the Creative Commons Attribution 4.0 License.
the Creative Commons Attribution 4.0 License.
Influence of lateral heterogeneities on strike-slip fault behaviour: insights from analogue models
Sandra González-Muñoz
Guido Schreurs
Timothy C. Schmid
Fidel Martín-González
This study investigates how lithological changes can affect the strike-slip fault propagation patterns using analogue models. Strike-slip fault zones are long structures that may cut across pre-existing tectonic or lithological steep boundaries. How strike-slip faulting is affected by a laterally heterogeneous upper crust is crucial for understanding the evolution of regional and local fault patterns, stress reorientations, and seismic hazard. Our models undergo sinistral distributed strike-slip shear (simple shear) and have been analysed by particle image velocimetry (PIV). We use quartz sand and microbeads as brittle analogue materials over a viscous mixture to distribute the deformation through the model. The first models investigate strike-slip faulting in a homogeneous upper crust using quartz sand or microbeads only. Three further models examine how the presence of a central section which laterally differs in its properties influences strike-slip faulting. The main observations are the following:
-
The homogeneous upper crust shows typical Mohr–Coulomb strike-slip faults, with synthetic fault strikes related to the angle of internal friction of the material used.
-
The heterogeneous upper crust has a profound effect on synthetic fault propagation, interaction, and linkage, as well as the kinematic evolution of antithetic faults that rotate around a vertical axis.
-
The orientation of the central section determines whether antithetic fault activity concentrates along the entire length of the central contact or not.
In the first case, fault activity is segmented or the number of different faults formed is increased in distinct domains. In the second case, the properties of the central material determine fault propagation, interaction, and/or linkage across the central domain.
These findings have potential implications for nature that have been seen in the NW Iberian Peninsula. In this area, the change in direction of the sinistral faults and the position of the antithetic faults can be explained due to lithological change.
- Article
(13677 KB) - Full-text XML
- BibTeX
- EndNote
Strike-slip fault systems in nature extend from a few metres to several hundred kilometres and typically have complex geometries consisting of separate fault segments offset from each other or comprising anastomosing linked faults (e.g. Aydin and Nur, 1982; Barka and Kadinsky-Cade, 1988; Wesnousky, 1988; Stirling et al., 1996; Kim et al., 2004). The evolution of strike-slip fault systems has been studied in numerous studies focused on the process of offset formation and therefore basin development, change in fault polarity, and parameters controlling segmentation (e.g. Riedel, 1929; Anderson, 1950; Deng et al., 1986; Sylvester, 1988; Dooley and Schreurs, 2012; Hatem et al., 2017; Lefevre et al., 2020; Visage et al., 2023). Understanding strike-slip fault interaction and linkage is important for its implications for the seismic hazard (Petersen et al., 2011; Bullock et al., 2014), in terms of dynamics, fault growth, and the size of earthquakes (e.g. Aki, 1989; Harris and Day, 1999; Scholz, 2002; Wesnousky, 2006; Shaw and Dieterich, 2007; de Joussineau and Aydin, 2009; Preuss et al., 2019) but also in terms of regional stress orientations (Kirkland et al., 2008) and in view of the location of geothermal and hydrocarbon resources (e.g. Sibson, 1985; Martel and Peterson, 1991; Aydin, 2000; Odling et al., 2004; Cazarin et al., 2021).
How faults interact or link is considered to be a function of loading, stress disturbances, rheology, and the geometry of pre-existing structures (e.g. Kim et al., 2004; Myers and Aydin, 2004; Peacock and Sanderson, 1991, 1992; Burgmann and Pollard, 1994; Sibson, 1985; Gamond, 1983; Rispoli, 1981; Wesnousky, 1988). Various studies have investigated the influence of vertical changes in upper-crustal strength (e.g. a horizontal sedimentary sequence comprising layers or bodies of different strengths) on strike-slip fault orientation, segmentation, linkage, and displacement. These studies used field observations combined with analytical and numerical methods (e.g. Du and Aydin, 1995; Aydin and Berryman, 2010; de Dontney et al., 2011) or analogue models (Richard, 1991; Richard et al., 1995; Gomes et al., 2019; Gabrielsen et al., 2023; Venancio and da Silva, 2023). However, it is also important to consider the evolution of strike-slip fault systems in a laterally heterogeneous upper crust. Strike-slip faults often extend laterally over considerable distances and are thus expected to be influenced by steeply oriented pre-existing tectonic or lithological boundaries having rocks with contrasting strength on either side. Such (sub)vertical contacts often occur at terrane boundaries or within crustal blocks comprising rock units with contrasting strengths, e.g. a magmatic body with steep margins that intruded into a sedimentary sequence. To our knowledge, no modelling studies have yet investigated how strike-slip fault systems are affected by steeply dipping contacts separating different rock types. Here we use scaled analogue model experiments analysed by particle imaging velocimetry (PIV) to assess the role of vertically oriented domains of contrasting brittle strength in the upper crust in fault kinematics in distributed strike-slip shear. The models were inspired by the deformation pattern of the NW Iberian Peninsula, which has undergone sinistral shearing during the Alpine orogeny (e.g. Martínez Catalán, 2011; Vergés et al., 2019). This particular area shows a system of sinistral faults that crosses lithological domains with contrasting properties, and part of their segmentation is conditioned by these domains.
2.1 Analogue model setup
The experimental setup for simulating distributed strike-slip shear included a mobile base plate that could be translated horizontally above a fixed base plate (Fig. 1). An assemblage of 60 individual and moveable plexiglass bars (each 78 cm long, 5 cm high, and 5 mm wide) was positioned on top of two base plates. The assemblage of plexiglass bars was confined by carbon fibre sidewalls on the long sides (Fig. 1b) and wooden bars (circa 5 mm high, 2 cm wide, and 40 cm long) on the short sides (Fig. 1b) that could pivot below the longitudinal sidewalls. The model was constructed on top of the plexiglass bars and consisted of a 2 cm thick viscous layer, simulating the ductile lower crust, overlain by a 2 cm thick layer of granular materials simulating the brittle upper crust. The short sides of the model were confined by vertical rubber sheets. Although our model setup included a horizontal viscous layer overlain by a horizontal brittle layer, our experiments focus on the influence of vertical domains with brittle strength contrasts on strike-slip faulting. The function of the viscous layer, directly overlying the plexiglass bars, is to distribute the applied shear deformation over the entire width of the model in the overlying brittle layer (e.g. Schreurs, 1991, 2003; Dooley and Schreurs, 2012).
Each model had an initial rectangular shape in map view, with a length of 78 cm parallel to the shear direction and a width of 30 cm perpendicular to it. The movement of the mobile base plate occurred by computer-controlled stepper motors at a constant velocity of 40 mm h−1, resulting in 80 mm of total displacement after 2 h. Displacement of the mobile base plate changed the initial rectangular shape of the overlying assemblage of plexiglass bars into a parallelogram simulating simple shear.
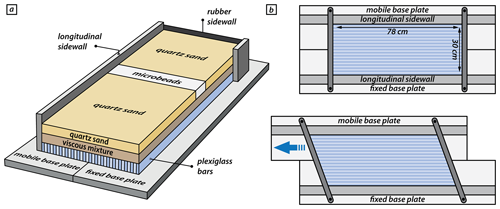
Figure 1Schematic experimental setup. (a) The base of the model setup consists of a fixed plate and a mobile plate overlain by an assemblage of individual and moveable plexiglass bars. The model is constructed on top of the plexiglass bars and is confined by two longitudinal sidewalls and two short sidewalls consisting of rubber sheets. (b) The upper panel shows the initial position of base plates overlain by plexiglass bars confined on the short sides by wooden bars that can pivot about a vertical axis. The lower panel shows the sinistral horizontal displacement of the mobile base plate induces a simple-shear movement in the overlying assemblage of plexiglass bars as they slide past one another.
We performed four series of simple-shear experiments, referred to as series A, B, C, and D (Fig. 2). Series A involved two models with only one brittle material (Fig. 2A), quartz sand or microbeads, to investigate strike-slip fault kinematics in a homogeneous upper crust without any lateral variations in mechanical strength. In the other three series (Fig. 2B–D), we introduced vertical domain boundaries across which the mechanical strength varied laterally. Each model had three domains with a 5 cm wide central domain consisting of a different material than the domains on either side. The difference between series B, C, and D is the orientation of the central domain with respect to the shear direction. To achieve such a model setup, two vertical thin sheets of cardboard (< 1 mm) were first placed as provisional walls, spaced 5 cm apart, on top of the viscous layer in the central domain of the model, parallel to the required orientation of the vertical domain boundaries. Subsequently, the different granular materials were sieved on top of the viscous layer, and once the desired model thickness was reached, the cardboard sheets were carefully removed. Although removal of the cardboard produced increased dilation along a narrow zone, it hardly affects the de facto function of this vertical boundary as a primary surface with materials of contrasting brittle strength on either side. For descriptive purposes, we defined a northerly direction, which is perpendicular to the applied shear direction and parallel to the short sides of the undeformed model (Fig. 2A). In models with a brittle strength contrast, we can distinguish two outer domains, a western and an eastern one, and a central domain (Fig. 2B–D).
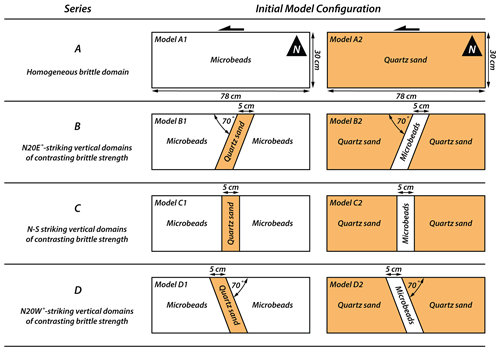
Figure 2Schematic drawing of the materials used and their surface distribution at the initial stage. All models have a length of 78 and a width of 30 cm. The references about the patterns observed have been given using the long side of the edge of the models as “north”. In the series of models referred to as A, only one type of material (quartz sand or microbeads) has been used. The diagrams of series B, C, and D show the position and orientation of the vertical domain boundaries in plain view and which materials were used.
2.2 Analogue materials
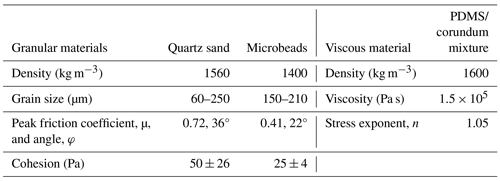
We used two different types of granular materials in our analogue models to assess the role of vertical zones of contrasting mechanical strength in the upper crust, namely quartz sand and microbead grains. The quartz sand (distributor Carlo Bernasconi AG; https://www.carloag.ch/de/, last access: 2022) has a grain size between 60 and 250 µm, with a bulk density of 1560 kg m−3, whereas the grain size of the microbeads (distributor Worf Glaskugeln GmbH, Germany) lies between 150 and 210 µm, with a bulk density of 1400 kg m−3. These density values were achieved by sieving the granular material into the model box from a height of 30 cm. Both quartz sand and microbeads deform according to the Coulomb failure criterion and have internal peak friction angles of 36° and 22° and cohesion values of 50±26 Pa and 25±4 Pa, respectively (Panien et al., 2006; Schmid et al., 2020). The considerable difference in the internal peak friction angle between the two materials makes them suitable for simulating contrasting upper-crustal rocks. According to their difference in the internal friction angle, we consider the microbeads and quartz sand to be weak and strong materials, respectively.
The viscous layer in our models had a density of 1600 kg m−3 and consisted of a mixture of SGM36 polydimethylsiloxane (PDMS) and corundum sand (weight ratio of 0.965 : 1.000). The mixture has a quasi-linear viscosity of 1.5×10⁵ Pa s and a stress exponent of 1.05 (Zwaan et al., 2018). The properties of all analogue materials are summarized in Table 1.
2.3 Scaling
For brittle Mohr–Coulomb-type materials, dynamic similarity is given by the equation for stress ratios,
where ρ∗, g∗, and h∗ are the ratios of model to nature for density, gravity, and length, respectively. Note that our two used granular materials have different densities, cohesions, and internal friction coefficients. However, the resulting scaling factors are nearly identical, and therefore, we provide only the scaling factors for quartz sand. Where scaling factors substantially differ, we denote them with subscripts “qtz” and “mb” for quartz sand and microbeads, respectively. Our model setup yields a length scaling factor of and a gravity scaling factor of 1. For quartz sand, the density scaling factor is , and the cohesion factor is (using a cohesion of ∼ 50 Pa and 50 MPa for our quartz sand and upper-crustal rocks, respectively; Byerlee, 1978). Additionally, for microbeads, the density scaling factor and cohesion scaling factor are and (assuming a weakened natural rock type with a cohesion of ca. 25 MPa), respectively. Using these scaling factors yields a stress scaling factor of for both quartz sand and microbeads.
Assuming a lower-crustal viscosity of η=1022 Pa s (Moore and Parsons, 2015; Zhang and Sagiya, 2017) yields a viscosity ratio of (using the viscosity of 1.5×10⁵ Pa s for the viscous analogue material).
The strain rate ratio is obtained from the stress ratio and the viscosity ratio by (Weijermars and Schmeling, 1986)
Note that due to the simple-shear setup, we substitute the strain rate scaling factor with the shear strain rate scaling factor . Next, the velocity scaling factor v∗ and a time scaling factor t∗ are calculated with
yielding a velocity scaling factor of and a time scaling factor of .
Based on our scaling, 1 cm in our experiments corresponds to 5 km in nature, and the applied velocity of 40 mm h−1 converts to a velocity of ∼ 2 mm a−1 in nature. Using the shear strain rate scaling factor , the bulk shear strain rate s−1 in our models translates into a shear strain rate of s−1 in nature, and 1 h in our analogue experiments translates into ∼12.5 Myr in nature.
In order to verify dynamic similarity of brittle natural and experimental material, we calculate the Smoluchowski number, Sm, which is the ratio between gravitational stress and cohesive strength (Ramberg, 1981),
where ρ, h, C, and μ are the density, thickness, cohesion, and friction coefficient, respectively, of the brittle material. With a cohesion of 50 MPa and a friction coefficient of ∼ 0.6 (Byerlee, 1978) for upper-crustal rocks, this yields values of Sm∼1 for our models, as well as for nature. We further calculate the Ramberg number, Rm, to ensure dynamic and kinematic similarities between the viscous layers.
For our velocity of 40 mm h−1, this yields a Ramberg number of 6 for both our models and nature. The Reynolds number, Re, is defined as the ratio between inertial forces and viscous forces and is for all our models, as well as for the natural prototype ≪1,
Based on the applied scaling laws, the material properties, and the similar non-dimensional numbers for model and nature, we consider our models to be properly dynamically scaled. Model parameters and dynamic numbers of the used materials are specified in Table 2.
2.4 Deformation monitoring and quantification
Since the experiments were conducted using a simple-shear setup, vertical motions during deformation were negligible, with nearly all movement located within the horizontal plane. The different experiments were monitored by an automated Nikon D810 (36 MP) DSLR (digital single-lens reflex) camera positioned above the experimental model. Images were taken at fixed intervals of 60 s during 2 h, resulting in 121 subsequent top-view images of the model surface. For a quantitative 2D analysis of the surface deformation, we used the StrainMaster module of the LaVision© DaVis image correlation software. Using a calibration plate, the software corrects the top-view images for lens distortion effects (i.e. unwarping), applies image rectification, and provides a scaling function that maps coordinates from the camera sensor to physical coordinates with a resolution of ∼ 9 px mm−1. The digital image correlation calculates local displacement vectors on subsequent images using a square matching algorithm with adaptive multi-pass cross-correlation. To properly track the grain movement patterns, we sprinkled coffee grains on the model surface prior to the model run. For each image, the analysed area is subdivided into a small interrogation window for which a local displacement vector is determined by cross-correlation. We used subsets (i.e. interrogation windows) of 31 by 31 pixels with a 75 % overlap for the local displacement calculations that, when assembled, result in incremental (60 s interval) displacement fields for the horizontal x and y components of ux and uy, respectively, with a vector resolution of ∼ 1.3 vectors mm−1.
Postprocessing included an outlier filter to fill gaps of pixels within a 3-by-3 neighbourhood (Westerweel and Scarano, 2005). Discarded vectors in the displacement fields were replaced by an iterative interpolation requiring at least two neighbouring vectors. For quantifying deformation at the model surface, we calculate the z vorticity, ωz (i.e. a rotation measure in the xy plane), as a proxy for shear movement along strike-slip faults. In our models, the x axis corresponds to the long side of the rectangle, and the y axis corresponds to the short side of the model. In contrast to the shear strain, εxy, vorticity is not dependent on the orientation of the coordinate system, which is crucial when quantifying the deformation along faults that strike obliquely with respect to the coordinate system (e.g. Cooke et al., 2020). ωz can be derived from local displacement gradients according to Eq. (1),
with ux and uy being the horizontal displacement components in the x and y directions, respectively. Positive and negative ωz values refer to sinistral and dextral relative displacement, respectively. Within the predefined increment of 60 s, ωz values are consistently within the range [−2 %, 2 %], and we set a threshold of −0.5 % and 0.5 % to distinguish between active deformation and background noise for dextral and sinistral shear sense, respectively. In Sect. 2.5, we present ωz at deformation stages every 30 min (i.e. after 30, 60, 90, and 120 min). Finite deformation after 120 min for each model is illustrated with a surface photograph and enhanced with superposed line drawings of the fault pattern. For the statistical analysis of fault orientations, we traced active fault segments (i.e. % or ωz≥0.5 %) in MATLAB using polylines, where each fault segment is defined by two consecutive vertices. At each time step, the segment length and azimuth were calculated and visualized in length-weighted rose diagrams.
3.1 Series A: fault evolution in a homogeneous upper crust
The Series A models consisted of a homogeneous upper-crustal layer composed of either microbeads (Fig. 3; model A1) or quartz sand (Fig. 3; model A2). The incremental strain panels document that strain localized first in the model with quartz sand, while deformation was still diffuse in the model with microbeads (Fig. 3a and f); i.e. strain localization occurs at lower amounts of applied simple shear in quartz sand than in microbeads. With progressive sinistral simple-shear deformation, slightly overlapping right-stepping en echelon strike-slip faults with a sinistral displacement formed (Fig. 3b and g). These faults were synthetic with respect to the bulk simple shear. In the model with microbeads (model A1) the first synthetic faults had an orientation of N79° E (Fig. 3b), whereas in the model with quartz sand (model A2), their orientation was N72° E (Fig. 3g). Initial deformation in both models is accommodated by synthetic (sinistral) strike-slip faults (Fig. 3a–b and f–g). As the deformation progressed, individual fault segments linked up, forming major sinistral strike-slip faults (Fig. 3c and h). Antithetic faults only developed in model A2 (quartz sand only; Fig. 3h and i) at later stages of the deformation. These faults were confined in between previously formed synthetic faults. The final deformation stage (Fig. 3e and j) shows that most deformation was taken up by major synthetic faults that crossed the entire length of the model. At the final stage, the initial en echelon pattern of faulting was better preserved in the quartz sand model than in the microbead model, resulting in a wider damage zone in the former.
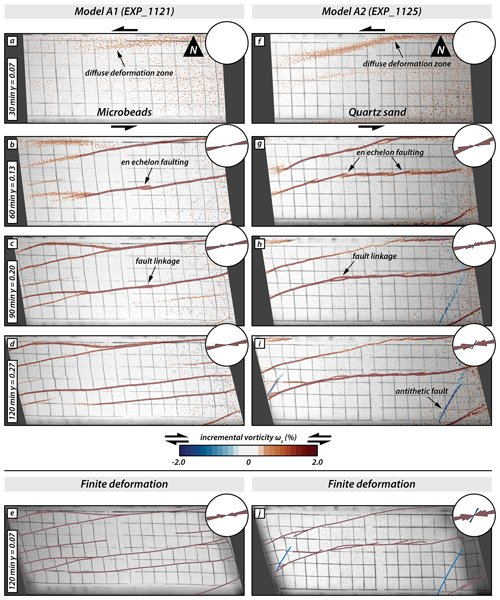
Figure 3Overview of series A models. Simple-shear deformation of two models with a homogeneous brittle upper layer. The first four panels of each series show surface photographs with the incremental vorticity after 30 min (20 mm displacement of mobile base plate), 60 min (or 40 mm displacement), 90 min (or 60 mm displacement), and 120 min (or 80 mm displacement). Incremental positive and negative values indicate sinistral (synthetic; red) and dextral (antithetic; blue) relative movement, respectively. The last panel for each series shows a surface photograph of the final stage overlain with the interpreted fault pattern. Red lines are sinistral faults, and blue lines are dextral faults.
3.2 Series B: fault evolution in models with N20° E vertical domain boundaries
The vertical domain boundaries in the series B models were oriented N20° E. Model B1 had a central domain consisting of strong quartz sand with weak microbeads in the adjacent, western, and eastern domains (Fig. 4; model B1), whereas in model B2, it was the other way around (Fig. 4; model B2). Both models showed the development of dextral strike-slip (antithetic with respect to sinistral simple shearing) faults along the vertical boundaries of the central domain (Fig. 4a, f). Later, sinistral strike-slip faults (synthetic) formed in the western and eastern domains (Fig. 4b, g). Although these faults propagated laterally with time, none of the synthetic faults crossed the central domain. Instead, they halted at or close to the boundary faults along the central domain (Fig. 4c, h). In model B1, a few antithetic faults formed in between pre-existing synthetic faults in the western and eastern domains, striking at circa N60° E (Fig. 4d, e). Antithetic faults also developed in the western and eastern domains of model B2, almost coevally with the synthetic faults. They strike at higher angles to the shear direction than those antithetic faults confined between overlapping synthetic faults in model B2. With increasing deformation, the central domain and its bordering antithetic faults rotated anticlockwise in both models (Fig. 4a–e, f–j), as did the antithetic faults in the western and eastern domains, which acquired a slight sigmoidal shape (e.g. Fig. 4j).
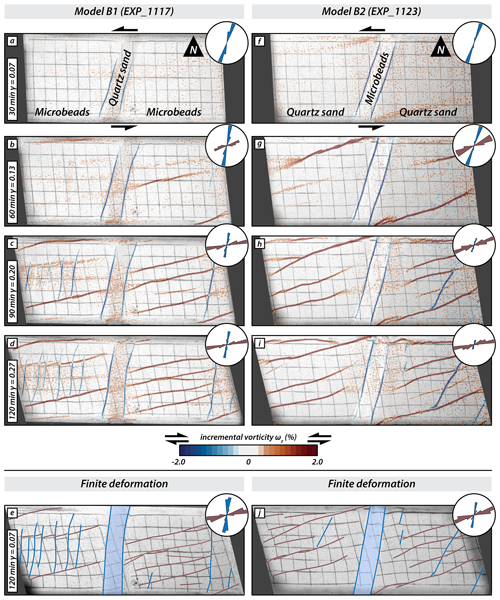
Figure 4Overview of series B models. Simple-shear deformation of two models with vertical domains of contrasting brittle strength oriented N20° E. The first four panels of each series show surface photographs with the incremental vorticity after 30 min (20 mm displacement of mobile base plate), 60 min (or 40 mm displacement), 90 min (or 60 mm displacement), and 120 min (or 80 mm displacement). Incremental positive and negative values indicate sinistral (synthetic; red) and dextral (antithetic; blue) relative movement, respectively. The last panel for each series shows a surface photograph of the final stage overlain with the interpreted fault pattern. Red lines are sinistral faults, and blue lines are dextral faults.
3.3 Series C: fault evolution in models with N-S vertical domain boundaries
During the early stages, simple-shear dextral (antithetic) faults formed along the N–S-striking borders of the central domain (Fig. 5b, g) in both models but were earlier and more pronounced in model C1. With progressive shearing, both synthetic and antithetic faults formed in the outer domains of both models (Fig. 5c and h). In model C2, activity along the antithetic faults bordering the central domain ceased, and synthetic faults propagated from the outer domains into the central weak domain (Fig. 5h–j). In contrast, in model C1, the antithetic faults along the borders of the central domain remained active, and no synthetic faults crossed the central strong domain (Fig. 5d). In the eastern domain of model C2, a few antithetic faults formed in between major synthetic faults, striking at a lower angle to the shear direction than earlier-formed antithetic faults in the western domain. With progressive simple shear, the central domain showed an anticlockwise rotation around a vertical axis in both models, and antithetic faults obtained a sigmoidal shape in top view (Fig. 5i). As the initial N–S antithetic faults bordering the central domain rotated anticlockwise, activity along these faults stopped, and new fault segments parallel to earlier antithetic faults formed in the western and eastern domains (Fig. 5d, e). At the final stage of model C2, antithetic faults dominated in the western domain and synthetic faults in the eastern domain. In contrast, in model C1, antithetic and synthetic faults were present in both the western and eastern domain.
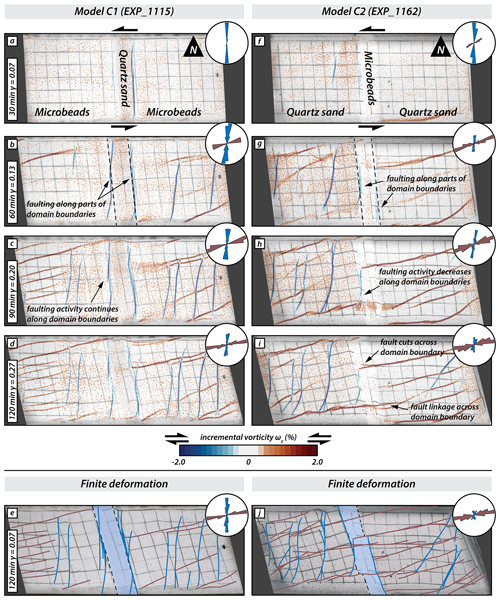
Figure 5Overview of series C models. Simple-shear deformation of two models with vertical domains of contrasting brittle strength striking N–S. The first four panels of each series show surface photographs with the incremental vorticity after 30 min (equivalent to 20 mm displacement of the mobile base plate), 60 min (or 40 mm displacement), 90 min (or 60 mm displacement), and 120 min (or 80 mm displacement). Incremental positive and negative values indicate sinistral (synthetic; red) and dextral (antithetic; blue) relative movement, respectively. The last panel for each series shows a surface photograph of the final stage overlain by the interpreted fault pattern. Red lines are sinistral faults, and blue lines are dextral faults.
3.4 Series D: fault evolution in models with N20° W striking vertical domain boundaries
In contrast to the model C series, no faults formed along the boundaries of the central domain in models D1 and D2 (Fig. 6a and f). Model D1 is dominated by synthetic faults cross-cutting the central strong domain (Fig. 6c–e). As these faults traversed the central domain, they slightly changed their strike. In contrast, in model D2, the weak microbeads of the central domain were internally deformed, and oblique-slip reverse faults formed, which propagated laterally and parallel to the domain boundaries (Fig. 6g–j). Synthetic faults formed in both the western and eastern domain of model D2, while antithetic faults formed later and in between overlapping synthetic faults (Fig. 6g–j). With progressive deformation synthetic faults from the western and eastern domain in model D2 propagated partially into the central weak central domain but halted at the previously formed oblique-slip reverse faults (Fig. 6h and i). During late stages of deformation, a few antithetic faults formed in model D1 in between earlier-formed synthetic faults, striking at larger angles to the shear direction than in model D2.
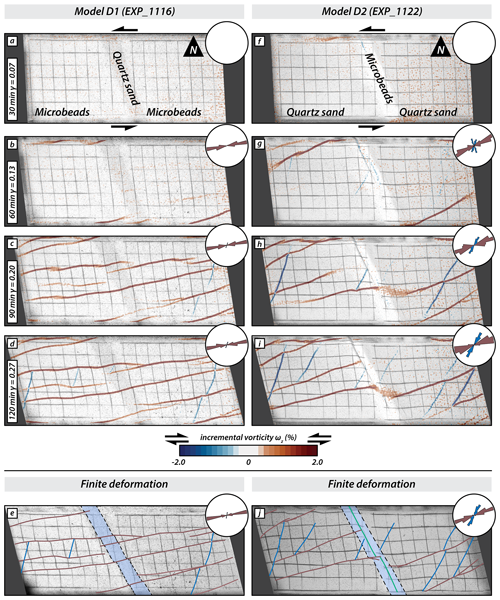
Figure 6Overview of series D models. Simple-shear deformation of two models with N20° W striking vertical domains of contrasting brittle strength. The first four panels of each series show surface photographs with the incremental vorticity after 30 min (20 mm displacement of mobile base plate), 60 min (or 40 mm displacement), 90 min (or 60 mm displacement), and 120 min (or 80 mm displacement). Incremental positive and negative values indicate sinistral (synthetic; red) and dextral (antithetic; blue) relative movement, respectively. The last panel for each series shows a surface photograph of the final stage overlain with the interpreted fault pattern. Red lines are sinistral faults, blue lines are dextral faults, and the green line indicates a reverse fault.
4.1 Series A: strike-slip faulting in models with a homogeneous upper-crust model
In our models simulating homogeneous crust, the structures display an en echelon pattern, as should be expected (Bartlett et al., 1988; Sylvester, 1988; Misra et al., 2009). Initial bulk simple shear is accommodated in both models by zones of diffuse deformation and is followed by localized deformation along narrow fault zones. It is interesting to note that localization requires a higher shear deformation in the model with the weak material than in the model with strong material. This difference in localization behaviour is attributed to the difference in dilatancy between the two analogue materials, which is closely related to grain shape and grain size distribution. The weak material, represented by the microbeads, is well-rounded and has a narrow grain size distribution (150–210 µm), whereas the strong material (quartz sand grains) is angular and has a wider grain size distribution (60–250 µm). The more uniform the grain shape and grain size, the more the applied shear deformation is needed to localize the strain along a narrow fault zone (Antonellini et al., 1994; Mair et al., 2002). Therefore, the shape and grain size characteristics will influence the time that a fault may take to reactivate, depending on the lithology that comprises its fault zone (e.g. Sammis et al., 1987; Mair et al., 2002).
In these two models, sinistral (synthetic) strike-slip faults form first. The initial strike of these faults differs between the model with the weaker material and the one with strong material, striking at N79 and N72° E, respectively. The internal friction angle of each type of material will be adjusted to a certain orientation of rupture according to the Mohr–Coulomb criterion (Fig. 7). At the beginning of the experiment, the main principal stress (σ1) is oriented at 45° to the shear direction, and the two potential fault orientations strike at 45° − and at 45° + to σ1, respectively, with φ as the angle of internal peak friction, which is 22° for the microbeads and 36° for quartz sand (Fig. 7). Hence, the synthetic and antithetic faults strike at N79 and N11° E, respectively, in the model with microbeads and at N72 and N18° E in the model with quartz sand, respectively. The fact that nearly all deformation is accommodated by synthetic faults is typical of simple-shear models with an initial rectangular shape, i.e. a large aspect ratio of length (parallel to shear direction) divided by width (Schreurs, 2003; Dooley and Schreurs, 2012). A comparison of previous simple-shear experiments shows that the shape of the initial model has an influence on the relative proportion of synthetic and antithetic faults (Gapais et al., 1991; Schreurs, 2003). With the decreasing aspect ratio, the number of antithetic faults will increase, and in case of an initially square-shaped model (i.e. aspect ratio is 1), antithetic faults will dominate (Gapais et al., 1991; Dooley and Schreurs, 2012). In the model with quartz sand, a few antithetic faults form in between previously formed major synthetic faults (Fig. 3i). These late antithetic faults, however, form in response to local stress field modifications between overlapping synthetic faults, causing σ1 to rotate clockwise from 45° in the bulk shear direction towards an orientation that is subparallel to the previously formed synthetic faults. As a consequence, these late antithetic faults are not in the “conjugate” position with respect to the synthetic major faults but strike at lower angles with respect to the long borders of the model (these are the lower-angle antithetic faults of Schreurs, 2003).
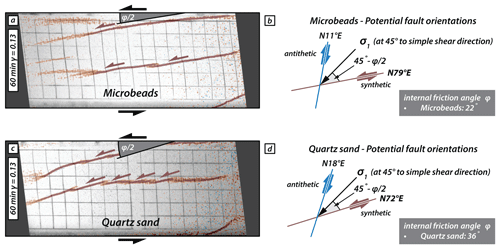
Figure 7Illustrative scheme of the expected fault orientation according to the Mohr–Coulomb failure criteria for the experiments with only one type of material (homogeneous upper crust). Panels (a) and (c) show surface photographs of the model with microbeads only (a) and quartz sand only (c), with the incremental vorticity after 60 min (40 mm displacement). Panels (b) and (d) show a schematic explanation for the expected orientation of the synthetic and antithetic faults considering the simple-shear orientation along with the Mohr–Coulomb failure criteria for the models with microbeads only (b) and quartz sand only (d), respectively.
4.2 Series B, C, and D: the influence of the orientation lateral heterogeneities on strike-slip faulting
Introducing a vertical domain with different properties than the surrounding material results in different fault patterns and timing of the structures (Segall and Pollard, 1983; PPeacock and Sanderson, 1991; Peacock and Sanderson, 1992; Schellart and Strak, 2016; Lefevre et al., 2020; Livio et al., 2019; Venâncio and Alves Da Silva, 2023). The degree of difference in the fault pattern is a function of the orientation and the strength of the domains.
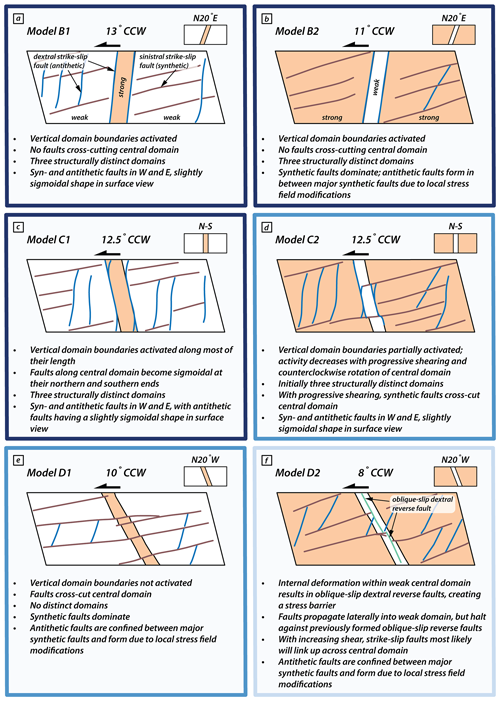
Figure 8Schematic surface views summarizing the main results from the models with vertical domains of contrasting brittle strength. CCW represents the anticlockwise rotation about a vertical axis that all the models undergo.
The first thing noticed is that the faults do not follow the en echelon pattern, and the antithetic faults are the first ones to form (Figs. 4 and 5). The domain boundaries in series B and C models initially strike N20° E and N–S, respectively (Fig. 8a, b, c, and d), which is close to the antithetic fault orientation predicted by the Mohr–Coulomb failure criterion (i.e. N11° E for microbeads and N18° E for quartz sand; see Sect. 4.1). As a result, the domain boundaries in both models are activated along their entire length, and the antithetic faults are formed along the borders of the central domains (Fig. 8a, b, and c). With progressive sinistral simple shear, the central domain bounded by the fault rotates anticlockwise about a vertical axis and, at the end of the experiment, has rotated about 12°, striking N08° E. The faults of the domain boundaries remain active throughout the model run because their strike is favourably oriented with respect to the main stress (Fig. 8a, b). As a result, the sinistral faults in series B and in model C1 cannot propagate along the entire model, regardless of the composition of the central domain, and two possibilities are shown: the faults are segmented (Fig. 8a and b) or more new faults are generated in the eastern and western domains (Fig. 8c). However, if the central domain is composed of the weak material and is not fully surrounded by antithetical faults, the synthetic fault can cross-cut the entire model (Fig. 8d). This may offer the possibility that strike-slip fault stepping may also be due to the action of lithology, which is able to induce fault segmentation. Hence, the presence of a laterally heterogeneous upper crust with steep boundaries and suitable orientation for activation by antithetic faults can prevent the synthetic strike-slip faults from crossing certain domains.
The antithetic faults that form in the outer domains of our models are of two types: (i) those that form relatively early in as yet largely unfaulted domains and strike at large angles to the shear direction (Fig. 8a, c, and d) and (ii) those confined between earlier-formed and overlapping synthetic faults that strike at lower angles to the shear direction (Fig. 8b, e, and f). In the first case, the earlier-formed antithetic faults reflect the orientation predicted by the Mohr–Coulomb failure criterion, striking N18° E if the outer domains consist of the strong material and N11° E if the outer domains consist of the weak material. Due to lateral fault propagation and coeval rotation of the central fault segments, these antithetic faults obtain a slightly sigmoidal shape form in map view during progressive simple shear (see also Schreurs, 1994, 2003; Dooley and Schreurs, 2012). In the second case, the antithetic faults confined in between closely spaced and earlier-formed synthetic faults have an initial different strike (N15°–N20° E in the weak material (e.g. model C1) and N25°–N30° E in the strong material (e.g. model C2)). The antithetic faults confined between major synthetic faults result from local stress field modifications governed by the relative movement of material in between previously formed synthetic faults with large overlap (Schreurs, 2003; Dooley and Schreurs, 2012; see their faults). Both types of antithetic faults rotate anticlockwise with progressive sinistral simple shear. Rotation of faults and blocks in strike-slip fault systems not only is observed in analogue models (Schreurs, 1994, 2003; Dooley and Schreurs, 2012) but also has been documented in nature (e.g. Ron et al., 1984; Nicholson et al., 1986). It is thus important to keep in mind that antithetic faults (and the blocks in between) can undergo considerable rotation about a vertical axis during simple-shear deformation, implying that present-day antithetic fault orientations in strike-slip fault systems do not necessarily reflect the orientations in which they initially formed.
In comparison with the series B and series C models, the initial N20° W-striking central domain boundaries in the series D models are the least favourably oriented for antithetical fault activation. Consequently, the fault development pattern follows an echelon type, but in both cases, the size of the segments is affected by the lateral variation in the material properties. In the weak–strong–weak model D1 (Fig. 8e and f), the domain boundaries are not activated at all, and the synthetic faults forming in the outer domains propagate across the central domain. Apart from a slight reorientation of the fault strike, reflecting the difference in material strength between central and outer domains (difference in internal friction angles), the fault pattern in model D1 is similar to the one in model A1, which had no vertical brittle strength contrasts. The strong–weak–strong model D2 shows a different deformation behaviour. Although the domain boundaries at the surface are not activated, the presence of a weak material surrounded by strong material results in internal deformation within the central domain and dextral oblique-slip reverse faults form, striking parallel to the domain boundaries. These faults prevent synthetic faults from crossing the central domain, and they halt against the oblique-slip reverse faults.
4.3 Fault linkage across central domain
In models where synthetic faults from the eastern and western domain cross-cut the central domain, the entire model behaves as one domain. As shown in the section above, this is the case for models C2, D1, and D2, where the vertical boundaries of the central domain are not or are only partially activated, depending on the orientation of the central domain (Sect. 4.2). However, all three models show distinct differences in how laterally propagating synthetic strike-slip faults link across the central domain (Fig. 9). For model D1 (Fig. 9a, b), faults cross-cut the stronger central domain from the eastern and western domains (Fig. 9a), linking up in a new segment. This new segment shows different orientation resulting in a step-like linkage pattern in surface view (i.e. flat–steep–flat; Fig. 9a, b). When segmentation occurs and the faults cross the central domain, the orientation of the faults is different, probably related to the internal friction angles between the quartz sand and the microbeads (Du and Aydin, 1995; de Doney et al., 2011).
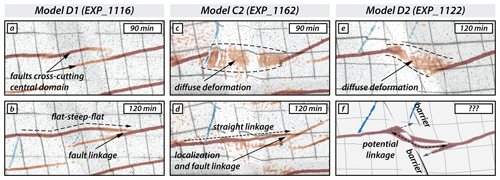
Figure 9Detailed surface photographs of the central domain of the models with the contrasting brittle mechanical strength, showing the fault linkage across the central domain at 90 min (60 mm displacement) and 120 min (80 mm displacement). Panels (a) and (b) show model D1 with the central domain striking N20° W and composed of the strong material (quartz). Panels (c) and (d) show model C2 with the central domain striking N–S and composed of the weak material (microbeads). Panel (e) shows model D2 with the central domain striking N20° W and composed of the weak material (microbeads). (f) Schematic drawing for the fault linkage at the last stage.
For models C2 and D2, however, the domain configuration strong–weak–strong has implications for fault linkage. As synthetic strike-slip faults propagate from the western and eastern domains towards the weaker central domain, early-deformation patterns are characterized by a zone of diffuse deformation across the central domain (Fig. 9c, e). In model C2, the fault from the westerly domain cross-cuts the weak central domain and eventually links with the fault in the easterly domain in a straight fashion after 120 min (Fig. 9d), abandoning earlier active fault strands striking N18° E (i.e. the predicted orientation for Mohr–Coulomb failure criterion). Similar fault kinematics should be expected for model D2 (Fig. 9e, f). However, laterally propagating faults in the western and eastern domain do not link during the duration of the model run. Instead, the two fault segments halt at the domain boundary, resulting in ongoing diffuse deformation without strain localization in the central domain. This behaviour may be explained by the presence of the N20° W-striking reverse faults within the central model domain. Due to the misalignment between central domain boundaries and the expected orientation of antithetic faults, the domain boundaries do not activate, and domain-internal deformation is taken up by oblique-slip dextral reverse faults. Such faults (i.e. nearly orthogonally striking with respect to synthetic faults) accommodate bulk shear deformation hindering the synthetic faults from propagating. In that sense, the oblique-slip reverse faults act as an impenetrable barrier inhibiting linkage of synthetic faults across the weak central domain (Fig. 9f). Oblique-slip reverse faults in the central domain, therefore, influence fault interaction across the central domain in a way that is similar to the activated domain boundaries in models B1, B2, and C1 (Fig. 8).
4.4 Comparison with strike-slip fault zones in Iberia
The NW Iberian Peninsula contains major sinistral and dextral strike-slip intraplate fault systems (Fig. 10a). These intraplate fault systems are located in an old basement developed during Variscan orogeny (Devonian–Carboniferous; e.g. Matte, 1991; Martínez Catalán et al., 1997; Fernández et al., 2004). During this stage, a set of lithologic units with contrasting properties such as granites, quartzites, slates, and high-grade metamorphic rocks were emplaced and deformed. During the Alpine compression (Late Cretaceous to the present), the present fault pattern was obtained due to the collision between the Iberian microplate and the northern edge of Africa in the Middle Miocene (e.g. Alonso et al., 1996; Vegas et al., 2004; Martín-González and Heredia, 2011; Martín-González et al., 2012). This collision caused the Iberian Peninsula to undergo an anticlockwise twist, resulting in slight shearing (e.g. Martínez Catalán, 2012; Vergés et al., 2019). In the study area, intraplate deformation led to a fault pattern primarily composed of sinistral faults, such as the Penacova–Régua–Verin fault (PRVF), Manteigas–Vilariça–Bragança (MVBF), and Orense faults (see Fig. 10a). Additionally, antithetic dextral faults were also generated (see Fig. 10a).
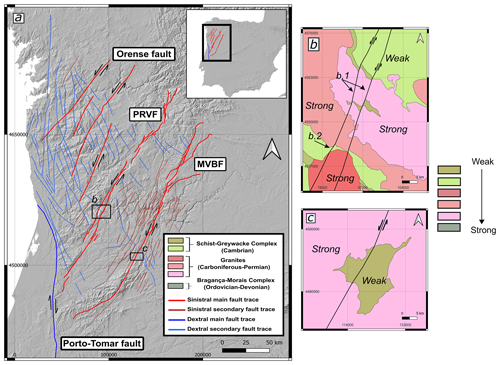
Figure 10(a) Digital elevation model of the northwestern section of the Iberian Peninsula where the main faults are drawn, with the locations of (b) and (c) enlarged as insets. The faults are essentially sinistral, and there is a dextral fault on the southern edge that delimits the study area. In blue and light red, the secondary antithetic (dextral) and synthetic (sinistral) faults have been marked, respectively. (b) Schematic representation of the southern section of the Verin fault showing patterns of directional changes similar to models D1 and D2. (c) Schematic representation of the southern section of the Vilariça fault showing a similar deformation pattern to model C2.
Among the traces of these faults, we can observe antithetic faults that do not connect with each other and, in some cases, acquire a sigmoidal shape as observed in models C1 and C2 (Fig. 8e and f). These antithetic faults are not in a conjugate position and are mostly confined between major sinistral faults. At the end of the sinistral faults is the Porto–Tomar fault, which delimits the study area. The Porto–Tomar fault shows dextral displacement and tectonically delimits the area to the north and south of Portugal (Veludo et al., 2017). The main traces of the sinistral faults are not completely straight but show slight changes in strike. For example, along the PRVF, the fault undergoes an anticlockwise refraction when crossing from weak into strong lithologies (b.1 in Fig. 10b), similar to model D1, with strong quartz sand in the central domain (Fig. 10b). On the other hand, the same fault undergoes a clockwise refraction as it crosses from strong lithologies (granites) in shaly units (b.2 in Fig. 10b), similar to model D2, with weak microbeads in the central domain. The same phenomenon is also observed along the Vilariça fault when the fault intersects granites and slate units (Fig. 10c).
Although, on a local scale, similarities are observed in the behaviour of individual faults crossing contrasting lithologies in nature and faults crossing vertical domain boundaries in our analogue models, the NW Iberian Peninsula strike-slip fault system as a whole shows little resemblance to the overall fault patterns in homogeneous or laterally heterogeneous upper-crustal models. This may indicate that the NW Iberian crust is much more heterogeneous and complex than the one modelled in our experiments.
We developed a series of analogue models to investigate faulting in the brittle upper crust as a result of sinistral simple shear. In a first series of models, the upper crust was homogeneous and consisted of a single analogue material, namely weak microbeads or strong quartz sand. In three further series of models, the upper crust was laterally heterogeneous and consisted of three domains with vertical boundaries and contrasting strength (i.e. a weak–strong–weak or a strong–weak–strong configuration).
The fault pattern in a homogeneous upper crust is dominated by sinistral (synthetic) strike-slip faulting, whose orientations are readily explained by the Mohr–Coulomb failure criterion, with fault strikes being a function of the internal friction angles. In models with a heterogeneous upper crust, the development of the faults does not follow an en echelon pattern. The sinistral faults are developed in the outer domains in the expected orientations, according to the Mohr–Coulomb failure criterion.
The heterogeneity of the upper crust, as lateral variations in the lithology, could affect the expected sequence of strike-slip faults, with antithetic faults being the first to form. If the initial strike of the boundaries of the domains is subparallel to the predicted Mohr–Coulomb failure criterion, the development of antithetic faults is promoted. As a consequence, faulting may occur in distinct structural domains and faults may be segmented. If the orientation is less favourable, the development of antithetic faults is not promoted, allowing synthetic faults to form without distinct structural domains.
The properties of the lithology that intersect the sinistral faults influence how their segments are connected. In the case of weak–strong–weak, the synthetic faults from the outer domains cross-cut the central domain with a slight change in strike orientation, whereas in the case of strong–weak–strong, the weak central domain shows internal oblique-slip reverse faulting which inhibits faults from the outer domain from fully crossing the central domain.
Although we only tested sinistral simple shear, our results can also be applied to dextral simple shear by mirroring the fault patterns around a N–S axis.
There are similarities between the behaviour of individual faults in natural systems and our heterogeneous upper-crustal models, i.e. the slight change in strike orientation when crossing a boundary with contrasting strength.
The images of the experiments are available in the following data repository: González-Muñoz et al. (2024). The rest of the data are included in the article.
Rheological measurements of the analogue materials used are available in the form of open-access data publications provided by the GFZ Data Service (brittle materials at https://doi.org/10.5880/fidgeo.2020.006, Schmid et al., 2020a; https://doi.org/10.5880/fidgeo.2020.005, Schmid et al., 2020b; viscous materials at https://doi.org/10.5880/fidgeo.2018.023, Zwaan et al., 2018). The input files, custom ASPECT plug-ins, and postprocessing scripts used in this publication can be found in the Zenodo repository at https://doi.org/10.5281/zenodo.7701374 (Glerum, 2023).
SGM, GS, and FMG: conceptualization and writing (original draft). SGM and GS: methodology and investigation. SGM, GS, FMG, and TS: formal analysis and visualization. TS: data curation. FMG: funding. GS and FMG: funding acquisition, supervision, and project administration. SGM: writing (review and editing).
The contact author has declared that none of the authors has any competing interests.
Publisher's note: Copernicus Publications remains neutral with regard to jurisdictional claims made in the text, published maps, institutional affiliations, or any other geographical representation in this paper. While Copernicus Publications makes every effort to include appropriate place names, the final responsibility lies with the authors.
The following work has been partially funded by a predoctoral contract (PREDOC20-073) by the Universidad Rey Juan Carlos, and project PID2022-139527OB-I00 has been funded by MCIN/AEI/10.13039/501100011033/ and FEDER (Ministerio de Ciencia, Innovación y Universidades).
The following work has been funded by a predoctoral contract (grant no. PREDOC20-073; Universidad Rey Juan Carlos) and the project FACTER (grant no. PID2022-139527OBI00) from the Spanish Government (grant no. MCIN/ AEI/10.13039/501100011033; Ministerio de Ciencia, Innovación y Universidades).
This paper was edited by Yang Chu and reviewed by Roy H. Gabrielsen, Michele Cooke, and Bing Yan.
Alonso, J. L., Pulgar, J. A., García-Ramos, J. C., and Barba, P.: Tertiary basins and Alpine tectonics in the Cantabrian Mountains (NW Spain). in Tertiary Basins of Spain (214–227 pp.), Cambridge University Press, https://doi.org/10.1017/CBO9780511524851.031, 1996.
Aki, K.: Geometric features of a fault zone related to the nucleation and termination of an earthquake rupture, in: Proceedings of Conference XLV Fault Segmentation and Controls of Rupture Initiation and Termination. US Geological Survey Open File Report 89-315, 1–9 pp., https://pubs.usgs.gov/of/1989/0315/report.pdf (last access: 2023), 1989.
Anderson, E. M.: The dynamics of faulting, Trans. Edinb. Geol. Soc., 8, 387–402, https://doi.org/10.1144/transed.8.3.387, 1905.
Antonellini, M. A., Aydin, A., and Pollard, D. D.: Microstructure of deformation bands in porous sandstones at Arches National Park, Utah. J. Struct. Geol., 16, 941e959, https://doi.org/10.1016/0191-8141(94)90077-9, 1994.
Aydin, A. and Nur, A.: Evolution of pull-apart basins and their scale independence, Tectonics, 1, 91–105, 1982.
Aydin, A.: Fractures, faults, and hydrocarbon entrapment, migration and flow. Mar. Pet. Geol., 17, 797–814, 2000.
Aydin, A. and Berryman, J. G: Analysis of the growth of strike-slip faults using effective medium theory, J. Struct. Geol., 32, 1629–1642, https://doi.org/10.1016/j.jsg.2009.11.007, 2010.
Barka, A. and Kadinsky-Cade, K.: Strike-slip fault geometry in Turkey and its influence on earthquake activity, Tectonics, 7, 663–684, 1988.
Bartlett, W. L., Friedman, M., and Logan, J. M.: Experimental folding and faulting of rocks under confining pressure Part IX. Wrench faults in limestone layers, Tectonophysics, 79, 255–277, https://doi.org/10.1016/0040-1951(81)90116-5, 1988.
Bullock, R. J., De Paola, N., Holdsworth, R. E., and Trabucho-Alexandre, J.: Lithological controls on the deformation mechanisms operating within carbonate-hosted faults during the seismic cycle, J. Struct. Geol., 58, 22–42, https://doi.org/10.1016/j.jsg.2013.10.008, 2014.
Burgmann, R. and Pollard, D. D.: Strain accommodation about strike-slip fault discontinuities in granitic rock under brittle-to-ductile conditions, J. Struct. Geol., 16, 1655–1674, 1994.
Byerlee, J.: Friction of rocks, Pure Appl. Geophys., 116, 615–626, https://doi.org/10.1007/bf00876528, 1978.
Cazarin, C. L., van der Velde, R., Santos, R. V., Reijmer, J. J. G., Bezerra, F. H. R., Bertotti, G., La Bruna, V., Silva, D. C. C., de Castro, D. L., Srivastava, N. K., and Barbosa, P. F.: Hydrothermal activity along a strike-slip fault zone and host units in the S ̃ ao Francisco Craton, Brazil – implications for fluid flow in sedimentary basins, Precambrian Res., 365, https://doi.org/10.1016/j.precamres.2021.106365, 2021.
Cooke, M. L., Toeneboehn, K., and Hatch, J. L.: Onset of slip partitioning under oblique convergence within scaled physical experiments, Geosphere, 16, 875–889, https://doi.org/10.1130/GES02179.1, 2020.
de Joussineau, G. and Aydin, A.: Segmentation along strike-slip faults revisited, Pure Appl. Geophys., 166(10–11), 1575–1594, https://doi.org/10.1007/s00024-009-0511-4, 2009.
DeDontney, N., Rice, J. R., and Dmowska, R.: Influence of material contrast on fault branching behavior: BIMATERIAL BRANCHING, Geophys. Res. Lett., 38, https://doi.org/10.1029/2011gl047849, 2011.
Deng, Q., Wu, D., Zhang, P., and Chen, S.: Structure and deformational character of strike-slip fault zones, Pure Appl. Geophys., 124, 203–223, https://doi.org/10.1007/bf00875726, 1986.
Dooley, T. P. and Schreurs, G. : Analogue modelling of intraplate strike-slip tectonics: A review and new experimental results, Tectonophysics, 574–575, 1–71, https://doi.org/10.1016/j.tecto.2012.05.030, 2012.
Du, Y. and Aydin, A.: Shear fracture patterns and connectivity at geometric complexities along strike-slip faults, J. Geophys. Res., 100, 18093–18102, https://doi.org/10.1029/95jb01574, 1995.
Fernández, M., Marzán, I., and Torne, M.: Lithospheric transition from the Variscan Iberian Massif to the Jurassic oceanic crust of the Central Atlantic, Tectonophysics, 386, 97–115, https://doi.org/10.1016/j.tecto.2004.05.005, 2004.
Gabrielsen, R. H., Giannenas, P. A., Sokoutis, D., Willingshofer, E., Hassaan, M., and Faleide, J. I.: Analogue experiments on releasing and restraining bends and their application to the study of the Barents Shear Margin, Solid Earth, 14, 961–983, https://doi.org/10.5194/se-14-961-2023, 2023.
Gamond, J. F.: Displacement features associated with fault zones: a comparison between observed examples and experimental models, J. Struct. Geol., 5, 33–45, 1983.
Gapais, D., Fiquet, G., and Cobbold, P. R.: Slip system domains, 3. New insights in fault kinematics from plane-strain sandbox experiments, Tectonophysics, 188, 143–157, https://doi.org/10.1016/0040-1951(91)90320-r, 1991.
Glerum, A.: anne-glerum/paper-Schmid-Tectonic-interactionsduring-rift-linkage: Update ASPECT branch (v.2.0.0), Zenodo [code], https://doi.org/10.5281/zenodo.7701374, 2023.
Gomes, A. S., Rosas, F. M., Duarte, J. C., Schellart, W. P., Almeida, J., Tomás, R., and Strak, V.: Analogue modelling of brittle shear zone propagation across upper crustal morpho-rheological heterogeneities, J. Struct. Geol., 126, 175–197, https://doi.org/10.1016/j.jsg.2019.06.004, 2019.
González-Muñoz, S., Schreurs, G., Schmid, T., and Martín-González, F.: Experimental pictures article: Influence of lateral heterogeneities on strike-slip fault behaviour: insights from analogue models, e-cienciaDatos [data set], https://doi.org/10.21950/WVB8ZO, 2024.
Harris, R. A. and Day, S. M.: Dynamic 3D simulation of earthquakes on en echelon faults, Geophys. Res. Lett., 26, 2089–2092, 1999.
Hatem, A. E., Cooke, M. L., and Toeneboehn, K.: Strain localization and evolving kinematic efficiency of initiating strike-slip faults within wet kaolin experiments, J. Struct. Geol., 101, 96–108, https://doi.org/10.1016/j.jsg.2017.06.011, 2017.
Hatem, A. E., Cooke, M. L., and Toeneboehn, K.: Strain localization and evolving kinematic efficiency of initiating strike-slip faults within wet kaolin experiments, J. Struct. Geol., 101, 96–108, https://doi.org/10.1016/j.jsg.2017.06.011, 2017.
Kim, Y., Peacock, D. C. P., and Sanderson, D. J.: Fault damage zones, J. Struct. Geol., 26, 503–517, 2004.
Kirkland, C. L., Alsop, G. I., and Prave, A. R.: The brittle evolution of a major strike-slip fault associated with granite emplacement: a case study of the Leannan Fault, NW Ireland, J. Geol. Soc., 165, 341–352, https://doi.org/10.1144/0016-76492007-064, 2008.
Lefevre, M., Souloumiac, P., Cubas, N., and Klinger, Y. : Experimental evidence for crustal control over seismic fault segmentation, Geology, 48, 844–848, https://doi.org/10.1130/g47115.1, 2020.
Livio, F. A., Ferrario, M. F., Frigerio, C., Zerboni, A., and Michetti, A. M. Variable fault tip propagation rates affected by near-surface lithology and implications for fault displacement hazard assessment, J. Struct. Geol., 130, 103914, doi:10.1016/j.jsg.2019.103914, 2020.
Mair, K., Frye, K. M., and Marone, C.: Influence of grain characteristics on the friction of granular shear zones, J. Geophys. Res., 107, 4/1–4/9, 2002.
Martel, S. J. and Peterson Jr., J. E.: Interdisciplinary characterization of fracture systems at the US/BK site, Grimsel Laboratory, Switzerland. International Journal of Rock Mechanics and Mining Science and Geomechanical Abstracts, 28, 259–323, 1991.
Martínez Catalán, J. R., Arenas, R., Díaz García, F., and Abati, J.: Variscan accretionary complex of northwest Iberia: Terrane correlation and succession of tectonothermal events, Geology, 25, 1103, https://doi.org/10.1130/0091-7613(1997)025<1103:vaconi>2.3.co;2, 1997.
Martínez Catalán, J. R.: The Central Iberian arc, an orocline centered in the Iberian Massif and some implications for the Variscan belt, Int. J. Earth Sci., 101, 1299–1314, https://doi.org/10.1007/s00531-011-0715-6, 2012.
Martín-González, F. and Heredia, N.: Geometry, structures and evolution of the western termination of the Alpine-Pyrenean Orogen reliefs (NW Iberian Peninsula), J. Iber. Geol., 37, 103–120, https://doi.org/10.5209/rev_JIGE.2011.v37.n2.1, 2011.
Martín-González, F., Barbero, L., Capote, R., Heredia, N., and Gallastegui, G.: Interaction of two successive Alpine deformation fronts: constraints from low-temperature thermochronology and structural mapping (NW Iberian Peninsula), Int. J. Earth. Sci., 101, 1331–1342, https://doi.org/10.1007/s00531-011-0712-9, 2012.
Matte, P.: Accretionary history and crustal evolution of the Variscan belt in Western Europe, Tectonophysics, 196, 309–337, https://doi.org/10.1016/0040-1951(91)90328-p, 1991.
Misra, S., Mandal, N., and Chakraborty, C: Formation of Riedel shear fractures in granular materials: Findings from analogue shear experiments and theoretical analyses, Tectonophysics, 471, 253–259, https://doi.org/10.1016/j.tecto.2009.02.017, 2009.
Moore, J. D. P. and Parsons, B.: Scaling of viscous shear zones with depth-dependent viscosity and power-law stress–strain-rate dependence, Geophys. J. Int., 202, 242–260, https://doi.org/10.1093/gji/ggv143, 2015.
Myers, R. and Aydin, A.: The evolution of faults formed by shearing across joint zones in sandstone, J. Struct. Geol., 26, 947–966, 2004.
Nicholson, C., Seeber, L., Williams, P., and Sykes, L. R.: Seismic evidence for conjugate slip and block rotation within the San Andreas fault system, Southern California, Tectonics, 5, 629–648, 1986.
Odling, N. E., Harris, S. D., and Knipe, R. J.: Permeability scaling properties of fault damage zones in siliclastic rocks, J. Struct. Geol., 26, 1727–1747, 2004.
Panien, M., Schreurs, G., and Pfiffner, A.: Mechanical behaviour of granular materials used in analogue modelling: insights from grain characterisation, ring-shear tests and analogue experiments, J. Struct. Geol., 28, 1710–1724, https://doi.org/10.1016/j.jsg.2006.05.004, 2006.
Peacock, D. C. P. and Sanderson, D. J.: Displacement, segment linkage and relay ramps in normal fault zones, J. Struct. Geol., 13, 721–733, 1991.
Peacock, D. C. P. and Sanderson, D. J.: Effects of layering and anisotropy on fault geometry, J. Geol. Soc., 149, 793–802, https://doi.org/10.1144/gsjgs.149.5.0793, 1992.
Petersen, M. D., Dawson, T. E., Chen, R., Cao, T., Wills, C. J., Schwartz, D. P., and Frankel, A. D.: Fault displacement hazard for strike-slip faults, BSSA, 805–825, https://doi.org/10.1785/0120100035, 2011.
Preuss, S., Herrendörfer, R., Gerya, T., Ampuero, J.-P., and Dinther, Y.: Seismic and aseismic fault growth lead to different fault orientations, J. Geophys. Res.-Solid Earth, 124, 8867–8889, https://doi.org/10.1029/2019jb017324, 2019.
Ramberg, H.: Gravity, Deformation and the Earth’s Crust, Academic Press, London, ISBN-10: 0125768605, 1981.
Richard, P.: Experiments on faulting in a two-layered cover sequence overlying a reactivated basement fault with oblique-slip, J. Struct. Geol., 13, 459–469, 1991.
Richard, P., Naylor, M. A., and Koopman, A.: Experimental models of strike-slip tectonics, Pet. Geosci., 1, 71–80, 1995.
Riedel, W.: Zur Mechanik geologischer Brucherscheinungen, Centralblatt, 354–368 pp., https://oceanrep.geomar.de/id/eprint/52902 (last access: 2023), 1929.
Rispoli, R.: Stress fields about strike-slip faults inferred from stylolites and tension gashes, Tectonophysics, 75, 729–736, 1981.
Ron, H., Freund, R., Garfunkel, Z., and Nur, A.: Block rotation by strike slip faulting: structural and paleomagnetic evidence, J. Geophys. Res., 89, 6256–6270, 1984.
Sammis, C. G., King, G., and Biegel, R.: The kinematics of gouge deformation, Pure Appl. Geophys., 125, 777–812, 1987.
Schellart, W. P. and Strak, V. A review of analogue modelling of geodynamic processes: Approaches, scaling, materials and quantification, with an application to subduction experiments, J. Geodynam., 100, 7–32, https://doi.org/10.1016/j.jog.2016.03.009, 2016.
Schmid, T., Schreurs, G., Warsitzka, M., and Rosenau, M.: Effect of sieving height on density and friction of brittle analogue material: ring-shear test data of quarz sand used for analogue experiments in the Tectonic Modelling Lab of the University of Bern, GFZ Data Services [code], https://doi.org/10.5880/fidgeo.2020.006, 2020a
Schmid, T., Schreurs, G., Warsitzka, M., and Rosenau, M.: Effect of sieving height on density and friction of brittle analogue material: Ring-shear test data of corundum sand used for analogue experiments in the Tectonic Modelling Lab of the University of Bern (CH), GFZ Data Services [data set], https://doi.org/10.5880/fidgeo.2020.005, 2020b.
Scholz, C. H.: The Mechanics of Earthquakes and Faulting, Cambridge University Press, https://doi.org/10.1017/9781316681473, 2002.
Schreurs, G.: Experiments on strike-slip faulting and block rotation, Geology, 22, 567, https://doi.org/10.1130/0091-7613(1994)022<0567:eossfa>2.3.co;2, 1994.
Schreurs, G.: Structural analysis of the Schams nappes and adjacent tectonic units in the Penninic zone (Grisons, SE-Switzerland), ETH Zurich, https://doi.org/10.3929/ethz-a-000578883, 1991.
Schreurs, G.: Fault development and interaction in distributed strike-slip shear zones: an experimental approach, in: Intraplate Strike-slip Deformation Belts, edited by: Storti, F., Holdsworth, R. E., and Salvini, F., Geol. Soc. Spec. Publ., 210, 35–52, 2003.
Segall, P. and Pollard, D. D. Nucleation and growth of strike slip faults in granite, J. Geophys. Res., 88, 555–568, https://doi.org/10.1029/jb088ib01p00555, 1983.
Shaw, B. E. and Dieterich, J. H.: Probabilities for jumping fault segment stepovers, Geophys. Res. Lett., 34, L01307, https://doi.org/10.1029/2006GL027980, 2007.
Sibson, R. H.: Stopping of earthquake ruptures at dilational fault jogs, Nature, 316, 248–251, 1985.
Stirling, M. W., Wesnousky, S. G., and Shimazaki, K.: Fault trace complexity, cumulative slip, and the shape of the magnitude-frequency distribution for strike-slip faults: a global survey, Geophys. J. Int., 124, 833–868, 1996.
Sylvester, A. G.: Strike-slip faults, Geol. Soc. Am. Bull., 100, 1666–1703, https://doi.org/10.1130/0016-7606(1988)100<1666:SSF>2.3.CO;2, 1988.
Vegas, R., Vicente Muñoz, G., Muñoz Martín, A., and Palomino, R.: Los corredores de fallas de Régua-Verin y Vilariça: Zonas de transferencia de la deformación intraplaca en la Península Ibérica, Geo-Temas, 6, 245–248, https://hdl.handle.net/20.500.14352/52547 (last access: 2023), 2004.
Veludo, I., Dias, N. A., Fonseca, P. E., Matias, L., Carrilho, F., Haberland, C., and Villaseñor, A.: Crustal seismic structure beneath Portugal and southern Galicia (Western Iberia) and the role of Variscan inheritance, Tectonophysics, 717, 645–664, https://doi.org/10.1016/j.tecto.2017.08.018., 2017.
Venâncio, M. B. and da Silva, F. C. A.: Structures evolution along strike-slip fault zones: The role of rheology revealed by PIV analysis of analog modeling, Tectonophysics, 229764, 229764, https://doi.org/10.1016/j.tecto.2023.229764, 2023.
Vergés, J., Kullberg, J. C., Casas-Sainz, A., de Vicente, G., Duarte, L. V., Fernàndez, M., Gómez, J. J., Gómez-Pugnaire, M. T., Jabaloy Sánchez, A., López-Gómez, J., Macchiavelli, C., Martín-Algarra, A., Martín-Chivelet, J., Muñoz, J. A., Quesada, C., Terrinha, P., Torné, M., and Vegas, R.: An introduction to the alpine cycle in Iberia, En The Geology of Iberia: A Geodynamic Approach, 1–14 pp., Springer International Publishing, https://doi.org/10.1007/978-3-030-11295-0_1, 2019.
Visage, S., Souloumiac, P., Cubas, N., Maillot, B., Antoine, S., Delorme, A., and Klinger, Y.: Evolution of the off-fault deformation of strike-slip faults in a sand-box experiment, Tectonophysics, 847, 229704, https://doi.org/10.1016/j.tecto.2023.229704, 2023.
Wesnousky, S. G.: Seismological and structural evolution of strike-slip faults, Nature, 335, 340–342, 1988.
Wesnousky, S. G.: Predicting the endpoints of earthquake ruptures, Nature, 444, 358–360, 2006.
Westerweel, J. and Scarano, F.: Universal outlier detection for PIV data, Experiments in fluids, 39, 1096–1100, 2005.
Weijermars, R. and Schmeling, H.: Scaling of Newtonian and non-Newtonian fluid dynamics without inertia for quantitative modelling of rock flow due to gravity (including the concept of rheological similarity), Phys. Earth Planet. Int., 43, 316–330, 1986.
Zhang, X. and Sagiya, T.: Shear strain concentration mechanism in the lower crust below an intraplate strike-slip fault based on rheological laws of rocks, EPS, 69, https://doi.org/10.1186/s40623-017-0668-5, 2017.
Zwaan, F., Schreurs, G., Ritter, M., Santimano, T., and Rosenau, M.: Rheology of PDMS-corundum sand mixtures from the Tectonic Modelling Lab of the University of Bern (CH), GFZ Data Services [data set], https://doi.org/10.5880/fidgeo.2018.023, 2018.


