the Creative Commons Attribution 4.0 License.
the Creative Commons Attribution 4.0 License.
 | 14 Jun 2024
Frequency-dependent shear wave attenuation across the Central Anatolia region, Türkiye
Tuna Eken
Peter Gaebler
Tülay Kaya-Eken
Tuncay Taymaz
The Central Anatolian Plateau with its volcanic provinces represents a broad transition zone between the compressional deformation in the east and the extensional regime in the west. The Central Anatolian Fault Zone separates the Kırşehir Block in the north and the Anatolide–Tauride Block in the south within the plateau. A proper understanding of physical properties such as seismic attenuation in the crustal volume of this region can provide hints toward the possible source for the geodynamic events in the past and present that likely lead to the observed deformation. In order to model intrinsic and scattering attenuation separately, we perform a nonempirical coda-wave modeling approach in which a fitting process between observed and synthetic coda-wave envelopes is performed for each earthquake in multiple frequency bands. Here, the acoustic radiative transfer theory, assuming multiple isotropic scattering, was utilized for the forward modeling of the synthetic coda-wave envelopes of local earthquakes. Our findings generally highlight the prominent nature of intrinsic attenuation over scattering attenuation, implying the presence of thick volcanic rocks with relatively high attenuation values beneath Central Anatolia. Overall, the spatial distribution of the attenuation at varying frequencies marks the Kırşehir Massif distinctively with its considerable high-attenuating character. Our findings, combined with early seismological and geo-electrical models, suggest a possible partial melt beneath most of the Central Anatolian Volcanic Province, and the resultant zones of elevated fluid-rich content exhibit high and dominant intrinsic attenuation. To the southeast, a gradual decrease in the observed attenuation coincides with the Central Taurus Mountains where high altitude is considered to be evolved following the slab break-off and resulting mantle upwelling.
- Article
(11074 KB) - Full-text XML
- BibTeX
- EndNote


Being overly complex with a long history of subduction, collision and accretion acting on the Anatolian Plate, the Central Anatolian Fault Zone (CAFZ) has been widely studied (Koçyiǧit and Beyhan, 1998; Okay and Tüysüz, 1999). An identification of crustal strain accumulation and its release in time, in relation to the spatiotemporal variations in crustal deformation in this tectonically complicated area, is a hard task (McKenzie, 1972; Jackson and McKenzie, 1984; Şengör and Yilmaz, 1981). The study of seismic attenuation provides valuable insights into ongoing magmatic processes within subduction zones. This is because environments with higher temperatures or the presence of fluids can have distinct effects on seismic attenuation compared to seismic velocity (Karato et al., 2003). It is crucial to accurately quantify both intrinsic and scattering attenuation independently within the region. This is essential for gaining insights into the anticipated crustal-scale deformations in the future, which are likely controlled by the nature of depth-varying heterogeneities along the CAFZ and its surrounding area. The energy of seismic waves is subject to decay due to the properties of the anelastic medium in which they propagate. This energy loss can be attributed to three main phenomena, namely geometric spreading, intrinsic attenuation and scattering attenuation. These are critical physical parameters when considering realistic seismic wave propagation (Aki and Chouet, 1975; Aki, 1969). In the context of intrinsic attenuation, Eq. (1a) describes the dissipation of seismic wave energy. This loss occurs as the energy transforms into other forms, such as heat, and can be attributed to factors like friction or mineral dislocations. Scattering attenuation (Eq. 1b), on the other hand, can be described by the energy redistribution due to small-scale heterogeneities along the path as
where Qi and Qsc are intrinsic and scattering attenuation, b is intrinsic absorption parameter, f is the frequency, and g* is the scattering coefficient. Separating scattering and intrinsic attenuation in varying frequency ranges can be achieved through several methods (Sato et al., 2012). One approach employs a coda-wave modeling procedure where part of the problem is achieved by complete analytic expression of synthetic coda-wave envelopes based on the radiative transfer theory (RTT) (Sens-Schönfelder and Wegler, 2006a). The RTT was used to investigate source and attenuation in different geological settings in a seismically active Vogtland region on the Germany–Czechia border (Eulenfeld and Wegler, 2016), with a larger data set over the entire United States (Eulenfeld and Wegler, 2017). In Anatolia, Gaebler et al. (2019) and later Izgi et al. (2020) employed this approach in order to investigate the central and northwestern section of the North Anatolian Fault Zone, respectively. In the present work, we utilize the same RTT approach to further understand the upper-crustal part of the Central Anatolia region by mapping the 2D variations in frequency-dependent attenuation properties. Our findings will provide new constraints on the seismic character of the upper-crustal part of the study region. For instance, our findings will provide intrinsic and scattering attenuation properties associated with various interesting tectonic and geological features, including the Central Anatolian Volcanic Province (CAVP), which would be meaningful for a proper interpretation of future geodynamic hypotheses aiming at explaining past and/or present deformation history and tectonic evolution of the study area.
1.1 Study area
Türkiye, as a part of the tectonically active system, undergoes constant stress driven by convergent motion of the Arabian Plate, with respect to the Eurasian Plate and the northward convergence of the African Plate beneath Anatolia (Armijo et al., 1999; Faccenna et al., 2006; Reilinger et al., 2006; Taymaz et al., 1991c; Confal et al., 2018). As a result of this ongoing Arabian collision and slab rollback along the Hellenic Trench, the Anatolian microplate has a westward escaping motion with respect to Eurasia with increasing velocities of ∼ 18 to 25 mm yr−1 from east to west (Reilinger et al., 2006). The extrusion of the Anatolian microplate is accommodated by the North and East Anatolian Fault zones (NAFZ and EAFZ, respectively) as evidenced by destructive earthquakes (Taymaz et al., 1990, 1991b, a; Şengör and Yilmaz, 1981). The active tectonics of the Anatolian microplate are shown in Fig. 1. Apart from these major fault zones, the sinistral CAFZ is one other significant structure that characterizes internal deformation in Central Anatolia and is considered to form the future eastern boundary of the Anatolian microplate following a replacement with the EAFZ (Koçyiǧit and Beyhan, 1998; Taymaz et al., 1991a; Melgar et al., 2020; Taymaz et al., 2021). The Central Anatolia region (Fig. 1) plays a key role as a transition zone between the compressional regime in the east and the extensional regime in the west. It is characterized by an increasing elevation from the interior to the north and the presence of the Taurus Mountains to the south (Fig. 2). In this form, the region can be considered to exhibit a typical plateau-like morphology on a smaller scale. The continental fragments were consolidated during the Neo-Tethyan Ocean closure in the Cretaceous period. As a result of this closure, the northern Pontides were separated from the Kırşehir Block. In the southern region, it was disconnected from the Anatolide–Tauride Block, having been identified by the presence of the Inner Tauride suture (ITS) (Şengör and Yilmaz, 1981; Abgarmi et al., 2017). The Anatolide–Tauride Block primarily comprises non-metamorphosed platform carbonates, while the Kırşehir Block is composed of Cretaceous high-temperature metamorphic rocks and igneous intrusions (Tüysüz, 1999; Whitney and Hamilton, 2004; Okay and Tüysüz, 1999).
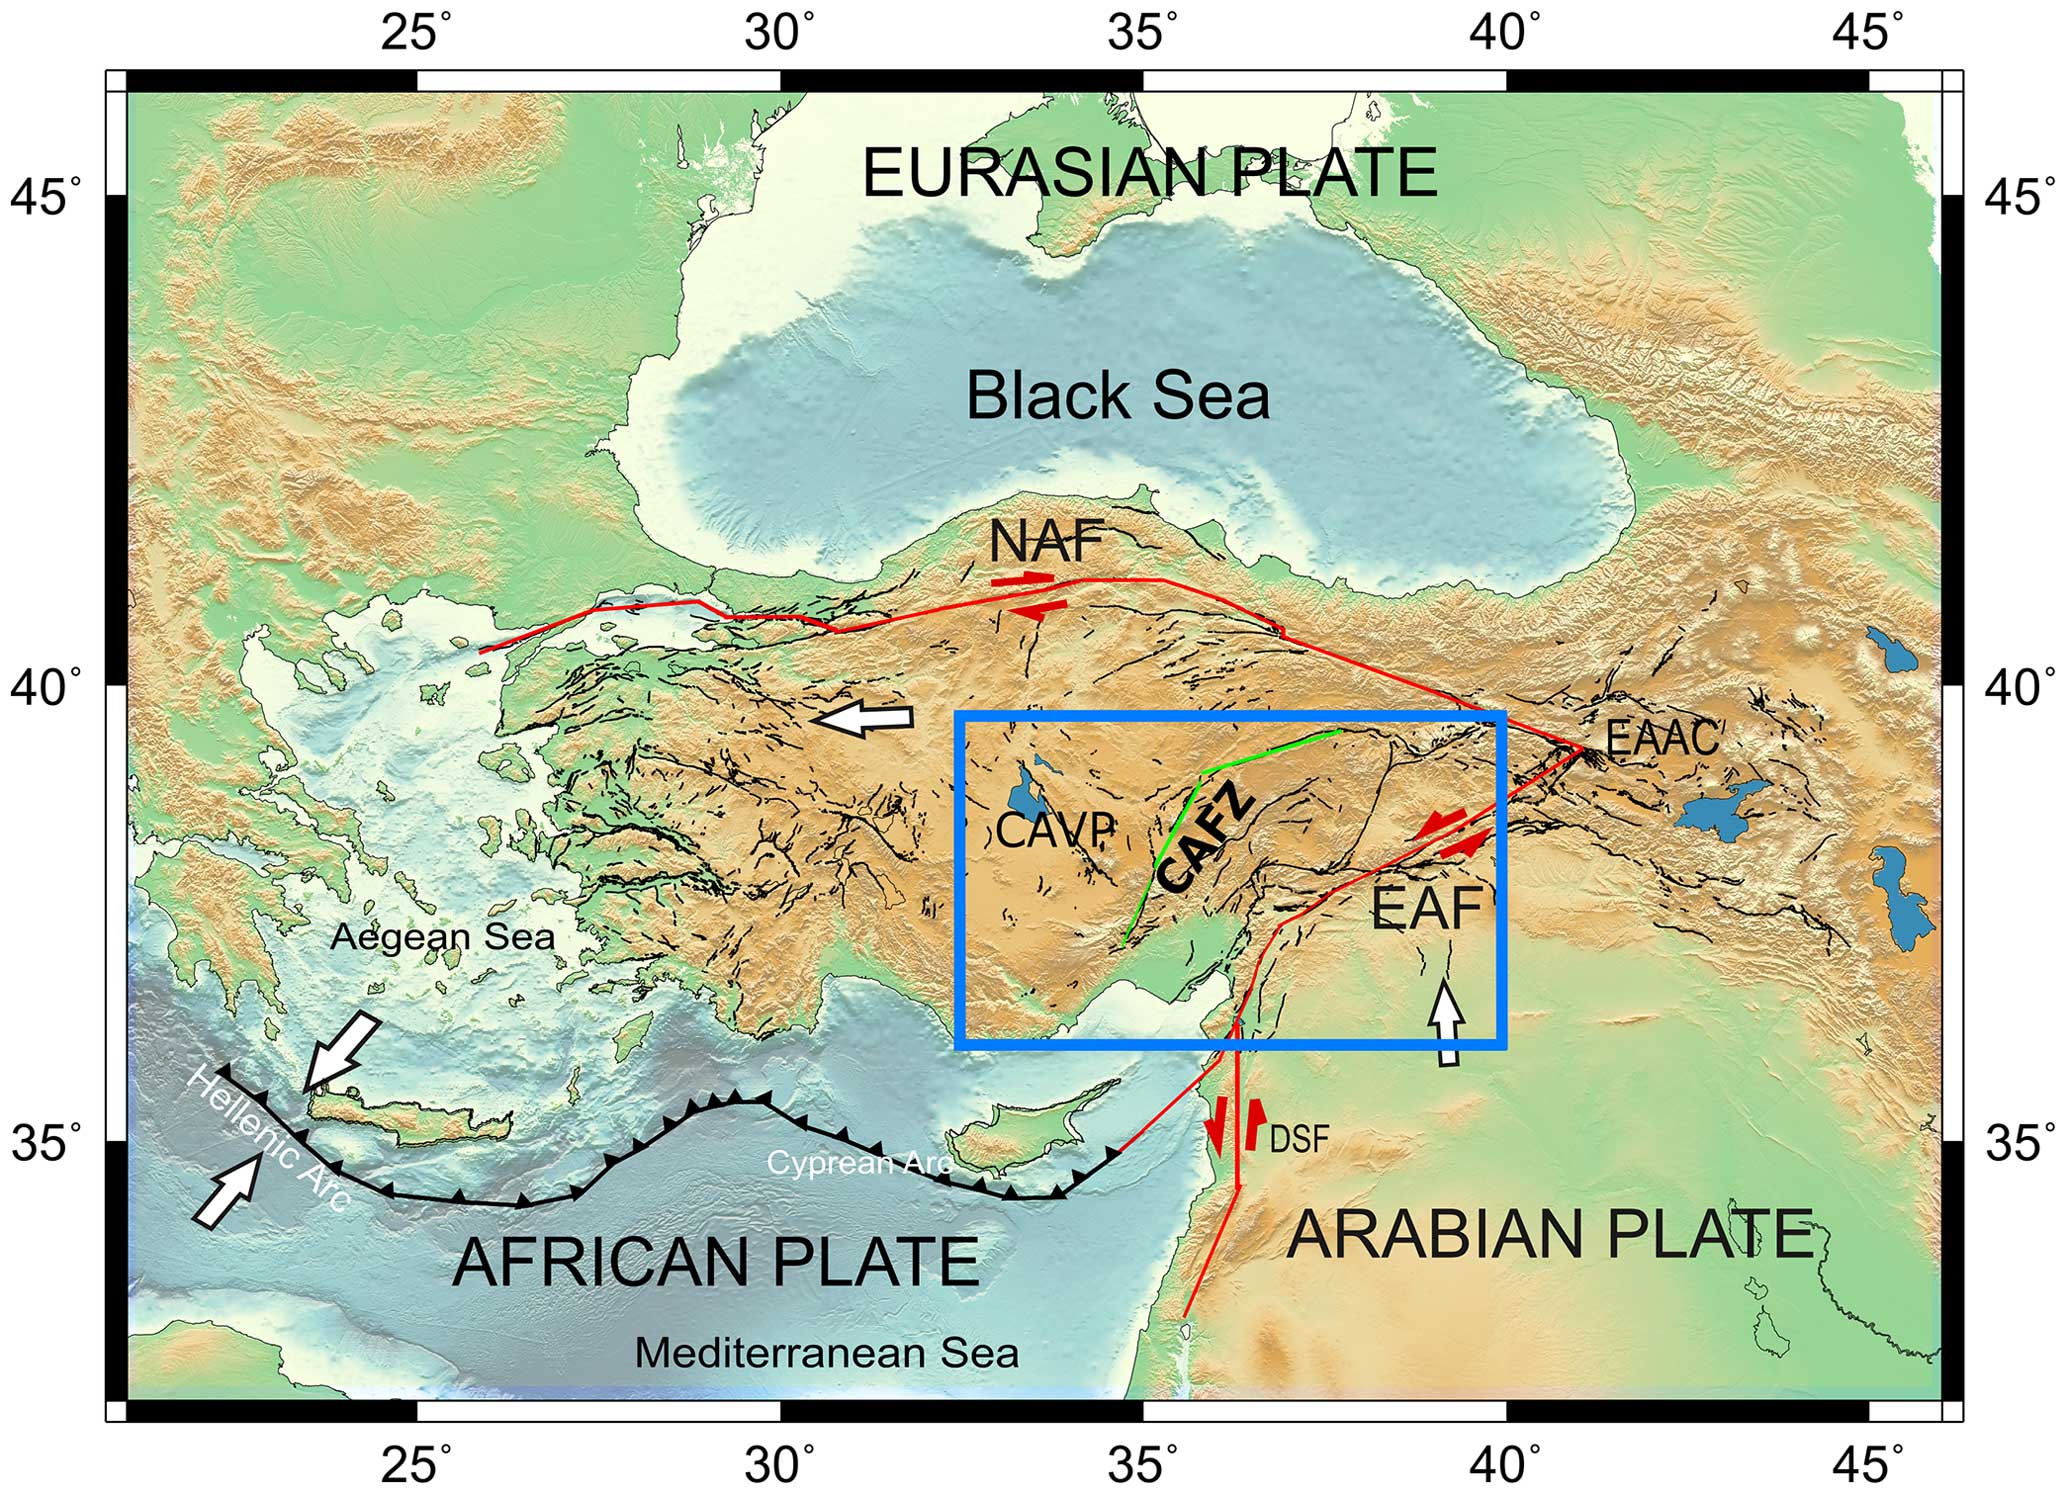
Figure 1Active tectonics of the Anatolian microplate with respect to the Eurasian, Arabian and African plates. Extensional boundaries are shown in green, and major shear zones are shown in red (NAF: North Anatolian Fault, EAF: East Anatolian Fault, DSF: Dead Sea Fault, EAAC: East Anatolia Accretionary Complex, CAVP: Central Anatolian Volcanic Province). The study area is indicated by the blue rectangle. Bathymetry and topography data are taken from GEBCO (2019), and the active faults are from Şaroğlu et al. (1992).
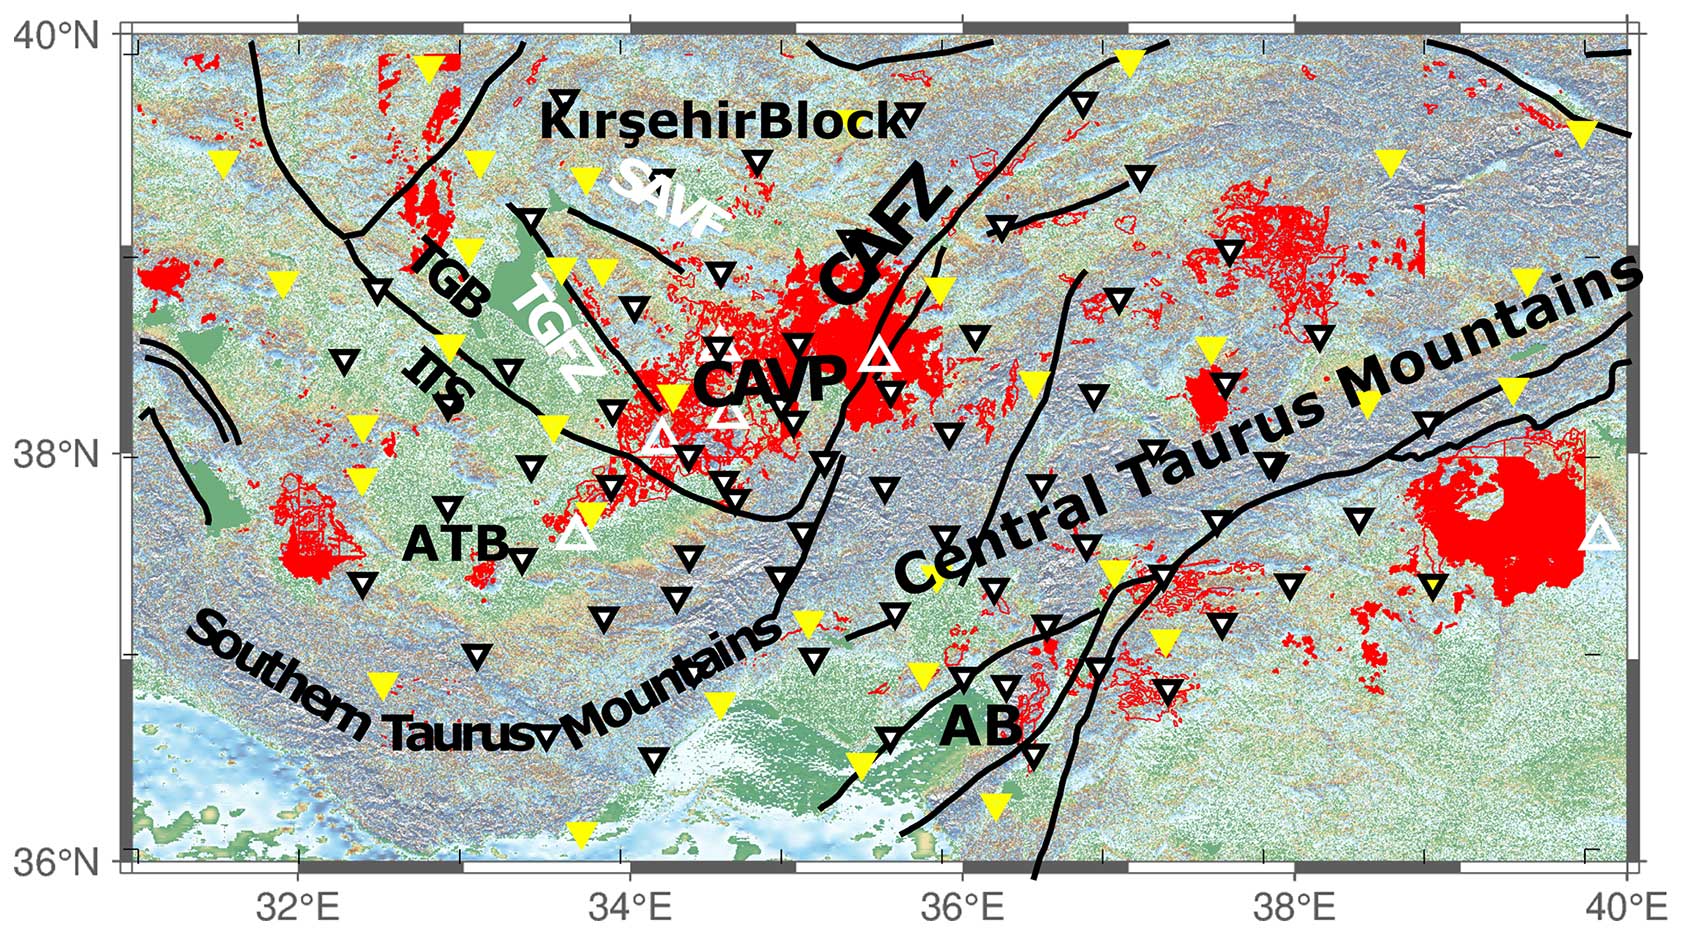
Figure 2The topographic map showing the study area with key tectonic features modified from Abgarmi et al. (2017). Black lines indicate main faults in the study area (CAFZ: Central Anatolian Fault Zone, ITS: Inner Tauride suture, SAVF: Savcılı Fault, TGFZ: Tuz Gölü Fault Zone). White inverted triangles indicate the Continental Dynamics–Central Anatolian Tectonics (CD-CAT) network, and the yellow inverted triangles indicate the Kandilli Observatory and Earthquake Research Institute (KOERI) stations. Large white triangles show Holocene volcanoes, and the red polygons are Neogene–Anthropocene volcanic deposits (e.g., CAVP: Central Anatolian Volcanic Province). ATB refers to the Anatolide–Tauride Block, and AB represents the Adana basin.
1.2 Data
We utilized 72 broadband stations deployed within the framework of a passive seismic experiment between 2013 and 2015 named the Continental Dynamics–Central Anatolian Tectonics (CD-CAT) (Portner et al., 2018). In total, we examined 1509 local earthquakes with local magnitudes between Ml 2.0 and Ml 4.6 from the IRIS Data Management Center. The distance between stations and events is restricted to a maximum of 120 km to avoid the effects of Moho-guided Sn waves. We preferred to analyze the earthquakes with less than 10 km of focal depth in order to exclude the effect of relatively large-scale heterogeneities on coda-wave trains. Station–event pairs are shown in Fig. 3.
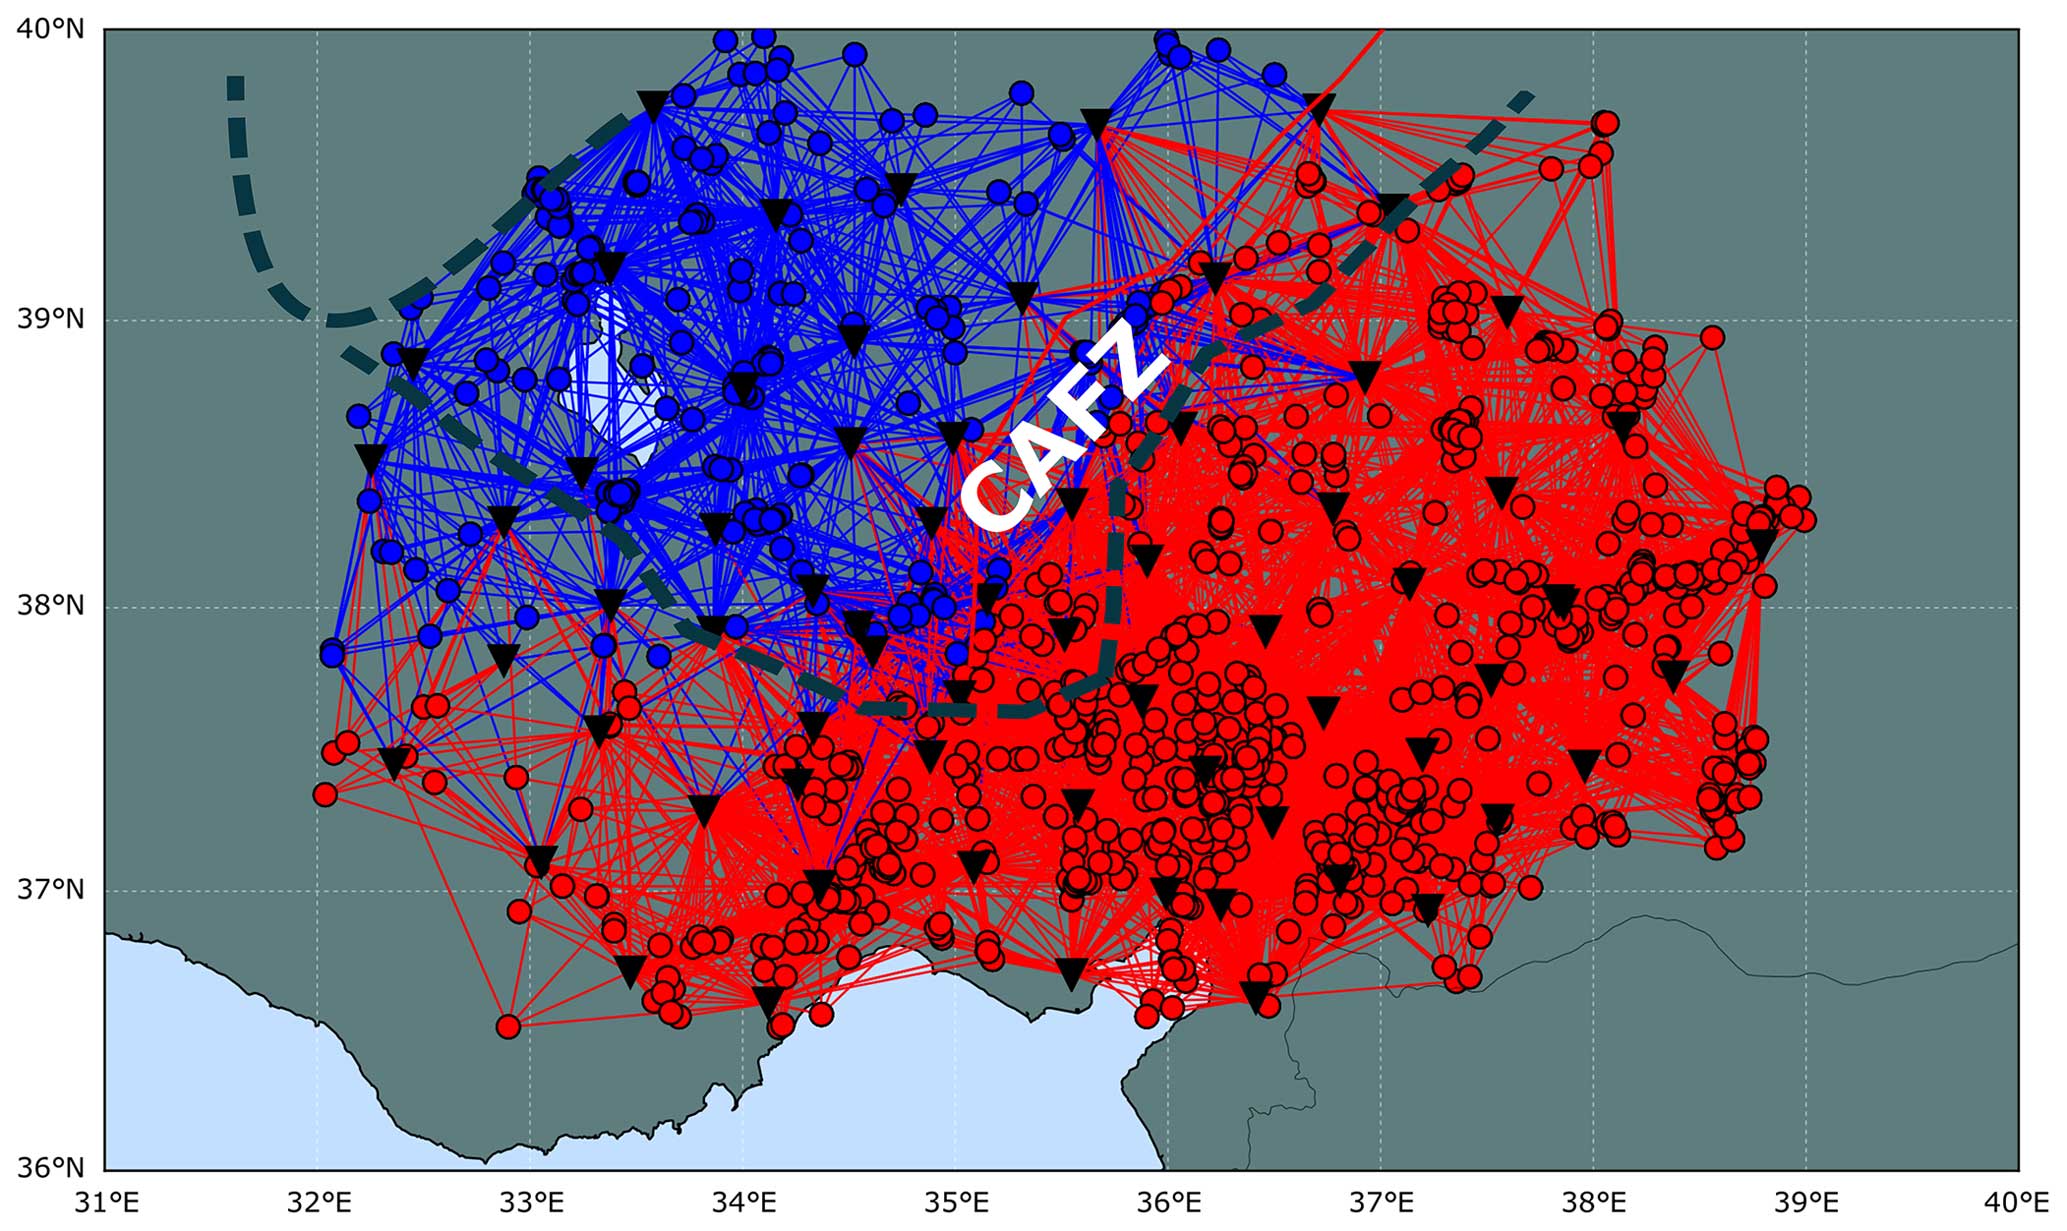
Figure 3A total of 1509 earthquakes given as circles with ray paths. Their colors are shown according to their position relative to the Central Anatolian Fault (CAF), and the Inner Tauride suture (ITS) marks the tectonic difference. Inverted black triangles show the location of 72 broadband stations.
We used a Butterworth band-pass filter with central frequencies at 0.75, 1.5, 3.0, 6.0 and 12 Hz. Theoretical S-wave onsets are determined according to a pre-calculated crustal model (Delph et al., 2015). In the absence of phase picks, the S-wave window is deliberately chosen to be wide enough to encompass all the direct S-wave energy, starting 3 s before the arrival of the S wave and extending to 7 s after. The subsequent coda window begins at the end of the S-wave window and can last up to 100 s. However, the coda window may be shortened if the signal-to-noise ratio falls below a threshold of 2.5 or if the smoothed envelope stops falling over time and starts rising again, possibly due to an aftershock. Stations with coda windows shorter than 20 s are excluded from the inversion process. If data are available from fewer than three stations, the corresponding frequency band is omitted from the analysis for that particular event.
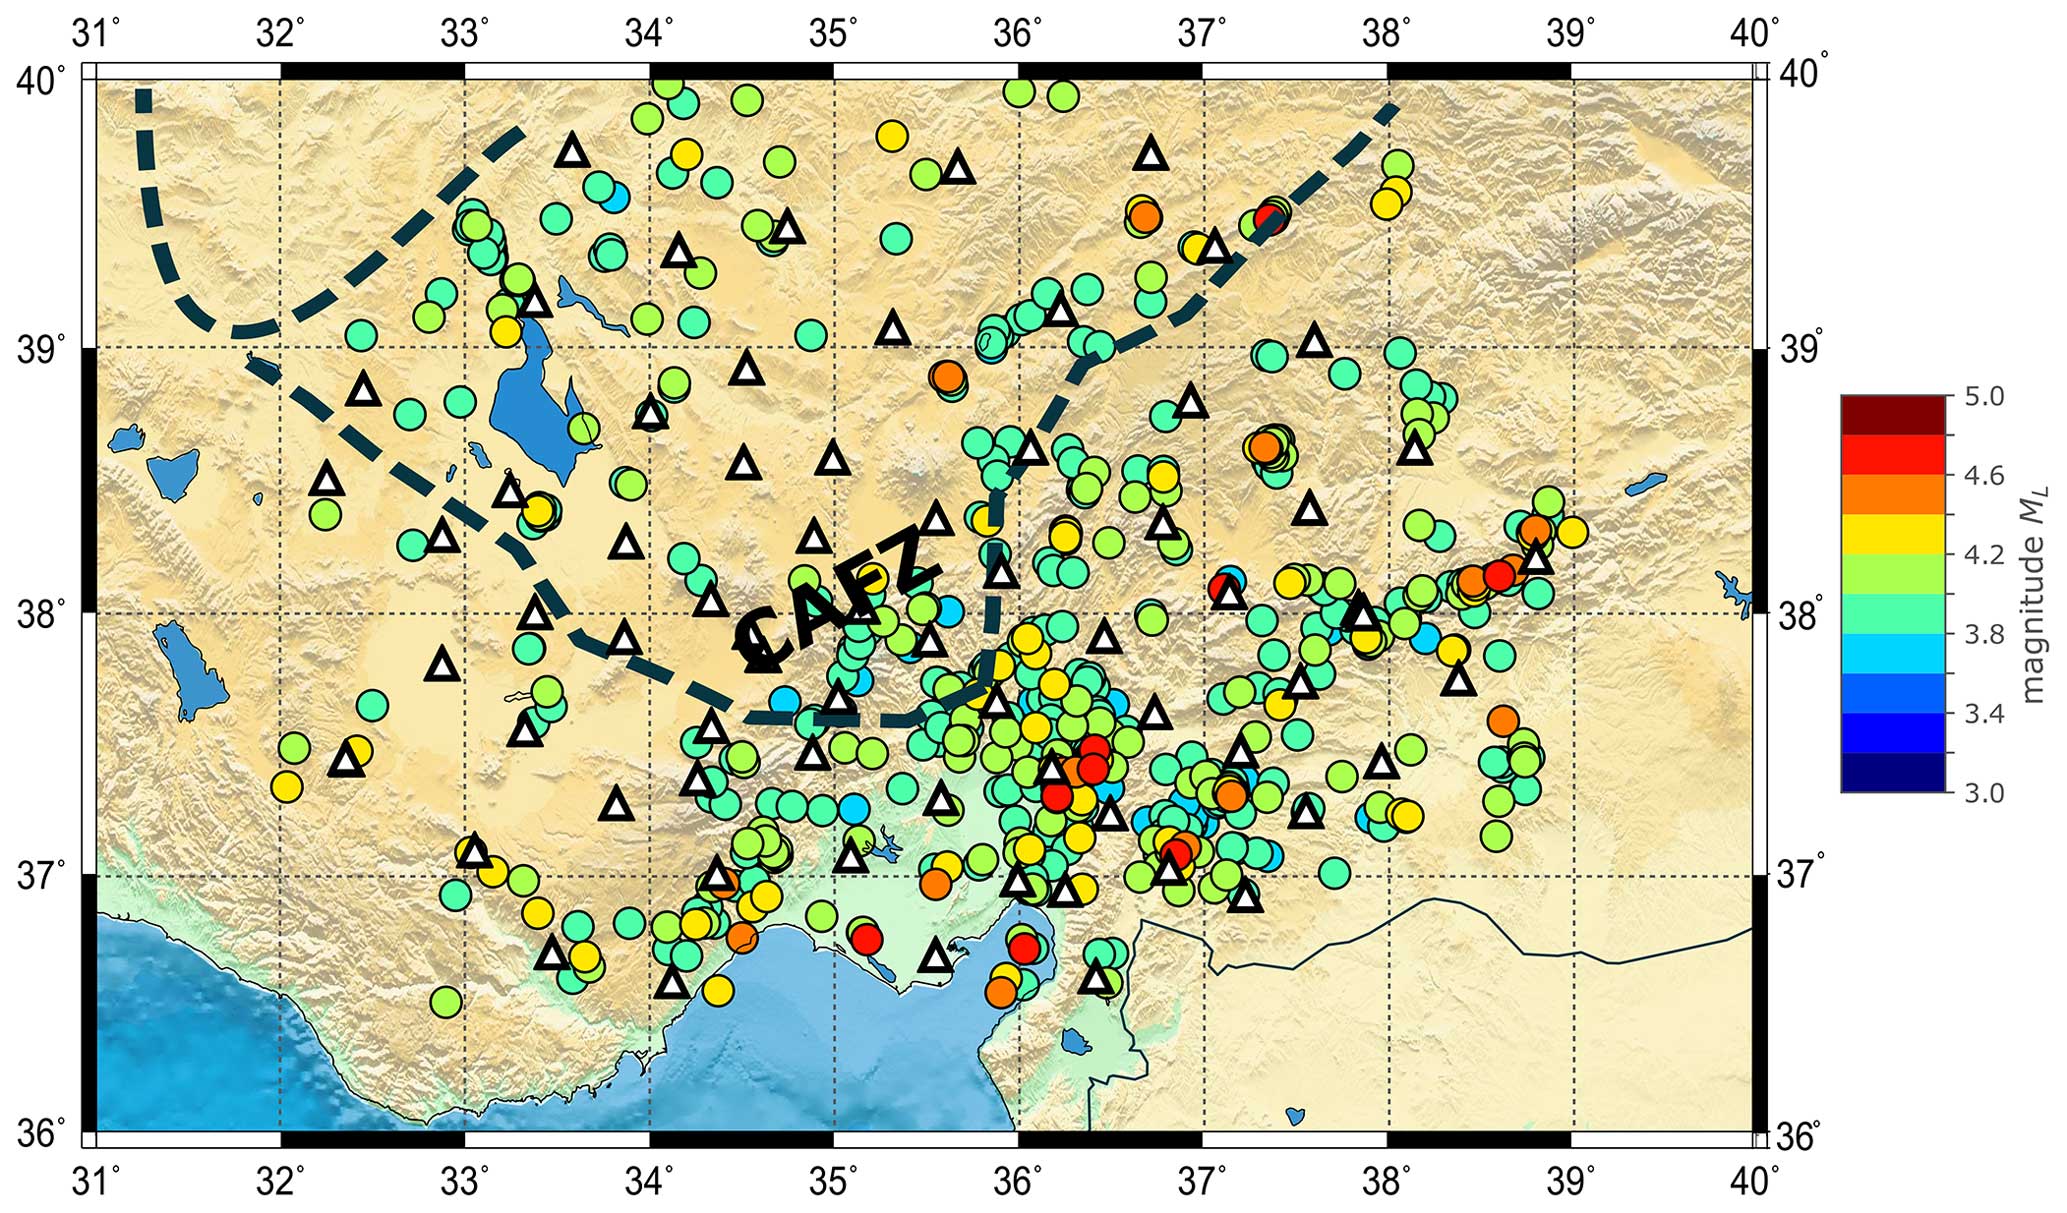
Figure 4A total of 916 selected earthquakes with varying magnitudes are shown in colors accordingly. White triangles represent 72 broadband stations.
2.1 Inversion process
Chandrasekhar (2013) introduced the RTT as a means to describe the propagation of light through a turbulent atmosphere. In the field of seismology, the RTT has been used to describe the propagation of seismic waves in heterogeneous media (Przybilla and Korn, 2008; Sens-Schönfelder and Wegler, 2006a; Gaebler et al., 2015; Izgi et al., 2020). We utilized an inversion method based on an acoustic RTT introduced by Sens-Schönfelder and Wegler (2006b) since it enables us to use events with smaller amplitudes and directly provides the relation between source excitation and coda-wave amplitude. With this method, coda normalization is not compulsory because the source and site parameters are calculated within the inversion. For each earthquake, the inversion simultaneously solves for the intrinsic absorption parameter (b), scattering coefficient (g*), site amplification factor (Ri) and spectral source energy (W). For the corresponding frequency band of an earthquake, the event must be recorded at a minimum of three stations; otherwise it is removed from the analysis. The forward calculation of energy density (Emod), which represents theoretical envelopes for a specific frequency band under the assumption of an isotropic source, is expressed in Sens-Schönfelder and Wegler (2006b) as follows:
where W, R and b, which are all frequency-dependent source terms, are the source term, energy site amplification factor and attenuation parameter, respectively. The function , as given by Paasschens (1997), includes both the scattered wave field and the direct wave and is expressed as follows:
where the term with the Dirac delta function δ represents the direct wave, and the other terms without the δ are the scattered waves. V0 corresponds to the mean S-wave velocity and g0 is the only scattering parameter in this formula used under the assumption of isotropic scattering. The modeled energy envelopes (Emod) are compared with the observed energy envelopes (Eobs) calculated via Eq. (1) for each seismic station within our inversion scheme, which is summarized below.
where ρ0 is the mean mass density, is the mean square velocity and C acts as the free surface correction as C=4 (Emoto et al., 2010). To obtain observed envelopes, the seismic velocity data are filtered by a specific frequency band f and normalized by the filter width δf. The error function (Err(g)) represents the misfit between predicted (Eq. 2) and observed (Eq. 4) energy densities for each event at each station with Nij time samples (index k) in a specific frequency band. It is defined as a sum over the squared residuals of the solution and can be minimized using
Here, the scattering attenuation term g will be optimized once the following equality is fulfilled, which minimizes the error function calculated for each scattering coefficient until it is optimized as
or
Equation (6) can simply be regarded as the expression of an overdetermined inversion problem with equation systems and NS + NE + 1 variables. It enables us to solve Wj, Ri and b using a least-squares technique. Following a simple procedure presented in Eulenfeld and Wegler (2017), we perform the inversion. Briefly, this involves (i) calculating the Green's functions using Eq. (2) with the fixed scattering parameters; (ii) minimizing Eq. (6) to solve for b, Ri and Wj via a weighted least-squares approach; and (iii) repeating the first two steps by varying g to optimize the model parameters g, b, Ri and Wj that provide optimal fitting between the observed and predicted coda-wave envelopes.
2.2 Envelope fitting
The method has been validated by fitting synthetic and observed energy envelopes, utilizing an analytical approximation to calculate direct S-wave and coda-wave energy (Paasschens, 1997). Earlier, it was proven that only using the S-wave energy for fitting the envelopes would be sufficient, as the S-wave dominates the wave train (Gaebler et al., 2015). Figure 5 presents an example of envelope fitting performed on an event with ML=4.1 using five different frequency bands (0.75, 1.5, 3.0, 6.0 and 12.0 Hz) at four stations and demonstrates that observed energy densities accurately fit, allowing for the precise determination of direct S-wave onsets in terms of envelope amplitude.
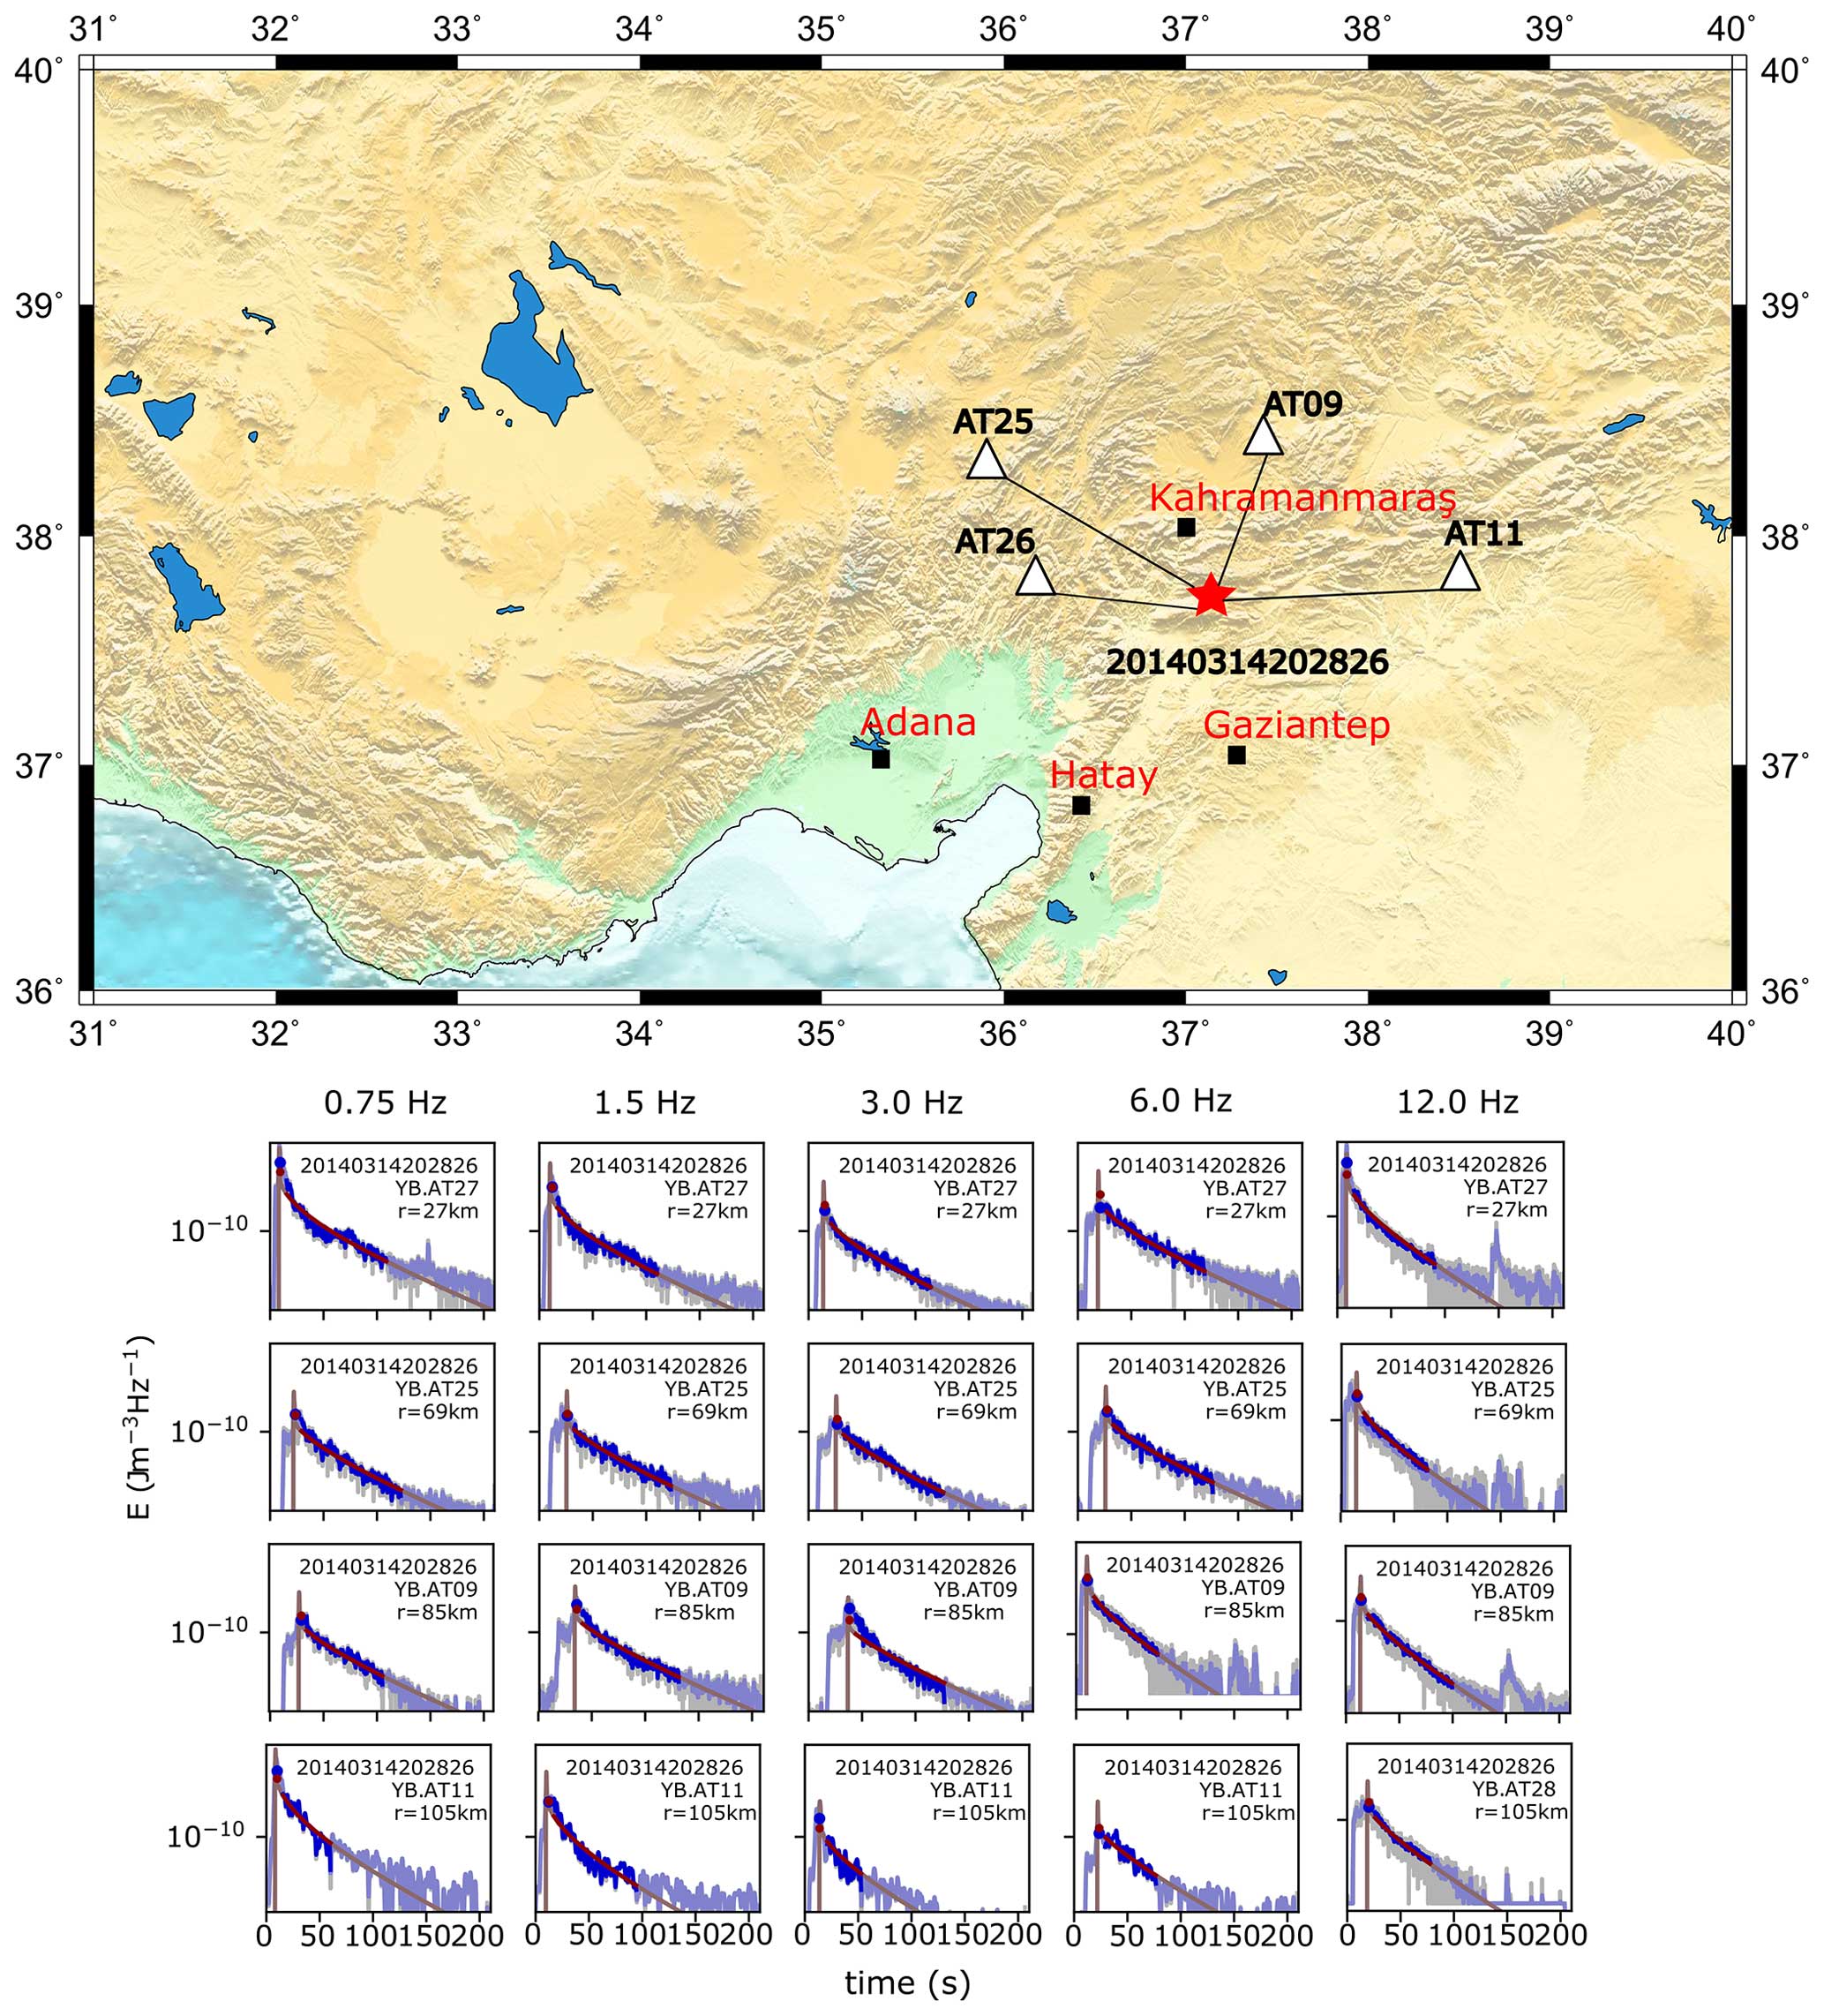
Figure 5Fitting example of an earthquake, shown as a red star, recorded at four stations, shown as white triangles. Surrounding main cities are marked by black squares. Bathymetry and topography data are taken from GEBCO (2019), and active faults are taken from Şaroğlu et al. (1992). Beneath the topography map, the five columns represent the central frequencies, and the rows correspond to station recordings. Red and blue colors show the synthetic and observed energy envelopes. Grey indicates the smoothed and observed energy densities. Dots show the average of respective energy densities in the S-wave window.
Across all magnitudes and frequency bands, the direct onset of the S wave can be accurately modeled in terms of envelope amplitude. Furthermore, the decay of the seismic coda can be modeled with high accuracy for time windows of up to 100 s from a 27 to 85 km depth, while for a 105 km depth, the time window resulting in an accurate envelope fitting is, at maximum, 50 s. It is worth noting that the seismic coda decays faster at higher frequencies, thus lowering the accuracy of the modeled energy envelopes. Mainly because of geometrical spreading, observing a smaller window of the fitting between synthetic and observed energy densities is expected. Thus, the bottom row of panels in Fig. 5, representing the distance equal to 105 km, shows a smaller portion of the fit of the observed envelopes compared to the synthetic envelopes. Since the top row of panels in Fig. 5 corresponds to the uppermost crustal layer when compared to the others, it shows fewer attenuated energy density envelopes and precise fitting. The overall quality of the fits is further comparable to those estimated for different tectonic settings in previous studies (Izgi et al., 2020; Gaebler et al., 2015; Eulenfeld and Wegler, 2016).
Figure 6 shows the 2D spatial variation in intrinsic, scattering and total attenuation parameters estimated for five frequency bands. Figure 7 presents a comparison of frequency-dependent attenuation parameters between the northern and southern parts of the CAFZ. In the study area, the values of all attenuation types increase with a decreasing frequency; for example, the estimated total attenuation of seismic waves ranges from 0.0013 at 12.0 Hz to 0.0216 at 0.75 Hz. The inverse of the scattering quality factor varies between 0.0003 at 12.0 Hz and 0.0116 at 0.75 Hz. The inverse of the intrinsic quality factor decreases from 0.0110 at 0.75 Hz to 0.0011 at 12 Hz. Intrinsic attenuation tends to show an overall dominancy over scattering attenuation. The lateral variation in attenuation values marks the CAF and ITS. In the southeastern part, lower attenuation values with a gradually decreasing pattern are notable from the CAF towards the southeastern end. The dominance of different attenuation types at different frequency bands and their overall contribution to total attenuation appear to be similar or close to each other. Along the northern part of the CAFZ, intrinsic attenuation decreases from 0.0075 at 0.75 Hz to 0.0024 at 12.0 Hz, while at the southern part, it decreases from 0.0089 to 0.0023 at 12.0 Hz. Scattering attenuation has a maximum value of 0.0103 at 0.75 Hz for the northern part and 0.0007 at 12.0 Hz, whereas for the southern part, it varies between 0.0096 at 0.75 Hz and 0.0006 at 12.0 Hz. As a sum of two types of attenuation values, total attenuation changes at the northern part from 0.0179 at 0.75 Hz and 0.0025 at 12.0 Hz, while for the southern part, it is 0.0169 at 0.75 Hz and 0.0024 at 12.0 Hz. At each frequency, attenuation values are relatively higher in the north than in the south of the CAFZ. The error bars in Fig. 7 are calculated concerning the average values for their respective regions and provide an understanding of the variability in attenuation characteristics within the specified areas on either side of the CAFZ. This visual representation further offers a clear insight into the nuanced patterns of total attenuation, with the error bars serving as indicators of deviation for individual station estimates from the regional averages. Notably, the frequency dependence of total attenuation (Fig. 7c) can be explained by a best-fitting power law. The frequency dependence for the blocks north of the CAFZ is represented by 0.0136×f0.714, while for the blocks south of the CAFZ, it is represented by 0.0132×f0.718.
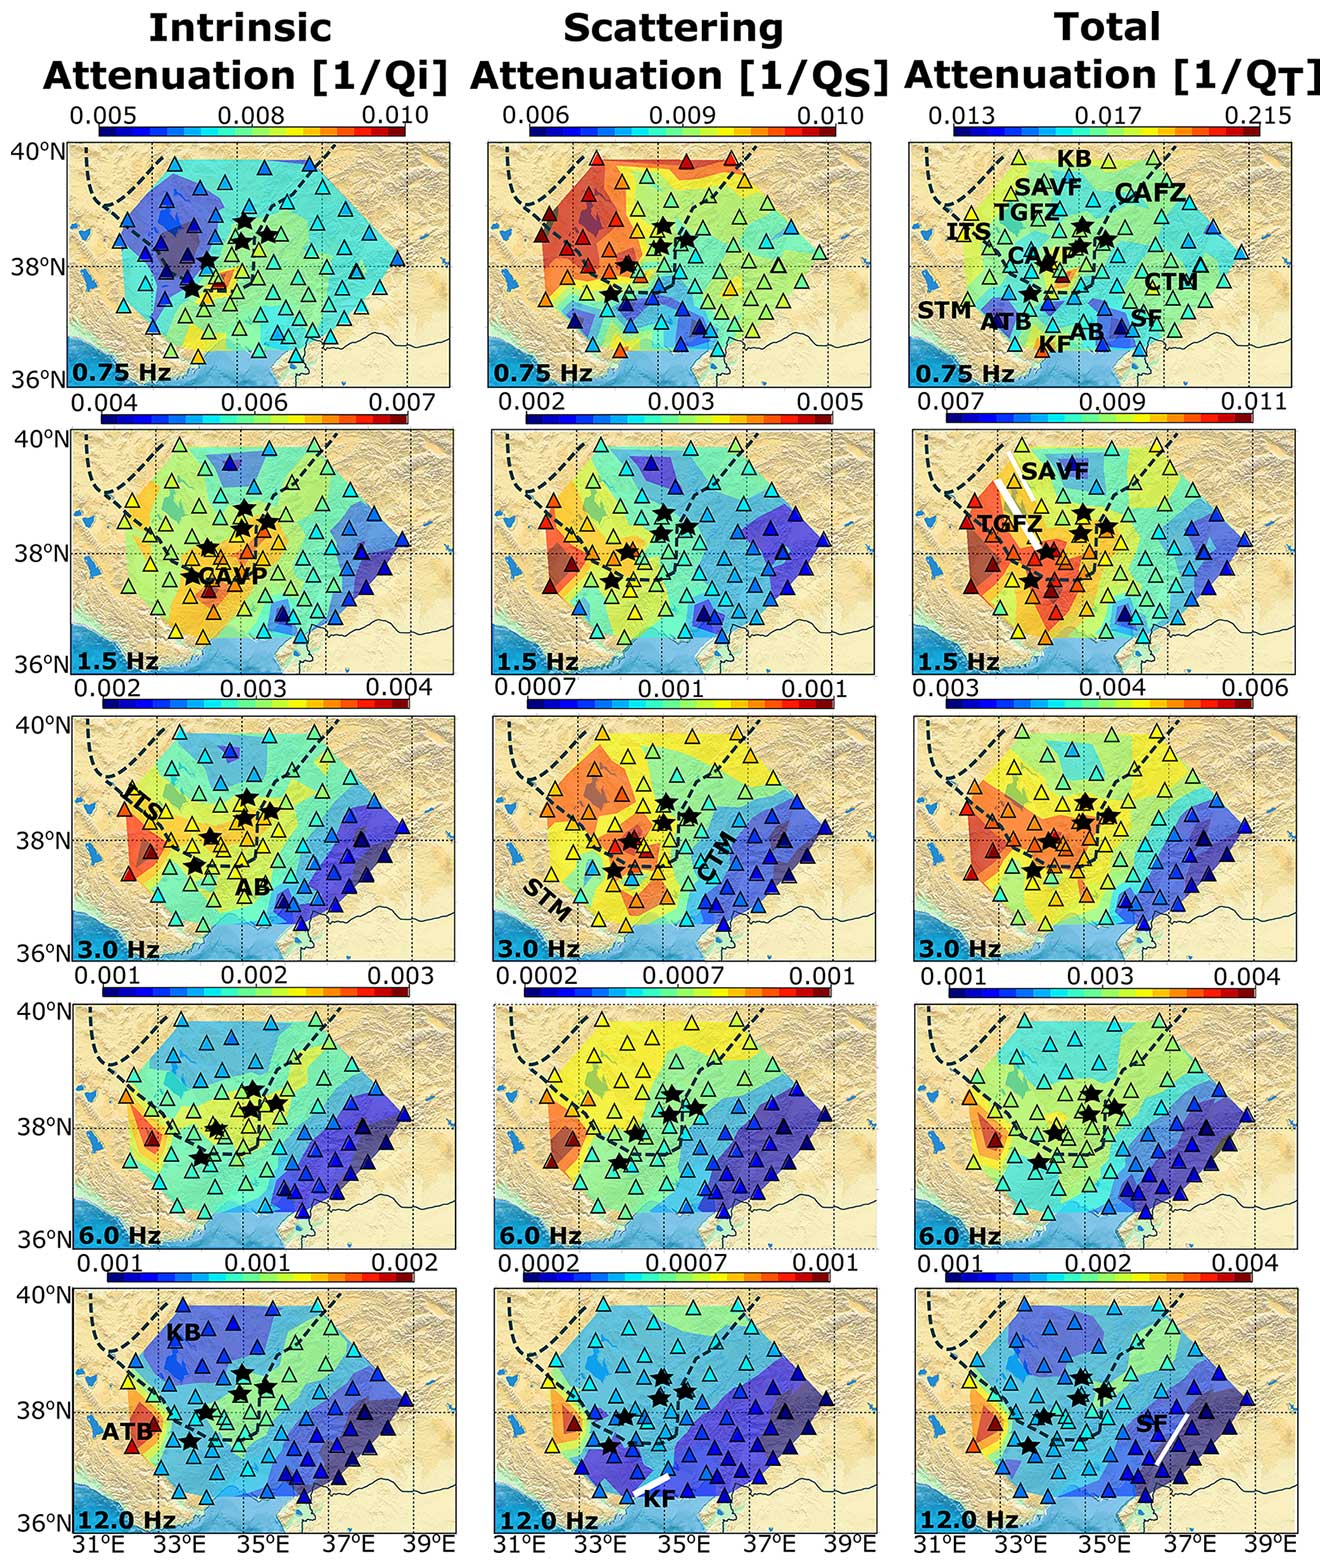
Figure 6Topography maps of the study area showing 2D variations in the inverse quality factors , which represent seismic intrinsic (left), scattering (middle) and total attenuation (right), respectively. Each row corresponds to the investigated frequency bands increasing from top to bottom. Attenuation value increase is color-coded and increases from blueish to reddish colors. Stations are shown as triangles. The dashed lines correspond to the Central Anatolian Fault (CAF) and other major faults in the study area, indicating the tectonics. Black stars mark the volcanic provinces. Annotations are the same as in Fig. 2. ATB, AB, KB, KF, SF, CTM and STM refer to the Anatolide–Tauride Block, Adana basin, Kırşehir Block, Kozan Fault, Sarız Fault, Central Taurus Mountains and southern Taurus Mountains, respectively.
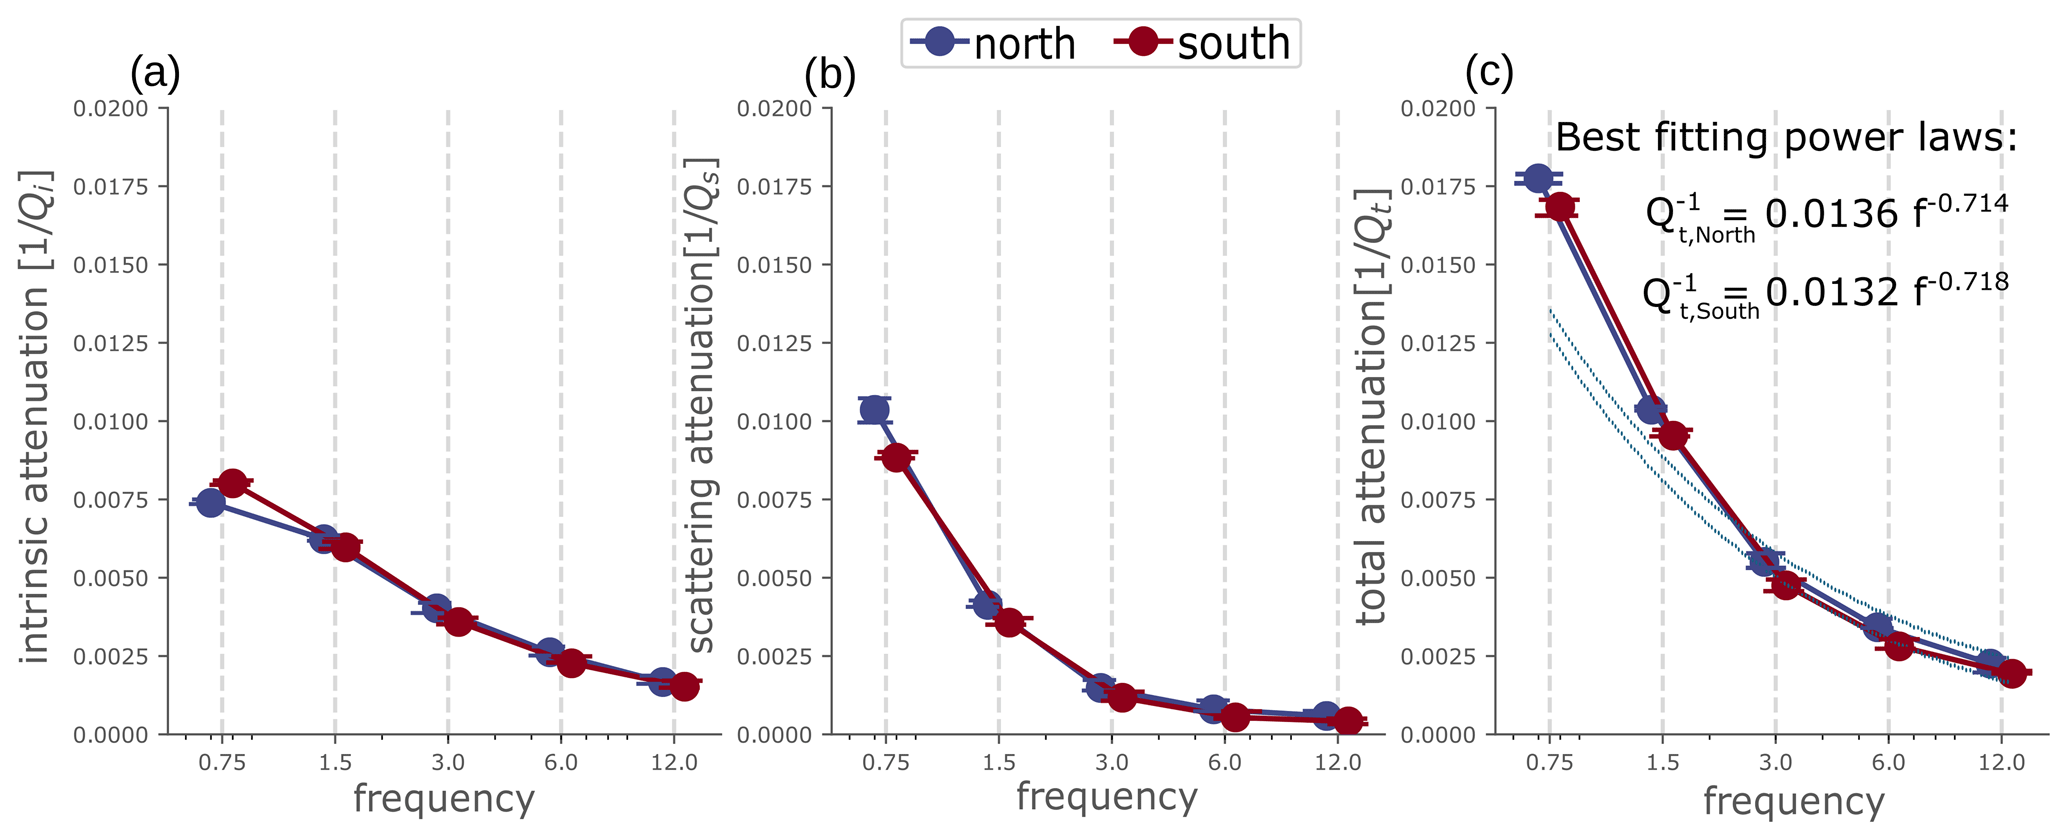
Figure 7The inverse of the quality factors (panel (a) shows , panel (b) shows and panel (c) shows as a function of frequency. The northern part is shown in blue and southern in red. The dotted lines on the right side symbolize the best-fitting power law for total attenuation in both the northern and southern parts. Error bars accompanying each estimation reflect the median absolute deviation from individual stations located both north and south of the CAFZ.
Our approach employing a joint inversion technique to estimate the structural properties provides powerful tools to investigate the crustal structure of tectonically active regions. Izgi et al. (2020) reported a clear significance of the scattering attenuation over the intrinsic attenuation at the frequencies corresponding to the deeper parts of the upper crust as well as an overall decrease in attenuation properties towards the north of the western NAFZ. Mapping the variation in attenuation properties enabled a clear marking of the main branch of the central part of the CAFZ, as this was the case in early attenuation modeling studies using the same approach at the western and central part of the NAFZ (Gaebler et al., 2019; Izgi et al., 2020). Similarly, we could define the TGFZ by a considerable contrast in attenuation variation (Fig. 6). The volcanic provinces in the Central Anatolia region show the highest attenuation. When examining the 2D spatial distributions of attenuation values (see Fig. 6), two main blocks are clearly distinguished: the Kırşehir Block and the Anatolide–Tauride Block, which are separated by the CAFZ. The younger and hotter crust exhibits dominancy of intrinsic attenuation (Eulenfeld and Wegler, 2017) since the anelastic processes are controlled mainly by the temperature (Cormier et al., 2011). Ates et al. (2005) reported high heat flow values (around 70–80 m) in the Central Pontides, resulting in shallow Curie temperature depths and the presence of hot materials. Intrinsic attenuation is found to be slightly dominant over scattering attenuation within the region, except at the deepest part (0.75 Hz) as this can explain the presence of thick volcanic rocks beneath Central Anatolia. Significant differences from the northern to the southern parts of the CAFZ imply a highly heterogeneous nature of the region with a complex tectonic structure. Part of the observed contrast can be denoted to lithological contrasts that are likely developed due to the structural–tectonic relationships in the crust. These contrasts have a potential impact on the regions of distinct sedimentary and crustal architecture. To give a better overview of our findings, we examine our results in the following three sections: ”Kırşehir Block”, ”Southeastern part of the CAF” and ”Southwestern part of the CAFZ”.
4.1 Kırşehir Block
The triangular-shaped Kırşehir Block (see Fig. 2), which is bounded by the strand of the CAFZ and ITS, is known as crystalline complex and mainly composed of high-temperature metamorphic rocks with igneous intrusions (Okay and Tüysüz, 1999; Whitney and Hamilton, 2004; Gürer et al., 2016). Localities with a pronounced thin crust are distributed mainly along the central Kırşehir Block, where the Moho is typically below 35 km and as shallow as ∼ 25 km (Vanacore et al., 2013; Eken et al., 2021). The faults (Tuz Gölü Fault and the CAFZ) and sutures (Ankara–Erzincan suture, Inner Tauride suture and Izmir–Ankara suture), by which the Kırşehir Block is bounded, seem to accommodate crustal thickness variations between the inside and outside of this block. The close relationship between Moho depth changes, fault and suture zones suggests a strong control of structural inheritance on the present-day crustal structure and fault development. This complex deformation area is clearly observable via the 2D spatial distribution of our attenuation estimates. There is a noticeable variation in the crustal composition across the CAFZ. For instance, the CAFZ appears to act as a separator between carbonate nappes from the highly deformed metamorphosed rocks and exploits the lithospheric-scale weakness of the ITS (Fig. 2). On the northwestern side of the zone, the Central Anatolian Volcanic Province (CAVP) consists of a volcanic complex characterized by calc-alkaline to Holocene alkaline volcanic activity during the middle–late Miocene period, following a northeast to southwest direction (Toprak and Göncöoḡlu, 1993; Toprak, 1998; Piper et al., 2002; Aydin et al., 2014). The CAVP encompasses pyroclastic lava flow deposits that exhibit an age progression from southwest to northeast (Schleiffarth et al., 2015). The highly attenuating behavior of the southwestern region of the CAVP can be observed in Fig. 6, in particular, for the deeper sections of the crust (e.g., 0.75, 1.5 and 3.0 Hz). Early seismic imaging studies based on the depth-migrated and stacked and converted wave analyses (Abgarmi et al., 2017), local P-wave/Pn-wave tomography (Gans et al., 2009; Wang et al., 2020), ambient noise tomography (Delph et al., 2015), and modeling of teleseismic P-coda autocorrelation functions (Eken et al., 2021) suggest slow seismic wave speeds beneath most of the CAVP. As evidence for this, observed multiple large negative amplitude conversions (Abgarmi et al., 2017), or a distinct transition between faster and slower in terms of Pn velocities from the southern to northern part of the CAF (Gans et al., 2009), can be given. Our high attenuation estimates and large negative amplitude with a moderate ratio (i.e., 1.75–1.80) (Eken et al., 2021) can be explained by a possible partial melt in this area. High and low electrical resistivity anomalies resolved from the inversion of magnetotelluric data in southwest Cappadocia of Central Anatolia, which is evidenced by the covering layer of welded ignimbrites and Quaternary volcanism products as well as a relatively deep (4–6 km), single magmatic chamber beneath Mt. Hasan and the surrounding system (Tank and Karaş, 2020). Similarly, another magnetotelluric modeling study (Başokur et al., 2022) detected a deep and large zone of low resistivity <10Ω m, interpreted as a shallow-seated magma reservoir at a depth of 3 to 7 km beneath the volcanic edifice of Karadağ, which is one of the inactive stratovolcanoes from the Quaternary period in the area. At relatively shallow depths (> 1–2 km) a near-surface localized low-resistivity zone of lacustrine sediment was also reported by Başokur et al. (2022). This zone is well marked by our moderate attenuation values at high frequencies (12 Hz). Zones of elevated fluid content exhibit higher attenuation in the Kırşehir Block compared to the southern part of the north–south boundary (see Fig. 7). The fluid-rich content is visible in all frequency bands and characterized by dominant intrinsic attenuation compared to a scattering one except 0.75 Hz.
The Tuz Gölü basin is an extensive low-relief region between the Pontide and Taurus mountains with a basin sedimentation controlled by the extensional Tuz Gölü Fault (Cemen, 1999; Dirik and Erol, 2003; Oezsayin and Dirik, 2007). Biryol et al. (2011) reported upwelling of asthenospheric material from seismic tomography below Tuz Gölü through lithospheric slab breaks and tears. Cosentino et al. (2012) observed a relation of slab breaks to uplift patterns towards the south. We observed a noticeable alteration in both scattering and intrinsic attenuation, particularly in the deeper sections of the crust (e.g., 0.75 and 1.5 Hz), which characterizes the SAVF and the TGFZ. The spatial variation in scattering attenuation, which demonstrates an increasing attenuation towards the south, facilitates the propagation of the slab tear. At a depth of 75 km beneath Central Anatolia, which coincides with Kırşehir Massif, a structure showing slow anomalies was detected (Zhu, 2018). High attenuation values in the shallow parts of the lithosphere correspond well with similar findings of Biryol et al. (2011) as well as the results from Confal et al. (2020), which present low S-wave velocities and, therefore, high ratios in accordance with intrinsic attenuation.
4.2 Southeastern part of the CAF
The southeastern region of the CAFZ comprises the Central Taurus Mountains, which are bounded by the Kozan Fault (KF) to the south and the Adana basin (AB) and Sarız Fault (SZ) to the east (see Fig. 6). Faccenna et al. (2006) investigated Pn velocities in this area and interpreted the sharp transition between fast and slow velocities as the boundary of a second slab window extending towards the west. We observe a gradual decrease in attenuation values from the eastern edge of the study area, including the Central Taurus Mountains, to the southeastern part of the CAFZ, which is consistent with relatively high P-wave and S-wave speeds beneath the mountain range, resolved in early studies (Gans et al., 2009; Abgarmi et al., 2017; Wang et al., 2020; Eken et al., 2021). Significant crustal thinning (Eken et al., 2021) is evident in the transition from the Taurus Mountains (more than 40 km thick) to the Adana basin (about 30 km thick) over a relatively short lateral distance of about 60 km. This pronounced thinning of the crust corresponds to the Kozan Fault, which is thought to be a transtensional splay fault branching from the East Anatolian Fault Zone (EAFZ) (Higgins et al., 2015). However, the observed motion along the Kozan Fault is insufficient to account for the 2 km of uplift of the Taurus Mountains since the Late Miocene. The uplift of the Taurus Mountains and Central Anatolia is a subject of interest and debate in the scientific community. This uplift coincides with a decrease in the attenuation values within this area, and the Kozan Fault is characterized by the marked change in scattering attenuation from low to high in deeper parts and from intermediate to low in shallower parts. The Taurus Mountains, located at the southern border of the Anatolian microplate, are a part of the Anatolide–Tauride Block. These mountains are composed of non-metamorphosed platform carbonates and are covered by Late Miocene platform carbonates. Two recent competing hypotheses, the slab break-off model (Schildgen et al., 2012, 2014) and drip tectonics (Göğüş et al., 2017), attempt to explain the uplift of the Taurus Mountains and Central Anatolian Plateau. According to Eken et al. (2021), recent constraints on the Moho topography suggest that the thick crust in the Taurus Mountains aligns with the assumption of simple crustal isostatic equilibrium in the slab break-off model. Their crustal thickness model only resembles the models of lithospheric removal in the plate hinterland of Central Anatolia. Seismic tomography models obtained for the crust and upper mantle in the region have indicated relatively high-velocity anomalies underneath the Taurus Mountains (Wang et al., 2020; Confal et al., 2020). Cosentino et al. (2012) claimed that the uplift in the area is the possible outcome of the asthenospheric upwelling following the slab break-off. Their model required hot material in the crust–mantle volume north of the Taurus Mountains. This was found to be consistent by Cosentino et al. (2012), who observed profound low P-wave velocities (1 %–2 %) at shallow depths but a large-scale low-velocity (2 %–4 %) zone revealed in the lower crust and uppermost mantle beneath the Late Cenozoic volcanic centers in central Türkiye. The low and high seismic attenuation features beneath and north of the Taurus Mountains, respectively, combined with the velocity properties, provide evidence for the presence of lithospheric remnants in the sublithospheric mantle. This supports a slab break-off model to explain the uplift of the region and the subsequent upwelling of asthenospheric material that could lead to partial melting. Adana basin experiences gradual crustal thickening towards the northeast (Fichtner et al., 2013a, b; Higgins et al., 2015; Abgarmi et al., 2017; Delph et al., 2017), which is evident from a gradual change in attenuation values. Continuing to the east, the SZ accommodates internal deformations of the Taurus Mountains (Kaymakci et al., 2010). This fault exhibits a distinct change in attenuation values, particularly at shallower depths (e.g., 3.0, 6.0 and 12.0 Hz), which decrease rapidly from west to east of the SZ.
4.3 Southwestern part of the CAF
In this region, the distinctive identification of young basaltic volcanic rocks is evident from their pronounced high attenuation characteristics. Specifically, at low-frequency ranges between 0.75 and 1.5 Hz, this increasing attenuation fairly aligns with Neogene volcanism originating from the upper mantle. This association is linked to the presence of Holocene volcanoes in the southwestern part of the CAFZ (Pearce et al., 1990). This correlation suggests recent, small-volume mafic volcanic activity, including a mafic sill that has stalled in the crust (Rojay et al., 2001; Abgarmi et al., 2017). The highest attenuation estimates are located near the western edge of the CAFZ and are in good agreement with the NE–SW elongated zone of slowest shear velocities reported in Delph et al. (2017). As we shift towards higher frequencies, such as 3.0, 6.0 and 12.0 Hz, there is a significant increase in scattering and intrinsic attenuation near the ATB. To the north of this region, a strong contrast within the lateral variation in attenuation across the CAF appears to confirm the crustal thickening (Gans et al., 2009; Vanacore et al., 2013; Eken et al., 2021) that is considered to develop in response to the mantle upwelling following the detachment of the Cyprus slab north of the Taurus Mountains (Melnick et al., 2017). At low frequencies (e.g., 0.75 and 1.5 Hz), scattering attenuation is more pronounced than intrinsic attenuation, particularly in the upper crust. This suggests that small volumes of a mafic sill may have intruded into the young basaltic rocks in the area. The changes in intrinsic and scattering attenuation along the southwestern part of the CAFZ in deeper sections of the crust indicate the SAVF and TGFZ. Furthermore, the increasing scattering attenuation towards the south may suggest the propagation of slab tear in the geological setting.
This study focused on investigating the physical properties of the Central Anatolian Plateau, specifically the seismic attenuation in the crustal volume of the region. The plateau serves as a transition zone between compressional deformation in the east and an extensional regime in the west. The Central Anatolian Fault Zone separates the Kırşehir Block in the north and the Anatolide–Tauride Block in the south. Using a nonempirical coda-wave modeling approach, we aimed to distinguish between intrinsic attenuation and scattering. Our methodology involved applying the acoustic radiative transfer theory, which assumes multiple isotropic scattering in order to forward-calculate synthetic coda-wave envelopes of local earthquakes. The study found that intrinsic attenuation has a greater impact than scattering attenuation, suggesting the presence of thick volcanic rocks with high attenuation in Central Anatolia. The spatial distribution of attenuation at different frequencies clearly identified the Kırşehir Massif as having high-attenuating behavior. Further analysis, in conjunction with early seismological and geo-electrical models, indicates the possibility of partial melting beneath most of the Central Anatolian Volcanic Province. High and dominant intrinsic attenuation was found to represent this partial melt and resultant zones of elevated fluid-rich content. Moving southeast, a gradual decrease in observed attenuation correlated with the Central Taurus Mountains, where high altitude is proposed to have evolved due to slab break-off and resulting mantle upwelling. Our attenuation estimates not only improve understanding of the geodynamic events that have shaped the Central Anatolian Plateau but also provide valuable insights into the active deformation mechanisms driven by plate movements. The observed variations in attenuation serve as valuable markers, unraveling the complex interplay between geological processes and tectonic forces within this dynamic region.
The Python code (Qopen) used for carrying out the inverse modeling is available under the permissive MIT license and is distributed at https://github.com/trichter/qopen (last access: 15 April 2017) (https://doi.org/10.5281/zenodo.3953654, Eulenfeld, 2020).
IRIS Data Services and, in particular, the IRIS Data Management Center facilities were used to access the seismic waveforms, associated metadata and/or derived products used in this study (https://doi.org/10.7914/SN/YB_2013, Sandvol, 2013)
The paper was initially prepared by GI and TE. PG reviewed the entire manuscript, particularly the Methodology section. TKE reviewed the entire manuscript and contributed to the geo-electrical crustal property in the study region and geo-dynamic implications. TT equally conceived the study and contributed to the writing of the paper and interpretation of the results and tectonic background.
The contact author has declared that none of the authors has any competing interests.
Publisher’s note: Copernicus Publications remains neutral with regard to jurisdictional claims made in the text, published maps, institutional affiliations, or any other geographical representation in this paper. While Copernicus Publications makes every effort to include appropriate place names, the final responsibility lies with the authors.
Gizem Izgi acknowledges support from the University of Potsdam. Tuna Eken and Tuncay Taymaz acknowledge financial support from the Alexander von Humboldt Foundation (AvH) towards computational and peripheral resources. We thank Christoph Sens-Schönfelder for his valuable comments and helpful discussion and Ceyhun Erman for his contributions to the maps.
This research has been supported by the University of Potsdam.
This paper was edited by Michal Malinowski and reviewed by two anonymous referees.
Abgarmi, B., Delph, J. R., Arda Ozacar, A., Beck, S. L., Zandt, G., Sandvol, E., Turkelli, N., and Biryol, C. B.: Structure of the crust and African slab beneath the central Anatolian plateau from receiver functions: New insights on isostatic compensation and slab dynamics, Geosphere, 13, 1774–1787, https://doi.org/10.1130/GES01509.1, 2017. a, b, c, d, e, f, g
Aki, K.: Analysis of the Seismic Coda of Local Earthquakes as Scattered Waves, J. Geophys. Res., 74, 615–631, 1969. a
Aki, K. and Chouet, B.: Origin of coda waves: Source, attenuation, and scattering effects, J. Geophys. Res., 80, 3322–3342, https://doi.org/10.1029/JB080i023p03322, 1975. a
Armijo, R., Meyer, B., Hubert, A., and Barka, A.: Westward propagation of the North Anatolian fault into the northern Aegean: Timing and kinematics, Geology, 27, 267–270, https://doi.org/10.1130/0091-7613(1999)027<0267:WPOTNA>2.3.CO;2, 1999. a
Ates, A., Bilim, F., and Buyuksarac, A.: Curie point depth investigation of Central Anatolia, Turkey, Pure Appl. Geophys., 162, 357–371, 2005. a
Aydin, F., Schmitt, A. K., Siebel, W., Sönmez, M., Ersoy, Y., Lermi, A., Dirik, K., and Duncan, R.: Quaternary bimodal volcanism in the Niğde Volcanic Complex (Cappadocia, central Anatolia, Turkey): age, petrogenesis and geodynamic implications, Contrib. Mineral. Petr., 168, 1–24, 2014. a
Başokur, A. T., Koçyiğit, A., Hacıoğlu, Ö., Arslan, H. İ., and Meqbel, N.: Magnetotelluric imaging of the shallow-seated magma reservoir beneath the Karadağ stratovolcano, Central Anatolia, Turkey, J. Volcanol. Geoth. Res., 427, 107567, https://doi.org/10.1016/j.jvolgeores.2022.107567, 2022. a, b
Biryol, C., Beck, S. L., Zandt, G., and Özacar, A. A.: Segmented African lithosphere beneath the Anatolian region inferred from teleseismic P-wave tomography, Geophys. J. Int., 184, 1037–1057, 2011. a, b
Cemen, I.: Structural Evolution of the Tuz Golu Basin in Central Anatolia, Turkey, The Journal of Geology, 107, 693–706, 1999. a
Chandrasekhar, S.: Radiative transfer, Courier Corporation, Oxford, Clarendon Press, ISBN 9780486318455, 2013. a
Confal, J. M., Faccenda, M., Eken, T., and Taymaz, T.: Numerical simulation of 3-D mantle flow evolution in subduction zone environments in relation to seismic anisotropy beneath the eastern Mediterranean region, Earth Planet. Sc. Lett., 497, 50–61, 2018. a
Confal, J. M., Bezada, M. J., Eken, T., Faccenda, M., Saygin, E., and Taymaz, T.: Influence of upper mantle anisotropy on isotropic P-wave tomography images obtained in the Eastern Mediterranean region, J. Geophys. Res.-Sol. Ea., 125, e2019JB018559, https://doi.org/10.1029/2019JB018559, 2020. a, b
Cormier, V. F., Attanayake, J., and He, K.: Inner core freezing and melting: Constraints from seismic body waves, Phys. Earth Planet. In., 188, 163–172, 2011. a
Cosentino, D., Schildgen, T. F., Cipollari, P., Faranda, C., Gliozzi, E., Hudáčková, N., Lucifora, S., and Strecker, M. R.: Late Miocene surface uplift of the southern margin of the Central Anatolian Plateau, Central Taurides, Turkey, Bulletin, 124, 133–145, 2012. a, b, c
Delph, J. R., Zandt, G., and Beck, S. L.: A new approach to obtaining a 3D shear wave velocity model of the crust and upper mantle: An application to eastern Turkey, Tectonophysics, 665, 92–100, 2015. a, b
Delph, J. R., Ward, K. M., Zandt, G., Ducea, M. N., and Beck, S. L.: Imaging a magma plumbing system from MASH zone to magma reservoir, Earth Planet. Sc. Lett., 457, 313–324, 2017. a, b
Dirik, K. and Erol, O.: Tectonomorphologic evolution of Tuzgölü and surrounding area, central Anatolia-Turkey, Turkish Association of Petroleum Geologists Special Publication, 5, 27–46, 2003. a
Eken, T., Tork Qashqai, M., Schiffer, C., Taymaz, T., and Saygin, E.: New insights into crustal properties of Anatolia and its surroundings inferred from P-Coda autocorrelation inversions, J. Geophys. Res.-Sol. Ea., 126, e2021JB023184, https://doi.org/10.1029/2021JB023184, 2021. a, b, c, d, e, f, g
Emoto, K., Sato, H., and Nishimura, T.: Synthesis of vector wave envelopes on the free surface of a random medium for the vertical incidence of a plane wavelet based on the Markov approximation, J. Geophys. Res.-Sol. Ea., 115, B08306, https://doi.org/10.1029/2009JB006955, 2010. a
Eulenfeld, T.: Qopen: Separation of intrinsic and scattering Q by envelope inversion, Zenodo [code], https://doi.org/10.5281/zenodo.3953654, 2020.
Eulenfeld, T. and Wegler, U.: Measurement of intrinsic and scattering attenuation of shear waves in two sedimentary basins and comparison to crystalline sites in Germany, Geophys. J. Int., 205, 744–757, https://doi.org/10.1093/gji/ggw035, 2016. a, b
Eulenfeld, T. and Wegler, U.: Crustal intrinsic and scattering attenuation of high-frequency shear waves in the contiguous United States, J. Geophys. Res.-Sol. Ea., 122, 4676–4690, https://doi.org/10.1002/2017JB014038, 2017. a, b, c
Faccenna, C., Bellier, O., Martinod, J., Piromallo, C., and Regard, V.: Slab detachment beneath eastern Anatolia: A possible cause for the formation of the North Anatolian fault, Earth Planet. Sc. Lett., 242, 85–97, 2006. a, b
Fichtner, A., Saygin, E., Taymaz, T., Cupillard, P., Capdeville, Y., and Trampert, J.: The deep structure of the North Anatolian fault zone, Earth Planet. Sc. Lett., 373, 109–117, 2013a. a
Fichtner, A., Trampert, J., Cupillard, P., Saygin, E., Taymaz, T., Capdeville, Y., and Villasenor, A.: Multiscale full waveform inversion, Geophys. J. Int., 194, 534–556, 2013b. a
Gaebler, P., Eken, T., Bektaş, H. Ö., Eulenfeld, T., Wegler, U., and Taymaz, T.: Imaging of shear wave attenuation along the central part of the North Anatolian Fault Zone, Turkey, J. Seismol., 23, 913–927, 2019. a, b
Gaebler, P. J., Eulenfeld, T., and Wegler, U.: Seismic scattering and absorption parameters in the W-Bohemia/Vogtland region from elastic and acoustic radiative transfer theory, Geophysical Supplements to the Monthly Notices of the Royal Astronomical Society, 203, 1471–1481, 2015. a, b, c
Gans, C. R., Beck, S. L., Zandt, G., Biryol, C. B., and Ozacar, A. A.: Detecting the limit of slab break-off in central Turkey: New high-resolution Pn tomography results, Geophys. J. Int., 179, 1566–1572, https://doi.org/10.1111/j.1365-246X.2009.04389.x, 2009. a, b, c, d
GEBCO Bathymetric Compilation Group 2019: The GEBCO_2019 Grid – a continuous terrain model of the global oceans and land, British Oceanographic Data Centre, National Oceanography Centre, NERC, UK [data set], https://doi.org/10.5285/836f016a-33be-6ddc-e053-6c86abc0788e, 2019. a, b
Göğüş, O. H., Pysklywec, R. N., Şengör, A., and Gün, E.: Drip tectonics and the enigmatic uplift of the Central Anatolian Plateau, Nat. Commun., 8, 1538, https://doi.org/10.1038/s41467-017-01611-3, 2017. a
Gürer, D., van Hinsbergen, D. J., Matenco, L., Corfu, F., and Cascella, A.: Kinematics of a former oceanic plate of the Neotethys revealed by deformation in the Ulukışla basin (Turkey), Tectonics, 35, 2385–2416, 2016. a
Higgins, M., Schoenbohm, L. M., Brocard, G., Kaymakci, N., Gosse, J. C., and Cosca, M. A.: New kinematic and geochronologic evidence for the Quaternary evolution of the Central Anatolian fault zone (CAFZ), Tectonics, 34, 2118–2141, 2015. a, b
Izgi, G., Eken, T., Gaebler, P., Eulenfeld, T., and Taymaz, T.: Crustal seismic attenuation parameters in the western region of the North Anatolian Fault Zone, J. Geodyn., 134, 101694, https://doi.org/10.1016/j.jog.2020.101694, 2020. a, b, c, d, e
Jackson, J. and McKenzie, D.: Active tectonics of the Alpine–Himalayan Belt between western Turkey and Pakistan, Geophys. J. Int., 77, 185–264, 1984. a
Karato, S.-I.: Mapping water content in upper mantle, Geophysical Monograph-American Geophysical Union, 138, 135–152, 2003. a
Kaymakci, N., Inceöz, M., Ertepinar, P., and Koç, A.: Late Cretaceous to recent kinematics of SE Anatolia (Turkey), Geological Society, London, Special Publications, 340, 409–435, 2010. a
Koçyiǧit, A. and Beyhan, A.: A new intracontinental transcurrent structure: The Central Anatolian Fault Zone, Turkey, Tectonophysics, 284, 317–336, https://doi.org/10.1016/S0040-1951(97)00176-5, 1998. a, b
McKenzie, D.: Active tectonics of the Mediterranean region, Geophys. J. Int., 30, 109–185, 1972. a
Melgar, D., Ganas, A., Taymaz, T., Valkaniotis, S., Crowell, B. W., Kapetanidis, V., Tsironi, V., Yolsal-Çevikbilen, S., and Öcalan, T.: Rupture kinematics of 2020 January 24 M w 6.7 Doğanyol-Sivrice, Turkey earthquake on the East Anatolian Fault Zone imaged by space geodesy, Geophys. J. Int., 223, 862–874, 2020. a
Melnick, D., Yıldırım, C., Hillemann, C., Garcin, Y., Ciner, A., Pérez-Gussinyé, M., and Strecker, M. R.: Slip along the Sultanhanı Fault in Central Anatolia from deformed Pleistocene shorelines of palaeo-lake Konya and implications for seismic hazards in low-strain regions, Geophys. J. Int., 209, 1431–1454, 2017. a
Oezsayin, E. and Dirik, K.: Quaternary activity of the Cihanbeyli and Yeniceoba fault zones: İnönü-Eskişehir fault system, Central Anatolia, Turkish J. Earth Sci., 16, 471–492, 2007. a
Okay, A. I. and Tüysüz, O.: Tethyan sutures of northern Turkey, Geological Society, London, Special Publications, 156, 475–515, 1999. a, b, c
Paasschens, J.: Solution of the time-dependent Boltzmann equation, Phys. Rev. E, 56, 1135, 1997. a, b
Pearce, J. A., Bender, J., De Long, S., Kidd, W., Low, P., Güner, Y., Saroglu, F., Yilmaz, Y., Moorbath, S., and Mitchell, J.: Genesis of collision volcanism in Eastern Anatolia, Turkey, J. Volcanol. Geoth. Res., 44, 189–229, 1990. a
Piper, J., Gürsoy, H., and Tatar, O.: Palaeomagnetism and magnetic properties of the Cappadocian ignimbrite succession, central Turkey and Neogene tectonics of the Anatolian collage, J. Volcanol. Geoth. Res., 117, 237–262, 2002. a
Portner, D. E., Delph, J. R., Biryol, C. B., Beck, S. L., Zandt, G., Özacar, A. A., Sandvol, E., and Türkelli, N.: Subduction termination through progressive slab deformation across Eastern Mediterranean subduction zones from updated P-wave tomography beneath Anatolia, Geosphere, 14, 907–925, 2018. a
Przybilla, J. and Korn, M.: Monte Carlo simulation of radiative energy transfer in continuous elastic random media–three-component envelopes and numerical validation, Geophys. J. Int., 173, 566–576, 2008. a
Reilinger, R., McClusky, S., Vernant, P., Lawrence, S., Ergintav, S., Cakmak, R., Ozener, H., Kadirov, F., Guliev, I., Stepanyan, R., Nadariya, M., Hahubia, G., Mahmoud, S., ArRajehi, K. S. A., Paradissis, D., Prilepin, A. M., Guseva, T., Evren, E., Dmitrotsa, A., Gomez S. V. F., and Karam, R. A.-G.: GPS constraints on continental deformation in the Africa-Arabia-Eurasia continental collision zone and implications for the dynamics of plate interactions, J. Geophys. Res.-Sol. Ea., 111, B05411, https://doi.org/10.1029/2005JB004051, 2006. a, b
Rojay, B., Heimann, A., and Toprak, V.: Neotectonic and volcanic characteristics of the Karasu fault zone (Anatolia, Turkey): the transition zone between the Dead Sea transform and the East Anatolian fault zone, Geodin. Acta, 14, 197–212, 2001. a
Sandvol, E.: Continental Dynamics/Central Anatolian Tectonics: Surface to mantle dynamics during collision to escape, International Federation of Digital Seismograph Networks [data set], https://doi.org/10.7914/SN/YB_2013, 2013.
Şaroğlu, F., Emre, O., and Kuşçu, O.: Active fault map of Turkey. General Directorate of Mineral Researc h and Exploration, Ankara, Turkey Scholz, CH 1968. The frequency-magnitude relation of microfracturin g in rock and its relation to earthquakes, B. Seismol. Soc. Am., 58, 399–415, 1992. a, b
Sato, H., Fehler, M. C., and Maeda, T.: Seismic wave propagation and scattering in the heterogeneous earth, 2nd edn., Berlin, Springer, vol. 496, 494 pp., https://doi.org/10.1007/978-3-642-23029-5, 2012. a
Schildgen, T. F., Cosentino, D., Bookhagen, B., Niedermann, S., Yıldırım, C., Echtler, H., Wittmann, H., and Strecker, M. R.: Multi-phased uplift of the southern margin of the Central Anatolian plateau, Turkey: A record of tectonic and upper mantle processes, Earth Planet. Sc. Lett., 317, 85–95, 2012. a
Schildgen, T. F., Yıldırım, C., Cosentino, D., and Strecker, M. R.: Linking slab break-off, Hellenic trench retreat, and uplift of the Central and Eastern Anatolian plateaus, Earth-Sci. Rev., 128, 147–168, 2014. a
Schleiffarth, W. K., Reid, M. R., and Cosca, M. A.: Ages, distribution, and evolution of Miocene basalts, East-Central Anatolia, in: AGU Fall Meeting Abstracts, vol. 2015, 2015AGUFM.T22B..08S, 2015. a
Şengör, A. C. and Yilmaz, Y.: Tethyan evolution of Turkey: a plate tectonic approach, Tectonophysics, 75, 181–241, 1981. a, b, c
Sens-Schönfelder, C. and Wegler, U.: Passive image interferemetry and seasonal variations of seismic velocities at Merapi Volcano, Indonesia, Geophys. Res. Lett., 33, 139–143, https://doi.org/10.1029/2006GL027797, 2006a. a, b
Sens-Schönfelder, C. and Wegler, U.: Radiative transfer theory for estimation of the seismic moment, Geophys. J. Int., 167, 1363–1372, https://doi.org/10.1111/j.1365-246X.2006.03139.x, 2006b. a, b
Tank, S. B. and Karaş, M.: Unraveling the electrical conductivity structure to decipher the hydrothermal system beneath the Mt. Hasan composite volcano and its vicinity, SW Cappadocia, Turkey, J. Volcanol. Geoth. Res., 405, 107048, https://doi.org/10.1016/j.jvolgeores.2020.107048, 2020. a
Taymaz, T., Jackson, J., and Westaway, R.: Earthquake mechanisms in the Hellenic Trench near Crete, Geophys. J. Int., 102, 695–731, 1990. a
Taymaz, T., Eyidogãn, H., and Jackson, J.: Source parameters of large earthquakes in the East Anatolian Fault Zone (Turkey), Geophys. J. Int., 106, 537–550, 1991a. a, b
Taymaz, T., Jackson, J., and McKenzie, D.: Active tectonics of the north and central Aegean Sea, Geophys. J. Int., 106, 433–490, 1991b. a
Taymaz, T., Jackson, J., and McKenzie, D.: Active tectonics of the north and central Aegean Sea, Geophys. J. Int., 106, 433–490, 1991c. a
Taymaz, T., Ganas, A., Yolsal-Çevikbilen, S., Vera, F., Eken, T., Erman, C., Keleş, D., Kapetanidis, V., Valkaniotis, S., Karasante, I., Tsironi, V., Gaebler, P., Melgar, D., and Öcalan T.: Source mechanism and rupture process of the 24 January 2020 Mw 6.7 Doğanyol–sivrice earthquake obtained from seismological waveform analysis and space geodetic observations on the East Anatolian Fault Zone (Turkey), Tectonophysics, 804, 228745, https://doi.org/10.1016/j.tecto.2021.228745, 2021. a
Toprak, V.: Vent distribution and its relation to regional tectonics, Cappadocian Volcanics, Turkey, J. Volcanol. Geoth. Res., 85, 55–67, 1998. a
Toprak, V. and Göncöoḡlu, M.: Tectonic control on the development of the neogene-quaternary central anatolian volcanic province, Turkey, Geol. J., 28, 357–369, 1993. a
Tüysüz, O.: Geology of the Cretaceous sedimentary basins of the Western Pontides, Geol. J., 34, 75–93, 1999. a
Vanacore, E., Taymaz, T., and Saygin, E.: Moho structure of the Anatolian Plate from receiver function analysis, Geophys. J. Int., 193, 329–337, 2013. a, b
Wang, H., Huang, Z., Eken, T., Keleş, D., Kaya-Eken, T., Confal, J. M., Erman, C., Yolsal-Çevikbilen, S., Zhao, D., and Taymaz, T.: Isotropic and anisotropic P wave velocity structures of the crust and uppermost mantle beneath Turkey, J. Geophys. Res.-Sol. Ea., 125, e2020JB019566, https://doi.org/10.1029/2020JB019566, 2020. a, b, c
Whitney, D. L. and Hamilton, M. A.: Timing of high-grade metamorphism in central Turkey and the assembly of Anatolia, J. Geol. Soc., 161, 823–828, 2004. a, b
Zhu, H.: High ratio in the crust and uppermost mantle beneath volcanoes in the Central and Eastern Anatolia, Geophys. J. Int., 214, 2151–2163, 2018. a
In this manuscript, we investigate the complexity of the upper-crustal block of the Central Anatolia region, Türkiye. We present the results of seismic attenuation by examining 1509 local earthquakes recorded at 72 broadband stations and deployed within the framework of a passive seismic experiment. We emphasize the detailed 2D maps of intrinsic and scattering attenuation within the area where two devastating earthquakes (M1 7.8 and M1 7.5 Kahramanmaraş Earthquake Sequence) happened in 2023.
In this manuscript, we investigate the complexity of the upper-crustal block of the Central...