the Creative Commons Attribution 4.0 License.
the Creative Commons Attribution 4.0 License.
 | 19 Feb 2025
On the crustal composition of the Sardinia–Corsica continental block inferred from receiver functions
Fabio Cammarano
Henrique Berger Roisenberg
Alessio Conclave
Islam Fadel
Mark van der Meijde
Subduction-related geodynamic processes significantly influence plate tectonics and Earth's evolution, yet their impact on the continental crust remains poorly understood. We investigated the Sardinia–Corsica continental block, situated in the Mediterranean Sea, which has experienced intense subduction-driven geodynamic events. By analyzing P-wave receiver functions from our LiSard (Lithosphere of Sardinia) seismic network and publicly available stations, we aimed to understand crustal structure and composition. We inferred the Moho depth and examined the P-wave to S-wave velocity ratio (). We interpret our findings considering petrological data, heat flux measurements, and other geophysical information. We found that the Variscan granitoid batholith has the greatest Moho depths in both Sardinia and Corsica. ratios (ranging from 1.65 to 1.70) are consistent with average crustal values of SiO2 between 65 % and 70 %. However, in central Corsica, two stations have exceptionally high values (> 1.80), suggesting the possible presence of serpentinite throughout the crust. In Alpine Corsica, a station exhibited similar high values but a shallower Moho depth of 21 km. The western part of Sardinia, where Cenozoic volcanism occurred, also showed a shallower Moho depth (20–25 km) and high values. The highest value (1.91) is recorded in an area where surface-wave dispersion curves from ambient noise identified the lowest average S-wave velocity and where the highest heat flux has been reported. This suggests elevated crustal temperatures, although these values may also reflect the influence of thick Plio-Quaternary sedimentary deposits. Overall, our results indicate that recent geodynamic processes have left the granitoid batholith almost intact, with minimal alteration to its composition.
- Article
(15415 KB) - Full-text XML
-
Supplement
(31232 KB) - BibTeX
- EndNote


The Sardinia–Corsica continental block serves as a natural laboratory for understanding the shaping of the continental crust by geodynamic processes occurring at plate boundaries. The primary constituent of the Sardinia–Corsica “micro-continent” is a granitoid batholith that formed as a consequence of the Variscan (or Hercynian) orogenesis. This batholith spans approximately 15 000 km2, encompassing nearly all of Corsica and a significant portion of eastern Sardinia (Fig. 1). There is a petrological continuity between this batholith and those found in Provence (Elter et al., 2004). The northeastern region of Corsica, known as Alpine Corsica, represents a segment of the Alpine orogenic system. It comprises a series of tectonic units derived from both continental and oceanic sources, which have undergone varying degrees of metamorphism (Malavieille et al., 1998; Vitale Brovarone et al., 2013). Abundant high-pressure lawsonite-bearing rocks are found in this region, including lawsonite-bearing eclogite rocks that have been exhumed from a large depth of approximately 70 km, making them exceptionally rare on a global scale (Vitale Brovarone et al., 2013).
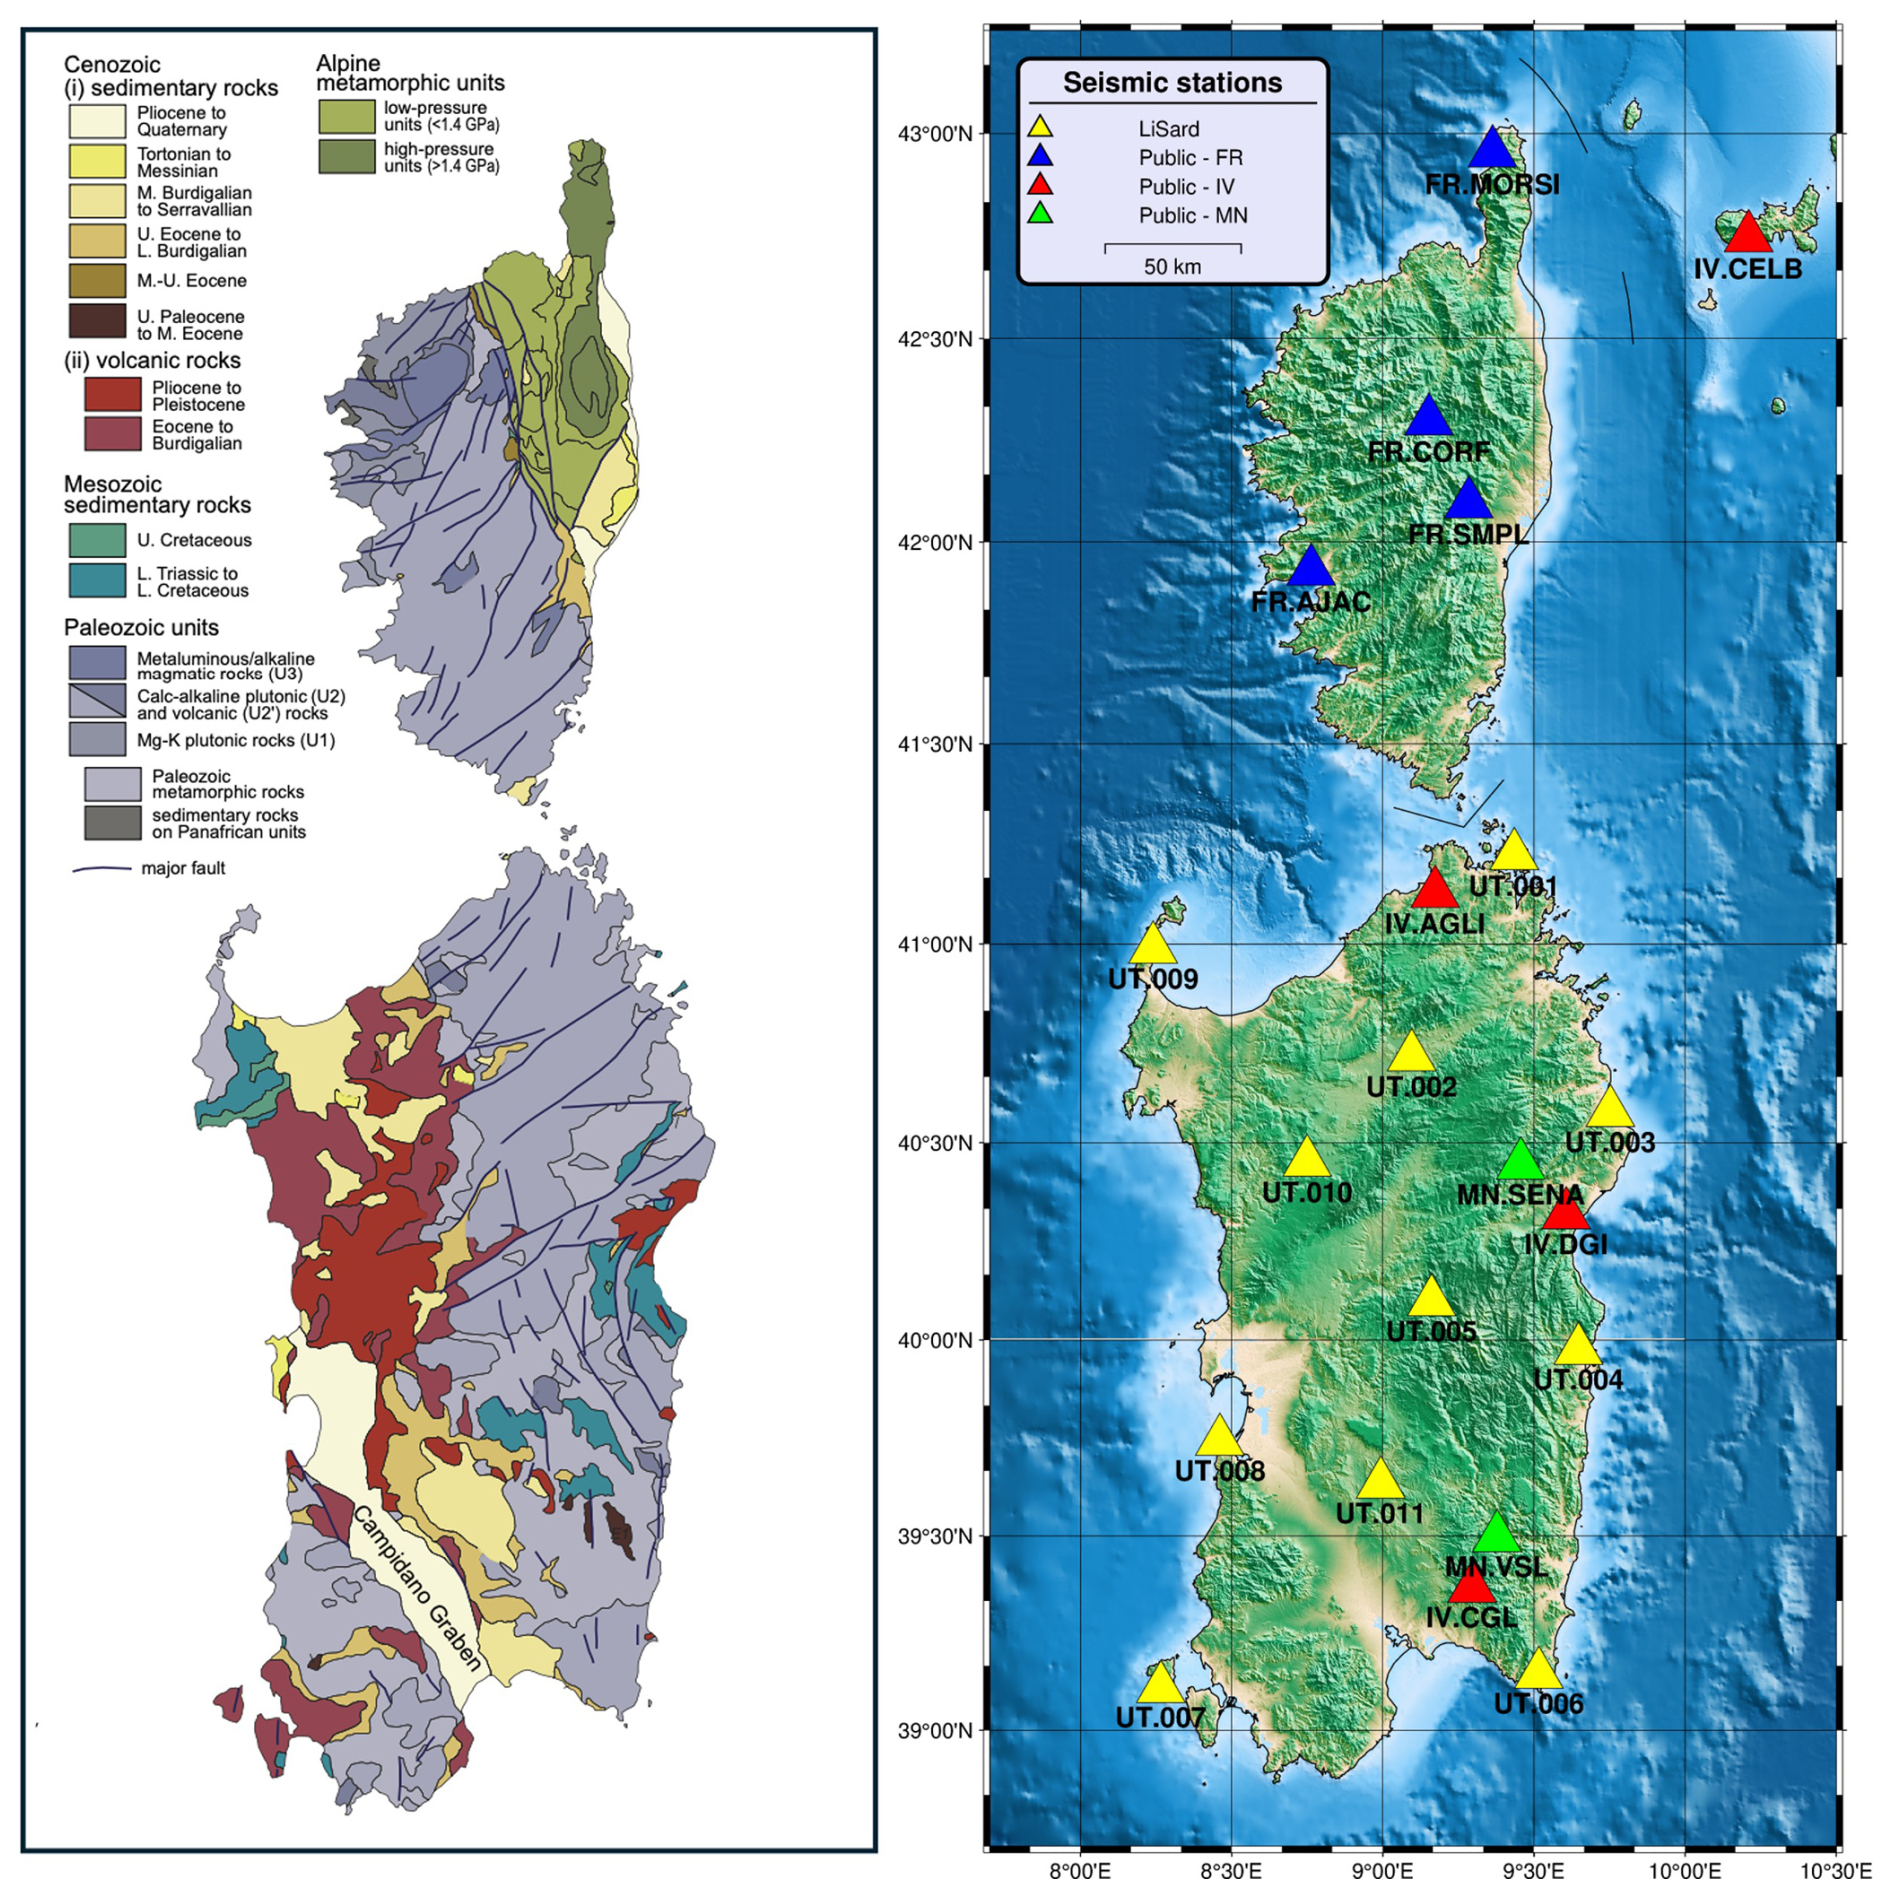
Figure 1Geological map (a), modified from Malusà et al. (2016), and a topography and bathymetry map with the locations of seismic stations used in this study (b).
Petrological and structural data indicate that the Hercynian basement of Corsica island experienced deformation during the dynamics of the Alpine orogeny. For instance, investigations utilizing low-temperature thermochronology and Raman spectroscopy of carbonaceous materials have provided insights into the maximum temperatures attained by Corsican rocks during Alpine tectonic events (Rossetti et al., 2023). These findings suggest that the Alpine orogenic wedge and/or foreland basins likely covered almost all of Corsican island.
Approximately 35 million years ago until around 10 million years ago, the Apennine–Tyrrhenian slab underwent asymmetric retreat, resulting in the opening of the Ligurian–Provencal back-arc basin (e.g., Faccenna et al., 2014). During this period, the Sardinia–Corsica block separated from mainland Europe and underwent rotation. Within this period, there was abundant volcanism related to subduction occurring in the western region of Sardinia. Additionally, there were occurrences of less abundant and geochemically distinct volcanism in more recent times (see Lustrino et al., 2013, for a thorough review of Cenozoic volcanism in Sardinia). The rapid opening of the Tyrrhenian Sea, probably initiated around 5 million years ago, can be attributed to the rapid retreat of the oceanic–lithospheric portion of the slab, likely caused by the completion of a slab tearing (Faccenna et al., 2014, and references therein). As a consequence of this process, the Sardinia–Corsica block remained behind as the Tyrrhenian Sea expanded.
Significant evidence of the relatively recent and intense geodynamic evolution can be observed in both the Cenozoic and more recent volcanic deposits, as well as in the pronounced topography that characterizes both Corsica and Sardinia. Furthermore, the heat flow in these islands is relatively high compared to other regions. A study by Della Vedova et al. (1995) indicates that Corsica has an average heat flow of around 75 mW m−2, which is higher than the typical values observed in other parts of the Hercynian basement. For instance, in Provence, heat flow values of approximately 60 mW m−2 are observed. In Sardinia, the heat flow values associated with the Variscan batholith are generally less pronounced and similar to those observed in Provence. However, in the western portion of Sardinia, notably in the Campidano graben, even higher heat flow values exceeding 100 mW m−2 have been recorded (Della Vedova et al., 1995). Additionally, both islands exhibit abundant thermal springs. Some of the hottest springs in Sardinia are located along the margin of the granitoid Variscan batholith and are likely linked to the lateral flow of water through the radiogenic-rich granite (Cuccuru et al., 2015).
Deep seismic refraction profiles have revealed a relatively uniform Moho depth in both Corsica and Sardinia, with slightly larger values in the central regions of the islands. The maximum crustal thickness recorded is approximately 33 km in Corsica and 34 km in Sardinia (Egger et al., 1988). However, as we move towards the coastal areas, the Moho depth shows a decreasing trend, with values ranging between 30 and 23 km. The average crustal P-wave velocities (VP) in these areas are around 6.4 km s−1 in Corsica and 6.3 km s−1 in Sardinia. These findings are supported by the gravimetric Bouguer anomaly map, as reported by Carrozzo et al. (1997), which is consistent with the observed crustal thicknesses.
A receiver function analysis was conducted for the first time by Megna and Morelli (1994), utilizing 20 teleseismic events recorded at the VSL station in southern Sardinia. The results of Megna and Morelli were subsequently reviewed and confirmed by van der Meijde et al. (2003). These investigations estimated a Moho depth of 29 ± 1 km at the VSL station in southern Sardinia. This station is also included in the present study.
In 2015, Afilhado et al. conducted an investigation of the Sardinia margin, encompassing both the sea and mainland, using wide-angle and reflection seismic data. They determined a crustal thickness of 27 km on land and identified two distinct layers, measuring 12 and 15 km in thickness, with corresponding P-wave velocities (VP) ranging from 5.9–6.4 and 6.5–6.7 km s−1, respectively. At the Moho discontinuity, a jump to velocities of 7.9–8.0 km s−1 was inferred.
In June 2016, the LiSard (Lithosphere of Sardinia) project was initiated with the goal of studying the crustal and lithospheric mantle structure of Sardinia. The project was motivated by the limited seismic coverage in Sardinia, as the region is relatively seismically inactive, resulting in a lack of robust constraints on the deep lithospheric structure. Additionally, the strategic location of an array in the center of the Mediterranean facilitated large-scale tomographic studies (Magrini et al., 2022; Agius et al., 2022). The LiSard project consists of a network of 10 seismic broadband stations uniformly distributed throughout the territory. The data acquisition, spanning over 2 years, has generated a significant amount of data, which have only been partially analyzed thus far. For example, the analysis of ambient noise cross-correlation between pairs of stations has allowed for the measurement of dispersion curves of surface waves (Rayleigh and Love waves), enabling the development of a tomography model of shear waves (VS) (Magrini et al., 2019). The VS (shear-wave velocity) model derived from the LiSard project reveals a distinct division in the upper crust, with lower VS values observed in the western portion and higher VS values in the eastern portion. Although the study only partially covers Corsica, the central region of Corsica also exhibits elevated VS values, similar to those found in the eastern part of Sardinia. This suggests a pattern of higher shear-wave velocities in the central and eastern parts of the study area, while the western regions display comparatively lower VS values.
In this study, we conducted an analysis of P-receiver functions using data from 11 locations of the LiSard project and 10 public stations from the INGV, RESIF, and MEDNET networks. Our main objective was to obtain a more accurate determination of the Moho depth and gain insights into the crustal composition by examining the retrieved ratios.
To interpret our results, we integrated them with previous seismic investigations and considered aspects such as crustal composition and temperature. In order to achieve this, we performed thermodynamic modeling and incorporated constraints from petrology and heat flow studies. By combining these different lines of evidence, we aimed to improve our understanding of the crustal structure, its composition, and the thermal conditions in the study area.
2.1 The P-wave receiver function
P-wave receiver function (RF) analysis is a widely used technique employed in the investigation of the subsurface structure of the Earth, with a specific focus on discerning boundaries between different geological layers (e.g., Langston, 1977; Vinnik, 1977; Ammon, 1991; Zandt and Ammon, 1995; Piana Agostinetti and Amato, 2009). This method involves the examination of the seismic response to teleseismic P-waves, which undergo conversions to S-waves at those boundaries, thereby yielding crucial information about the properties of seismic discontinuities beneath the receiver. For instance, when a teleseismic P-wave encounters the Moho, the interface between the Earth's crust and mantle, it generates a converted shear-vertical (SV) wave known as the Ps phase. By accurately measuring the time delay between the P-wave and the generated S-wave, it becomes possible to estimate the depth to the boundary and deduce relevant details concerning the velocity ratio between P-wave and S-wave velocity () within the crust. In addition to the Ps phase, other seismic phases, including PpPs, PsPs, and PpSs, arise due to multiple reflections. The incorporation of these phases in the receiver function analysis contributes to constraining the determination of velocities, in particular the VP to VS ratio, and the accurate assessment of depths pertaining to subsurface discontinuities.
The P-wave receiver function is obtained by assuming a plane-wave approximation and by deconvolving the vertical component from the radial and transverse components of the seismogram. This deconvolution effectively removes the common elements present in the waveforms, which include information about the seismic source and the travel path. Several deconvolution techniques, either in the time or frequency domain, have been proposed. In this study, we employ the classical time-domain iterative deconvolution. This method was originally introduced by Kikuchi and Kanamori (1982) for estimating the source time function of large earthquakes. Subsequently, Ligorria and Ammon (1999) applied this method to determine the receiver function for teleseismic earthquakes.
The iterative deconvolution approach consists of finding the best fit between the observed horizontal seismogram and a predicted signal. This is done by convolving an iteratively updated spike train with the vertical component seismogram. The process starts by cross-correlating the vertical and radial components to determine the lag of the first and largest spike in the receiver function. The optimal time corresponds to the peak with the highest amplitude in the cross-correlation signal. Next, the current estimate of the receiver function is convolved with the vertical component seismogram and subtracted from the radial component seismogram. This step is repeated to estimate the lags and amplitudes of additional spikes in the receiver function. With each iteration, the misfit between the convolved vertical seismogram and the radial seismogram is reduced as more spikes are incorporated into the receiver function. The iteration process continues until the reduction in misfit with each additional spike becomes insignificant, indicating that further refinement is no longer significant. The approach can also be applied to transverse motion.
In the case of high-quality data, the selection of alternative deconvolution methods has a minimal impact on the resulting receiver function. We conducted a test for a limited set of data and specifically applied the water-level deconvolution method (Clayton and Wiggins, 1976), which is another commonly used technique for extracting receiver functions. We observe only minor deviations in the obtained receiver functions.
Like any inverse process, each deconvolution method requires subjective decisions regarding regularization terms. In practice, a balance must be struck between the complexity of the model and the reduction of data variance. In the case of the time-domain iterative deconvolution, the key parameter is the Gaussian width factor. This factor controls the bandwidth of the signal, with larger values corresponding to wider bandwidths (Ligorria and Ammon, 1999). In general, a wider pulse provides lower time resolution but may be more stable in the presence of noise. On the other hand, a narrower pulse provides higher time resolution but may be more sensitive to noise. The choice of the width of the Gaussian pulse depends on the specific characteristics of the seismic data, including the signal-to-noise ratio and the desired level of detail in the resulting receiver function.
2.1.1 Thermodynamical modeling and reference lithologies
Physical properties, such as density and seismic velocities (VP and VS), are governed by temperature and composition. Thermodynamical modeling is a valuable tool for studying these properties and accounts for mineralogical phase transitions. While metastable rocks may exist in the Earth's crust, previous research (Guerri et al., 2015; Diaferia and Cammarano, 2017) demonstrated the applicability of this modeling approach for crustal properties. In this study, we follow the same procedure as Diaferia and Cammarano (2017), using the Perple_X software (Connolly, 2005) with a specialized database specifically designed for computing seismic velocities within the crust (for detailed information, refer to Diaferia and Cammarano, 2017). The primary advantage of using a single thermodynamic database of mineral species is the ability to compute consistent bulk-rock properties (seismic velocities and density) for various chemical compositions. However, it is important to note that this method does not account for metastability and has certain limitations, such as the exclusion of porosity, which can be significant in the uppermost portion of the upper crust. Additionally, the method only considers isotropic properties.
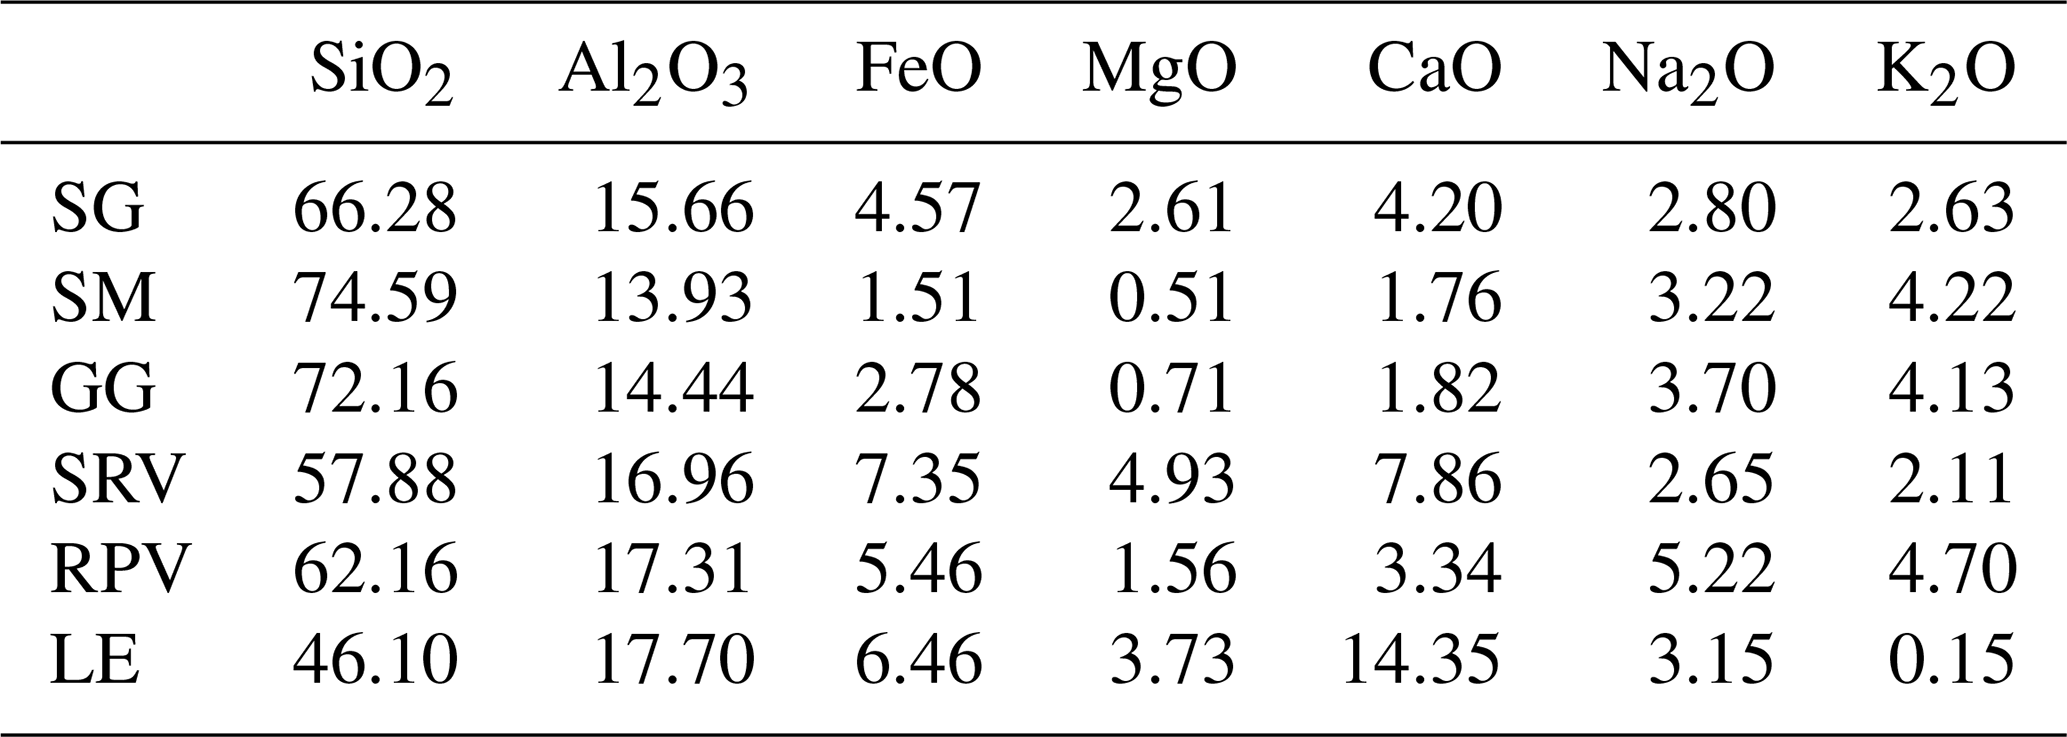
Thermodynamical modeling has been applied to model the properties of several compositions, which we deemed to be representative of the Sardinia–Corsica outcropping rocks (Table 1). We divided the block into three major provinces. The first province is characterized by the presence of a Variscan (300 million years old) granitoid batholith in the northeastern part of Sardinia and Corsica, as well as Variscan metamorphic rocks in the southeastern part of Sardinia (Fig. 1). The most abundant rocks in this province are granodiorites and monzogranites (Poli et al., 1989), which are rich in quartz and therefore have high SiO2 content in their chemical compositions. We also model a global granite composition (Blatt et al., 1996). In the western part of Sardinia, on the other hand, there are volcanic rocks that are related to the subduction of the African plate and were emplaced between 30 million years ago and 10 million years ago (Lustrino et al., 2013). These rocks have a more mafic composition. Additionally, there is more recent magmatism characterized by compositional variations, which Lustrino et al. (2013) divided into two groups of volcanism: RPV (radiogenic Pb volcanism) and UPV (unradiogenic Pb volcanism) (only RPV is shown in Table 1 as UPV is less abundant). Finally, the northeastern part of Corsica, known as Alpine Corsica, exhibits, as mentioned earlier, metamorphic rocks at various grades (blue and green schists) and basaltic and metabasaltic compositions with the presence of ophiolitic sequences and mantle serpentinites. A globally rare rock abundant in Alpine Corsica is an eclogite-containing lawsonite (Vitale Brovarone et al., 2011), shown in Table 1 and included in our tests.
Table 1Chemical compositions (wt %) representative of different petrological provinces in the study area: Variscan batholith (SG, SM, GG), Alpine Corsica (LE), and Cenozoic volcanism of western Sardinia (SRV, RPV). All chemical compositions have been re-normalized to our seven-oxide system and have 0.25 wt % of H2O. FeO is total. SG: Sardinia granodiorites (Poli et al., 1989), SM: Sardinia monzogranites (Poli et al., 1989), GG: Global granites (Blatt and Tracy, 1996), SRV: representative composition of subduction-related volcanism (Lustrino et al., 2013, and references therein). RPV: representative composition of radiogenic Pb volcanism (Lustrino et al., 2013, and references therein). LE: lawsonite-bearing eclogite (Vitale Brovarone et al., 2011), outcropping in Alpine Corsica.
Furthermore, we modeled the globally averaged chemical compositions of the upper, middle, and lower crust, as proposed by Rudnick and Gao (2014). This was done to illustrate the implications of transitioning from a silica-rich (sialic) upper crust to a more magnesium- and iron-rich (mafic) composition and to have a reference with respect to the Sardinia–Corsica compositions.
Thermodynamical modeling has been performed employing a seven-oxide system: SiO2–Al2O3–FeO–MgO–CaO–Na2O–K2O. Additionally, a small amount of H2O (0.25 wt %) was incorporated, which indirectly affects the ratio by reducing the solidus temperature and aiding in the formation of a more realistic mineral assemblage (Guerri et al., 2015). It is important to emphasize that our main objective was not to precisely replicate the exact mineral compositions found in nature. Rather, we aimed to estimate seismic velocities and compare relative variations among different compositions.
In relation to this, we also investigated the influence of silica content in the granitoid batholith on the ratio. To accomplish this, we employed the global reference upper-crust composition proposed by Rudnick and Gao (2014) and adjusted the SiO2 content to various levels (as presented in Table 2). Indeed, the most important effect on is due to the relative abundance of quartz. This is confirmed by previous studies conducted by Lowry and Pérez-Gussinyé (2011). Some authors (e.g., Ma and Lowry, 2017), however, prefer to link the major or minor presence of quartz to the hydration of crustal mineral assemblages. Our previous studies (Guerri et al., 2015; Diaferia and Cammarano, 2017) show that, although important, variation in water content has a minor impact on the overall composition of the crust.
Table 2Chemical compositions (wt %) obtained by varying the silica content from the global composition of Rudnick and Gao (2014) for the upper crust.
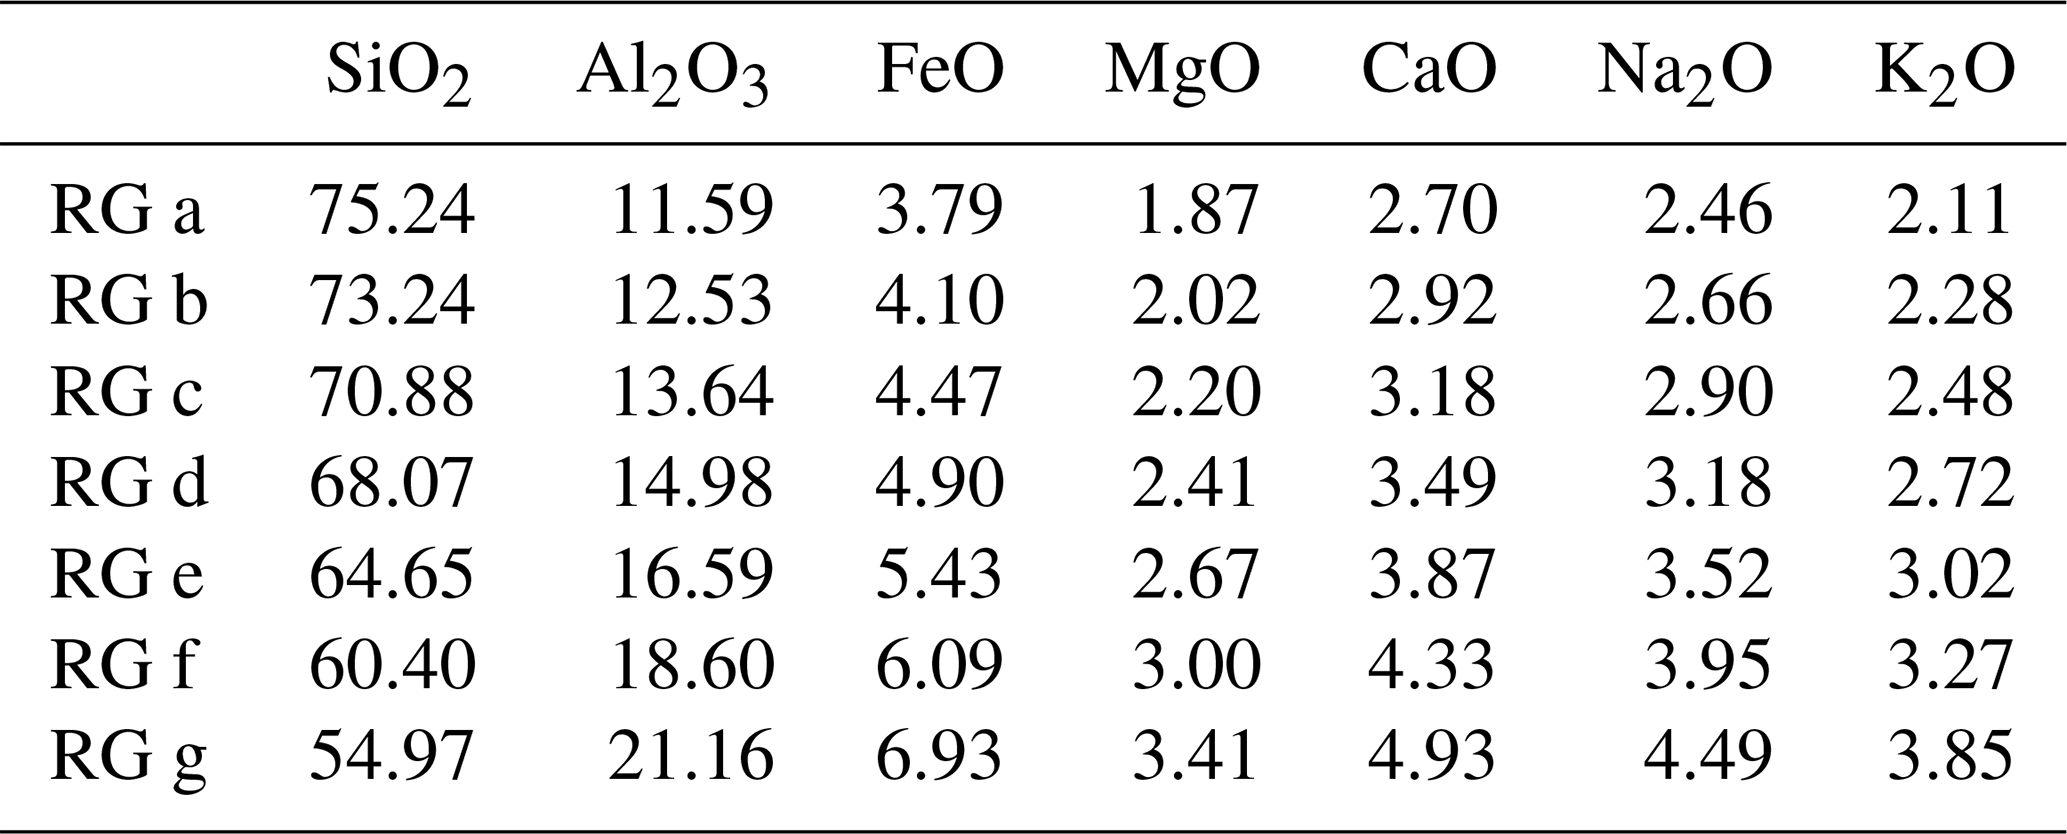
All chemical compositions have been re-normalized to our seven-oxide system and have 0.25 wt % of H2O. FeO is total. Composition goes from ∼ 55 wt % to 76 wt % of SiO2. Physical properties as a function of SiO2 and thermal gradients are shown in Fig. 11.
2.2 Datasets and processing
In our study, we utilized both the available broadband public seismic stations and our in-house LiSard seismic network to compute P-wave receiver functions. The locations of the seismic stations analyzed in this study are depicted in Fig. 1. The LiSard network, operational from 30 June 2016 to 15 September 2018, consisted of 10 broadband seismic stations equipped with Nanometrics Trillium posthole sensors.
One of the LiSard stations, UT.001, was initially located in La Maddalena, northern Sardinia, for a period of 14 months before being relocated to the Campidano graben as station UT.011. The remaining stations operated continuously for over 2 years, recording more than 200 earthquakes with magnitudes between 5.5 and 8.0 and epicentral distances ranging from 25 to 95°. The earthquake catalog used for our analysis is sourced from IRIS (Incorporated Research Institutions for Seismology).
For the 11 public stations examined in this study, we considered an earthquake catalog spanning 30 June 2016 to 1 January 2023. Some stations, such as FR.MORSI, were active throughout the entire time interval, enabling the recording of a significant number of teleseismic events.
We use Python open-source libraries for the analysis of the waveforms, including ObsPy (Beyreuther et al., 2010) and SeisPy (Xu and He, 2022).
In our data processing workflow, we extracted P-waveforms from the three-component seismograms, spanning 10 s before to 120 s after the theoretical P arrival time, which has been inferred using TauP (Crotwell et al., 1999) and the AK135 model (Kennett et al., 1995). Prior to analysis, we applied preprocessing steps, including the removal of the mean and trend from the waveforms and the application of a bandpass filter between 0.05 and 2 Hz.
We rotated the north (N) and east (E) components of the seismic waveforms to obtain the radial (R) and transverse (T) components, and we thus computed the P-wave RF. As mentioned earlier, we utilized the iterative deconvolution method. Following extensive testing, we decided to employ a Gaussian width factor of 1.5. This choice is conservative and aligns with our focus on determining the depth of the Moho, which is the primary seismic discontinuity typically imaged in the P-wave coda across most of our study locations.
The receiver functions from different teleseismic events at one single station can sometimes be different. These differences can be attributed to variations in the source characteristics, propagation paths, and station-specific effects that are not fully removed by the deconvolution process. Therefore, it is important to select the best-quality data. This is done through automatic quality control, which is therefore an important part of the process. There are two criteria to remove bad-quality receiver functions. The first one is based on the signal-to-noise ratio of the seismic waveform. We employ a value of 1 dB. The second one is based on a root mean square threshold between the original and recovered receiver functions, which we choose to be 0.25. Both parameters were selected based on tests with various stations. In our opinion, these values are able to retain a statistically significant amount of data with relatively good quality. In addition, however, a manual inspection of the RFs that passed the selection criteria has also been carried out. In particular, we remove the few waveforms that do not align with others on the first arrival. These steps help to ensure a consistent and reliable dataset for subsequent analysis.
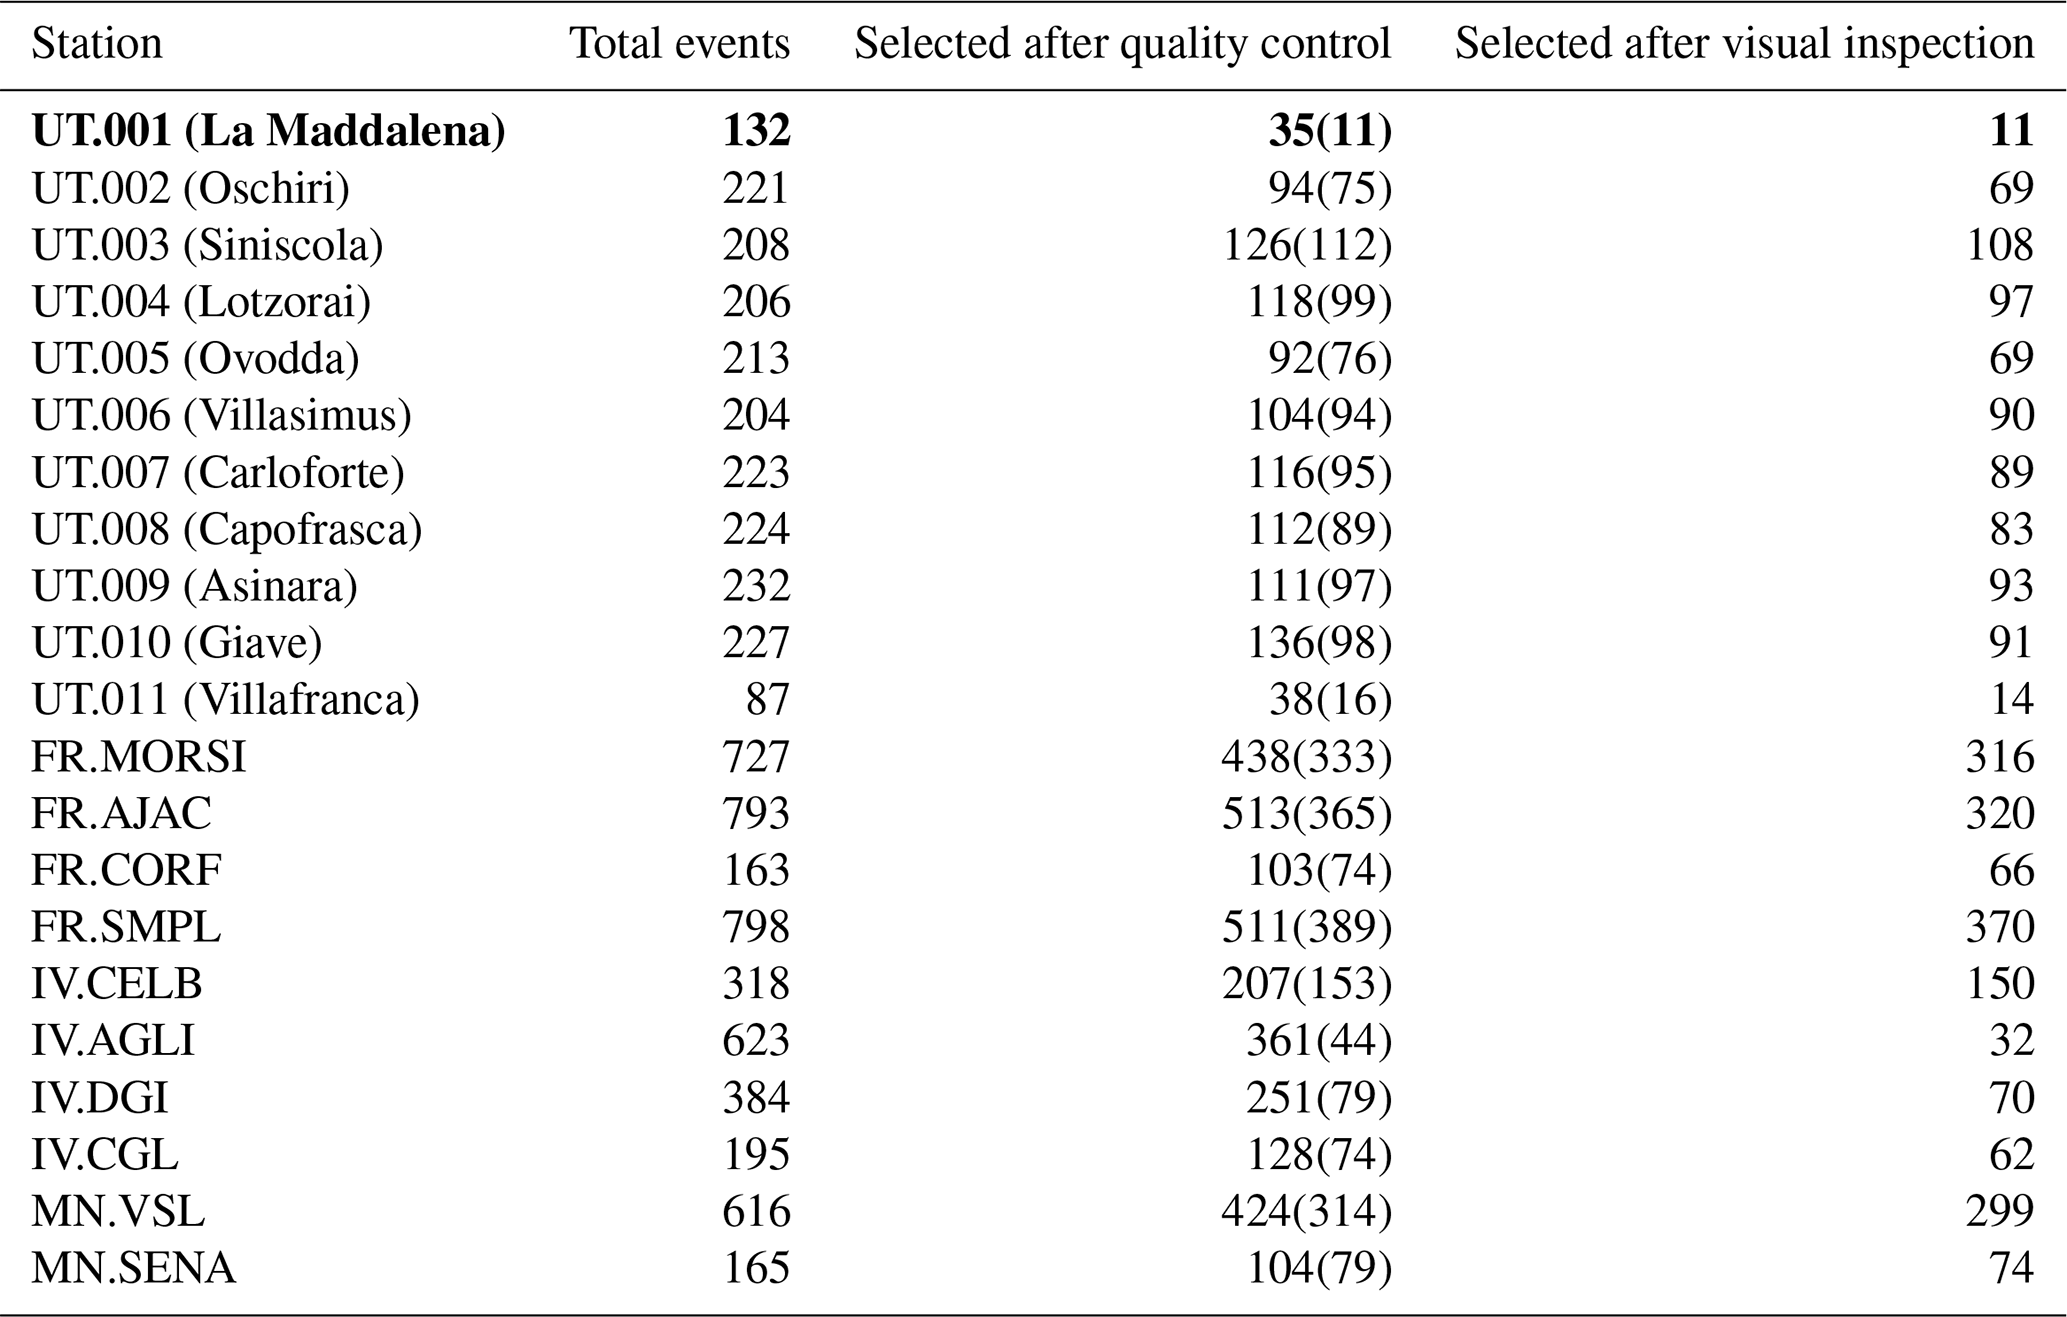
In Table 3 we report a list of the teleseismic P-wave RFs analyzed at each station and the number remaining after quality control procedures. It is noteworthy that the number of discarded RFs varies greatly among different locations. We have a number of events ranging from 200 to 230 for the nine LiSard locations which have been active for 2 years. With the exception of UT.002 and UT.005, the other seven stations have more than 90 RFs that meet the quality criteria. UT.011, which has been recording for approximately 9 months, captured 87 events, but only 14 of them were deemed suitable for further processing. This station is located in the Campidano graben, an area characterized by a thick and structurally complex sedimentary cover that can introduce reverberations and complicate the waveforms. UT.001, situated in northern Sardinia, exhibited significant noise, resulting in the selection of only a small fraction of the analyzed RFs after quality control. In addition, the few remaining RFs do not present a consistent pattern. As a result, it was decided to exclude this station from further processing. Comparatively, some public stations have been operational for a longer duration, resulting in a higher number of recorded teleseismic events, as indicated in Table 3. The number of eventually selected RFs is also variable in this case. Notably, IV.AGLI station has only 32 selected RFs available for further analysis.
Table 3Number of total events analyzed for each location and the final number of receiver functions which passed our selection criteria and visual inspection (see main text). In total, 6959 P-wave receiver functions have been considered. 2573 passed our selection criteria for further processing. In bold is the UT.001 station, which has been discarded from further processing.
2.3 H–k stacking analysis
The H–k stacking method, introduced by Zhu and Kanamori (2000), is a simple but effective method to determine the crustal thickness and the ratio beneath each station. The general idea is to exploit not only the main Ps for the stacking but also the major multiples, i.e., PpPs and PpSs + PsP. The time delay of the solely Ps phase from the P arrival can be used to estimate the thickness of the crust but trades off strongly with the ratio: we estimated that a variation of 0.1 in the latter causes about a 4 km change in the crustal thickness. A slight sensitivity to VP also occurs: i.e., a 0.1 km s−1 variation gives a 0.5 km change in the crustal thickness. To mitigate this ambiguity, it is possible to consider the PpPs and PpSs + PsP phases. According to the different move out of the phases, the three phases will coherently stack only when the correct crustal thickness (named H) and (named k) ratios are used.
Using several RFs for the same H–k stack increases the signal-to-noise ratio. However, it is noteworthy to remember that, owing to the presence of 3-D structural complexity within the crust and/or at the Moho depth, the multiples can be partly masked. The weighting scheme of each of the three seismic phases therefore has to be carefully checked for each station. For the sake of simplicity, we adopt, in this stage, the same weighting scheme for each station, which is 0.6 for the Ps phase and 0.3 and 0.1 for PpPs and PsPs + PpSs, respectively. Later, we will discuss specific cases for which we had to modify the weightings.
The search has been carried out by using values of Moho depth between 20 and 50 km and of between 1.55 and 1.90. We assume a value of VP equal to 6.4 km s−1. Note that the error bars resulting from the H–k stacking are based on the 95 % confidence interval (2σ). These are only strictly valid if the simplifying assumptions of homogenous, isotropic, and horizontal layers are valid. Therefore, they represent an optimistic value.
In order to ensure high-quality results, the stacked P-wave receiver function requires a sufficient number of reliable receiver functions with good azimuthal coverage. In an ideal scenario, where the subsurface consists of a simple layered structure without dipping interfaces, anisotropy, or other three-dimensional structural heterogeneity, all the energy related to the converted P-to-S waves would be SV (S-wave polarized in the vertical plane) and then observed on the radial component. However, real-world situations are more complex and deviate from this ideal case. Hence, it is crucial to compute the transverse receiver functions alongside the radial ones. The transverse receiver functions provide additional information that aids in the interpretation of observations.
Figure 2 (top panel) illustrates the radial and transverse receiver functions obtained from UT.003, one of the nine LiSard stations that recorded seismic events over a 2-year period. The events are arranged based on their back-azimuth. Similarly to the other LiSard stations, UT.003 exhibits a consistent pattern among the various events. The only exception is UT.011 (Fig. 2d–f), which has a limited number of records satisfying the quality criteria adopted, and even those show some inconsistency. For instance, reverberations are not always at the same distance and amplitudes on the transverse RF are high.
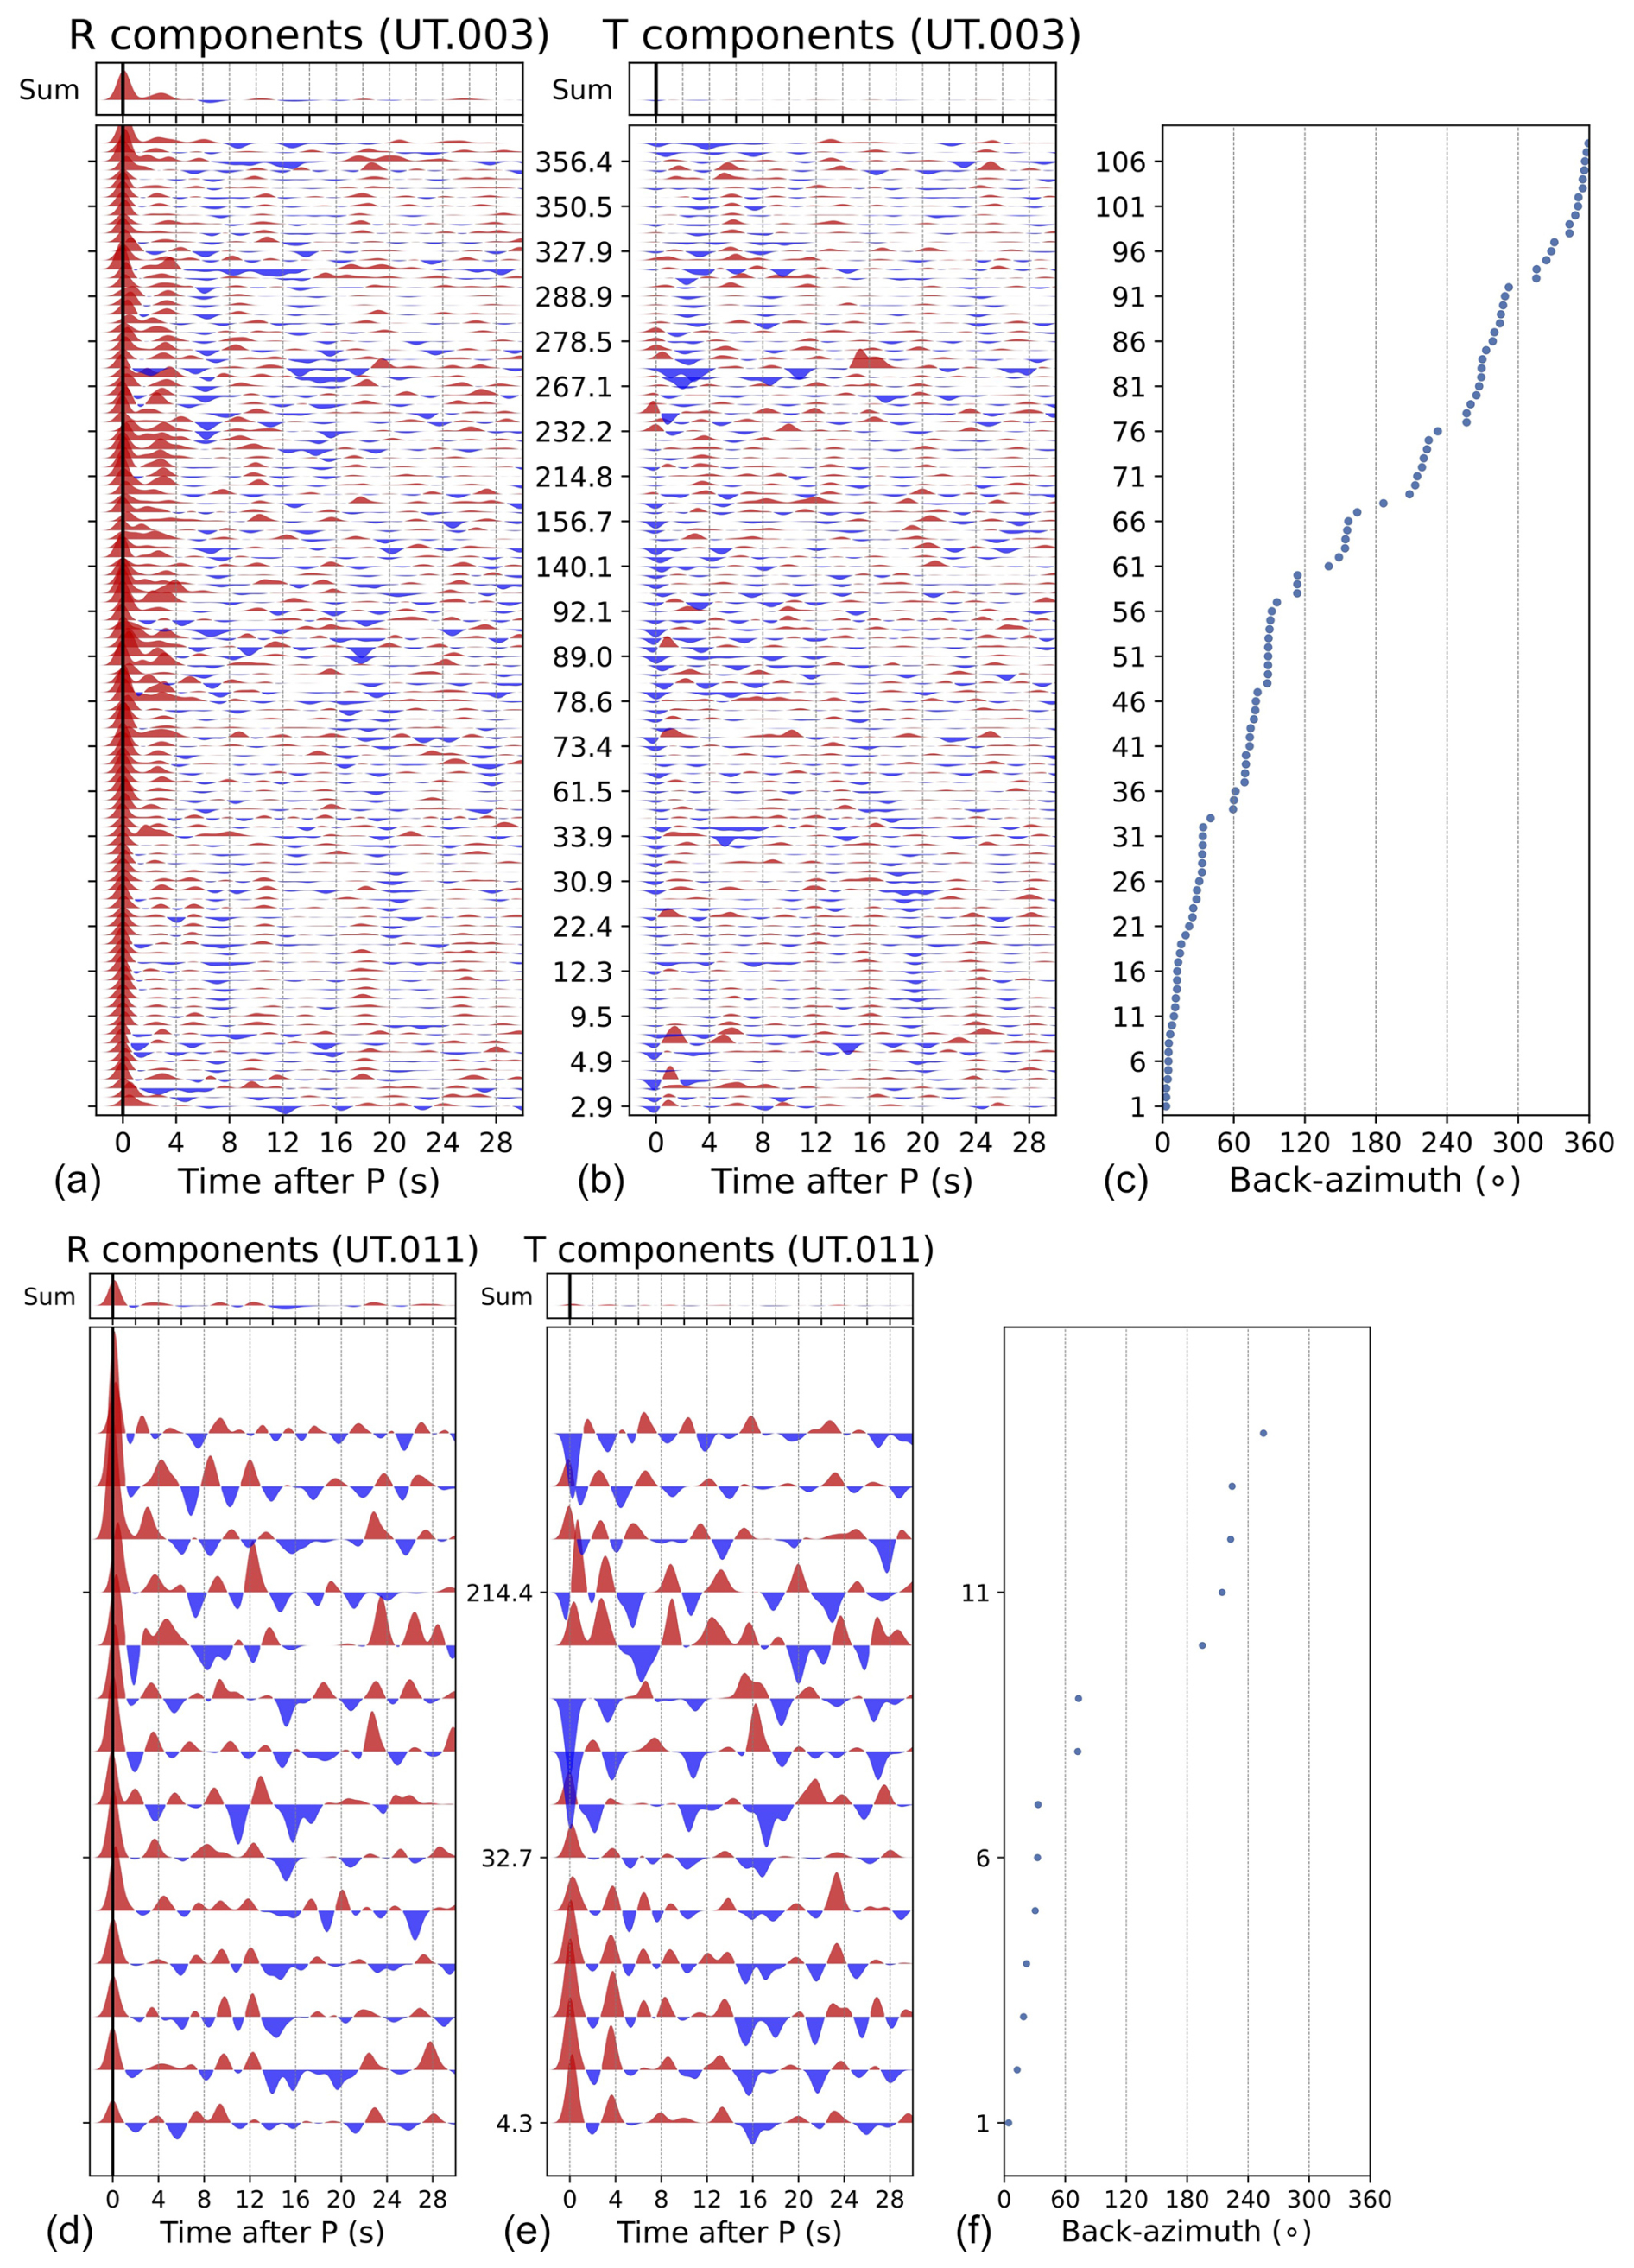
Figure 2Radial and transverse P-wave receiver functions for two LiSard stations sorted as a function of back-azimuth. Panels (c) and (f) show the back-azimuth distribution of the recorded events. Panels (a), (b), and (c) show UT.003, whose sampling is similar to the other LiSard stations. Panels (d), (e), and (f) show the poorly sampled UT.011.
For the public stations, we present the receiver functions from the extensively studied MN.VSL station in Fig. 3a–c. The receiver functions from this station demonstrate good azimuthal coverage, indicating a comprehensive dataset for analysis. Additionally, we include the IV.AGLI station (Fig. 3d–f), for which only a limited number of the total receiver functions meet the quality criteria (see Table 3). Also in this case, the selected RFs exhibit significant noise in the waveforms, compromising their reliability.
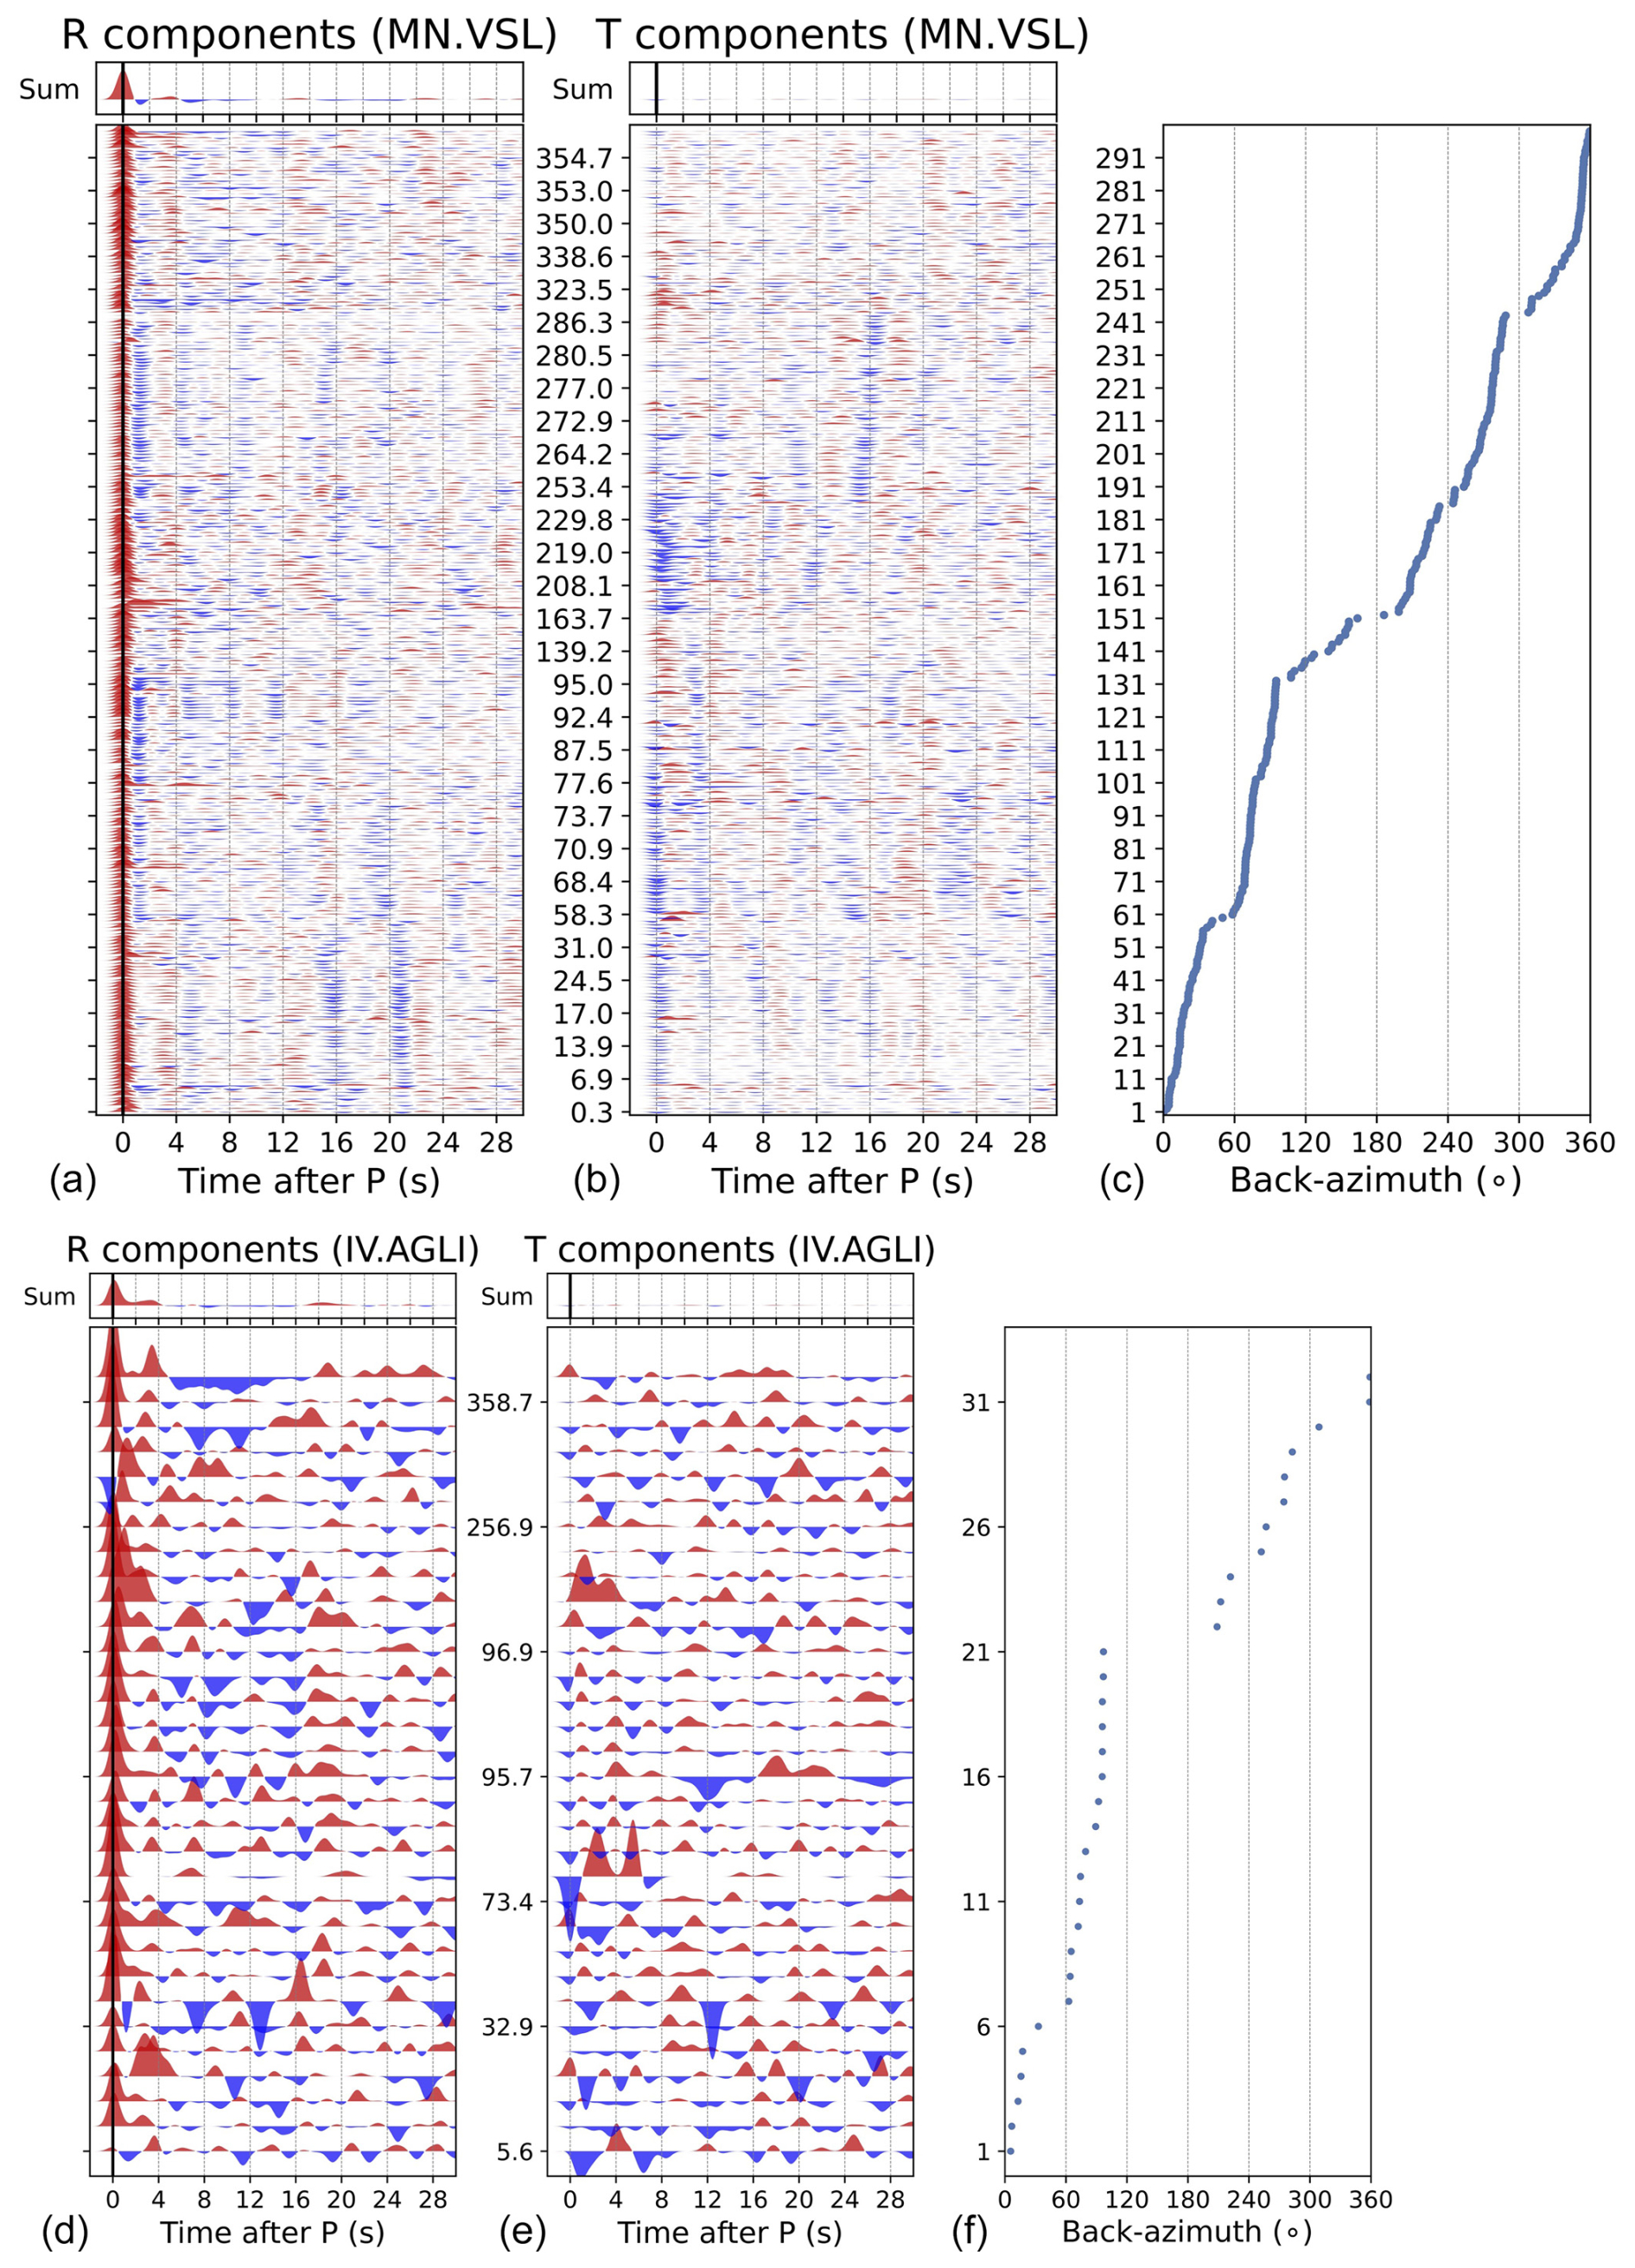
Figure 3Radial and transverse P-wave receiver functions for two public stations sorted as a function of back-azimuth. Panels (c) and (f) show the back-azimuth distribution of the recorded events. Panels (a), (b), and (c) show MN.VSL, probably the most extensively studied station. Panels (d), (e), and (f) show IV.AGLI, which shows fewer and more intricate receiver functions.
The computed radial and transverse receiver functions for all the other analyzed stations are shown in the Supplement (Figs. S1 to S17). In addition, readers can find in the Supplement the links to the original three-component waveform data selected for each event and the full procedure for reproducing all our results. This allows readers to access and examine the complete set of receiver functions obtained from the study and ensures reproducibility of our results.
The obtained H–k estimates for all the LiSard stations, accompanied by the 95 % confidence interval, are presented (Figs. 4 and 5). The output of the Zhu and Kanamori (2000) technique is displayed in the bottom-right panels of each figure. The stack values for each individual phase are presented in the remaining panels. Maximum stack values are attained when all three phases arrive coherently. Normalized values ranging from 0 to 1 are employed in each panel.
The arrival times are well-defined for the various expected phases, particularly for the Ps phase, at most of the LiSard stations, indicating that these receivers can be considered “high quality”. The high quality of our data is reflected in coherent images of the individual seismic phases (Ps, PpPs, and PpSs + PsPs) and well-constrained Moho depths and ratios. Only a few stations show some peculiar features that pose challenges for a clear interpretation.
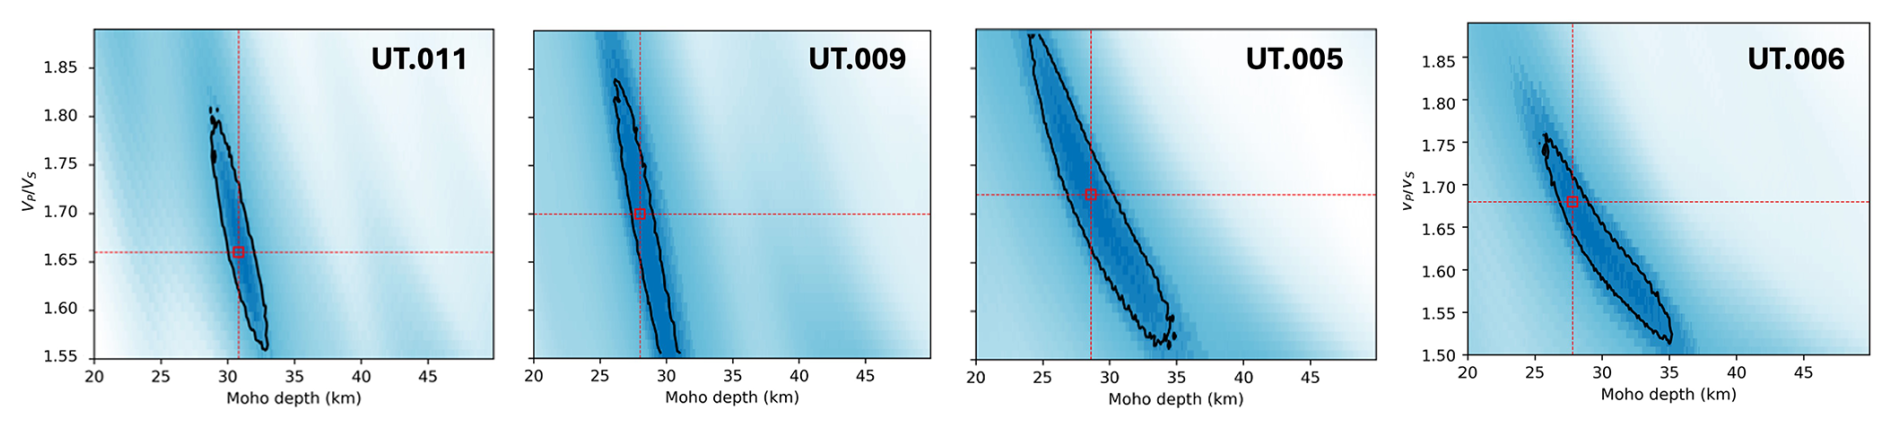
Figure 4Results of the H–k stacking process for 011, 009, 005, and 006 LiSard stations, all showing intricate features (see main text for details). Stack values in each panel are normalized from 0 to 1. Individual panels for the Ps phase, the PpPs phase, and the PsPs + PpSs phase are shown in the Supplement.
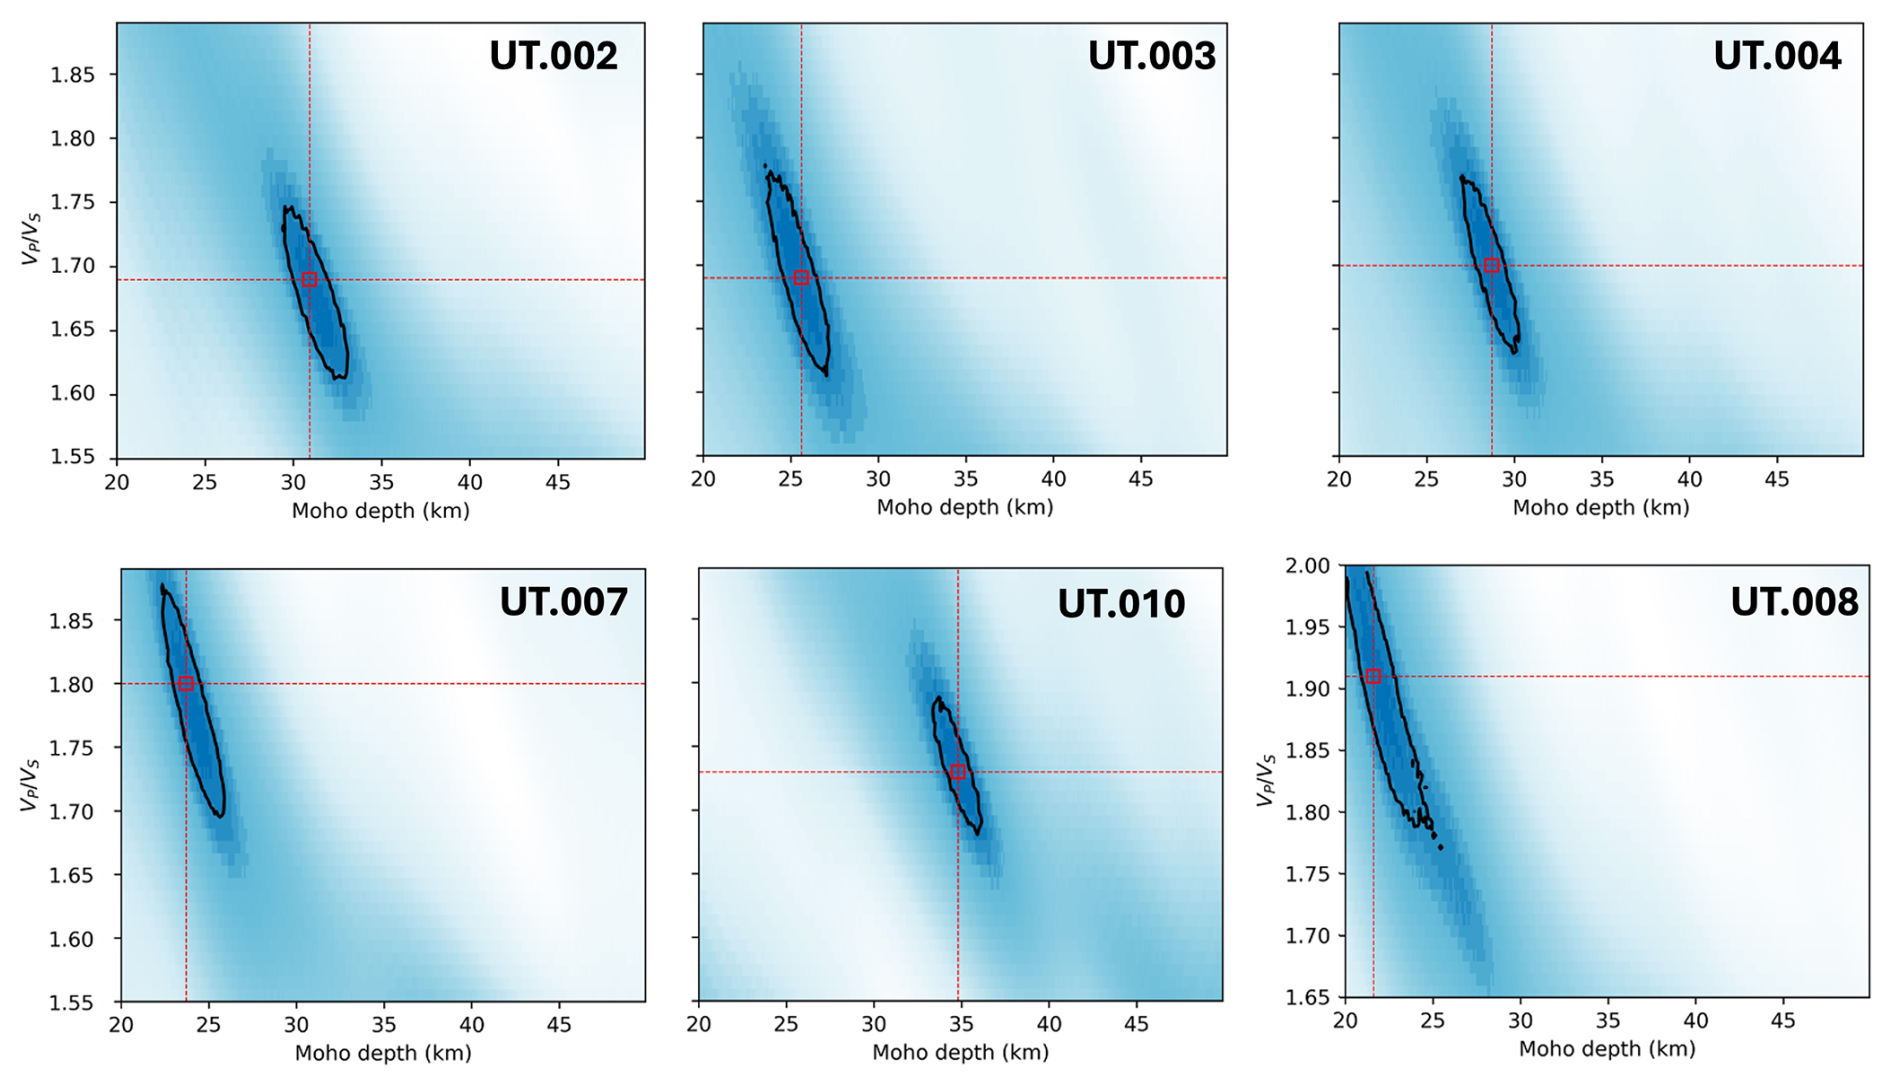
Figure 5Results of the H–k stacking process for six high-quality LiSard stations. Stack values in each panel are normalized from 0 to 1. See the Supplement for individual panels showing the main Ps phase and multiples.
We show in Fig. 4 the H–k stack of four LiSard stations characterized by the most intricate features, i.e., UT.011, UT.009, UT.005, and UT.006.
For stations UT.001 and UT.011, a low number of receiver functions were obtained (11 and 14, respectively, as shown in Table 3). In the case of UT.001, this limited number of receiver functions did not allow for a reliable estimation of H–k parameters due to the short recording interval and incoherent waveform traces. However, for the UT.011 (Villafranca) station (shown in the top-left panel of Fig. 4), a Moho depth of 30.8 ± 2.13 km and a ratio of 1.66 ± 0.12 were estimated.
Station UT.009, situated at Asinara island in northwestern Sardinia (as shown in Fig. 1), lacks a prominent Ps arrival (Fig. 4, top-right panel). Upon examining the RFs, we observe a negative polarity signal in most of the RFs that may be related to the presence of a low-velocity layer.
Similarly, stations UT.005 and UT.006 (bottom panels of Fig. 4) are characterized by complexities that cannot be attributed to a single discontinuity. The Ps is largely visible, but the multiple phases are partially masked by other signals. To account for these complexities, we apply a different weighting scheme (0.8, 0.1, and 0.1 for Ps, PpPs, and PpSs + PsP, respectively) for these two stations. This weighting scheme ensures a more accurate mean, albeit with higher uncertainties due to the increased trade-off between H and k. The same applies to UT.006, although the variation resulting from the new weighting scheme is negligible.
For the remaining six stations, shown in Fig. 5, the high quality of our data is reflected in coherent images of the individual seismic phases (Ps, PpPs, and PpSs + PsPs) and well-constrained Moho depths and ratios.
Station UT.008 (bottom-left panel in Fig. 5) exhibits the shallowest Moho depth and high features, which align with the station's location predominantly sampling the oceanic environment. This region has been previously identified as having the lowest VS within the crust, as indicated by a previous study by Magrini et al. (2019) based on surface waves from ambient noise. It is worth noting that for station UT.008, we had to expand our H–k search to accurately compute the confidence interval, requiring a k value of 2.0. Conversely, for station UT.009, the search had to be extended to k=1.5.
The shallow Moho depth at station UT.007 (at Carloforte) and a relatively higher ratio were also expected.
The receiver functions from both the French (FR) and Italian (IV) public networks exhibit excellent quality as well. FR.AJAC (Fig. 6, top left) displays blurred multiples, which could be attributed to crustal heterogeneities. The estimated crustal thickness (H) for this station is 25.4 ± 1.10 km, with a corresponding ratio (k) of 1.82 ± 0.05. The FR.MORSI station (Fig. 6, top right) exhibits a much simpler structure, characterized by a shallow crust with a thickness of 21.4 ± 0.81 km and a higher ratio of 1.85 ± 0.06. These results align with expectations, considering the station's location in the northernmost part of Alpine Corsica (see also the geological map in Fig. 1). Noteworthy findings were obtained for the FR.CORF (Corte) and FR.SMPL (Barrage de Sampolo) stations (bottom panels of Fig. 6), revealing a relatively deeper Moho. The estimated crustal thickness is 32.5 ± 1.69 km for CORF and 33.9 ± 0.07 km for SMPL. These findings are consistent with previous studies employing alternative methodologies, lending support to the robustness of the results. Remarkably, an unexpectedly high ratio was observed for these two stations. Specifically, the ratio was determined to be 1.81 ± 0.076 for CORF and 1.88 ± 0.001 for SMPL (Fig. 6, bottom panels). Additionally, it is worth noting that the CORF station exhibits an indistinct Ps phase, implying the presence of intricate wave propagation characteristics specific to the central Corsica region.
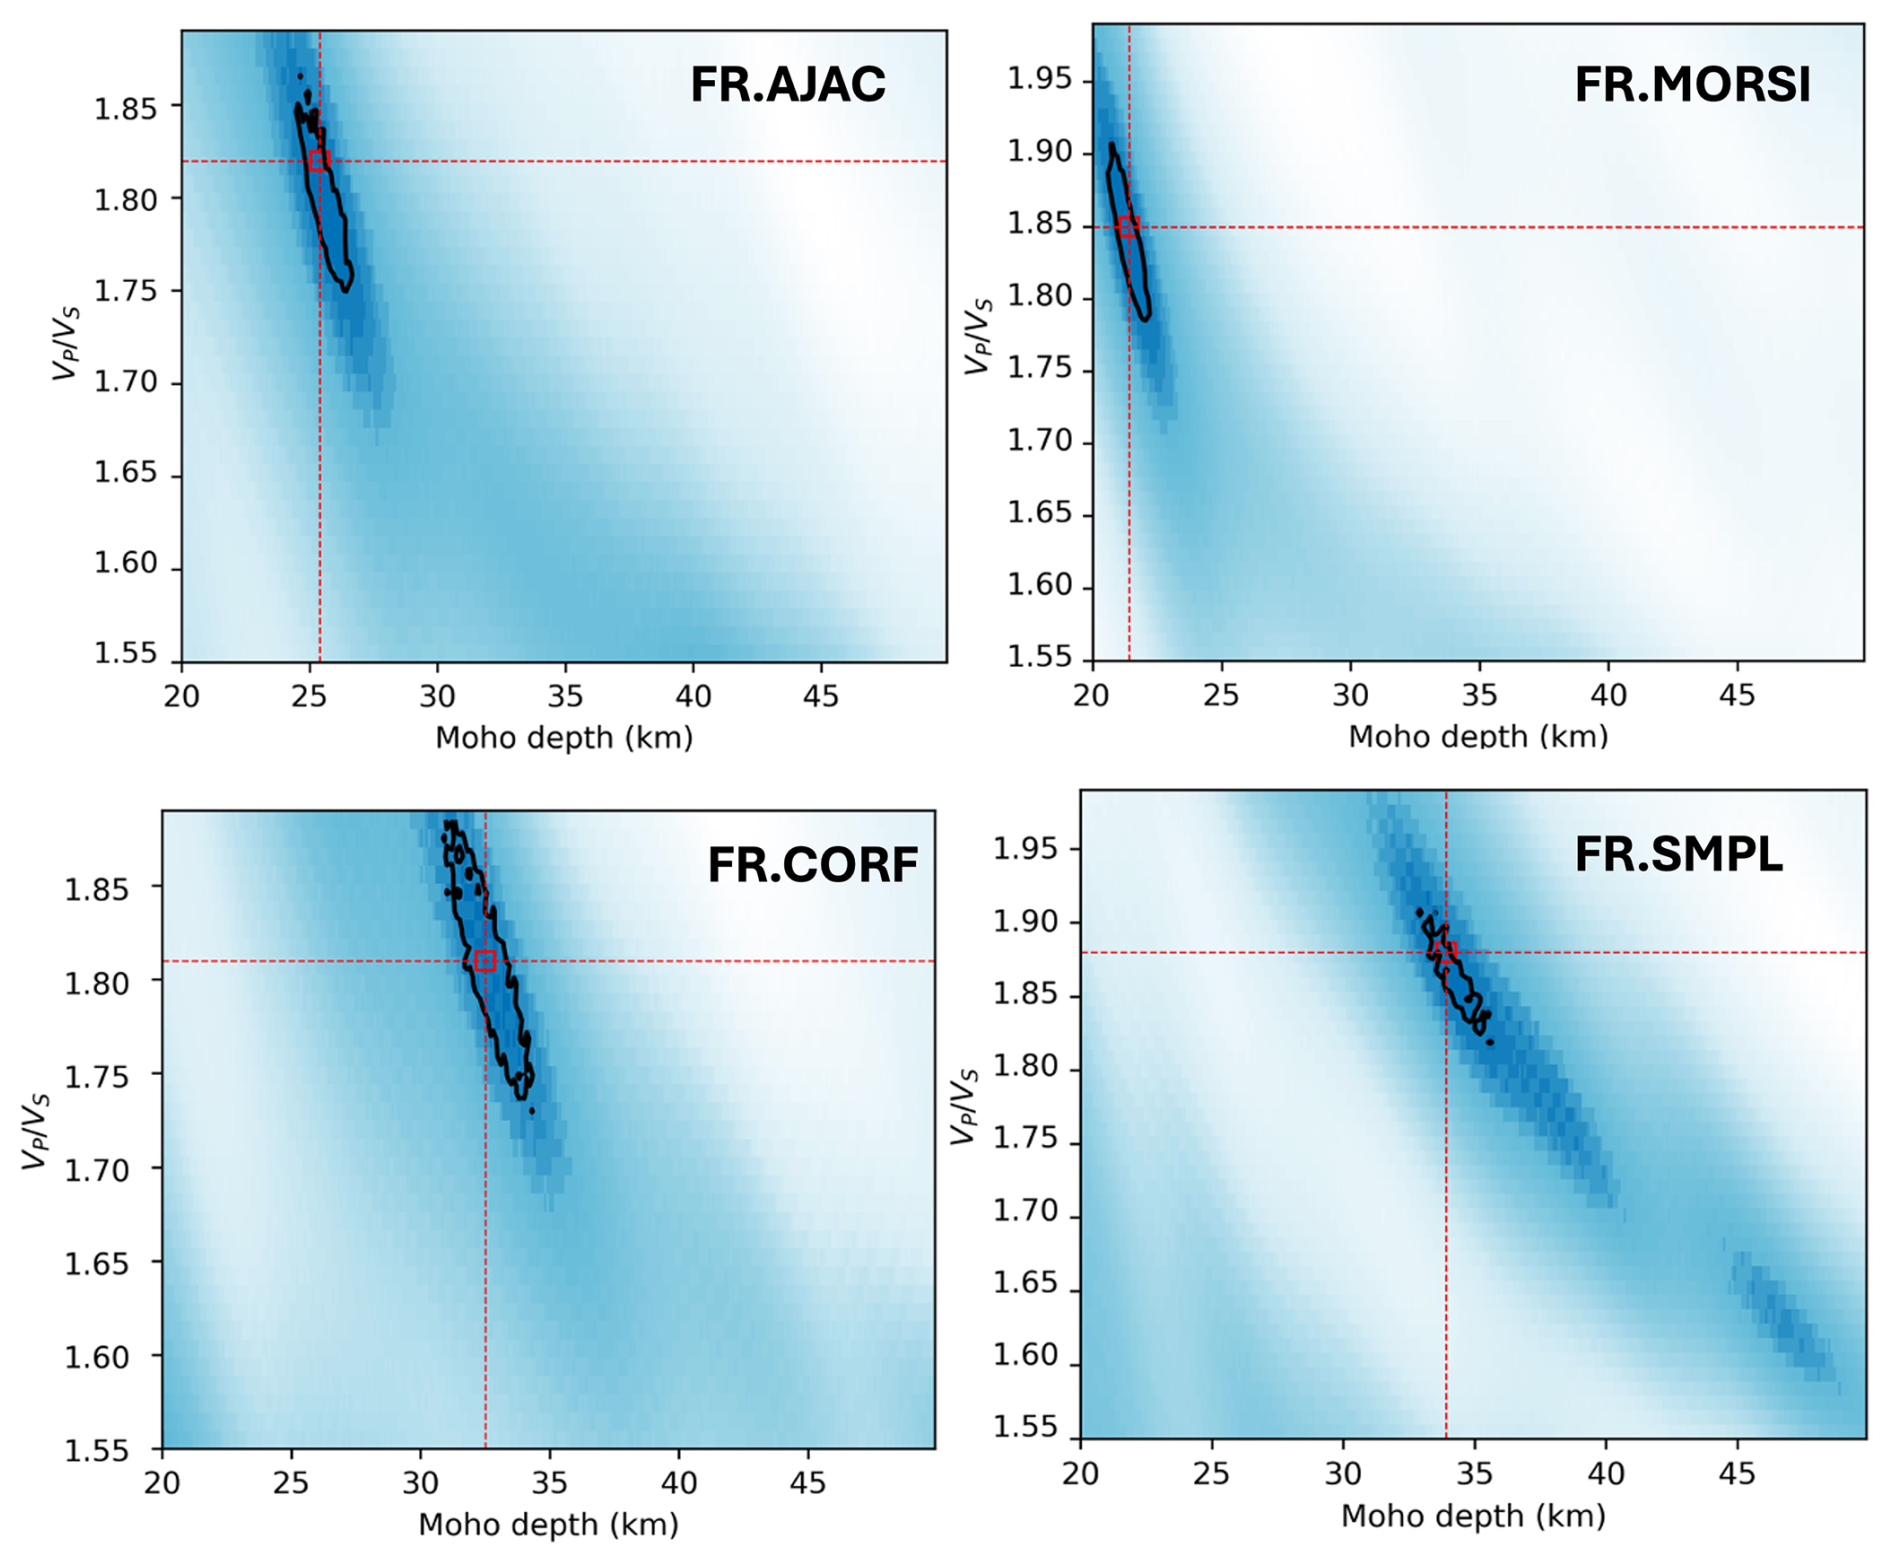
Figure 6Results of the H–k stacking process for four public stations in Corsica from the French (RESIF) network. See the Supplement for individual panels showing the main Ps phase and multiples.
The CELB station, part of the INGV network and situated on the island of Elba, exhibits an interesting characteristic in terms of the ratio (Fig. 7, top-left panel). The ratio, determined as , indicates a relatively low value compared to what is expected for an oceanic environment. This observation highlights the significant influence of the region's outcropping granodiorite rocks on the seismic properties. Additionally, the estimated Moho depth for this station is km.
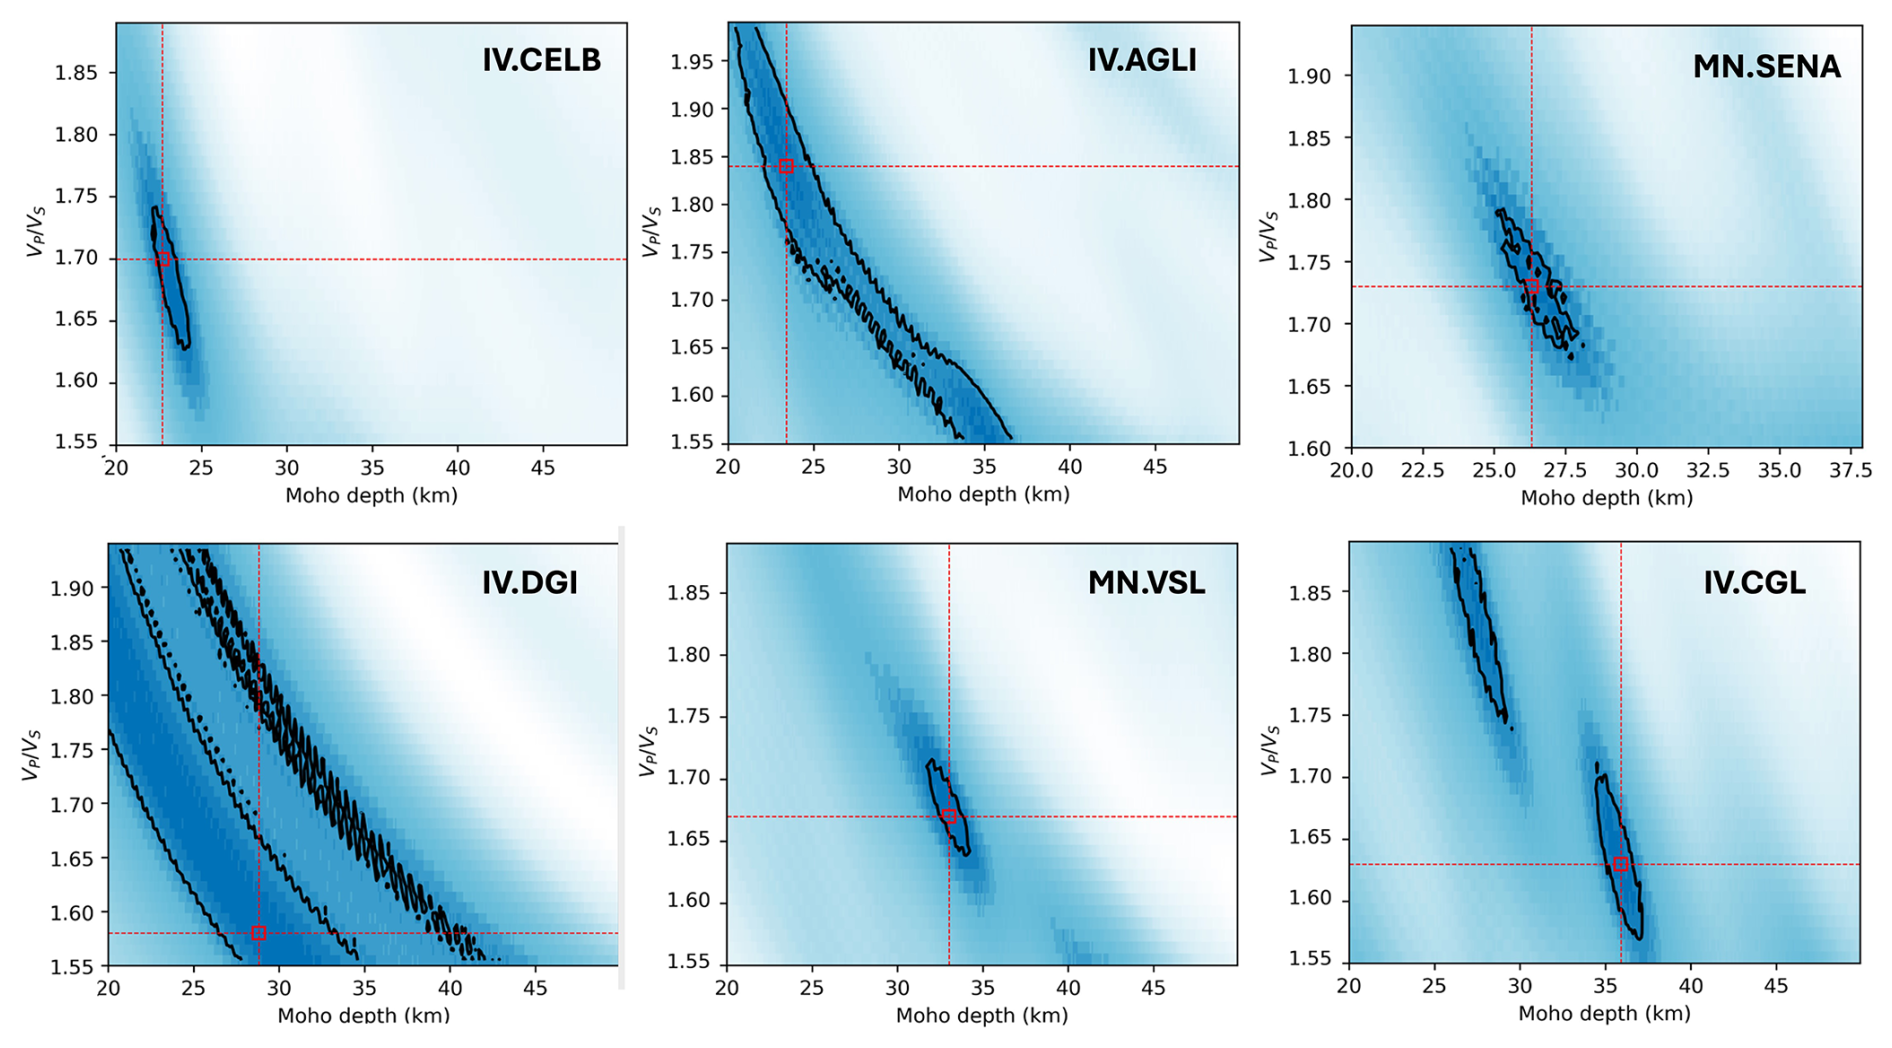
Figure 7Results of the H–k stacking process for five public stations in Sardinia and one on Elba island from the Italian (INGV) and Mediterranean (MedNet) networks.
Moving further south, the Aglientu station (IV.AGLI) encountered challenges during the processing of receiver functions due to the presence of considerable noise in the data. Consequently, a significant number of tracks were discarded based on the adopted quality criteria. The remaining receiver functions exhibited a heterogeneous trend as well. In the subsequent H–k analysis (Fig. 7, top-right panel), a different weighting scheme was applied for this station, namely 0.7 for Ps and 0.2 and 0.1 for PpPs and PpSs + PsP, respectively. Despite these adjustments, the trade-off between crustal thickness and the ratio persisted, resulting in larger uncertainties in the estimates. We obtain a Moho depth of 23.4 ± 7.51 km and a ratio of 1.84±0.22. The incorporation of multiples did not effectively reduce the trade-off between these two parameters.
The MN.SENA station, situated at a depth of 111 m inside a disused mine gallery to enable precise monitoring of regional seismic noise (Di Giovanni et al., 2020), has been operational since 2019. The recorded waveforms at this station are characterized by notable complexity. Figure 7 reveals a blurred Ps phase, accompanied by subsequent multiple arrivals. The intricate waveform characteristics observed during the analysis of receiver functions likely arise from pronounced three-dimensional structural heterogeneity or an unclear transitional zone.
The IV.DGI (Dorgali) station shares similar characteristics with the neighboring SENA station. In the case of DGI, a substantial number of receiver functions had to be excluded based on the selection criteria applied during the receiver function analysis. After conducting thorough examinations, it was determined that utilizing only the Ps phase would be the most appropriate course of action, despite the presence of ambiguous multiples. Consequently, the advantage offered by the H–k method, which considers multiple phases jointly, was nullified. Nevertheless, coherent values were obtained that effectively represent the constraints imposed by this specific station (Fig. 7).
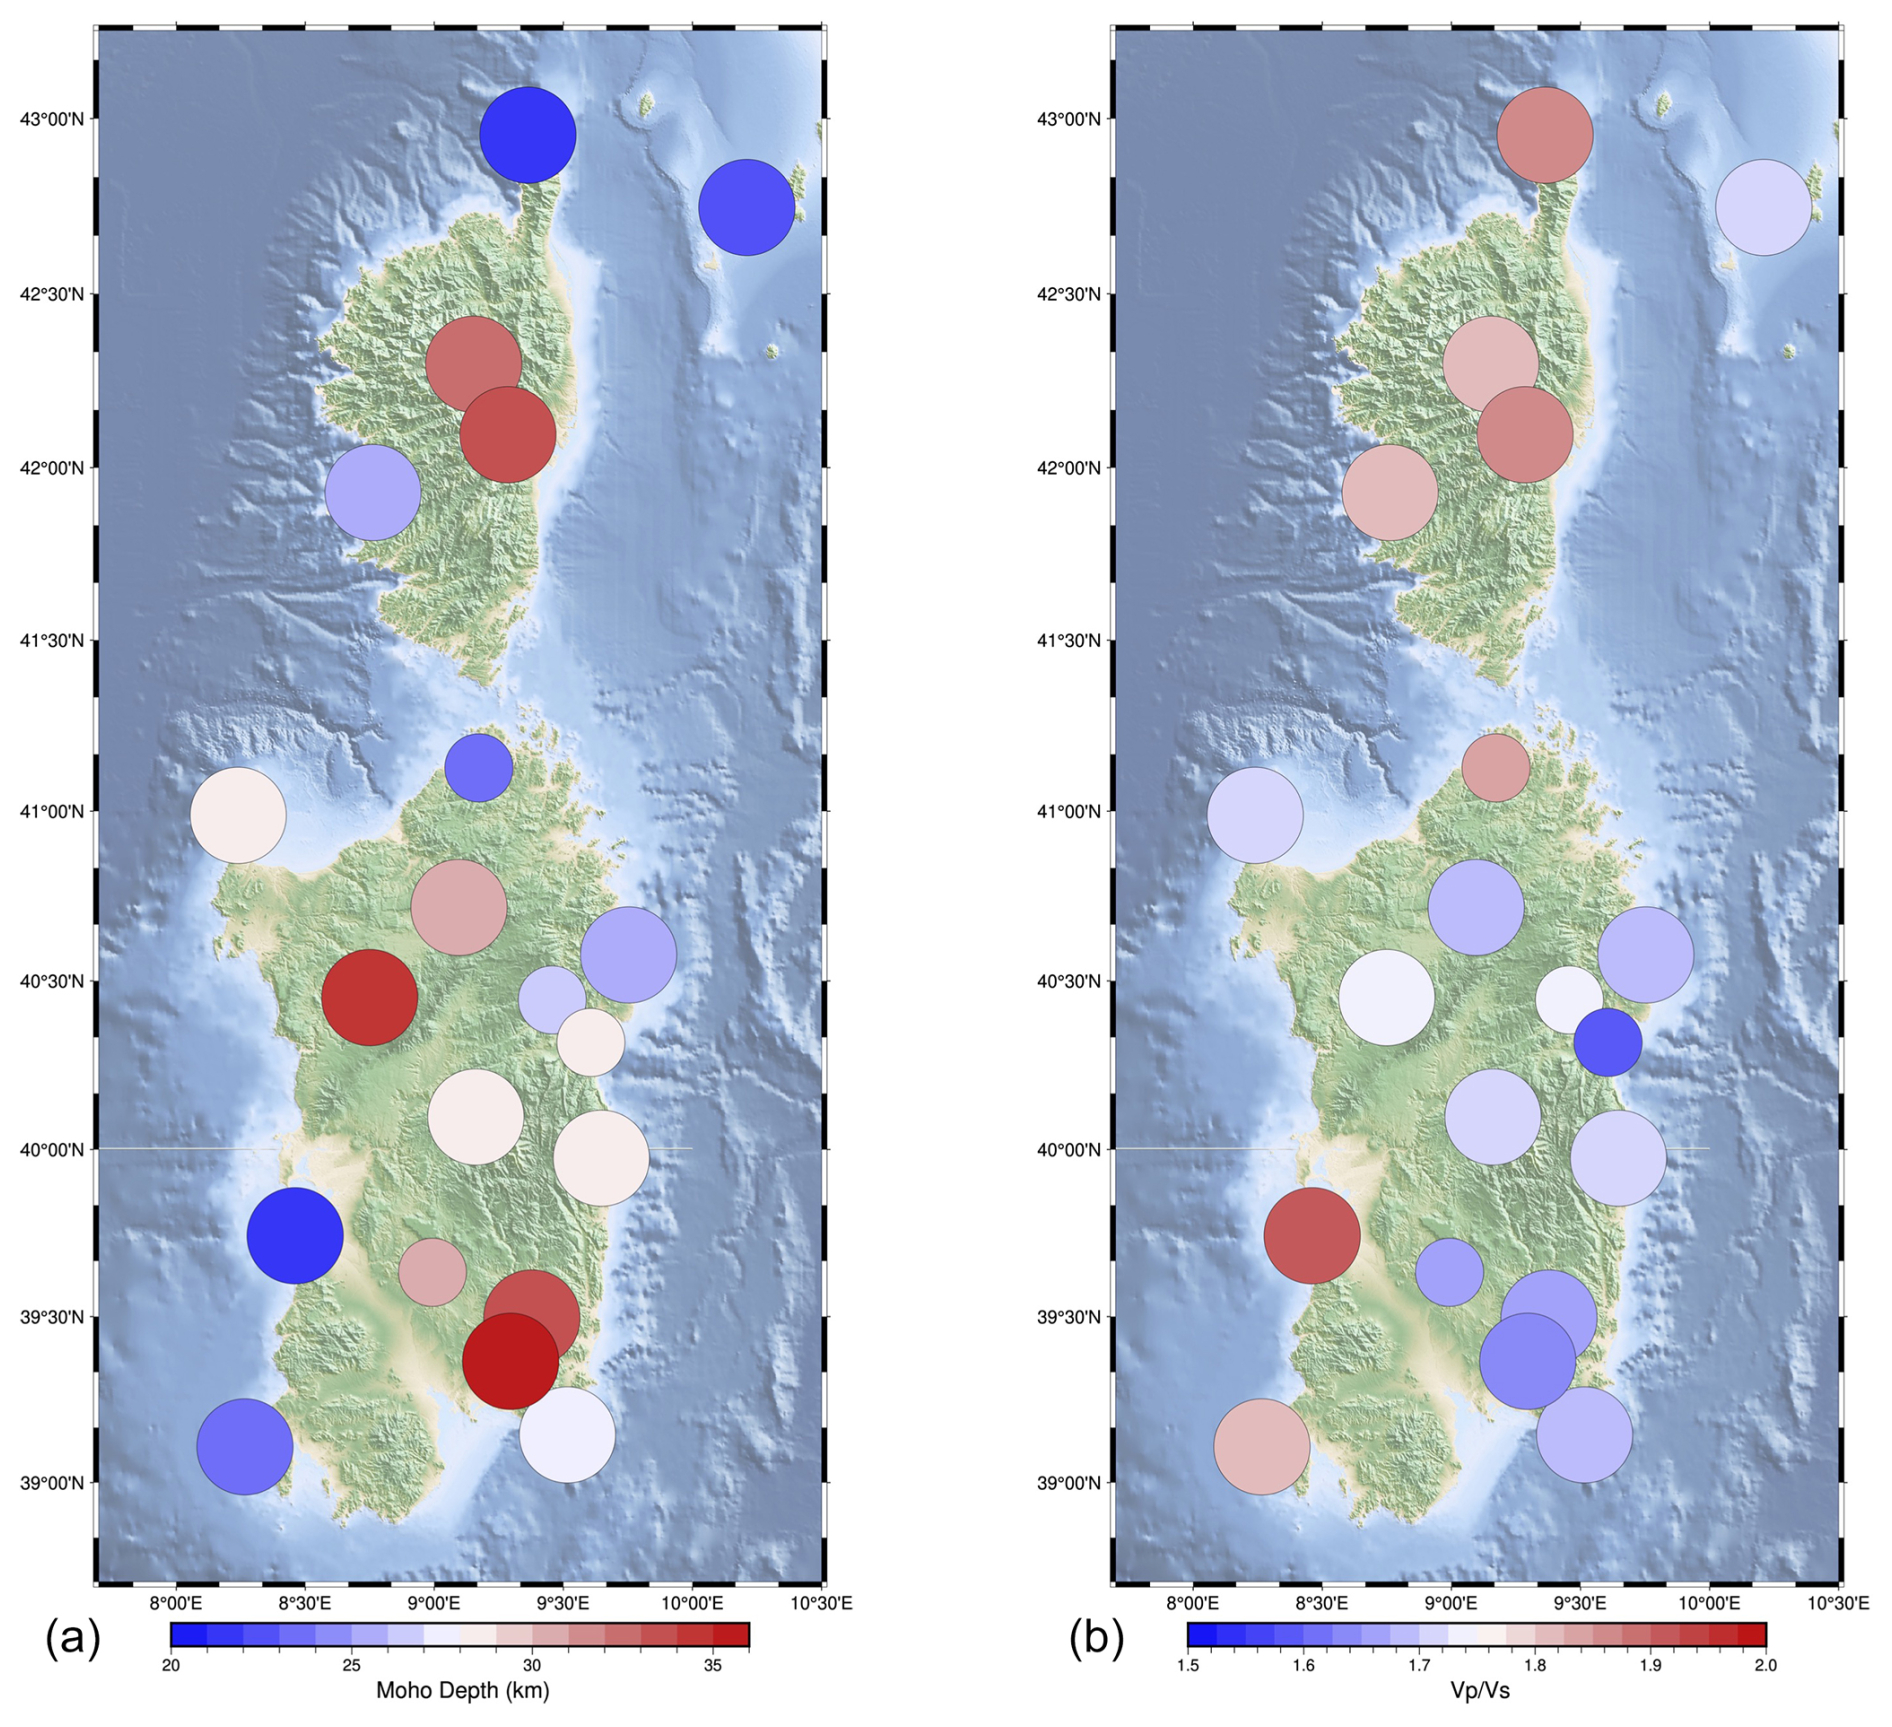
Figure 8Moho depth (a) and ratio (b) obtained with H–k stacking. The four most problematic stations are indicated with smaller symbols.
The MN.VSL station in Villasalto (Fig. 7, bottom-left panel), which has been extensively studied over the years, yielded excellent data through the initial processing phase. The coherence observed between the Ps phase and multiples enabled the successful application of the H–k technique. The resulting values of and were found to be consistent with previous studies conducted for this particular station.
Finally, the nearby IV.CGL has a limited number of receiver functions that have passed the quality check and shows scattered waveforms. Two localized minima were obtained with H–k stacking, one centered at H=27.4 km and k=1.85 and the second at km and . Furthermore, the Ps phase, as for VSL, is relatively weak in amplitude, consistent with previous results (Pondrelli et al., 2019).
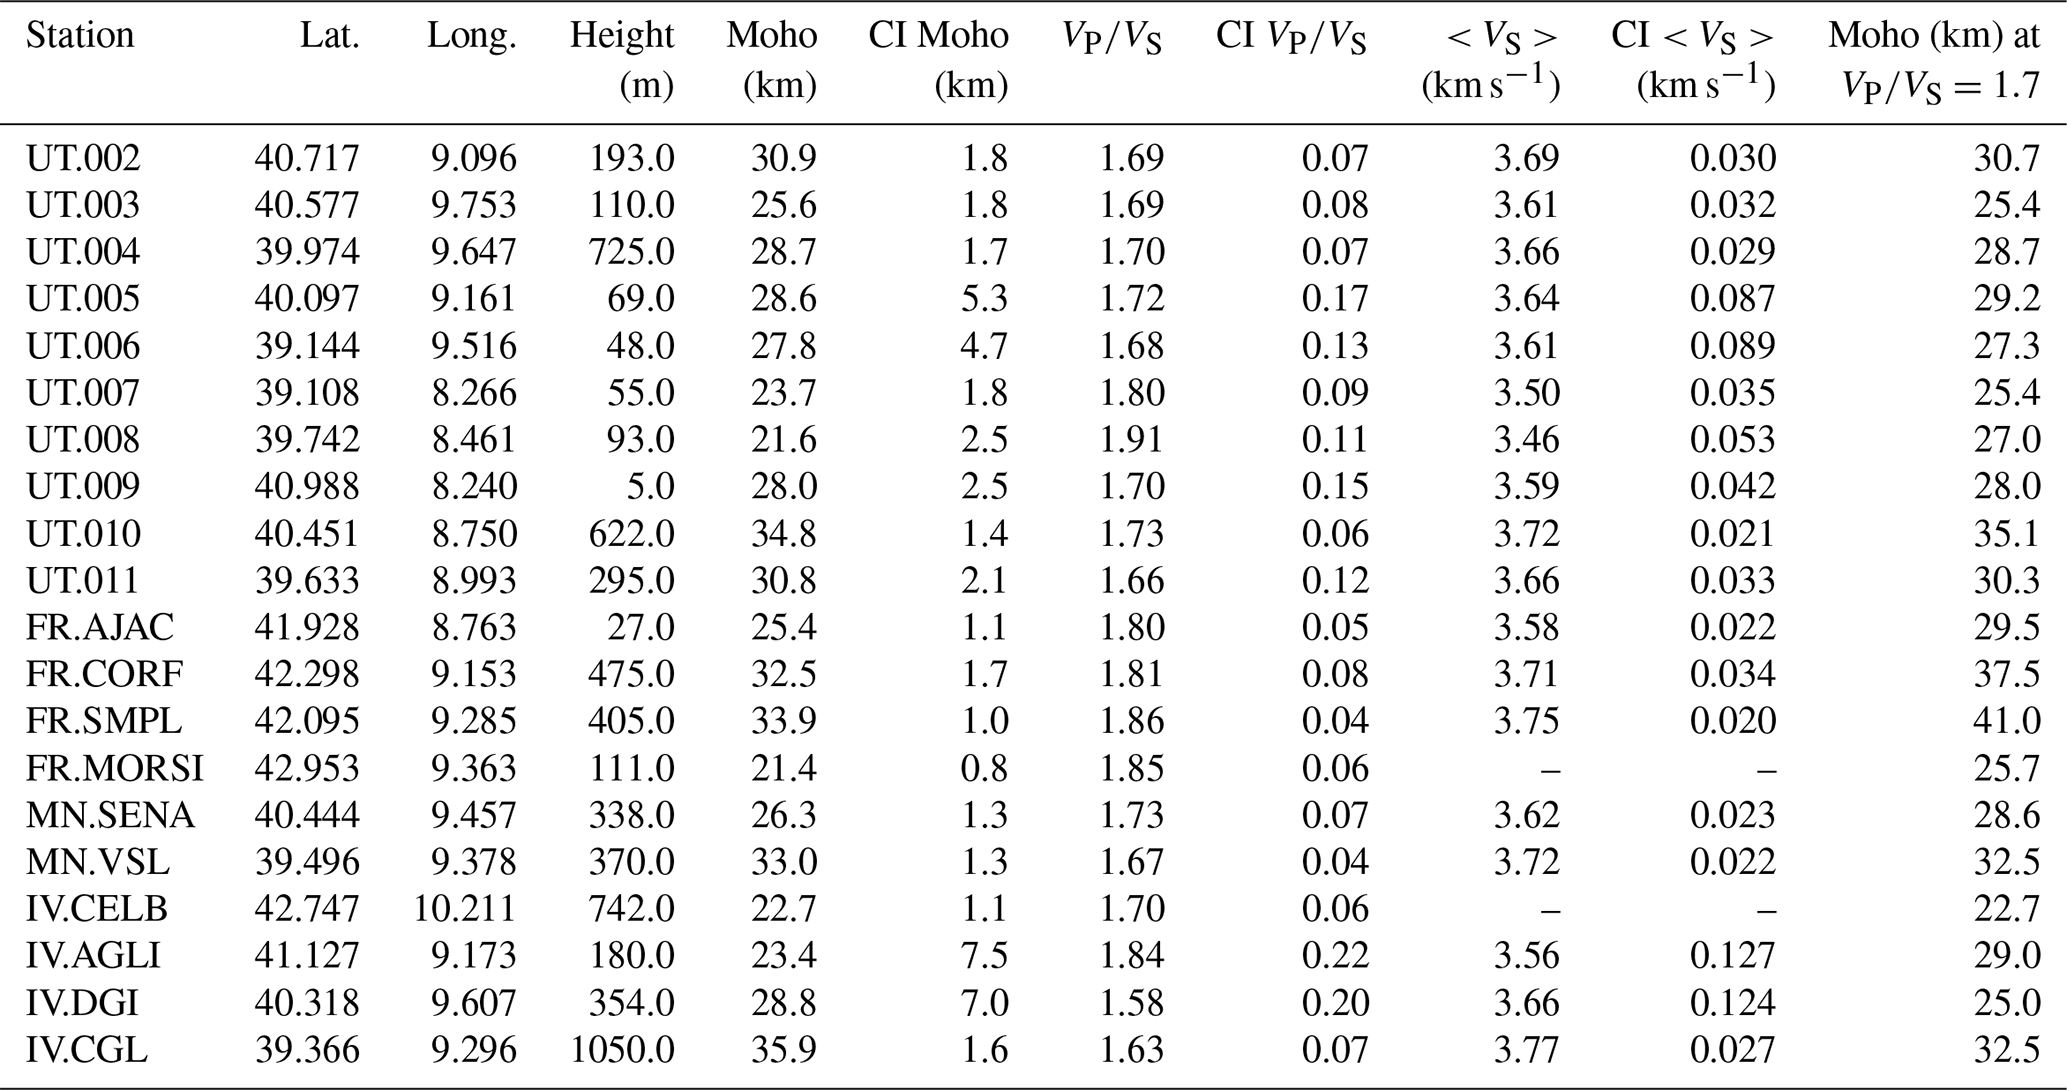
The results obtained for each station are reported in Table 4. Together with the estimated Moho depths, ratios, and respective confidence intervals, we also report the average VS for the crustal depth inferred from the Magrini et al. (2019) model and its uncertainty in percentage. Finally, the last column is the Moho depth estimated with a fixed value of .
Table 4Inferred Moho depths, the ratio, and their confidence intervals from the H–k stacking for all the stations. We use a fixed value of VP=6.4 km s−1, and we assign a weight equal to 0.6, 0.3, and 0.1 for the Ps, PpPs, and PpSs + PsP phases, respectively, for all the stations except three. UT.005 and UT.006 are weighted differently (i.e., 0.8, 0.1, 0.1). For station IV.DGI we only use the Ps phase. We also added an estimate of average shear-wave velocity (< VS >) and variations according to Moho uncertainties from the model of Magrini et al. (2019) and the Moho depth obtained by assuming a fixed ratio equal to 1.7.
Receiver functions, unlike previous deep refraction profiles, are not very sensitive to lateral velocity variations. A nominal horizontal resolution for the crust–mantle discontinuity is on the order of 20–30 km. Dipping interfaces, complex structural heterogeneity, and anisotropy introduce complexities to the obtained RFs and complicate interpretation. Modeling and interpretation of anisotropic effects in the RFs will be a topic for future work. We anticipate, however, that applying a harmonic decomposition to isolate the isotropic part of the signals before the H–k stack did not produce any significant change. In particular, the variation of the obtained ratio is particularly small. Here, we note that the azimuthal coverage of our data was appropriate for conducting a reliable isotropic analysis. The results obtained from our receiver function analysis therefore provide unprecedented resolution on the depth of the Moho and offer an average value of the ratio (Fig. 8), which is a crucial parameter for determining the average composition of the crust (Christensen and Mooney, 1995). These findings can be interpreted in terms of petrological, thermal, and geophysical constraints.
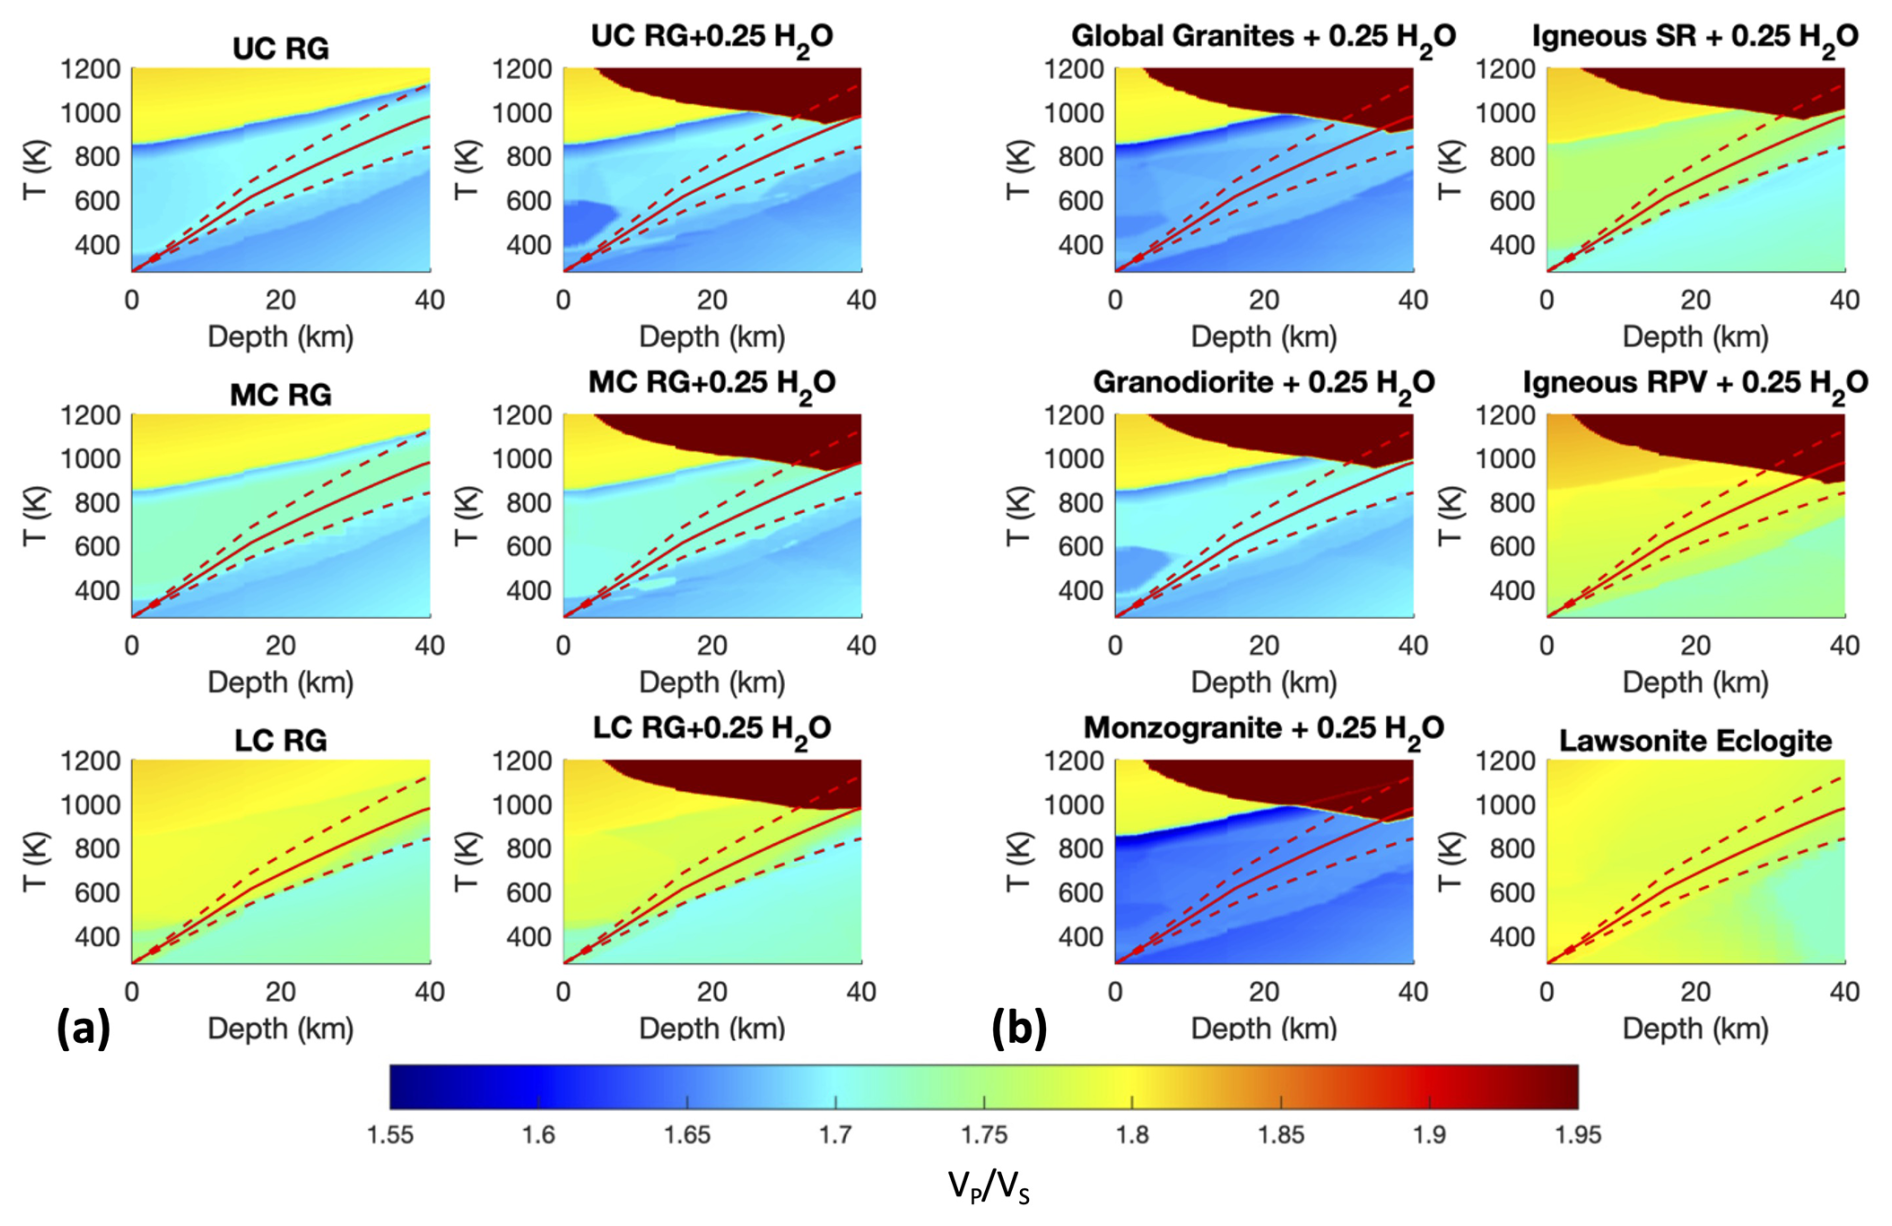
Figure 9 ratio as a function of depth and temperature (T) for different chemical compositions. In each panel, we show reference thermal structures: the solid red line is a continental geotherm assuming a 60 mW m−2 heat flow, and dashed lines are 40 and 80 mW m−2 geotherms. Panels on the left side show predicted values for average upper-, middle-, and lower-crust compositions from Rudnick and Gao (2014). The right side of panel (a) is the same composition with 0.25 wt % of H2O. Panel (b) represents, on the left, estimated compositions of global granites (Blatt and Tracy, 1996) and the two most abundant rocks in the Sardinia–Corsica granitoid batholite, i.e., granodiorite and monzogranite (from Poli et al., 1989). On the right, we show values for chemical compositions representative of the igneous Cenozoic rocks outcropping in western Sardinia (from Lustrino et al., 2013) and a typical eclogite (dry) of Alpine Corsica. All chemical compositions considered here are reported in Table 1.
As previously mentioned, we considered three major petrological provinces, and we have conducted thermodynamical modeling to determine the physical properties of representative lithologies in a state of equilibrium as a function of pressure (depth) and temperature. The chemical compositions of these lithologies can be found in Table 1. Additionally, we have computed the P–T properties of the upper, middle, and lower crust from the global compilation of Rudnick and Gao (2014) (reported in Table 2).
In Fig. 9, we present the results of our thermodynamical modeling in terms of the ratio as a function of depth (we convert pressure to depth using the PREM pressure profile; Dziewonski and Anderson, 1981). We also include reference thermal profiles based on steady-state calculations of continental geotherms. Specifically, we show a geotherm that has been computed with a surface heat flow of 60 mW m−2, along with two additional geotherms corresponding to heat flows of 40 and 80 mW m−2.
Once the surface heat flow is known, it is possible to estimate temperatures at greater depths by considering a radiogenic heat distribution in the shallow crust and taking into account the thermal conductivity of rocks (e.g., Chapman, 1986). For the geotherms displayed in Fig. 9, we assume a thermal conductivity value of 2.5 W m−1 K−1 and a fixed radiogenic heat production (AC=1.0 µW m−3). These values are chosen arbitrarily, since the scope of plotting the steady-state continental geotherms is only to provide a reference range of possible temperatures within the crust. Indeed, it is important to note that due to the recent geodynamic processes that Sardinia and Corsica have undergone (as described in the Introduction), the assumption of steady-state conditions may not be applicable to our study region. In any case, we point out that the radiogenic heat value of the Variscan batholith in Sardinia and Corsica has been estimated to be only slightly higher than the global average for the upper crust (Verdoya et al., 1998; Puccini et al., 2014).
In general, the crystalline crust consists of a sialic upper crust, an intermediate middle crust, and a mafic lower crust. As shown in the panels representing the reference crustal composition (Fig. 9, left panels), the values of the ratio increase, but slightly, with depth within the crust. The addition of H2O, which is essential to obtain a more realistic mineralogy, has its main effect owing to the reduction of the solidus. Anelastic effects at solid state, not considered here, could also be enhanced. The most evident variations at varying depth (pressure) and temperature are related to the break-down of plagioclase and to α to β quartz transition (Diaferia and Cammarano, 2017).
By examining the right panels in Fig. 9, it becomes apparent that the rocks representing the Variscan batholith in Sardinia and Corsica are characterized by the lowest values of the ratio. Along the reference geotherm at 60 mW m−2, a typical monzogranite has a equal to ∼ 1.65. Slightly higher values, but not exceeding 1.7, are estimated for a granodiorite and for a globally average granite composition. Conversely, the volcanic rocks outcropping in western Sardinia, as well as the metabasalts and metamorphic rocks of Alpine Corsica, are characterized by higher values under the same conditions. Specifically, we have calculated values of approximately 1.75 for an average chemical composition of the Cenozoic subduction-related volcanic rocks and ∼ 1.8 for a lawsonite–eclogite (Fig. 9).
The stations located on the Sardinian portion of the batholith exhibit relatively low values of the ratio, which is consistent with a silica-rich composition of the crust (Fig. 8).
As mentioned in the Introduction, the study of the ambient noise using the LiSard network has permitted us to extract and model dispersion curves of surface waves (Magrini et al., 2019). Although these waves do not provide precise information on sharp discontinuities, they offer a reliable constraint on the average shear-wave velocity of the crust. The average VS values for a fixed 30 km crust, as determined by Magrini et al. (2019), are presented in Fig. 10. Additionally, Table 4 provides the average VS values estimated for each station. The shear-wave model covers a large portion of the study area and reveals an evident east–west trend in Sardinia, with relatively higher average VS in the eastern part. Corsica is only partially resolved. However, the central area shows comparable velocities to eastern Sardinia. It is important to note that the absolute velocities derived by surface-wave-based models are partly influenced by regularization. In this regard, a VS scale with larger velocity variations could also be consistent with the surface-wave data.
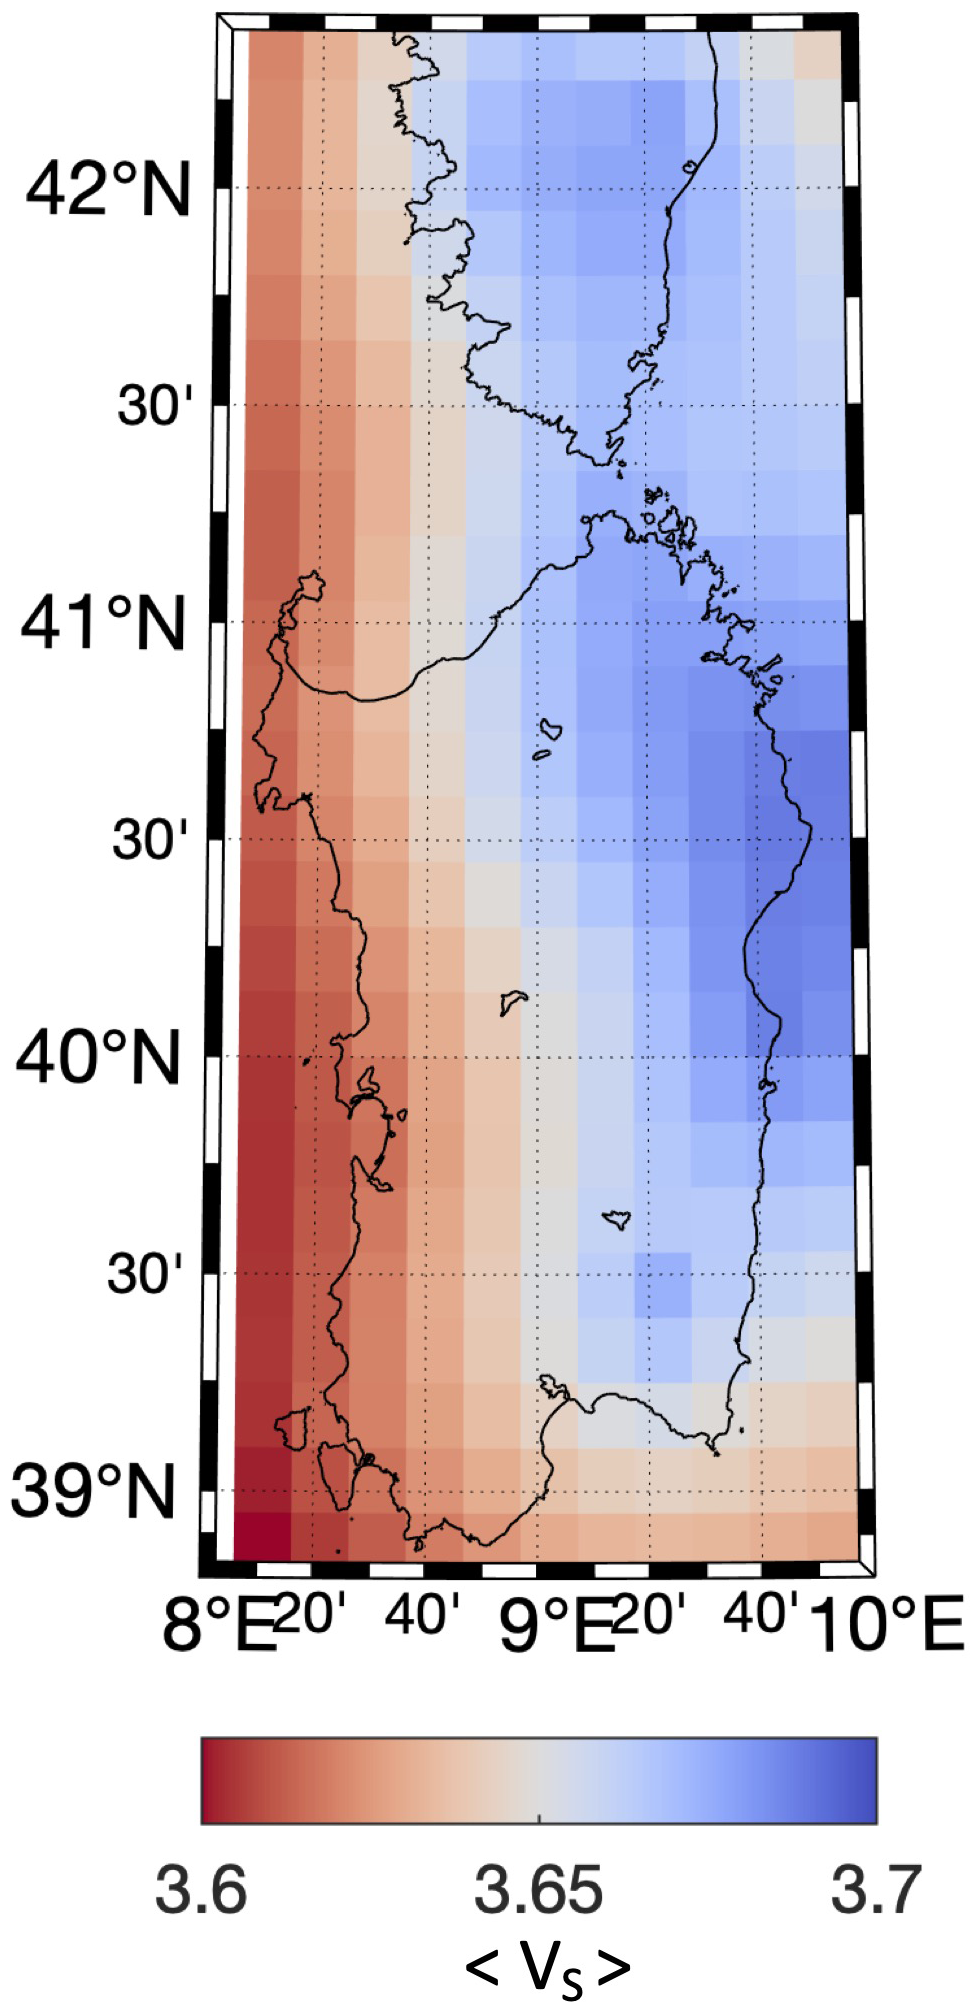
Figure 10Average shear-wave velocity (VS) until a depth of 30 km inferred from the VS model of Magrini et al. (2019).
To quantitatively estimate the average silica content of the Sardinian crust, we model how the physical properties change as a function of SiO2 (Fig. 11; see chemical compositions in Table 2). The variation in silica content has a relatively modest impact on the average shear-wave velocity (< VS >). For instance, along a geotherm based on a surface heat flow of 60 mW m−2, < VS > increases slightly from ∼3.82 to 3.87 as the SiO2 content varies from 60 wt % to 70 wt % (Fig. 11). In contrast, VP decreases from ∼ 6.6 to 6.4 within the same range. The combined ratio shows the most significant variations, ranging from 1.76 to 1.65.
Despite the inherent uncertainties in our estimates, as well as in other geophysical and thermal constraints, the thermodynamical modeling gives valuable insights for the potential range of average silica content in the Sardinian Variscan crust. In Fig. 11, we identify a specific region that is consistent with both the thermal and geophysical constraints. This region corresponds to a ratio ranging from 1.65 to 1.70, consistently observed in eastern Sardinia (refer to Fig. 8). The average shear-wave velocity (VS), which is relatively higher in eastern Sardinia (as shown in Fig. 10), has values around 3.7 km s−1. Finally, the VP is on the order of 6.4 km s−1 (Egger et al., 1988). Taking these different findings, we can infer that the silica content of the Sardinian Variscan batholith falls within the range of 65 % to 70 %.
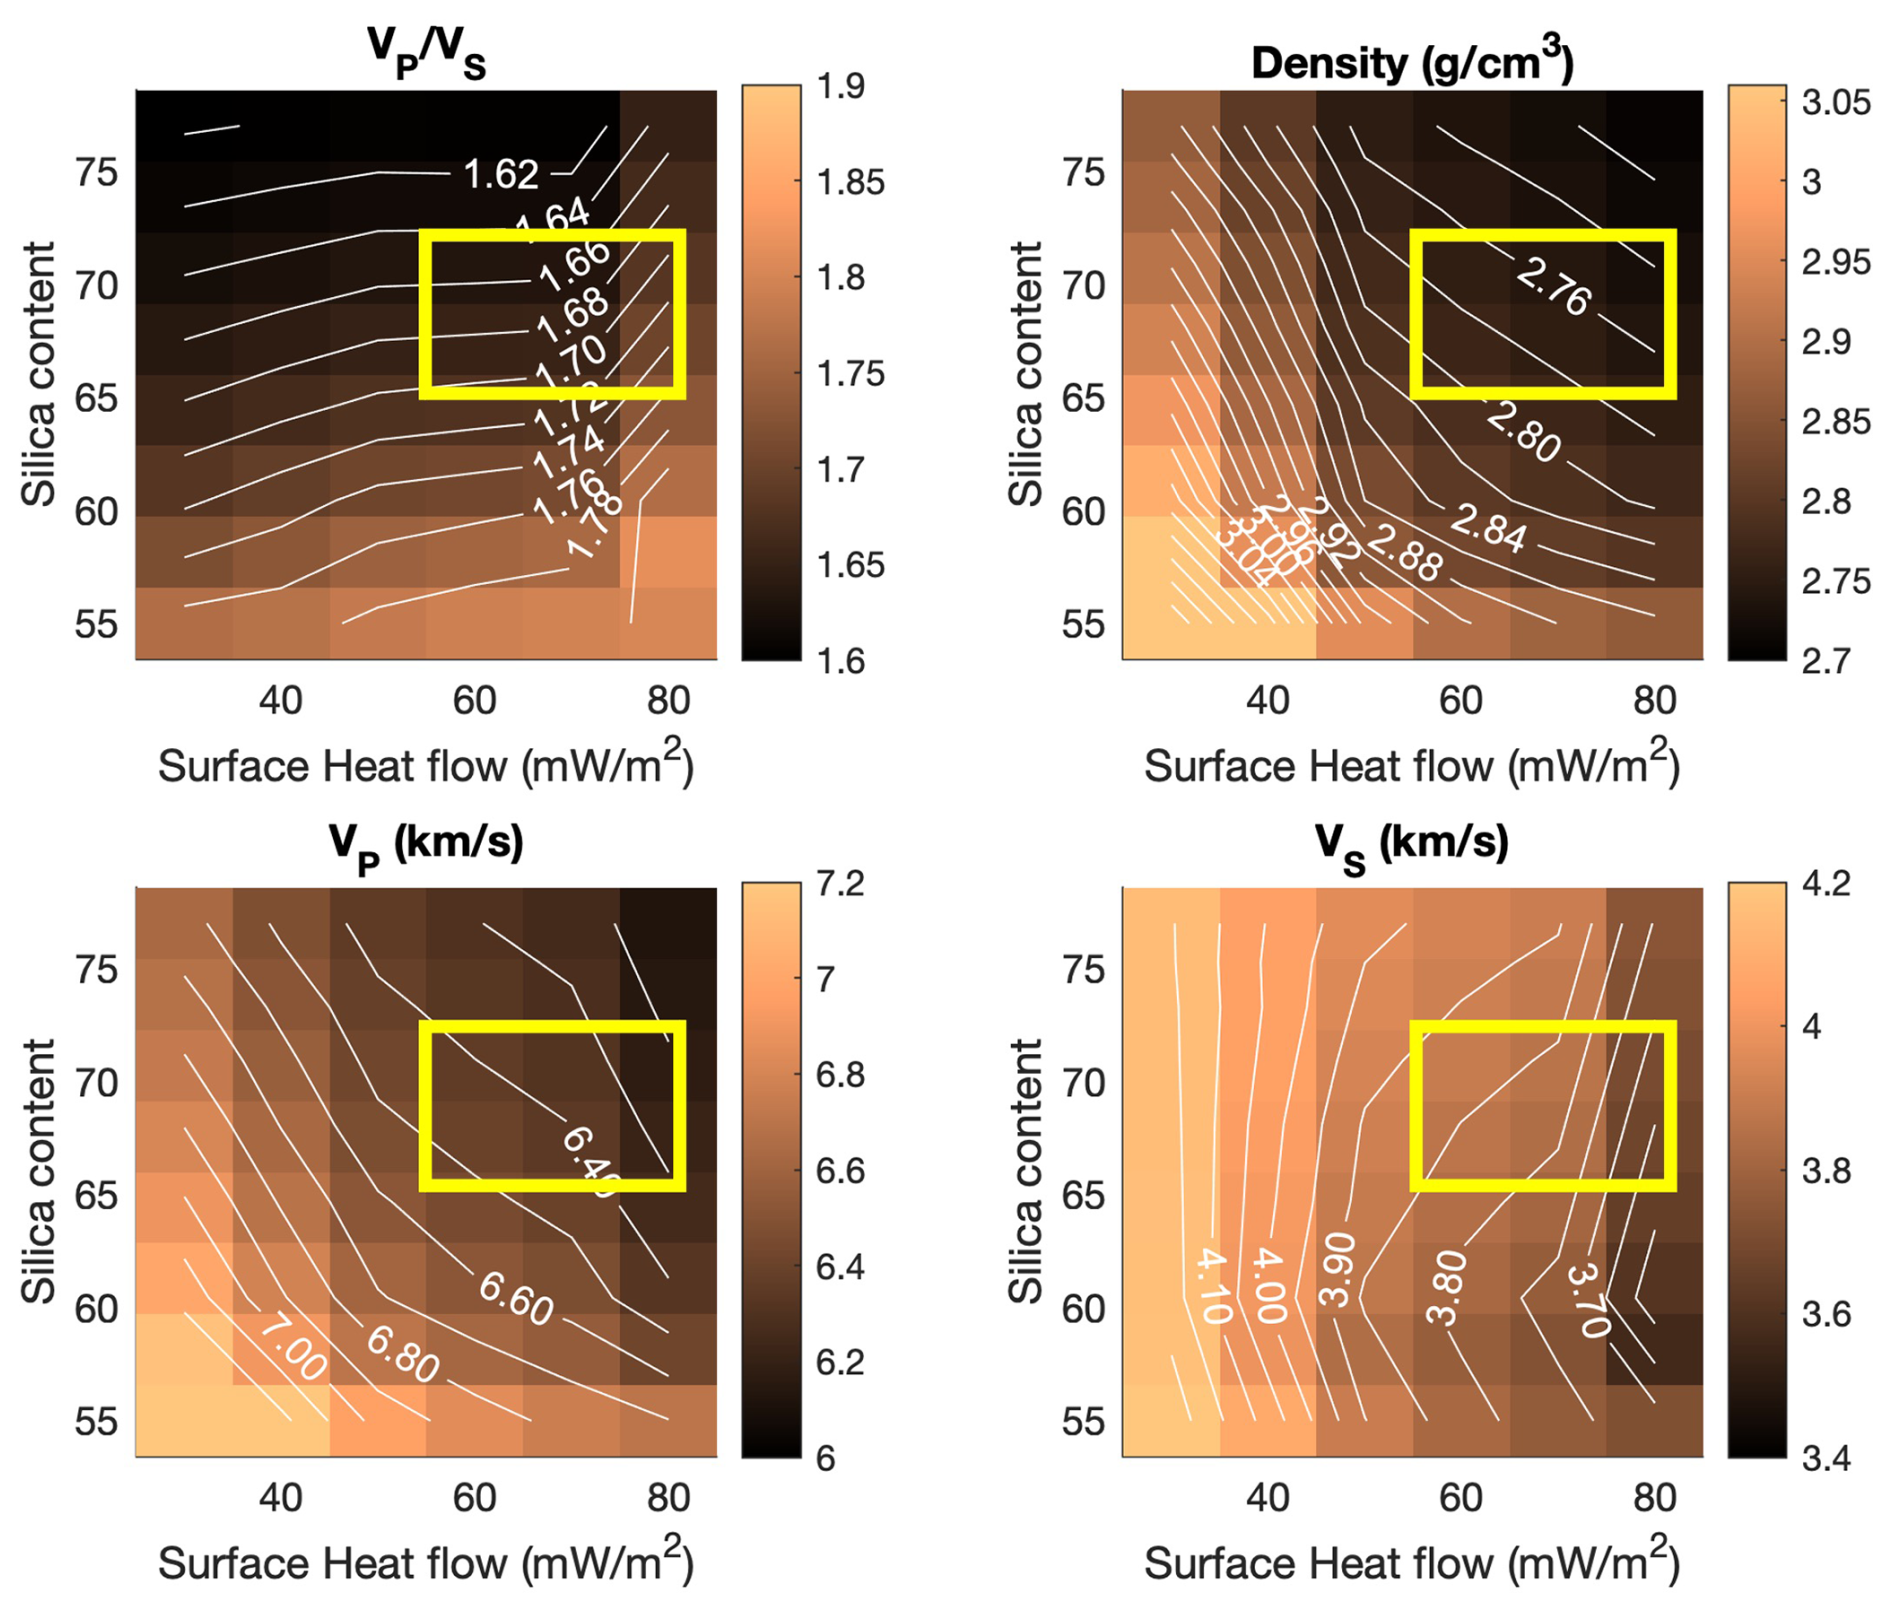
Figure 11Effect of temperature and silica content on average , absolute velocities, and density of the crust. The values refer to the chemical compositions in Table 2 and have been calculated for a crustal depth of 30 km and for thermal structures based on continental geotherms at variable heat flow. In yellow, we indicate the range which satisfies the physical properties as constrained by geophysical studies. In the Supplement, we provide two similar figures but with a variable-silica-content upper crust only in the top 15 km.
It is interesting to note that the is less sensitive to temperature than absolute velocities (VS and VP), as shown in Fig. 11, except when temperature reaches levels high enough to approach the solidus. However, colder thermal structures can be confidently excluded based on multiple factors. Firstly, the measured heat flow indicates that colder thermal structures are unlikely. Additionally, colder structures would result in excessively high absolute velocities, providing further evidence against their presence in the region.
Our modeling is also able to establish a consistent relationship between seismic velocities and density as a function of composition and temperatures within the crust. For instance, assuming a 30 km thick crust composed of variable silica compositions ranging from 65 % to 70 %, we can predict a density of approximately 2.77 g cm−3 (Fig. 11).
Since our geophysical estimates are for the bulk crust, we also assume a reference crust, in which we consider only the top 50 % (i.e., 15 km) of upper crust with a variable silica content. The rest of the crust is fixed, and it is composed of 25 % (i.e., 7.5 km) middle crust (intermediate composition) with the bottom 25 % being lower crust (mafic composition). With this reference crust, we obviously get even higher values for the ratio, and we infer a silica content of the upper crust ranging from ∼ 67 % to 75 % (we document this result in Fig. S18 in the Supplement). Moreover, the average crustal density becomes larger and reaches a value around 2.8 g cm−3 (Fig. S18).
The silica-rich composition we infer for Variscan batholith is consistent with the chemical composition estimated for a portion of exhumed Variscan crust in Calabria (Sassi, 2003; Fiannacca et al., 2017). In addition, the Moho depth observed in the batholith corresponds to that of the intact Variscan European crust. Our findings suggest that the subduction-driven processes associated with the formation of the islands in the past 35 million years did not significantly modify the continental crust.
On the other hand, the western portion of Sardinia has a thinner crust and higher ratios, which are consistent with the presence of Cenozoic volcanic rocks. A remarkable finding is the identification of a ratio exceeding 1.9 in a region where an independent study reported the lowest VS values and where heat flow is significantly high. This finding is consistent with elevated temperatures within the crust. An alternative explanation could be related to the effects of the thick (∼ 3000 m according to gravity studies; Balia et al., 1984) sedimentary deposits, which characterize this specific location. To support this hypothesis, we note that the VS model by Magrini et al. (2019) shows very high velocity only in the top portion of the crust. A combination of the two factors, high temperature and thick sediments, cannot be discarded.
The Corsica stations yield other important results. Stations located on the Alpine front in Corsica image a deep Moho, in agreement with previous studies, and high ratios. However, the VS values in these regions are not low. We interpret these findings as indicative of the presence of serpentinite-rich rocks throughout the crust, highlighting the significant influence of Alpine orogenesis processes on the entire crust of Corsica. The MORSI stations located in the extreme north of Alpine Corsica also has a high ratio but a shallower Moho depth. This outcome is consistent with the physical properties of the metamorphic Alpine rocks and with the partial sampling of the oceanic crust surrounding the station. Interestingly, the nearby CELB station on Elba island, within the Tuscany magmatic province, displays a shallow crust, as expected. However, it shows a lower ratio, which is consistent with the abundance of granodioritic and monzogranitic rocks forming a large pluton that intruded approximately 7 million years ago (Caggianelli et al., 2014).
Subduction-related processes play a fundamental role in plate tectonics. The rapid retreat of subducting slabs leads to the formation of volcanic arcs and the opening of back-arc basins. In certain cases, such as the example of Sardinia and Corsica, the process of rifting can cause segments of continental crust to separate from the main continent, becoming part of the newly formed basin. Our study reveals that these processes, which are responsible for extensive Cenozoic arc volcanism in Sardinia and significant intraplate volcanism in the Tyrrhenian Sea, did not result in substantial modifications to the Variscan crust, which forms a substantial portion of the Sardinia–Corsica micro-continent.
In contrast, the previous Alpine orogenesis, as evidenced by observations from two stations in central Corsica located along the Alpine front, had a profound impact on the entire crust. This orogenic event, associated with the collision between the African and European plates, caused significant changes, including deformation and metamorphism, throughout the crust. In central Corsica, for instance, we found a deep crust consistent with previous studies, but also high ratios that indicate that a large portion of the crust should be mafic. The high ratio between compressional and shear-wave seismic velocities, coupled with high VS and with the nearby presence of serpentinized Alpine Corsica rocks, suggests that serpentinization could be a significant process affecting the entire crust.
Furthermore, we have discovered compelling evidence of an anomaly in within the crust in the eastern part of Sardinia, which can be related to elevated temperature or to the role of a thick sedimentary cover. We find this anomaly in correspondence with a region characterized by several other elements that support our finding, namely a region that experienced relatively recent (1.5 Myr ago) volcanism, current rifting, high heat flow, low shear-wave velocity, and thick Plio-Quaternary sediments.
The seismological data used in this work are partly publicly available through the European Integrated Data Archive (EIDA; http://www.orfeus-eu.org/data/eida/, last access: 13 February 2023; European Integrated Data Archive, 2022) and partly come from in-house data of the LiSard seismic network. Full three-component waveforms and computed receiver function waveforms used in this study, as well as scripts to reproduce the results, are available from https://zenodo.org/records/14568981 (Cammarano et al., 2024). In the same repository we also provide thermodynamic tables of physical properties computed with Perple-X and related scripts. We extensively used ObsPy routines (Beyreuther et al., 2010); https://docs.obspy.org/index.html, last access: 29 December 2024, and we use SeisPy (Xu and He, 2023; https://seispy.xumijian.me/index.html, last access: 29 December 2024) for the processing and post-processing of the receiver functions.
The supplement related to this article is available online at https://doi.org/10.5194/se-16-135-2025-supplement.
FC, IF, and MvdM installed the stations and acquired the data. FC, AC, and HBR computed and interpreted the receiver functions. FC performed the thermodynamics computations. FC wrote the manuscript draft. HBR, IF, MvdM, AC, and FC reviewed and edited the manuscript.
The contact author has declared that none of the authors has any competing interests.
Publisher’s note: Copernicus Publications remains neutral with regard to jurisdictional claims made in the text, published maps, institutional affiliations, or any other geographical representation in this paper. While Copernicus Publications makes every effort to include appropriate place names, the final responsibility lies with the authors.
Fabio Cammarano and Henrique Berger Roisenberg acknowledge the Grant of Excellence Departments, MIUR-Italy (ARTICOLO 1, COMMI 314–337 LEGGE 232/2016). The authors would like to thank Tony Lowry, an anonymous reviewer, and the associate editor Irene Bianchi for their comments that improved the manuscript.
The research has been supported by the Grant of Excellence Departments, MIUR-Italy (ARTICOLO 1, COMMI 314–337 LEGGE 232/2016).
This paper was edited by Irene Bianchi and reviewed by Tony Lowry and one anonymous referee.
Afilhado, A., Moulin, M., Aslanian, D., Schnürle, P., Klingelhoefer, F., Nouzé, H., Rabineau, M., Leroux, E., and Beslier, M.-O.: Deep crustal structure across a young passive margin from wide-angle and reflection seismic data (The SARDINIA Experiment) – II. Sardinia's margin, B. Soc. Geol. Fr., 186, 331–351, https://doi.org/10.2113/gssgfbull.186.4-5.331, 2015. a
Agius, M. R., Magrini, F., Diaferia, G., Kästle, E. D., Cammarano, F., Faccenna, C., Funiciello, F., and van der Meijde, M.: Shear-Velocity Structure and Dynamics Beneath the Sicily Channel and Surrounding Regions of the Central Mediterranean Inferred From Seismic Surface Waves, Geochem. Geophy. Geosy., 23, e2022GC010394, https://doi.org/10.1029/2022GC010394, 2022. a
Ammon, C. J.: The isolation of receiver effects from teleseismic P waveforms, Bull. Seism. Soc. Am., 81, 2504–2510, 1991. a
Balia, R., Ciminale, M., Loddo, M., Pecorini, G., Ruina, G., and Trudu, R.: Gravity survey and interpretation of bouguer anomalies in the campidano geothermal area (Sardinia, Italy), Geothermics, 13, 333–347, https://doi.org/10.1016/0375-6505(84)90048-8, 1984. a
Beyreuther, M., Barsch, R., Krischer, L., Megies, T., Behr, Y., and Wassermann, J.: ObsPy: A Python Toolbox for Seismology, Seismol. Res. Lett., 81, 530–533, https://doi.org/10.1785/gssrl.81.3.530, 2010. a
Blatt, H., Tracy, R., and Owens, B.: Petrology: Igneous Sedimentary and Metamorphic, Macmillan, 2006. a
Caggianelli, A., Ranalli, G., Lavecchia, A., Liotta, D., and Dini, A.: Post-emplacement thermo-rheological history of a granite intrusion and surrounding rocks: the Monte Capanne pluton, Elba Island, Italy, Geol. Soc. Lond. Spec. Publ., 394, 129–143, https://doi.org/10.1144/SP394.1, 2014. a
Cammarano, F., Roisenberg, H. B., Conclave, A., Fadel, I., and van der Meijde, M.: Repository: On crustal composition of the Sardinia-Corsica continental block inferred from receiver functions, Zenodo [data set], https://doi.org/10.5281/zenodo.14568981, 2024. a
Carrozzo, M., Balia, R., Loddo, M., Luzio, D., Margiotta, C., Quarta, T., and Trudu, R.: Gravity modelling of the lower crust in Sardinia (Italy), Ann. Geophys., 40, 12 pp., https://doi.org/10.4401/ag-3845, 1997. a
Chapman, D. S.: Thermal gradients in the continental crust, in: The nature of the lower continental crust, edited by: J. B. Dawson, D. A. Carswell, J. H. and Wedepohl, K. H., Geol. Soc. Spec. Publ., Vol. 24, 63–70, https://doi.org/10.1144/GSL.SP.1986.024.01.07, 1986. a
Christensen, N. I. and Mooney, W. D.: Seismic velocity structure and composition of the continental crust: A global view, J. Geophys. Res.-Sol. Ea., 100, 9761–9788, https://doi.org/10.1029/95JB00259, 1995. a
Clayton, R. W. and Wiggins, R. A.: Source shape estimation and deconvolution of teleseismic bodywaves, Geophys. J. Int., 47, 151–177, https://doi.org/10.1111/j.1365-246X.1976.tb01267.x, 1976. a
Connolly, J.: Computation of phase equilibria by linear programming: A tool for geodynamic modeling and its application to subduction zone decarbonation, Earth Planet. Sc. Lett., 236, 524–541, https://doi.org/10.1016/j.epsl.2005.04.033, 2005. a
Crotwell, H. P., Owens, T. J., and Ritsema, J.: The TauP Toolkit: Flexible Seismic Travel-time and Ray-path Utilities, Seismol. Res. Lett., 70, 154–160, https://doi.org/10.1785/gssrl.70.2.154, 1999. a
Cuccuru, S., Oggiano, G., and Funedda, A.: Low Entalpy Geothermal Suitability of North Sardinia (Italy), Energy Proced., 76, 256–263, https://doi.org/10.1016/j.egypro.2015.07.858, 2015. a
Della Vedova, B., Lucazeau, F., Pasquale, V., Pellis, G., and Verdoya, M.: Heat flow in the tectonic provinces crossed by the southern segment of the European Geotraverse, Tectonophysics, 244, 57–74, https://doi.org/10.1016/0040-1951(94)00217-W,1995. a, b
Di Giovanni, M., Giunchi, C., Saccorotti, G., Berbellini, A., Boschi, L., Olivieri, M., De Rosa, R., Naticchioni, L., Oggiano, G., Carpinelli, M., D'Urso, D., Cuccuru, S., Sipala, V., Calloni, E., Di Fiore, L., Grado, A., Migoni, C., Cardini, A., Paoletti, F., Fiori, I., Harms, J., Majorana, E., Rapagnani, P., Ricci, F., and Punturo, M.: A Seismological Study of the Sos Enattos Area – the Sardinia Candidate Site for the Einstein Telescope, Seismol. Res. Lett., 92, 352–364, https://doi.org/10.1785/0220200186, 2020. a
Diaferia, G. and Cammarano, F.: Seismic Signature of the Continental Crust: What Thermodynamics Says. An Example From the Italian Peninsula, Tectonics, 36, 3192–3208, https://doi.org/10.1002/2016TC004405, 2017. a, b, c
Dziewonski, A. M. and Anderson, D. L.: Preliminary reference earth model, Phys. Earth Planet. Int., 25, 297–356, https://doi.org/10.1016/0031-9201(81)90046-7, 1981. a
Egger, A., Demartin, M., Ansorge, J., Banda, E., and Maistrello, M.: The gross structure of the crust under Corsica and Sardinia, Tectonophysics, 150, 363–389, https://doi.org/10.1016/0040-1951(88)90075-3, 1988. a, b
Elter, F. M., Corsi, B., Cricca, P., and Muzio, G.: The south-western Alpine foreland: correlation between two sectors of the Variscan chain belonging to “stable Europe”: Sardinia(-)Corsica and the Maures Massif (south-eastern France), Geodin. Acta, 17, 31–40, https://doi.org/10.3166/ga.17.31-40, 2004. a
European Integrated Data Archive: EIDA: European Integrated Data Archive, ORFEUS [data set], https://www.orfeus-eu.org/data/eida/ (last access: 28 February 2024), 2022. a
Faccenna, C., Becker, T. W., Auer, L., Billi, A., Boschi, L., Brun, J. P., Capitanio, F. A., Funiciello, F., Horvàth, F., Jolivet, L., Piromallo, C., Royden, L., Rossetti, F., and Serpelloni, E.: Mantle dynamics in the Mediterranean, Rev. Geophys., 52, 283–332, https://doi.org/10.1002/2013RG000444, 2014. a, b
Fiannacca, P., S., I. S. W. I., and R., C.: Timescales and mechanisms of batholith construction: Constraints from zircon oxygen isotopes and geochronology of the late Variscan Serre Batholith (Calabria, southern Italy), Lithos, 277, 302–314, https://doi.org/10.1016/j.lithos.2016.06.011, 2017. a
Guerri, M., Cammarano, F., and Connolly, J. A. D.: Effects of chemical composition, water and temperature on physical properties of continental crust, Geochem. Geophy. Geosy., 16, 2431–2449, https://doi.org/10.1002/2015GC005819, 2015. a, b, c
Kennett, B. L. N., Engdahl, E. R., and Buland, R.: Constraints on seismic velocities in the Earth from traveltimes, Geophys. J. Int., 122, 108–124, https://doi.org/10.1111/j.1365-246X.1995.tb03540.x, 1995. a
Kikuchi, M. and Kanamori, H.: Inversion of complex body waves, Bull. Seism. Soc. Am., 72, 491–506, 1982. a
Langston, C.: The effect of planar dipping structure on source and receiver responses for constant ray parameter, Bull. Seism. Soc. Am., 67, 1029–1050, 1977. a
Ligorria, J. and Ammon, C.: Iterative Deconvolution and Receiver Function Estimation, Bull. Seismol. Soc. Am., 89, 1395–1400, 1999. a, b
Lowry, A. R. and Pérez-Gussinyé, M.: The role of crustal quartz in controlling Cordilleran deformation, Nature, 471, 353–357, https://doi.org/10.1038/nature09912, 2011. a
Lustrino, M., Fedele, L., Melluso, L., Morra, V., Ronga, F., Geldmacher, J., Duggen, S., Agostini, S., Cucciniello, C., Franciosi, L., and Meisel, T.: Origin and evolution of Cenozoic magmatism of Sardinia (Italy). A combined isotopic (Sr–Nd–Pb–O–Hf–Os) and petrological view, Lithos, 180/181, 138–158, https://doi.org/10.1016/j.lithos.2013.08.022, 2013. a, b
Ma, X. and Lowry, A. R.: USArray Imaging of Continental Crust in the Conterminous United States, Tectonics, 36, 2882–2902, 2017. a
Magrini, F., Diaferia, G., Fadel, I., Cammarano, F., van der Meijde, M., and Boschi, L.: 3-D shear wave velocity model of the lithosphere below the Sardinia–Corsica continental block based on Rayleigh-wave phase velocities, Geophys. J. Int., 220, 2119–2130, https://doi.org/10.1093/gji/ggz555, 2019. a, b, c
Magrini, F., Diaferia, G., El-Sharkawy, A., Cammarano, F., van der Meijde, M., Meier, T., and Boschi, L.: Surface-Wave Tomography of the Central-Western Mediterranean: New Insights Into the Liguro-Provençal and Tyrrhenian Basins, J. Geophys. Res.-Sol. Ea., 127, e2021JB023267, https://doi.org/10.1029/2021JB023267, 2022. a
Malavieille, J., Chemenda, A., and Larroque, C.: Evolutionary model for Alpine Corsica: mechanism for ophiolite emplacement and exhumation of high‐pressure rocks, Terra Nova, 10, 317–322, https://doi.org/10.1046/j.1365-3121.1998.00208.x, 1998. a
Malusà, M., Danišik, M., and Kuhleman, J.: Tracking the Adriatic-slab travel beneath the Tethyan margin of Corsica – Sardinia by low-temperature thermochronometry, Gondwana Res., 31, 135–149, 2016. a
Megna, A. and Morelli, A.: Determination of Moho depth and dip beneath MEDNET station AQU by analysis of broadband receiver functions, Ann. Geophys., 37, 913–928, 1994. a
Piana Agostinetti, N. and Amato, A.: Moho depth and ratio in peninsular Italy from teleseismic receiver functions, J. Geophys. Res.-Sol. Ea., 114, B06303, https://doi.org/10.1029/2008JB005899, 2009. a
Poli, G., Ghezzo, C., and Conticelli, S.: Geochemistry of granitic rocks from the Hercynian Sardinia-Corsica batholith: Implication for magma genesis, Lithos, 23, 247–266, https://doi.org/10.1016/0024-4937(89)90038-8, 1989. a
Pondrelli, S., Di Luccio, F., Scognamiglio, L., Molinari, I., Salimbeni, S., D'Alessandro, A., and Danecek, P.: The First Very Broadband Mediterranean Network: 30 yr of Data and Seismological Research, Seismol. Res. Lett., 91, 787–802, https://doi.org/10.1785/0220190195, 2019. a
Puccini, A., Xhixha, G., Cuccuru, S., Oggiano, G., Xhixha, M. K., Mantovani, F., Alvarez, C. R., and Casini, L.: Radiological characterization of granitoid outcrops and dimension stones of the Variscan Corsica-Sardinia Batholith, Environ. Earth Sci., 71, 393–405, https://doi.org/10.1007/s12665-013-2442-8, 2014. a
Rossetti, F., Cavazza, W., Di Vincenzo, G., Lucci, F., and Theye, T.: Alpine tectono-metamorphic evolution of the Corsica basement, J. Metamor. Geol., 41, 299–326, https://doi.org/10.1111/jmg.12696, 2023. a
Rudnick, R. and Gao, S.: Composition of the Continental Crust, Treat. Geochem., 3, 1–64, 2014. a, b
Sassi, F.: The abundance of 55 elements and petrovolumetric models of the crust in 9 type areas from the crystalline basements of Italy, with some geophysical and petrophysical data, Scritti e Documenti, Accademia Nazionale delle Scienze detta dei XL, 32, https://www.accademiaxl.it/attivita/pubblicazioni/scritti-e-documenti/ (last access: 29 December 2024), 2003. a
van der Meijde, M., van der Lee, S., and Giardini, D.: Crustal structure beneath broad-band seismic stations in the Mediterranean region, Geophys. J. Int., 152, 729–739, https://doi.org/10.1046/j.1365-246X.2003.01871.x, 2003. a
Verdoya, M., Pasquale, V., Chiozzi, P., and Kukkonen, I.: Radiogenic heat production in the Variscan crust: new determinations and distribution models in Corsica (northwestern Mediterranean), Tectonophysics, 291, 63–75, https://doi.org/10.1016/S0040-1951(98)00031-6, 1998. a
Vinnik, L.: Detection of waves converted from P to SV inthe mantle, Phys. Earth Planet. In., 15, 39–45, 1977. a
Vitale Brovarone, A., Groppo, C., Hetényi, G., Compagnoni, R., and Malavielle, J.: Coexistence of lawsonite-bearing eclogite and blueschist: phase equilibria modelling of Alpine Corsica metabasalts and petrological evolution of subducting slabs, J. Metamorph. Geol., 29, 583–600, https://doi.org/10.1111/j.1525-1314.2011.00931.x, 2011. a, b
Vitale Brovarone, A., Beyssac, O., Malavieille, J., Molli, G., Beltrando, M., and Compagnoni, R.: Stacking and metamorphism of continuous segments of subducted lithosphere in a high-pressure wedge: The example of Alpine Corsica (France), Earth-Sci. Rev., 116, 35–56, https://doi.org/10.1016/j.earscirev.2012.10.003, 2013. a, b
Xu, M. and He, J. S.: Python module for batch calculation and postprocessing of receiver functions, Seismological Society of America [data set], 94, 935–43, 2023. a
Zandt, G. and Ammon, C.: Continental Crustal composition constrained by measurements of crustal Poisson's ratio, Nature, 374, 152–154, 1995. a
Zhu, L. and Kanamori, H.: Moho depth variation in southern California from teleseismic receiver functions, J. Geophys. Res., 105, 2969–2980, 2000. a