the Creative Commons Attribution 4.0 License.
the Creative Commons Attribution 4.0 License.
 | 06 Jun 2025
Lithologically constrained velocity–density relationships and vertical stress gradients in the North Alpine Foreland Basin, SE Germany
Peter Obermeier
Florian Duschl
Geophysical properties of the subsurface and the vertical stress acting within are key prerequisites to understanding fundamental geological processes and mitigating risks associated with the economic usage of the subsurface. In SE Germany, the North Alpine Foreland Basin (NAFB) is a well-studied sedimentary basin, which was extensively explored for oil and gas in the last century and which is currently explored and exploited for deep geothermal energy. The up to 5 km thick Cenozoic basin fill comprises mostly shales, marls, sandstones, carbonates, and coarse-grained clastics; in particular, Oligocene–Miocene age sediments display significant lateral lithological variability due to two marine transgressions. In addition, Cenozoic marine sediments in the eastern part of the basin are significantly overpressured. The basin sediments overlay Mesozoic passive margin sediments. Here, karstified Upper Jurassic carbonates represent the main target for deep geothermal exploration and production. Even though the North Alpine Foreland Basin has been well studied during its economic development, the relationships between basic geophysical parameters, such as bulk density and seismic velocity, both of which are key for seismic imaging and the prediction of physical rock properties, have not yet been systematically investigated. The same is true for the distribution of vertical stress gradients, a key input parameter for geomechanical modelling and the prediction of natural and induced seismicity. To improve the understanding of density–velocity relationships and the distribution of vertical stress gradients, we systematically analysed 78 deep wells with total depths of 650–4800 m below ground level, which form two overlapping datasets: bulk density and sonic velocity data from 41 deep boreholes were used to establish velocity–density relationships for the main lithological units in the North Alpine Foreland Basin in SE Germany. We applied these newly derived relationships to velocity data of a second set of 55 wells, which at least penetrated the Cenozoic basin fill section in the study area and spliced resulting bulk densities with measured but scarcer measured bulk density data. We integrated these spliced bulk density profiles to vertical stress to investigate the spatial distribution of vertical stress gradients. Thereby, we observed an eastward decrease in vertical stress gradients, which correlates well with the geological configuration of the North Alpine Foreland Basin in SE Germany. In addition, we investigated the distribution of vertical stress gradients at the top of the economically important Upper Jurassic carbonates. As a practical result, we provide lithologically constrained velocity–bulk density relationships and depth-dependent vertical stress gradient models, which can be used as an improved input for future geophysical, geomechanical, geological, and rock physics studies in the North Alpine Foreland Basin, both in fundamental and applied research contexts.
- Article
(4464 KB) - Full-text XML
- BibTeX
- EndNote


Knowledge of the stress field in the Earth's crust is a key prerequisite to understanding geological processes and mitigating risks associated with the economic usage of the subsurface (Allen and Allen, 2013; Zoback, 2007). Hereby, vertical stress is often assumed to be one of the principal stresses of the stress tensor, and the first stress to be estimated since its magnitude at any depth largely depends on the weight of the overlying material (Zoback, 2007). The weight of the overlying sediments can be estimated if the bulk density of the material is known. Bulk density in the subsurface can be determined along boreholes by measuring the energy loss between a gamma ray source and a detector (Asquith and Krygowski, 2004). The bulk density of rocks thereby averages the density of the grains or matrix of the rock and the fluid stored in its pore space, and it is therefore directly related to the rock's porosity and fracture density (Asquith and Krygowski, 2004). Acoustic wave velocity through rocks (or its inverse, the acoustic slowness) typically correlates well with the bulk density and porosity of different rock types. Several authors have investigated this correlation and established relationships that are widely used in geophysics and rock physics applications (e.g. Gardner et al., 1974; Medici et al., 2023; Raiga-Clemenceau et al., 1986; Wyllie et al., 1956; Zhang, 2011). In sedimentary basins, the bulk density typically increases with depth due to compaction (Allen and Allen, 2013), which also impacts the increase in vertical stress as a function of vertical depth below ground level, also known as vertical stress gradient. The intensification of compaction is often highest at shallow depth before it converges towards grain or matrix densities of the buried sediments at greater depths. This reduction in matrix porosity or increase in bulk density with increasing depth has previously been described by exponential or logarithmic functions for sedimentary rocks (e.g. Athy, 1930; Sclater and Christie, 1980; Yang and Aplin, 2004; Couzens-Schultz and Azbel, 2014).
In this study, we use data from 78 deep wells to investigate velocity–bulk density relationships of main lithological units (MLUs) and the distribution of vertical stress gradients in the SE German part of the North Alpine Foreland Basin by (i) correlating (depending on the lithological composition) acoustic velocities from high-resolution sonic logs with quality-controlled bulk density logs from 41 wells by modifying Gardner's relationship (Gardner et al., 1974); (ii) establishing a shallow bulk density depth model calibrated to bulk density and bulk-density-transformed velocity data from all wells; (iii) applying the lithologically constrained velocity–bulk density relationships to velocity data to complement bulk density profiles along 55 boreholes, which have at least penetrated the entire Cenozoic basin fill; and (iv) integrating the derived bulk density profiles into vertical stress to acquire vertical stress gradient profiles at each of these 55 drilling locations and to derive geographically constrained vertical stress gradient models as a function of true vertical depth below ground level. The resulting distribution of vertical stress gradients is shown on maps and placed into context with the geological conditions and deep geothermal energy use in the North Alpine Foreland Basin (NAFB) in SE Germany.
2.1 Geological setting
The North Alpine Foreland Basin (NAFB) is located in central Europe and extends from Lake Geneva in the west to Upper Austria in the east (Kuhlemann and Kempf, 2002). Our study area encompasses the SE German (Bavarian) part of the NAFB. The NAFB deepens towards the Northern Alps (Fig. 1a). In front of the Northern Alps, the undeformed foreland part of the Cenozoic basin fill (Foreland Molasse) is separated from its deformed part (Subalpine Molasse) and the Northern Alps (Fig. 1b). Here, the Foreland Molasse reaches a thickness of up to 5 km (Bachmann and Müller, 1992; Bachmann et al., 1987; Lemcke, 1973; Pfiffner, 1986). This asymmetric wedge shape (Fig. 1b) was generated by the flexural subsidence of the European plate in consequence of the continental convergence of the African and European plates and is filled with Cenozoic molasse sediments (Bachmann and Müller, 1996; Bachmann et al., 1987; Pfiffner, 1986) (Fig. 2). The lateral extent of the Subalpine Molasse, which is largest in the western part of the study area, reflects the clockwise rotation during the Late Oligocene–Early Miocene and an associated westward increase in strain (Ortner et al., 2015). Below the Cenozoic basin fill, Mesozoic passive margin sediments and Variscan crystalline basement rocks with sporadic Permo-Carboniferous sediment troughs can be found (Bachmann et al., 1987). Mesozoic passive margin sediments comprise Triassic–Middle Jurassic clastic sediments, Upper Jurassic platform carbonates, and Cretaceous clastic sediments. Thereby, Triassic–Middle Jurassic clastic sediments are missing in the eastern part of the study due to erosion, and Cretaceous–Eocene sediments are missing in the western part, with an SE–NW-increasing erosion (Bachmann et al., 1987). The sedimentary succession of the Cenozoic can be attributed to two transgressive–regressive megacycles, both of which are defined by an eastward marine regression changing the depositional environment from a marine to a terrestrial setting (Fig. 2). Consequently, terrestrial sediments (sandstones) dominate in the western part, while marine sediments (shales and marls) prevail in the eastern part of the Cenozoic basin fill of the NAFB in SE Germany (Bachmann and Müller, 1996; Bachmann and Müller, 1992; Bachmann et al., 1987; Kuhlemann and Kempf, 2002). Since the Late/Middle Miocene, sand and coarse-grained clastics have been deposited (Kuhlemann and Kempf, 2002) (Fig. 2).
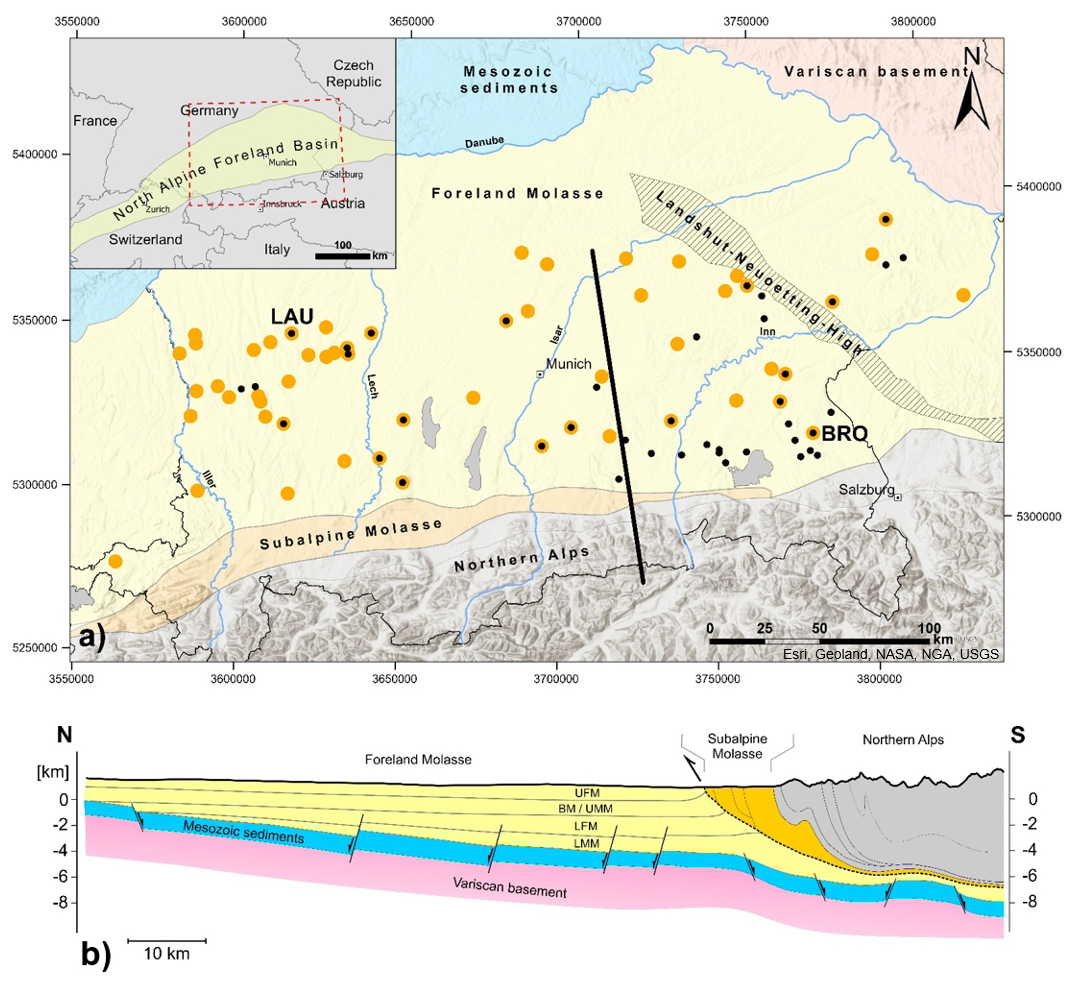
Figure 1Location and overview of the study area and well datasets used. (a) Study area and well locations used for the calibration of the velocity–bulk density transforms (Dataset I with black markers) and for the generation of vertical stress gradient profiles (Dataset II with orange markers). The Lauterbach 1 (LAU) and Bromberg 1 (BRO) wells are highlighted to showcase bulk density profiles in Fig. 5b and c. The inset in the upper-left corner shows an overview map of the North Alpine Foreland Basin after Kuhlemann and Kempf (2002) and the extent of the map (dashed red box). (b) Schematic cross-section (black line in Fig. 1a) showing the asymmetric basin geometry and main stratigraphic units from north to south (modified after Bachmann and Müller, 1981, and Lemcke, 1988).
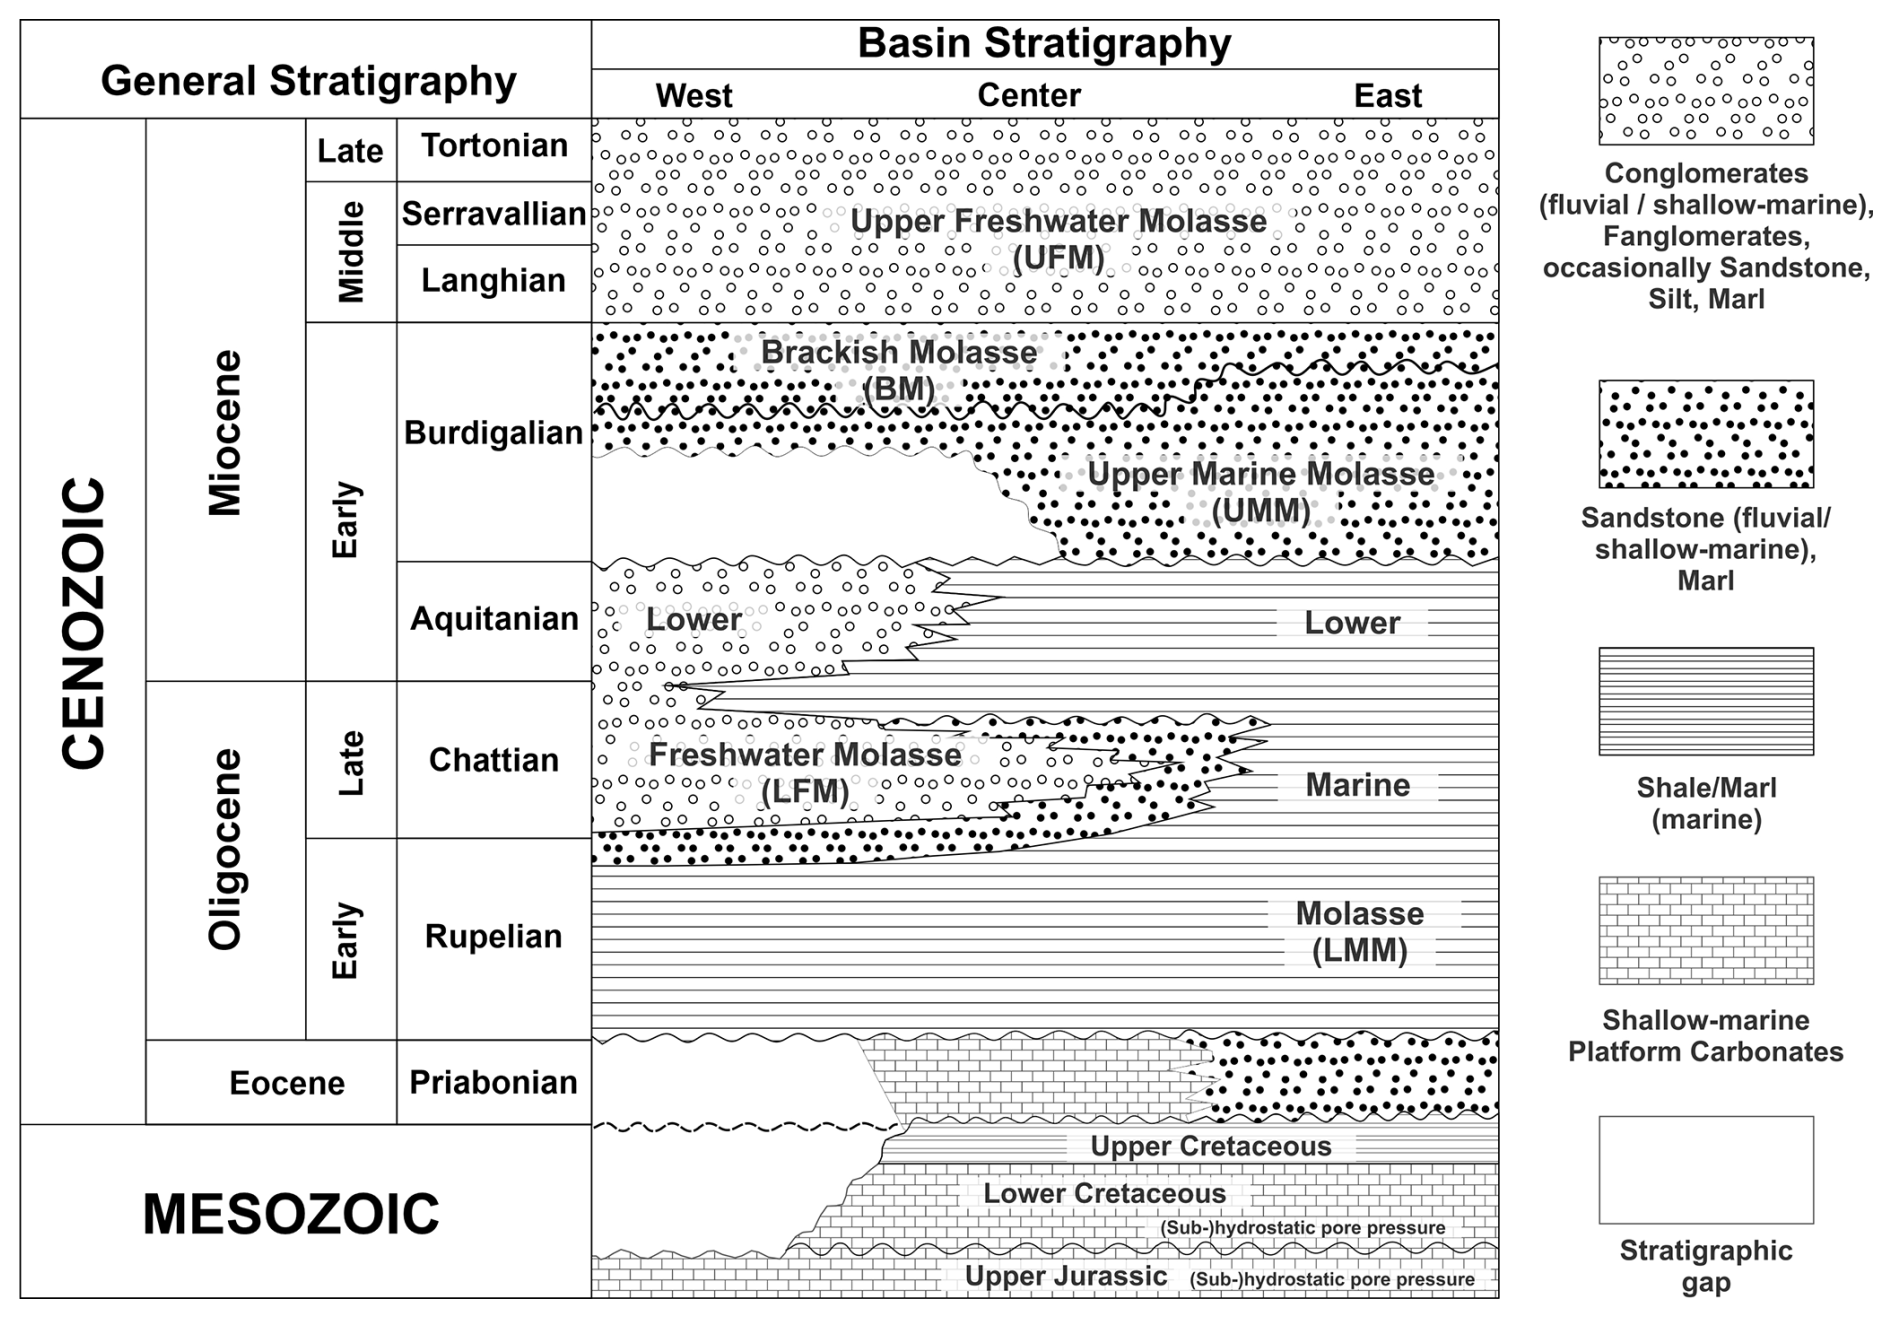
Figure 2Chronostratigraphic chart of the North Alpine Foreland Basin in SE Germany modified from Drews et al. (2018) after Kuhlemann and Kempf (2002) and Bachmann and Müller (1992).
2.2 Previous studies addressing velocity–density relationships and vertical stress
The NAFB in SE Germany was extensively explored by the oil and gas industry from the 1950s to the 1980s (Bachmann et al., 1981; Lemcke, 1979) and has been explored more recently for deep geothermal energy extraction (Flechtner and Aubele, 2019; Schulz et al., 2017). Hereby, knowledge of stress magnitudes is critical to mitigate drilling and production risks such as wellbore instabilities and induced seismicity, in particular for deep geothermal energy drilling and production (Drews et al., 2022; Megies and Wassermann, 2014). Overall, more than 900 deep wells have been drilled in the SE German part of the NAFB, and, along a few of them, bulk density, sonic, and/or seismic interval velocities were measured, but these measurements only recently became publicly accessible (Großmann et al., 2024). As a consequence, stress magnitudes and even the stress regime of the NAFB are subject to controversy in the scientific community. While this controversy mostly addresses the magnitudes of horizontal stresses (Budach et al., 2018; Drews and Duschl, 2022; Drews et al., 2019; Seithel et al., 2015; von Hartmann et al., 2016; Ziegler and Heidbach, 2020), the vertical stress, which is actually much easier to estimate, has only been addressed and examined by a few studies so far. Thereby, most studies estimated vertical stress as a necessary requirement to investigate other geomechanical phenomena. While some studies assumed a constant vertical stress gradient (Seithel et al., 2015) or average bulk density values per stratigraphy (Budach et al., 2018) published from other areas of the NAFB (Leu et al., 2006), others introduced compaction-dependent vertical stress estimates (Drews et al., 2018; Drews and Duschl, 2022; Drews et al., 2020; Drews et al., 2019). Regional studies utilize numerical modelling to estimate vertical stress (Ahlers et al., 2021, 2022; Ziegler and Heidbach, 2020; Ziegler et al., 2016) but are subject to large uncertainties due to data limitations.
Only very few studies incorporated bulk density and velocity data to analyse compaction or stress in the NAFB (Drews et al., 2018; Drews and Duschl, 2022; Drews et al., 2020; Drews et al., 2019; Lohr, 1969, 1978). Lohr (1969, 1978) found that seismic velocities in the NAFB increase towards the south and west and attributed this effect to a general increase in stress magnitudes. More recent studies investigated velocity, density, and vertical stress as means to predict the occurrence of pore fluid overpressure (short: overpressure) in the NAFB. Overpressure is present due to high sedimentation rates during Late Oligocene and Early Miocene times (Drews et al., 2018; Zweigel, 1998) and can be found in Oligocene and Upper Cretaceous sediments (Drews et al., 2018; Müller and Nieberding, 1996; Müller et al., 1988), which is reflected by low interval velocities (Drews et al., 2018; Drews and Duschl, 2022; Rizzi, 1973; Shatyrbayeva et al., 2024). Since disequilibrium compaction is believed to be the main overpressure mechanism (Drews et al., 2018, 2020), the presence of overpressure possibly impacts bulk density and thus vertical stress. Overpressure appears in the southern and southeastern parts of the study area and roughly follows the distribution of Upper Cretaceous shales, which are missing in the northwestern part of the study area (Drews et al., 2018; Shatyrbayeva et al., 2023, 2024). The top of overpressure is usually tied to the top of Oligocene shales and is not found at depths above 1500 m below ground level (Drews et al., 2018; Shatyrbayeva et al., 2023). In contrast, Lower Cretaceous and Upper Jurassic carbonates roughly follow the hydraulic head of the Danube River in the north over geological timescales and are underpressured (Lemcke, 1976), which can result in a sharp pressure contrast in comparison to overpressured Cretaceous–Oligocene sediments (see Drews et al., 2022).
To investigate the relationship between shale compaction and vertical effective stress, Drews et al. (2018, 2019) fitted an Athy-type porosity decay function (Athy, 1930) modified for vertical effective stress to an average bulk density profile based on bulk density and velocity data from a few wells to integrate vertical stress profiles. They also found that Gardner's average velocity–bulk density relationship (Gardner et al., 1974) reasonably captures the velocity–bulk density correlation of sediments in the NAFB in SE Germany, but they only presented a model, which reflects the average bulk density profile along the investigated wells. Drews and Duschl (2022) used the same Athy-type porosity decay function to model vertical stress in 18 deep wells distributed along both sides of the Subalpine Molasse. They found that vertical stress gradients are mainly increasing towards the Subalpine Molasse and southward of it and, in a less pronounced fashion, also from east to west. Drews and Duschl (2022) interpreted the southward increase to be a result of increased horizontal compaction towards the Alps and the eastward decrease to reflect changes in lithological composition and undercompaction due to overpressure presence.
2.3 Geothermal energy extraction in the NAFB
Since the early 2000s, the NAFB in SE Germany has been subject to deep geothermal energy extraction (Schulz et al., 2017). To do so, hydrothermal doublets, consisting of a production and an injection well, typically produce thermal water from karstified Upper Jurassic carbonates at depths of 1500–4500 m below ground level. Hereby, temperatures and flow rates between 60–160 °C and 50–200 L s−1 are achieved. The extracted heat is mostly used for district heating but also for electricity generation (BVG, 2024). Before 2024, more than 70 deep geothermal wells were drilled at 25 locations, and currently more than 40 projects with at least one production and injection well are planned to be realized to boost the decarbonization of heating in SE Germany in the next 5–10 years. Hereby, knowledge of geophysical and geomechanical properties of the subsurface is critical to minimize risks associated with geothermal exploration, drilling, and production: not all geothermal wells found an economical amount of the thermal water resource (Flechtner and Aubele, 2019), and productivity correlates with vertical effective stress (Bohnsack et al., 2020). Furthermore, the relationship between density and velocity is important for processing and depth-migrating seismic reflection surveys to properly assess the depth and quality of the Upper Jurassic thermal aquifer in the exploration stage. Likewise, vertical stress is an important input parameter for geomechanical studies to mitigate drilling risks that often occur, such as elevated pore pressures and wellbore instabilities (Drews et al., 2022), and to optimize injection well placement to minimize the risk of previously reported induced seismicity (Megies and Wassermann, 2014).
In total, the dataset comprises 78 deep oil and gas wells with a depth range from 650 to 4800 mTVD drilled in the North Alpine Foreland Basin in SE Germany (see Großmann et al., 2024, for a detailed description of the data sources). A total of 62 wells are vertical or show vertical deviations of less than 5 m from true vertical depth (TVD) below ground level. The measured depths of all wells were converted to true vertical depth using provided well deviation surveys and the minimum curvature method. We split the dataset into two subsets to establish lithologically constrained velocity–bulk density relationships (Dataset I) and to use these relationships to generate and model continuous bulk density and vertical stress profiles along deep wells in the NAFB in SE Germany (Dataset II) (Fig. 1a and Table 1). Dataset I contains 41 wells with overlapping sonic velocity and bulk density data from geophysical borehole measurements and lithological information from cutting descriptions. Across all 41 wells, Dataset I covers all stratigraphic units encountered above the top of the Upper Jurassic. However, not all wells of Dataset I cover the full stratigraphic column from the surface to the Upper Jurassic. Dataset II encompasses 55 wells which have at least penetrated the entire Cenozoic basin fill and which have either measured bulk density, sonic velocity, and/or seismic interval velocity in addition to lithological information from cutting descriptions. Seismic interval velocities are derived from vertical seismic profiles and checkshots. Information on stratigraphic tops and cutting descriptions are extracted from geological end of well reports. In addition, wells of Dataset II are not allowed to have data gaps larger than 30 m, except for the shallow section (< 1500 m vertical depth below ground level). A total of 18 wells are part of both Dataset I and Dataset II (Table 1).
Table 1Well names, well locations, dataset membership, and composition of the complete density profiles by data source in percent.
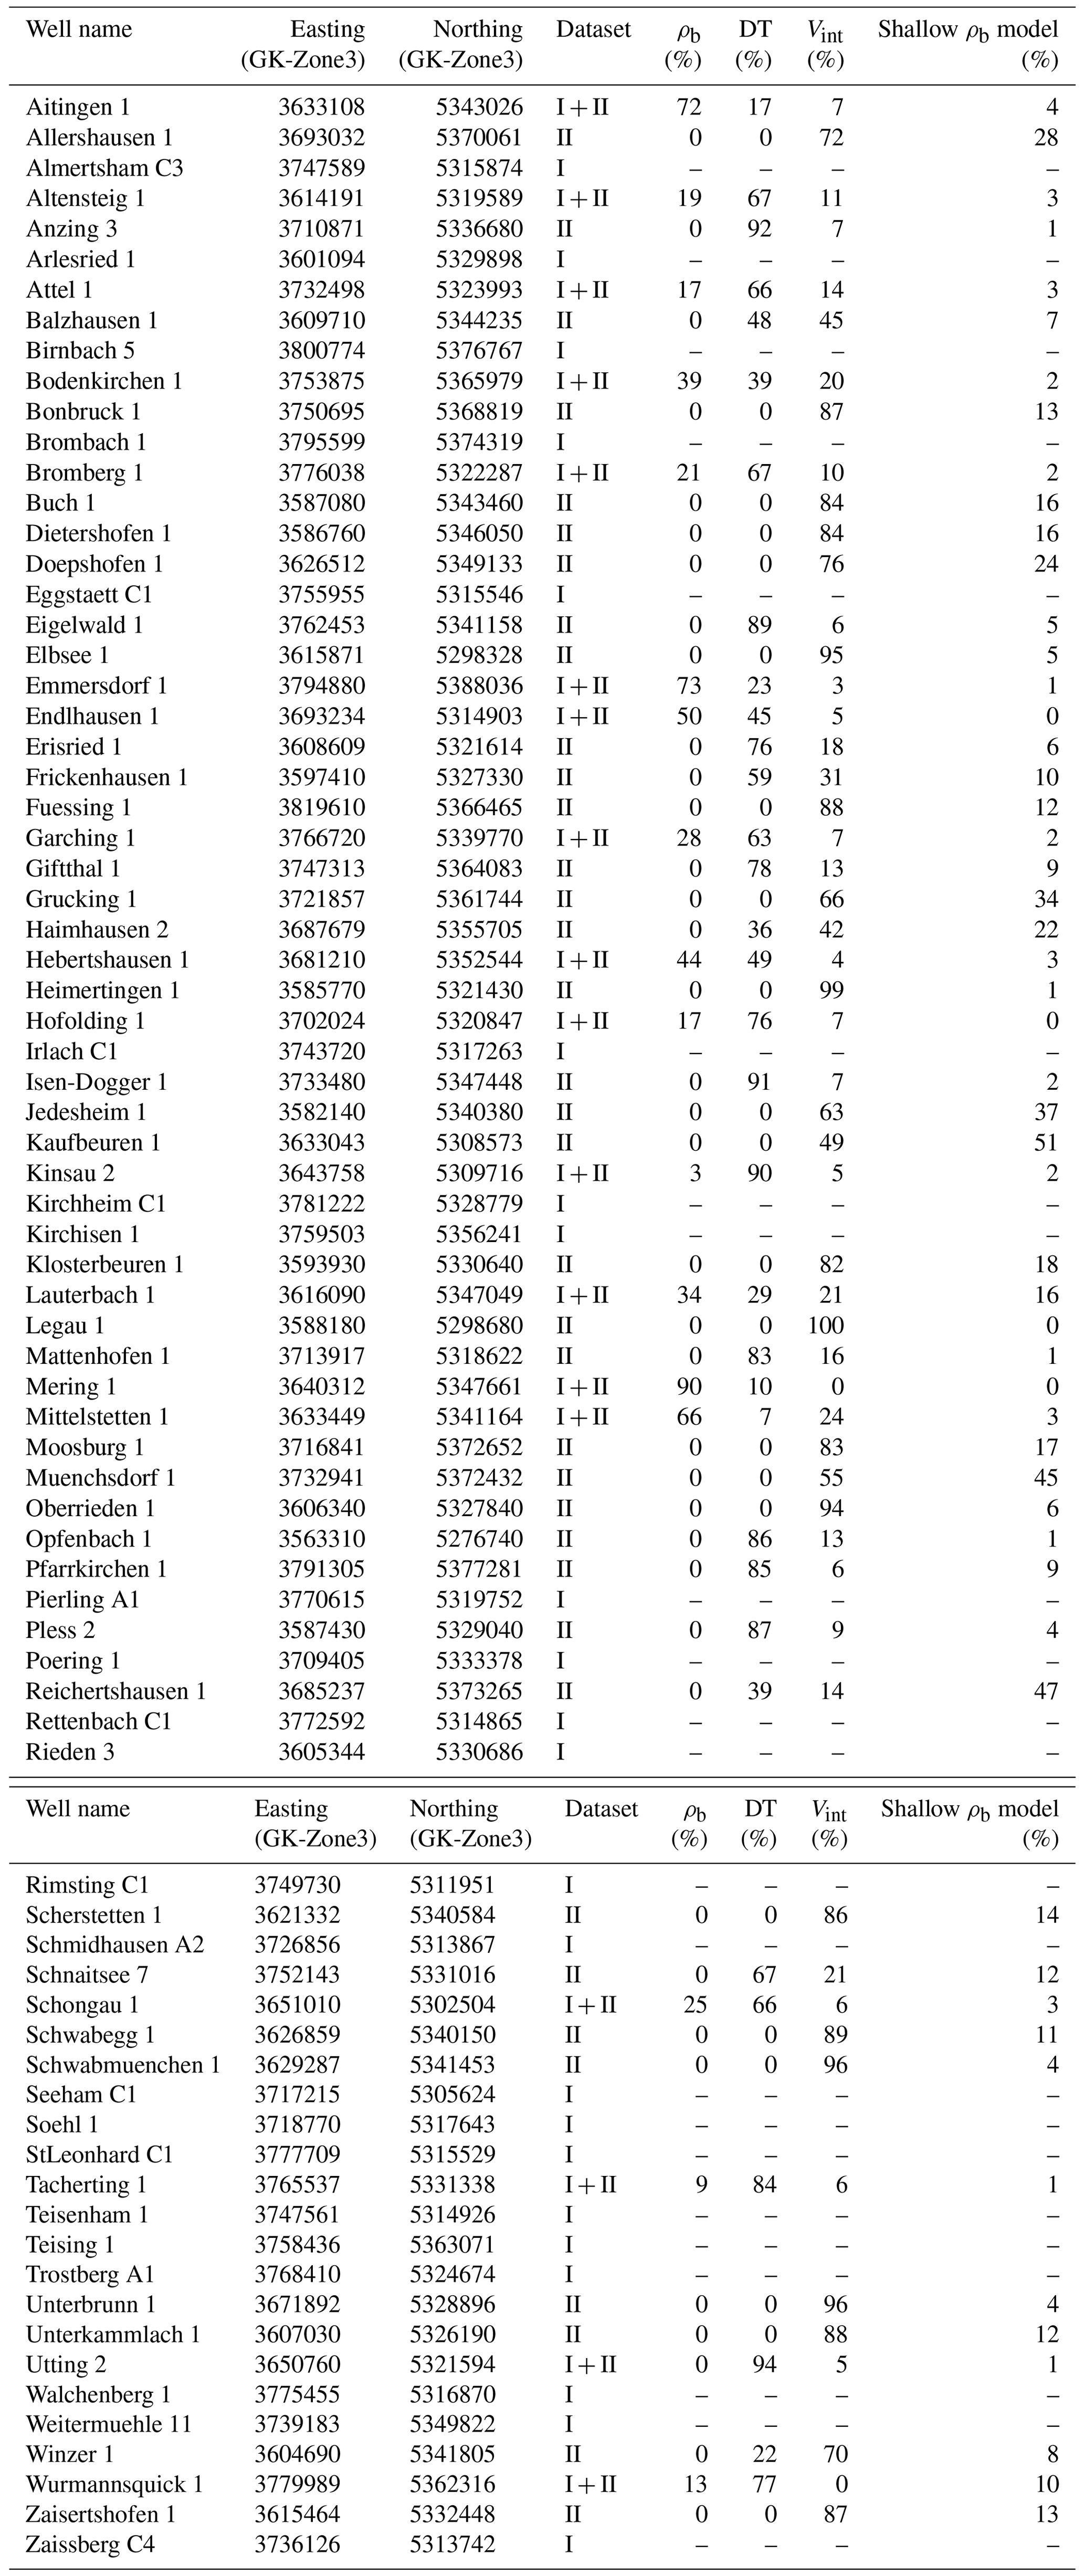
ρb: quality-controlled bulk density data from bulk density log; DT: sonic velocity data from sonic log; Vint: seismic interval velocity data from vertical seismic profiles of checkshots; shallow ρb model: shallow bulk density model (Eq. 4).
In order to establish lithologically constrained velocity–bulk density relationships and to generate and model vertical stress gradient profiles, we follow a four-step workflow, which will be explained in more detail in the subsections below:
-
We retrieve standardized lithological information and quality control of bulk density data.
-
We establish lithologically constrained velocity–bulk density relationships based on wellbores, along which both bulk density and sonic velocity are measured.
-
We generate complete bulk density profiles along wellbores which at least penetrated the Cenozoic basin fill by splicing bulk density data and bulk-density-transformed velocity data (using the velocity–bulk density relationships from step 2) with modelled densities in the shallow section; this step includes a homogenization of lithostratigraphic information from cutting descriptions with bulk density and sonic/seismic velocity data from geophysical borehole logging.
-
We integrate continuous bulk density profiles from step 3 to calculate vertical stress gradient profiles and establish practical vertical stress gradient models as a function of true vertical depth below ground level.
3.1 Lithological information and quality control of bulk density data
3.1.1 Lithological information
Lithological information is required to constrain lithology-dependent velocity–bulk density relationships and to use these relationships to transform velocity to bulk density where no measured bulk density data were available. We grouped lithological information from cutting descriptions of Mesozoic and Cenozoic sections of the analysed wells into five main lithological units: coarse-grained clastics (gravel and conglomerates), carbonates (limestones, dolostones), sandstones (clean, marly, or clayey calcareous and siliciclastic sandstones and siltstones), marls (clean, silty, or sandy marls), and shales (clean, silty, or marly clays and claystones). Other lithologies, such as coal, have only been recorded in accessory amounts and are neglected in our study.
Two deep wells in the southwest of the study area, Heimertingen 1 and Legau 1, only have little or no lithological information from cutting descriptions or core samples. However, both wells are important for geographic coverage of the study area, and we generated average synthetic lithological columns based on the information of the immediate offset wells.
3.1.2 Quality control of bulk density data
Bulk density data in the NAFB are often impeded by borehole breakouts and washouts (cf. Reinecker et al., 2010). Since the bulk density tool requires physical contact with the borehole wall, the quality of bulk density data is challenged in these intervals. To exclude sections of questionable quality from the bulk density dataset, we use two quality measures.
The ratio between the actual borehole diameter from the caliper log and the drill bit size used is not allowed to exceed a critical value of 1.10. This value was chosen as the cut-off to have the best balance between data quality and geographical coverage.
The bulk density correction value DRHO, which is an indicator of the quality of the measurement at each data point, must be lower than 0.05 g cm−3.
These strict cut-off values delimit the number of utilized bulk density–sonic data pairs by 51% but simultaneously ensure reproducible data quality.
3.2 Lithologically constrained velocity–bulk density relationships
We establish lithologically differentiated velocity–bulk density relationships by fitting Gardner's relationship (Gardner et al., 1974) to Dataset I:
where ρb is the modelled bulk density value (g cm−3); Vp is the measured sonic or seismic interval velocity (m s−1); and A and B are lithology-dependent constants, which, according to Gardner et al. (1974), provide a reasonable fit to mixed lithology datasets if A and B are set to 0.23 and 0.25, respectively. We iteratively fit Eq. (1) to our lithologically differentiated Dataset I by changing A and B with a constraint precision of such that the sum of the squared differences between the calculated and measured densities becomes minimal. For realistic ranges of bulk density (1.5–3.0 g cm−3) and interval velocity (1500–6000 m s−1), A and B will result in value combinations which follow a logarithmic relationship (Fig. 3):
where a and b define the curvature of the relationship and the minimum value of B and typically take values of −0.12 to −1.10 and 0.05 to 0.11, respectively, for the mentioned parameter space (shaded grey area in Fig. 3). Thereby, low A and high B combinations refer to steep velocity–bulk density relationships which are typical for softer “compressible materials”. In contrast, high A and low B combinations reflect sediments where bulk density is not changing as fast with velocity, which is typical for more competent or “incompressible materials” (cf. Gardner et al., 1974).
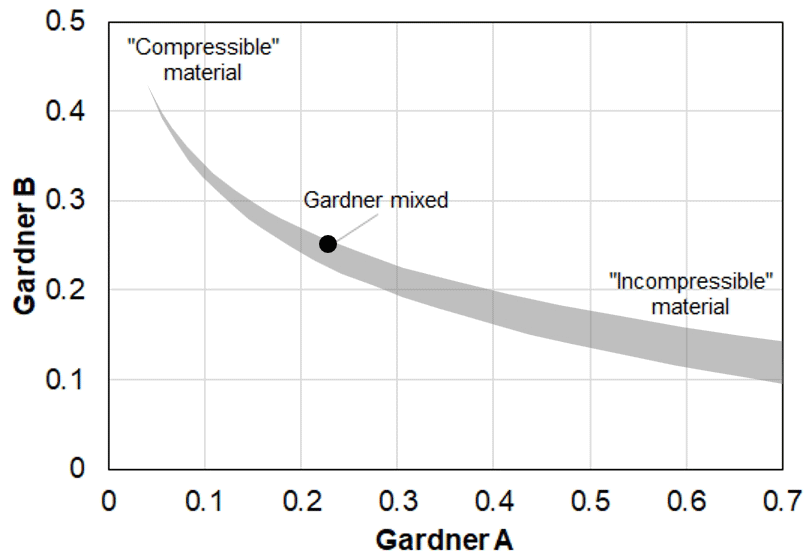
Figure 3Theoretically possible range for Gardner A and B (grey area) for natural occurring bulk rock densities (1.5–3.0 g cm−3) and velocities (1500–6000 m s−1). The black dot “Gardner mixed” marks the A–B combination (A= 0.23, B= 0.25) for mixed lithologies after Gardner et al. (1974).
3.3 Continuous bulk density profiles
Along each well of Dataset II, we generate continuous bulk density profiles, which cover the entire Cenozoic basin fill and, if present, sediments of Cretaceous age. We generate a homogenized dataset with quality-controlled bulk density data, sonic and seismic interval velocity data, and lithostratigraphic information from cutting descriptions from Dataset II. Since the cutting descriptions apply to larger intervals than the measured bulk density and velocity data, we defined a desired interval length of 2 m, which proved to be the best compromise between highest possible resolution, minimization of outliers due to averaging, and least number of intervals without data. Each interval must cover only a single stratigraphic and lithological section, which might result in slight deviations from the desired 2 m interval size.
The generation of continuous bulk density profiles follows a hierarchical approach. Quality-controlled bulk density logs are the preferred data source. Gaps in the quality-controlled bulk density logs are then primarily filled by transforming firstly sonic velocity and secondly seismic interval velocity to bulk density using Gardner's relationship (Gardner et al., 1974; Eq. 1) with lithologically constrained A and B parameters according to the main lithological unit of the depth interval. The remaining gaps with intervals > 30 m, which are exclusively present in the shallow section (TVD < 1500 m), are filled with a lithology-dependent bulk density model, which we fit to available shallow bulk density data from all wells. Finally, we apply a 30 m moving average window filter to the entire spliced bulk density dataset to smooth outliers and to close remaining data gaps.
3.3.1 Bulk density from checkshots and vertical seismic profiles
In intervals where neither bulk density nor sonic velocity data are available, seismic interval velocity from checkshots or vertical seismic profiles is converted to bulk density. However, intervals measured by vertical seismic profiles or checkshots often cover several depth intervals with different main lithological units (MLUs). Here, we estimate Gardner's A by calculating an average weighted by the thickness hMLU of each main lithological unit MLU covered by the measured velocity interval dTVD:
where is Gardner's A of the ith main lithological unit MLU (there are five MLUs) and the sum of all thicknesses of all main lithological units is the covered depth interval dTVD. Subsequently, Gardner's B is derived by using in Eq. (2).
3.3.2 Shallow bulk density profiles
Intervals without any measured log data over a length of more than 30 m only occur in shallow well sections. Since these intervals are above the shallowest recorded top of overpressure of 1500 m (cf. Drews et al., 2018; Shatyrbayeva et al., 2023), we model bulk density ρb in these intervals as a function of true vertical depth (TVD) below ground level (in m) for each defined main lithological unit with an Athy-type compaction function adjusted for density increase with increasing depth (Couzens-Schultz and Azbel, 2014):
where ρmax is the maximum bulk density occurring above a TVD < 1500 m, ρsurf is the average surface bulk density, and C is a compaction constant. We then fit Eq. (4) for each main lithological unit to bulk density–depth pairs from all wells with respective data above 1500 m and an interval size of 1 m by adjusting ρmax, ρsurf, and C and by iteratively minimizing the sum of squared differences between the measured and modelled densities with a constraint precision of .
3.4 Vertical stress gradient profiles and models
3.4.1 Integration of bulk density to vertical stress and calculation of vertical stress gradient profiles
Vertical stress Sv (in MPa) at any true vertical depth (TVD) below ground level (in km) is calculated by using the average weight of the overlying material:
where is the average bulk density of the overlying material (in g cm−3) and g is the Earth's gravitational acceleration at 9.81 m s−2. We then calculate vertical stress gradients by dividing Sv by TVD (in km):
where ∇Sv is the vertical stress gradient (in MPa km−1).
3.4.2 Vertical stress gradient modelling
Since we expect bulk density to increase with depth due to increasing sediment compaction, we model the vertical stress gradient (in MPa km−1) as a function of TVD (in m) using a power law relationship:
where is the modelled vertical stress gradient at TVD (in m) and is the starting vertical stress gradient close to surface. α and β are fitting parameters which we determine by iteratively minimizing the sum of the squared differences between actual and modelled vertical stress gradients with a constraint precision of .
4.1 Velocity–bulk density relationships for the main lithology units in the NAFB
The calibration of Gardner's A and B (Gardner et al., 1974) to data pairs of quality-controlled bulk density and sonic velocity measurements of Dataset I results in distinct A–B combinations for the investigated main lithological units, which fall into the corridor of realistic velocity–bulk density combinations (Fig. 4a). The correlation between A and B can be described by a logarithmic relationship (see Fig. 4a and Eq. 2), where, for our Dataset I, a and b of Eq. (2) become −0.105 and 0.0966, respectively (Fig. 4a). Hereby, the established trendline plots at the upper limit of possible A–B combinations and is in line with Gardner's mixed lithology combination of A= 0.23 and B= 0.25 (Fig. 4a).
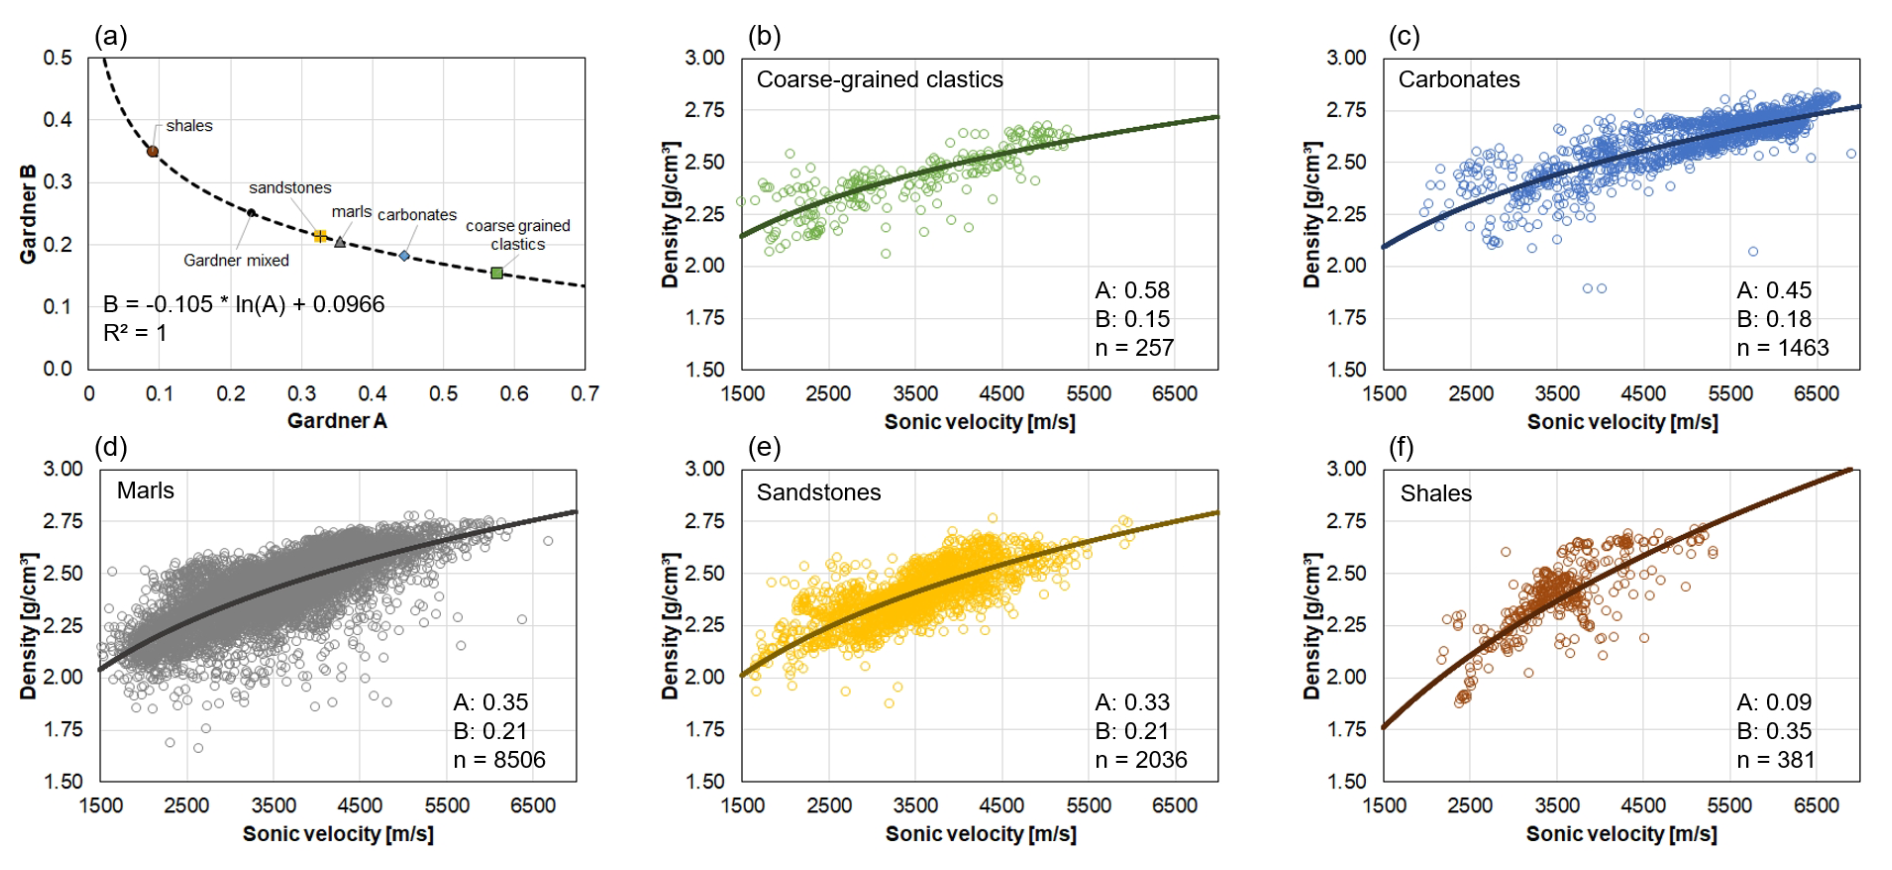
Figure 4Lithologically calibrated velocity–bulk density relationships based on Gardner et al. (1974). (a) Relationship between A–B parameters for the main lithological units. A–B parameters were fitted to quality-controlled velocity–bulk density relations for (b) coarse-grained clastics, (c) carbonates, (d) marls, (e) sandstones, and (f) shales.

Figure 5Bulk density profiles. (a) Shallow bulk density profiles for each main lithological unit (lines) fitted to quality-controlled and transformed bulk density data from all wells with available data. R2 values for the bulk density models of coarse-grained clastics, sandstones, carbonates, marls, and shales are 0.56, 0.82, 0.54, 0.87, and 0.50, respectively. (b) Example of a spliced and averaged bulk density profile for the shallow Lauterbach 1 well in the northwestern part of the study area (LAU in Fig. 1a). (c) Example of a spliced and averaged bulk density profile for the deep Bromberg 1 well in the southeastern part of the study area (BRO in Fig. 1a). The pie chart insets of panels (b) and (c) indicate the coverage by quality-controlled bulk density data (blue), transformed density from sonic velocity (orange), seismic interval velocity from vertical seismic profiles (VSP) or checkshots (grey), and the shallow bulk density model (yellow) (Table 1).
In addition to the relationship between Gardner's A and B parameters, our results also confirm that stiffer or rather incompressible lithologies such as coarse-grained clastics (Fig. 5b) and carbonates (Fig. 5c) follow a less steep (higher A, lower B) velocity–bulk density relationship when compared to marls (Fig. 5d), sandstones (Fig. 5e), and shales (Fig. 5f), whose velocity–bulk density relationships can be described with lower A and higher B values. The results also indicate that marls and sandstones show very similar properties and velocity–bulk density relationships.
It should be noted that the resolution of lithological information from cutting descriptions is typically ≥ 5 m, which might result in the mixing of lithologies where the lithological variations are below this resolution. Thin-bedded intercalations of sandstones and marls have been reported especially for Late Oligocene and Early Miocene sediments in the western and central part of the study area (Kuhlemann and Kempf, 2002) and might explain the similarity in our results between marls and sandstones. Also, it is important to understand that we assume that the grouped and investigated main lithological units are representative for the entire study area. However, the basin fill of the NAFB is a result of different routing systems with variable mineralogical composition of the respective sources (Kuhlemann and Kempf, 2002), which might explain the rather large uncertainty around the fitted velocity–bulk density relationships. Nevertheless, since we grouped several lithologies, we believe that our results represent valid average relationships on a basin scale. Also, due to lack of high-quality bulk density data, it was not possible to investigate sub-regional variations.
4.2 Bulk density profiles
Based on the established values for Gardner's A and B parameters for the main lithological units of the SE German part of the NAFB (see Fig. 4), sonic and seismic interval velocities were transformed to bulk density and spliced with quality-controlled bulk density data for each well of Dataset II. Remaining gaps with intervals ≥ 30 m exclusively remain in the shallow section (TVD ≤ 1500 m). To fill these gaps, we fitted Eq. (2) to shallow bulk density and transformed bulk density (from sonic or seismic interval velocity) data from all wells for each main lithological unit (Fig. 5a). The fitting values for the varied parameters ρmax, ρsurf, and C are listed in Table 2. In concordance with the established velocity–bulk density relationships (cf. Fig. 4), shales show the fastest compaction (highest compressibility) and the lowest surface bulk density (Fig. 5a). Compaction in the shallow section is very similar for all other main lithological units except for carbonates, which compact fast towards high densities close to grain densities of carbonates (cf. Gardner et al., 1974).
Table 2Shallow (< 1500 m) bulk density modelling parameters for the main lithological units.
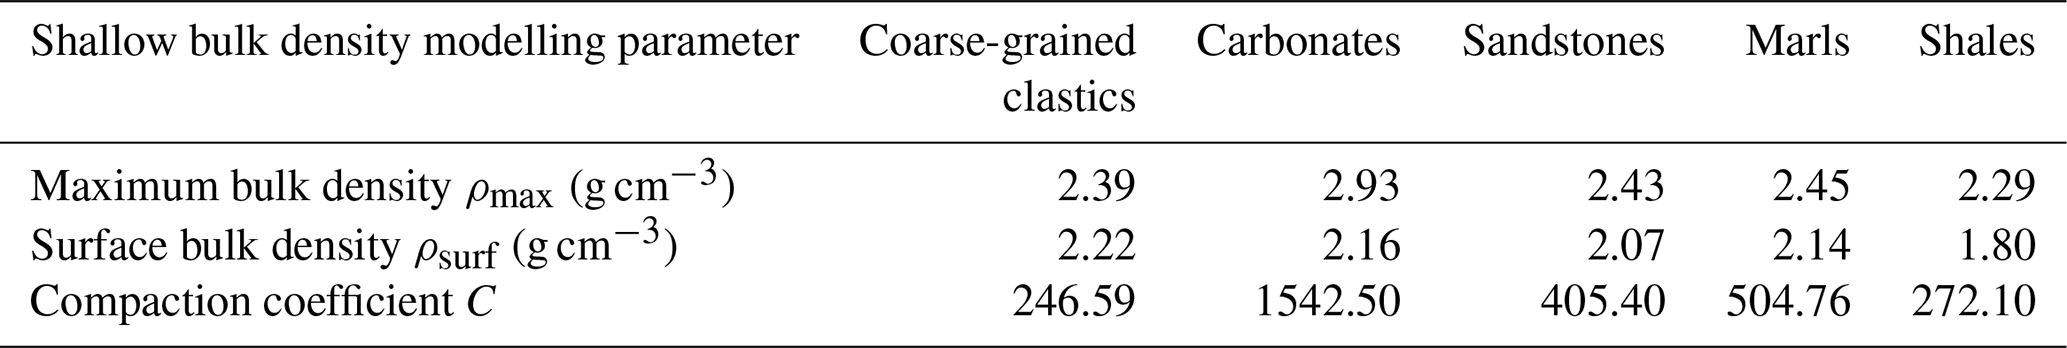
Complete bulk density profiles after splicing quality-controlled bulk density data, densities transformed from sonic and seismic interval velocities, and the shallow bulk density model show reasonable alignment between the different data sources (Fig. 5b and c). The largest deviations are observed towards higher densities from transformed vertical seismic profiles and checkshots (see elevated densities from seismic interval velocities at 400 and 500 m in Fig. 5b and c, respectively), which could be due to the mixing of several main lithological units within the measured intervals or the typically lower acoustic wave frequency of these measurements, when compared to sonic velocity measurements (cf. Zoback, 2007). Although we applied rather rigorous cut-offs for borehole enlargements and bulk density corrections to quality-controlled bulk density data, obvious outliers remain (see negative spikes of bulk density data at 1070 m in Fig. 5b and between 1400 and 1750 m and at 4100 m in Fig. 5c). However, for subsequent vertical stress integration, a moving average window of 30 m was applied to remove these outliers and to close remaining gaps with intervals ≤ 30 m (black lines in Fig. 5b and c), resulting in realistic and complete average bulk density profiles.
4.3 Vertical stress gradient distribution in the NAFB
Vertical stress gradients were calculated after integrating the complete bulk density profiles at each well location of Dataset II to vertical stress. Vertical stress gradients decrease from west to east, which is in concordance with previous investigations of vertical stress gradients along the Subalpine Molasse (Drews and Duschl, 2022). While this trend is less pronounced at shallower depths (Fig. 6a), deeper wells in the western part of the study area display vertical stress gradients which are up to 1.5 MPa km−1 higher when compared to wells located in the east of the study area at comparable depths (Fig. 6b and c). At 3 km true vertical depth below ground level, this gradient difference can cumulate to absolute vertical stress magnitude differences of 4.5 MPa. Note that, since the NAFB deepens from north to south in the study area, fewer wells become available with each horizontal slice.
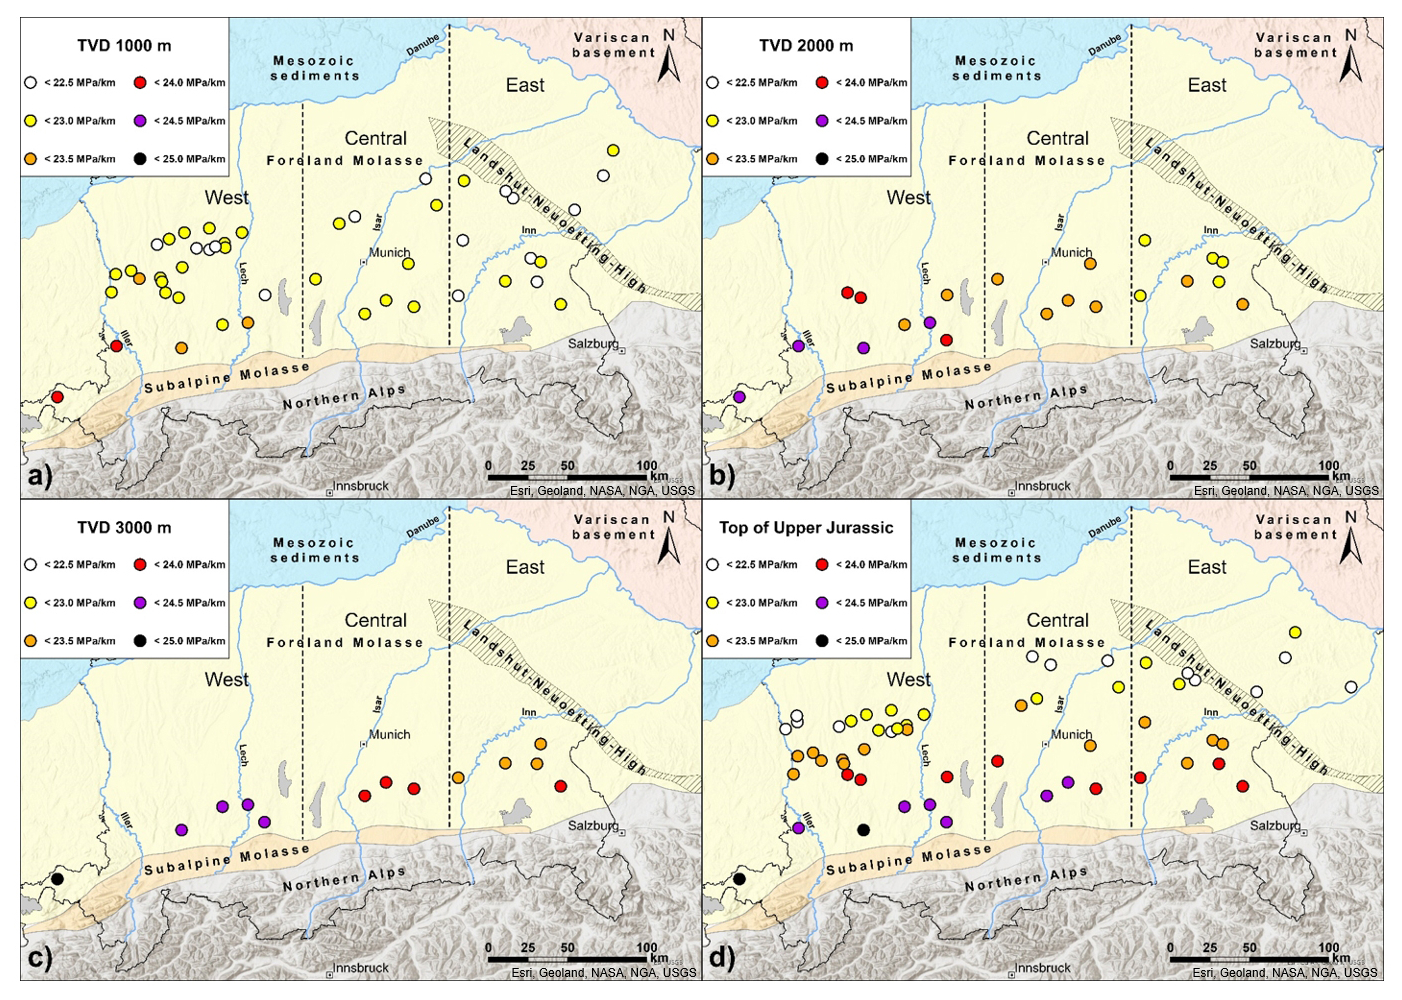
Figure 6Distribution of vertical stress gradients (in MPa km−1) in the North Alpine Foreland Basin. Vertical stress gradient distribution at a true vertical depth below ground level: (a) TVD = 1000 m, (b) TVD = 2000 m, (c) TVD = 3000 m. (d) Vertical stress gradient distribution at the top of Upper Jurassic carbonates. The N–S-trending dashed black lines divide the study area into western, central, and eastern parts.
We also show the distribution of vertical stress gradients at the top of the Upper Jurassic (Fig. 6d), which is an important thermal aquifer for deep geothermal energy utilization in the NAFB (Flechtner and Aubele, 2019; Schulz et al., 2017). In addition to the aforementioned eastward reduction, an apparent southward increase in vertical stress gradients can also be observed, reflecting the southward dip and associated increasing depth of the Upper Jurassic in the study area.
4.4 Vertical stress gradient modelling
In order to provide practical vertical stress gradient models for the SE German part of the NAFB, we model vertical stress gradients as a function of TVD and geographical easting. Thereby, we divide the study area into western, central, and eastern subdivisions (Fig. 6) to account for the lithological variations in the Cenozoic section and their impact on compaction (Bachmann and Müller, 1992; Bachmann et al., 1987; Kuhlemann and Kempf, 2002) (cf. Fig. 2). We calculate the arithmetic mean of vertical stress gradients of all wellbores of Dataset II within these three subdivisions using a 500 m step size with a tolerance of ±2 m. We restrict the calculation of the average to a maximum depth of TVD = 3500 m because only very few wells were drilled to greater depths and we want to avoid bias towards single wells. Fig. 7a shows the three resulting vertical stress gradient models (cf. Eq. 7) fitted to the mean vertical stress gradients in the western, central, and eastern parts. Both the mean vertical stress gradients and the fitted models capture the eastward decrease in vertical stress gradients in the study area. Due to its relevance for deep geothermal energy production in the NAFB, we also established vertical stress gradient models for the top of the Upper Jurassic (Fig. 7b) using Eq. (7). Likewise, both the vertical stress gradients established through bulk density integration and modelling reflect the eastward decrease in vertical stress gradients. The fitting parameters α and β, along with the coefficient of determination for both the average vertical stress gradient models and the top Upper Jurassic vertical stress gradient models, are listed in Table 3. For all models, the starting vertical stress gradient close to the surface was set to 21 MPa km−1.
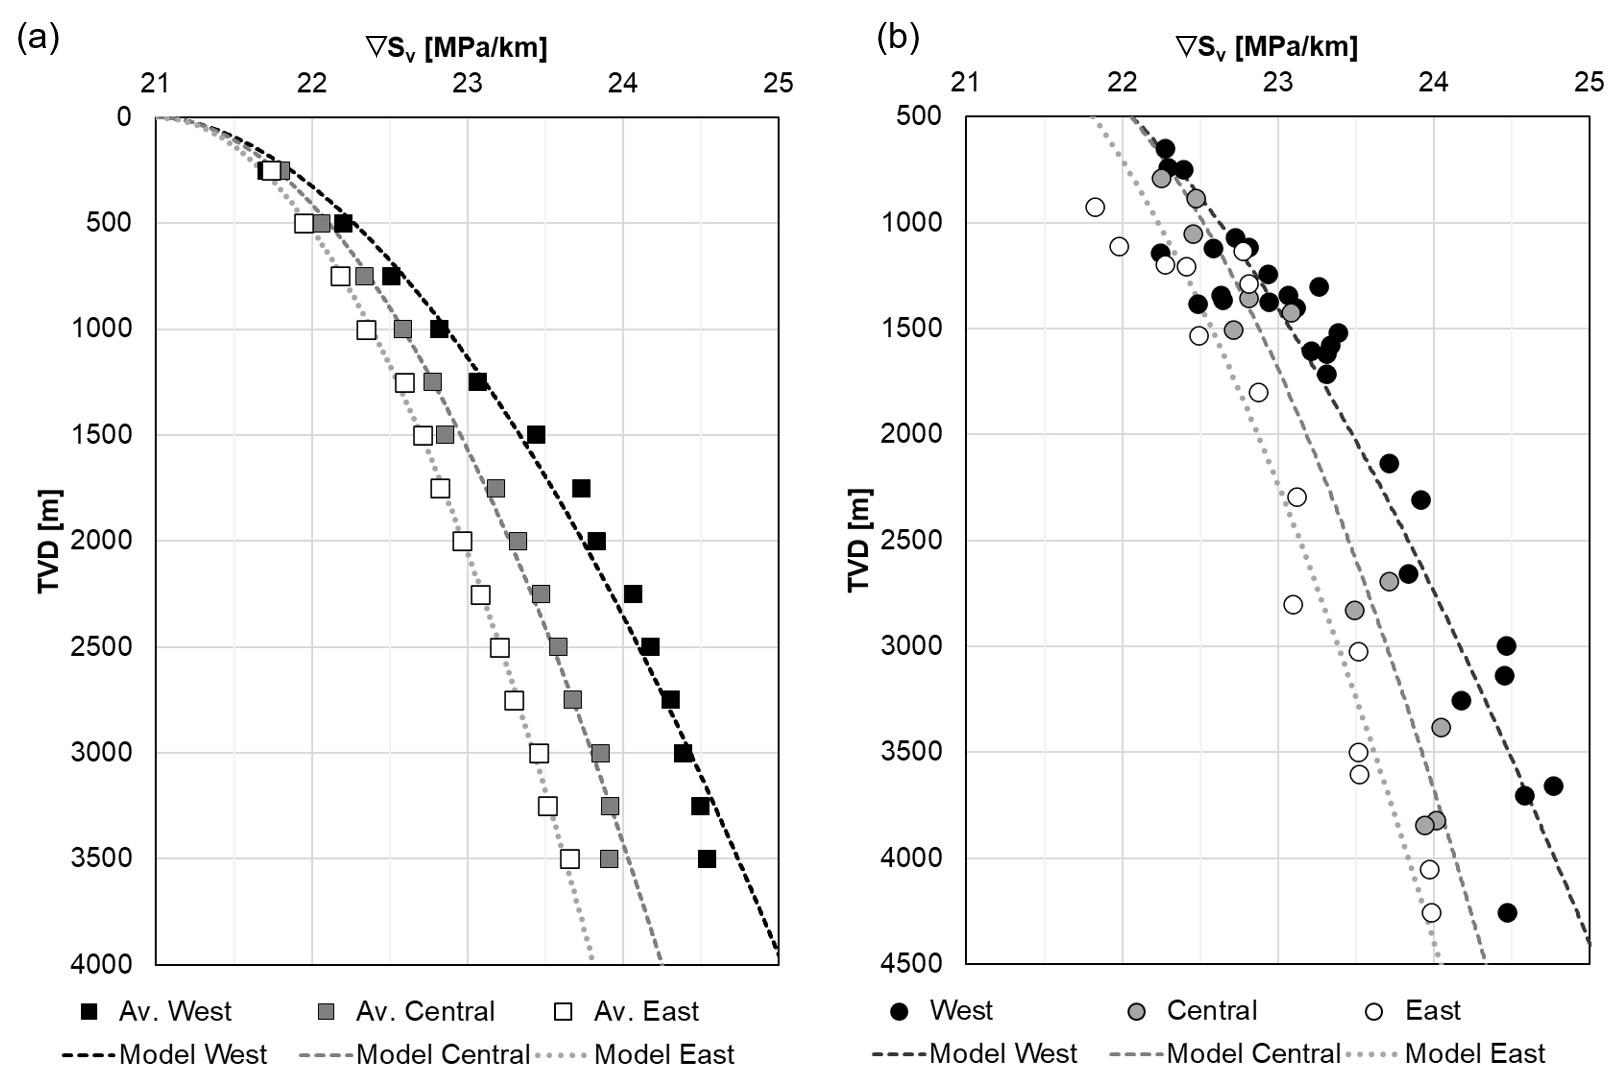
Figure 7Vertical stress gradients from Dataset II as a function of true vertical depth (TVD) below ground level. (a) Average and modelled vertical stress gradients in the western, central, and eastern parts of the study area (cf. Fig. 6). Average vertical stress gradients reflect the arithmetic mean from all wells in the western, central, and eastern parts of the study area at 14 depths and with a step size of 500 ± 2 m. (b) Well-based and modelled vertical stress gradients in the western, central, and eastern parts of the study area at the top of the Upper Jurassic.
Table 3Parameters to model vertical stress gradients for Dataset II.
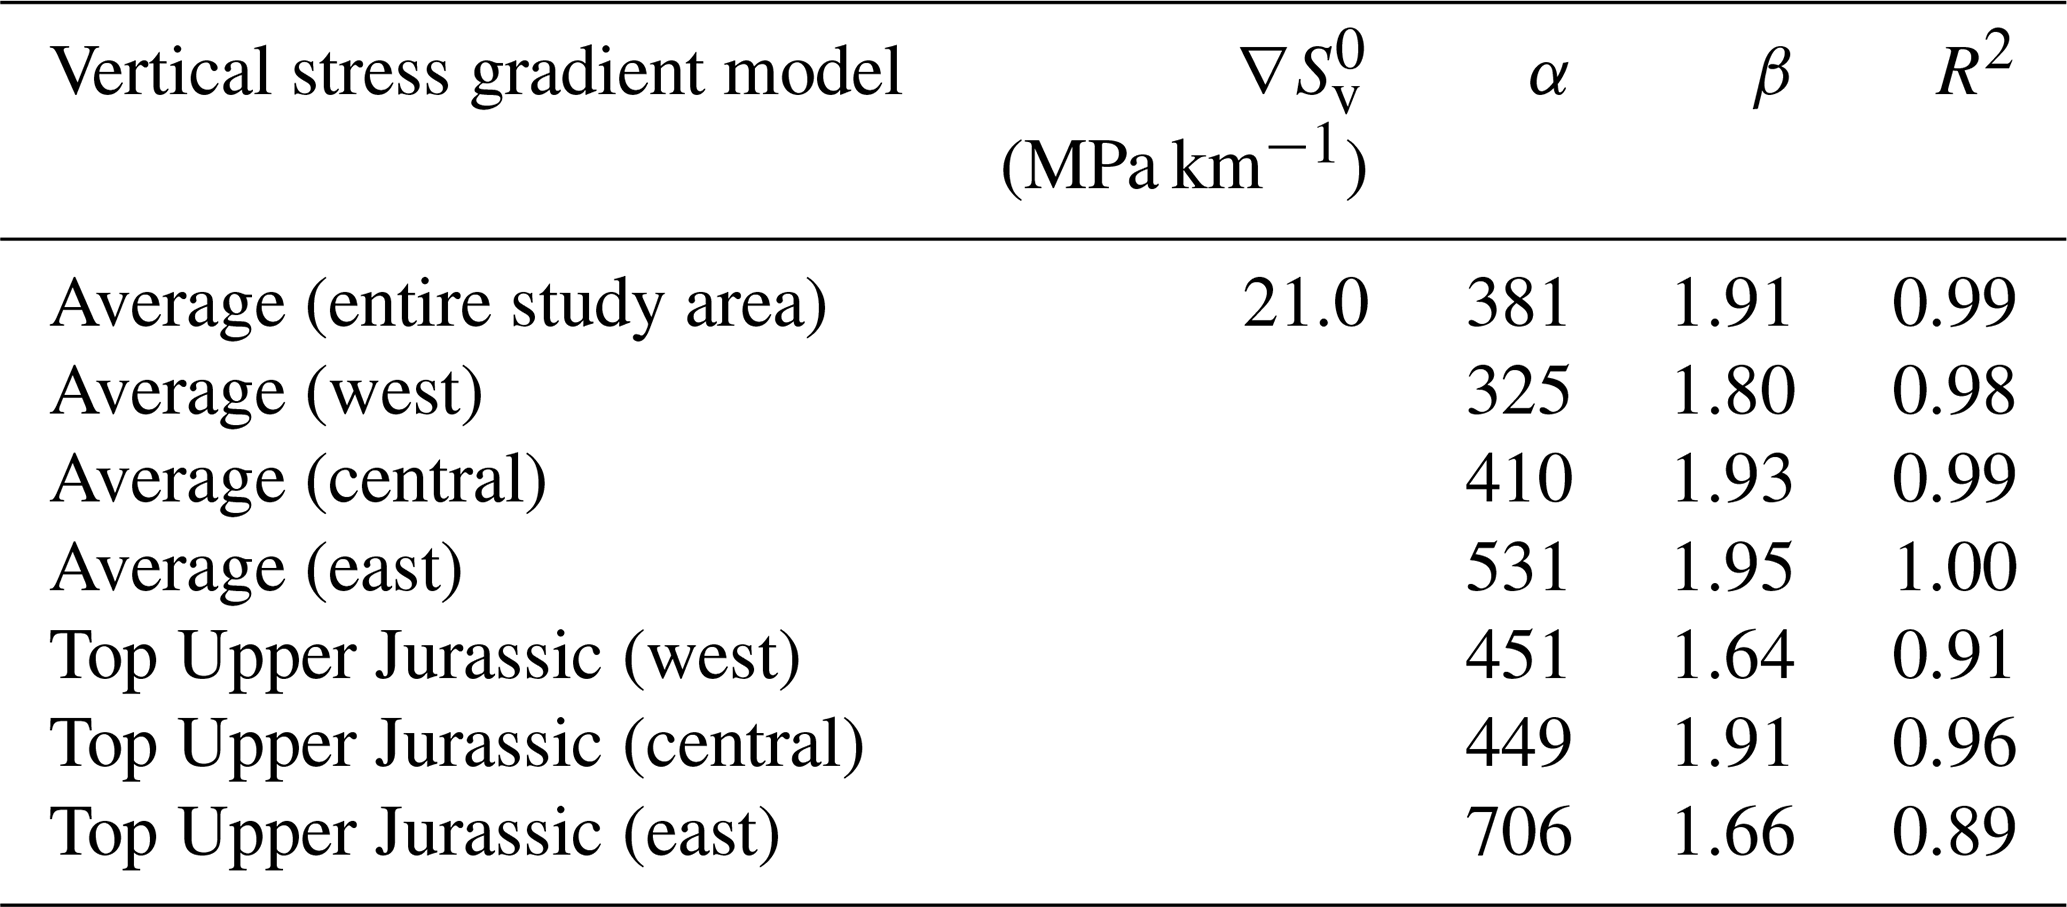
, α, and β: vertical stress gradient close to the surface and fitting parameters (Eq. 7); R2: coefficient of determination.
The established vertical stress gradient models show that density and, with it, vertical stress gradients are increasing with depth and from east to west. A single vertical stress gradient assumption (e.g. 23 MPa km−1) is therefore not sufficient to estimate vertical stress and would result in fairly large errors in most parts and depths of the NAFB in SE Germany (cf. Figs. 6 and 7): at shallow depths (< 1500 m), a constant vertical stress gradient of 23 MPa km−1 would overestimate vertical stress by up to 1 MPa, and, at greater depths (> 4000 m), this simplification would accumulate to an underestimation of vertical stress of up to 8 MPa.
4.5 Geological controls on bulk density, velocity, and vertical stress in the NAFB
Shallow bulk density profiles across all wells (Fig. 5a) and spliced bulk density profiles (Fig. 5b, c), as well as the derived vertical stress gradient models, highlight that bulk density and velocity generally increase with depth. The main driver for this trend is likely mechanical compaction because, in areas where pore fluid overpressures have been documented, the velocity is nearly constant with depth (cf. Drews et al., 2018, 2020; Drews and Duschl, 2022; Shatyrbayeva et al., 2024). The generally reasonable correlation between bulk density and velocity (Fig. 6) indicates that unloading effects, such as fluid expansion, hydrocarbon generation, or diagenesis (cf. Bowers, 1995, 2002), probably only have a minor influence on sediment compaction in the NAFB. However, compaction mechanisms other than burial, such as tectonic stress, cementation, and diagenesis, have also been hypothesized by previous authors who investigated the distribution of overpressure and stress in the NAFB (Drews and Duschl, 2022; Drews et al., 2020; Lohr, 1969, 1978; Müller and Nieberding, 1996; Shatyrbayeva et al., 2024). Shatyrbayeva et al. (2024) investigated shale compaction in the NAFB and found that both sonic velocity and electrical resistivity are increasing towards the Subalpine Molasse, possibly because of increasing lateral strain, carbonate cementation, clay diagenesis, mineralogical changes, or a combination of all. In the Austrian part of the NAFB, clay and sandstone diagenesis, which would likely affect density and velocity shales, marls, and sandstones, have been reported (e.g. Gier et al., 1998; Grundtner et al., 2016).
While the increase in vertical stress gradients with depth simply reflects increasing compaction, and, with it, the loss of porosity and an increase in bulk density (cf. Allen and Allen, 2013), the reasons for the eastward decrease in vertical stress gradients are more complex. Firstly, the lithological composition of sediments of Lower Oligocene (Rupelian) to Lower Miocene (Aquitanian) age significantly changes from west to east in the study area: coarser-grained terrestrial material was deposited in two regressions in the western part, while a marine setting prevailed in the eastern part of the study area, resulting in the deposition of fine-grained sediments (Fig. 2). The central part was subject to a transitional depositional environment during that time (Kuhlemann and Kempf, 2002). Shales, which are typical deposits from a marine environment, display the lowest densities in our study area, which could be a significant factor for lower vertical stress gradients in the eastern part of the study area (cf. Fig. 4). The abundance of shales in the eastern part of the study area compared to the western part is also pronounced by the presence of Upper Cretaceous shales, which are missing due to erosion in the western part (Bachmann et al., 1987). The presence of shales also fostered the development of significant pore fluid overpressure in the eastern part of the study area (Drews et al., 2018; Shatyrbayeva et al., 2023, 2024). Here, the main postulated mechanism for overpressure formation is disequilibrium compaction, which results in abnormally high porosity and possibly low bulk density in the overpressured zone. The overpressured section is up to 2 km thick in the eastern part of the study area (Drews et al., 2018; Drews and Duschl, 2022), and disequilibrium compaction could therefore be a main factor in the reduced vertical stress gradients in the area. In addition, the western part is also subject to higher horizontal strain rates, which is reflected by the decreased N–S extent of the NAFB and a more pronounced deformation front (Subalpine Molasse) along the northern outline of the Alps in this area (Drews and Duschl, 2022; Ortner et al., 2015). Elevated horizontal strain, combined with lower pore pressures and higher permeability of the basin fill, would also foster sediment compaction and therefore favour lower porosities, higher densities, and finally higher vertical stress gradients.
4.6 Implications for geothermal energy extraction from Upper Jurassic carbonates
More than 40 deep geothermal projects and close to 100 deep wells are planned to be drilled through the Cenozoic basin fill to tap the hydrothermal Upper Jurassic aquifer in the next 5–10 years (BVG, 2024). Our results have the potential to contribute to the success of the planned deep geothermal exploration, drilling, and production campaigns. The derived lithologically constrained velocity–bulk density relationships provide important information to process seismic reflection data and tie them to existing wells. In addition, the relationship between velocity and bulk density is important for the prediction of reservoir quality through rock physics modelling, and the established modified Gardner parameters provide an effective tool to model the geophysical and petrophysical properties of the main lithological units present in the study area. Hereby, not only are the Upper Jurassic carbonates of interest, but the Cenozoic reservoirs might also be targeted for geothermal energy extraction and storage of carbon dioxide and hydrogen. The improved understanding of vertical stress and the provided vertical stress gradient models can directly feed into modelling of the (effective) stress field and pore pressure prediction and therefore help to mitigate risks associated with drilling and production, such as wellbore instabilities and uncontrolled fluid influxes while drilling (cf. Drews et al., 2022) or induced seismicity during geothermal production (cf. Megies and Wassermann, 2014). Since the productivity of the Upper Jurassic aquifer correlates with vertical effective stress (Bohnsack et al., 2020), our newly derived vertical stress distribution can also contribute to predicting geothermal productivity in the future.
Based on Gardner's relationship, we established regional velocity–bulk density relationships for the main lithological units of the North Alpine Foreland Basin in SE Germany. We used these relationships to generate complete bulk density profiles along 55 wells, which at least penetrated the entire Cenozoic section to integrate vertical stress and to calculate vertical stress gradients. Thereby, the following observations were made:
-
Bulk density data are often impeded by washouts and/or breakouts and must be rigorously quality-controlled.
-
Velocity–bulk density relationships differ for the main lithological units but can be approximated by modifying the A and B parameters of Gardner's relationship.
-
Calibrated A and B parameters of Gardner's relationship for each main lithological unit of the NAFB follow a logical sequence on a logarithmic relationship. More compressible rocks, such as shales and marls, display a steeper velocity–bulk density relationship with lower A and higher B values, while the opposite is the case for less compressible rocks, such as carbonates and coarse-grained clastics.
-
Vertical stress gradients decrease from west to east in the SE German part of the North Alpine Foreland Basin, correlating well with lithological variations, overpressure, and tectonics.
In addition, we provided applicable vertical stress gradient models for the western, central, and eastern parts of the study area, which can be used to calculate either vertical stress profiles in these parts or vertical stress gradients at the top of Upper Jurassic carbonates, which pose an important aquifer for deep geothermal energy production. Our results therefore provide a useful resource for future geophysical, geomechanical, and geological studies in the North Alpine Foreland Basin that require velocity–bulk density relationships and an estimate of vertical stress.
The data used in this study are available upon request from the Bavarian Environment Agency.
PO: conceptualization, investigation, formal analysis, writing of the original draft. FD: supervision, conceptualization, writing (review and editing). MCD: supervision, conceptualization, writing (review and editing), funding acquisition.
The contact author has declared that none of the authors has any competing interests.
Publisher’s note: Copernicus Publications remains neutral with regard to jurisdictional claims made in the text, published maps, institutional affiliations, or any other geographical representation in this paper. While Copernicus Publications makes every effort to include appropriate place names, the final responsibility lies with the authors.
The authors would like to thank Johannes Großmann (Bavarian Environment Agency) for the support in data acquisition. Finally, the authors would like to thank the two anonymous reviewers and Giacomo Medici for their constructive reviews and comments, which greatly helped to improve the quality of the article.
This research has been supported by the Bavarian Environment Agency (KompakT) and the Bavarian Ministry for Science and the Arts (Geothermal Alliance Bavaria (GAB)).
This paper was edited by Florian Fusseis and reviewed by two anonymous referees.
Ahlers, S., Henk, A., Hergert, T., Reiter, K., Müller, B., Röckel, L., Heidbach, O., Morawietz, S., Scheck-Wenderoth, M., and Anikiev, D.: 3D crustal stress state of Germany according to a data-calibrated geomechanical model, Solid Earth, 12, 1777–1799, https://doi.org/10.5194/se-12-1777-2021, 2021.
Ahlers, S., Röckel, L., Hergert, T., Reiter, K., Heidbach, O., Henk, A., Müller, B., Morawietz, S., Scheck-Wenderoth, M., and Anikiev, D.: The crustal stress field of Germany: a refined prediction, Geothermal Energy, 10, 10, https://doi.org/10.1186/s40517-022-00222-6, 2022.
Allen, P. A. and Allen, J. R.: Basin Analysis: Principles and Application to Petroleum Play Assessment, 3rd Edition, Wiley-Blackwell, 632 pp., ISBN 978-0-470-67377-5, 2013.
Asquith, G. and Krygowski, D.: Basic well log analysis, Second Edition, AAPG Methods in Exploration, The American Association of Petroleum Geologists, Tulsa, Oklahoma, https://doi.org/10.1306/Mth16823, 2004.
Athy, L. F.: Density, porosity and compaction of sedimentary rocks, AAPG Bull., 14, 1–24, 1930.
Bachmann, G. H. and Müller, M.: Geologie der Tiefbohrung Vorderriß 1 (Kalkalpen, Bayern), Geol. Bavarica, 81, 17–53, 1981.
Bachmann, G. H. and Müller, M.: Sedimentary and structural evolution of the German Molasse Basin, Eclogae Geol. Helv., 85, 519–530, 1992.
Bachmann, G. H. and Müller, M.: Die Entwicklung des süddeutschen Molassebeckens seit dem Variszikum: Eine Einführung, Z. Geol. Wissenschaft., 24, 3–20, 1996.
Bachmann, G. H., Koch, K., Müller, M., and Weggen, K.: Ergebnisse und Erfahrungen bei der Exploration in den Bayerischen Alpen, Erdoel-Erdgas-Zeitschrift, 97, 127–133, 1981.
Bachmann, G. H., Müller, M., and Weggen, K.: Evolution of the Molasse Basin (Germany, Switzerland), Tectonophysics, 137, 77–92, https://doi.org/10.1016/0040-1951(87)90315-5, 1987.
Bohnsack, D., Potten, M., Pfrang, D., Wolpert, P., and Zosseder, K.: Porosity–permeability relationship derived from Upper Jurassic carbonate rock cores to assess the regional hydraulic matrix properties of the Malm reservoir in the South German Molasse Basin, Geothermal Energy, 8, 12, https://doi.org/10.1186/s40517-020-00166-9, 2020.
Bowers, G. L.: Pore pressure estimation from velocity data: Accounting for overpressure mechanisms besides undercompaction, SPE Drill. Completion, 10, 89–95, 1995.
Bowers, G. L.: Detecting high overpressure, The Leading Edge, 21, 174–177, 2002.
Budach, I., Moeck, I., Lüschen, E., and Wolfgramm, M.: Temporal evolution of fault systems in the Upper Jurassic of the Central German Molasse Basin: case study Unterhaching, Int. J. Earth Sci., 107, 635–653, https://doi.org/10.1007/s00531-017-1518-1, 2018.
BVG: Tiefe Geothermie-Projekte in Deutschland 2024, https://www.geothermie.de/fileadmin/user_upload/Aktuelles/Geothermie_in_Zahlen/BVG_Poster_Tiefe_Geothermie_2024_web.pdf (last access: 12 February 2025), 2024.
Couzens-Schultz, B. A. and Azbel, K.: Predicting pore pressure in active fold-thrust systems: An empirical model for the deepwater Sabah foldbelt, J. Struct. Geol., 69, 465–480, https://doi.org/10.1016/j.jsg.2014.07.013, 2014.
Drews, M. C. and Duschl, F.: Overpressure, vertical stress, compaction and horizontal loading along the North Alpine Thrust Front, SE Germany, Mar. Petrol. Geol., 143, 105806, https://doi.org/10.1016/j.marpetgeo.2022.105806, 2022.
Drews, M. C., Bauer, W., Caracciolo, L., and Stollhofen, H.: Disequilibrium compaction overpressure in shales of the Bavarian Foreland Molasse Basin: Results and geographical distribution from velocity-based analyses, Mar. Petrol. Geol., 92, 37–50, 2018.
Drews, M. C., Hofstettter, P., Zosseder, K., Shipilin, V., and Stollhofen, H.: Predictability and mechanisms of overpressure in the Bavarian Foreland Molasse Basin: An integrated analysis of the Geretsried GEN-1 Deep Geothermal Well, Geoth. Energy, 8, 3, https://doi.org/10.1186/s40517-019-0121-z, 2020.
Drews, M. C., Seithel, R., Savvatis, A., Kohl, T., and Stollhofen, H.: A normal-faulting stress regime in the Bavarian Foreland Molasse Basin? New evidence from detailed analysis of leak-off and formation integrity tests in the greater Munich area, SE-Germany, Tectonophysics, 755, 1–9, https://doi.org/10.1016/j.tecto.2019.02.011, 2019.
Drews, M. C., Shatyrbayeva, I., Bohnsack, D., Duschl, F., Obermeier, P., Loewer, M., Flechtner, F., and Keim, M.: The role of pore pressure and its prediction in deep geothermal energy drilling – examples from the North Alpine Foreland Basin, SE Germany, Petrol. Geosci., 28, petgeo2021-060, https://doi.org/10.1144/petgeo2021-060, 2022.
Flechtner, F. and Aubele, K.: A brief stock take of the deep geothermal projects in Bavaria, Germany (2018), PROCEEDINGS, 44th Workshop on Geothermal Reservoir Engineering, Stanford University, Stanford, California, 11–13 February, https://pangea.stanford.edu/ERE/db/GeoConf/papers/SGW/2019/Flechtner.pdf (last access: 25 May 2025), 2019.
Gardner, G. H. F., Gardner, L. W., and Gregory, A. R.: Formation velocity and density – the diagnostic basics for stratigraphic traps, Geophysics, 39, 770–780, 1974.
Gier, S., Ottner, F., and Johns, W. D.: Layer-charge heterogeneity in smectites of I-S phases in pelitic sediments from the Molasse Basin, Austria, Clay. Clay Mineral., 46, 670–678, https://doi.org/10.1346/CCMN.1998.0460607, 1998.
Großmann, J., Hofmann, N., Pamer, R., Spörlein, T., Pechnig, R., Knapp, D., Clauser, K., Karp, T., and Günther, D.: Abgeschlossene Arbeiten zur Digitalisierung geophysikalischer Grundlagendaten in Bayern, Geologica Bavarica, 127, 1–115, 2024.
Grundtner, M.-L., Gross, D., Linzer, H. G., Neuhuber, S., Sachsenhofer, R. F., and Scheucher, L.: The diagenetic history of Oligocene-Miocene sandstones of the Austrian north Alpine foreland basin, Mar. Petrol. Geol., 77, 418–434, https://doi.org/10.1016/j.marpetgeo.2016.04.003, 2016.
Kuhlemann, J. and Kempf, O.: Post-Eocene evolution of the North Alpine Foreland Basin and its response to Alpine tectonics, Sediment. Geol., 152, 45–78, https://doi.org/10.1016/S0037-0738(01)00285-8, 2002.
Lemcke, K.: Zur nachpermischen Geschichte des nördlichen Alpenvorlands, Geologica Bavarica, 69, 5–48, 1973.
Lemcke, K.: Übertiefe Grundwässer im süddeutschen Alpenvorland, Bulletin der Vereinigung Schweiz, Petroleum-Geologen und -Ingenieure, 42, 9–18, 1976.
Lemcke, K.: Dreissig Jahre Oel- und Gassuche im süddeutschen Alpenvorland, Jahresberichte und Mitteilungen des Oberrheinischen Geologischen Vereins, 61, 305–317, 1979.
Lemcke, K.: Das Bayerische Alpenvorland vor der Eiszeit, Schweizerbart Science Publishers, Stuttgart, Germany, 1–175, ISBN 978-3-510-65135-1, 1988.
Leu, W., Mégel, T., and Schärli, U.: Geothermische Eigenschaften der Schweizer Molasse Tiefenbereich 0–500 m – Datenbank für Wärmeleitfähigkeit, spezifische Wärmekapazität, Gesteinsdichte und Porosität, Bericht Schweizer Bundesamt für Energie, https://inis.iaea.org/records/14nez-c8x36 (last access: 25 May 2025), 2006.
Lohr, J.: Die seismischen Geschwindigkeiten der jüngeren Molasse im ostschweizerischen und deutschen Alpenvorland, Geophys. Prospect., 17, 111–125, https://doi.org/10.1111/j.1365-2478.1969.tb02075.x, 1969.
Lohr, J.: Alpine stress documented by anomalous seismic velocities in the Molasse trough, Inter-Union Com. On Geodynamics, Sci. Rep., 38, 69–71, 1978.
Medici, G., Ling F., and Shang J.: Review of discrete fracture network characterization for geothermal energy extraction, Front. Earth Sci., 11, 1328397, https://doi.org/10.3389/feart.2023.1328397, 2023.
Megies, T. and Wassermann, J.: Microseismicity observed at a non-pressure-stimulated geothermal power plant, Geothermics, 52, 36–49, https://doi.org/10.1016/j.geothermics.2014.01.002, 2014.
Müller, M. and Nieberding, F.: Principles of abnormal pressures related to tectonic developments and their implication for drilling activities (Bavarian Alps, Germany), in: Oil and Gas in Alpidic Thrusbelts and Basins of Central and Eastern Europe, edited by: Wessely, G. and Liebl., W., EAGE Spec. Pub., 119–126, 1996.
Müller, M., Nieberding, F., and Wanninger, A.: Tectonic style and pressure distribution at the northern margin of the Alps between Lake Constance and the River Inn, Geol. Rundsch., 77, 787–796, 1988.
Ortner, H., Aichholzer, S., Zerlauth, M., Pilser, R., and Fügenschuh, B.: Geometry, amount, and sequence of thrusting in the Subalpine Molasse of western Austria and southern Germany, European Alps, Tectonics, 34, 1–30, https://doi.org/10.1002/2014TC003550, 2015.
Pfiffner, O. A.: Evolution of the north Alpine foreland basin in the Central Alps, in: Foreland Basins, edited by: Allen, P. A. and Homewood, P., Blackwell Scientific Publications, Oxford, 219–228, https://doi.org/10.1002/9781444303810.ch11, 1986.,
Raiga-Clemenceau, J., Martin, J. P., and Nicoletis, S.: The concept of acoustic formation factor for more accurate porosity determination from sonic transit time data, SPWLA 27th Annual Logging Symposium, Houston, Texas, June 1986, https://onepetro.org/SPWLAALS/proceedings-abstract/SPWLA-1986/All-SPWLA-1986/SPWLA-1986-G/18543 (last access: 25 May 2025), 1986.
Reinecker, J., Tingay, M., Müller, B., and Heidbach, O.: Present-day stress orientation in the Molasse Basin, Tectonophysics, 482, 129–138, https://doi.org/10.1016/j.tecto.2009.07.021, 2010.
Rizzi, P. W.: Hochdruckzonenfrüherkennung in Mitteleuropa, Erdoel-Erdgas-Zeitschrift, 89, 249–256, 1973.
Schulz, I., Steiner, U., and Schubert, A.: Factors for the Success of Deep Geothermal Projects – Experience from the Bavarian Molasse Basin, Erdöl Erdgas Kohle, 133, 73–79, 2017.
Sclater, G. and Christie, P. A. F.: Continental stretching: An explanation of the Post-Mid-Cretaceous subsidence of the central North Sea Basin, J. Geophys. Research, 85, 3711–3739, https://doi.org/10.1029/JB085iB07p03711, 1980.
Seithel, R., Steiner, U., Müller, B., Hecht, C., and Kohl, T.: Local stress anomaly in the Bavarian Molasse Basin, Geoth. Energy, 3, 4, https://doi.org/10.1186/s40517-014-0023-z, 2015.
Shatyrbayeva, I., Bohnsack, D., Duschl, F., and Drews, M. C.: Comparison and integration of pore pressure measurements and indicators from drilling data in a deep geothermal energy play in SE Germany, Geoenergy, 1, geoenergy2023-2038, https://doi.org/10.1144/geoenergy2023-038, 2023.
Shatyrbayeva, I., Duschl, F., and Drews, M.: Drilling data-calibrated shale compaction models for pore pressure evaluation from geophysical well logs in the North Alpine Foreland Basin, SE Germany, Petrol. Geosci., 30, petgeo2024-014, doi.org/10.1144/petgeo2024-014, 2024.
von Hartmann, H., Tanner, D. C., and Schumacher, S.: Initiation and development of normal faults within the German alpine foreland basin: The inconspicuous role of basement structures, Tectonics, 35, 1560–1574, https://doi.org/10.1002/2016TC004176, 2016.
Wyllie, M. R. J., Gregory, A. R., and Gardner, L. W.: Elastic wave velocities in heterogeneous and porous media, Geophysics, 21, 41–70, 1956.
Yang, Y. and Aplin, A. C.: Definition and practical application of mudstone porosity-effective stress relationships, Petrol. Geosci., 10, 153–162, https://doi.org/10.1144/1354-079302-567, 2004.
Zhang, J.: Pore pressure prediction from well logs: Methods, modifications, and new approaches, Earth-Sci. Rev., 108, 50–63, https://doi.org/10.1016/j.earscirev.2011.06.001, 2011.
Ziegler, M. O. and Heidbach, O.: The 3D stress state from geomechanical–numerical modelling and its uncertainties: a case study in the Bavarian Molasse Basin, Geothermal Energy, 8, 11, https://doi.org/10.1186/s40517-020-00162-z, 2020.
Ziegler, M. O., Heidbach, O., Reinecker, J., Przybycin, A. M., and Scheck-Wenderoth, M.: A multi-stage 3-D stress field modelling approach exemplified in the Bavarian Molasse Basin, Solid Earth, 7, 1365–1382, https://doi.org/10.5194/se-7-1365-2016, 2016.
Zoback, M. D.: Reservoir Geomechanics, Reservoir Geomechanics, Cambridge University Press, 1–452, https://doi.org/10.1017/CBO9780511586477, 2007.
Zweigel, J.: Eustatic versus tectonic control on foreland basin fill: Sequence stratigraphy, subsidence analysis, stratigraphic modelling, and reservoir modelling applied to the German Molasse basin, Contributions to Sedimentary Geology, 20, 140 pp., ISBN 978-3-510-57020-1, 1998.