the Creative Commons Attribution 4.0 License.
the Creative Commons Attribution 4.0 License.
 | 30 Jun 2025
Accretionary prism deformation and fluid migration caused by slow earthquakes in the Nankai subduction zone
Takeshi Akuhara
Yusuke Yamashita
Hiroko Sugioka
Masanao Shinohara
Shunsuke Takemura
Takeshi Tsuji
Slow earthquakes induce structural deformation around their source regions and can also be linked to fluid migrations. Both of these phenomena potentially induce temporal variations in the seismic structure; how these two factors behave for a slow earthquake episode remains unknown. In this study, we applied the ambient noise correlation technique to the continuous records acquired at the seafloor in the Nankai subduction zone. We investigate the changes in seismic velocity () and heterogeneous correlation coefficient (CC) structures before and after the slow earthquake activity that occurred around the shallow plate interface from the end of 2020. As a result, temporal variations in and CC show different patterns for the slow earthquake episode. The variations show a step-like temporal reduction, and the reduced velocity was not recovered to the original level until the end of the observation period, whereas the CC variations show transient reductions and were recovered to the original level after the episode. Thus, the reflects the variation in the aspect ratio of pre-existing cracks and/or newly created cracks due to sediment deformation, where the extensional stresses normal to the trough were induced by the slips of the slow earthquakes, and the updated crack condition persisted even after the episode. We suggest that the CC variations correspond to transient fluid migrations from the source regions to shallow depths, activated by the fracturing of fluid caprocks that resulted from slow earthquakes. Our study indicates that monitoring these two quantities provides useful information to understand the variations in the subsurface structure due to slow earthquakes.
- Article
(10453 KB) - Full-text XML
-
Supplement
(6174 KB) - BibTeX
- EndNote


Slow earthquakes occur at shallow plate interfaces in the Nankai subduction zone in southwestern Japan. Their characteristics have been investigated from interdisciplinary viewpoints, such as seismic and geodetic observations, geology, rock experiments, and seismic structures (e.g., Takemura et al., 2023). The slow earthquakes in this region are mainly categorized into tremors, very-low-frequency earthquakes (VLFEs), and slow slip events (SSEs), based on the dominant periods of their seismic signals (2–8 Hz for tremors and 0.01–0.1 Hz for VLFEs) and durations of geodetic deformation (several days to several years for SSEs) (e.g., Fig. 1 in Obara and Kato, 2016). The occurrences of tremors and VLFEs and their distributions have been determined by seismometers in both land and sea areas (e.g., Obara and Ito, 2005; Ito and Obara, 2006; Asano et al., 2008; Sugioka et al., 2012; Kaneko et al., 2018; Takemura et al., 2019; Yabe et al., 2019; Baba et al., 2020; Ogiso and Tamaribuchi, 2022; Tamaribuchi et al., 2022; Yamamoto et al., 2022). SSEs have been observed through pore pressure measurements in boreholes at the seafloor (Araki et al., 2017; Nakano et al., 2018; Ariyoshi et al., 2021) and seafloor geodetic observations using the Global Navigation Satellite System (GNSS)–acoustic ranging technique combined with a seafloor positioning system (GNSS-A) (Yokota and Ishikawa, 2020). Compared to SSEs, the spatio-temporal variations of tremors and VLFEs in this region have been elucidated using seismometer records. Tremors and VLFEs are sporadically distributed along the strike direction of the Nankai Trough, and they occur at the plate interface at depths of less than ∼10 km (Obara and Kato, 2016). The recurrence intervals of these phenomena vary regionally along the Nankai Trough between 1 and 5 years (e.g., Baba et al., 2020).
Fluids are related to the generations of slow earthquakes. This linkage has been documented for slow earthquakes occurring at both deep and shallow plate interfaces in various subduction zones. Seismological techniques, including tomography and receiver functions, have revealed that the subducting oceanic crust near the region where deep tremors occur shows specific seismic velocities, such as low P-wave velocity (Vp) in the Nankai subduction zone (Shelly et al., 2006) and high VpVs in the Cascadia subduction zone (Gosselin et al., 2020). A tomographic study suggested that low-frequency earthquakes occur under undrained conditions within the subducting oceanic crust (Nakajima and Hasegawa, 2016). Details of other subduction zones have been reviewed elsewhere (Audet and Kim, 2016). Pore pressure waves along the plate interface may influence the migration of tremor excitations (Cruz-Atienza et al., 2018). Such fluid migrations to different sites are also related to slow earthquake generations (e.g., Nakajima and Uchida, 2018; Ito and Nakajima, 2024). These seismological features indicate the prevalence of fluids with high pore pressure within the oceanic crust, which mechanically reduces the shear strength of the fault.
In cases of shallow slow earthquakes, evidence of fluids and their migrations has been reported. Seismic exploration surveys have reported the presence of a low-velocity layer within the accretionary prism in the central Nankai subduction zone (Park et al., 2010; Kamei et al., 2012), and this is linked to the generation of VLFEs through the presence of fluids (Kitajima and Saffer, 2012; Tsuji et al., 2014; Tonegawa et al., 2017; Akuhara et al., 2020). Another exploration study in the Hikurangi subduction zone indicated that sediment lenses with low velocity that left behind subducting seamounts are linked to SSEs (Bangs et al., 2023). In the Hyuga-nada region of the western Nankai subduction zone, low-seismic-velocity layers have been detected within marine sediments above the regions where tremors occur (Akuhara et al., 2023a). Arai et al. (2023) have successfully imaged the vertical low-velocity zones connecting the plate boundary and seafloor and found a spatial correlation between the vertical conduits and the distribution of slow earthquakes.
In order to unveil the relationship between fluids and slow earthquake generation, the temporal changes in the seismological structure around the region of slow earthquakes should be investigated. Using the continuous records of the Dense Oceanfloor Network system for Earthquakes and Tsunamis (DONET, Fig. 1) (Kaneda et al., 2015; Kawaguchi et al., 2015; Aoi et al., 2020) for the observation periods of >10 years, which were acquired for the Nankai subduction zone, Tonegawa et al. (2022) found that the heterogeneous structure shows temporal changes associated with slow earthquakes and interpreted this to indicate that transient fluid migrations alter the fractional fluctuation of wave velocity in the heterogeneous structure within sediments. In particular, the slow earthquake activity that started at the end of 2020 showed temporal changes in seismic velocity and heterogeneous structure. However, the period after the slow earthquake activity has not been investigated in detail because post-event data were not sufficiently available. Moreover, the mapping of temporal variations in the subsurface structure was limited to the DONET1 area (Tonegawa et al., 2022).
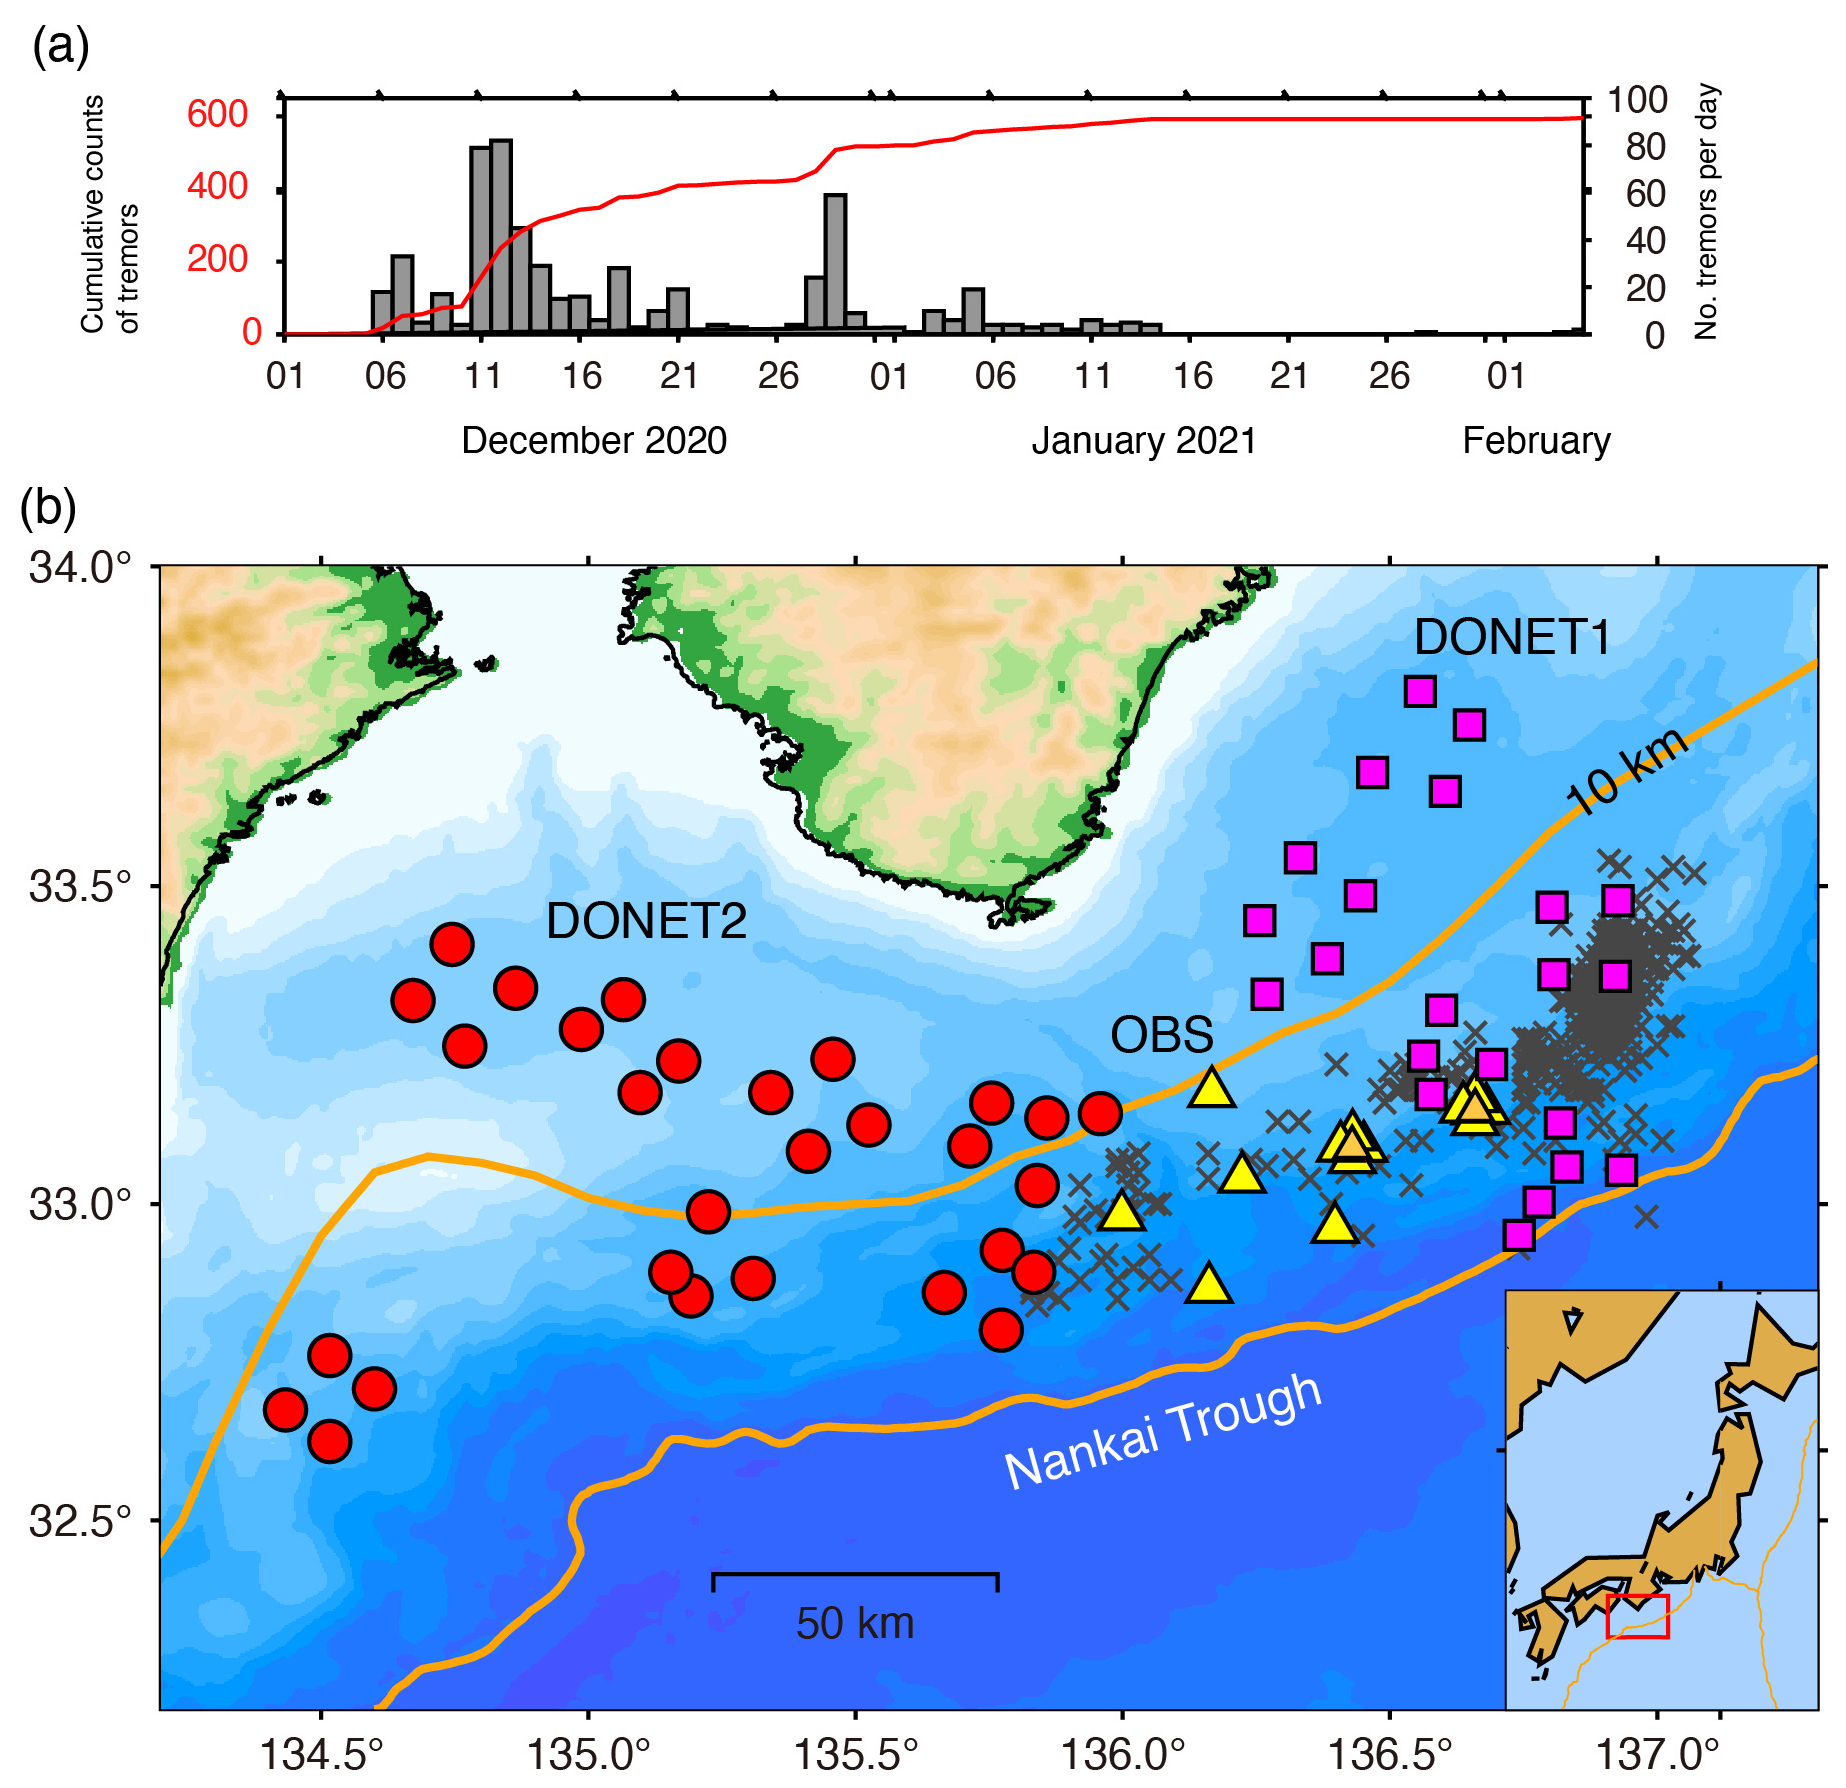
Figure 1(a) Frequency of tremors that occurred between 1 December 2020 and 5 February 2021, with the cumulative numbers indicated by the solid line and counts per day by the histogram. The tremors are the same as those used in panel (b). (b) Map showing the locations of stations. Squares and circles represent the DONET1 and DONET2 stations, respectively, and triangles show temporary OBSs. The two lines correspond to the Nankai Trough and the contour lines of 10 km to the Philippine Sea plate (Baba et al., 2002; Hirose et al., 2008). Crosses indicate the locations of tremors that occurred between 1 December 2020 and 5 February 2021 (Tamaribuchi et al., 2022), for which tremors with spatial errors of ≤0.1° are plotted, and 16 % of tremors are preserved from the original catalog.
In this study, we add temporary ocean bottom seismometers (OBSs) to the DONET stations to cover the gap between DONET1 and DONET2 and to estimate temporal changes in the subsurface structure using ambient noise correlation techniques. Additionally, we investigate the connection between fluid and the occurrence of slow earthquakes, especially focusing on the activity that started at the end of 2020. Because the spatio-temporal variation of tremors in the activity has been investigated in detail and potentially reflects the slip area, we compare the obtained structural changes with the tremor activity. The tremor activity started on 5 December 2020, peaked on 11 and 28 December (Tamaribuchi et al., 2022; Ogiso and Tamaribuchi, 2022), and faded by early February 2021, which expanded from the eastern part of DONET2 to the eastern part of DONET1 (Fig. 1).
We used the continuous vertical component records from 49 DONET stations (Fig. 1; the station codes used in this study are displayed in Fig. S1 in the Supplement). However, those near the Nankai Trough were primarily considered because temporal changes due to the slow earthquakes were limited to this region (Tonegawa et al., 2022). DONET contains the eastern (DONET1) and western (DONET2) cabled networks, which are deployed at water depths of 1000–4400 m with a station spacing of 10–30 km, which were installed at the end of 2010 and 2014, respectively. All stations include a broadband seismometer (Guralp CMG-3T, flat-velocity response of up to 360 s), which is buried 1 m below the seafloor (Nakano et al., 2013). The locations of DONET1 and DONET2 differ from each other by ∼80 km. To fill the gap, 15 OBSs with short-period sensors (1 Hz) were deployed between September 2019 and May 2021, among which 10 OBSs were used for two subarrays with a station spacing of ∼2 km. In this study, we used two OBSs located at the center of the two subarrays. In total, seven OBSs were used.
3.1 Calculation of cross-correlation functions
We calculated the cross-correlation functions (CCFs) from ambient noise records, following established methods (e.g., Campillo and Paul, 2003; Shapiro et al., 2005; Brenguier et al., 2007). To suppress energetic signals, such as those of earthquakes, we applied lognormal-shaped functions (Tonegawa et al., 2021, 2022). A bandpass filter of 0.5–2.0 Hz combined with spectral whitening was used. In the chosen frequency band, the ambient seismic noise is dominated by acoustic-coupled Rayleigh (ACR) waves. These waves propagate through the ocean and the entire accretionary prism in this region with a propagation velocity of 1.3–1.5 km s−1 (Tonegawa et al., 2015). CCFs were computed using 600 s time windows, and a 30 d moving average was obtained by stacking daily CCFs for each station pair. If the duration affected by the lognormal-shaped function was less than 70 % of the 30 d period, the corresponding CCF was discarded. Additionally, we prepared 20 d CCFs, preserving the duration longer than 70 % of 20 d for estimating temporal variations in the subsurface structures. This is because 30 d CCFs are required for evaluating clock deviations (introduced in the subsequent paragraph), but 20 d CCFs can be used for assessing the subsurface structures. Reference CCFs for each station pair were generated by stacking CCFs over the entire observation period. In the CCFs, direct ACR wave propagation between station pairs appears at early lag times, while their scattered waves are observed in the coda (Fig. 2).
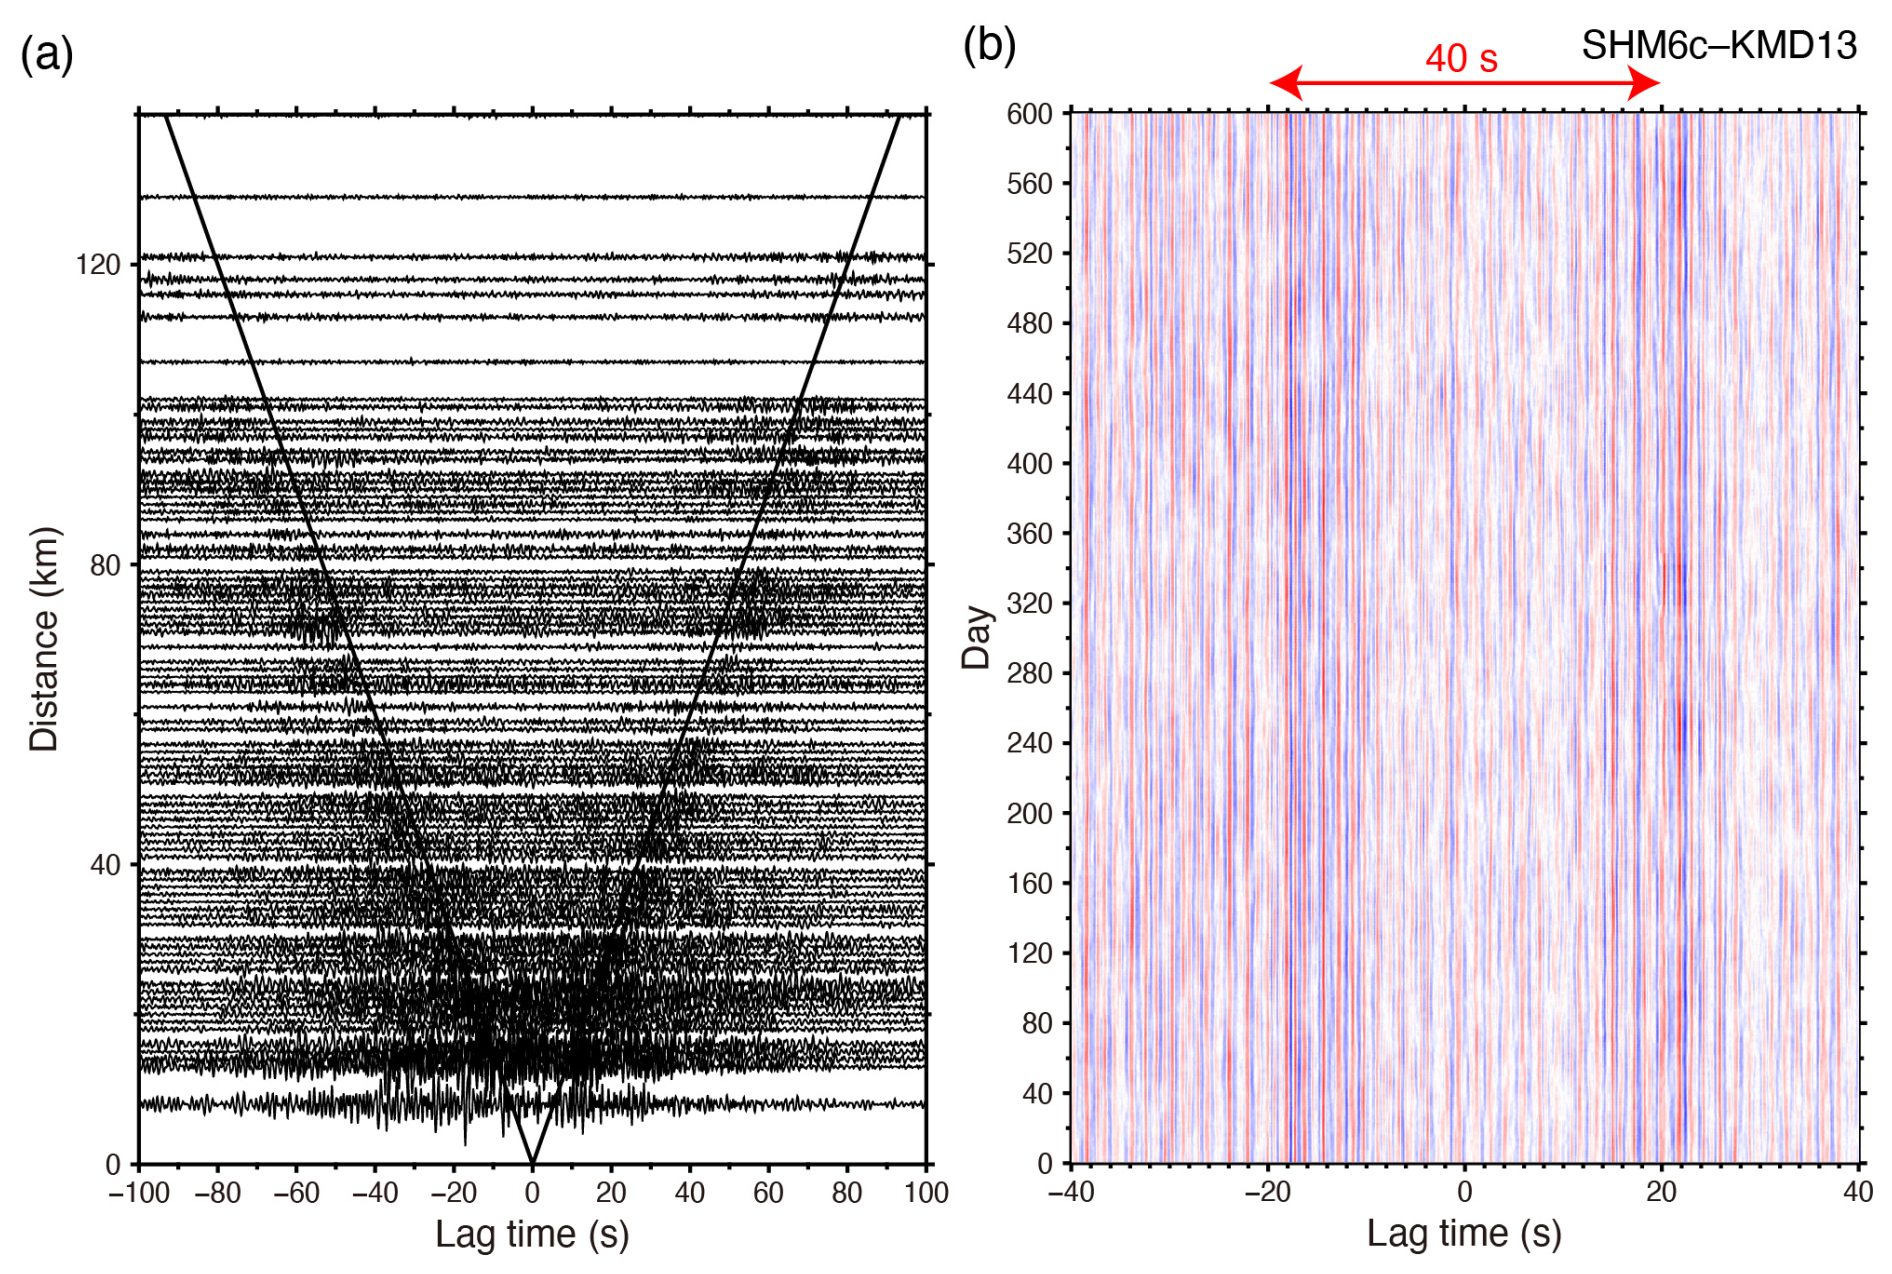
Figure 2Stacked CCFs at 0.5–2.0 Hz. (a) CCFs for station pairs stacked between −182 (2 October 2019) and 183 (1 October 2020) days from the reference date of 1 April 2020 (1 year). The two lines represent a propagation velocity of 1.5 km s−1. (b) CCFs at the station pair of SHM6–KMD13 for the observation period (2 October 2019–23 May 2021).
3.2 Clock error estimations
The clocks of the recorders are adjusted to the clocks of the GNSS at the timings before and after their observations and are linearly interpolated during the observations. However, the deviation rate of recorder clocks from the accurate times may not be uniform through the observation period. These deviations can be measured using CCFs with ambient noise correlations (Takeo et al., 2014). Using the CCFs calculated in the previous section, we measure the clock deviations of the OBSs from the clocks of the DONET stations. The clocks of the DONET data are calibrated by the GNSS signal through the submarine cables to land (e.g., Tsuji et al., 2023). We used CCFs for the station pairs for which the DONET stations are located within a distance of 50 km from each OBS. When the CCFs are aligned as a function of the observation date, several coherent phases, including ACR waves and their scattered waves, are observed in the positive and negative lag times during the observation periods (Fig. 2b). However, if the clocks deviate from the accurate times, the arrival times of the causal and acausal waves are simultaneously shifted in the same direction toward the positive or negative lag time during the observation periods. Here, in cases where temporal variations in the seismic velocity at the subsurface structure affect the arrival times of causal and acausal waves, the arrival times of causal waves in the positive lag time and acausal waves in the negative lag time are shifted symmetrically with respect to the lag time of 0 s (e.g., Brenguier et al., 2008), which is a different feature from the clock deviations to the CCFs.
We set a 2 s time window with an increment of 1 s between −20 and 20 s in the CCFs (Fig. 2b) and prepared the reference CCF for each station pair by stacking the CCFs between October 2019 and September 2020. In each 2 s time window, we calculate cross-correlation functions (referred to as CF to distinguish this function from the CCFs using ambient noise records) between the reference CCF and individual CCFs. If, within a given time window, the cross-correlation coefficients of the CFs exceed 0.9 for more than 85 % of the observation period, the time window is considered to contain coherent signals throughout the period. The delay times of these CFs are then interpreted as the clock deviation. The obtained temporal variation of the clock deviation from the starting time of the observation period may be slightly shifted from 0 s in lag time, because the coherent signals between the reference CCF and individual CCFs may have phase differences. Therefore, the time difference of a coherent signal averaged over the first 10 d is subtracted from the time differences of the subsequent days. This processing is repeated for different pairs between each OBS and the available DONET stations that satisfy the aforementioned criterion. On each day, the obtained delay times are counted at 0.01 s bins, and the counts are used for estimating the weighted average, Sj, for the jth day:
where Tij is the ith time, which is assigned from −0.15 to 0.15 s with an increment of 0.01 s, and Cij is the counts at the bins. We chose the power of 3 in Eq. (2) because, if the power is 1–2, the estimated average is slightly away from the large counts and deviates to the center of the count distribution. Additionally, we took the moving average of Sj within 60 d for smoothing the obtained values (Figs. 3 and S2 in the Supplement).
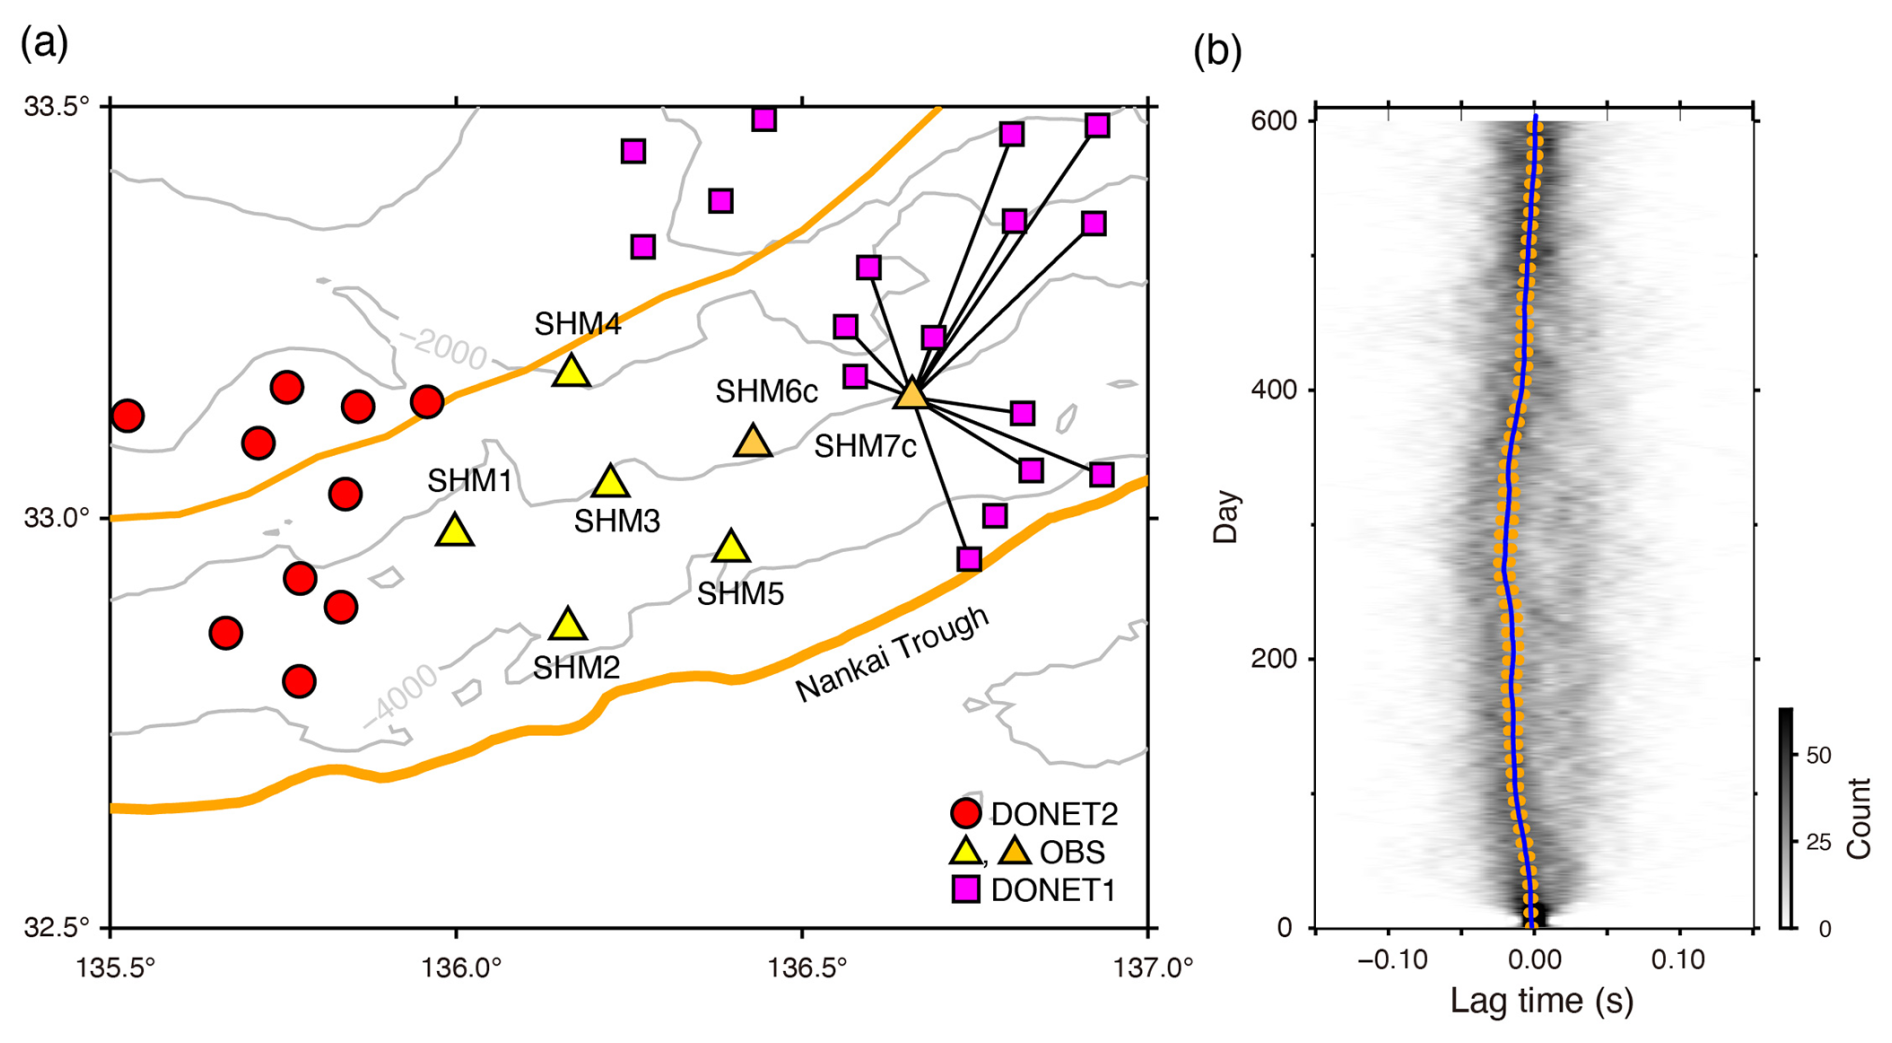
Figure 3Clock deviations at SHM7c. (a) The locations of the pairs between the SHM7c and DONET stations, used for measuring the clock deviations, which are connected by solid lines. (b) The estimated clock deviations at SHM7c. The solid and dashed lines represent the weighted average and its standard deviations for the clock deviation. The background counts indicate the measurements of the clock deviations counted at bins of 0.01 s and 1 d.
3.3 Estimations of and CC
For each 30 d CCF, we applied the stretching technique for estimating the changes in seismic velocity () and cross-correlation coefficients (CCs) (Sens-Schönfelder and Wegler, 2006; Obermann et al., 2013), in which the relation of has been widely used since an earlier work for coda waves from repetitive seismic sources (Poupinet et al., 1984). The searching range of the stretch () is between −0.4 % and 0.4 %, with an increment of 0.01 %. CCs are estimated by cross-correlating 50 s segments between the reference and 30 d CCFs that are stretched by the obtained , and the CCs obtained for the positive and negative lag times are averaged. The starting times of the 50 s segments are the arrival times of the ACR waves in the positive and negative lag times, which were estimated by dividing the separation distance of two stations by a propagation velocity of 1.5 km s−1. After correcting the individual CCFs using the obtained , we calculated the CCs between the reference and the corrected CCFs.
The uncertainties in and CC due to the clock deviations are estimated by a bootstrapping technique. The and CC variations were estimated using the 30 d CCFs every day (between the −14th and +15th days from the reference days), and the clock deviations were also estimated for the OBSs every day. We randomly selected a value between the standard deviations and time-shifted the CCFs using this value as the clock deviation. Using the time-shifted CCFs, we estimated the and CC and repeated this process 100 times to obtain the and CC uncertainties. The results for the node KMC and OBSs are summarized in Figs. 4 and S3 in the Supplement. Moreover, we compared temporal variations in and CC for several pairs of KMC stations with changing stacking periods for 10, 20, and 30 d (Fig. S4 in the Supplement). The for all stacking periods is consistent for three station pairs. The patterns of CC for stacking periods between 20 and 30 d are similar, although there are small offsets. On the other hand, the CC for a stacking period of 10 d disagrees with CCs with longer stacking periods. Considering the similarity of the CC, 20 d CCFs can be leveraged for detecting subsurface structure changes. However, 30 d CCFs are reliable for assessing clock deviations because of the small offsets of the CC. Moreover, the and CC could not be estimated at several pairs, including MRE21, during the slow earthquake activity (Fig. S3d). This is because we discarded the 30 d CCFs for the reasons mentioned in Sect. 3.1, and we did not use the corresponding 20 d CCFs for and CC mappings, which will be explained in the subsequent section.
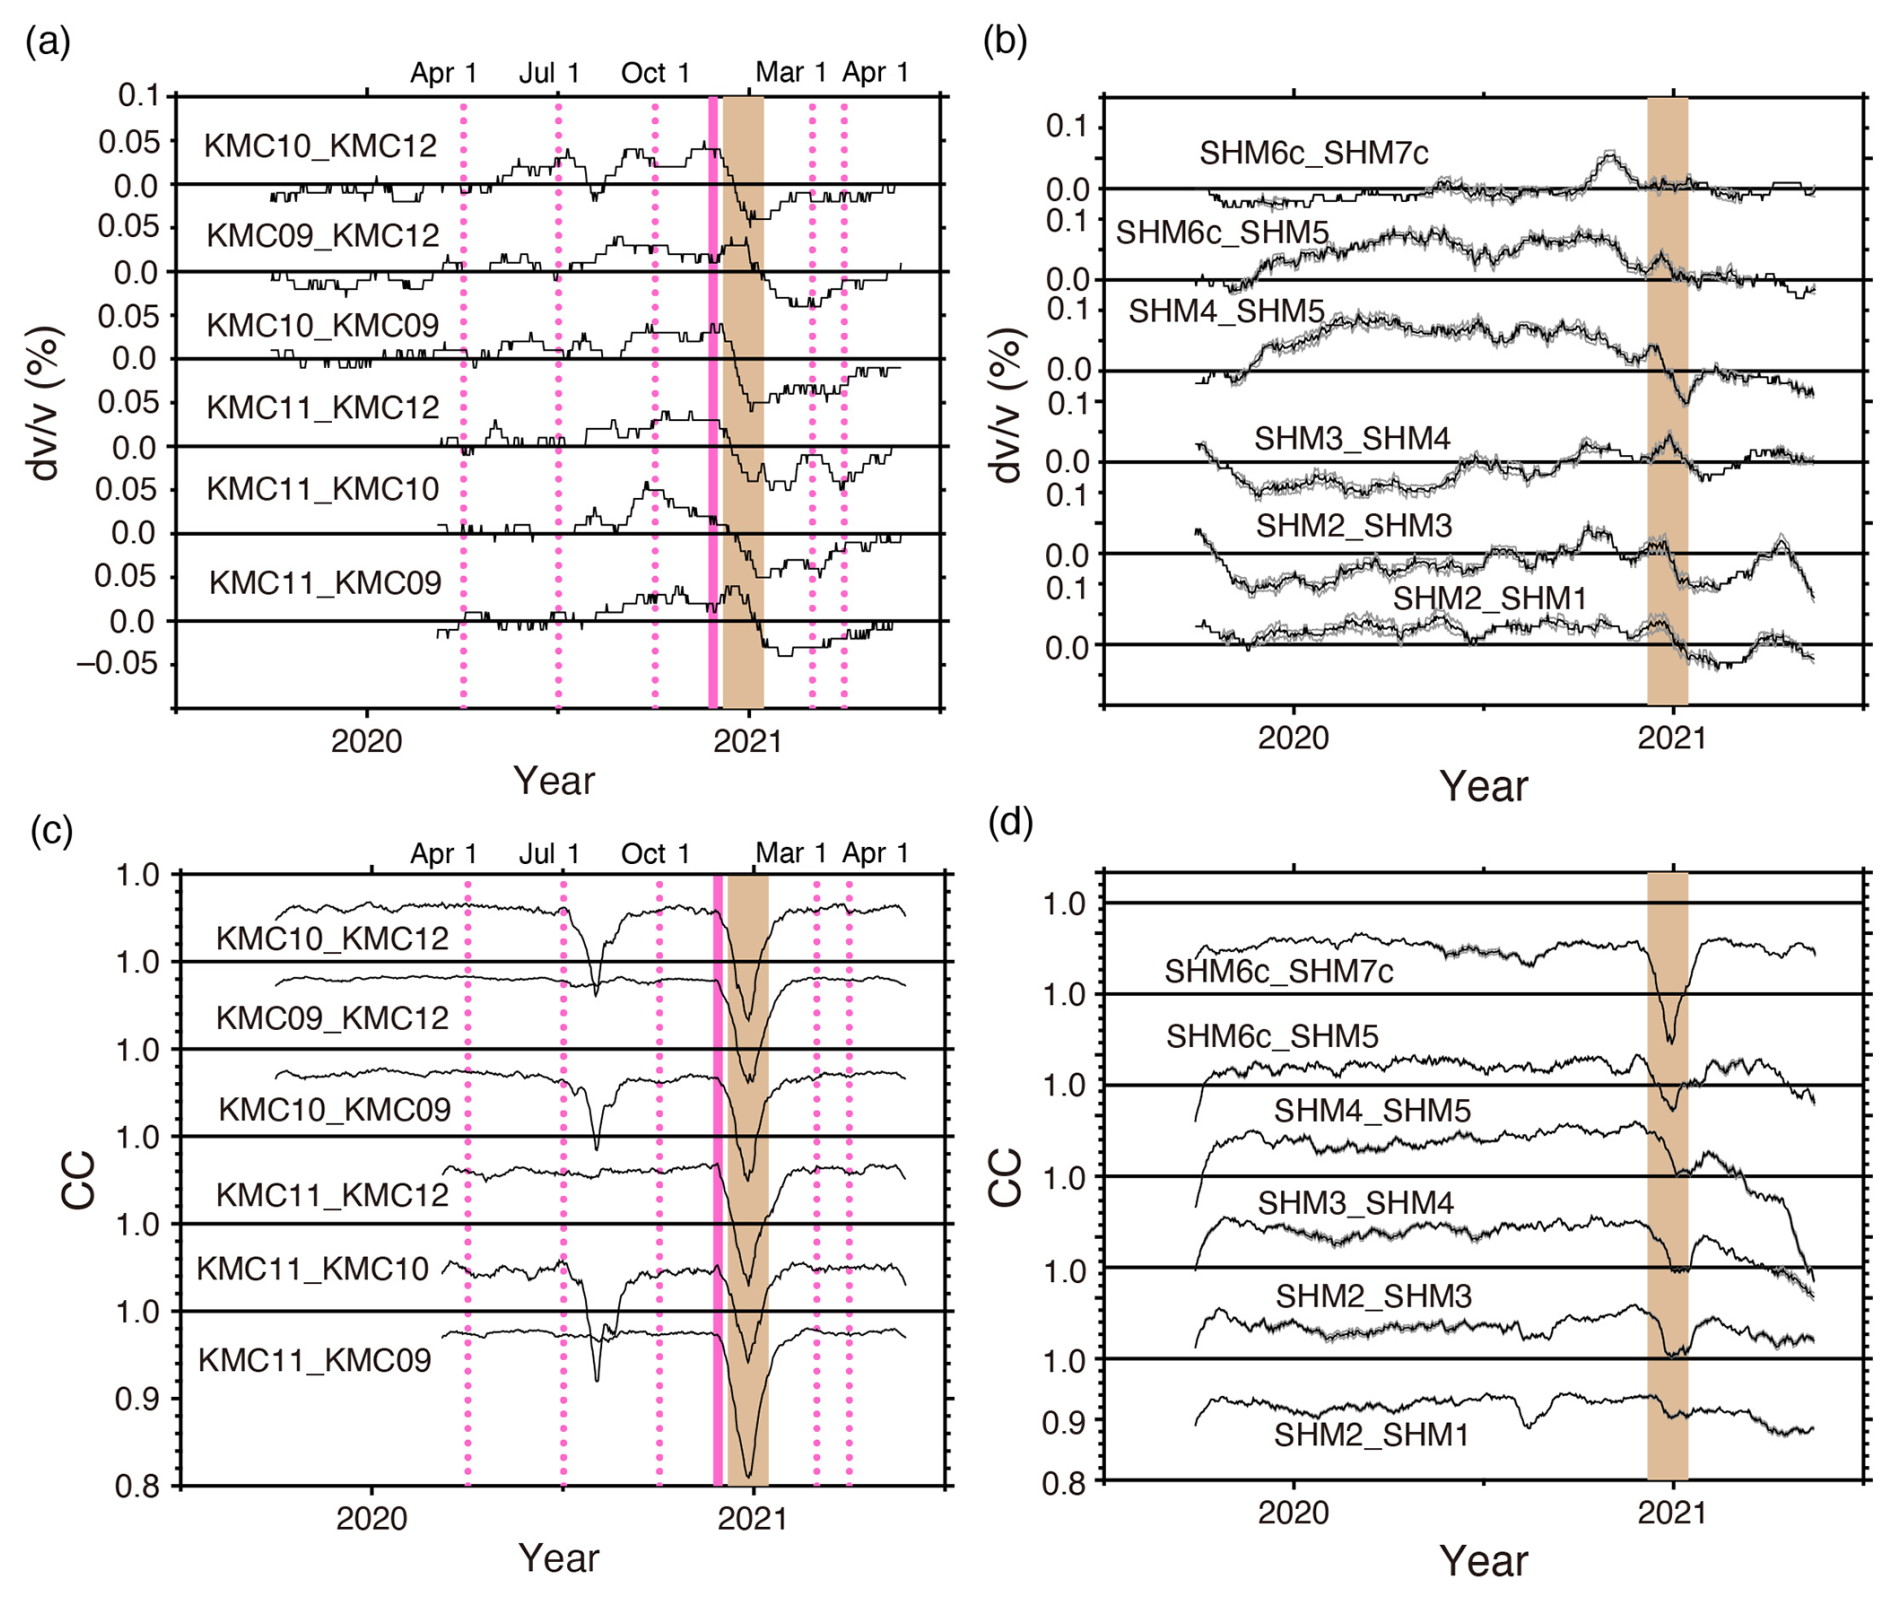
Figure 4(a) variations for node KMC. The shaded region represents the timing of the slow earthquake activity. The vertical bold line indicates the reference period, and the dotted lines show the dates for which the mappings of and Δg for non-slow earthquakes are conducted (Figs. S5 and S6). (b) Same as panel (a) but for results for the temporary OBSs. Upper and lower lines indicate the uncertainties due to clock deviations. (c) Same as panel (a) but for CC variations. (d) Same as panel (b) but for CC variations.
Because we use ACR waves, the depth sensitivities of the and CC obtained in this study are approximately 1 km from the seafloor (Tonegawa et al., 2022). Moreover, since the stretching technique measures the for scattered waves in the coda part of the CCFs, the obtained reflects relatively wide horizontal areas around two stations. In contrast, because the CC potentially varies with amplitude variations within a short time segment of the CCFs, the obtained CC reflects the temporal variations of the heterogeneous structure in relatively horizontally localized areas where the scattered waves within the short time segment sample. Indeed, an experimental study suggested that the CC variation was more sensitive than the variations to fluid injection (Théry et al., 2020).
3.4 Spatial mapping of velocity change and seismic scattering coefficient
To estimate the region where the velocity and heterogeneous structure change, we map velocity changes and scattering coefficient changes (SCCs: Δg) using a method described previously (Obermann et al., 2013, 2014, 2015; Sánchez-Pastor et al., 2018; Hirose et al., 2019, 2020; Tonegawa et al., 2022). We limited the mapping of and Δg with available stations in nodes KMB, KMC, KMD, MRD, and MRE, and temporary OBSs (Fig. 1), because the and CC variations are limited within the distribution of these stations. We investigate and CC changes during the tremor activities, which started on 6 December 2020 and stopped on 14 January 2021. We used the reference values for the and CC, averaged during 21–30 November 2020 and selected the values of and CC for Periods (1)–(6): (1) 25 November 2020, (2) 10 December 2020, (3) 20 December 2020, (4) 30 December 2020, (5) 10 January 2021, and (6) 20 January 2021. Because the used CCFs are stacked over 20 d, obtained results on and CC contain the effects between the −9th and +10th days from the reference dates. The methods for estimating are the same as those used in Tonegawa et al. (2022), and they are briefly summarized in the Supplement.
4.1 Clock deviation
Because stations SHM1, SHM6c, and SHM7c are relatively close to DONET1 or DONET2, direct and scattered waves can be retrieved in the CCFs. Consequently, as shown in Figs. 3 and S2, sufficient measurements of clock deviations can be obtained for these OBSs. The clock deviations obtained at stations SHM4 and SHM6c are approximated by linear interpolation before and after the observations, since the average values are close to 0 s over the entire observation period. On the other hand, the average values of SHM1, SHM2, SHM3, SHM5, and SHM7c are slightly away from 0 s during the observation period, which indicates non-linear clock deviations (Figs. 3 and S2). The average of the standard deviation of the clock deviations for all the stations is <0.006 s (Table S1 in the Supplement). Because the clocks of the recorders are adjusted to the clocks of the GNSS at the timings before and after the observations, the estimated clock deviations at the starting and ending dates should be 0 s. However, the clock deviation of SHM2 at the end of the observation is approximately −0.02 s. This is probably because the counts at each day within 550–600 d are almost comparable, and relatively high counts are not estimated, hence the obtained results deviate from 0 s (Fig. S2b). Since the range of the high tremor activity is 445–485 d (5 December 2020–14 January 2021; Fig. 1a), the clock estimations near the end of the observation period do not substantially influence the results of and CC.
4.2 Spatio-temporal changes in and CC
Figure 4a and b show the temporal variations in at node KMC and OBSs, respectively. The changes at node KMC show an abrupt reduction of 0.1 % during the slow earthquake activity, while such reductions cannot be observed in the station pairs of the OBSs. Substantial reductions are not observed at nodes MRD and MRE of DONET2 (Fig. S2c and d). This fact indicates that the changes do not expand to the area of the OBSs. The reductions in at node KMC continued, with a gradual recovery to the original values until the end of the observation period. Figure 4c and d display the temporal variations in CC at node KMC and OBSs, respectively, and CC reductions are detected during the slow earthquake activity in both areas. In particular, the troughs of the CC variations in the OBS pairs are slightly shifted, which indicates that they occur first in the eastern part of the survey area (SHM6c_SHM7c and SHM6c_SHM5) and later in the central part (Fig. S4c). These reductions were almost recovered to the original levels of CC immediately after the slow earthquake activity. Another CC reduction can be observed in the middle of 2020 for three pairs of two stations at node KMC (Fig. 4c), and such features may be identified at other pairs, e.g., KMB06_KMB05 and KMB07_KMB08, with relatively weak levels (Fig. S4).
The spatio-temporal variations in for Periods (1–6) are displayed in Fig. 5. Substantial variations in are not observed in Period (1), whereas the reduction can be observed in the eastern part of the survey area during Periods (2–6). This result is consistent with the results obtained at nodes KMC (Fig. 4), KMB, and KMD (Fig. S2), where the reduction is not recovered to the original level after the event. The spatio-temporal variations in Δg for Periods (1–6) are displayed in Fig. 6. Large localized Δg is imaged in the eastern part of the survey area in Periods (2–5), and relatively weak Δg occurred in the western part in the same period. In addition, the large Δg region in the eastern part in Period (5) migrated to the central part in Period (6). Figure 7 shows the spatio-temporal relationship between Δg and tremor distributions (Tamaribuchi et al., 2022); here, tremors with estimated errors of ≤0.1° from the original catalog are preserved, and hence 84 % of the tremors are excluded. These tremors occurred near the location of the maximum Δg. The large Δg in the eastern and western parts are merged during 15–20 January 2021, and substantially large Δg cannot be observed in February 2021.
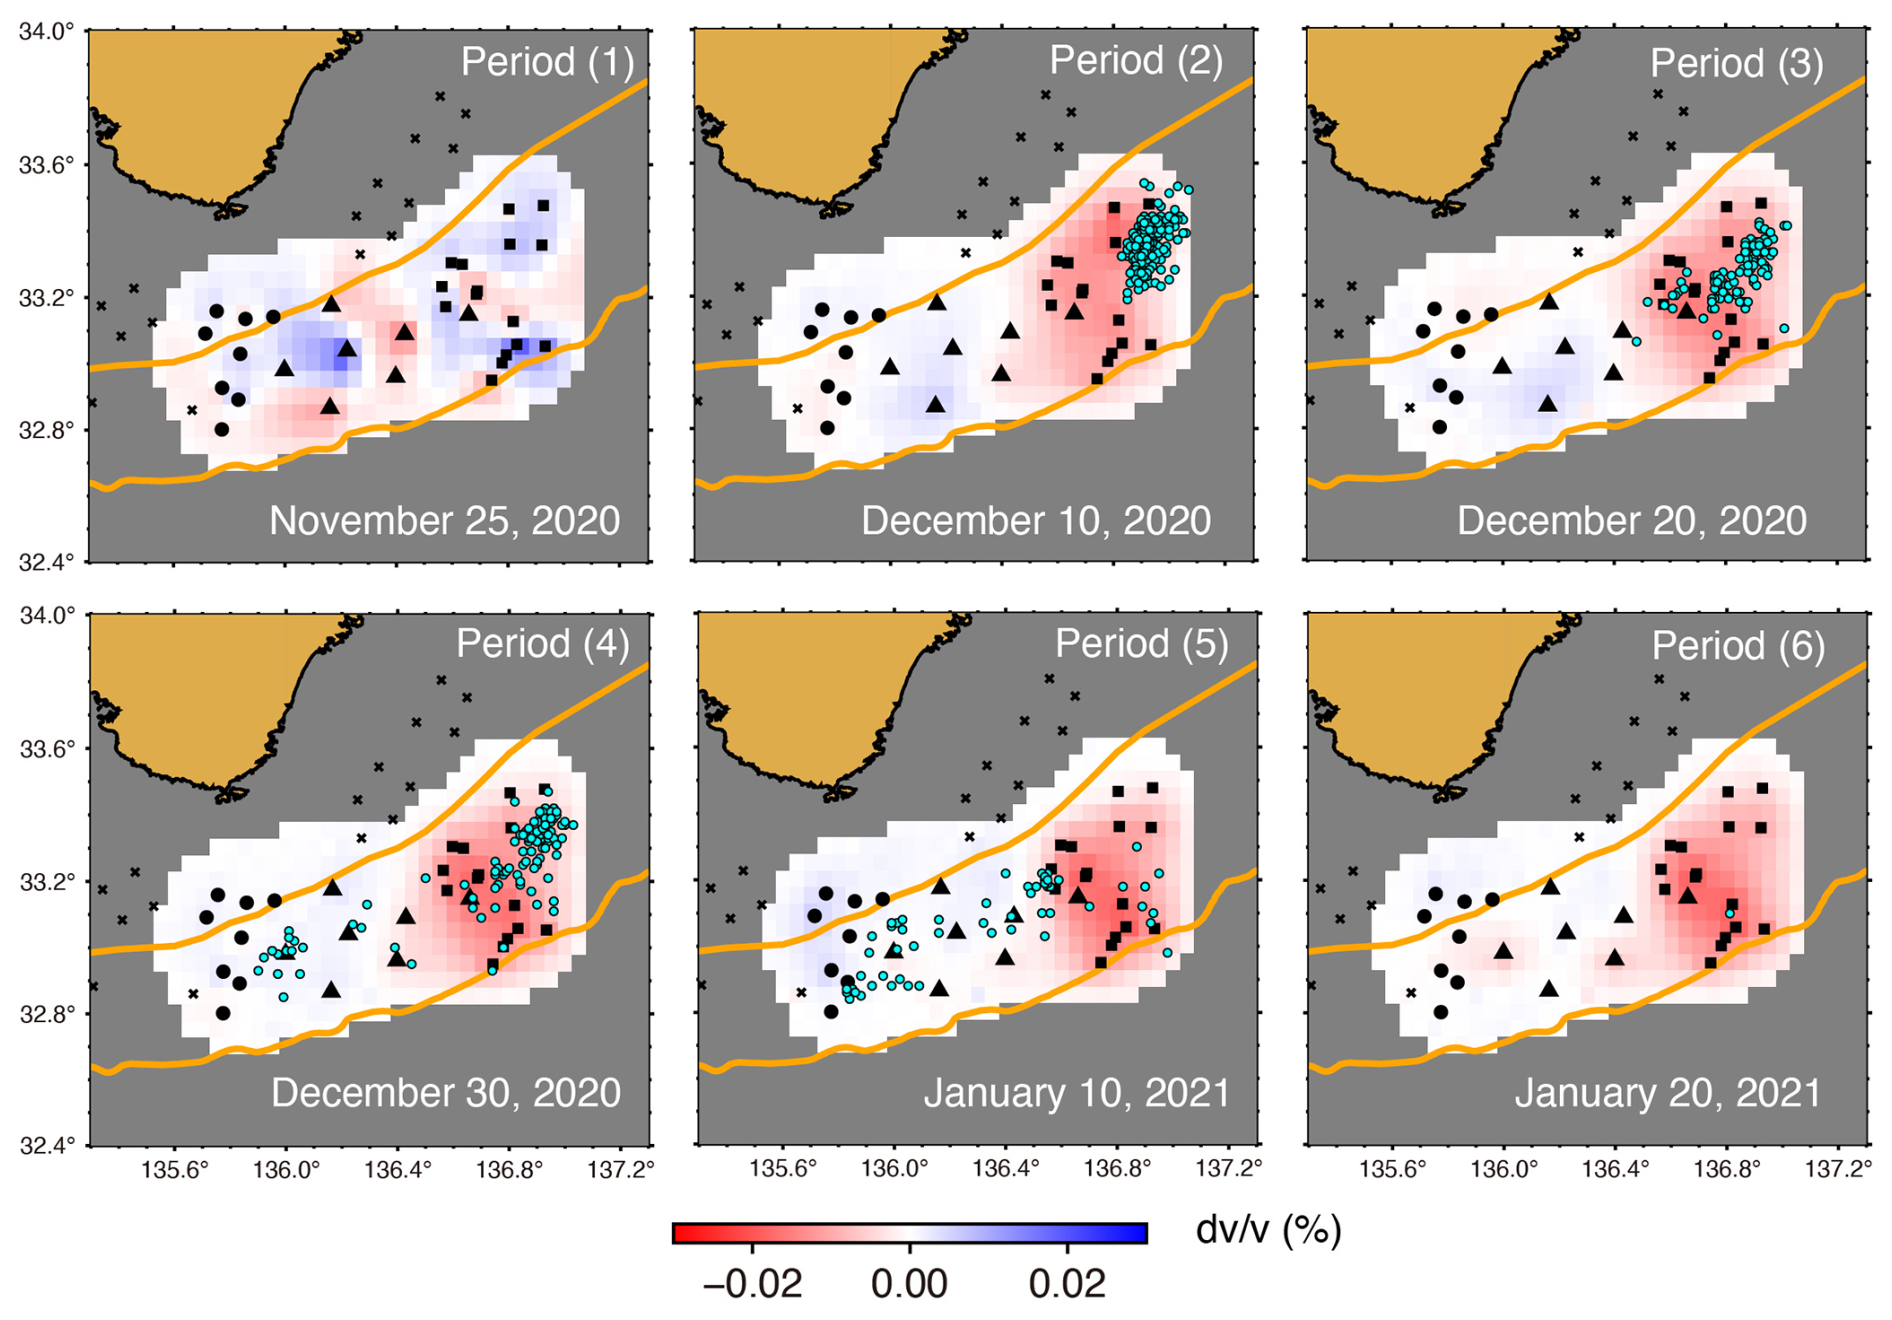
Figure 5Spatio-temporal variations in Periods (1–6). Circles represent the tremor locations within ±5 d of the reference dates, as determined by Tamaribuchi et al. (2022), from which tremors with spatial errors of ≤0.1° are plotted (16 % of tremors from the original catalog). Squares and circles indicate the DONET1 and DONET2 stations (KMB, KMC, KMD, MRD, and MRE), and triangles show the temporary OBSs used in this analysis. Crosses represent the other stations.
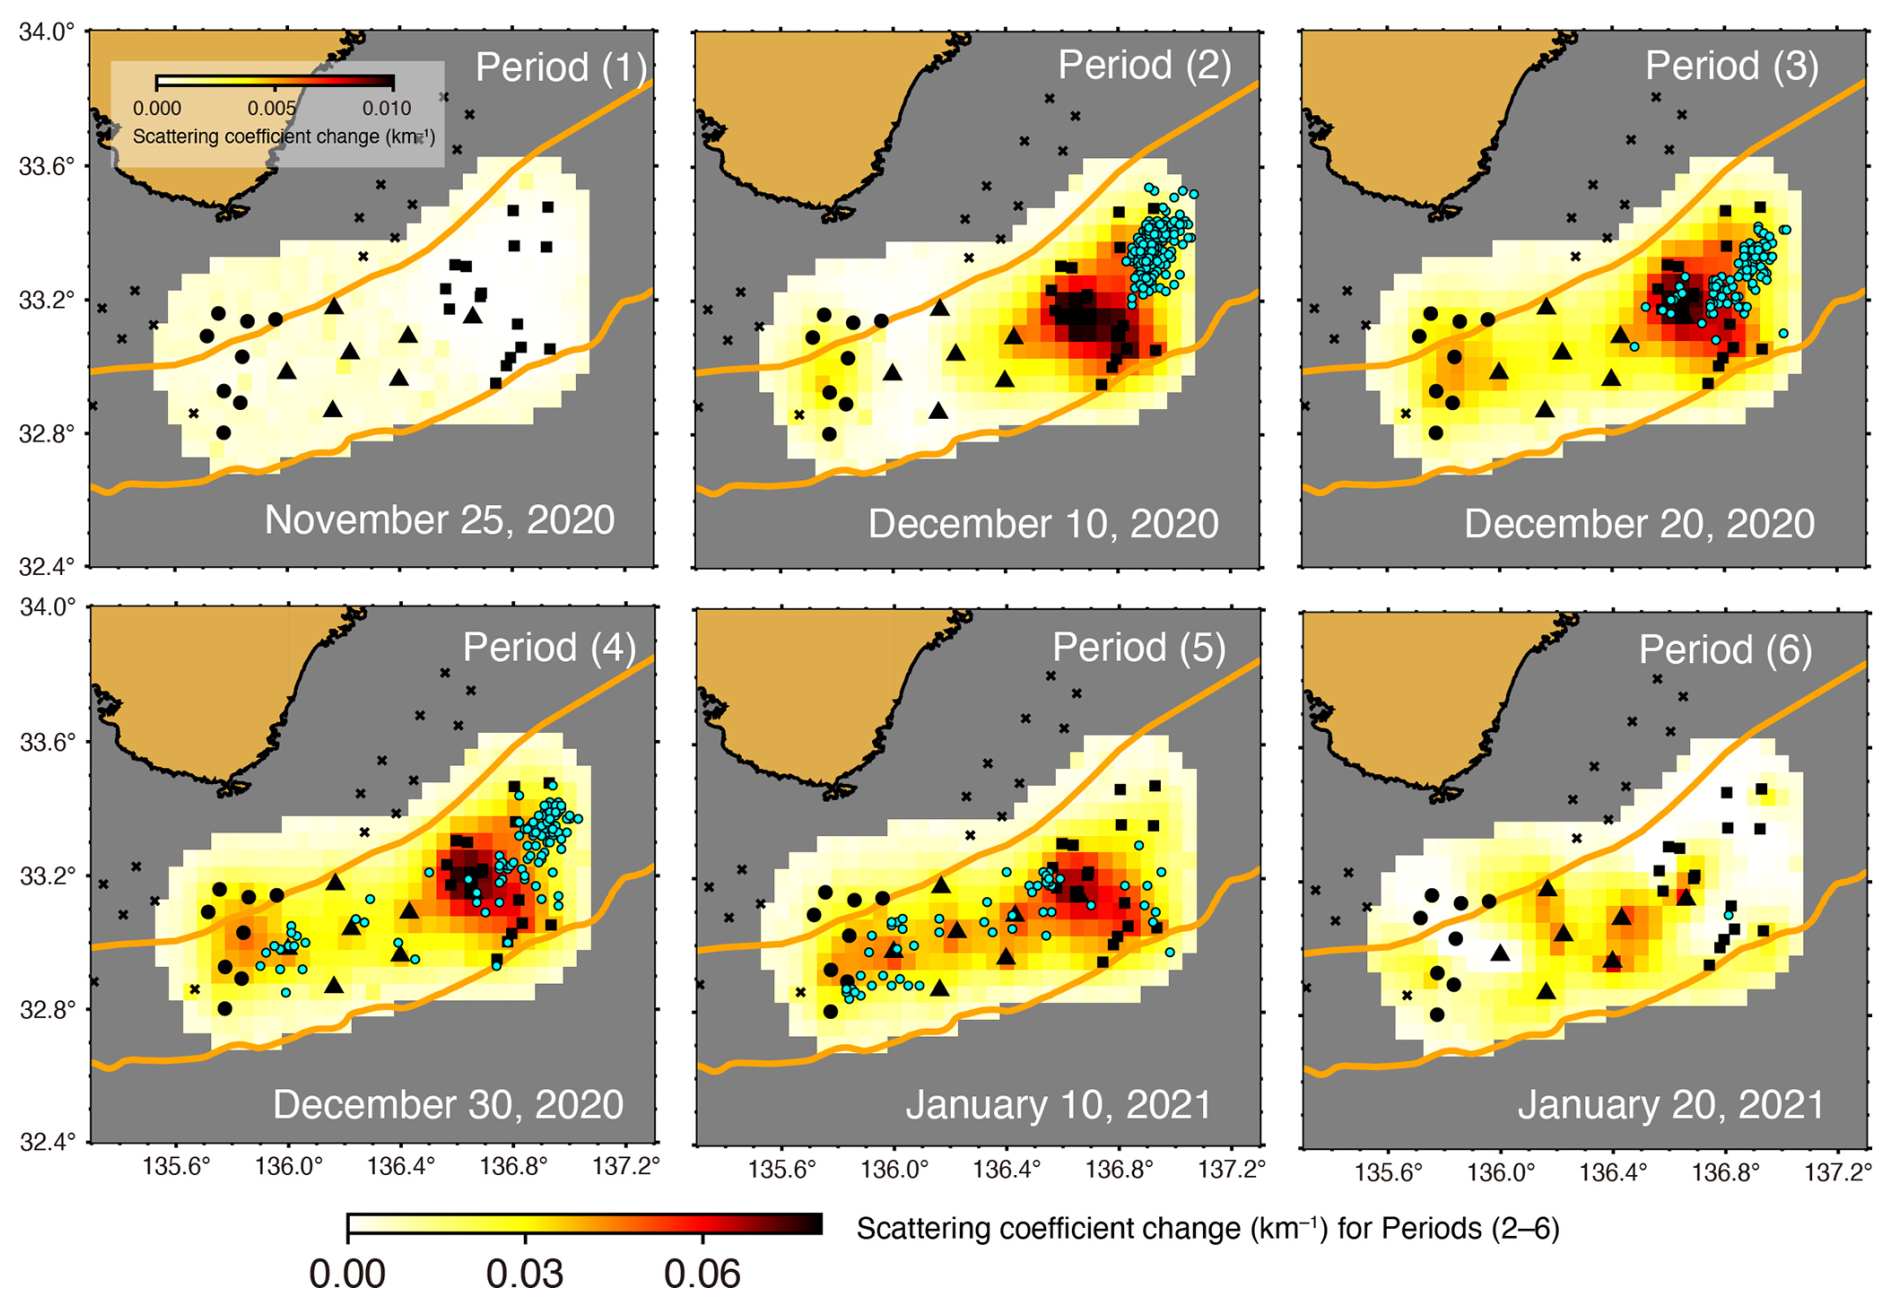
Figure 6Spatio-temporal scattering coefficient change (Δg) variations in Periods (1–6). Circles represent the tremor locations within ±5 d of the reference dates, determined by Tamaribuchi et al. (2022), from which tremors with spatial errors of ≤0.1° are plotted (16 % of tremors from the original catalog). Squares and circles indicate the DONET1 and DONET2 stations (KMB, KMC, KMD, MRD, and MRE), and triangles show temporary OBSs used in this analysis. Crosses represent the other stations. The amplitudes in Period (1) are low, and a different color scale is used.
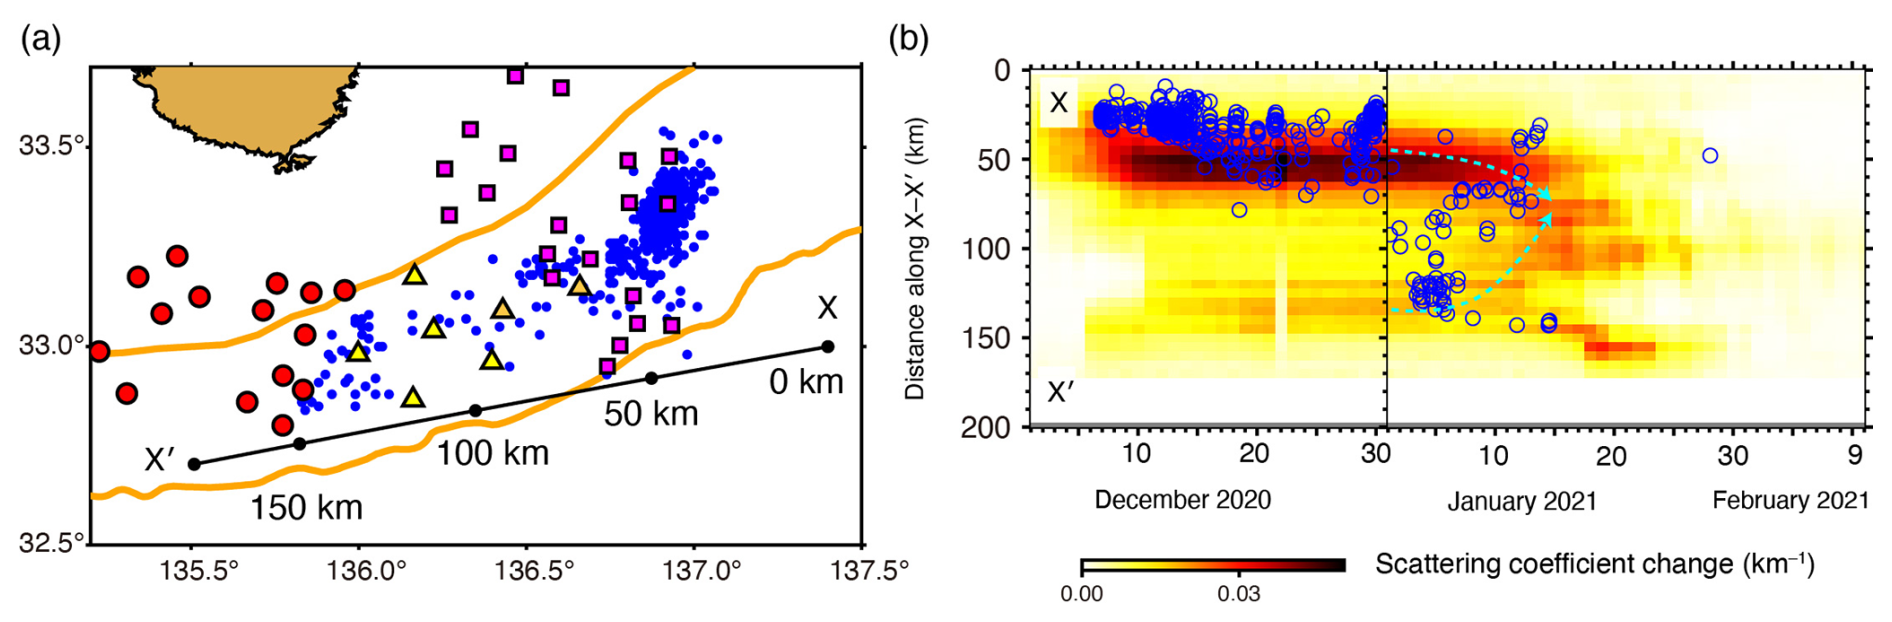
Figure 7Spatio-temporal scattering coefficient change (Δg) variations with tremors. (a) Tremor distribution (Tamaribuchi et al., 2022) and the line X–X′ at which the Δg and tremors are projected. Other symbols are the same as those used in Fig. 1. (b) Tremors and Δg projected onto the line X–X′ in panel (a). Arrows show that large Δg in the western and eastern parts are merged.
We estimated the and Δg for the dates of 1 April, 1 July, and 1 October in 2020 and 1 March and 1 April in 2021 using 20 d CCFs. These dates in 2020 and 2021 correspond to non-slow earthquake periods and post-slow earthquake periods, respectively (Figs. S5 and S6 in the Supplement). Δg does not change in these dates substantially. On the other hand, reductions relative to the reference period (21–30 November 2020) are observed on 1 April and 1 July in 2020. This is attributed to the long-term increase of that has been observed in this area (Tonegawa et al., 2022). After the slow earthquake activity, although reductions are also observed on 1 March and 1 April in 2021, recoveries of the reductions are not clearly imaged. The changes between the activity and post-activity appear to be too small to detect in the mapping.
5.1 Spatio-temporal relationship of and SCC (Δg) with tremors
A localized area of the reduction is observed in the eastern part of the survey area (Fig. 5). The reduction and tremor activities started from Period (2). Although the location of the maximum reduction is only at a small distance from the high-activity area of tremors during Periods (2–3), the reduction area covers the tremor distribution. The tremor activity area migrated westward in Periods (4–5) and reached the central and western parts of the survey area; however, there is no considerable change in the reduction area. These facts indicate that the areas of reduction and tremors are correlated only at the early stages of the episode.
The large Δg area is also localized in the eastern part of the survey area, and the extent of localization is higher than that of the reduction area. The large Δg was initiated at the timing of the tremor activity in Period (2). Although the location of the maximum Δg shifted slightly westward from the tremor activity area, the relatively large Δg area surrounding the maximum Δg covers the area of the tremors as well as that of the reduction. The tremor area moved to the location of the maximum Δg in Periods (3–4). The areas of tremors moved westward in Period (5), but the CC reduction area did not change. However, in Period (6), the CC reduction area moved westward approximately 10 d after the westward tremor migrations observed in Period (5) (Figs. 6 and 7).
5.2 Interpretation of temporal change difference in and SCC (Δg)
Our results indicate that the shows a step-like drop at the time of the slow earthquakes that began from the end of 2020, whereas the CC changes are recovered to the original level after the slow earthquake activity. Because CC reductions were observed during SSEs without or with fewer tremor activities, the effects of the tremor signal contaminations on CC measurements appear minor (Tonegawa et al., 2022). Although a step-like reduction was observed in this area due to the strong seafloor motions of the 2016 off-Mie earthquake (Mw 6.0) that occurred beneath DONET1 (Ikeda and Tsuji, 2018; Tonegawa et al., 2022), such strong motions were not observed during the slow earthquake episode. Although slow earthquake activity with tremors and VLFEs occurred in October 2015 (e.g., Annoura et al., 2017; Baba et al., 2020), reductions were not observed during this event (Ikeda and Tsuji, 2018; Tonegawa et al., 2022). Therefore, it appears that the and CC changes obtained in this study were a result of different factors that occurred within the accretionary prism.
A candidate for the observed reduction is the change in crack conditions due to the deformation within the accretionary prism (Fig. 8a). Prior to the slow earthquake activity, the compressional stress in the trough-normal direction is dominant in the accretionary prism, and cracks with a long axis oriented in the trough-normal direction are prevalent (e.g., Crampin 1977, 1981) (Fig. 8b). Slow earthquakes at the shallow plate interface generate extensional stress within the overlying plate, which reduces the compressional stress and results in the extensional deformation of the accretionary prism along the trough-normal direction. Such deformations induce changes in the aspect ratio of the pre-existing cracks normal to the trough axis, and new cracks parallel to the axis are created. The updated conditions of the stress field and cracks are preserved with a small degree of recovery after the slow earthquakes, and such recoveries can be observed from the beginning of 2021 to the end of the observation period at nodes KMB, KMC, and KMD (Figs. 4 and S2). In our observation, because the obtained changes are spatially limited to the eastern part of the survey region owing to the concentrated occurrence of tremors here (Tamaribuchi et al., 2022; Ogiso and Tamaribuchi, 2022), the deformation of the sediment also appears to be concentrated in this region. Thus, the mechanism that crack states are altered by the sediment deformation supports the step-like reduction observed in the region where tremors prevalently occurred.
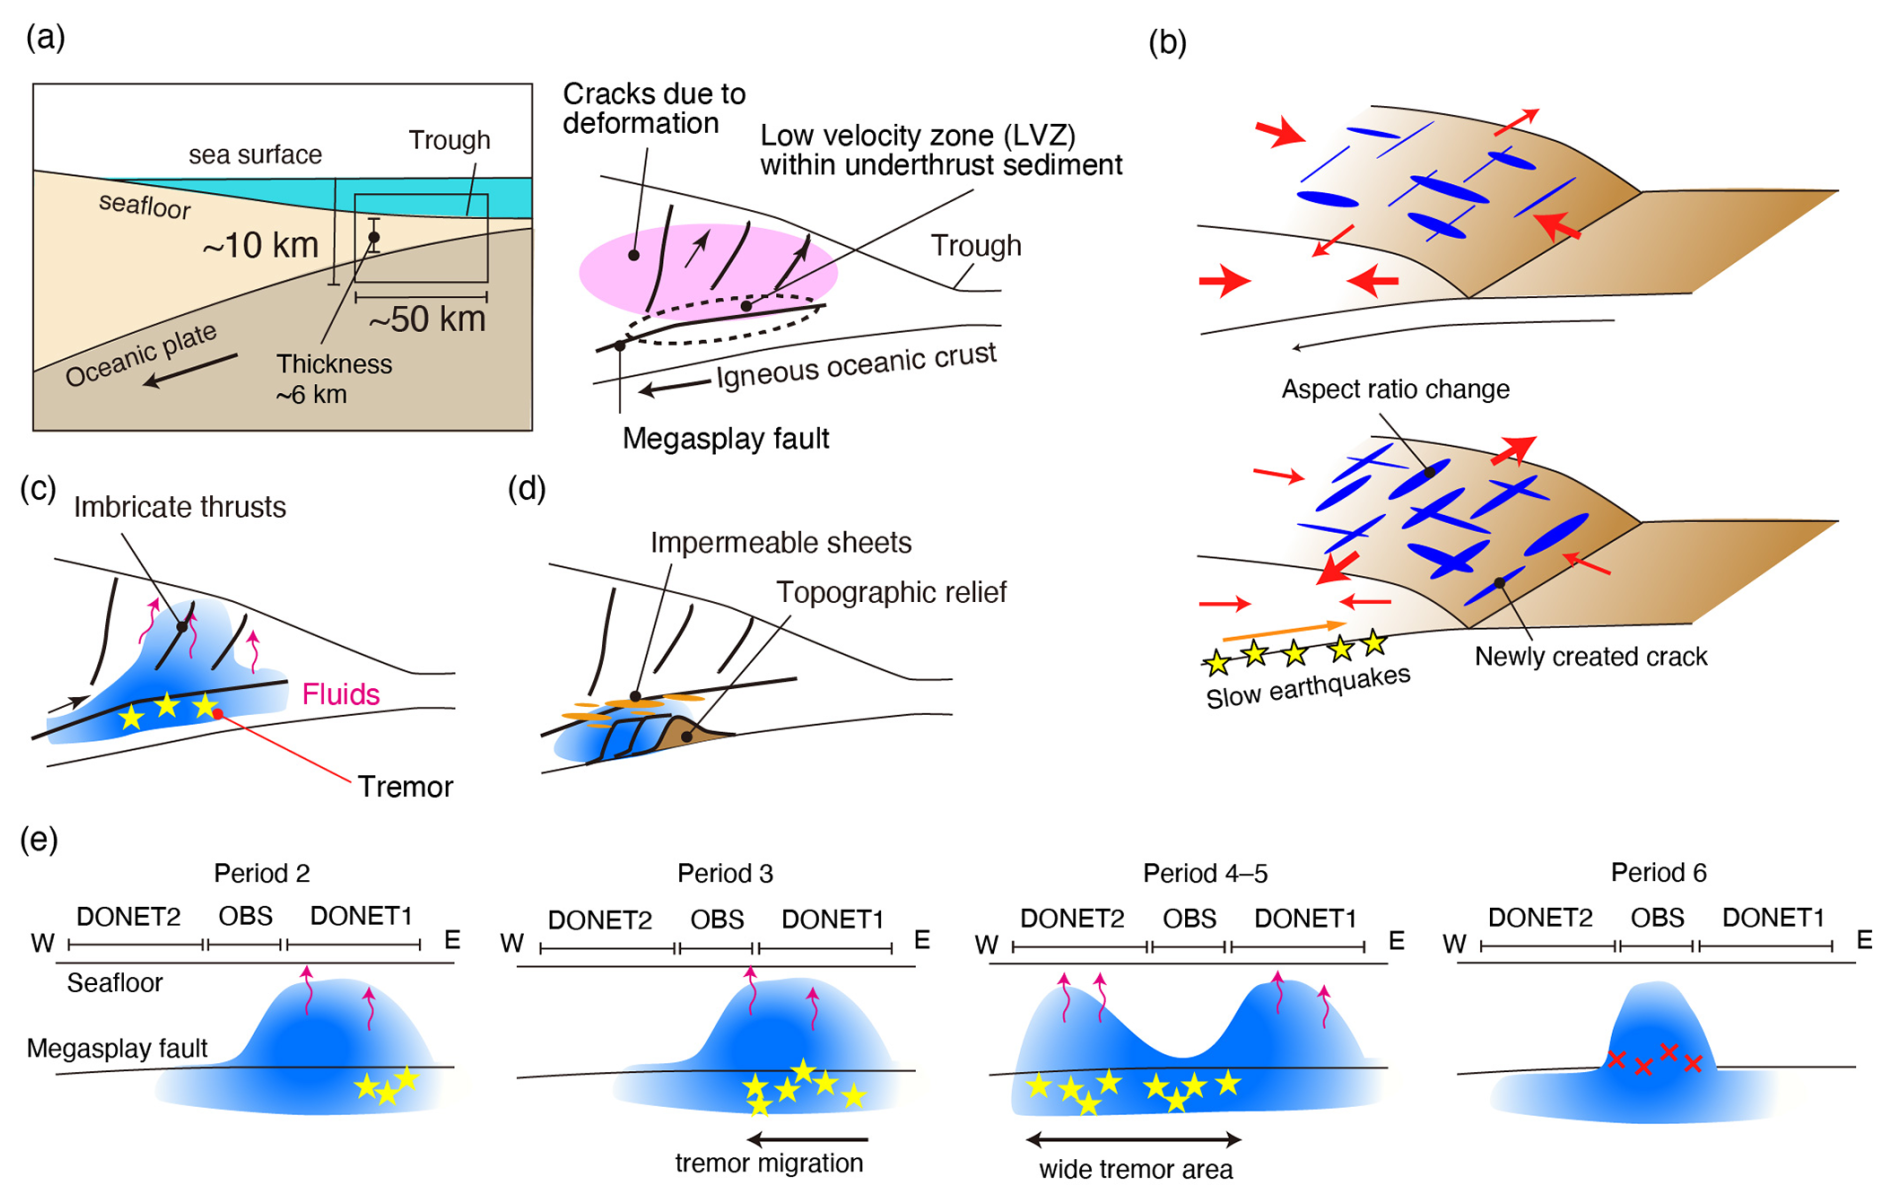
Figure 8Interpretation of our results with tremor and fluid distributions. (a) Illustration for crack creations due to the deformation causing a step-like reduction in . (b) Crack conditions for trough-normal compressional stress and newly created cracks and aspect ratio changes of pre-existing cracks during slow earthquakes. (c) Upward fluid migration during tremors (slow earthquakes) in the cross-section along the dipping direction. (d) Fluids are trapped by the impermeable sheets that are created by the deformation in topographic reliefs. (e) Spatio-temporal distributions of tremors and upward fluid migrations in the cross-sections along the strike direction. Crosses indicate the locations of caprock fractures.
In contrast, the CC reductions are recovered to the original level after the slow earthquake activity. Tonegawa et al. (2022) postulated that the CC reduction and its recovery are caused by transient upward fluid migrations at local scales (Fig. 8c). Based on the observations in this study and Tonegawa et al. (2022) – that upward fluid migrations intermittently occur – we suggest a possible scenario for fluid storage and upward migration in this paragraph and fluid trapping in the subsequent paragraph. Before slow earthquakes, the pore fluid pressure in the source region tends to increase with the fluid supply from the underlying oceanic crust through dehydration reactions (e.g., Kameda et al., 2011) and the accretionary prism itself by the tectonic compression (Saffer and Bekins, 1998). Although the uncertainties in the tremor depths are still high, the horizontal spatial coincidence between the VLFEs and the low-velocity layer within the accretionary prism has been observed (Tsuji et al., 2014; Tonegawa et al., 2022; Akuhara et al., 2020) (Fig. 8a). Several studies have also investigated whether tremor occurrences are related to the low-velocity layer (Hendriyana and Tsuji, 2021; Fahrudin et al., 2022; Akuhara et al., 2023b). The low-velocity layer has a thickness of ∼1 km and a horizontal distance of ∼15 km in the dip direction (Park et al., 2010). Because a high-pore-pressure region with a width of several hundred meters was found by a seafloor drilling program (Hirose et al., 2021), it seems that the low-velocity layer consists of many such high-pore-pressure volumes. Thus, it appears that fluids are trapped by impermeable caprocks in localized areas with low seismic velocities. Numerical simulations with hydraulic models also indicate the importance of impermeable zones to locally increase pore pressures (Kaneki and Noda, 2023). A previous study has reported that temporal changes in seismic velocity and anisotropic structures occurred during the rupture of a slow-slip patch in the Hikurangi subduction zone (Zal et al., 2020). When slow earthquakes occurred at the end of 2020, the caprocks fractured, and the trapped fluids migrated upwards. Our results of CC reductions reflect this fluid migration passing through shallow depths. In particular, the CC reductions in Period (6) are observed approximately 10 d after the tremor activities in the central part (Figs. 7 and 8e), which may correspond to the fracture-induced fluid migrations. This phenomenon was not documented in Tonegawa et al. (2022).
To increase pore fluid pressures in the source region, mechanisms that trap fluids within the accretionary prism are required, and the topographic relief of the top surface of the oceanic crust may be invoked for the fluid trapping. The topographic relief induces deformation at the downdip side of the relief (Fig. 8c). Such deformations intensively form horizontally sheeted clay minerals in and around the deformation area immediately above the oceanic crust, which can create impermeable caprocks. As a result, fluids cannot escape laterally or vertically and are trapped below the impermeable sheets; eventually the pore pressure becomes higher than that in the surrounding regions. Such fluid-trapped areas would have been created locally in several parts of the Nankai subduction zone, which may be related to the sporadic occurrences of the VLFEs. Indeed, VLFEs occur on the downdip sides of the topographic relief (Shiraishi et al., 2020; Hashimoto et al., 2022). Moreover, several discontinuous reflections with high-impedance contrasts are imaged within the low-velocity zone (Tsuji et al., 2014), which may represent impermeable sheets due to relief-induced deformations.
We present the temporal variations in and CC in the Nankai subduction zone associated with slow earthquake activity that began at the end of 2020. The variations exhibit step-like reductions at several pairs of stations that are located in the eastern part of the survey area. These features are considered to be constructed by changes in the aspect ratios of pre-existing cracks and/or newly created cracks due to the sediment deformation induced by the slow earthquake episode. The CC variations show the transient reductions in the eastern and western parts of the survey area, which are spatially correlated with the tremor distribution. The CC reductions can be considered to be linked to the transient fluid migration from the source region of the slow earthquakes. Thus, and CC are sensitive to different factors in the subseafloor structure, and we suggest that both the and CC variations be monitored for understanding the slow earthquake generations and their influence on the surrounding structure.
DONET data can be downloaded from the website operated by the National Research Institute for Earth Science and Disaster Resilience (NIED) (https://doi.org/10.17598/NIED.0008, NIED, 2019). The and CC data used in this study can be downloaded from the Zenodo repository (https://doi.org/10.5281/zenodo.15048965, Tonegawa, 2025).
The supplement related to this article is available online at https://doi.org/10.5194/se-16-579-2025-supplement.
TTo processed the data and drafted the manuscript. TA, ST, and TTs edited the paper and contributed to the interpretation. TA, YY, HS, and MS acquired the data. All authors contributed to the final version of the paper.
The contact author has declared that none of the authors has any competing interests.
Publisher's note: Copernicus Publications remains neutral with regard to jurisdictional claims made in the text, published maps, institutional affiliations, or any other geographical representation in this paper. While Copernicus Publications makes every effort to include appropriate place names, the final responsibility lies with the authors.
This work was supported by the Cooperative Research Program of Atmosphere and Ocean Research Institute, the University of Tokyo (research vessels Shinsei-maru, SH19-27, and S21-31).
This research has been supported by the Japan Society for the Promotion of Science (grant no. JP21H05202 in Scientific Research on Transformative Research Areas “Science of Slow-to-Fast Earthquakes”).
This paper was edited by Irene Bianchi and reviewed by Takashi Hirose and one anonymous referee.
Akuhara, T., Tsuji, T., and Tonegawa, T.: Overpressured Underthrust Sediment in the Nankai Trough Forearc Inferred From Transdimensional Inversion of High-Frequency Teleseismic Waveforms, Geophys. Res. Lett., 47, e2020GL088280, https://doi.org/10.1029/2020GL088280, 2020.
Akuhara, T., Yamashita, Y., Ohyanagi, S., Sawaki, Y., Yamada, T., and Shinohara, M.: Shallow Low-Velocity Layer in the Hyuga-Nada Accretionary Prism and Its Hydrological Implications: Insights From a Passive Seismic Array, J. Geophys. Res.-Sol. Ea., 128, e2022JB026298, https://doi.org/10.1029/2022JB026298, 2023a.
Akuhara, T., Yamashita, Y., Sugioka, H., and Shinohara, M.: Locating tectonic tremors with uncertainty estimates: time- and amplitude-difference optimization, wave propagation-based quality control and Bayesian inversion, Geophys. J. Int., 235, 2727–2742, https://doi.org/10.1093/gji/ggad387, 2023b.
Annoura, S., Hashimoto, T., Kamaya, N., and Katsumata, A.: Shallow episodic tremor near the Nankai Trough axis off southeast Mie prefecture, Japan, Geophys. Res. Lett., 44, 3564–3571, https://doi.org/10.1002/2017GL073006, 2017.
Aoi, S., Asano, Y., Kunugi, T., Kimura, T., Uehira, K., Takahashi, N., Ueda, H., Shiomi, K., Matsumoto, T., and Fujiwara, H.: MOWLAS: NIED observation network for earthquake, tsunami and volcano, Earth Planets Space, 72, 126, https://doi.org/10.1186/s40623-020-01250-x, 2020.
Arai, R., Miura, S., Nakamura, Y., Fujie, G., Kodaira, S., Kaiho, Y., Mochizuki, K., Nakata, R., Kinoshita, M., Hashimoto, Y., Hamada, Y., and Okino, K.: Upper-plate conduits linked to plate boundary that hosts slow earthquakes, Nat. Commun., 14, 5101, https://doi.org/10.1038/s41467-023-40762-4, 2023.
Araki, E., Saffer, D. M., Kopf, A. J., Wallace, L. M., Kimura, T., Machida, Y., Ide, S., Davis, E., and IODP Expedition 365 shipboard scientists: Recurring and triggered slow-slip events near the trench at the Nankai Trough subduction megathrust, Science, 356, 1157–1160, https://doi.org/10.1126/science.aan3120, 2017.
Ariyoshi, K., Iinuma, T., Nakano, M., Kimura, T., Araki, E., Machida, Y., Sueki, K., Yada, S., Nishiyama, T., Suzuki, K., Hori, T., Takahashi, N., and Kodaira, S.: Characteristics of Slow Slip Event in March 2020 Revealed From Borehole and DONET Observatories, Front. Earth Sci., 8, 600793, https://doi.org/10.3389/feart.2020.600793, 2021.
Asano, Y., Obara, K., and Ito, Y.: Spatiotemporal distribution of very-low frequency earthquakes in Tokachi-oki near the junction of the Kuril and Japan trenches revealed by using array signal processing, Earth Planets Space, 60, 871–875, 2008.
Audet, P. and Kim, Y.: Teleseismic constraints on the geological environment of deep episodic slow earthquakes in subduction zone forearcs: A review, Tectonophysics, 670, 1–15, https://doi.org/10.1016/j.tecto.2016.01.005, 2016.
Baba, S., Takemura, S., Obara, K., and Noda, A.: Slow Earthquakes Illuminating Interplate Coupling Heterogeneities in Subduction Zones, Geophys. Res. Lett., 47, e2020GL088089, https://doi.org/10.1029/2020GL088089, 2020.
Baba, T., Tanioka, Y., Cummins, P. R., and Uhira, K.: The slip distribution of the 1946 Nankai earthquake estimated from tsunami inversion using a new plate model, Phys. Earth Planet. In., 132, 59–73, https://doi.org/10.1016/S0031-9201(02)00044-4, 2002.
Bangs, N. L., Morgan, J. K., Bell, R. E., Han, S., Arai, R., Kodaira, S., Gase, A. C., Wu, X., Davy, R., Frahm, L., Tilley, H. L., Barker, D. H. N., Edwards, J. H., Tobin, H. J., Reston, T. J., Henrys, S. A., Moore, G. F., Bassett, D., Kellett, R., Stucker, V., and Fry, B.: Slow slip along the Hikurangi margin linked to fluid-rich sediments trailing subducting seamounts, Nat. Geosci., 16, 505–512, https://doi.org/10.1038/s41561-023-01186-3, 2023.
Brenguier, F., Shapiro, N. M., Campillo, M., Nercessian, A., and Ferrazzini, V.: 3-D surface wave tomography of the Piton de la Fournaise volcano using seismic noise correlations, Geophys. Res. Lett., 34, 1351–1355, https://doi.org/10.1029/2006GL028586, 2007.
Brenguier, F., Shapiro, N. M., Campillo, M. Ferrazzini, V., Duputel, Z., Coutant, O., and Nercessian, A.: Towards forecasting volcanic eruptions using seismic noise, Nat. Geosci., 1, 126–130, 2008.
Campillo, M. and Paul, A.: Long-Range Correlations in the Diffuse Seismic Coda, Science, 299, 547–549, https://doi.org/10.1126/science.1078551, 2003.
Crampin, S.: A review of the effects of anisotropic layering on the propagation of seismic waves, Geophys. J. Int., 49, 9–27, https://doi.org/10.1111/j.1365-246X.1977.tb03698.x, 1977.
Crampin, S.: A review of wave motion in anisotropic and cracked elastic-media, Wave Motion, 3, 343–391, https://doi.org/10.1016/0165-2125(81)90026-3, 1981.
Cruz-Atienza, V. M., Villafuerte, C., and Bhat, H. S.: Rapid tremor migration and pore-pressure waves in subduction zones, Nat. Commun., 9, 2900, https://doi.org/10.1038/s41467-018-05150-3, 2018.
Fahrudin, Chhun, C., and Tsuji, T.: Influence of shear zone thickness and strike-slip faulting on tectonic tremor in the Nankai Trough, southwest Japan, Tectonophysics, 838, 229519, https://doi.org/10.1016/j.tecto.2022.229519, 2022.
Gosselin, J. M., Audet, P., Esteve, C., McLellan, M., Mosher, S. G., and Schaeffer, A. J.: Seismic evidence for megathrust fault-valve behavior during episodic tremor and slip, Science Advances, 6, eaay5174, https://doi.org/10.1126/sciadv.aay5174, 2020.
Hashimoto, Y., Sato, S., Kimura, G., Kinoshita, M., Miyakawa, A., Moore, G. F., Nakano, M., Shiraishi, K., and Yamada, Y.: Décollement geometry controls on shallow very low frequency earthquakes, Sci. Rep.-UK, 12, 2677, https://doi.org/10.1038/s41598-022-06645-2, 2022.
Hendriyana, A. and Tsuji, T.: Influence of structure and pore pressure of plate interface on tectonic tremor in the Nankai subduction zone, Japan, Earth Planet. Sc. Lett., 558, 116742, https://doi.org/10.1016/j.epsl.2021.116742, 2021.
Hirose, F., Nakajima, J., and Hasegawa, A.: Three-dimensional seismic velocity structure and configuration of the Philippine Sea slab in southwestern Japan estimated by double-difference tomography, J. Geophys. Res., 113, B09315, https://doi.org/10.1029/2007JB005274, 2008.
Hirose, T., Nakahara, H., and Nishimura, T.: A Passive Estimation Method of Scattering and Intrinsic Absorption Parameters From Envelopes of Seismic Ambient Noise Cross-Correlation Functions, Geophys. Res. Lett., 46, 3634–3642, https://doi.org/10.1029/2018GL080553, 2019.
Hirose, T., Nakahara, H., Nishimura, T., and Campillo, M.: Locating Spatial Changes of Seismic Scattering Property by Sparse Modeling of Seismic Ambient Noise Cross-Correlation Functions: Application to the 2008 Iwate-Miyagi Nairiku (Mw 6.9), Japan, Earthquake, J. Geophys. Res.-Sol. Ea., 125, e2019JB019307, https://doi.org/10.1029/2019JB019307, 2020.
Hirose, T., Hamada, Y., Tanikawa, W., Kamiya, N., Yamamoto, Y., Tsuji, T., Kinoshita, M., Heuer, V. B., Inagaki, F., Morono, Y., and Kubo, Y.: High Fluid-Pressure Patches Beneath the Décollement: A Potential Source of Slow Earthquakes in the Nankai Trough off Cape Muroto, J. Geophys. Res.-Sol. Ea., 126, e2021JB021831, https://doi.org/10.1029/2021JB021831, 2021.
Ikeda, T. and Tsuji, T.: Temporal change in seismic velocity associated with an offshore MW 5.9 Off-Mie earthquake in the Nankai subduction zone from ambient noise cross-correlation, Prog. Earth Planet. Sci., 5, 62, https://doi.org/10.1186/s40645-018-0211-8, 2018.
Ito, Y. and Nakajima, J.: Temporal Variations in Frequency-Dependent Shear-Wave Anisotropy Above a Plate Interface Following Episodic Slow-Slip Events, J. Geophys. Res.-Sol. Ea., 129, e2023JB028526, https://doi.org/10.1029/2023JB028526, 2024.
Ito, Y. and Obara, K.: Very low frequency earthquakes within accretionary prisms are very low stress-drop earthquakes, Geophys. Res. Lett., 33, L09302, https://doi.org/10.1029/2006GL025883, 2006.
Kameda, J., Yamaguchi, A., Saito, S., Sakuma, H., Kawamura, K., and Kimura, G.: A new source of water in seismogenic subduction zones, Geophys. Res. Lett., 38, L22306, https://doi.org/10.1029/2011GL048883, 2011.
Kamei, R., Pratt, R. G., and Tsuji, T.: Waveform tomography imaging of a megasplay fault system in the seismogenic Nankai subduction zone, Earth Planet. Sc. Lett., 317–318, 343–353, https://doi.org/10.1016/j.epsl.2011.10.042, 2012.
Kaneda, Y., Kawaguchi, K., Araki, E., Matsumoto, H., Nakamura, T., Kamiya, S., Ariyoshi, K., Hori, T., Baba, T., and Takahashi, N.: Development and application of an advanced ocean floor network system for megathrust earthquakes and tsunamis, in: Seafloor Observatories, edited by: Favali, P., Beranzoli, L., and De Santis, A., Springer Berlin Heidelberg, Berlin, Heidelberg, 643–662, https://doi.org/10.1007/978-3-642-11374-1_25, 2015.
Kaneki, S. and Noda, H.: Steady-State Effective Normal Stress in Subduction Zones Based on Hydraulic Models and Implications for Shallow Slow Earthquakes, J. Geophys. Res.-Sol. Ea., 128, e2022JB025995, https://doi.org/10.1029/2022JB025995, 2023.
Kaneko, L., Ide, S., and Nakano, M.: Slow Earthquakes in the Microseism Frequency Band (0.1–1.0 Hz) off Kii Peninsula, Japan, Geophys. Res. Lett., 45, 2618–2624, https://doi.org/10.1002/2017GL076773, 2018.
Kawaguchi, K., Kaneko, S., Nishida, T., and Komine, T.: Construction of the DONET real-time seafloor observatory for earthquakes and tsunami monitoring, in: Seafloor Observatories, edited by: Favali, P., Beranzoli, L., and De Santis, A., Springer Berlin Heidelberg, Berlin, Heidelberg, 211–228, https://doi.org/10.1007/978-3-642-11374-1_10, 2015.
Kitajima, H. and Saffer, D. M.: Elevated pore pressure and anomalously low stress in regions of low frequency earthquakes along the Nankai Trough subduction megathrust, Geophys. Res. Lett., 39, L23301, https://doi.org/10.1029/2012GL053793, 2012.
Nakajima, J. and Hasegawa, A.: Tremor activity inhibited by well-drained conditions above a megathrust, Nat. Commun., 7, 13863, https://doi.org/10.1038/ncomms13863, 2016.
Nakajima, J. and Uchida, N.: Repeated drainage from megathrusts during episodic slow slip, Nat. Geosci., 11, 351–356, https://doi.org/10.1038/s41561-018-0090-z, 2018.
Nakano, M., Nakamura, T., Kamiya, S., Ohori, M., and Kaneda, Y.: Intensive seismic activity around the Nankai trough revealed by DONET ocean-floor seismic observations, Earth Planets Space, 65, 5–15, https://doi.org/10.5047/eps.2012.05.013, 2013.
Nakano, M., Hori, T., Araki, E., Kodaira, S., and Ide, S.: Shallow very-low-frequency earthquakes accompany slow slip events in the Nankai subduction zone, Nat. Commun., 9, 984, https://doi.org/10.1038/s41467-018-03431-5, 2018.
NIED: National Research Institute for Earth Science and Disaster Resilience, Resilience (NIED) DONET [data set], https://doi.org/10.17598/NIED.0008, 2019.
Obara, K. and Ito, Y.: Very low frequency earthquakes excited by the 2004 off the Kii peninsula earthquakes: A dynamic deformation process in the large accretionary prism, Earth Planets Space, 57, 321–326, 2005.
Obara, K. and Kato, A.: Connecting slow earthquakes to huge earthquakes, Science, 353, 253–257, https://doi.org/10.1126/science.aaf1512, 2016.
Obermann, A., Planès, T., Larose, E., and Campillo, M.: Imaging preeruptive and coeruptive structural and mechanical changes of a volcano with ambient seismic noise, J. Geophys. Res.-Sol. Ea., 118, 6285–6294, https://doi.org/10.1002/2013JB010399, 2013.
Obermann, A., Froment, B., Campillo, M., Larose, E., Planès, T., Valette, B., Chen, J. H., and Liu, Q. Y.: Seismic noise correlations to image structural and mechanical changes associated with the Mw 7.9 2008 Wenchuan earthquake, J. Geophys. Res.-Sol. Ea., 119, 3155–3168, https://doi.org/10.1002/2013JB010932, 2014.
Obermann, A., Kraft, T., Larose, E., and Wiemer, S.: Potential of ambient seismic noise techniques to monitor the St. Gallen geothermal site (Switzerland), J. Geophys. Res.-Sol. Ea., 120, 4301–4316, https://doi.org/10.1002/2014JB011817, 2015.
Ogiso, M. and Tamaribuchi, K.: Spatiotemporal evolution of tremor activity near the Nankai Trough trench axis inferred from the spatial distribution of seismic amplitudes, Earth Planets Space, 74, 49, https://doi.org/10.1186/s40623-022-01601-w, 2022.
Park, J.-O., Fujie, G., Wijerathne, L., Hori, T., Kodaira, S., Fukao, Y., Moore, G. F., Bangs, N. L., Kuramoto, S., and Taira, A.: A low-velocity zone with weak reflectivity along the Nankai subduction zone, Geology, 38, 283–286, https://doi.org/10.1130/G30205.1, 2010.
Poupinet, G., Ellsworth, W. L., and Frechet, J.: Monitoring velocity variations in the crust using earthquake doublets: An application to the Calaveras Fault, California, J. Geophys. Res.-Sol. Ea., 89, 5719–5731, https://doi.org/10.1029/JB089iB07p05719, 1984.
Saffer, D. M. and Bekins, B. A.: Episodic fluid flow in the Nankai accretionary complex: Timescale, geochemistry, flow rates, and fluid budget, J. Geophys. Res.-Sol. Ea., 103, 30351–30370, 1998.
Sánchez-Pastor, P., Obermann, A., and Schimmel, M.: Detecting and Locating Precursory Signals During the 2011 El Hierro, Canary Islands, Submarine Eruption, Geophys. Res. Lett., 45, 10288–10297, https://doi.org/10.1029/2018GL079550, 2018.
Sens-Schonfelder, C. and Wegler, U.: Passive image interferometry and seasonal variations of seismic velocities at Merapi Volcano, Indonesia, Geophys. Res. Lett., 33, L21302, https://doi.org/10.1029/2006GL027797, 2006.
Shapiro, N. M., Campillo, M., Stehly, L., and Ritzwoller, M. H.: High-Resolution Surface-Wave Tomography from Ambient Seismic Noise, Science, 307, 1615–1618, https://doi.org/10.1126/science.1108339, 2005.
Shelly, D. R., Beroza, G. C., Ide, S., and Nakamula, S.: Low-frequency earthquakes in Shikoku, Japan, and their relationship to episodic tremor and slip, Nature, 442, 188–191, https://doi.org/10.1038/nature04931, 2006.
Shiraishi, K., Yamada, Y., Nakano, M., Kinoshita, M., and Kimura, G.: Three-dimensional topographic relief of the oceanic crust may control the occurrence of shallow very-low-frequency earthquakes in the Nankai Trough off Kumano, Earth Planets Space, 72, 72, https://doi.org/10.1186/s40623-020-01204-3, 2020.
Sugioka, H., Okamoto, T., Nakamura, T., Ishihara, Y., Ito, A., Obana, K., Kinoshita, M., Nakahigashi, K., Shinohara, M., and Fukao, Y.: Tsunamigenic potential of the shallow subduction plate boundary inferred from slow seismic slip, Nat. Geosci., 5, 414–418, https://doi.org/10.1038/ngeo1466, 2012.
Takemura, S., Matsuzawa, T., Noda, A., Tonegawa, T., Asano, Y., Kimura, T., and Shiomi, K.: Structural Characteristics of the Nankai Trough Shallow Plate Boundary Inferred From Shallow Very Low Frequency Earthquakes, Geophys. Res. Lett., 46, 4192–4201, https://doi.org/10.1029/2019GL082448, 2019.
Takemura, S., Hamada, Y., Okuda, H., Okada, Y., Okubo, K., Akuhara, T., Noda, A., and Tonegawa, T.: A review of shallow slow earthquakes along the Nankai Trough, Earth Planets Space, 75, 164, https://doi.org/10.1186/s40623-023-01920-6, 2023.
Takeo, A., Forsyth, D. W., Weeraratne, D. S., and Nishida, K.: Estimation of azimuthal anisotropy in the NW Pacific from seismic ambient noise in seafloor records, Geophys. J. Int., 199, 11–22, https://doi.org/10.1093/gji/ggu240, 2014.
Tamaribuchi, K., Ogiso, M., and Noda, A.: Spatiotemporal Distribution of Shallow Tremors Along the Nankai Trough, Southwest Japan, as Determined From Waveform Amplitudes and Cross-Correlations, J. Geophys. Res.-Sol. Ea., 127, e2022JB024403, https://doi.org/10.1029/2022JB024403, 2022.
Thery, R., Guillemot, A., Abraham, O., and Larose, E.: Tracking fluids in multiple scattering and highly porous materials: Toward applications in non-destructive testing and seismic monitoring, Ultrasonics, 102, 106019, https://doi.org/10.1016/j.ultras.2019.106019, 2020.
Tonegawa, T.: Dataset of and CC using DONET and temporary OBSs in the Nankai subduction zone, Zenodo [data set], https://doi.org/10.5281/zenodo.15048965, 2025.
Tonegawa, T., Fukao, Y., Takahashi, T., Obana, K., Kodaira, S., and Kaneda, Y.: Ambient seafloor noise excited by earthquakes in the Nankai subduction zone, Nat. Commun., 6, 6132, https://doi.org/10.1038/ncomms7132, 2015.
Tonegawa, T., Araki, E., Kimura, T., Nakamura, T., Nakano, M., and Suzuki, K.: Sporadic low-velocity volumes spatially correlate with shallow very low frequency earthquake clusters, Nat. Commun., 8, 2048, https://doi.org/10.1038/s41467-017-02276-8, 2017.
Tonegawa, T., Kimura, T., and Araki, E.: Near-Field Body-Wave Extraction From Ambient Seafloor Noise in the Nankai Subduction Zone, Front. Earth Sci., 8, 610993, https://doi.org/10.3389/feart.2020.610993, 2021.
Tonegawa, T., Takemura, S., Yabe, S., and Yomogida, K.: Fluid Migration Before and During Slow Earthquakes in the Shallow Nankai Subduction Zone, J. Geophys. Res.-Sol. Ea., 127, e2021JB023583, https://doi.org/10.1029/2021JB023583, 2022.
Tsuji, S., Araki, E., Yokobiki, T., Nishida, S., Machida, Y., Zumberge, M., and Takahashi, K.: Precise tilt measurement by seafloor borehole tiltmeters at the Nankai Trough subduction zone, Earth Planets Space, 75, 188, https://doi.org/10.1186/s40623-023-01946-w, 2023.
Tsuji, T., Kamei, R., and Pratt, R. G.: Pore pressure distribution of a mega-splay fault system in the Nankai Trough subduction zone: Insight into up-dip extent of the seismogenic zone, Earth Planet. Sc. Lett., 396, 165–178, https://doi.org/10.1016/j.epsl.2014.04.011, 2014.
Yabe, S., Tonegawa, T., and Nakano, M.: Scaled Energy Estimation for Shallow Slow Earthquakes, J. Geophys. Res.-Sol. Ea., 124, 1507–1519, https://doi.org/10.1029/2018JB016815, 2019.
Yamamoto, Y., Ariyoshi, K., Yada, S., Nakano, M., and Hori, T.: Spatio-temporal distribution of shallow very-low-frequency earthquakes between December 2020 and January 2021 in Kumano-nada, Nankai subduction zone, detected by a permanent seafloor seismic network, Earth Planets Space, 74, 14, https://doi.org/10.1186/s40623-022-01573-x, 2022.
Yokota, Y. and Ishikawa, T.: Shallow slow slip events along the Nankai Trough detected by GNSS-A, Science Advances, 6, eaay5786, https://doi.org/10.1126/sciadv.aay5786, 2020.
Zal, H. J., Jacobs, K., Savage, M. K., Yarce, J., Mroczek, S., Graham, K., Todd, E. K., Nakai, J., Iwasaki, Y., Sheehan, A., Mochizuki, K., Wallace, L., Schwartz, S., Webb, S., and Henrys, S.: Temporal and spatial variations in seismic anisotropy and ratios in a region of slow slip, Earth Planet. Sc. Lett., 532, 115970, https://doi.org/10.1016/j.epsl.2019.115970, 2020.