the Creative Commons Attribution 4.0 License.
the Creative Commons Attribution 4.0 License.
 | 10 Sep 2025
Using nanoindentation to quantify the mechanical profile of the Wufeng–Longmaxi Formation in southwestern China: link to sedimentary conditions
Jianfeng Wang
Chao Yang
Yuke Liu
Wenmin Jiang
Yun Li
Ting Zhang
Yijun Zheng
Yuhong Liao
Qiuli Huo
Li Fu
Yusheng Wang
Ping'an Peng
Yongqiang Xiong
The fine construction of a continuous mechanical profile for the Wufeng–Longmaxi (WF-LMX) Formation is crucial for designing hydraulic fracturing projects in shale gas development, which however is generally difficult to achieve by conventional macroscopic mechanical testing methods due to the difficulty in obtaining continuous block shale samples. This study employed the nanoindentation technique to achieve the continuous mechanical characterization of the WF-LMX Formation and correlated the mechanical stratigraphic profile to the sedimentary conditions. A total of 27 cutting samples were collected at 1–1.5 m intervals from the Sanquan-1 (SQ-1) well. Nanoindentation testing, rock mineralogy, major element analysis, and porosimetry were performed. The results showed that the WF-LMX shales in this study region were deposited in a passive continental margin environment, primarily from biogenic silica. Mechanical properties (hardness, fracture toughness, Young's modulus, and brittle index) varied synchronously with mineral and organic content across the vertical drilling profile, reflecting changes in lithology and sedimentary facies within the WF-LMX Formation. Shales in the upper part of the WF Formation and lower part of the LMX Formation, belonging to the deep-water shelf facies, exhibited high mechanical properties. Quartz and clay play a dominant role in controlling shale mechanics, while the minor rock constituents and nanoporosity have little effect. In particular, biogenic silica (authigenic quartz) plays an important role in increasing the brittleness of shale. The effect of shale constituents on micromechanics is essentially controlled by the sedimentary environment. Additionally, the potential of using nanoindentation to effectively assess shale brittleness was also demonstrated. This study provides a continuous and accurate interpretation profile of mechanical parameters and is helpful in determining favorable intervals for hydraulic fracturing in the design of shale gas development.
- Article
(10049 KB) - Full-text XML
-
Supplement
(483 KB) - BibTeX
- EndNote


Shale gas is a significant unconventional hydrocarbon resource in China and occurs in shale-dominated formations with low porosity and low permeability (Zou et al., 2010). Realizing commercial development of shale gas requires large-scale reservoir fracturing of shale formations (Guo et al., 2014). The optimal design of reservoir stimulation (i.e., hydraulic fracturing) highly depends on the reliable measurement of the mechanics of shale at different scales, which remains an ongoing challenge (Rickman et al., 2008; Sone and Zoback, 2013a, b). In the past, the uniaxial/triaxial compression and the acoustic emission tests were the most common methods to investigate the mechanical properties of shale rock. These tests are conducted on centimeter-sized cores, thus obtaining shale mechanics at core scale. Although these macroscopic mechanical testing methods can provide reliable and directly applicable rock mechanics data for exploration and development, they are always flawed, especially when mechanical characterization of the entire shale formation is required to optimize favorable fracture intervals, since they rely on bulky core samples that are typically difficult to obtain (Alramahi and Sundberg, 2012; Sone and Zoback, 2013a).
Nanoindentation, a technique widely used in micromechanical characterization, is increasingly being used to evaluate the micromechanical properties of shales (Ulm et al., 2005). It involves pressing a hard needle tip into the surface of the material, thus requiring small sample volumes on the millimeter scale. Because drill cuttings (at the millimeter scale) can meet the requirements of nanoindentation mechanical testing and are readily available, the nanoindentation can achieve accurate mechanical characterization of the entire shale formation. By adjusting the indentation depth or applied load, elastic–plastic parameters such as hardness and Young's modulus of materials can be quickly derived from the load–displacement curves (Oliver and Pharr, 1992). In addition, by developing mathematical models, scholars have also used indentation data to calculate other mechanical parameters, including fracture toughness characterizing the ability of a material to resist crack propagation and brittleness index quantifying the fracturability of materials (Lawn and Marshall, 1979; Ma et al., 2023). In order to determine the micromechanical properties of shales by nanoindentation, it is crucial to develop an appropriate indentation protocol, highlighting the importance of establishing a well-designed approach in this field, because shales have a more pronounced size effect and transverse heterogeneity at the microscale (Ulm and Abousleiman, 2006; Wang et al., 2022a, 2023; Yang et al., 2020). Currently, a statistical grid nanoindentation scheme is widely used, which is based on averaging a large amount of mechanical data from a series of indentations performed over a sufficiently large area and using large indentation loads (200–500 mN) (Abedi et al., 2016; Gupta et al., 2018; 2020; Kumar et al., 2012; Long et al., 2021; Shi et al., 2019a, b, 2020; Shukla et al., 2013; Zhao et al., 2019). The use of a relatively large load is to indent a large volume to involve more matrix phases in each indentation (i.e., to reduce the impact of size effects), and the use of a nanoindentation campaign is to make the results more statistically significant (i.e., to reduce the impact of heterogeneity). A large number of indentation cases indicate that this method is reliable and scientific for obtaining the micromechanical properties of shale. Besides, some research indicates that the Young's modulus determined by acoustic emission testing correlates well with measurements obtained by nanoindentation (Kumar et al., 2012). In general, the mechanical properties (mainly Young's modulus) measured by nanoindentation can provide us with an efficient approach to analyze the mechanical properties and variation patterns of specific shale formation at the microscopic scale.
The Wufeng–Longmaxi (WF-LMX) Formation shales are the primary marine formations for shale gas exploration and development in southern China, with commercial developments successfully implemented in several locations, including Fuling, Changning, and Weiyuan in Sichuan Province, China (Zou et al., 2010). In particular, the marine black shales of the WF-LMX Formation were predominantly deposited in a deep-water shelf environment characterized by strong reducing conditions (Zou et al., 2010). To date, extensive research has been conducted and documented on the geologic characteristics of areas conducive to WF-LMX shale gas accumulation (Guo and Zeng, 2015; Yan et al., 2018; Zheng et al., 2022; Zou et al., 2010). Currently, engineering challenges have emerged as critical to the success of shale gas development. Among these, rock mechanics research, particularly as it relates to hydraulic fracturing, has been at the forefront of research efforts. Previous mechanical research on the WF-LMX shale was mainly based on macromechanical testing (Guo et al., 2019; Jia et al., 2021b). Although many significant achievements and insights have been made to guide exploration and production, several challenges remain, such as determining exactly how changes in stratigraphy correlate with changes in the mechanical properties of a shale sequence, which can then be used to identify the most suitable intervals for hydraulic fracturing operations (Sethi et al., 2024). Previous studies have attempted to use macroscopic testing to establish the relationship between macroscopic mechanics and sedimentary conditions (Li et al., 2024; Sethi et al., 2024), but they were not able to characterize shale strata continuously or accurately depict the correlation between shale mechanics and sedimentary conditions, especially for the fragile shale samples. Nanoindentation can overcome sampling problems, and a single mechanical test can simultaneously obtain these mechanical parameters. Recent literature mainly discusses the selection of indentation method (Du et al., 2021; Jia et al., 2021a; Shi et al., 2019b; Wang et al., 2022b), fluid influence (Yang et al., 2018, 2016), and component analysis of small sample size for the study of WF-LMX shale mechanics (Long et al., 2021). Few studies concerning the geological effects have been conducted on the micromechanical properties of shales (Charlton et al., 2023). To the best of our knowledge, there have been no investigations focusing on the microscale mechanical properties, namely elasticity, plasticity, toughness, and brittleness, of the marine shale of the WF-LMX Formation along the southeastern margin of the Sichuan Basin and how these properties are related to sedimentary conditions.
In this study, we aim to use nanoindentation technology to perform a thorough mechanical characterization of WF-LMX shales at the microscale and to quantitatively assess the mechanical profile of WF-LMX shales. Specifically, in order to obtain micromechanical parameters, we used a novel method to calculate the shale brittleness index based on nanoindentation data. Additionally, we aim to correlate the measured micromechanical data with the sedimentary conditions (e.g., redox condition and bedding) and rock physics (petromineralogy, reservoir space) of the WF-LMX Formation. This correlation will enable us to identify the controlling factors of shale mechanics at the microscale and to investigate how lithofacies influence the micromechanical profile of WF-LMX shales. In general, this mechanical study of WF-LMX shales in the whole layer using the nanoindentation technique overcomes the limitations of traditional mechanical testing associated with sample availability. This approach provides a continuous and accurate interpretation profile of mechanical parameters for the design of shale gas development.
The Sichuan Basin and surrounding regions were characterized as stagnant basins during the Late Ordovician to Early Silurian, resulting in the formation of extensive low-energy and anoxic sedimentary environments (Chen et al., 2014). During this period, two significant global transgressions occurred, which contributed to extensive organic-rich shale intervals within the WF Formation and the bottom part of the LMX Formation (see Fig. 1a). The black shale gradually shifted from the central sedimentary region to the source region (as shown in Fig. 1a), while the paleoenvironment gradually evolved from deep-water shelf environments to semi-deep-water environments and finally to shallow-water shelf environments (Guo and Zeng, 2015).
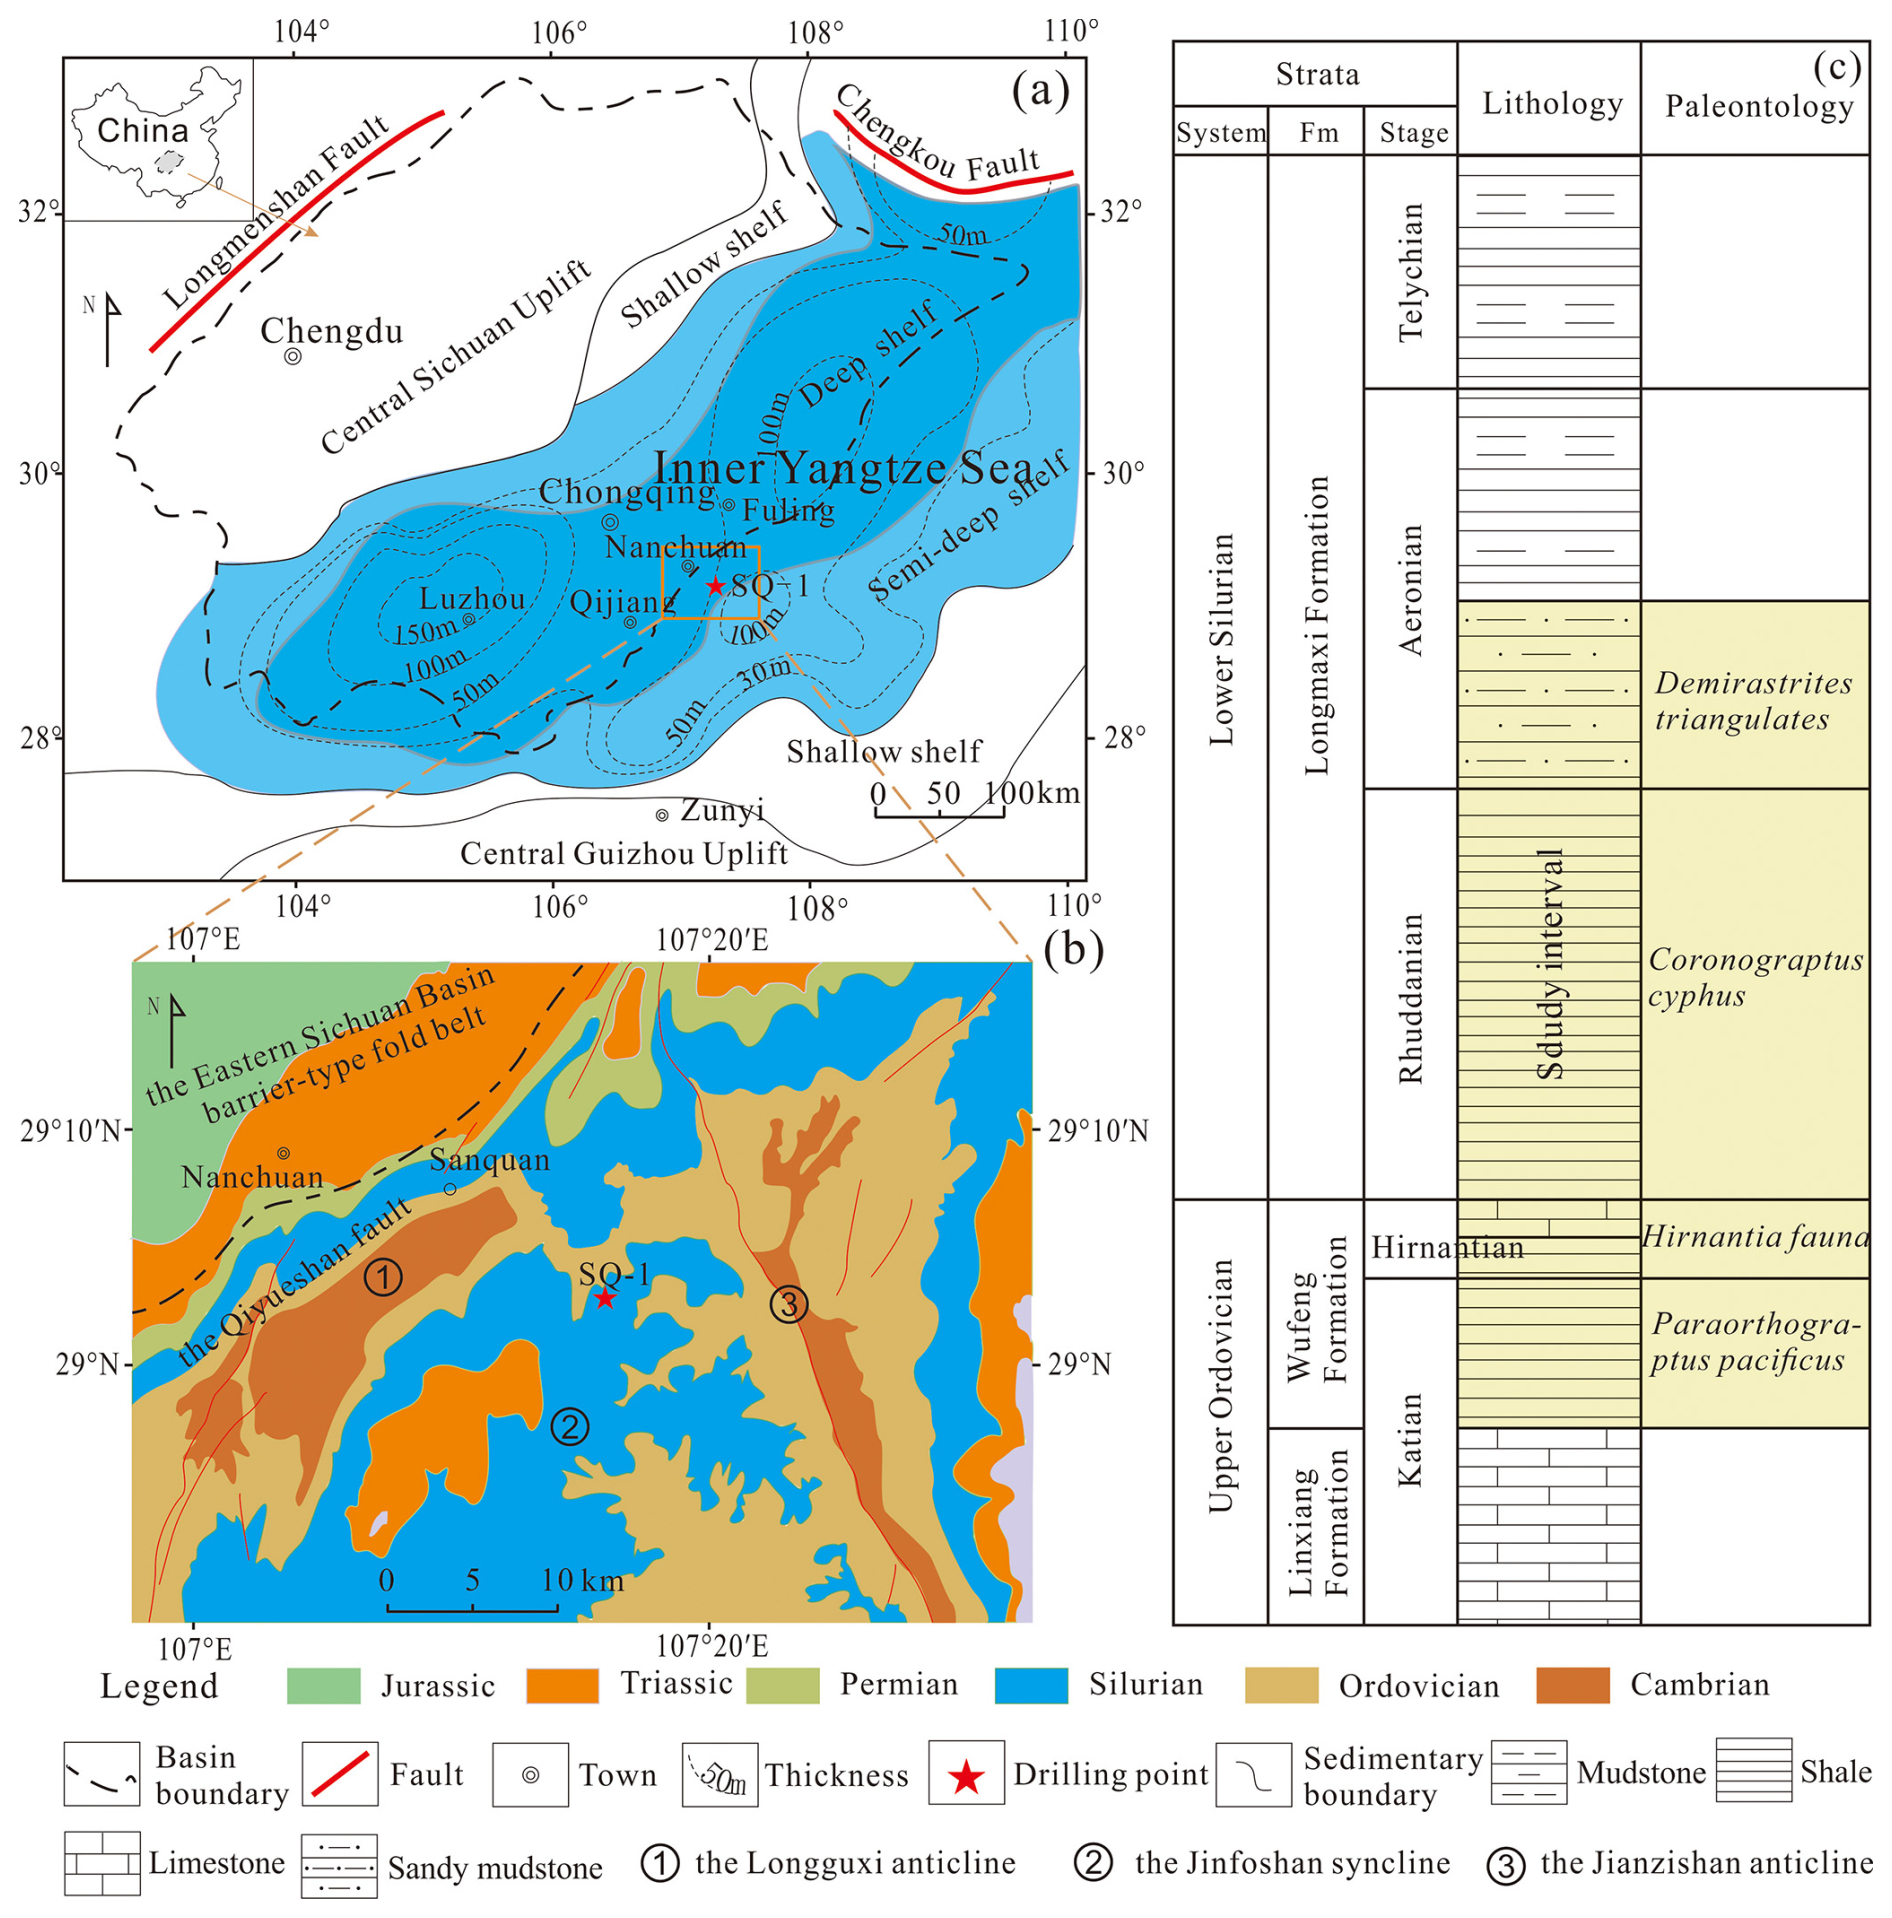
Figure 1Panel (a) shows a paleogeographic map of the Sichuan Basin and adjacent regions during the Early Silurian. Panel (b) shows the regional, structural, and geological profiles of the Sanquan region, highlighting the exposed strata and the Sanquan-1 well. Panel (c) shows the stratigraphic, lithologic, and paleontologic column, along with the intervals under study (modified from Zheng et al., 2018). Fm = Formation.
The Sanquan-1 (SQ-1) well, located in Sanquan Town, Nanchuan District, Chongqing City, within the Sichuan Basin of China (as shown in Fig. 1b), is located on the crest of an anticline and to the east of the Qiyue Shan Fault (see Fig. 1b). Core shale samples were collected from the Upper Ordovician Wufeng Formation and the lower part of the Silurian Longmaxi Formation (as shown in Fig. 1c). The stratigraphy of the SQ-1 well consists of muddy limestone, siliceous shale, carbonaceous shale, black shale, sandy mudstone, and mudstone in sequence from base to top. According to biostratigraphy, petrography, and gamma rays (GRs), the sequence stratigraphy of the SQ-1 well can be distinguished (Fig. 1c). There are two sections in the Longmaxi Formation of the SQ-1 well: the Rhuddanian and Aeronian stages. The Rhuddanian stage, ranging from 60.5 to 84.7 m in depth, consists of black carbonaceous and black shale. The Aeronian stage, from 11 to 60.5 m, consists of black shale and grayish-black argillaceous sandstone (Fig. 1c). The WF Formation (84.7–90.0 m) contains two parts, the Katian stage (86.0–90.0 m) and the Hirnantian stage (84.7–86.0 m) (Zheng et al., 2018).
3.1 Shale rock samples
Shale core samples were systematically collected from the WF-LMX Formation within the wellbore at intervals of 1–1.5 m from the bottom up. A total of 27 core samples were collected for analysis. These samples have been used in previous geological and petrological studies targeting shale gas exploration in WF-LMX shales (Yang et al., 2020; Zheng et al., 2018, 2022). Most of the information regarding total organic carbon (TOC) assessment, mineral composition analysis, major element analysis, experimental assessment of total porosity by mercury injection capillary pressure (MICP), and characterization of nanopore structures by gas adsorption techniques is provided in our previous research (Zheng et al., 2018), and the related data can be found in Tables S1–S2 in the Supplement. It is noted that previous studies of these samples have focused primarily on the organic geochemical properties, mineralogy, and porosity of the WF-LMX Formation shale. In contrast, our research primarily investigates the coupling relationship between the micromechanical properties and the sedimentary environment of these shales.
3.2 Sample preparation
Shale samples were prepared with cuttings for nanoindentation testing, generally 1–10 mm thick (Fig. 2a). We chose shale samples oriented perpendicular to the bedding plane (designated X1) and those oriented parallel to the bedding plane (designated X3) (Fig. 2b), cut them into ∼ 5 mm thick chips, impregnated them and cemented them with resin, and ground and polished them using silicon carbide abrasive papers of various mesh sizes ranging from 50 to 2000 grit. This was followed by the application of diamond suspension fluid with particle diameters of 9, 3, and 1 µm for detailed polishing (Yang et al., 2020). Finally, an IM4000 argon ion mill was used for an additional 1–2 h of polishing to achieve a very smooth surface. The average roughness (measured as root-mean-square roughness, Rq) of the shale surface, which measures 30 × 30 µm2 and was measured using atomic force microscopy, is less than 100 nm (Wang et al., 2022b). Figure 2c shows a typical optical microscopy image of the shale sample after grid nanoindentation.
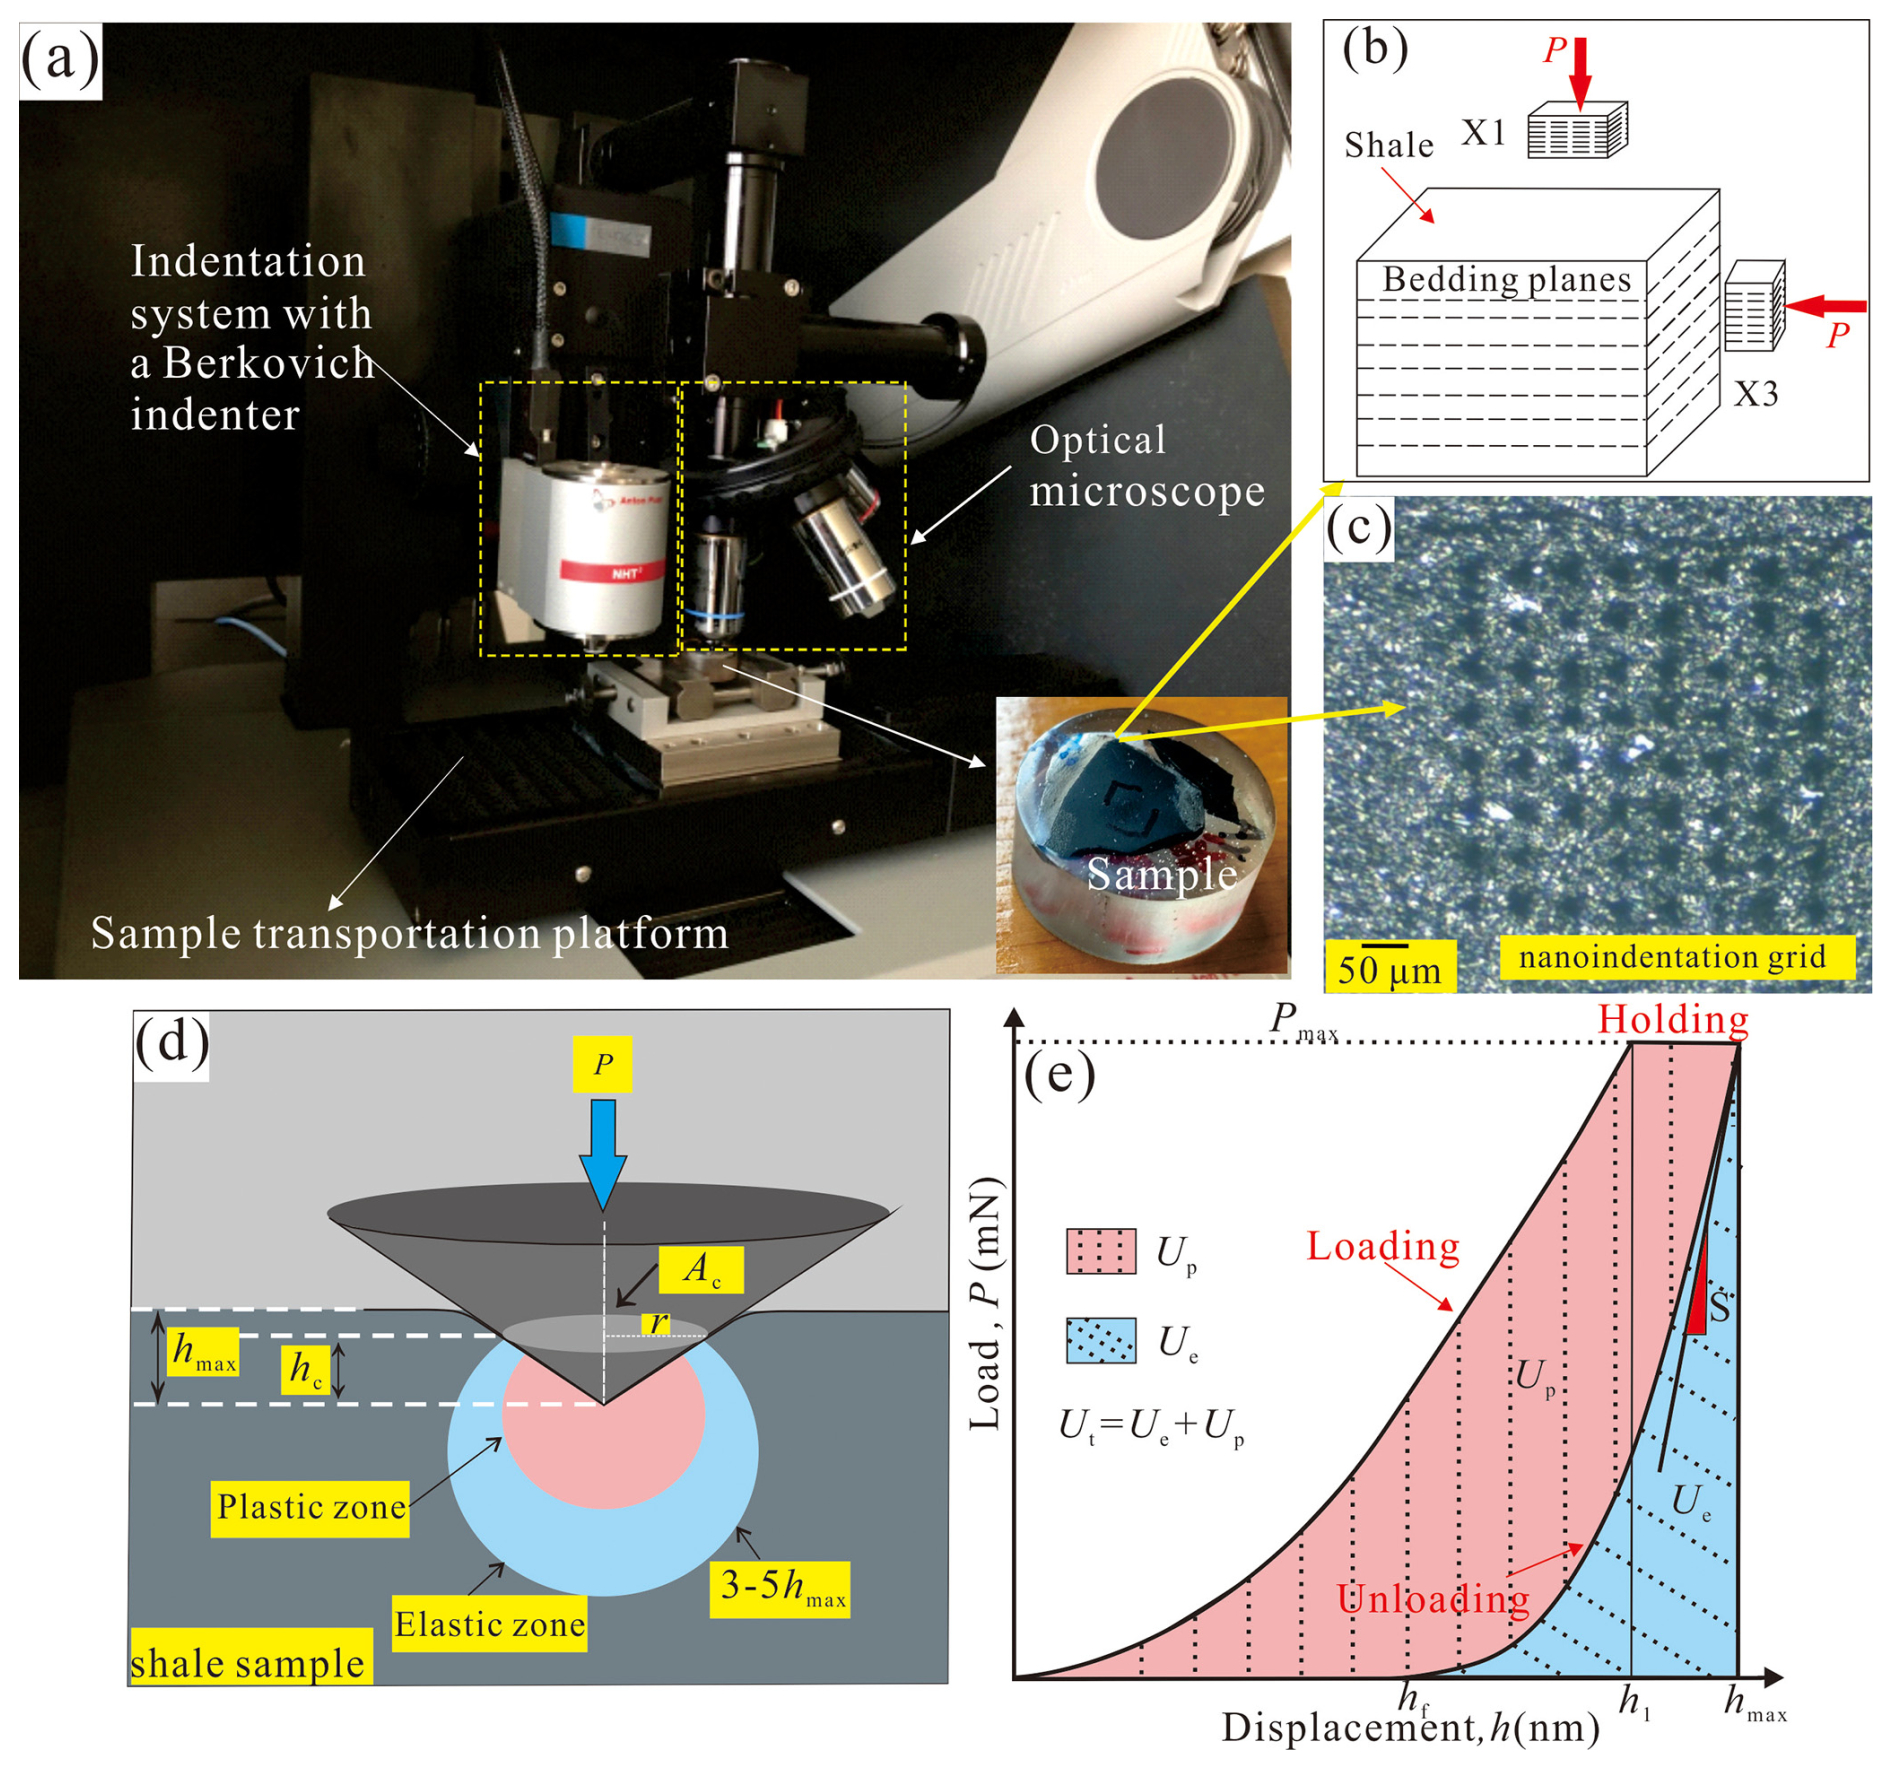
Figure 2(a) The primary components of the nanoindenter are shown, with the polished specimen in the lower-right corner. Panel (b) shows the specimen with X1 and X3 planes, oriented differently for nanoindentation testing. Panel (c) shows typical light microscopy images of a shale sample undergoing nanoindentation. Panel (d) provides a schematic representation of the indentation profile. Panel (e) shows a typical load–displacement (P-h) curve (modified from Wang et al., 2023). Here, P is the applied load, Pmax is the maximum load, r is the contact radius, S is the contact stiffness, and h is the indentation displacement, while hf, h1, and hmax are the residual displacement, the displacement at the onset of the hold phase, and the maximum displacement during nanoindentation, respectively. The elastic–plastic deformation zone under the indenter is 3–5 times hmax (Larsson et al., 1996).
3.3 Optical microscopy
The mineralogy was examined using an Olympus 4500P optical microscope under reflected light, which was integrated with the nanoindentation system. This high-resolution optical microscope offers magnifications ranging from 200 × to 4000 ×, making it suitable for precise visualization of the surface area prior to nanoindentation testing.
3.4 Scanning electron microscope (SEM) and energy-dispersive spectroscopy (EDS) imaging
Following the nanoindentation tests, we used a Hitachi S8010 scanning electron microscope (SEM) integrated with energy-dispersive spectroscopy (EDS) to examine the indentations formed on the shale surface. Deviating from standard pre-treatment procedures, the specimens were not coated with a gold layer prior to testing to avoid potential damage to the indentation sites and to ensure unobstructed observation of the indentations. The phase distribution diagram based on elemental composition was quantified by EDS analysis.
3.5 Nanoindentation tests
3.5.1 Nanoindentation and theoretical background
Mechanical nanoindentation tests were performed using an Anton Paar TTX NHT3 nanoindenter with a diamond Berkovich indenter tip with a radius of curvature between 50 and 100 nm (shown in Fig. 2a). A high-resolution optical microscope was integrated into the indenter for precision. Loads ranging from 0.1 to 500 mN were applied to the indenter as it contacted and penetrated the sample surface.
Before performing the indentation tests, a standardized fused silicon sample was used to calibrate the shape of the tip. Thanks to the unique reference ring design of the Anton Paar instrument, automatic thermal drift correction was implemented to ensure data stability. Figure 2d shows a schematic representation of the indentation profile, while Fig. 2e shows a typical load–displacement curve (P-h curve) consisting of three distinct phases: loading, holding, and unloading. The loading phase includes both elastic and plastic deformation components, while the unloading phase captures only the elastic-deformation-related strain recovery (Cheng et al., 2002; Yang et al., 2020). Consequently, the area under the unloading curve is referred to as the elastic energy (Ue), and the area enclosed by both the loading and unloading curves represents the irreversible energy (Up). The total energy (Ut) is the sum of Ue and Up (Cheng et al., 2002). By analyzing the P-h curve, the hardness (H) and reduced elastic modulus (Er) of the shale will be derived (Oliver and Pharr, 1992, 2004). In this investigation, a Poisson's ratio of 0.3 was assumed for the shale samples to calculate their Young's modulus (E) (Li et al., 2018).
3.5.2 Experimental protocols
Constant load holding tests were performed, in which the indentation load was applied in a linear fashion until the peak load of 400 mN was reached. Once this peak load was reached, the diamond indenter was held in position for 2 s. Finally, the indentation test was completed with a 30 s unloading of the tip. We adopted the statistical nanoindentation method, which is widely used in the mechanical characterization of multiphase composite materials (Fig. 2c). Specifically, the peak load of 400 mN was used (Kumar et al., 2012). Each shale sample surface contained at least 7 × 7 grid indentations with a distance of at least 60 µm between adjacent indentations (Wang et al., 2022a). Therefore, the size of the indentation areas was approximately 450 µm × 450 µm, which is a much larger representative elementary area (REA) than that proposed by Liu et al. (2016) to ensure an unbiased statistical characterization. Prior to conducting the nanoindentation tests, we firstly observed the shale surface using a high-resolution optical microscope to determine the representative regions of interest, taking into account the multiscale heterogeneity and mineralogical variability in the shale. We did not find any obvious laminar structure in our shales. The shale surface areas selected for testing exhibited mineralogical characteristics consistent with the overall shale surface.
3.6 Determination of fracture toughness and brittleness index
In this study, the energy-based method was used to calculate the fracture toughness (Kc) of shale (Gautham and Sasmal, 2022; Gupta et al., 2020; Liu, 2015; Liu et al., 2016, 2022; Liu, 2015; Manjunath and Jha, 2019; Zeng et al., 2017, 2019). After we obtained Kc, the brittleness index (B) based on the mechanical properties can be calculated as (Lawn and Marshall 1979)
The detailed calculation process can be found in Text S1 of the Supplement.
3.7 Statistical analyses
Statistical significance of the correlations between mechanical parameters and mineralogy, TOC content, porosity, and pore volume was determined by SPSS 23.0 software with Pearson correlation analyses and two-tailed Student's tests. This statistical analysis provides a range of correlation coefficients and tests designed to assess the magnitude and direction of the relationship between two variables. This allows us to gain a deeper insight into the patterns and relationships in the data and to uncover potential associations that may go beyond the confines of simple linear correlations. All numerical analyses were performed using Origin 2021, Python 2.0, and Microsoft Excel 2016, and all graphs were made with Origin 2021, Corel Draw X8, and Microsoft Excel 2016.
4.1 Mineralogy and indentation of shale
4.1.1 Optical properties of shale mineralogy
The core samples are mainly composed of quartz and clays (≥ 70 vol %) with small percentages of feldspar, carbonate, pyrite, and organic matter. Here, we selected two representative samples (i.e., SQ-80b and SQ-90) in terms of their different mineralogical characteristics (i.e., quartz-rich and clay-rich) to demonstrate the microstructure of the shale. The quartz grains present in the detrital material are translucent and have a grayish-white color when viewed under reflected light (Fig. 3). They have a variety of irregular shapes characterized by sharp, straight boundaries and are predominantly between 15 and 40 µm in size (Fig. 3). It is noteworthy that WF-LMX shales have a large number of authigenic quartz grains, which are usually very small in size, less than 2 µm, and can only be observed by an SEM (Milliken et al., 2016; Yang et al., 2020). The clay minerals show a dark-gray color and are continuously distributed in the shale matrix, constituting the connected skeleton of the shale (Fig. 3). Notably, the clays are usually intermixed with nanometer-sized organic matter, forming the organoclay composites (Ma et al., 2015; Yang et al., 2020). Organic matter, consisting mostly of particles smaller than 3 µm, is embedded in matrix voids or intermixed with clay minerals (Fig. 3d). Pyrite typically appears as aggregates with dimensions ranging from 1 to 8 µm (Yang et al., 2020). The pyrite and organic matter usually show a grayish-white to bright-white color under the reflected light. Overall, the quartz-rich shale sample has a coarse-grained texture, with large mineral particles such as quartz acting as the supporting skeleton. However, the clay-rich shale has a continuous and fine-grained texture with organoclay composites acting as the framework materials of shale. Notably, the X1 plane (as shown in Fig. 4a and c) exhibits a lower amount of quartz compared to the X3 plane (as shown in Fig. 4b and d).
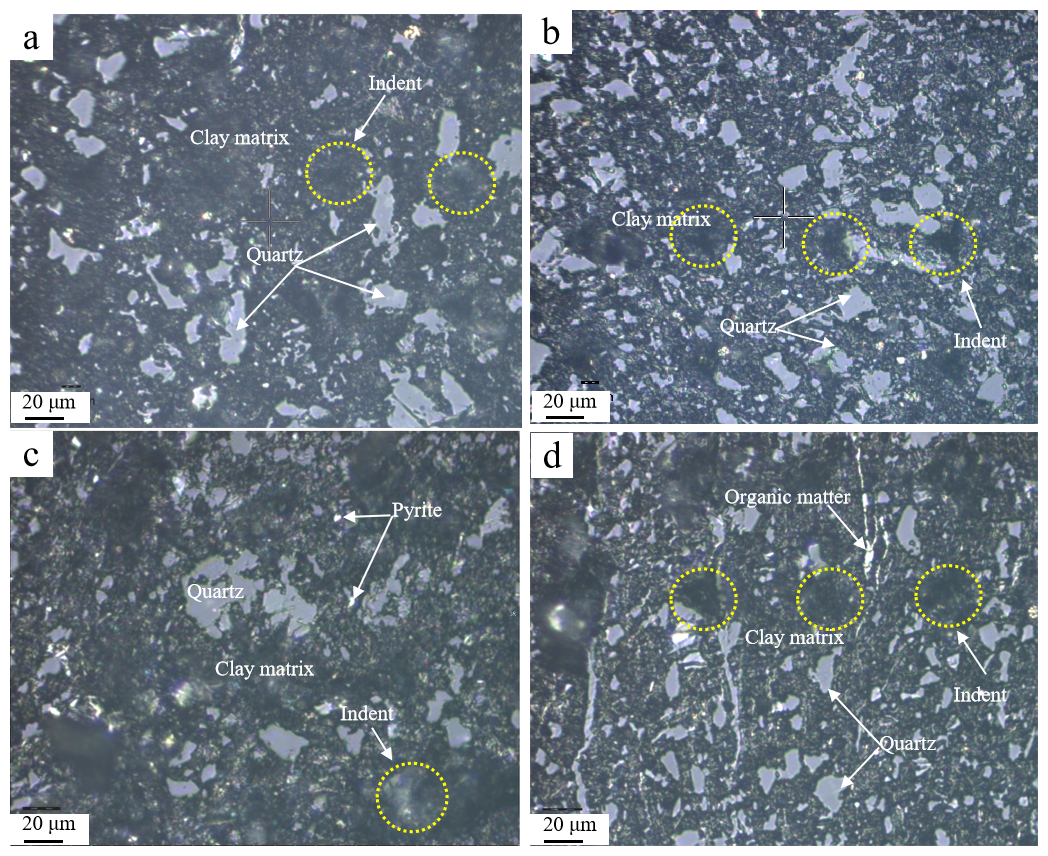
Figure 3Optical microscopy images of the mineralogy of the two representative shale samples. The mineral composition characteristic for (a, b) quartz-rich shale and (c, d) clay-rich shale. Panels (a) and (c) are from the X1 plane, and panels (b) and (d) are from the X3 plane. The X1 plane (a, c) of the shale sample has a lower concentration of quartz grains compared to the X3 plane (b, d). The “indent” in all panels represents the residual indentation impressions left in the shale.
4.1.2 Nanoindentation of representative microdomains
Figure 4 displays the indents of sample SQ-78b in the X3 plane. Figure 4a shows the panorama of all the indentations. It is observed that some of the indents are located on microfractures. Given the strong heterogeneity of the shale, we chose three representative indentation areas for further analysis: the clay-rich area, the organic-matter-rich area, and the quartz-rich area. The quartz particle is large, and its surface is very smooth, mainly containing Si and O elements (Fig. 4g and i). The organic matter in the backscattering (BSE) diagram appears black (Curtis et al., 2012; Zhao et al., 2014), with no fixed form, and is shown in the form of small strips and thin threads (Fig. 4f). The clay matrix often combines with the organic matter and mainly contains elements such as Al, Si, C, and O (Fig. 4e and h). The indentation impression in the quartz-rich area measures approximately 20 µm in diameter, while those in the other two areas exceed 30 µm. Microcracks are found around the quartz-rich area, indicating that quartz grain is fractured under the load of 400 mN. In contrast, no significant cracks are observed in the clay-rich and organic-matter-rich areas. Furthermore, indentation impressions are clearly visible in the clay-rich and quartz-rich areas. In contrast, no indentation impressions are observed on the surface of the organic matter. This phenomenon has also been found in previous studies (Liu et al., 2019b; Wang et al., 2022c) and is attributed to the high elasticity of organic matter in the high maturity stage.
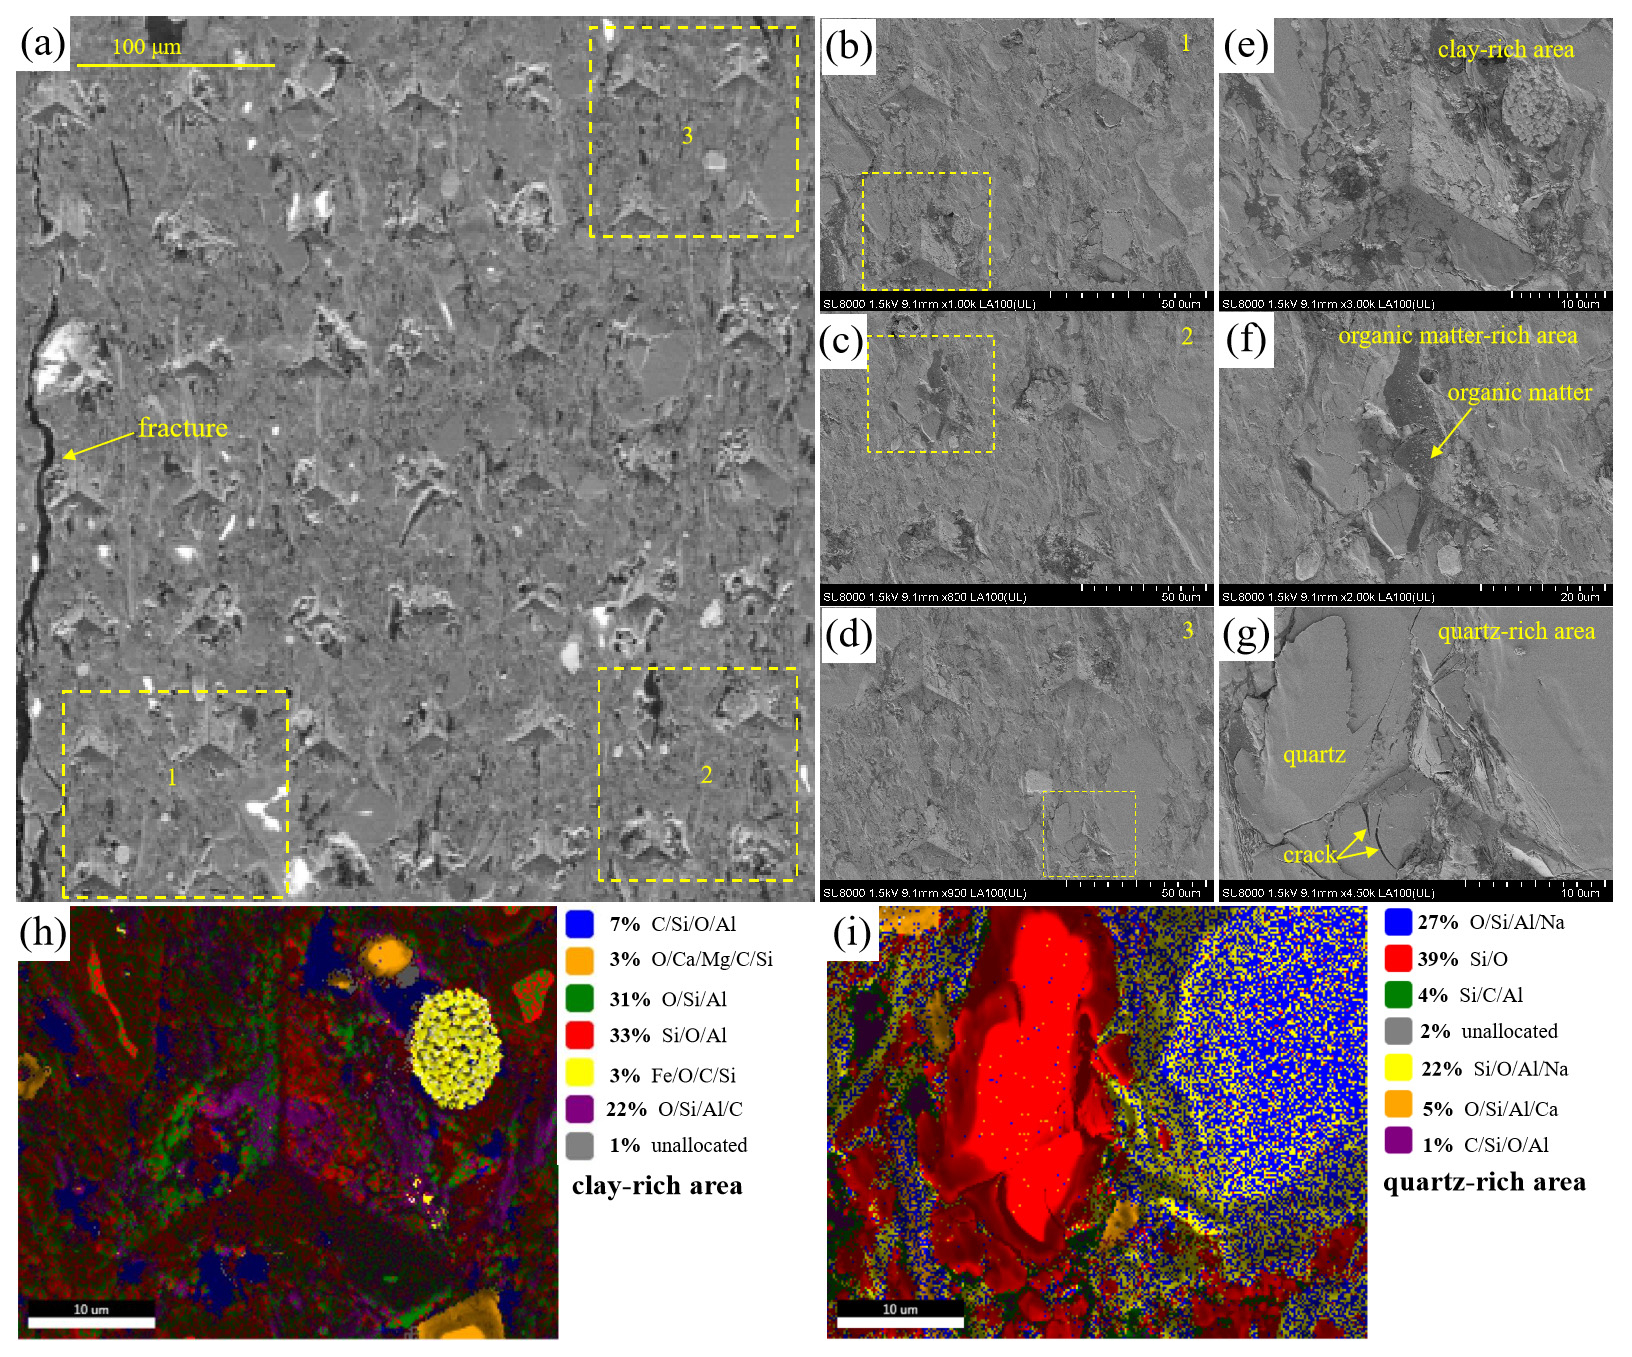
Figure 4Backscattering (BSE) diagrams (a–g) and phase distribution diagrams (h–i) of indented points in different regions. The numbers 1, 2, and 3 in panels (b)–(d) represent the corresponding enlarged parts. The phase distributions of panels (h) and (i) show the indentations located on the clay-rich area and quartz-rich area, respectively. The indentation impression in the quartz-rich area has a diameter of about 20 µm, while the diameters of the other two areas are larger than 30 µm. The indent is clearly visible in the clay-rich or quartz-rich area but not in the organic-rich area.
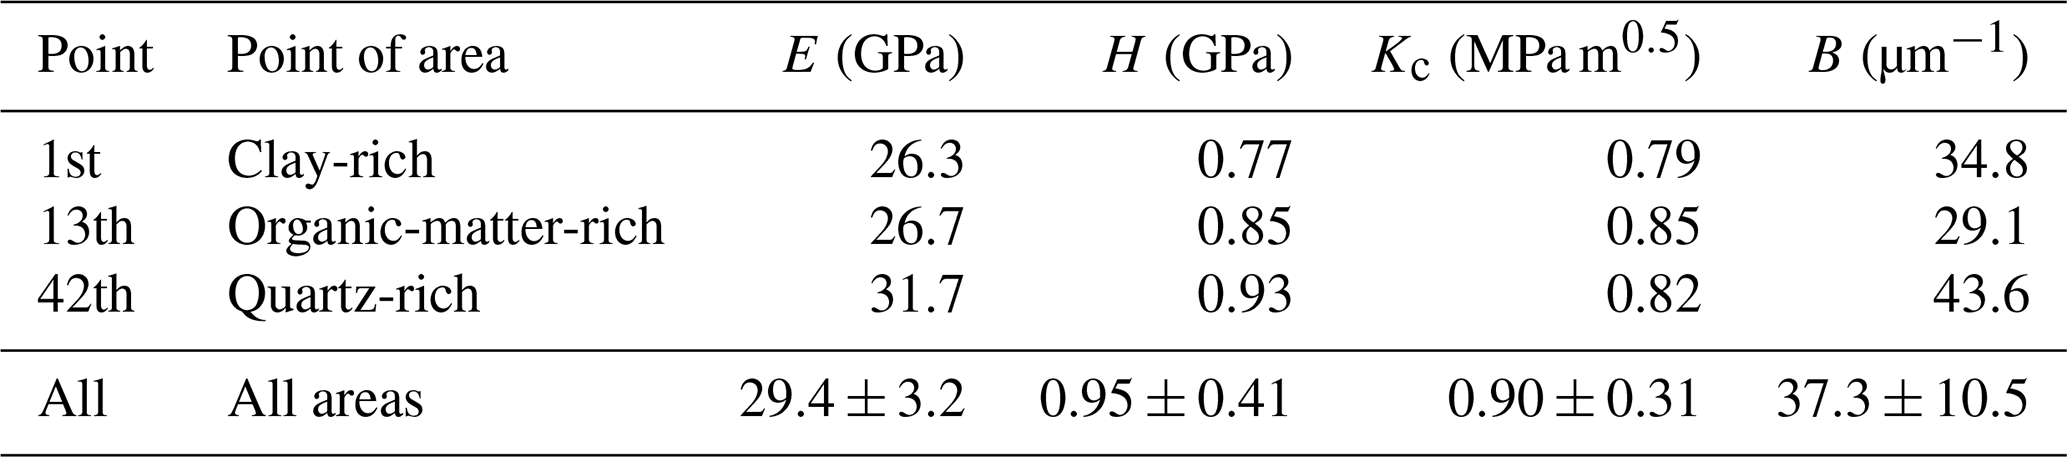
Figure 5 shows the P-h curves of all the indents and three typical indents. Figure 5a shows the maximum displacement ranges from ∼ 3 to 6 µm. The indents present at the fracture zones (as shown in Fig. 4) show significant displacements along with pop-in behavior characterized by abrupt jumps in displacement. This phenomenon could possibly be due to the development of microcracks during the indentation process. We did not use these data for statistical mechanical analysis. The maximum indentation displacement in the quartz-rich area is significantly smaller than those in the organic-rich area (∼ 4900 nm) and clay-rich area (∼ 4900 nm). The E and H of the indentations in the quartz-rich area are the highest, with values of E=31.7 GPa and H=0.93 GPa, respectively, while those in the organic-matter-rich area (E=26.7 GPa, H=0.85 GPa) and the clay-rich area (E=26.3 GPa, H=0.77 GPa) are lower (Table 1). Despite the relatively large differences in elastic–plastic parameters, the fracture toughness of these three indents is relatively similar, ranging from 0.79 to 0.85 MPa m0.5. The B value for the indent of the quartz-rich area is the highest (43.6 µm−1), followed by the indent in the clay-rich area (34.8 µm−1) and the indent in the organic-matter-rich area (29.1 µm−1). Overall, the average mechanical parameters obtained are GPa, GPa, MPa m0.5, and µm−1. Notably, the values of H show a larger variability (43.2 % variation) than those of E (10.9 % variation) and Kc (34.4 % variation).
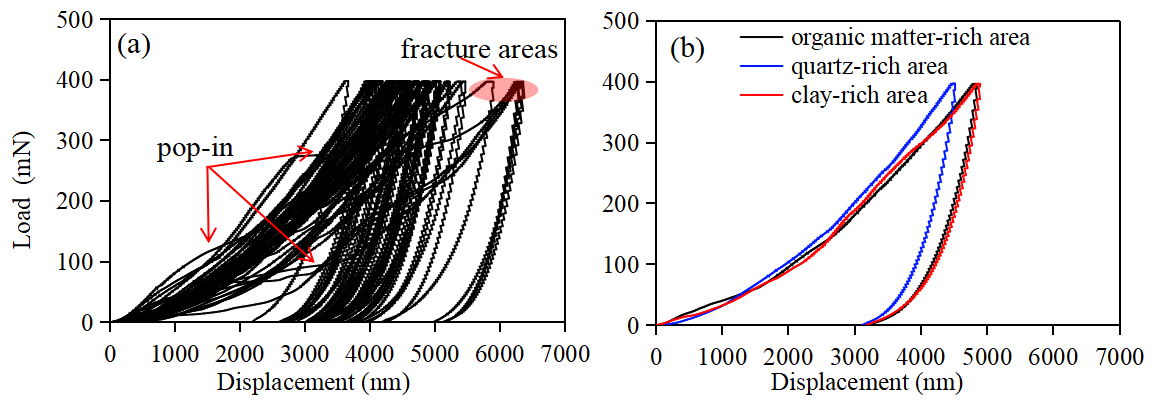
Figure 5Load–displacement curve of (a) all the indentation points and (b) three typical indentation points in different areas.
Table 1Mechanical parameters of indentation points in different regions.
4.2 TOC, mineralogy, porosity, and major elemental characteristics
Using lithofacies analysis and gamma ray (GR) values, previous researchers divided the WF Formation into two primary sections from base to top, the Transgressive Systems Tract (TST) and the Highstand Systems Tract (HST), while the LMX Formation was divided into TST, HST, and the Lowstand Systems Tract (LST) from bottom to top for the SQ-1 well (Zheng et al., 2018) (Fig. 6). The TOC content of the LMX Formation and WF Formation are in the range of 0.53 wt %–3.34 wt % (average 1.94 wt %) and 1.30 wt %–6.53 wt % (average 3.74 wt %), respectively. The quartz content values of the LMX Formation and WF Formation are in the range of 19.6 vol %–43.6 vol % (average 29.4 vol %) and 22.7 vol %–51.5 vol % (average 39.3 vol %), respectively. The clay content values of the LMX Formation and WF Formation are in the range of 30.3 vol %–54.3 vol % (average 43.1 vol %) and 28.8 vol %–48.1 vol % (average 35.5 vol %), respectively. Feldspar content ranges from 10.6 vol % to 20.4 vol %, with an average of 16.2 vol %. Conversely, the carbonate and pyrite contents are minimal, typically less than 10 vol % (Table S1). The major oxides in the WF-LMX Formation are SiO2 and Al2O3. Other major element concentrations were observed to be <7 % (Table S2). The SiO2 content is the highest of all the oxides in the shale samples, ranging from 58.63 % to 76.32 %. The average SiO2 content of the WF Formation (69.73 %) is higher than that of the LMX Formation (61.54 %). The average Al2O3 contents in the LMX and WF formations are 13.66 % and 8.61 %, respectively. The excess SiO2 contents are in the range of 5.93 %–58.93 % (Table S2).
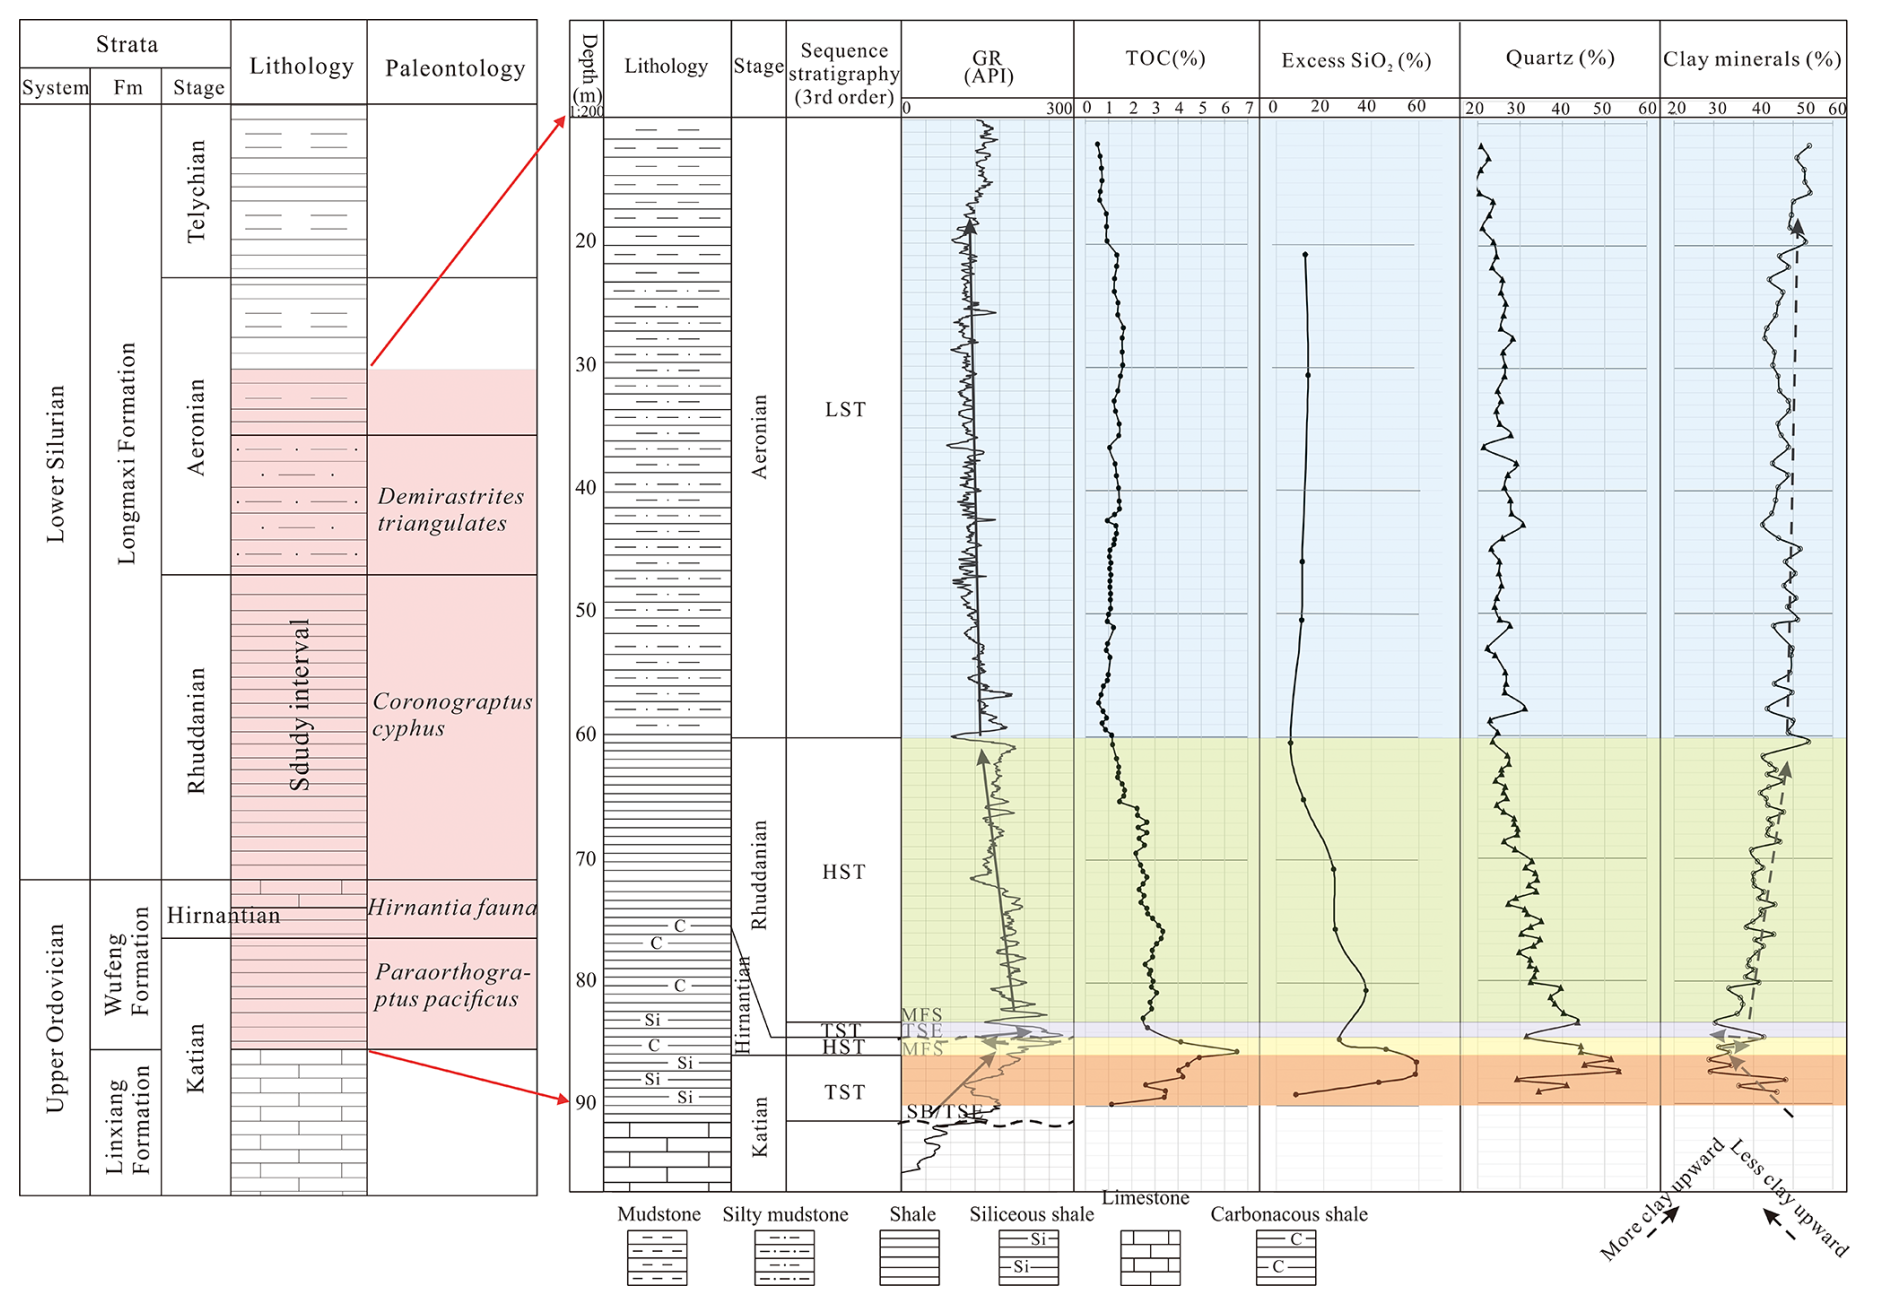
Figure 6A detailed histogram depicting various properties of the WF-LMX shales, including gamma ray (GR) intensity, TOC content, excess SiO2 content, quartz content, and clay content (modified from Zheng et al., 2018). HST is the highstand systems tract; LST is the lowstand systems tract; TST is the transgressive systems tract.
As one moves upward through the drilling profile of the WF-LMX shales, the GR values and TOC content initially increase and then decrease. The quartz content follows a similar pattern to the TOC content, while the clay mineral content shows an opposite trend. Excess silicon is widely distributed in the WF shales (Zheng et al., 2018). Previous research has shown that the excess silicon originates from authigenic silicon in shale, which is closely related to the genesis of siliceous plankton, such as diatoms and sponge spicules, in sedimentary waters (Schieber et al., 2000). In the SQ-1 well, the excess SiO2 content varies from low at the bottom to high in the middle and then back to low at the top, with the higher values (ranging from 43.04 % to 58.93 %) being observed in the upper section of the WF Formation. In terms of reservoir space parameters, the total pore volume (Vtotal) and total porosity exhibit ranges of 21.0 × 10⁻³–41.4 × 10⁻³ cm3 g−1 and 1.3 %–6.4 %, respectively. The higher values are in the WF Formation, where the average values are 37.6 × 10⁻³ cm3 g−1 and 4.5 %, respectively. In general, both Vtotal and total porosity are positively correlated with the TOC content (Table S1).
4.3 Micromechanical profile of WF-LMX shales
Figure 7 shows the longitudinal variations in different micromechanical parameters (E, H, Kc, and B) of WF-LMX Formations in the SQ-1 well. Table S3 presents the corresponding data. Overall, the mechanical parameters in the X1 plane change synchronously with those in the X3 plane. Specifically, they first increase and then decrease from the bottom to the top, which is consistent with the variation in quartz and TOC content in the drilling profile. The highest mechanical property values occur in the Hirnantian and the upper Katian of the WF Formation (85–87.6 m), where the contents of TOC (4.2 wt %–6.5 wt %) and quartz (44.4 %–53.3 %) are also very high (Fig. 6, Table S4). In fact, the WF Formation was in a deep-water marine shelf setting during the Hirnantian and upper Katian stages. Conversely, the shales of the upper Aeronian stage of the LMX Formation (SQ-11 and SQ-17), which belong to the shallow-water shelf facies, have the lowest mechanical values.
In general, the lower part of the Rhuddanian stage of the LMX Formation and the Hirnantian and upper Katian stages of the WF Formation have higher values of E, H, and B. Table S4 indicates that the average values of micromechanical parameters (E, H, Kc, and B) in the WF Formation are relatively higher than those in the LMX Formation. The micromechanical parameters (E, H, Kc, and B) in the X1 plane are lower than those in the X3 plane.
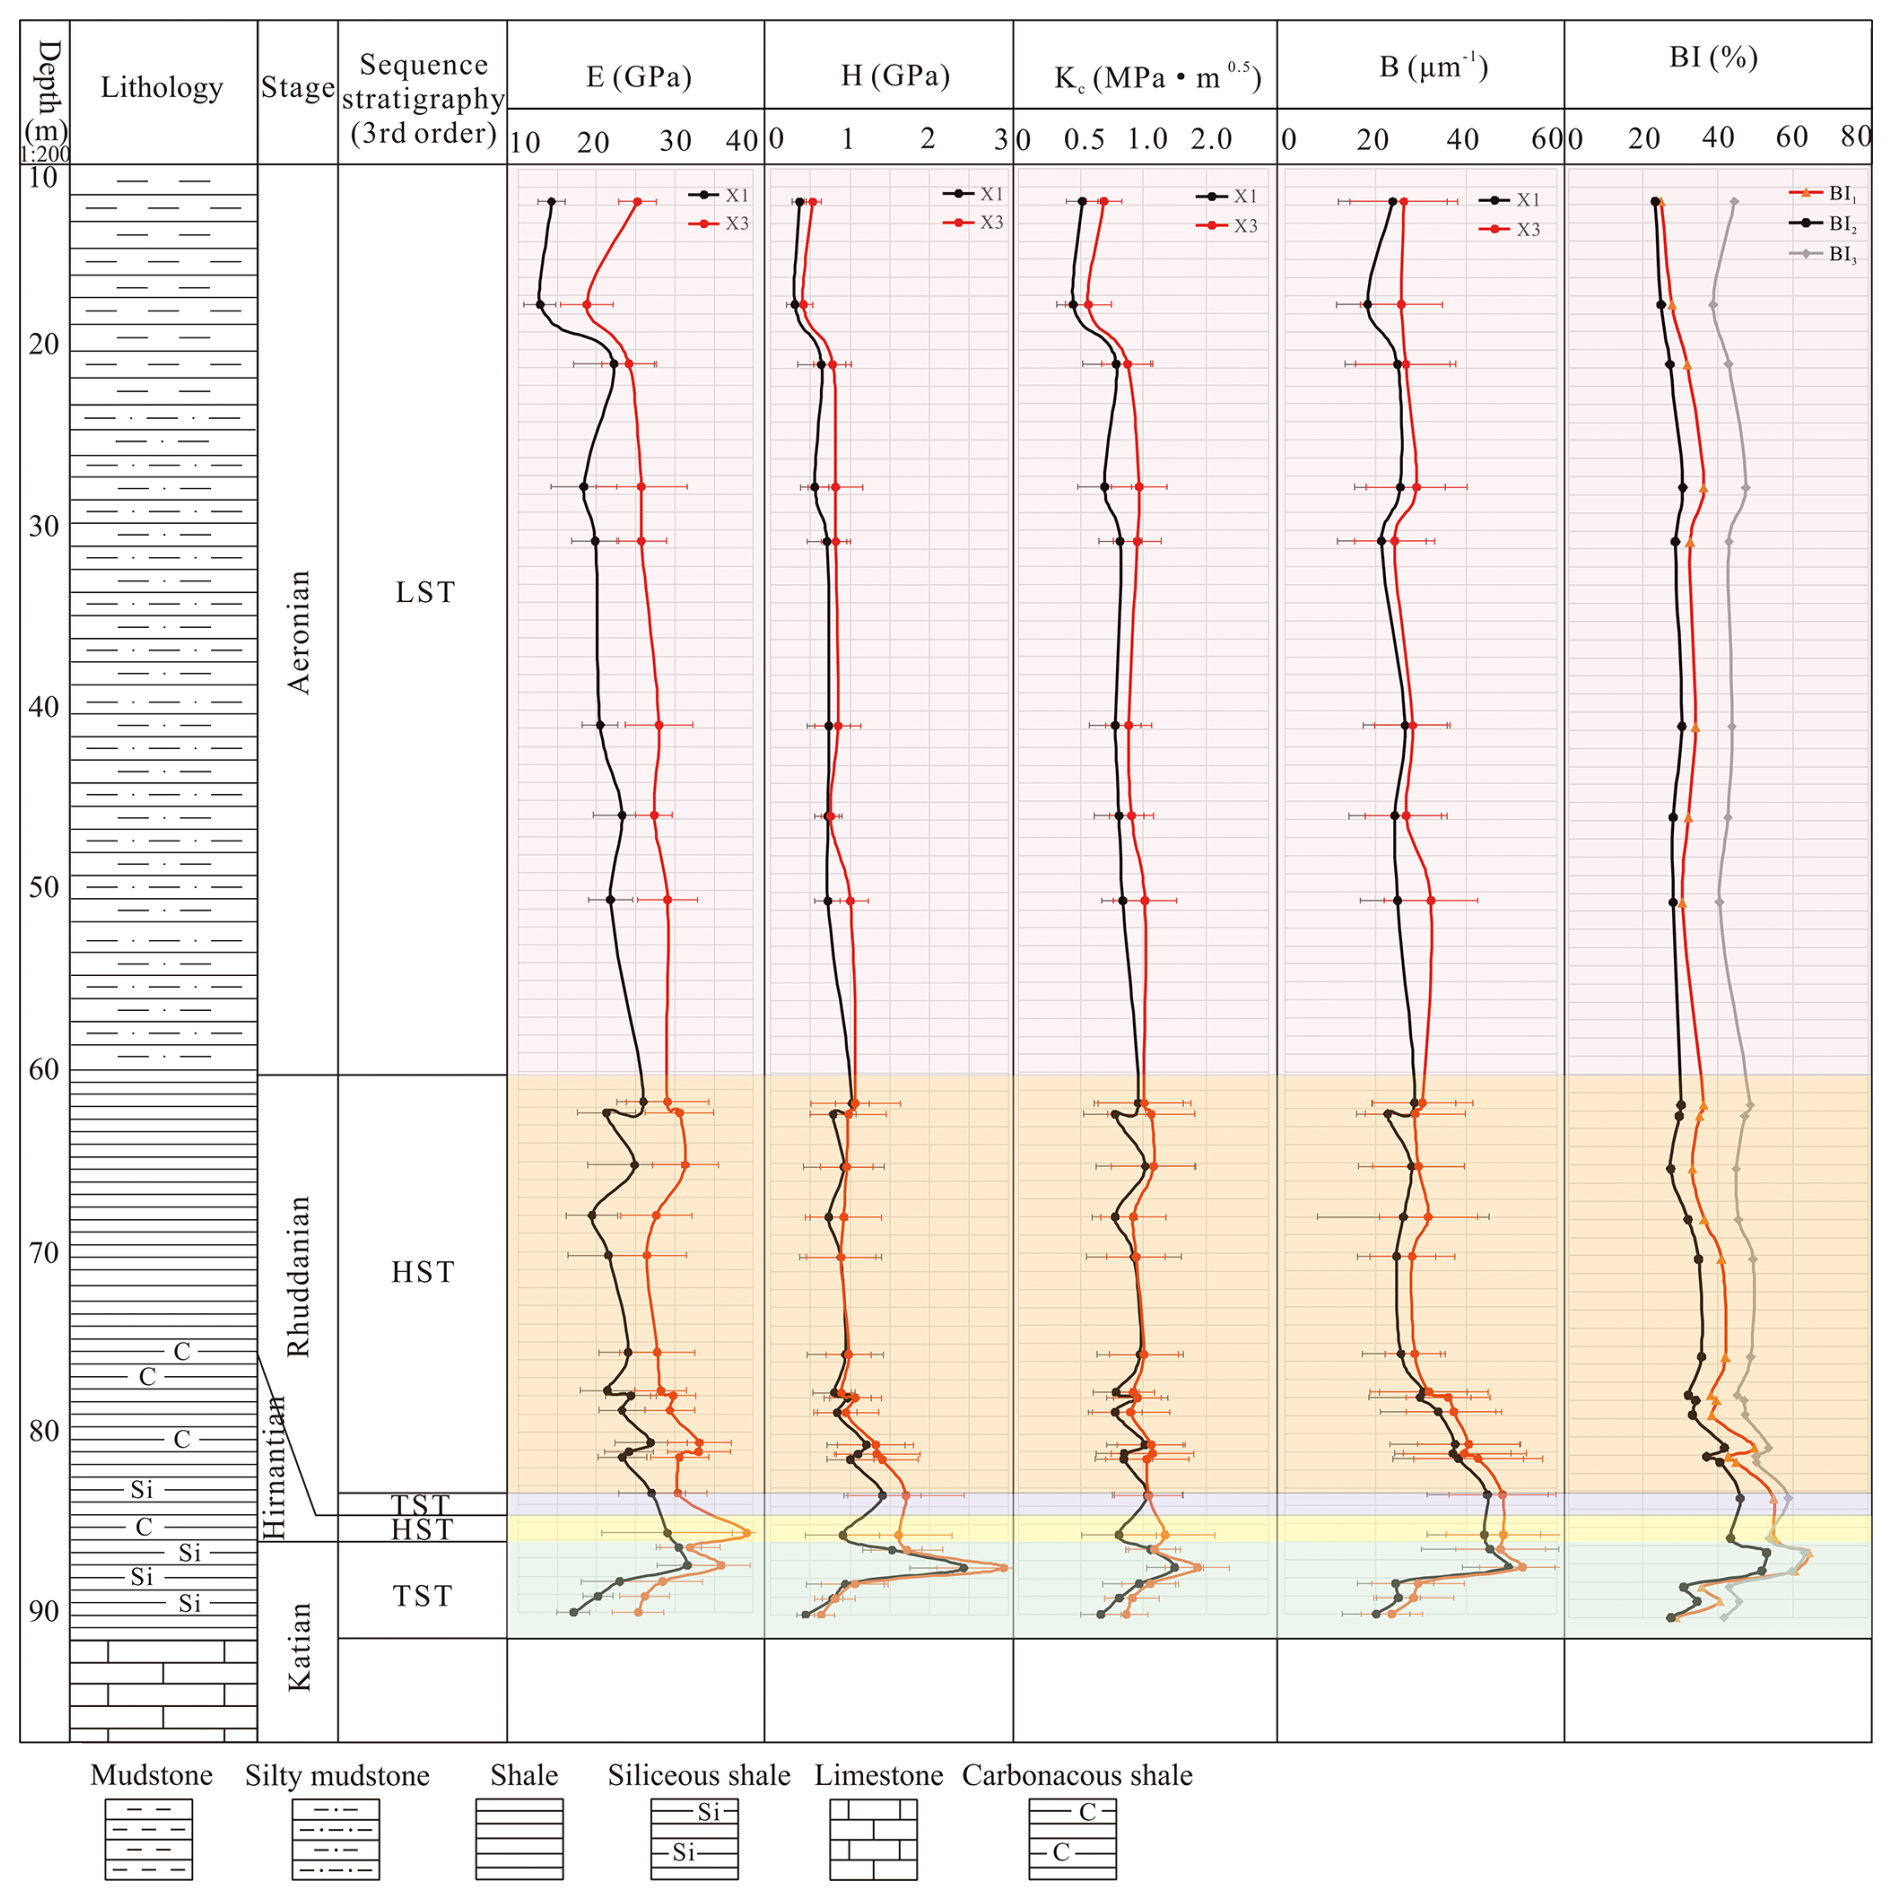
Figure 7A histogram of E, H, Kc, and brittleness index (BI) of shale in the SQ-1 well. X1 indicates a direction perpendicular to the bedding plane of the shale, while X3 indicates a direction parallel to the bedding plane. BI1, BI2, and BI3 are brittleness indices based on mineral composition (as shown in Table 4). From the bottom to the top of the SQ-1 well, E, H, Kc, and BI all show a similar trend, and the bottom of the LMX Formation and the upper part of WF Formation (∼ 80–87 m) have large values.
5.1 Paleodepositional conditions of WF-LMX shales
5.1.1 Sedimentary shale site
Al2O3 and TiO2 are commonly used as indicators of terrigenous material, while Mn is considered a marker element from the deep ocean (Adachi et al., 1986; Boynton, 1984). The ratio is generally less than 0.5 in coastal or continental shelf areas and ranges from 0.5 to 3.5 in open-ocean or deep-sea environments (Adachi et al., 1986; Boynton, 1984; Sethi et al., 2024). The average value of 0.06 in the WF-LMX shales indicates a sedimentary environment closer to the continent. The ratios in sediments from ridge, basin, and continental margin areas are less than 0.4, in the range of 0.4 to 0.7, and between 0.7 and 0.9, respectively (Murray et al., 1991). The ratio of WF-LMX shales ranges from 0.65 to 0.78, with an average of 0.71, suggesting a continental margin sedimentary environment. In addition, the vs. SiO2 and vs. plots can also be used to determine the ancient and modern tectonic backgrounds of the basins (Roser and Korsch, 1988; Sethi et al., 2024). In Fig. 8a–b, the WF-LMX shales show high SiO2/Al2O3 ratios, ratios, and SiO2 values. The majority of the data points are within the passive continental margin. Therefore, the WF-LMX shales in the study area are indicative of a passive continental margin sedimentary environment.
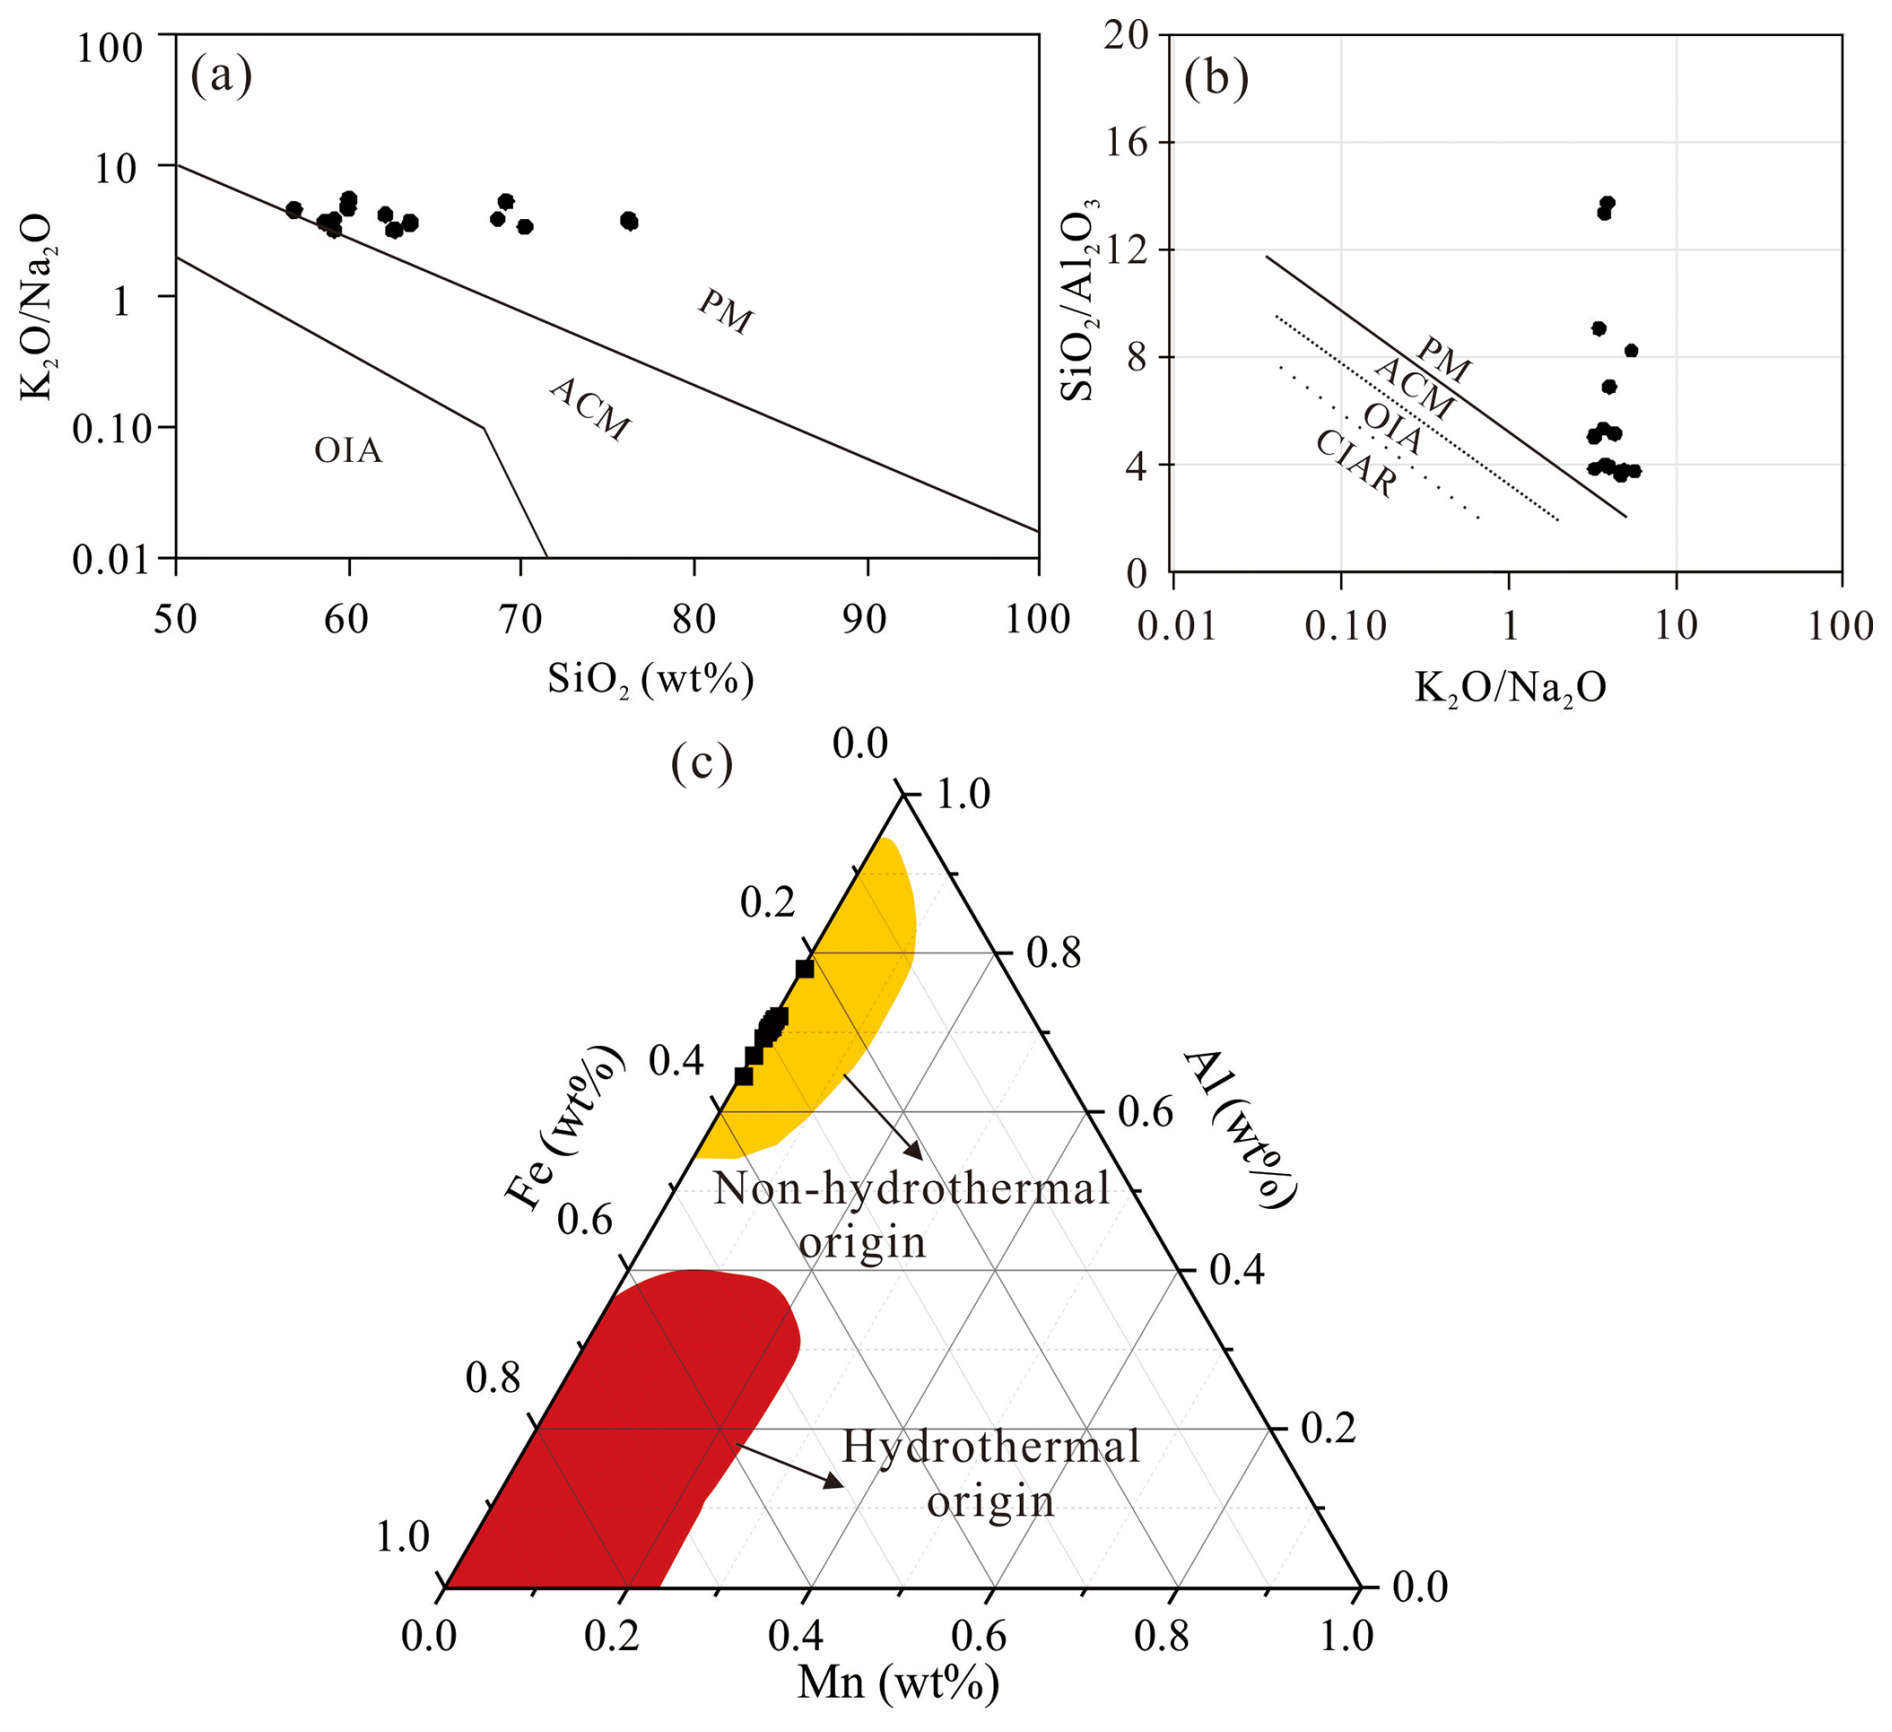
Figure 8Depositional position classification diagrams (a) after Roser and Korsch (1988) and (b) after Maynard et al. (1982). Identification origin of hydrothermal–biogenic sediment (Adachi et al., 1986). PM = passive continental margin; ACM = active continental margin; CIAR = continental island arc; OIA = oceanic island arc.
5.1.2 Sources of silicon
Currently, the main sources of silicon in shales include biogenic, terrestrial detrital, and hydrothermal origins (Adachi et al., 1986; Reynolds and Verhoogen, 1953). Al2O3 is typically indicative of terrestrial detrital input. When the ratio is close to 3, the silicon is primarily of crustal origin. However, when the ratio exceeds 3, silicon is primarily derived from biogenic and hydrothermal processes (Boström et al., 1973). The values of the WF-LMX shales range from 3.63 to 13.73 (with an average of 6.42), suggesting that silicon in these shale samples is not primarily derived from terrestrial detrital sources. In particular, geochemical proxies such as ratios above 25 (± 5) and ratios below 0.35 are recognized as the presence of hydrothermal activity during deposition (Boström and Peterson, 1969; He et al., 2016). The WF-LMX shale samples exhibit ratios ranging from 5.8 to 11.3, with an average of 8.9, while the ratios exhibit a narrower range of 0.64 to 0.78, with an average of 0.71 across the data set. This result indicates that silicon in the WF-LMX shale samples is not primarily derived from hydrothermal sources. Furthermore, by observing the Mn–Al–Fe ternary diagram (Fig. 8c), all the sample data fall within the non-hydrothermal origin range. It is commonly believed that an ratio exceeding 3.0 typically suggests a primarily biological origin (Boström et al., 1973). In the case of the WF-LMX shale samples, the values varied between 3.63 and 13.34, with an average of 6.42. This indicates that the silica source in these shale samples was predominantly influenced by biogenic input.
5.1.3 Paleoclimate and chemical weathering
Cox et al. (1995) proposed the Index of Component Variation (ICV), which is calculated as the molar ratio of (), to Al2O3. According to Cullers and Podkovyrov (2000), an ICV greater than 1 in fine-grained clastic rocks suggests low clay content and originally deposition in a tectonically active area. Conversely, an ICV less than 1 indicates high clay content resulting from chemical weathering or redeposition. In this study, the ICV values of the samples (1.18–1.46; see Table S2) exceed 1, which confirms the first deposition without redeposition and can reflect the weathering degree and paleoclimate of the source area.
The process of chemical weathering typically results in the depletion of elements such as Ca, Na, and K, while promoting the relative accumulation of Al and Ti (Fedo et al., 1995; Nesbitt and Wilson, 1992). To quantify the extent of chemical weathering in sediment source areas, previous research has established indices such as the chemical index of alteration (CIA) (CIA = 100 × ) (Nesbitt and Wilson, 1992; Nesbitt and Young, 1982) and the plagioclase index of alteration (PIA) (PIA = 100 × ) (Fedo et al., 1995). The units of the oxides used in these calculations are molar masses. CaO* refers specifically to the CaO content in silicate minerals. Since the CaO content in silicate minerals is often comparable to that of Na2O, a correction method is applied: if the molar amount of CaO is greater than that of Na2O, CaO = Na2O; conversely, if the molar amount of CaO is less than that of Na2O, no correction for CaO is required. The sample trend is generally parallel to the A-CN edge (Fig. 9), indicating that potassium (K) has not been significantly leached during weathering and may be weakly affected by potassium metasomatism. In general, CIA values between 50–60 and PIA values between 50–69 correspond to low weathering intensity, while CIA values between 60–80 and PIA values between 69–86 indicate moderate weathering, and CIA values between 80–100 with PIA values between 86–100 represent intense weathering conditions (Li et al., 2024; Nesbitt and Young, 1982; Reimann and de Caritat, 2012). For the WF-LMX shale samples, the calculated CIA indices range from 64.2 to 70.2 (mean = 65.9) (Fig. 9; Table S2), and the PIA values range from 72.8 to 82.8 (mean = 76.94). These results indicate that the source rocks have experienced a consistent stable and moderate intensity of chemical weathering. In addition, the CIA index is commonly used to evaluate paleoclimatic conditions (Fedo et al., 1995; Nesbitt and Wilson, 1992). In hot, humid paleoclimates, CIA indexes fluctuate between 80 and 100, while warm, humid environments show values between 60 and 80. Conversely, cold, arid paleoclimates generally record CIA values in the range of 50 to 60 (Nesbitt and Wilson, 1992). CIA values decrease from the lower to middle-upper part of the Wufeng Formation and then remain relatively stable at higher values in the Longmaxi Formation. This suggests that the paleoclimate shifted from warm and humid to cold and arid before returning to warm and humid conditions. However, the average CIA value of the WF-LMX Formation is 65.9, which generally indicates deposition under warm, humid conditions. It should be noted that this interpretation is based solely on major element data. To more precisely determine the paleoclimatic conditions, further validation through carbon–oxygen isotopes and palynological fossils is necessary.
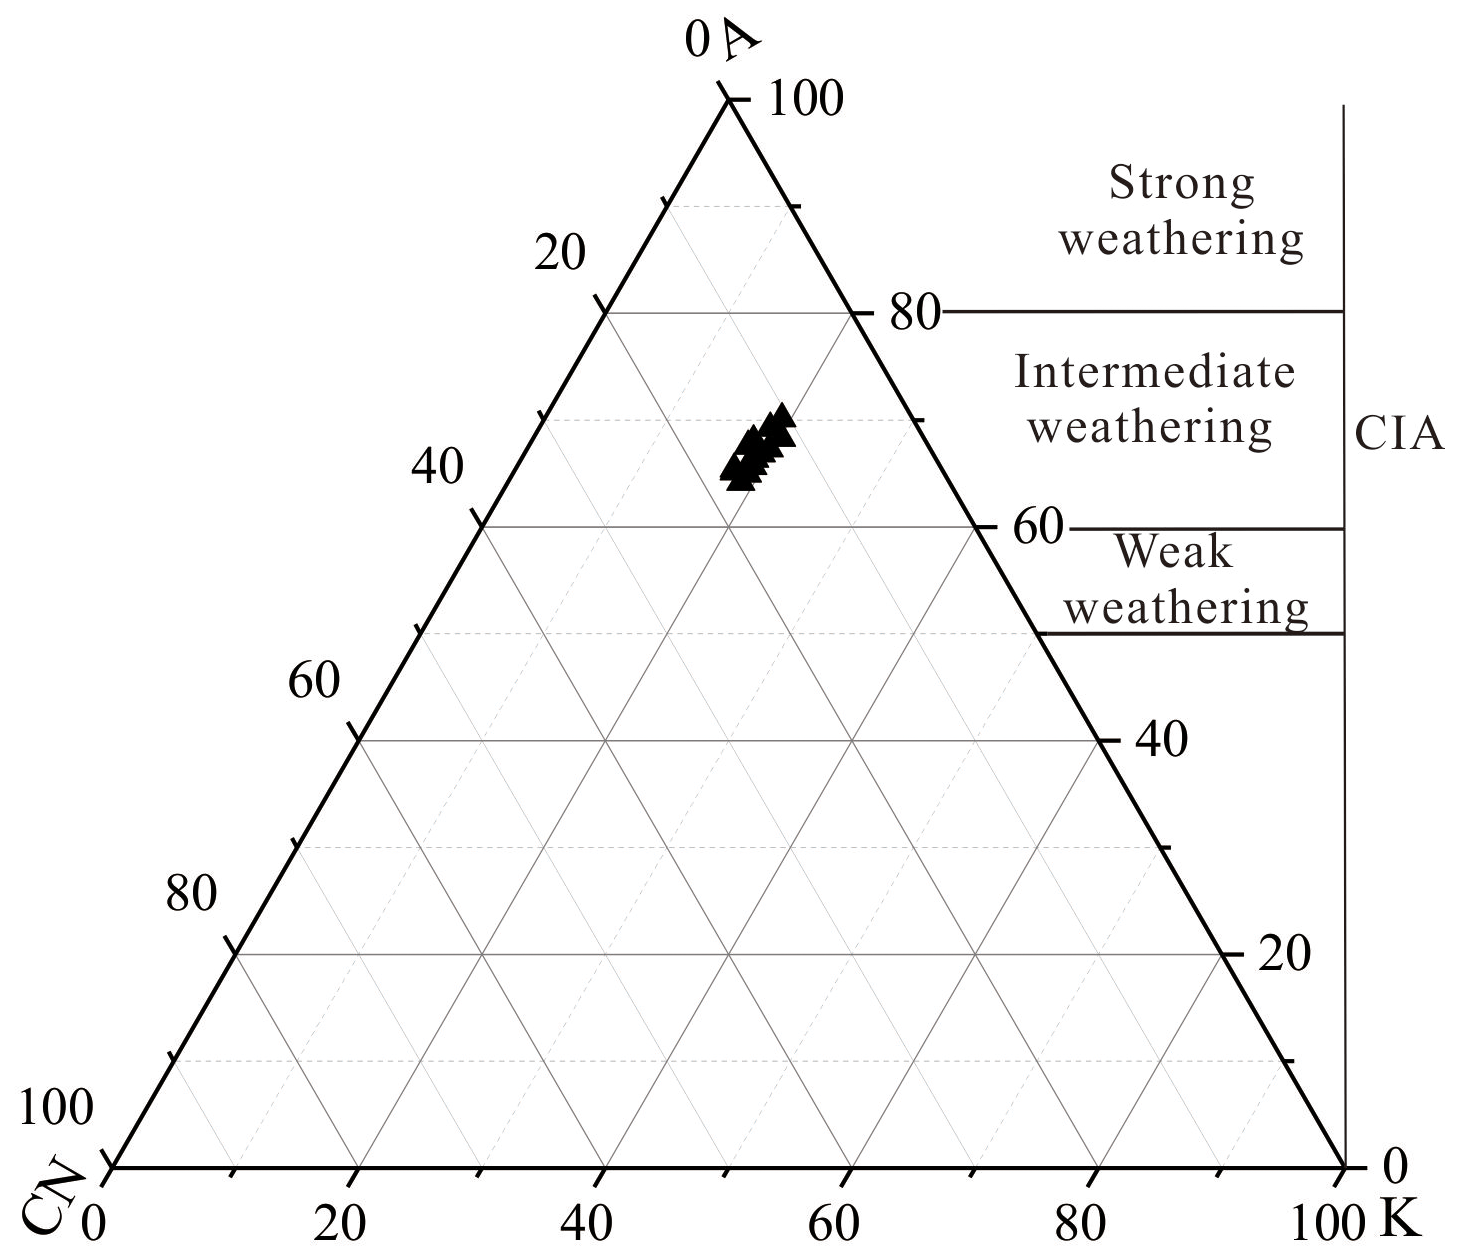
Figure 9Ternary plots of Al2O3-()-K2O (A-CN-K) in molar proportions that reflect the intensity of weathering (map based on Nesbitt and Young, 1982). Here, CaO* denotes the CaO content specifically within the silicate component.
5.1.4 Redox conditions
Previous studies have found that the redox indicators (e.g., , , and Mo values) of the WF-LMX shales are positively correlated with TOC content (Li et al., 2017; Yan et al., 2018; Wang et al., 2024; Wei et al., 2021). Based on the TOC content column profile of the SQ-1 well (Fig. 6), it can be inferred that the bottom of the LMX Formation and the upper-middle part of the WF Formation had the strongest reducing conditions, with TOC content exceeding 2.5 % formed in anoxic environments, while shale sections with TOC less than 2 % were mainly formed in oxic environments (Li et al., 2017). Furthermore, the high excess silicon content in organic-rich shales in the middle-upper part of the WF Formation and the bottom of the LMX Formation indicates relatively high paleoceanic productivity during deposition, which is consistent with previous findings (Li et al., 2017; Yan et al., 2018).
5.2 Effect of components on micromechanical properties
5.2.1 Young's modulus, hardness, and fracture toughness
The sedimentary environment controls the mineral composition, TOC content, and pore characteristics of organic-rich shales. Here we discuss the effect of constituents on the mechanical properties of WF-LMX shales. For both X1 and X3 planes, the linear positive correlation between Young's modulus of shale and the quartz content is good (Fig. 10a). The reason is that quartz is thought to be a brittle mineral. The measured Young's modulus of bulk shale is enhanced by elevated concentrations of the quartz. In particular, Young's modulus of shale on both X1 and X3 planes and the content of excess SiO2 show a positive correlation, especially on the X1 plane (Fig. 10i). This means authigenic quartz plays an important role in increasing the strength of shale and improving the fracturability of the shale. Conversely, Young's modulus and clay mineral content show a negative correlation in different planes (Fig. 10b), as clay minerals inherently act as plastic components within shale matrices. While increased clay content decreases mechanical properties of shale, the scientific consensus remains unresolved regarding the brittle classification of feldspar, calcite, dolomite, and pyrite (Glorioso and Rattia, 2012; Wang and Gale, 2009). As shown in Fig. 10c–f, there is no direct positive relationship between the content of these minerals and Young's modulus values. Notably, there is a negative correlation between calcite content and modulus measurements (Table 2, Fig. 10c), which is consistent with previous triaxial compression studies of core samples (Diao, 2013). This phenomenon may be due to two factors: (1) relatively low calcite volume fractions (vol % < 8 %) and (2) isolated grain distribution patterns within the shale matrix. Such dispersed rigid particles (calcite, dolomite, and pyrite) fail to form effective load-bearing frameworks, thereby precluding embrittlement enhancement by mineral reinforcement.
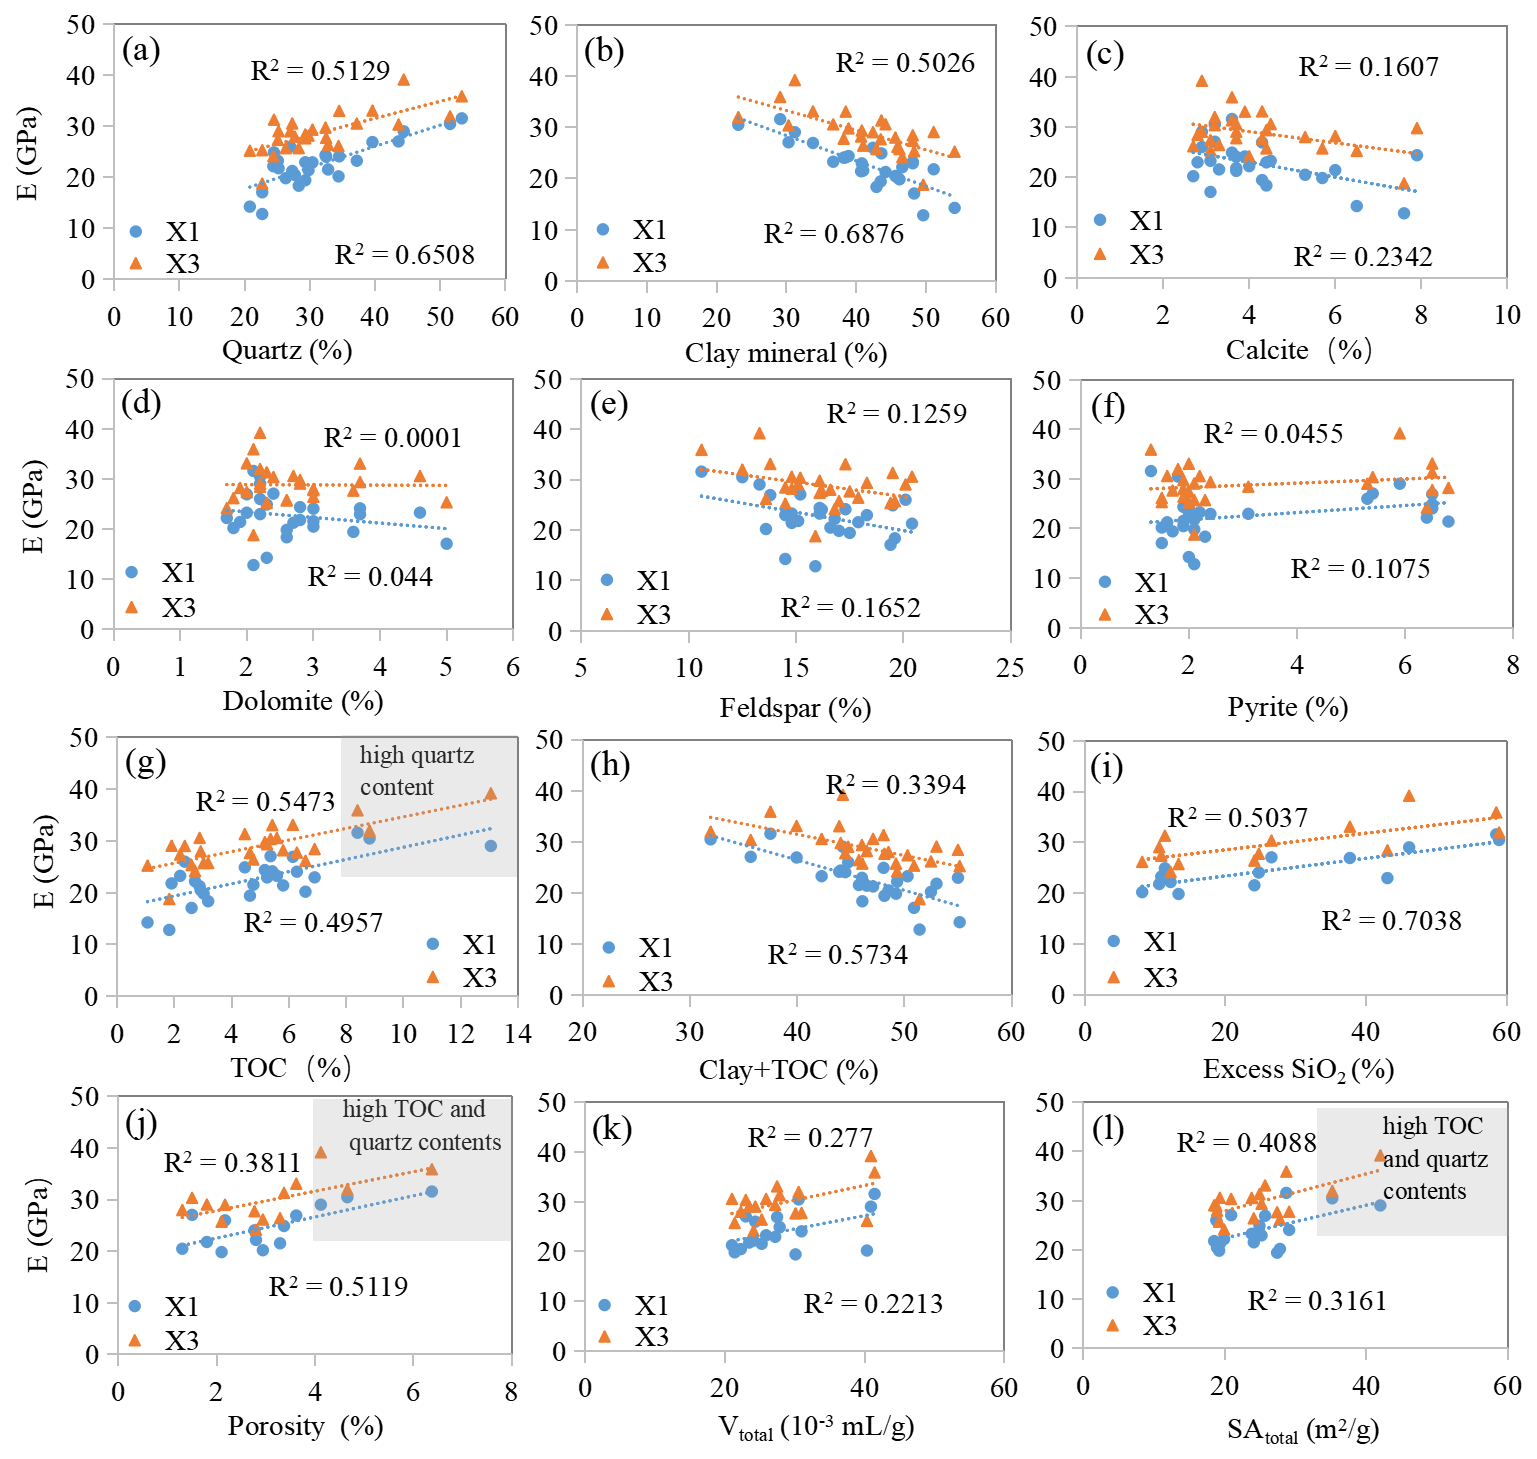
Figure 10Correlation of shale Young's modulus (E) with volumetric proportions of matrix constituents (a–h), excess SiO2 content (i), porosity (j), total nanopore volume (k), and surface areas (l). Note: Q = quartz; F = feldspar; Car = carbonate; Dol = dolomite; Py = pyrite; Vtotal = the total nanopore volume; SAtotal = the total nanopore surface areas. The percentage of various components is the volume percentage. The three samples marked in panels (g) and (j) are in high quartz, TOC contents, and porosity. Young's modulus shows high dependence on quartz, clay, and clay + TOC content, especially along the X1 plane, while it has a weak correlation or no correlation with the change in the content of other rock constituents, including the carbonates, organics, and pores.
Compared to inorganic minerals, organic matter has lower density (approximately half the density of the shale rock minerals) and much lower modulus values in the range of 1–20 GPa (Fender et al., 2020; Wang et al., 2024). However, Young's modulus is statistically positively correlated with TOC content of WF-LMX shales in both planes (Fig. 10g). The reason is that the contents of quartz and organic matter show a synchronous and co-directional trend in the stratigraphic profile. While organic matter inherently reduces shale strength, quartz emerges as the primary determinant in increasing shale Young's modulus, thereby leading to a consistent contribution relationship between organic matter and the Young's modulus of shale. Young's modulus shows no correlation with total nanopore volume or the total nanopore surface areas (Fig. 10k–l) and even a weak positive correlation with porosity (measured by MICP method) (Fig. 10j). The main reason is that, in the WF-LMX shale, high porosity and total pore volume are associated with high organic content (Table 2), which is positively correlated with the content of authigenic quartz. The influence of pores on shale mechanical properties may be compensated by authigenic quartz. On the other hand, the relationship between Young's modulus and individual components shows a more pronounced correlation in the X1 plane compared to the X3 plane, a disparity that could be primarily due to the preferential orientation of mineral particles during sedimentation and the distinct mechanical behaviors inherent to their depositional environments.
Figure 11 shows a good positive linear relationship between Young's modulus and both hardness and fracture toughness. The relationship between Young's modulus and hardness exhibits greater strength along the X1 plane (R2=0.74) compared to the X3 plane (R2=0.60). Conversely, the correlation between Young's modulus and fracture toughness maintains comparable magnitudes in both the X1 and X3 planes (Fig. 11). Generally, the influence of components on hardness or fracture toughness is equivalent to that of Young's modulus. This observation may be due to the fact that Young's modulus serves as a direct measure of material stiffness, with higher values corresponding to increased resistance to deformation and crack propagation, thereby contributing to higher fracture toughness values (Gupta et al., 2020).
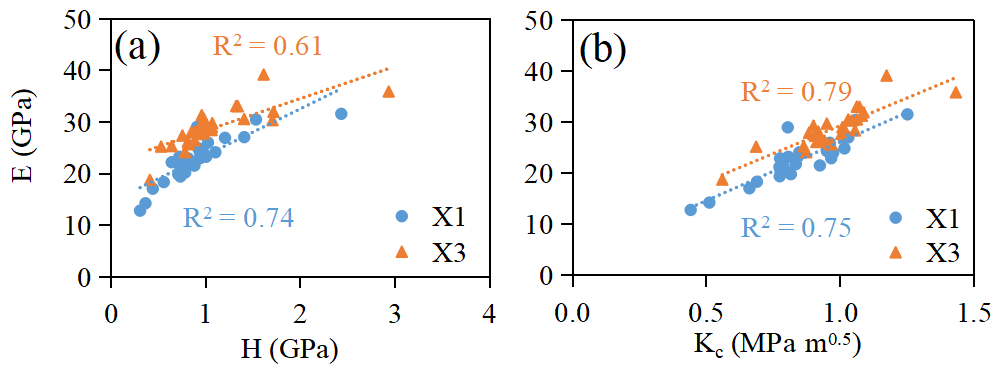
Table 2 presents the statistical correlation analysis between the mechanical parameters and the mineralogical compositions, TOC content (volumetric fraction), porosity, and total pore volume for the shale samples via SPSS software. Similar to the linear fit results observed in Fig. 10, the micromechanical properties (E, H, and Kc) of the WF-LMX shale show a good positive linear relationship with quartz, Q + Dol (quartz and dolomite), and QFC (quartz, feldspar, and carbonate) mineral assemblages, while exhibiting a negative correlation with clay mineral abundance and (clay + TOC) composite content. Taken together, these relationships suggest that the micromechanical behavior of the shale is predominantly controlled by the proportional content of quartz, clay minerals, and organic clay complexes, as these components form the primary structural framework of the shale matrix and collectively determine the overall mechanical performance of the WF-LMX Formation.
Table 2Correlation matrix to investigate the dependence of mechanical parameters on mineralogy, TOC content (volume fraction), porosity, and pore volume.
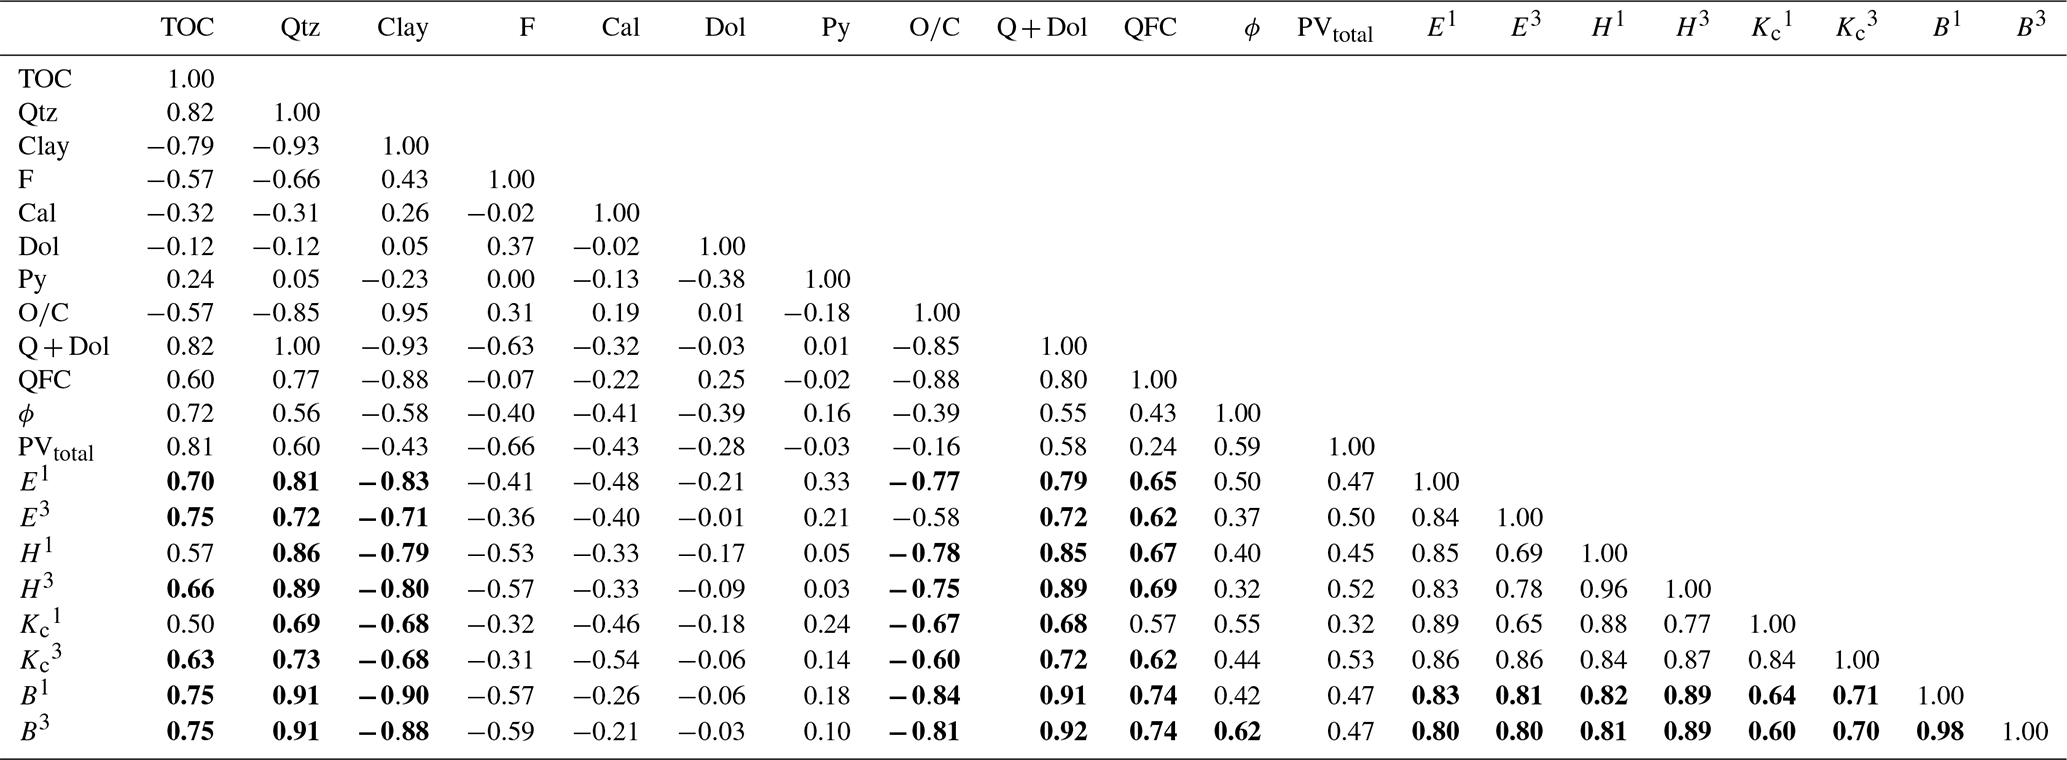
Note: Qtz = quartz; F = feldspar; Cal = calcite; Dol = dolomite; Py = pyrite; = clay + TOC; QFC = total volume content of quartz, feldspar, and carbonate minerals; ϕ = porosity; PVtotal = total nanopore volume. Superscripts 1 and 3 after mechanical parameters denote measurements along the parallel bedding plane (X1) and perpendicular bedding plane (X3), respectively. R2>0.6 are shown in bold. Negative signs (e.g., “−0.90”) indicate inverse correlations between parameters. The micromechanical parameters (E, H, Kc, and B) show strong dependencies on quartz abundance, clay content, ratio, Q + Dol assemblage, and QFC mineral fractions, with nearly all correlation coefficients exceeding 0.60. This underscores their dominant control over the mechanical behavior of the shale.
5.2.2 Brittleness index
Table 2 shows that the B value based on micromechanical properties is strongly positively correlated with quartz (R2=0.91), Q + Dol (R2≥0.91), and QFC (R2=0.74) contents and negatively correlated with clay (R2≥0.88) and clay + TOC contents (R2≥0.81). However, no significant correlations were observed between these parameters and other individual minerals, porosity, or total nanopore volume. Notably, the R2 values for the correlations between the brittleness index (B) and mineralogical constituents were similar to those for Young's modulus (E) and hardness (H) but had consistently higher magnitudes (Table 2). Therefore, quartz, especially for the authigenic quartz, as a distinct constituent of marine shale, plays an important role in enhancing the brittleness of shale. The B is strongly positively correlated with the E and H in both the planes, indirectly suggesting that the effect of component on B in shale is similar to that of E and H. To explain the accuracy of the brittleness index calculated based on micromechanical properties, the mineral composition method and micromechanical properties based on the nanoindentation method are compared to characterize the brittleness of shale. Due to the disunity of brittle minerals, three typical formulas based on mineral composition are each selected. Table 3 shows the brittle mineral and the corresponding formulas.
Table 3Brittleness index model based on mineral composition (V = volume fraction).
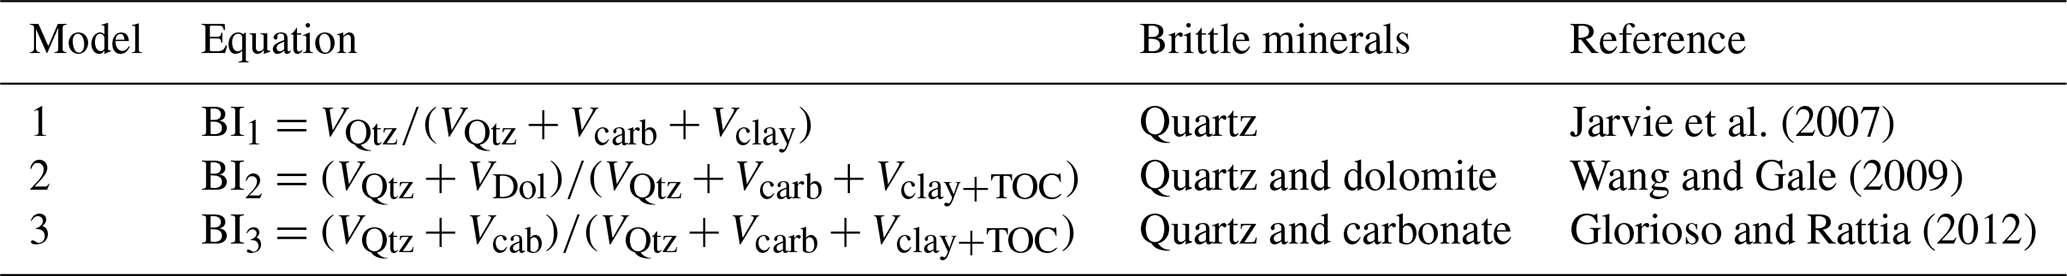
Figure 12 shows that the brittleness index has a better linear positive correlation with E along the X1 plane than along the X3 plane. The correlations between BI1 and E are the strongest among the brittleness indices (BI1, BI2, and BI3) along both the X1 (R2=0.70) and X3 (R2=0.49) planes. The correlation between the brittleness index (BI1, BI2, and BI3) and H in the X1 plane is close to that in the X3 plane. The correlations between the brittleness index (BI1, BI2, and BI3) and H are almost all larger than those between E and the brittleness indices. This suggests that H in the X3 plane is more sensitive to the brittleness index than E. The reason may be related to the presence of various mineral phases and their overall physical properties. E is an inherent property of a material, fundamentally related to atomic bonds, while H measures the resistance to local plastic deformation caused by mechanical indentation or wear, which mainly depends on the microstructure or the arrangement of molecules and atoms (Liu et al., 2021). This difference may lead to the varying correlations with the brittleness index. The B value, determined from the micromechanical properties calculated from nanoindentation, exhibits a strong correlation with the mineral-component-based BI1, BI2, and BI3 values (Fig. 12g–i). Moreover, it shows a similar trend in changes, from the base to the top of the SQ-1 well, to the BI1, BI2, and BI3 values, indicating a high brittleness index at the lower interval of the LMX Formation and the upper interval of the WF Formation, between ∼ 80.0–87.0 m (Fig. 7). Compared with Young's modulus from conventional logging, we can not only obtain the Young's modulus of shale via drill cuttings but also predict its brittleness in the X1 and X3 planes (Fig. 7). Therefore, nanoindentation technology shows great potential for predicting the brittleness index of shale.
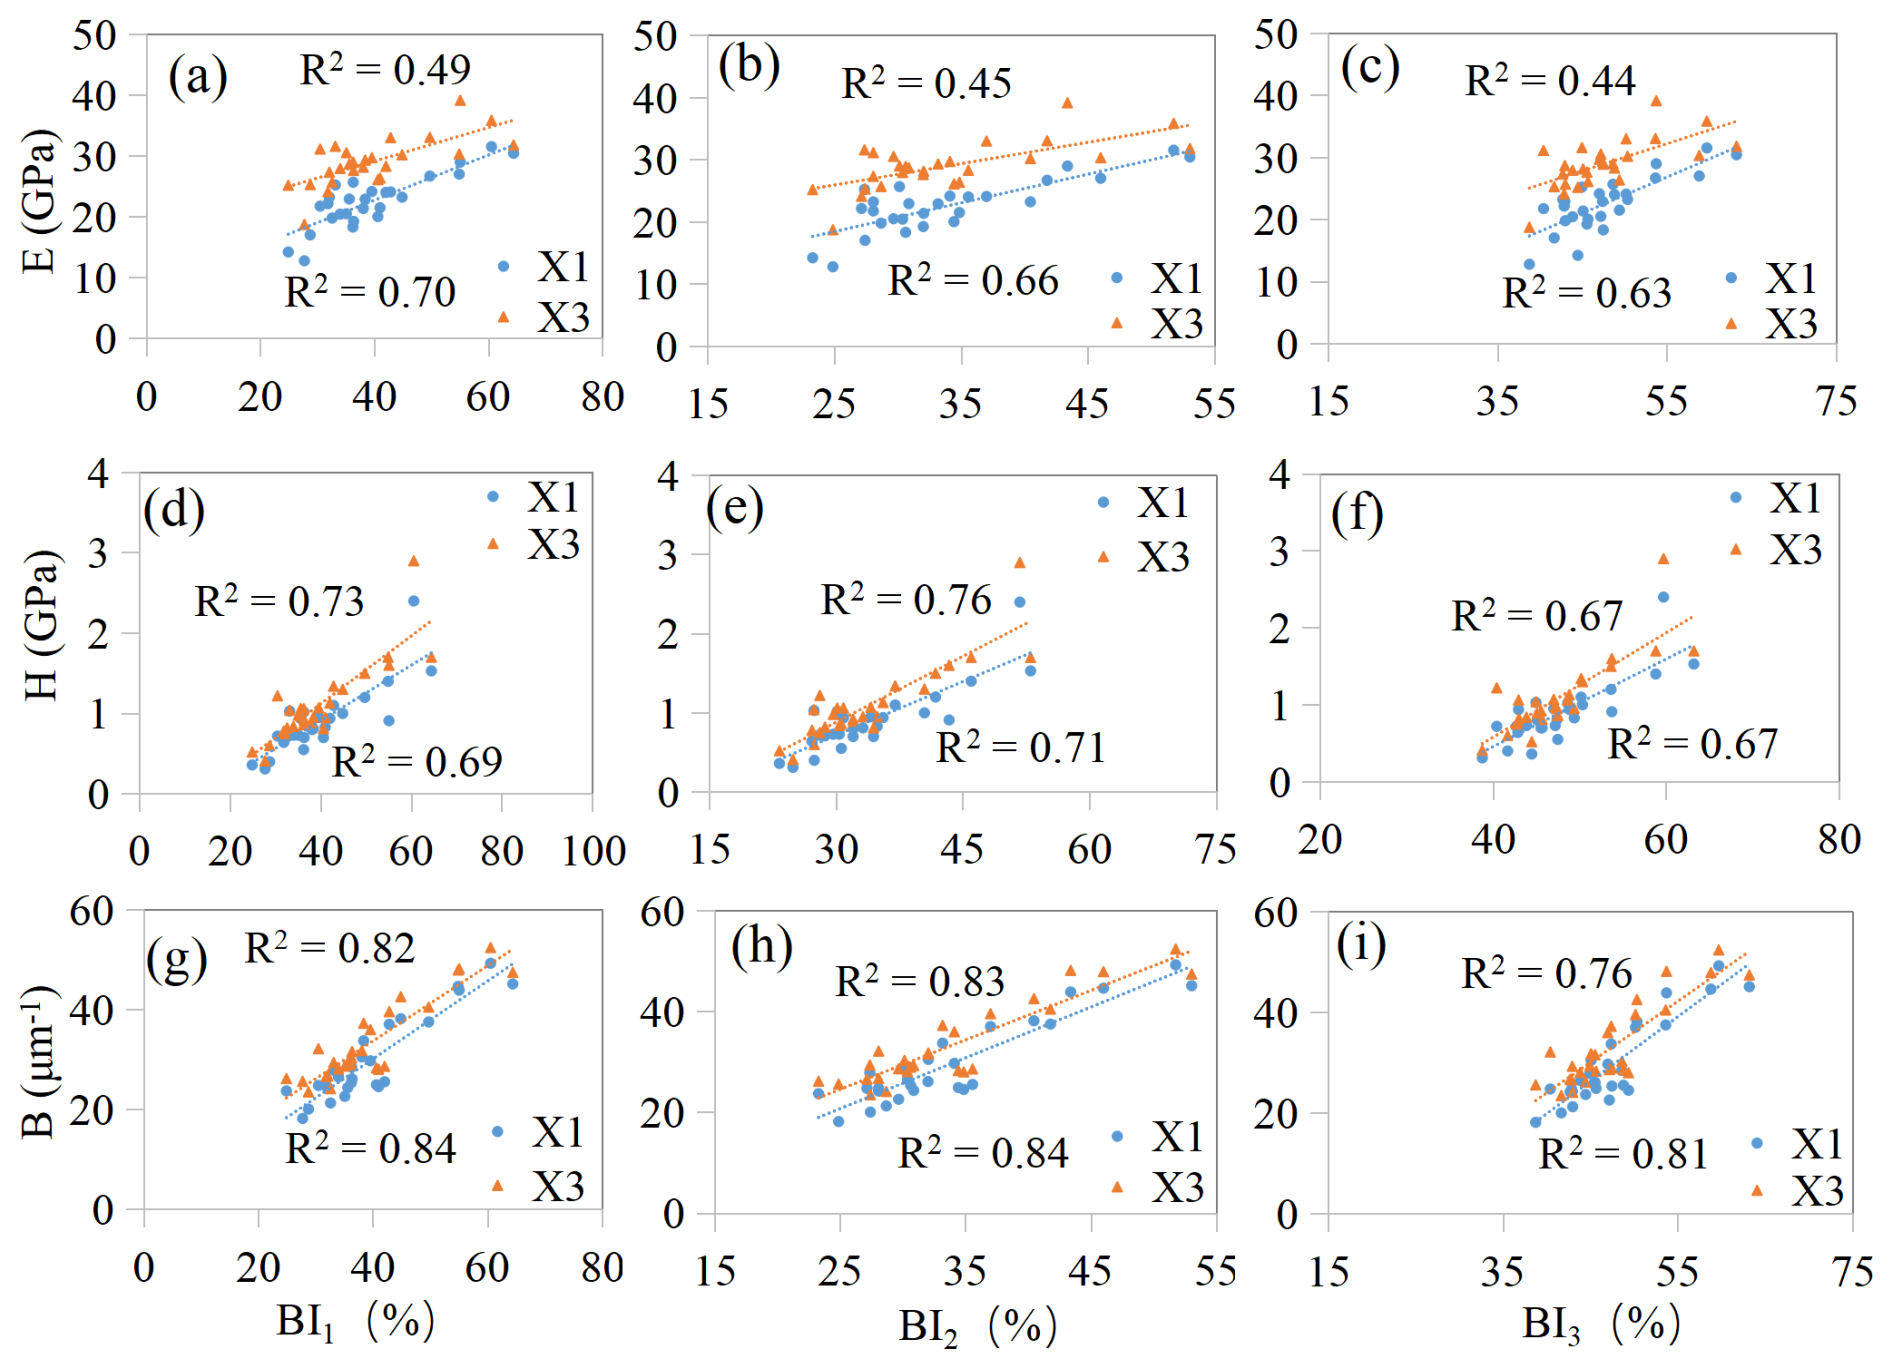
Figure 12Relationship between Young's modulus (E), hardness (H), brittleness index (B) based on the micromechanical properties, and brittleness index (BI1, BI2, and BI3) based on the mineral composition of shale.
5.3 Relationship between micromechanical properties and sedimentary environment
All studied shale samples were deposited in a passive continental margin environment, and the depositional period was mainly characterized by a warm and humid climate. Therefore, these factors are not the main reasons for the change in micromechanical properties of WF-LMX shales. However, changes in constituents (e.g., organic matter and biogenic silica) and redox conditions may have a significant effect on the variations in micromechanical properties of the shales. Previous studies have reported stratigraphic variations in mechanical properties of shales associated with different rock mineralogy, which resulted from sea level cycles (Harris et al., 2011; Slatt and Abousleiman, 2011) and were determined by the sedimentary environment. The WF Formation shales are located in a deep-water continental shelf sedimentary environment. They are located on a transgressive surface of erosion (TSE) or sequence boundary (SB) (Zheng et al., 2018). A decrease in clay minerals and an increase in organic matter and biogenic silica (excess SiO2) were observed in the Transgressive Systems Tract (TST) of the WF Formation from the lower part to the upper part, which is likely due to the change in relative sea level and sediment supply (Liu et al., 2019a). Young's modulus, hardness, and brittleness increase in the TST. The increase in diagenetic silica upward through the TST is also found in the Devonian gas shales of the Appalachian Basin, which increases the brittleness (Lash and Blood, 2011). The Young's modulus, hardness, and brittleness increase almost throughout the TST until reaching up to the maximum flooding surface (MFS) and then decrease slightly in the Highstand Systems Tract (HST) (Figs. 6 and 7).
The lower section of the LMX Formation primarily occupies a deep-water continental shelf, characterized by low-energy and strong reduction conditions, resulting in the deposition of mainly gray-black shale. During the later stages of sedimentation in the LMX Formation, the sea level dropped, and the sedimentary environment gradually shifted to oxidizing conditions and turbidite sediments, leading to the development of a lithological combination dominated by sandy mudstone and muddy siltstone (Fig. 1). The LMX Formation locates on a relatively thin carbonaceous shale TST (at the bottom of the Rhuddanian stage) and a thicker Lowstand Systems Tract (LST) and Highstand Systems Tract (HST). In general, organic matter and biogenic silica (quartz) decrease sharply from the basal to the upper intervals of the Rhuddanian stage of the LMX Formation, while they decrease slightly in the LST of Aeronian stage in the LMX Formation. Similarly, there is a decrease in Young's modulus, hardness, and brittleness in the HST, followed by a slight decrease in the LST. The HST in the LMX Formation records a large decrease in biogenic silica and organic matter input, which contributes to the decrease in hardness and brittleness. In contrast, the LST records a small decrease in silica and an increased flux of terrigenous clay minerals, resulting in a lower hardness and brittleness (Figs. 6 and 7). In general, the elevated values of Young's modulus, hardness, and brittleness values are in the middle-upper part of the TST in the Katian stage, the middle-upper part of the HST and TST in the Hirnantian stage, and the bottom part of the HST in the Rhuddanian stage, which belong to the deep-water shelf facies, corresponding to a high content of biogenic silica and organic matter, which may be the optimal intervals for hydraulic stimulation in these areas.
In this paper, we applied nanoindentation mechanical testing, along with rock mineralogical, major elemental, and pore analyses, to quantitatively evaluate the mechanical profile of WF-LMX shales and the relationship between micromechanical properties and the sedimentary conditions of marine shale formation from the WF-LMX member in the shallow SQ-1 well, Sichuan Basin, southwestern China. The results were as follows:
-
The WF-LMX shales within the study region were deposited in a passive margin environment. Biogenic silica was the major source of quartz mineral.
-
The micromechanical properties varied synchronously with mineral and organic content across the vertical drilling profile, reflecting changes in lithology and sedimentary conditions within the WF-LMX Formation. Specifically, in the SQ-1 well, the micromechanical properties of the shales in the WF-LMX Formation exhibit a distinct vertical pattern from bottom to top, sequentially passing through low, high, and low intervals. This pattern is relatively consistent with the variation in quartz and TOC content. However, it is opposite to the pattern of clay mineral content. We interpret these different trends as essentially dominated by the sedimentary environment of shale.
-
Young's modulus shows a positive linear correlation with quartz content and TOC content and a negative linear correlation with clay minerals and clay + TOC content. There are no correlations or weak correlations with other individual minerals or porosity, suggesting that the micromechanical properties of LMX shale are primarily controlled by quartz content, clay minerals, and organoclay complexes. Autochthonous quartz contributes significantly to the elevated bulk Young's modulus values of the shale.
-
The mineral content/Young's modulus relationship shows a stronger correlation on the X1 plane compared to the X3 plane, and the influence of components in shale on hardness or fracture toughness is equivalent to that of Young's modulus.
-
The mineralogy-based brittleness index exhibits a good positive linear correlation with both Young's modulus and hardness, with a slightly better correlation observed for hardness. Besides, the brittleness index based on micromechanical properties shows a significant consistency with the index based on mineral composition. Based on the nanoindentation method, the lower section of the LMX Formation and upper section of the WF Formation, belonging to the deep-water shelf facies, have high brittleness index values, potentially making them ideal intervals for hydraulic stimulation in relevant areas.
Our observations here demonstrate the relationship between the micromechanical properties and sedimentary environment of WF-LMX shale and predict the optimal intervals for hydraulic stimulation of WF-LMX shale by the brittleness index based on micromechanical properties. Future research can verify the effectiveness of micromechanics in predicting shale fracture intervals by actual field logging data, such as dynamic Young's modulus, thus expanding the application scope of micromechanics in this field.
The data that support the findings of this study are available from the corresponding author upon reasonable request.
The supplement related to this article is available online at https://doi.org/10.5194/se-16-819-2025-supplement.
JW and CY were responsible for the design and methodology of the study, performed the experiments, assembled and analyzed the data, obtained and managed financial support, and drafted and revised the paper. YL, WJ, YZ, and YL performed the experiments. YZ, QH, LF, YW, and YL collected the data. TZ, PP, and YX revised the draft. All authors contributed to the review of the article.
The contact author has declared that none of the authors has any competing interests.
Publisher's note: Copernicus Publications remains neutral with regard to jurisdictional claims made in the text, published maps, institutional affiliations, or any other geographical representation in this paper. While Copernicus Publications makes every effort to include appropriate place names, the final responsibility lies with the authors.
The authors thank Joanna Dziadkowiec and François Renard for their discussions. This is contribution no. IS-3669 from GIGCAS.
This research was supported by the China Postdoctoral Science Foundation (grant no. 2024M763277); the Postdoctoral Fellowship Program of CPSF (grant no. GZC20241735); the Natural Science Foundation of Guangdong Province (grant no. 2023A1515030280); the National Natural Science Foundation of China (grant nos. 41802165 and 42272182); the Basic and Applied Basic Research Project of Guangzhou City (grant no. 2023A04J0208); and the Open Fund of Key Laboratory of Petroleum Resources Research, Gansu Province (grant no. SZDKFJJ2023009).
This paper was edited by Jessica McBeck and reviewed by two anonymous referees.
Abedi, S., Slim, M., and Ulm, F.-J.: Nanomechanics of organic-rich shales: the role of thermal maturity and organic matter content on texture, Acta Geotech., 11, 775–787, https://doi.org/10.1007/s11440-016-0476-2, 2016.
Adachi, M., Yamamoto, K., and Sugisaki, R.: Hydrothermal chert and associated siliceous rocks from the northern Pacific their geological significance as indication od ocean ridge activity, Sediment. Geol., 47, 125–148, https://doi.org/10.1016/0037-0738(86)90075-8, 1986.
Alramahi, B. and Sundberg, M. I.: Proppant Embedment And Conductivity of Hydraulic Fractures In Shales, Paper presented at the 46th U.S. Rock Mechanics/Geomechanics Symposium, https://onepetro.org/ARMAUSRMS/proceedings-abstract/ARMA12/All-ARMA12/122313, 2012.
Boström, K. and Peterson, M. N. A.: The origin of aluminum-poor ferromanganoan sediments in areas of high heat flow on the East Pacific Rise, Mar. Geol., 7, 427–447, https://doi.org/10.1016/0025-3227(69)90016-4, 1969.
Boström, K., Kraemer, T., and Gartner, S.: Provenance and accumulation rates of opaline silica, Al, Ti, Fe, Mn, Cu, Ni and Co in Pacific pelagic sediments, Chem. Geol., 11, 123–148, https://doi.org/10.1016/0009-2541(73)90049-1, 1973.
Boynton, W.: Cosmochemistry of the Rare Earth Elements: Meteorite Studies, in: Developments in Geochemistry, Vol. 2, Elsevier, 63–114, https://doi.org/10.1016/B978-0-444-42148-7.50008-3, 1984.
Charlton, T., Rouainia, M., Aplin, A., Fisher, Q., and Bowen, L.: Nanoindentation of Horn River Basin Shales: The Micromechanical Contrast Between Overburden and Reservoir Formations, J. Geophys. Res.-Sol. Ea., 128, e2022JB025957, https://doi.org/10.1029/2022JB025957, 2023.
Chen, X., Fan, J., Chen, Q., Tang, L., and Hou, X.: Toward a stepwise Kwangsian Orogeny, Sci. China Earth Sci. 57, 379–387, https://doi.org/10.1007/s11430-013-4815-y, 2014.
Cheng, Y. T., Li, Z., and Cheng, C. M.: Scaling relationships for indentation measurements, Philos. Mag. A, 82, 1821–1829, 2002.
Cullers, R. and Podkovyrov, V.: Geochemistry of the Mesoproterozoic Lakhanda shales in southeastern Yakutia, Russia: Implications for mineralogical and provenance control, and recycling, Precambrian Res., 104, 77–93, https://doi.org/10.1016/S0301-9268(00)00090-5, 2000.
Curtis, M. E., Cardott, B. J., Sondergeld, C. H., and Rai, C. S.: Development of organic porosity in the Woodford Shale with increasing thermal maturity, Int. J. Coal Geol., 103, 26–31, https://doi.org/10.1016/j.coal.2012.08.004, 2012.
Cox, R., Lowe, D., and Cullers, R.: The influence of sediment recycling and basement composition on evolution of mudrock chemistry in the southwestern United States, Geochim. Cosmochim. Ac., 59, 2919–2940, https://doi.org/10.1016/0016-7037(95)00185-9, 1995.
Diao, H.: Rock mechanical properties and brittleness evaluation of shale reservoir, Acta Petro. Sin., 29, 3300–3306, 2013.
Du, J., Whittle, A. J., Hu, L., Divoux, T., and Meegoda, J. N.: Characterization of meso-scale mechanical properties of Longmaxi shale using grid microindentation experiments, J. Rock Mech. Geotech. Eng., 13, 555–567, https://doi.org/10.1016/j.jrmge.2020.09.009, 2021.
Fedo, C., Nesbitt, H., and Young, G.: Unraveling the effects of potassium metasomatism in sedimentary rocks and paleosols, with implications for paleoweathering conditions and provenance, Geology, 23, 921–924, https://doi.org/10.1130/0091-7613(1995)023<0921:UTEOPM>2.3.CO;2, 1995.
Fender, T. D., Van Der Land, C., Rouainia, M., Graham, S. P., Jones, D. M., Vane, C. H., and Wagner, T.: The Assessment of Organic Matter Young's Modulus Distribution With Depositional Environment and Maturity, J. Geophys. Res.-Sol. Ea., 125, e2020JB020435, https://doi.org/10.1029/2020jb020435, 2020.
Gautham, S. and Sasmal, S.: Nano-scale fracture toughness of fly ash incorporated hydrating cementitious composites using experimental nanoindentation technique, Theor. Appl. Fract. Mech., 117, 103180, https://doi.org/10.1016/j.tafmec.2021.103180, 2022.
Glorioso, J. C. and Rattia, A.: Unconventional reservoirs: basic petrophysical concepts for shale gas, SPE. 153004, 1–38, https://doi.org/10.2118/153004-MS, 2012.
Guo, T. and Zeng, P.: The Structural and Preservation Conditions for Shale Gas Enrichment and High Productivity in the Wufeng–Longmaxi Formation, Southeastern Sichuan Basin, Energy Explor. Exploit., 33, 259–276, 2015.
Guo, T., Zhang, S., Qu, Z., Zhou, T., Xiao, Y., and Gao, J.: Experimental study of hydraulic fracturing for shale by stimulated reservoir volume, Fuel, 128, 373–380, https://doi.org/10.1016/j.fuel.2014.03.029, 2014.
Guo, W., Shen, W., Li, X., Wang, N., Liu, X., Zhang, X., and Zhou, S.: Study on mechanical characteristics and damage mechanism of the Longmaxi Formation shale in southern Sichuan Basin, China, Energy Explor. Exploit., 38, 454–472, https://doi.org/10.1177/0144598719876858, 2019.
Gupta, I., Sondergeld, C., and Rai, C.: Applications of NanoIndentation for Reservoir Characterization in Shales, in: 52nd US Rock Mechanics/Geomechanics Symposium, https://onepetro.org/ARMAUSRMS/proceedings-abstract/ARMA18/All-ARMA18/ARMA-2018-271/122508, 2018.
Gupta, I., Sondergeld, C., and Rai, C.: Fracture toughness in shales using nano-indentation, J. Petrol. Sci. Eng., 191, 107222, https://doi.org/10.1016/j.petrol.2020.107222, 2020.
Harris, N., Miskimins, J., and Mnich, C.: Mechanical anisotropy in the Woodford Shale, Permian Basin: Origin, magnitude, and scale, Leading Edge, 30, 284–291, https://doi.org/10.1190/1.3567259, 2011.
He, C., Ji, L., Wu, Y., Su, A., and Zhang, M.: Characteristics of hydrothermal sedimentation process in the Yanchang Formation, south Ordos Basin, China: Evidence from element geochemistry, Sediment. Geol., 345, 33–41, https://doi.org/10.1016/j.sedgeo.2016.09.001, 2016.
Jarvie, D., Hill, R., Ruble, T., and Pollastro, R.: Unconventional shale-gas systems: The Mississippian Barnett Shale of north-central Texas as one model for thermogenic shale-gas assessment, AAPG Bull., 91, 475–499, https://doi.org/10.1306/12190606068, 2007.
Jia, L., Xu, Q., and Zhang, L.: Assessment of deep shale fracture toughness using nanoindentation tests, IOP Conf. Ser.: Earth Environ. Sci., 861, 062068, https://doi.org/10.1088/1755-1315/861/6/062068, 2021a.
Jia, Y., Tang, J., Lu, Y., and Lu, Z.: Laboratory geomechanical and petrophysical characterization of Longmaxi shale properties in Lower Silurian Formation, China, Mar. Petrol. Geol., 124, 104800, https://doi.org/10.1016/j.marpetgeo.2020.104800, 2021b.
Kumar, V., Sondergeld, C. H., and Rai, C. S.: Nano to Macro Mechanical Characterization of Shale, SPE annual technical conference and exhibition, SPE 159804, https://doi.org/10.2118/159804-MS, 2012.
Larsson, P. L., Giannakopoulos, A. E., Sderlund, E., Rowcliffe, D. J., and Vestergaard, R.: Analysis of Berkovich indentation, Int. J. Solids Struct., 33, 221–248, https://doi.org/10.1016/0020-7683(95)00033-7, 1996.
Lash, G. and Blood, R.: Sequence stratigraphy as expressed by shale source rock and reservoir characteristics – Examples from the Devonian succession, Appalachian Basin, AAPG Search and Discovery, 80168, https://www.searchanddiscovery.com/pdfz/documents/2011/80168lash/ndx_lash.pdf.html, 2011.
Lawn, B. R. and Marshall, D. B.: Hardness, Toughness, and Brittleness: An Indentation Analysis, J. Am. Ceram. Soc., 62, 347–350, https://doi.org/10.1111/j.1151-2916.1979.tb19075.x, 1979.
Li, C., Ostadhassan, M., Abarghani, A., Fogden, A., and Kong, L.: Multi-scale evaluation of mechanical properties of the Bakken shale, J. Mater. Sci., 54, 2133–2151, https://doi.org/10.1007/s10853-018-2946-4, 2018.
Li, H., Li, D., He, Q., Sun, Q., and Zhao, X.: Controlling mechanism of shale palaeoenvironment on its tensile strength: A case study of Banjiuguan Formation in Micangshan Mountain, Fuel, 355, 129505, https://doi.org/10.1016/j.fuel.2023.129505, 2024.
Li, Y., Zhang, T., Ellis, G. S., and Shao, D.: Depositional environment and organic matter accumulation of Upper Ordovician–Lower Silurian marine shale in the Upper Yangtze Platform, South China, Palaeogeogr. Palaeoecl., 466, 252–264, https://doi.org/10.1016/j.palaeo.2016.11.037, 2017.
Liu, B., Schieber, J., Mastalerz, M., and Teng, J.: Organic matter content and type variation in the sequence stratigraphic context of the Upper Devonian New Albany Shale, Illinois Basin, Sediment. Geol., 383, 101–120, https://doi.org/10.1016/j.sedgeo.2019.02.004, 2019a.
Liu, K., Jin, Z., Zeng, L., Ostadhassan, M., and Xu, X.: Understanding the creep behavior of shale via nano-DMA method, Energy Rep., 7, 7478–7487, https://doi.org/10.1016/j.egyr.2021.10.099, 2021.
Liu, K., Jin, Z., Zeng, L., Ozotta, O., Gentzis, T., and Ostadhassan, M.: Alteration in the mechanical properties of the Bakken during exposure to supercritical CO2, Energy, 262, 125545, https://doi.org/10.1016/j.energy.2022.125545, 2022.
Liu, K., Ostadhassan, M., and Bubach, B.: Applications of nano-indentation methods to estimate nanoscale mechanical properties of shale reservoir rocks, J. Nat. Gas Sci. Eng., 35, 1310–1319, https://doi.org/10.1016/j.jngse.2016.09.068, 2016.
Liu, Y.: Fracture toughness assessment of shales by nanoindentation, MS Thesis, University of Massachusetts Amherst, Cambridge, https://doi.org/10.7275/jzym-1g18, 2015.
Liu, Y., Xiong, Y., Liu, K., Yang, C., and Peng, P.: Indentation size and loading rate sensitivities on mechanical properties and creep behavior of solid bitumen, Int. J. Coal Geol., 216, 103295, https://doi.org/10.1016/j.coal.2019.103295, 2019b.
Long, Y., Zhang, Y., Huang, X., Wang, Y., Zhao, Y., Wang, R., and Song, F.: Assessment of the Multiphase Mechanical Properties of the Longmaxi Formation Shale Using Nanoindentation Tests, ACS Omega, 6, 18200–18214, https://doi.org/10.1021/acsomega.1c02049, 2021.
Ma, Y., Zhong, N., Li, D., Pan, Z., Cheng, L., and Liu, K.: Organic matter/clay mineral intergranular pores in the Lower Cambrian Lujiaping Shale in the north-eastern part of the upper Yangtze area, China: A possible microscopic mechanism for gas preservation, Int. J. Coal Geol., 137, 38–54, https://doi.org/10.1016/j.coal.2014.11.001, 2015.
Ma, T., Liu, K., Su, X., Chen, P., Ranjith, P. G., and Martyushev, D. A.: Investigation on the anisotropy of meso-mechanical properties of shale rock using micro-indentation., Bull. Eng. Geol. Environ., 83, 29, https://doi.org/10.1007/s10064-023-03510-y, 2023.
Manjunath, G. L. and Jha, B.: Geomechanical characterization of gondwana shale across nano-micro-meso scales, Int. J. Rock Mech. Min. Sci., 119, 35–45, https://doi.org/10.1016/j.ijrmms.2019.04.003, 2019.
Maynard, J. B., Valloni, R., and Yu, H. S.: Composition of modern deep-sea sands from arc-related basins, Geol. Soc. Lond. Spec. Publ., 10, 551–561, 1982.
Milliken, K. L., Ergene, S. M., and Ozkan, A.: Quartz types, authigenic and detrital, in the Upper Cretaceous Eagle Ford Formation, South Texas, USA, Sediment. Geol., 339, 273–288, https://doi.org/10.1016/j.sedgeo.2016.03.012, 2016.
Murray, R. W., Buchholtz Ten Brink, M. R., Gerlach, D. C., Russ, G. P., and Jones, D. L.: Rare earth, major, and trace elements in chert from the Franciscan Complex and Monterey Group, California: Assessing REE sources to fine-grained marine sediments, Geochim. Cosmochim. Ac., 55, 1875–1895, https://doi.org/10.1016/0016-7037(91)90030-9, 1991.
Nesbitt, H. and Wilson, R.: Recent Chemical Weathering of Basalts, Am. J. Sci., 292, 740–777, https://doi.org/10.2475/ajs.292.10.740, 1992.
Nesbitt, H. W. and Young, G. M.: Early Proterozoic climates and plate motions inferred from major element chemistry of lutites, Nature, 299, 715–717, https://doi.org/10.1038/299715a0, 1982.
Oliver, W. C. and Pharr, G. M.: An improved technique for determining hardness and elastic modulus using load and displacement sensing indentation experiments, J. Mater. Res., 7, 1564–1583, https://doi.org/10.1557/JMR.1992.1564, 1992.
Oliver, W. C. and Pharr, G. M.: Measurement of hardness and elastic modulus by instrumented indentation: Advances in understanding and refinements to methodology, J. Mater. Res., 19, 3–20, 2004.
Reimann, C. and de Caritat, P.: New soil composition data for Europe and Australia: Demonstrating comparability, identifying continental-scale processes and learning lessons for global geochemical mapping, Sci. Total Environ., 416, 239–252, https://doi.org/10.1016/j.scitotenv.2011.11.019, 2012.
Reynolds, J. H. and Verhoogen, J.: Natural variations in the isotopic constitution of silicon, Geochim. Cosmochim. Ac., 3, 224–234, https://doi.org/10.1016/0016-7037(53)90041-6, 1953.
Rickman, R., Mullen, M., Petre, E., Grieser, B., and Kundert, D.: A Practical Use of Shale Petrophysics for Stimulation Design Optimization: All Shale Plays Are Not Clones of the Barnett Shale, SPE Annual Technical Conference and Exhibition, https://doi.org/10.2118/115258-MS, 2008.
Roser, B. P. and Korsch, R. J.: Provenance signatures of sandstone-mudstone suites determined using discriminant function analysis of major-element data, Chem. Geol., 67, 119–139, https://doi.org/10.1016/0009-2541(88)90010-1, 1988.
Schieber, J., Krinsley, D., and Riciputi, L.: Diagenetic origin of quartz silt in mudstones and implications for silica cycling, Nature, 406, 981–985, https://doi.org/10.1038/35023143, 2000.
Sethi, C., Hazra, B., Ostadhassan, M., Motra, H. B., Dutta, A., Pandey, J. K., and Kumar, S.: Depositional environmental controls on mechanical stratigraphy of Barakar Shales in Rajmahal Basin, India, Int. J. Coal Geol., 285, 104477, https://doi.org/10.1016/j.coal.2024.104477, 2024.
Shi, X., He, Z., Long, S., Peng, Y., Li, D., and Jiang, S.: Loading rate effect on the mechanical behavior of brittle longmaxi shale in nanoindentation, Int. J. Hydrogen Energy, 44, 6481–6490, https://doi.org/10.1016/j.ijhydene.2019.01.028, 2019a.
Shi, X., Jiang, S., Lu, S., He, Z., Li, D., Wang, Z., and Xiao, D.: Investigation of mechanical properties of bedded shale by nanoindentation tests: A case study on Lower Silurian Longmaxi Formation of Youyang area in southeast Chongqing, China, Petrol. Explor. Dev., 46, 163–172, https://doi.org/10.1016/s1876-3804(19)30016-3, 2019b.
Shi, X., Jiang, S., Wang, Z., Bai, B., Xiao, D., and Tang, M.: Application of nanoindentation technology for characterizing the mechanical properties of shale before and after supercritical CO2 fluid treatment, J. CO2 Util., 37, 158–172, https://doi.org/10.1016/j.jcou.2019.11.022, 2020.
Shukla, P., Kumar, V., Curtis, M., Sondergeld, C. H., and Rai, C. S.: Nanoindentation Studies on Shales. Paper presented at the 47th U.S. Rock Mechanics/Geomechanics Symposium, San Francisco, California, 2013.
Slatt, R. M. and Abousleiman, Y.: Merging sequence stratigraphy and geomechanics for unconventional gas shales, Leading Edge, 30, 274–282, https://doi.org/10.1190/1.3567258, 2011.
Sone, H. and Zoback, M. D.: Mechanical properties of shale-gas reservoir rocks – Part 1: Static and dynamic elastic properties and anisotropy, Geophysics, 78, D381–D392, https://doi.org/10.1190/geo2013-0050.1, 2013a.
Sone, H. and Zoback, M. D.: Mechanical properties of shale-gas reservoir rocks – Part 2: Ductile creep, brittle strength, and their relation to the elastic modulus, Geophysics, 78, D390–D399, 2013b.
Ulm, F. J. and Abousleiman, Y.: The nanogranular nature of shale, Acta Geotech., 1, 77–88, https://doi.org/10.1007/s11440-006-0009-5, 2006.
Ulm, F. J., Delafargue, A., and Constantinides, G.: Experimental Microporomechanics, Springer, Vienna, https://doi.org/10.1007/3-211-38046-9_7, 2005.
Wang, F. P. and Gale, J. F.: Screening criteria for shale-gas systems, Gulf Coast Association of Geological Societies Transactions, 59, 779–793, 2009.
Wang, J., Dziadkowiec, J., Liu, Y., Jiang, W., Zheng, Y., Xiong, Y., Peng, P. A., and Renard, F.: Combining atomic force microscopy and nanoindentation helps characterizing in-situ mechanical properties of organic matter in shale, Int. J. Coal Geol., 281, 104406, https://doi.org/10.1016/j.coal.2023.104406, 2024.
Wang, J., Yang, C., Liu, Y., and Xiong, Y.: Nanoindentation investigation of mechanical and creep properties of continental Triassic Yanchang Formation shale, Ordos Basin, Interpretation, 10, SJ29–SJ41, https://doi.org/10.1190/int-2021-0218.1, 2022a.
Wang, J., Yang, C., Liu, Y., Li, Y., and Xiong, Y.: Using Nanoindentation to Characterize the Mechanical and Creep Properties of Shale: Load and Loading Strain Rate Effects, ACS Omega, 7, 14317–14331, https://doi.org/10.1021/acsomega.2c01190, 2022b.
Wang, J., Liu, Y., Yang, C., Jiang, W., Li, Y., Xiong, Y., and Peng, P. A.: Evolution of mechanical properties of kerogen with thermal maturity, Mar. Petrol. Geol., 145, 105906, https://doi.org/10.1016/j.marpetgeo.2022.105906, 2022c.
Wang, J., Liu, Y., Yang, C., Zheng, Y., Jiang, W., Menegon, L., Renard, F., Peng, P. A., and Xiong, Y.: Upscaling the creep behavior of clay-rich and quartz-rich shales from nanoindentation measurements: Application to the Wufeng-Longmaxi shale, China, Int. J. Rock Mech. Min. Sci., 171, 105580, https://doi.org/10.1016/j.ijrmms.2023.105580, 2023.
Wang, Q., Feng, Y., Gao, P., Meng, G., Lu, C., Fan, Q., Li, G., Tan, Y., and Xiao, X.: Influence of the sedimentary environment of the Wufeng-Longmaxi shale on organic matter accumulation in the Dingshan area, Sichuan Basin, Front. Earth Sci., 12, 1457377, https://doi.org/10.3389/feart.2024.1457377, 2024.
Wei, C., Dong, T., He, Z., He, S., He, Q., Yang, R., Guo, X., and Hou, Y.: Major, trace-elemental and sedimentological characterization of the upper Ordovician Wufeng-lower Silurian Longmaxi formations, Sichuan Basin, south China: Insights into the effect of relative sea-level fluctuations on organic matter accumulation in shales, Mar. Petrol. Geol., 126, 104905, https://doi.org/10.1016/j.marpetgeo.2021.104905, 2021.
Yan, C., Jin, Z., Zhao, J., Du, W., and Liu, Q.: Influence of sedimentary environment on organic matter enrichment in shale: A case study of the Wufeng and Longmaxi Formations of the Sichuan Basin, China, Mar. Petrol. Geol., 92, 880–894, https://doi.org/10.1016/j.marpetgeo.2018.01.024, 2018.
Yang, C., Xiong, Y., Wang, J., Li, Y., and Jiang, W.: Mechanical characterization of shale matrix minerals using phase-positioned nanoindentation and nano-dynamic mechanical analysis, Int. J. Coal Geol., 229, 103571, https://doi.org/10.1016/j.coal.2020.103571, 2020.
Yang, Z., Wang, L., Zhang, G., and Ho, C.: Micromechanical characterization of fluid-shale interactions via nanoindentation, SPE Asia Pacific Hydraulic Fracturing Conference,https://doi.org/10.2118/181833-MS, 2016.
Yang, Z., Wang, L., Chen, Z., Xiang, D., Hou, D., Ho, C. L., and Zhang, G.: Micromechanical Characterization of Fluid/Shale Interactions by Means of Nanoindentation, SPE Reservoir Eval. Eng., 21, 405–417, https://doi.org/10.2118/181833-pa, 2018.
Zeng, Q., Feng, Y., and Xu, S.: A discussion of “Application of nano-indentation methods to estimate nanoscale mechanical properties of shale reservoir rocks” by K Liu, M Osatadhassan and B Bubach, J. Nat. Gas Sci. Eng., 42, 187–189, https://doi.org/10.1016/j.jngse.2017.02.027, 2017.
Zeng, Q., Wu, Y., Liu, Y., and Zhang, G.: Determining the micro-fracture properties of Antrim gas shale by an improved micro-indentation method, J. Nat. Gas Sci. Eng., 62, 224–235, https://doi.org/10.1016/j.jngse.2018.12.013, 2019.
Zhao, J., Zhang, D., Wu, T., Tang, H., and Dai, C.: Multiscale Approach for Mechanical Characterization of Organic-Rich Shale and Its Application, Int. J. Geomech., 19, 04018180, https://doi.org/10.1061/(ASCE)GM.1943-5622.0001281, 2019.
Zhao, X., Li, Q., Jiang, Z., Zhang, R., and Li, H.: Organic geochemistry and reservoir characterization of the organic matter-rich calcilutite in the Shulu Sag, Bohai Bay Basin, North China, Mar. Petrol. Geol., 51, 239–255, https://doi.org/10.1016/j.marpetgeo.2013.12.014, 2014.
Zheng, Y., Liao, Y., Wang, Y., Xiong, Y., and Peng, P. A.: Organic geochemical characteristics, mineralogy, petrophysical properties, and shale gas prospects of the Wufeng–Longmaxi shales in Sanquan Town of the Nanchuan District, Chongqing, AAPG Bull., 102, 2239–2265, https://doi.org/10.1306/04241817065, 2018.
Zheng, Y., Liao, Y., Wang, Y., Xiong, Y., and Peng, P. A.: The main geological factors controlling the Wufeng-Longmaxi shale gas content, AAPG Bull., 106, 2073–2102, https://doi.org/10.1306/07132218243, 2022.
Zou, C., Dong, D., Wang, S., Li, J., Li, X., Wang, Y., Li, D., and Cheng, K.: Geological characteristics and resource potential of shale gas in China, Pet. Explor. Dev., 37, 641–653, https://doi.org/10.1016/s1876-3804(11)60001-3, 2010.