the Creative Commons Attribution 4.0 License.
the Creative Commons Attribution 4.0 License.
 | 06 Jan 2026
Seismic anisotropy under Zagros foreland from SKS splitting observations
Ayoub Kaviani
Wathiq Abdulnaby
Hanan Mahdi
Haydar Al-Shukri
We present SK[K]S splitting measurements from 18 newly deployed seismic stations in the foreland of the Zagros collision zone, providing new insights into asthenospheric flow and lithospheric deformation associated with the Arabian-Eurasian continental collision. Our results reveal two distinct fast-axis orientations: NE–SW in northern Iraq and NW–SE in the Mesopotamian Plain and Persian Gulf. The NE–SW anisotropy in northern Iraq aligns with fast-axis orientations observed in the Iranian-Anatolian Plateau and the azimuth of absolute plate motion, indicating large-scale asthenospheric flow as the primary cause of anisotropy across the northern Middle East. In contrast, the NW–SE-trending anisotropy in the Mesopotamian Plain and Persian Gulf, characterized by smaller splitting times, is parallel to the previously reported Pn anisotropy, suggesting a contribution from lithospheric mantle anisotropy, likely preserved as a remnant of past rifting. The influence of asthenospheric flow on the observed seismic anisotropy in this region appears minor. These findings demonstrate a dual origin of seismic anisotropy in the Zagros foreland, where lithospheric fabric related to Mesozoic rifting dominates in the Mesopotamian Plain, southwest of the Zagros lithosphere keel, while asthenospheric flow governs the anisotropy in northern Iraq and surrounding regions with thin lithosphere. This distinction refines models of mantle dynamics and lithosphere-asthenosphere coupling in continental collision zones.
- Article
(12518 KB) - Full-text XML
-
Supplement
(539 KB) - BibTeX
- EndNote


Seismic anisotropy is a powerful tool for probing the dynamics of the Earth's mantle and understanding the processes that drive plate tectonics (e.g., Park and Levin, 2002; Long and Becker, 2010). It provides critical insights into deformation within the crust and upper mantle and can reveal deep structural features, such as mantle flow, that are often inaccessible to other geophysical methods (Silver and Chan, 1991).
This study focuses on the foreland region of the Zagros continental collision zone, a key segment of the Arabia–Eurasia plate boundary (Fig. 1). Here, we investigate the interaction between asthenospheric mantle flow and the overlying continental lithosphere, particularly the influence of the thick lithospheric root beneath the Zagros orogen (Priestley et al., 2012). These interactions are shaped by large-scale plate motions and localized mantle dynamics, including shear and normal tractions at the base of the lithosphere (Sandvol et al., 2003). Despite the tectonic significance of the region, the Zagros foreland remains underexplored due to limited seismic station coverage.
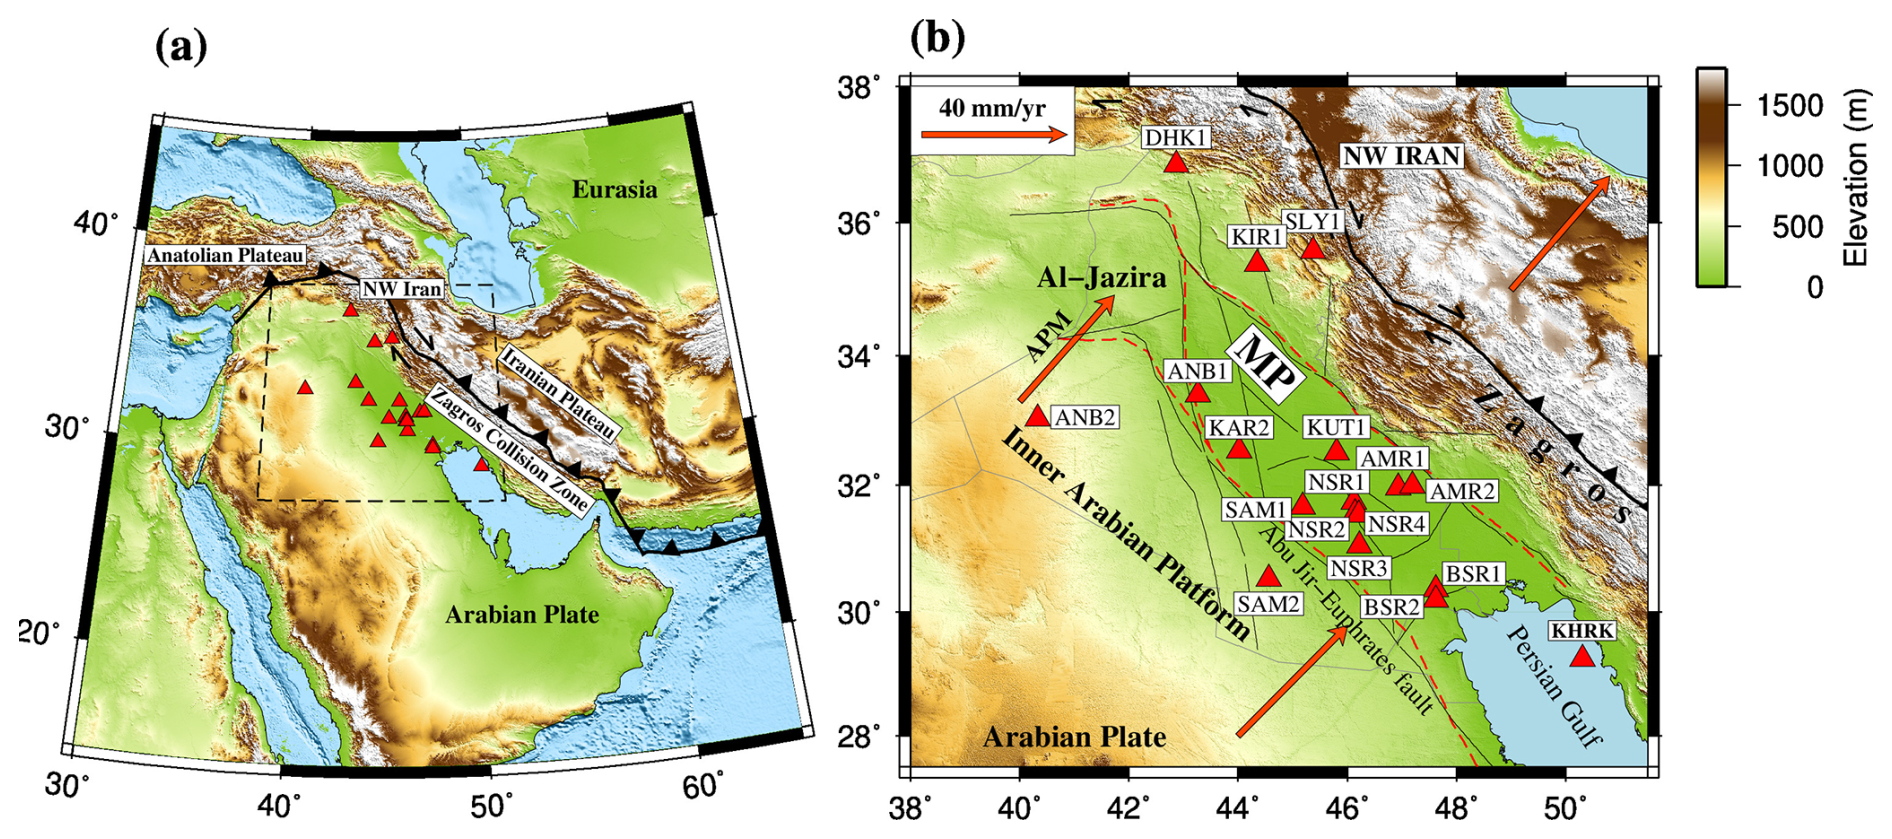
Figure 1(a) Topographic Map of the Middle East. The triangles indicate the locations of 18 seismic stations within the study area. The solid line marks the Bitlis-Zagros suture boundary. The dashed-line rectangle outlines the boundaries of the map displayed in panel (b). (b) Topographic Map of Mesopotamian Foredeep, situated in the foreland of the Zagros collision zone. The red dashed line indicates the tectonic division of Iraq as proposed by Fouad (2010) and Sissakian et al. (2017), separating the Inner Arabian Platform from the Outer Arabian Platform, which includes the Mesopotamian Foredeep, Al-Jazira, and Zagros collision zone. Arrows represent the absolute plate motion (APM) vectors from Kreemer et al. (2014). Thin black lines mark the location of basement faults within the Zagros Foreland Basin. Topographic and bathymetric data were obtained from the ETOPO1 global relief model (NOAA NCEI, 2022).
Teleseismic shear-wave splitting offers a sensitive method for detecting anisotropy within both the lithospheric and asthenospheric mantle (Silver and Holt, 2002). In the broader Middle East, SK[K]S splitting studies have revealed a consistent NE-oriented fast axis beneath northern Iran and Anatolia, interpreted as reflecting asthenospheric flow aligned with the absolute plate motion (APM) in a no-net-rotation frame (Paul et al., 2014; Arvin et al., 2021; Kaviani et al., 2021). In contrast, the anisotropy pattern across the Zagros is more complex, influenced by deformation of the thick Arabian lithosphere (Sadeghi-Bagherabadi et al., 2018b) and lateral variations in lithospheric thickness, which may deflect or suppress asthenospheric flow (Kaviani et al., 2021).
Despite these advances, the foreland basin beneath eastern Iraq and the Persian Gulf remains poorly characterized. This is largely due to logistical constraints: the partial overlap of the region with the Persian Gulf limits onshore station coverage, and eastern Iraq has historically lacked adequate seismic monitoring (Fig. 1). As a result, it has been difficult to resolve whether anisotropy in this region reflects present-day mantle flow or inherited lithospheric structure.
To address this gap, we analyze new data from 17 seismic stations in Iraq and one recently deployed station on an island in the Persian Gulf. The Iraqi stations, installed as part of a network enhancement initiative led by Lawrence Livermore National Laboratory, offer the first opportunity to investigate anisotropic patterns across this under-sampled region. Using shear-wave splitting analysis of SK[K]S phase, we assess the interaction between NE-oriented asthenospheric flow and the Arabian lithospheric keel, focusing specifically on the Zagros foreland.
We consider two main geodynamic scenarios for this interaction. In the first, the thick lithospheric root beneath the Zagros may force the asthenospheric flow to deeper levels, allowing it to continue beneath the orogen without significant lateral deflection. In the second, the lithospheric keel acts as a barrier, redirecting mantle flow laterally toward areas of thinner lithosphere in adjacent regions, such as northwest Iran, eastern Anatolia, or the Makran subduction zone. In addition, we evaluate the possibility of fossil anisotropy, a “frozen” lithospheric fabric inherited from Mesozoic rifting events during the earlier tectonic evolution of the region as part of northern Gondwana.
A better understanding of seismic anisotropy beneath the Zagros foreland is critical for distinguishing between these scenarios and for constraining the relative contributions of lithospheric and asthenospheric anisotropy. This has broader implications for understanding the mechanical coupling across the Arabia–Eurasia plate boundary, the dynamics of mantle flow in convergent zones, and the preservation of tectonic fabrics within stable continental lithosphere. The primary objectives of this study are: (1) To determine whether seismic anisotropy in the Zagros foreland originates in the lithosphere or asthenosphere; (2) To assess the possible deflection or suppression of mantle flow by the lithospheric keel beneath the Zagros; and (3) To investigate whether the NW–SE anisotropy observed in the Mesopotamian Plain reflects fossil fabric from Mesozoic rifting.
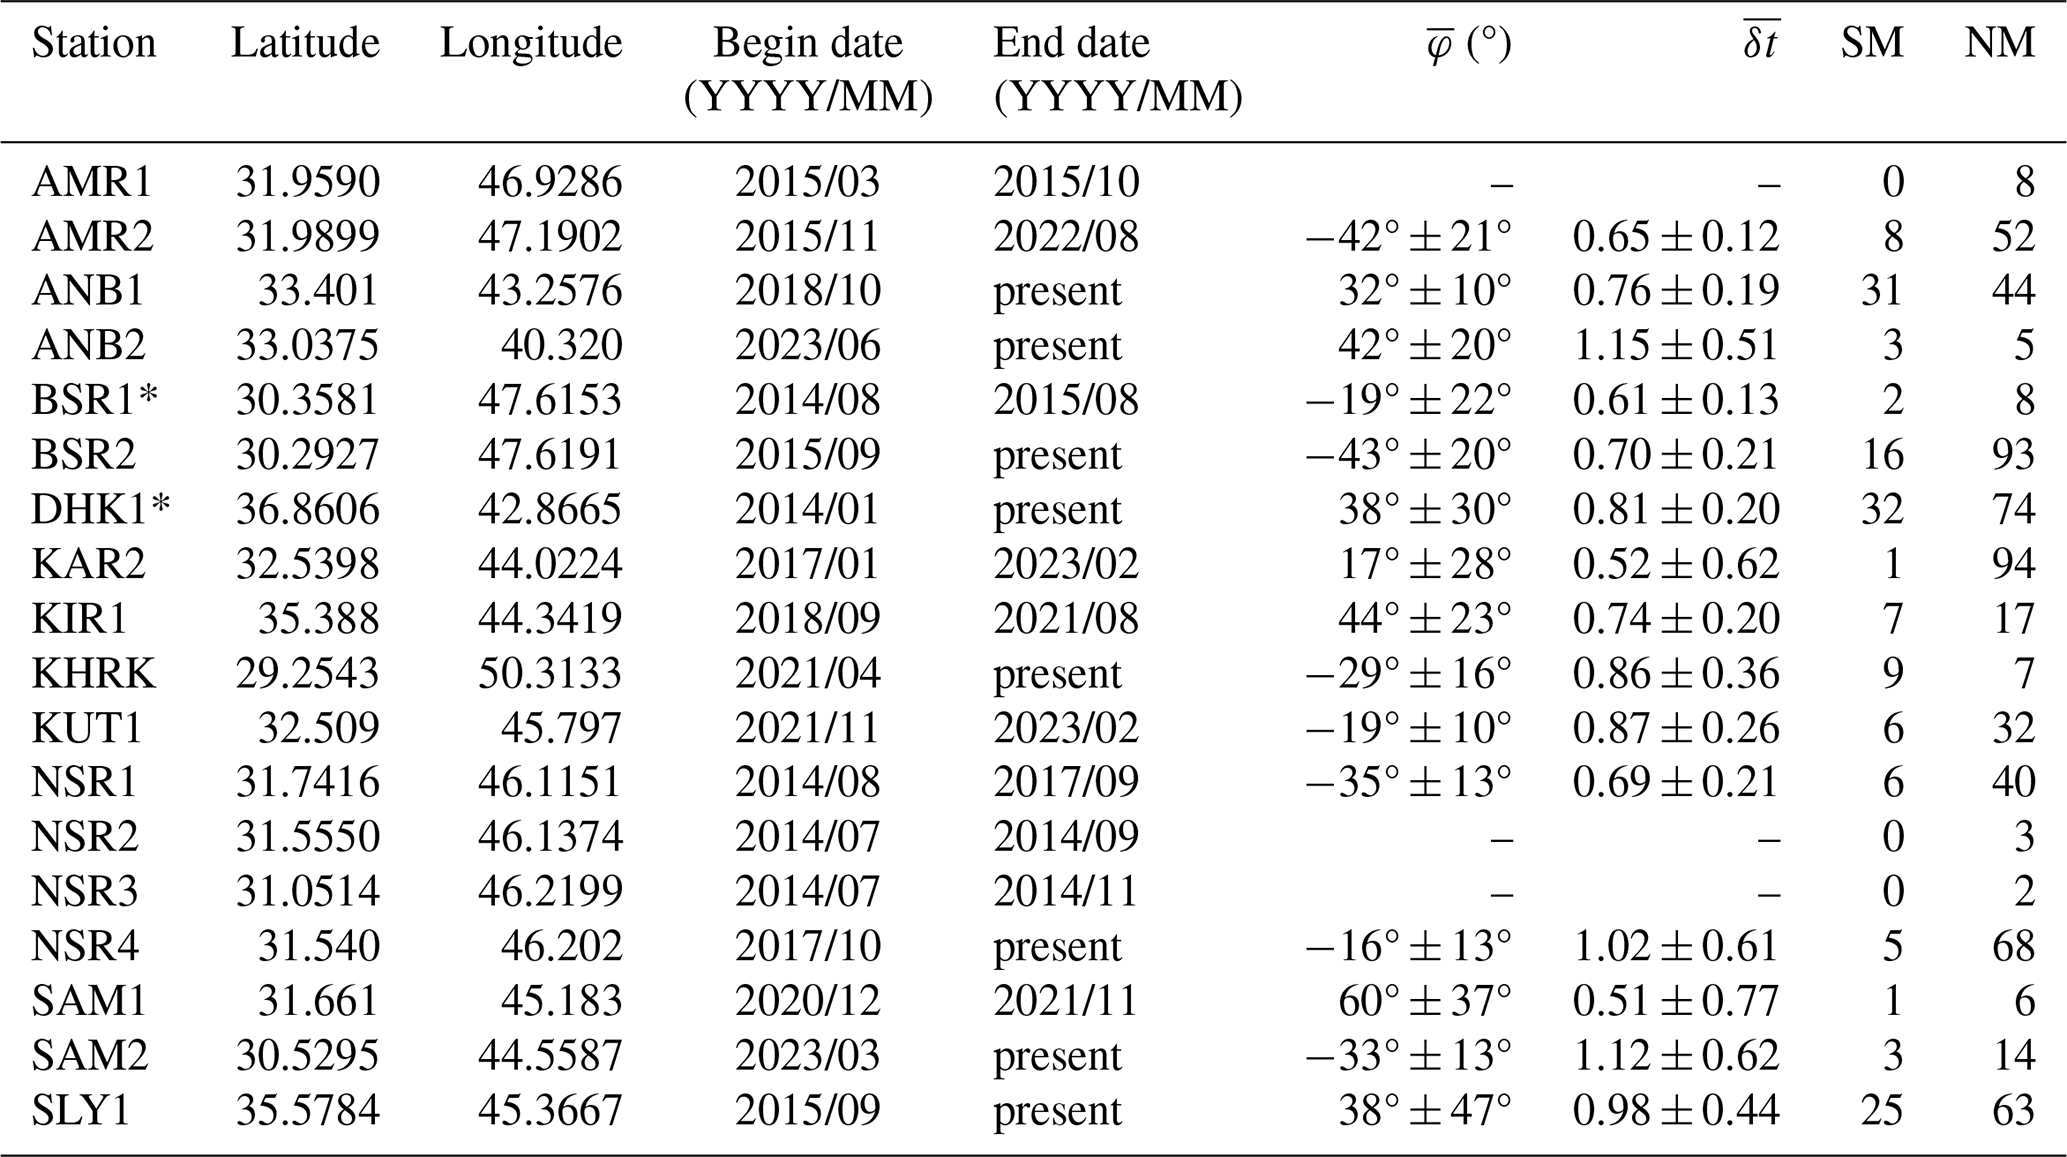
The primary dataset used in this study originates from a regional seismic network that has been operational in Iraq since 2014, established through a multi-institutional collaboration (Abdulnaby et al., 2020; Fig. 1). Table 1 provides the station coordinates and the time intervals during which data were accessible. Most stations were repositioned over time, with data collection periods ranging from five months to nine years (Table 1). To enhance lateral data coverage in the Zagros foreland, we also incorporated data from a newly established seismic station situated on Khark Island in the Persian Gulf. This station is operated by the International Institute of Earthquake Engineering and Seismology in Iran.
Table 1Summary of the used stations in this study and their splitting parameters. The table shows the station location, the circular mean of the fast axis orientation (), the mean splitting time (), the number of splitting measurements (SM), and the number of null measurements (NM). Stations with bimodal fast axis orientations are marked with an asterisk (*).
We extracted three-component waveforms from 342 teleseismic earthquakes with magnitudes≥6.0 from epicentral distances between 90° and 140°. A total of 3256 seismograms met these criteria. Two splitting parameters, Φ (fast-axis anisotropy orientation) and δt (splitting time between fast and slow polarizations), were estimated using the rotation-correlation method of Bowman and Ando (1987). Before performing the splitting analysis, we visually examined the waveforms to confirm low noise levels and to ensure that the SK[K]S phases were not distorted by other teleseismic phases with similar arrival times. Band-pass filtering was applied using visually selected cutoff periods, with low cutoff periods ranging from 5–10 s and high cutoff periods ranging from 20–30 s.
We manually selected the analysis window around the theoretical SK[K]S onset, calculated using the IASP91 standard velocity model (Kennett and Engdahl, 1991). The window length was chosen to include at least one period of the clearly observable target phases. Final splitting parameters were retained in the dataset after meeting the following quality criteria: (1) a signal-to-noise ratio>2 on the radial component within the analysis window, (2) a minimum correlation coefficient>0.90 between fast and slow components, (3) elliptical particle motion before correction for anisotropy and nearly linear particle motion after, and (4) at least a 50 % reduction in transverse energy after anisotropy correction (for non-null cases). A 50 % threshold for T-component energy reduction was adopted based on the analysis of the energy reduction distribution (Fig. S1b in the Supplement). Our analysis shows that although reductions of up to 95 % are observed, most measurements cluster between 50 % and 60 % energy reduction. This pattern is expected in our case, as the observed delay times are relatively small. Furthermore, as shown in Fig. S1a, the ratio of T-component to R-component energy is already relatively low for most seismograms before correction. Therefore, considering the background noise, we do not expect a substantial energy reduction after correction for anisotropy. The distribution of the energy ratio between the corrected T-component and the R-component (orange chart in Fig. S1a) further confirms that relatively low amplitudes remain on the T-component after correction. This also indicates linear R–T particle motions following the correction.
Measurement with initial linear particle motion or splitting times<0.5 s were classified as null, indicating no detectable splitting. Uncertainties in fast axis orientation and splitting time were estimated using the contour method, based on 95 % confidence regions from the normalized correlation surface. The standard deviation of splitting parameters within this region was used as the uncertainty measure for each event.
To evaluate the robustness of our results, we reanalyzed a representative subset of events using the minimum energy method. The results (Table S1 in the Supplement) showed good agreement with those obtained from the rotation-correlation technique. Future work incorporating full-matrix comparisons of all events using multiple methods is warranted.
Figure 2 presents two examples of the splitting analysis, illustrating the energy on the original transverse (SH) component and the elliptical particle motion of the horizontal components, both indicative of shear wave splitting. Main criteria for reliable measurements include the observation of linear particle motion and significant energy reduction on the SH component following correction for anisotropy using the estimated splitting parameters. The final dataset includes 155 reliable non-null measurements and 630 null measurements, as shown in Figs. 3 and 4. The individual measurements are also provided in Table S2.
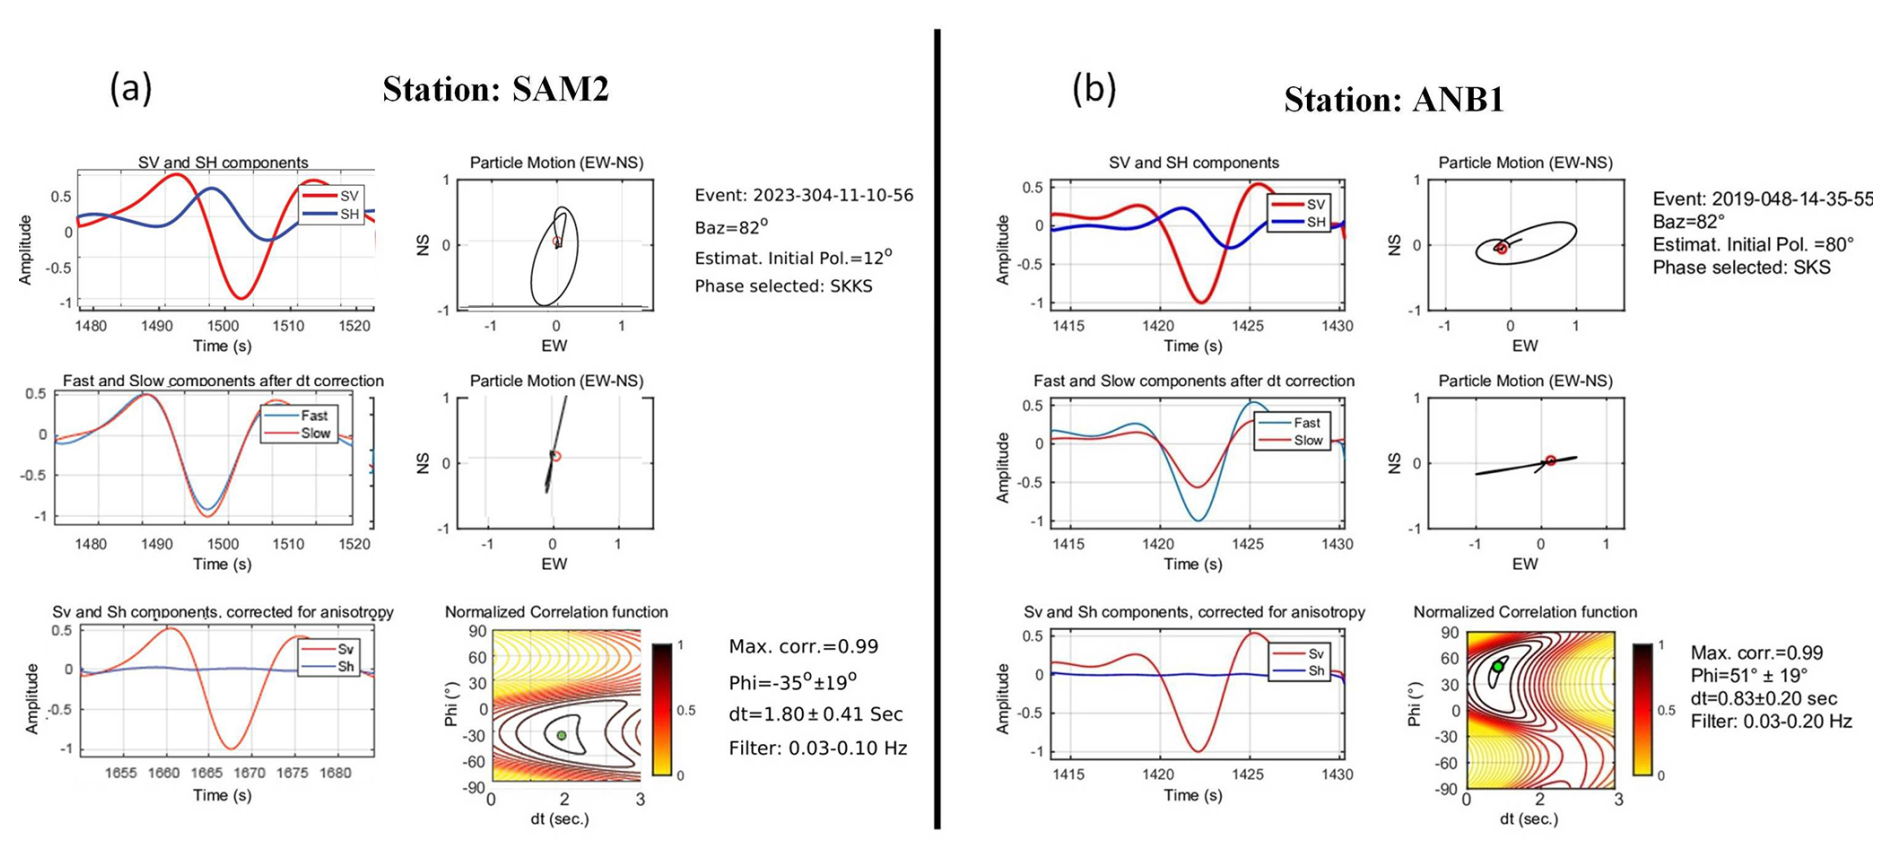
Figure 2Examples of shear-wave splitting measurements using the rotation-correlation method. The locations of the two stations can be inferred from Fig. 1b. (a) Single-event measurement at station SAM2. Data have been filtered to retain periods between 10 and 30 s. Information about the event is provided in the top right corner. The left panels, from top to bottom, display the original radial (red) and transverse (blue) seismograms, corrected fast (blue) and slow (red) components, and corrected radial (red) and transverse (blue) components, respectively. The right panels, from top to bottom, show the initial particle motion, the corrected particle motion, and the contour plot of the normalized correlation function with the optimal splitting parameter indicated by a green circle. The obtained splitting parameters are written in the bottom right corner. (b) Similar to (a) but for station ANB1.
Figure 3 shows the rose diagrams of both null and non-null measurements for 18 new stations in the Zagros foreland. At stations AMR1, AMR2, BSR2, NSR1, NSR3, NSR4, ANB1, and KIR1, the non-null measurements exhibit a consistent unimodal pattern (Fig. 3). Figure 4a presents the rose diagrams for non-null splitting measurements at station locations, and Fig. 4b shows individual measurements (represented by red bars) projected to their piercing points at a depth of 200 km, alongside measurements from previous studies (green and orange bars). Projecting the individual measurements at depth (Fig. 4b) provides a clearer view of the lateral distribution of anisotropy. The figure suggests that the varying fast axis orientations observed at some stations may indicate lateral variations in the anisotropic structure beneath the region.
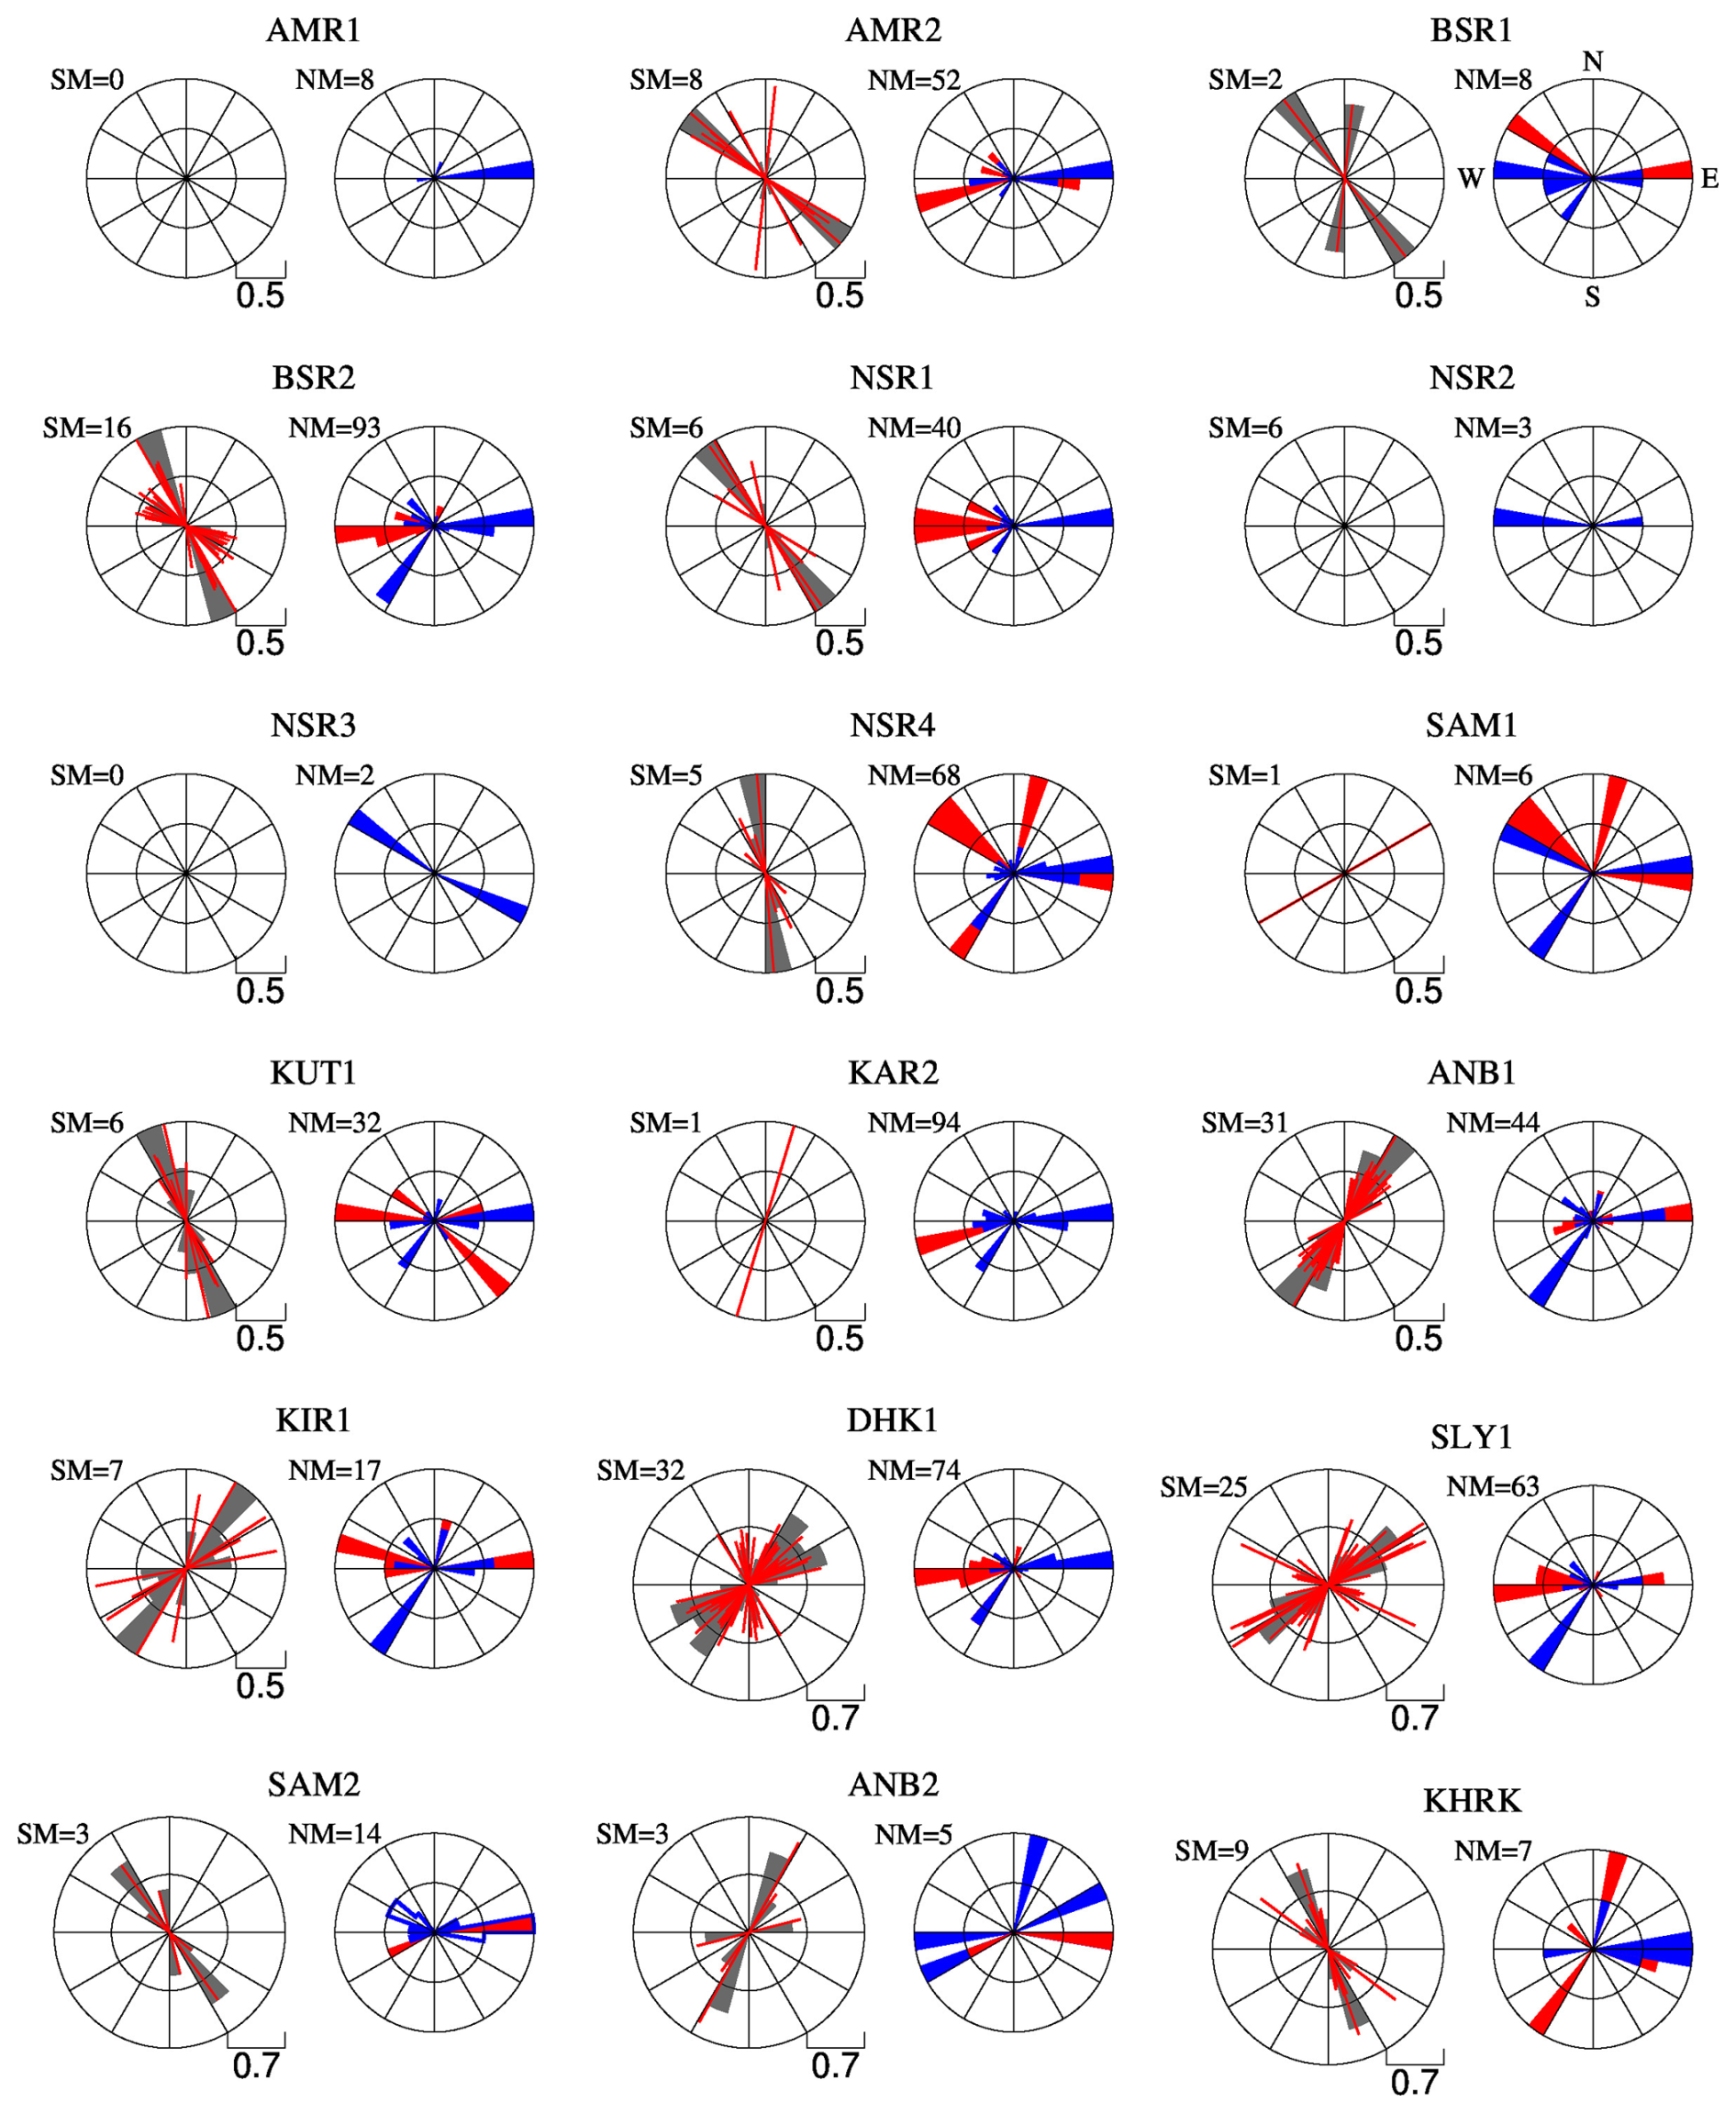
Figure 3Rose plots of splitting measurements for stations used in this study. For each station, non-null measurements are shown on the left-hand side plot as red bars oriented in the fast direction with length proportional to the lag time. Gray wedges represent histograms of individual measurements, binned in 15° sectors. Rose diagram of the initial polarization directions of null and non-null measurements are respectively shown as blue and red wedges on the right-hand side plots. Station locations are shown in Fig. 1. NM: number of null measurements; SM: number of splitting measurements.
The fast axis orientations across the study region can be categorized into two main patterns. First, in southern Iraq and the Persian Gulf (latitude<32° N), the orientations are predominantly NW–SE, sub-parallel to the Zagros orogeny and perpendicular to the APM vector within the no-net-rotation reference frame (Kreemer et al., 2014; Fig. 1). This pattern is observed at stations BSR1, BSR2, NSR1, NSR2, NSR4, AMR1, AMR2, SAM2, and KUT1 and extends into the Persian Gulf at station KHRK, marking the offshore continuation of the Zagros foreland basin. Second, in northern Iraq (latitude>33° N), the fast axis orientations are primarily NE–SW, perpendicular to the Zagros orogeny and sub-parallel to the APM vector, as observed at stations ANB1, ANB2, KIR1, SLY1, and DHK1. Station KAR2, located near the boundary between these two regions, shows almost null SK[K]S splitting, with 94 null measurements and 1 non-null measurement from a west back-azimuth (Fig. 3 and Table 1). This suggests the presence of two dominant anisotropic features with perpendicular orientations in the northern and southern sections of the study region.
An important question is why a large number of null measurements (630 out of 785) are observed. Figure 5 addresses this by showing polar histograms of back-azimuths for null and non-null measurements across the dataset. Two dominant directions are associated with nulls: east and southwest (≈210°). The southwestern azimuth coincides with the fast axis orientation in northern Iraq and the slow axis in southern Iraq, suggesting that SK[K]S phases from this direction are polarized along the symmetry axes of anisotropy, resulting in null splitting. However, the most prominent direction for nulls is from the east.
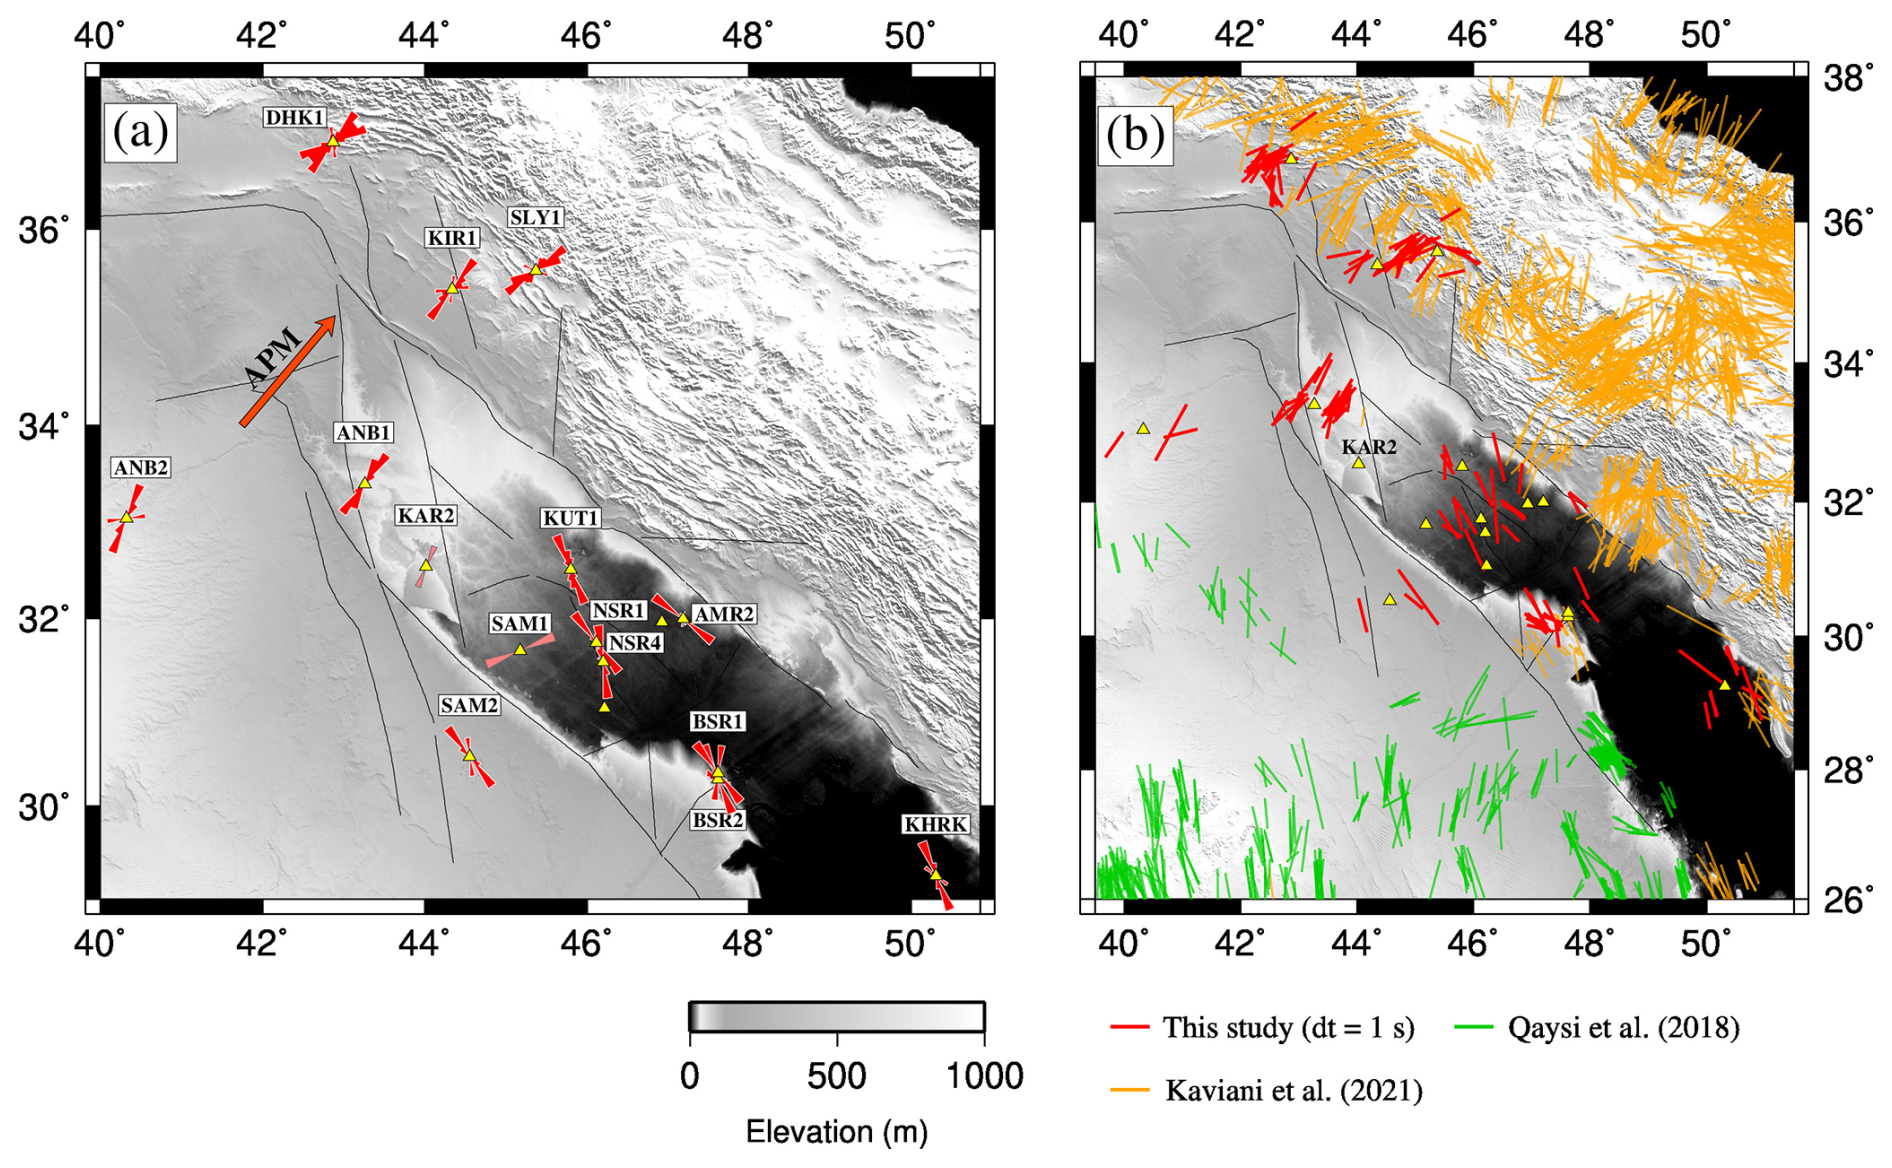
Figure 4(a) Rose plot for non-null splitting measurements at seismic station locations (triangles). Measurements for stations SAM2 and KAR2 are shown in pink, as each has only one non-null observation. Arrow represent absolute plate motion (APM) vector from Kreemer et al. (2014). (b) Individual fast-axis orientations from this study (red bars) and previous studies by Qaysi et al. (2018) and Kaviani et al. (2021), projected onto the ray-piercing points at a depth of 200 km. Topographic and bathymetric data were obtained from the ETOPO1 global relief model (NOAA NCEI, 2022).
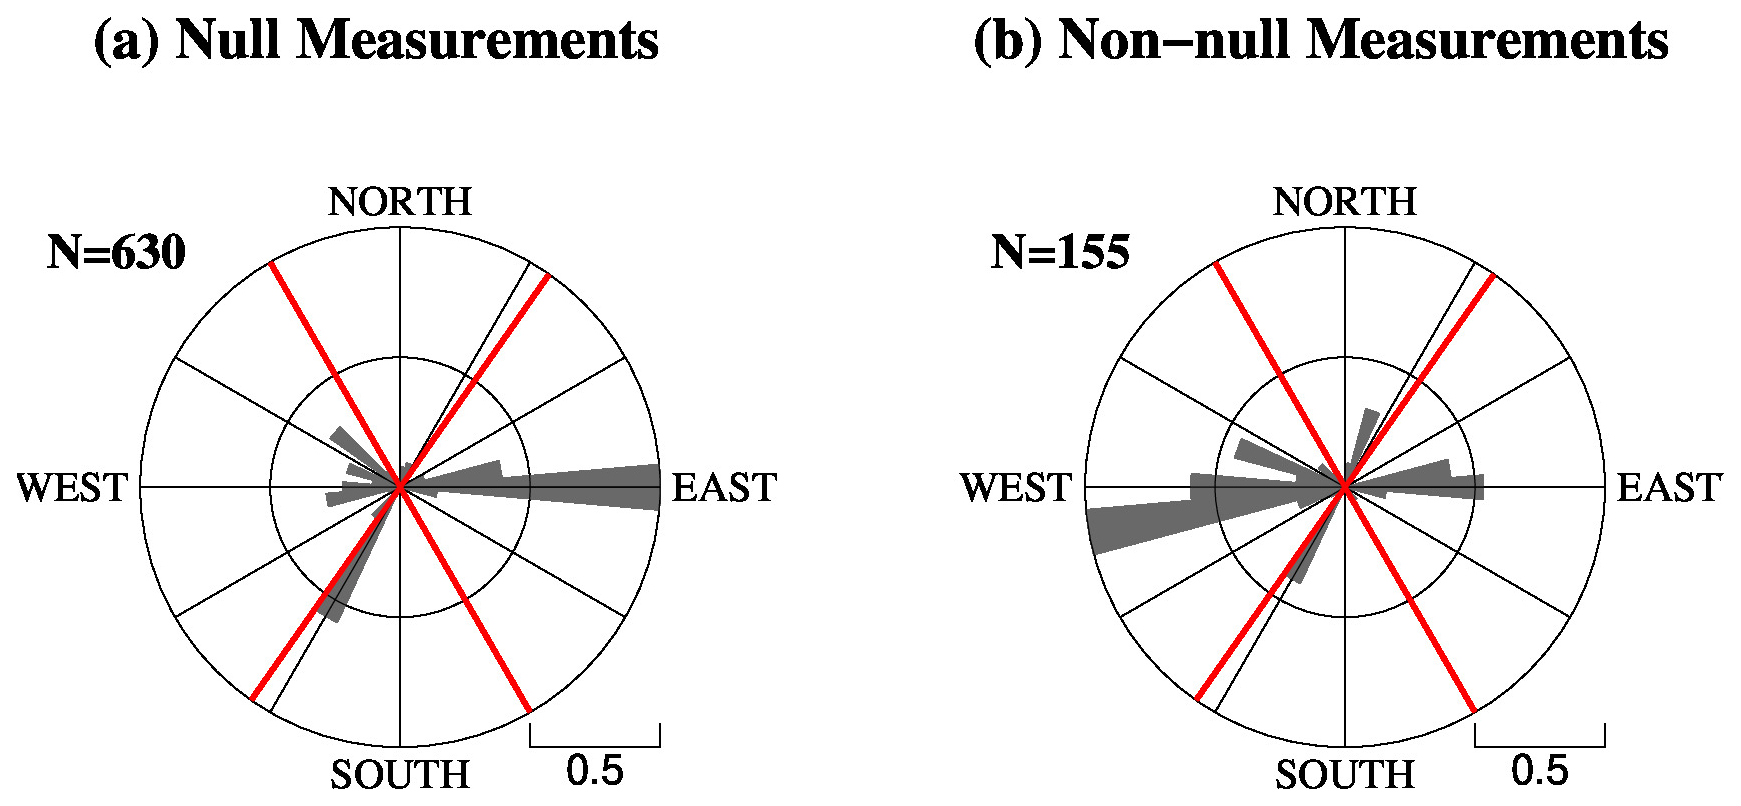
Figure 5Rose plots of back-azimuths for (a) null and (b) non-null measurements, binned in 10° sectors. Red lines indicate the fast axis orientations of anisotropy in northern and southern Iraq. N denotes the number of measurements used to plot the rose diagrams.
Station-specific back-azimuth rose diagrams (Fig. 3, right panels) show that stations AMR2, BSR2, NSR1, NSR4, KUT1, KAR2, and KHRK, all located in the Mesopotamian Plain and Persian Gulf, exhibit a high concentration of nulls from the east. In contrast, stations in northern Iraq (e.g., ANB1, ANB2, KIR1, and SLY1) do not show a similar eastern null pattern. This systematic azimuthal dependence likely results from both the complex lithospheric structure east of the Mesopotamian Plain, where it interacts with the Zagros, and the global distribution of teleseismic sources. A significant number of SK[K]S phases arrive from the east, where active subduction zones along the western Pacific margin fall within the optimal epicentral distance range for splitting analysis. Non-null measurements, by contrast, predominantly arrive from other directions, especially from the west, as seen in Fig. 3.
Figure 6 maps the lateral variation of SK[K]S splitting times across the study area and surrounding region, incorporating results from this study with those from previous studies. The map is generated by resampling the splitting times at regularly spaced 1° grid points and averaging them over the Fresnel zone around each point. The final map is then produced by linearly interpolating between the grid points. The results show that splitting times beneath the Zagros foreland are generally much smaller than those reported for the surrounding regions, including the Inner Arabian Platform, the eastern Anatolian Plate, and the Zagros collision zone (Paul et al., 2014; Qaysi et al., 2018; Kaviani et al., 2021).
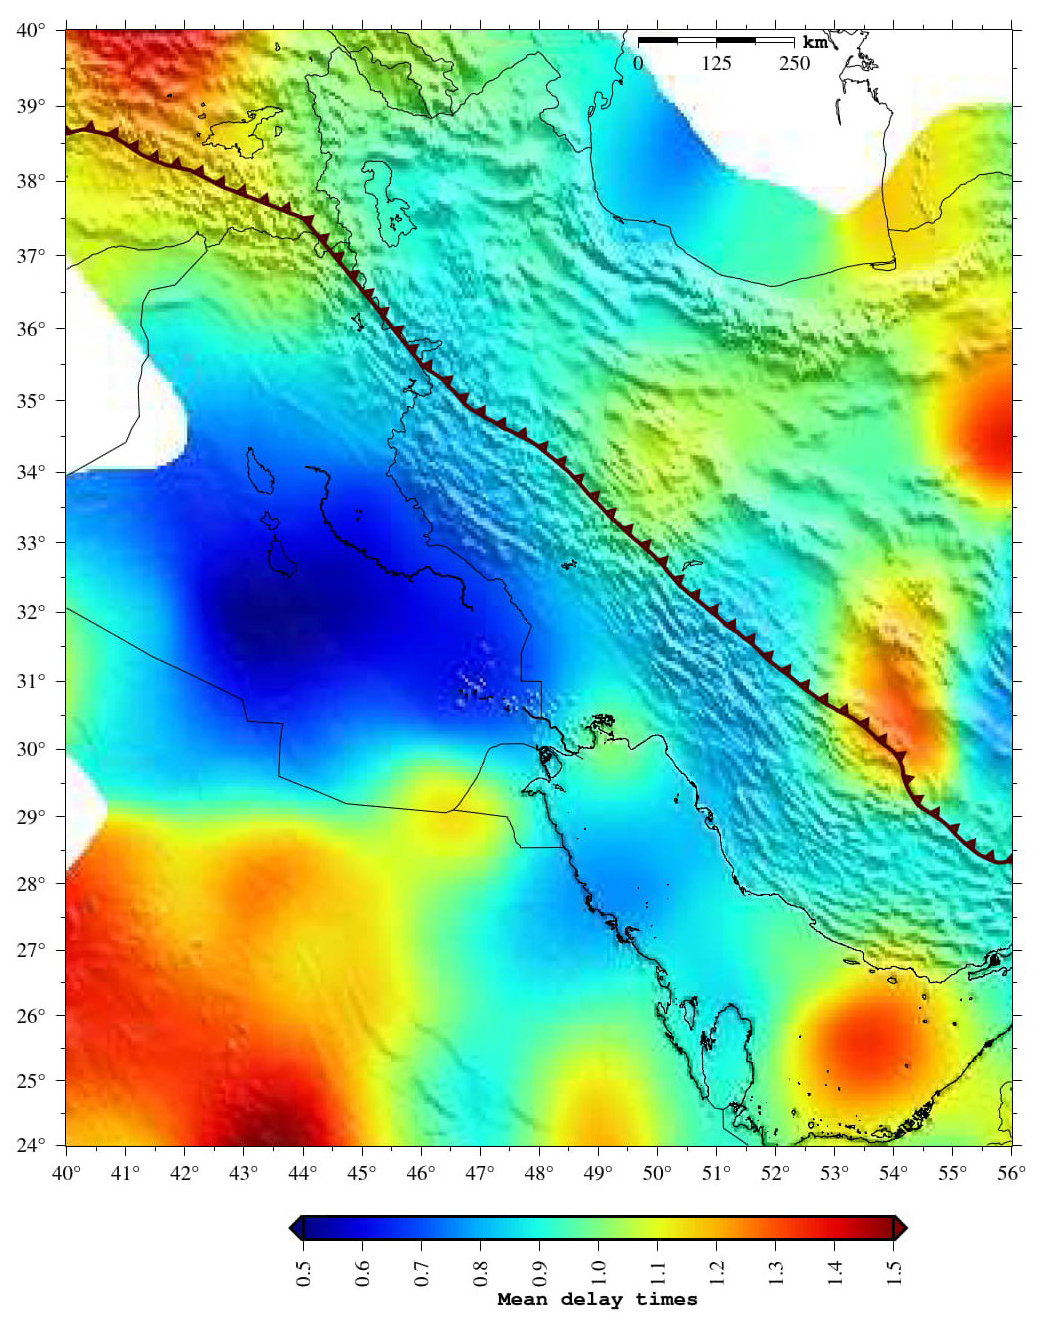
Figure 6Spatial distribution of SKS splitting times across the Zagros foredeep and surrounding regions, based on data from this study and previous works. The map is generated by resampling the splitting times at regularly spaced 1° grid points, averaging over the Fresnel zone around each point, and linearly interpolating between the grid points.
The most striking feature revealed by our SK[K]S splitting observations is the relatively abrupt change in anisotropy patterns across the Zagros foreland in the northeastern portion of the Arabian plate. Our results reveal two distinct anisotropy regimes: a uniform NE–SW fast axis orientation in the northern Iraq, aligned with the APM vector and a uniform NW–SE orientation, parallel to the Zagros orogen, across the Mesopotamian Plain and Persian Gulf. These coherent patterns are in sharp contrast to the complex and spatially variable anisotropy within the Zagros orogen. In the following, we integrate our results with those from surrounding regions to resolve anisotropic patterns on a broader scale and interpret them in terms of lithosphere–asthenosphere interaction and tectonic inheritance.
4.1 Comparison with previous studies
To investigate patterns of upper mantle seismic anisotropy, we combined our dataset with all available SK[K]S measurements from the Middle East. This merging allows us to assess how the results of this study align with or diverge from previous observations. Figure 7 presents maps comparing our measurements with those from earlier studies in neighboring regions, including the Iranian Plateau and eastern Anatolian Plateau (Kaviani et al., 2021), northwestern Iran (Arvin et al., 2021), the northern Zagros (Sadeghi-Bagherabadi et al., 2018a, b), and the Inner Arabian Platform (Qaysi et al., 2018). In the left panels of Fig. 7, individual SK[K]S measurements are displayed, with red bars representing the new measurements and blue bars indicating those from previous studies. Each measurement is projected onto its ray-piercing point at depths of 100, 200 and 300 km, shown in panels a, c, and e, respectively, to account for uncertainty in the depth of anisotropy.
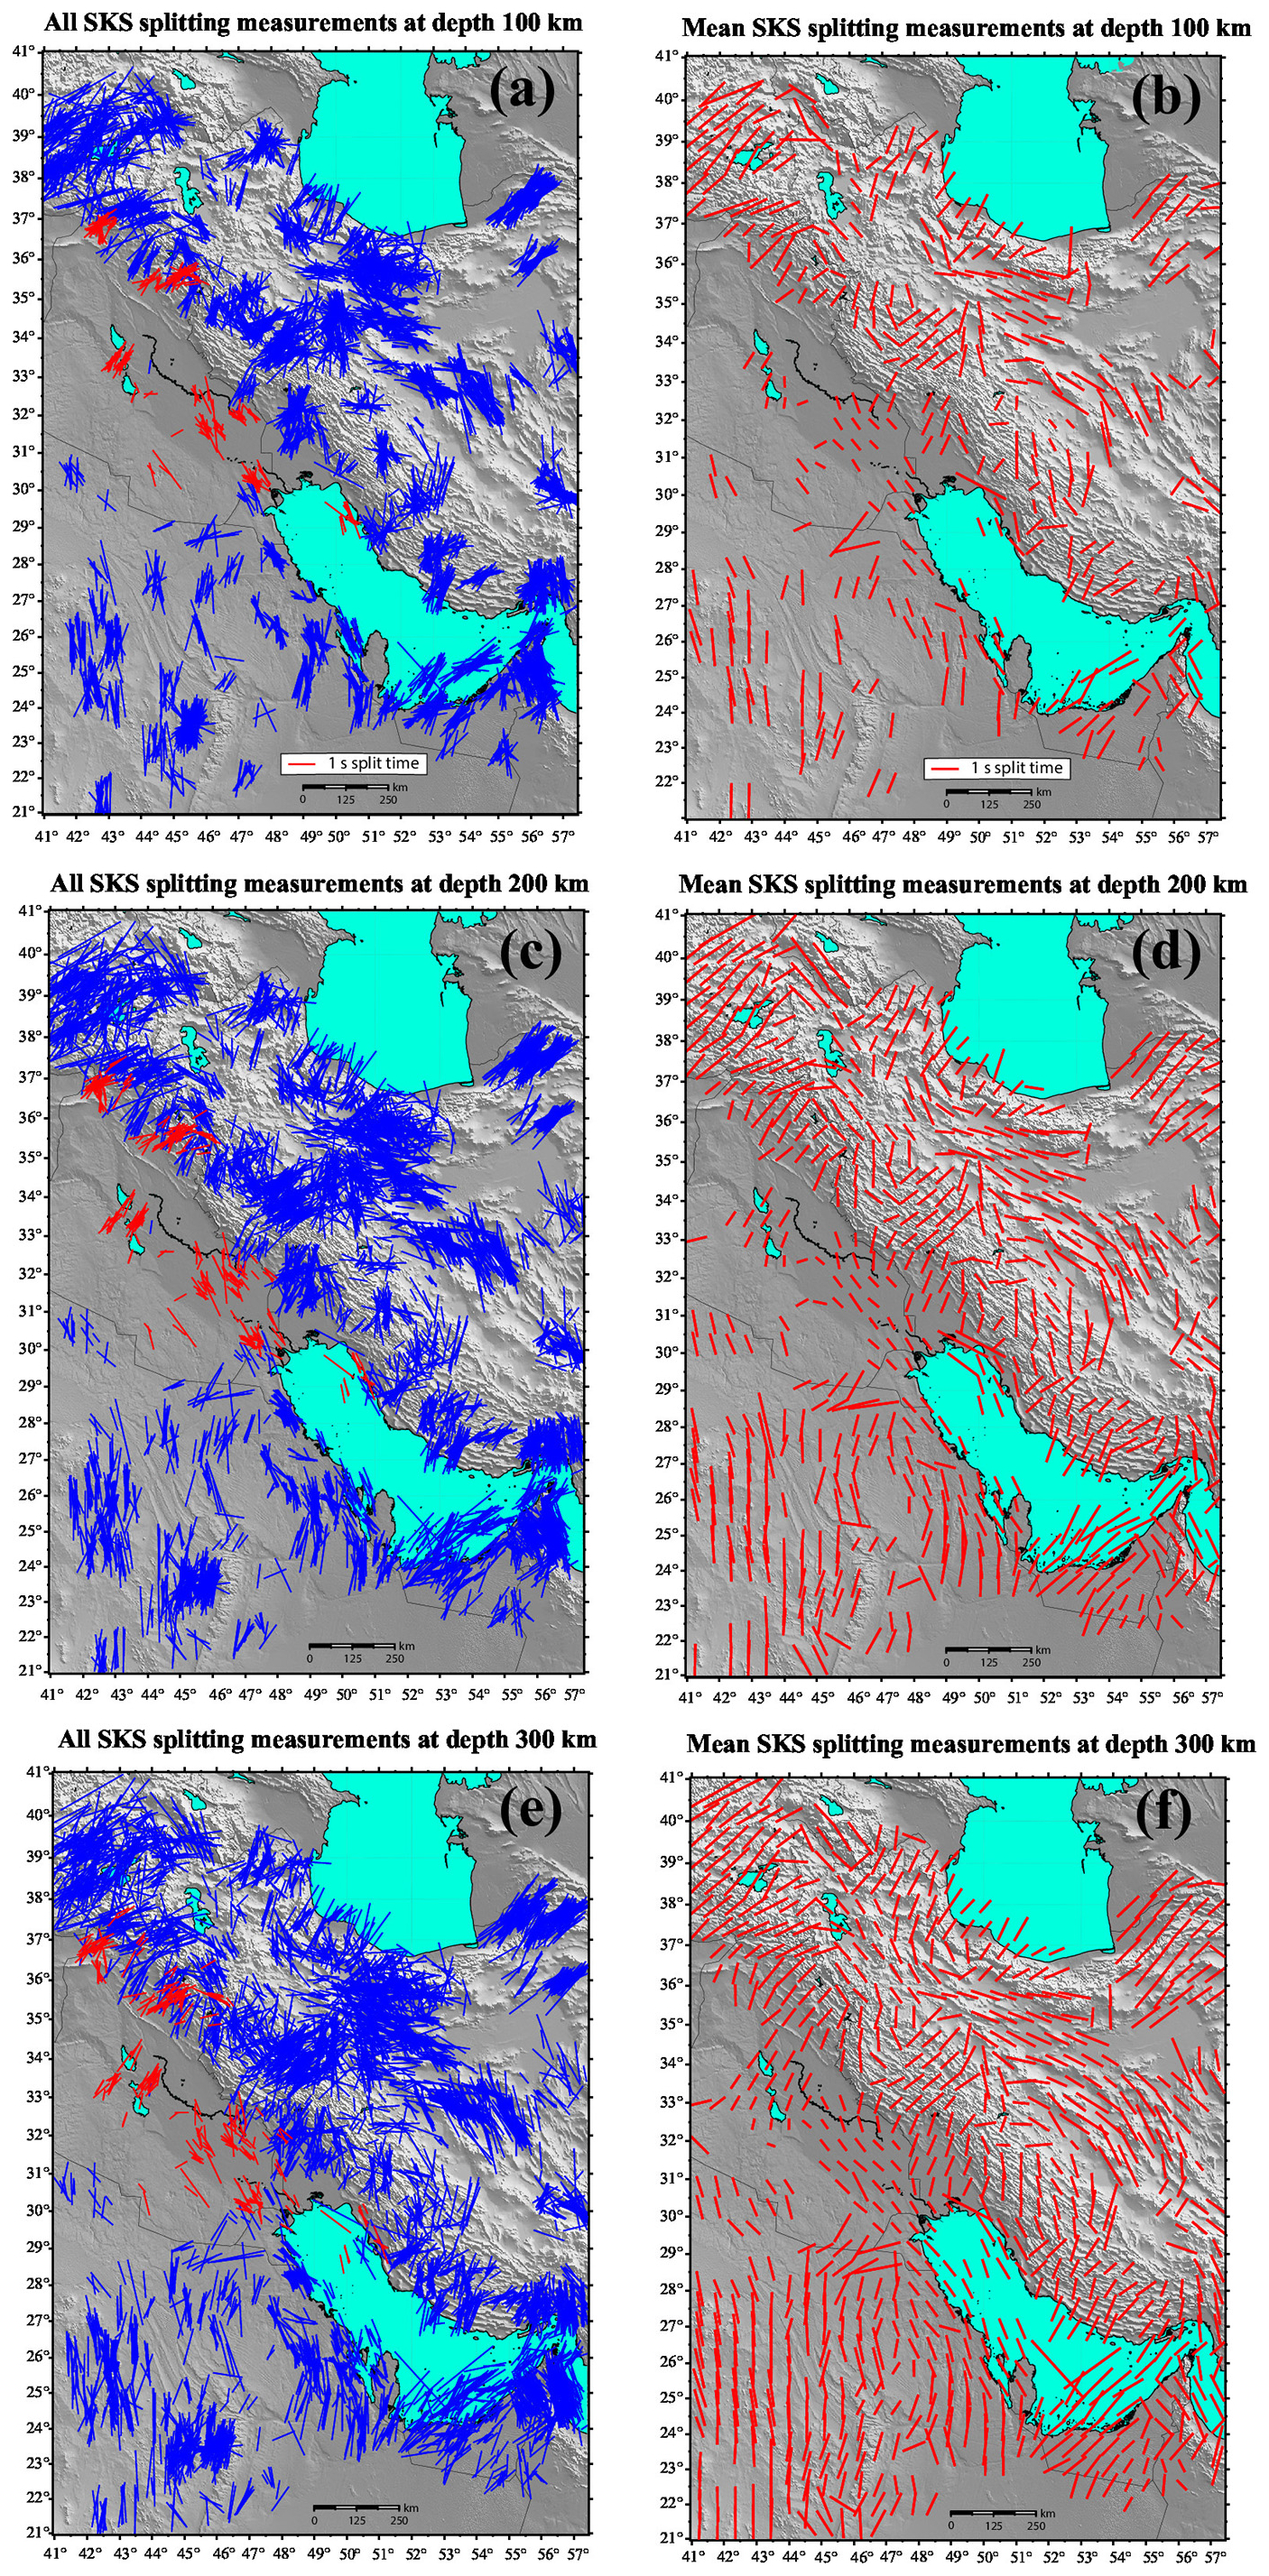
Figure 7Anisotropic fast axis orientations from the current study (depicted by red bars in the left panels) combined with prior measurements (represented by blue bars) from Kaviani et al. (2021), Arvin et al. (2021), Sadeghi-Bagherabadi et al. (2018a, b), and Qaysi et al. (2018). The left panels illustrate the fast axis orientations projected onto the ray-piercing point at depths of (a) 100 km, (c) 200 km, and (e) 300 km. The right panels display interpolated anisotropy fields at depths of (b) 100 km, (d) 200 km, and (f) 300 km. Elevation data were derived from ETOPO1 (NOAA NCEI, 2022).
Our results show a high degree of consistency with previous measurements, particularly in southern Iraq and the Persian Gulf, where NW–SE-oriented fast axes are observed. Similarly, in northern Iraq, the NE–SW-oriented fast axes align well with prior measurements in northern Iraq and eastern Turkey (Kaviani et al., 2021). This agreement affirms that our findings extend the observation of upper mantle anisotropy across the Zagros collision zone and enhance understanding of mantle flow and deformation beneath this tectonically active region.
To further visualize the azimuthal anisotropy patterns, we calculated vector averages of the individual splitting parameters projected at respective depths and within the Fresnel zone of SK[K]S waves, utilizing sensitivity kernels as calculated by Monteiller and Chevrot (2011). The interpolated anisotropy fields, shown in the right panels of Fig. 7, demonstrate that the anisotropic patterns remain largely consistent across different depth levels. The observed consistency in fast-axis orientations across depth projections suggests a dominantly single-layer anisotropic structure.
4.2 Uniform asthenospheric flow around the Arabian–Eurasian collision zone
In the northern Arabian Plate and much of the Eurasian Plate, the fast axes of SK[K]S splitting are consistently aligned with the APM direction of the Arabian Plate (Figs. 4 and 7). These regions also exhibit relatively large splitting delay times (Fig. 6), suggesting a strong and coherent anisotropic signal. The uniform pattern of fast axes over such a broad region suggests a large-scale, viscous asthenosphere flow as the dominant mechanism beneath the northern Middle East (Sandvol et al., 2003; Paul et al., 2014). This flow is aligned with the APM direction and appears to be only weakly influenced by lithospheric heterogeneities.
This interpretation is supported by previous studies, which report similar trends in anisotropy fast axis orientation and large splitting delay times across central Anatolia, eastern Turkey, and beneath northwestern and northeastern Iran (Sandvol et al., 2003; Paul et al., 2014; Kaviani et al., 2021; Arvin et al., 2021). In some locations, splitting observations vary with back-azimuth, indicating contributions from multiple layers of anisotropy at different depths. This vertical complexity suggests that distinct layers within the lithosphere–asthenosphere system contribute different anisotropic signatures.
The asthenospheric origin of the observed SK[K]S anisotropy is further supported by lithospheric thickness estimates from surface wave tomography (Priestley et al., 2012) and S receiver function studies (Gök et al., 2007; Taghizadeh-Farahmand et al., 2010, 2013; Kind et al., 2015). These studies reveal a thin lithosphere beneath regions where the fast axis orientations are coherently aligned with the APM. The lithospheric thickness ranges from ∼80–100 km beneath eastern Anatolia and the Bitlis suture zone (e.g., Kind et al., 2015), northwestern Iran (e.g., Taghizadeh-Farahmand et al., 2010), and northeastern Iran (e.g., Taghizadeh-Farahmand et al., 2013). In some parts of the Anatolian Plate, the lithospheric mantle is reportedly entirely absent (e.g., Gök et al., 2007).
It is noteworthy that the tectonics of northern Iraq and eastern Turkey are dominated by the active convergence between the Arabian and Eurasian plates, accommodated by the westward escape of Anatolia (Dewey et al., 1986; McClusky et al., 2000). Despite the complex and ongoing deformation at this junction, the anisotropy patterns remain remarkably consistent and unperturbed. This may confirm that the overlying lithosphere is not sufficiently thick to significantly influence the underlying mantle flow. Alternatively, any lithospheric fabrics that may be present could be aligned with the underlying mantle flow, resulting in a vertically coherent anisotropic signal that is indistinguishable from asthenospheric anisotropy in SK[K]S splitting data. The alignment between surface tectonic motions and the orientation of asthenospheric flow further supports a strong coupling between the thin lithosphere and underlying mantle, reinforcing the interpretation that asthenospheric flow is the dominant driver of plate tectonics in this region.
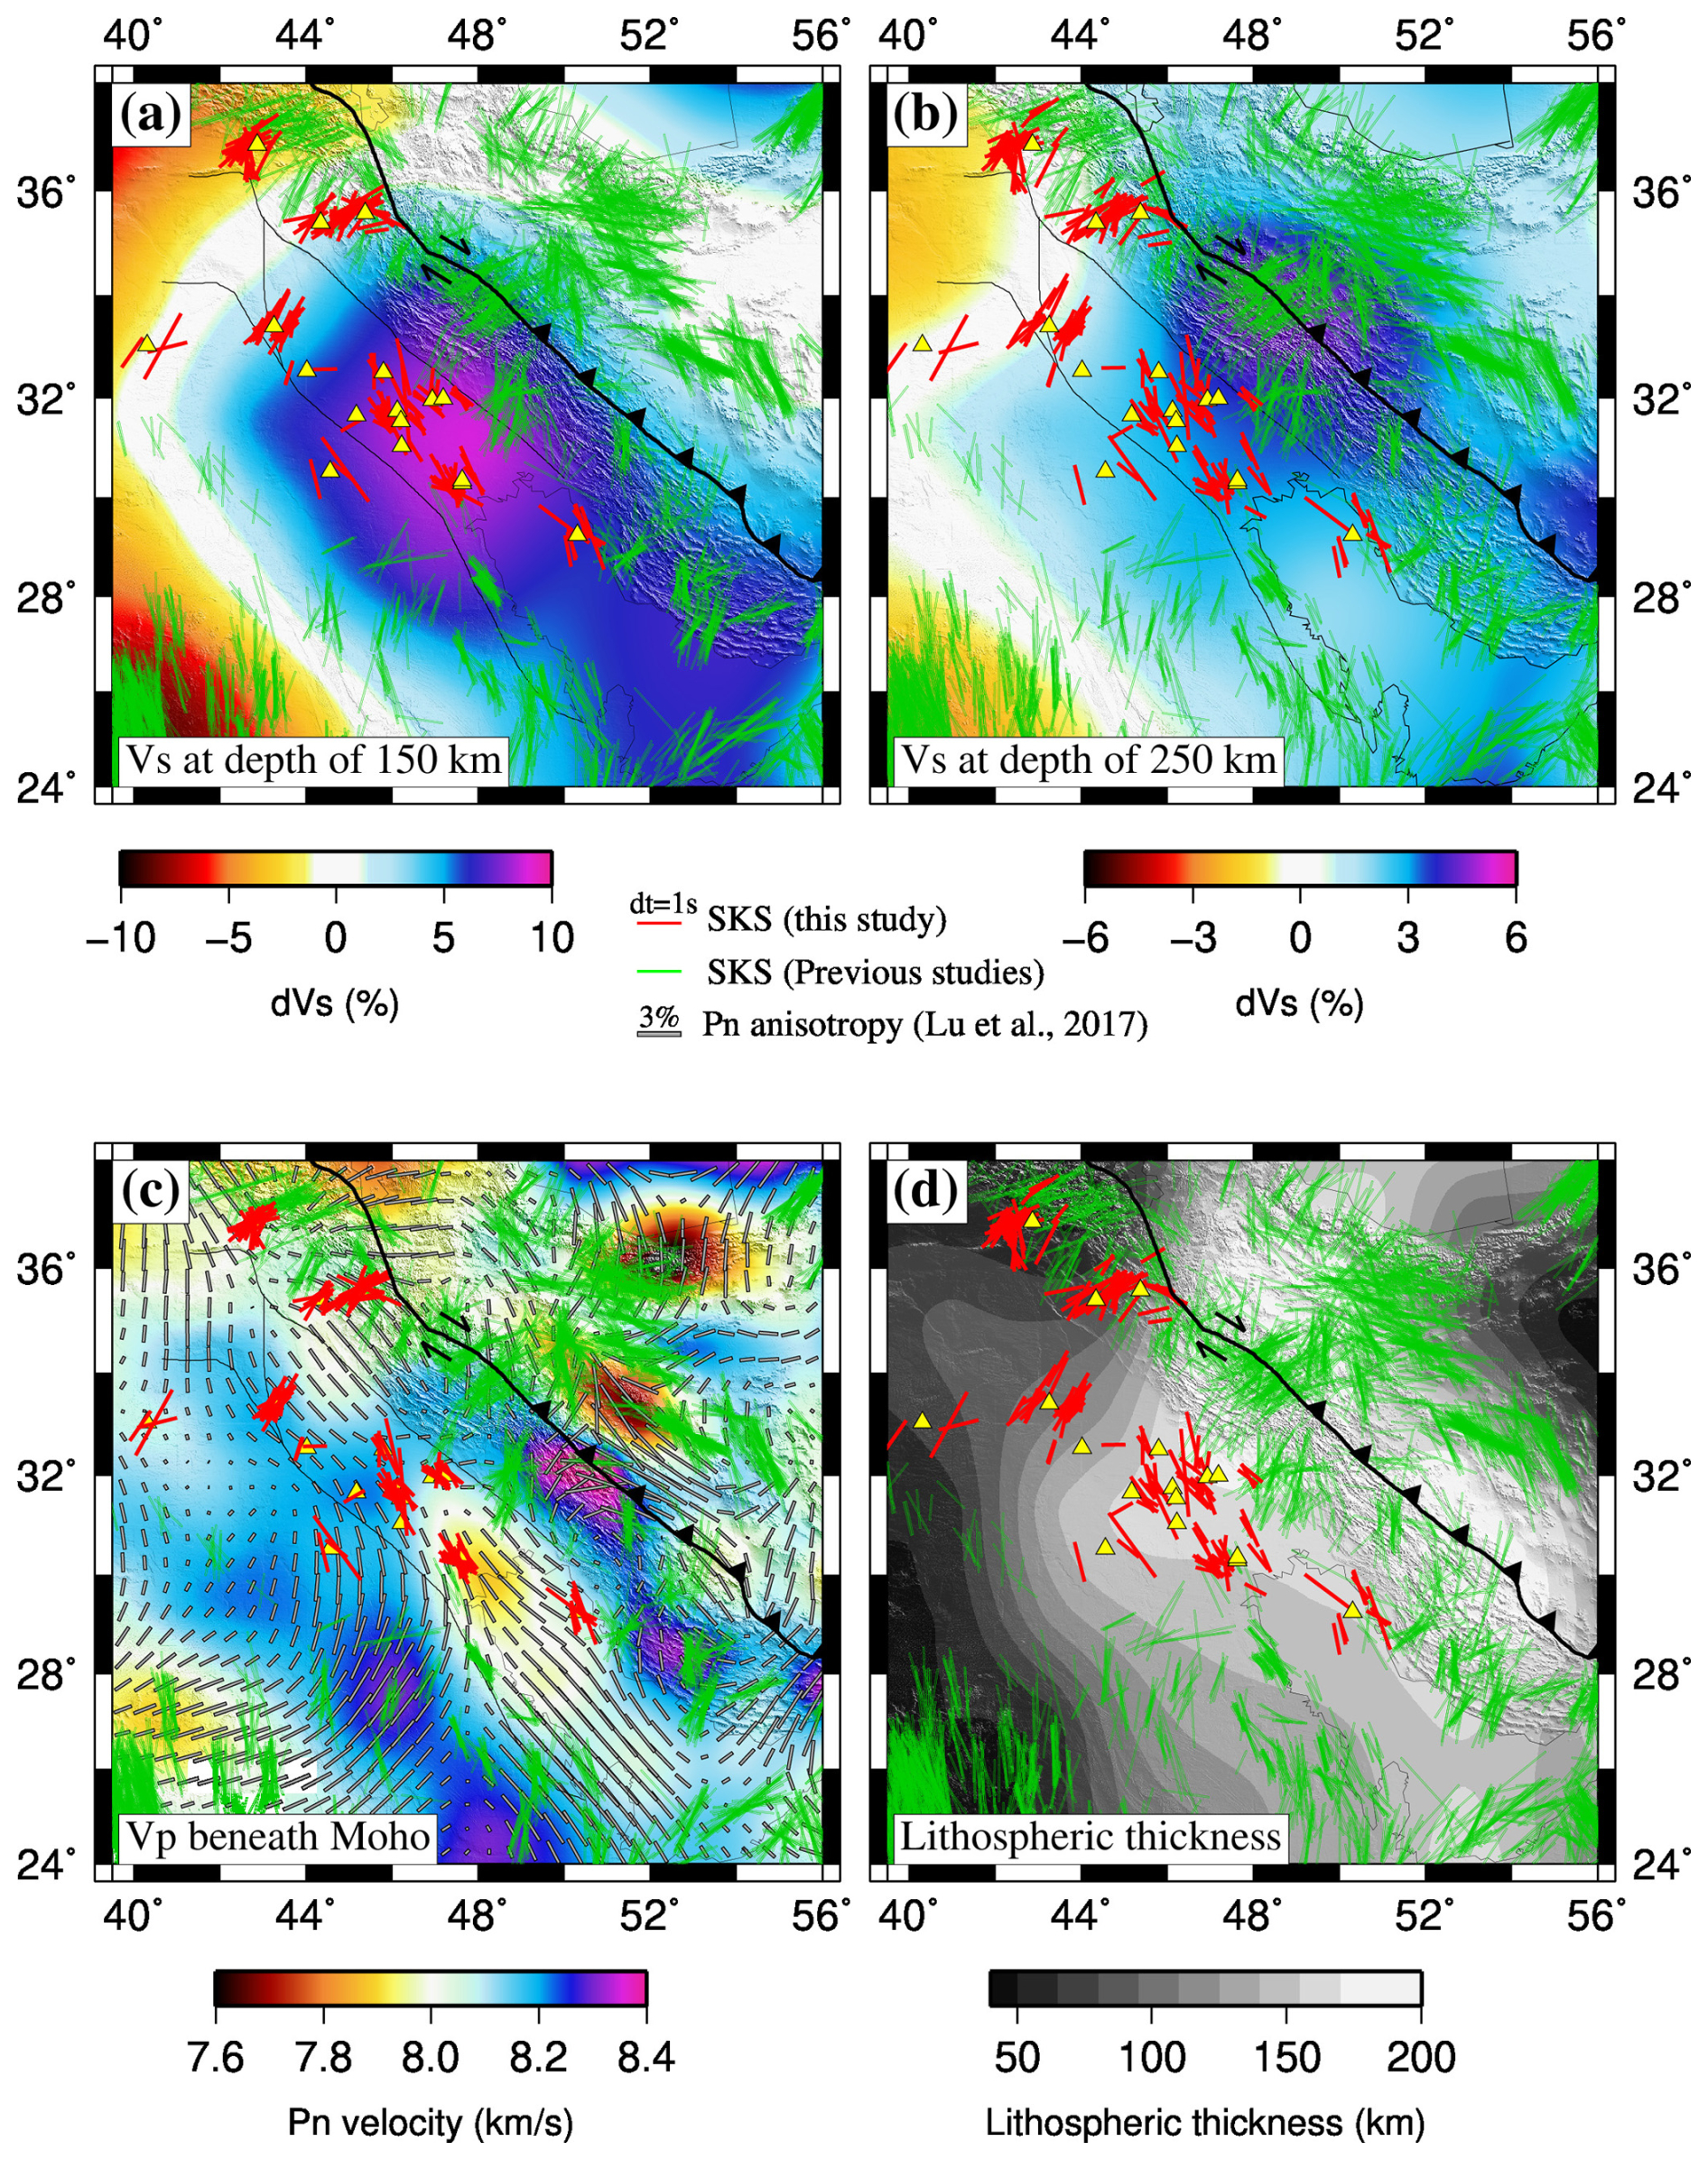
Figure 8(a) Shear-wave velocity (Vs) map at a depth of 150 km from regional full-waveform tomography by Celli et al. (2020). Colored bars represent individual fast-axis orientations from this study and previous studies, projected onto ray-piercing points at a depth of 150 km. Thin black lines mark the borders of Mesopotamian Foredeep and Al-Jazira (Sissakian et al., 2017). (b) Same as (a), but at a depth of 250 km. (c) Pn velocity map with fast-axis anisotropy orientations (gray bars) from Lü et al. (2017), overlaid with individual fast-axis orientation measurements projected to a depth of 75 km. (d) Lithospheric thickness map from Priestley and McKenzie (2013), with colored bars representing the individual fast-axis orientations projected onto ray-piercing points at a depth of 250 km. Elevation data were derived from ETOPO1 (NOAA NCEI, 2022).
4.3 Lithospheric control and fossil anisotropy in the Zagros foreland
In contrast to the uniform patterns observed farther north, the SKS splitting beneath the Zagros collision zone and the Mesopotamian foreland displays a more complex and spatially variable character. The fast axis orientations in this region are deflected around the Zagros lithospheric keel and the Mesopotamian foreland, while the splitting delay times are smaller than those in the surrounding areas. These patterns have been interpreted as resulting from mantle flow deflection around the thick Zagros lithospheric root (e.g., Kaviani et al., 2021).
We interpret these patterns in the context of lithosphere-asthenosphere interaction and propose that the cold, thick Arabian lithosphere beneath the Zagros foreland and Zagros orogeny both disrupts mantle flow and inhibits the development of coherent anisotropic fabrics within itself and in the underlying asthenosphere. This interpretation is supported by the correlation between anisotropy orientations and lithospheric thickness contours (Fig. 8d), and by thermal models indicating sub-Moho temperatures below 900 °C (Priestley et al., 2012), which limit olivine mobility and the formation of vertically coherent lattice-preferred orientation in the lithosphere due to pure-shear deformation during the collision (Nicolas and Christensen, 1987).
The relatively small splitting times beneath the Mesopotamian Plain support the idea that anisotropy in this region is either weak or confined to a shallow layer. We suggest that the source of anisotropy resides in the upper lithospheric mantle and reflects a fossil fabric as a remnant of early Mesozoic rifting that affected the northeastern Arabian platform. This interpretation is supported by two main lines of evidence: (1) A strong correlation between the SK[K]S fast axis orientation and the Pn fast axis anisotropy orientation (Fig. 8c), which represent subcrustal anisotropy, suggesting a shallow origin; (2) Small-scale lateral variations in anisotropy directions beneath the Mesopotamian Plain, in contrast to the more uniform patterns beneath the Inner Arabian platform and eastern Anatolia (see interpolated anisotropy fields in Fig. 7).
Our findings suggest that the NW–SE fast-axis anisotropy within the lithosphere of the Mesopotamian Plain likely originates from successive Mesozoic rifting events affecting the northeastern Arabian platform. Evidence for diffuse rifting in the region comes from previous geological and seismological studies (Mohammed, 2006; Numan, 1997, 2000; Jassim and Göff, 2006; Abdulnaby et al., 2020). P receiver function analysis (Abdulnaby et al., 2020) revealed a crustal root beneath the southeastern Mesopotamian Plain comparable in thickness to that of the Zagros collision zone. Abdulnaby et al. (2020) attributed the mismatch between large crustal thickness and low topography to successive rifting events, which promoted vertical loading from up to 14 km of sediment accumulation in fault-bounded depocenters. The Abu Jir-Euphrates fault, clearly imaged as a basement step in seismic lines (Mohammed, 2006), defines the southwest margin of the rift system (e.g., Fadhel and Al-Rahim, 2019). Inherited from Triassic passive-margin extension, this fault system was reactivated during Middle–Late Jurassic rifting, forming graben–horst structures (Numan, 1997, 2000). Continuous subsidence since the Late Jurassic enabled the deposition of thick sedimentary sequences within the Mesopotamian Plain (Jassim and Göff, 2006).
The lithosphere beneath the Mesopotamian Plain appears to have remained largely intact despite the subsequent continental collision and deformation associated with the advancing Zagros deformation front. The southwestward migration of the Zagros deformation front (ZFF) overprinted the eastern boundary of the Mesopotamian graben through thrust faulting and folding, producing opposing dips in the sedimentary cover. Abdulnaby et al. (2016) and Darweesh et al. (2017) proposed a southwestward dip of approximately 60° for the eastern margin of the basin beneath the ZFF. Collectively, these findings support the interpretation that the Mesopotamian Plain has been largely unaffected by deformation associated with the Zagros orogeny. As a result, older tectonic processes, most notably Mesozoic rifting, are the most plausible source of the preserved lithospheric mantle anisotropy.
While this interpretation is supported by multiple lines of evidence, forward modeling of shear-wave propagation through synthetic anisotropic structures will be critical to constrain the symmetry and depth extent of the anisotropy in the Mesopotamian lithosphere. The high occurrence of null measurements from the east may indicate a complex interaction between the lithosphere and asthenosphere at the boundary between Mesopotamia and the Zagros. A plausible explanation for these nulls is a two-layer anisotropic structure with orthogonal fast orientations, where the opposing effects of each layer interfere destructively. Such a configuration could result in the observed nulls for eastward-arriving waves across the Mesopotamian plain.
This study provides new SK[K]S splitting measurements from 18 seismic stations in the foreland of the Zagros collision zone, helping to fill a major gap in anisotropy coverage across the Middle East. The dataset reveals two distinct anisotropy domains: a NE–SW fast-axis orientation in northern Iraq, and a NW–SE orientation beneath the Mesopotamian Plain and Persian Gulf. The NE–SW orientation aligns with the direction of absolute plate motion, suggesting that large-scale asthenospheric flow, coupled with the overlying lithosphere, governs anisotropy in northern Iraq and the broader northern Middle East. In contrast, the NW–SE fast axis orientations and smaller splitting times beneath the Mesopotamian Plain and Persian Gulf indicate a shallow lithospheric source, likely reflecting a fossil fabric from Mesozoic rifting. The cold, thick Arabian lithosphere beneath the Zagros foreland further disrupts mantle flow and suppresses the formation of coherent anisotropic fabrics, both within itself and in the underlying asthenosphere. These findings highlight the joint control of lithospheric structure and mantle dynamics on seismic anisotropy in a continental collision zone. They emphasize the importance of inherited lithospheric fabrics, thermal structure, and lithosphere–asthenosphere coupling in shaping observed anisotropic patterns.
Continuous data from 17 Iraqi stations used in this study are available through the Incorporated Research Institutions for Seismology (IRIS). Tables of individual shear-wave splitting measurements are available online at Motaghi (2025) (https://doi.org/10.17632/t7zgvdfwpm.1).
The supplement related to this article is available online at https://doi.org/10.5194/se-17-1-2026-supplement.
KM analyzed the data, prepared figures, interpreted the results, and wrote the initial draft of the manuscript. AK developed the code, supervised the data analysis, prepared figures, and revised the manuscript. WA conducted the field survey, collected raw data, provided the data, and revised the manuscript. HM secured funding for data collection in Iraq and revised the manuscript. HA-S secured funding for data collection in Iraq and revised the manuscript.
The contact author has declared that none of the authors has any competing interests.
Publisher's note: Copernicus Publications remains neutral with regard to jurisdictional claims made in the text, published maps, institutional affiliations, or any other geographical representation in this paper. The authors bear the ultimate responsibility for providing appropriate place names. Views expressed in the text are those of the authors and do not necessarily reflect the views of the publisher.
We warmly appreciate Dr. Charlotte Krawczyk (Editor) and two anonymous reviewers for their helpful and constructive comments and suggestions. We are grateful to the Lawrence Livermore National Laboratory (LLNL) for supporting the installation of broadband seismic stations in Iraq. We also like to thank the University of Arkansas, Little Rock, for partially supporting this research.
This paper was edited by Charlotte Krawczyk and reviewed by two anonymous referees.
Abdulnaby, W., Al-Mohmed, R., and Mahdi, M.: Seismicity and recent stress regime of Diyala City, Iraq–Iran border, Modeling Earth Systems and Environment, 2, 1–8, https://doi.org/10.1007/s40808-016-0201-z, 2016.
Abdulnaby, W., Motaghi, K., Shabanian, E., Mahdi, H., Al-Shukri, H., and Gök, R.: Crustal structure of the Mesopotamian Plain, east of Iraq, Tectonics, 39, e2020TC006225, https://doi.org/10.1029/2020TC006225, 2020.
Arvin, S., Sobouti, F., Priestley, K., Ghods, A., Motaghi, K., Tilmann, F., and Eken, T.: Seismic anisotropy and mantle deformation in NW Iran inferred from splitting measurements of SK(K)S and direct S phases, Geophys. J. Int., 226, 1417–1431, https://doi.org/10.1093/gji/ggab181, 2021.
Bowman, J. R. and Ando, M.: Shear-wave splitting in the upper-mantle wedge above the Tonga subduction zone, Geophys. J. Int., 88, 25–41, https://doi.org/10.1111/j.1365-246X.1987.tb01367.x, 1987.
Celli, N. L., Lebedev, S., Schaeffer, A. J., and Gaina, C.: African cratonic lithosphere carved by mantle plumes, Nature Communications, 11, 92, https://doi.org/10.1038/s41467-019-13871-2, 2020.
Darweesh, H. A., Obed, A. Z. M., and Albadran, B. N.: Structural study of basins configuration in Mesopotamian area, International Journal of Engineering and Applied Sciences, 4, 54–58, 2017.
Dewey, J. F., Hempton, M. R., Kidd, W. S. F., Saroglu, F. A. M. C., and Şengör, A. M. C.: Shortening of continental lithosphere: the neotectonics of Eastern Anatolia – a young collision zone, Geological Society, London, Special Publications, 19, 1–36, https://doi.org/10.1144/GSL.SP.1986.019.01.01, 1986.
Fadhel, M. S. and Al-Rahim, A. M.: A new tectono sedimentary framework of the Jurassic succession in the Merjan oil field, Central Iraq, Journal of Petroleum Exploration and Production Technology, 9, 2591–2603, https://doi.org/10.1007/s13202-019-00750-1, 2019.
Fouad, S. F.: Tectonic evolution of the Mesopotamia Foredeep in Iraq, Iraqi Bulletin of Geology and Mining, 6, 41–53, 2010.
Gök, R., Pasyanos, M. E., and Zor, E.: Lithospheric structure of the continent-continent collision zone: eastern Turkey, Geophys. J. Int., 169, 1079–1088, https://doi.org/10.1111/j.1365-246X.2006.03288.x, 2007.
Jassim, S. Z. and Göff, J. C.: Geology of Iraq. Dolin, Prague and Moravian Museum, Brno, Czech Republic, p. 341, ISBN 80-7028-287-8, 2006.
Kaviani, A., Mahmoodabadi, M., Rümpker, G., Pilia, S., Tatar, M., Nilfouroushan, F., Yamini-Fard, F., Moradi, A., and Ali, M. Y.: Mantle-flow diversion beneath the Iranian plateau induced by Zagros' lithospheric keel, Scientific Reports, 11, 2848, https://doi.org/10.1038/s41598-021-81541-9, 2021.
Kennett, B. L. N. and Engdahl, E. R.: Traveltimes for global earthquake location and phase identification, Geophys. J. Int., 105, 429–465, https://doi.org/10.1111/j.1365-246X.1991.tb06724.x, 1991.
Kind, R., Eken, T., Tilmann, F., Sodoudi, F., Taymaz, T., Bulut, F., Yuan, X., Can, B., and Schneider, F.: Thickness of the lithosphere beneath Turkey and surroundings from S-receiver functions, Solid Earth, 6, 971–984, https://doi.org/10.5194/se-6-971-2015, 2015.
Kreemer, C., Blewitt, G., and Klein, E. C.: A geodetic plate motion and Global Strain Rate Model, Geochem. Geophys. Geosyst., 15, 3849–3889, https://doi.org/10.1002/2014GC005407, 2014.
Long, M. D. and Becker, T. W.: Mantle dynamics and seismic anisotropy, Earth Planet. Sc. Lett., 297, 341–354, https://doi.org/10.1016/j.epsl.2010.06.036, 2010.
Lü, Y., Ni, S., Chen, L., and Chen, Q. F.: Pn tomography with Moho depth correction from eastern Europe to western China, J. Geophys. Res.: Solid Earth, 122, 1284–1301, https://doi.org/10.1002/2016JB013052, 2017.
McClusky, S., Balassanian, S., Barka, A., Demir, C., Ergintav, S., Georgiev, I., Gurkan, O., Hamburger, M., Hurst, K., Kahle, H., Kastens, K., Kekelidze, G., King, R., Kotzev, V., Lenk, O., Mahmoud, S., Mishin, A., Nadariya, M., Ouzounis, A., Paradissis, D., Peter, Y., Prilepin, M., Reilinger, R., Sanli, I., Seeger, H., Tealeb, A., Toksoz, M. N., and Veis, G.: Global Positioning System constraints on plate kinematics and dynamics in the eastern Mediterranean and Caucasus, J. Geophys. Res.: Solid Earth, 105, 5695–5719, https://doi.org/10.1029/1999JB900351, 2000.
Mohammed, S. A.: Megaseismic section across the northeastern slope of the Arabian Plate, Iraq, GeoArabia, 11, 77–90, https://doi.org/10.2113/geoarabia110477, 2006.
Monteiller, V. and Chevrot, S.: High-resolution imaging of the deep anisotropic structure of the San Andreas Fault system beneath southern California, Geophys. J. Int., 186, 418–446, https://doi.org/10.1111/j.1365-246X.2011.05082.x, 2011.
Motaghi, K.: Individual SKS splitting measurements for Zagros foreland, V1, Mendeley Data [data set], https://doi.org/10.17632/t7zgvdfwpm.1, 2025.
Nicolas, A. and Christensen, N. I.: Formation of anisotropy in upper mantle peridotites – A review, Composition, Structure and Dynamics of the Lithosphere-Asthenosphere System, 16, 111–123, https://doi.org/10.1029/GD016p0111, 1987.
NOAA National Centers for Environmental Information: ETOPO 2022 15 Arc-Second Global Relief Model, NOAA National Centers for Environmental Information, https://doi.org/10.25921/fd45-gt74, 2022.
Numan, N. M. S.: A plate tectonic scenario for the phanerozoic succession in Iraq, J. Geol. Soc. Iraq, 30, 85–110, 1997.
Numan, N. M. S.: Major cretaceous tectonic events in Iraq, Rafidain Journal of Science, 11, 32–52, 2000.
Park, J. and Levin, V.: Seismic anisotropy: tracing plate dynamics in the mantle, Science, 296, 485–489, https://doi.org/10.1126/science.1067319, 2002.
Paul, A., Karabulut, H., Mutlu, A. K., and Salaün, G.: A comprehensive and densely sampled map of shear-wave azimuthal anisotropy in the Aegean–Anatolia region, Earth Planet. Sc. Lett., 389, 14–22, https://doi.org/10.1016/j.epsl.2013.12.019, 2014.
Priestley, K. and McKenzie, D.: The relationship between shear wave velocity, temperature, attenuation and viscosity in the shallow part of the mantle, Earth Planet. Sc. Lett., 381, 78–91, https://doi.org/10.1016/j.epsl.2013.08.022, 2013.
Priestley, K., McKenzie, D., Barron, J., Tatar, M., and Debayle, E.: The Zagros core: Deformation of the continental lithospheric mantle, Geochem. Geophy. Geosy., 13, https://doi.org/10.1029/2012GC004435, 2012.
Qaysi, S., Liu, K. H., and Gao, S. S.: A database of shear-wave splitting measurements for the Arabian Plate, Seismol. Res. Lett., 89, 2294–2298, https://doi.org/10.1785/0220180144, 2018.
Sadeghi-Bagherabadi, A., Margheriti, L., Aoudia, A., and Sobouti, F.: Seismic anisotropy and its geodynamic implications in Iran, the easternmost part of the Tethyan Belt, Tectonics, 37, 4377–4395, https://doi.org/10.1029/2018TC005209, 2018a.
Sadeghi-Bagherabadi, A., Sobouti, F., Ghods, A., Motaghi, K., Talebian, M., Chen, L., Jiang, M., Ai, Y., and He, Y.: Upper mantle anisotropy and deformation beneath the major thrust-and-fold belts of Zagros and Alborz and the Iranian Plateau, Geophys. J. Int., 214, 1913–1918, https://doi.org/10.1093/gji/ggy233, 2018b.
Sandvol, E., Turkelli, N., Zor, E., Gok, R., Bekler, T., Gurbuz, C., Seber, D., and Barazangi, M.: Shear wave splitting in a young continent-continent collision: An example from eastern Turkey, Geophys. Res. Lett., 30, https://doi.org/10.1029/2003GL017390, 2003.
Silver, P. G. and Chan, W. W.: Shear wave splitting and subcontinental mantle deformation, J. Geophys. Res.: Solid Earth, 96, 16429–16454, https://doi.org/10.1029/91JB00899, 1991.
Silver, P. G. and Holt, W. E.: The mantle flow field beneath western North America, Science, 295, 1054–1057, https://doi.org/10.1126/science.1066878, 2002.
Sissakian, V., Shihab, A. T., Al-Ansari, N., and Knutsson, S.: New tectonic finding and its implications on locating Oilfields in parts of the Gulf region, Journal of Earth Sciences and Geotechnical Engineering, 7, 51–75, 2017.
Taghizadeh-Farahmand, F., Sodoudi, F., Afsari, N., and Ghassemi, M. R.: Lithospheric structure of NW Iran from P and S receiver functions, J. Seismology, 14, 823–836, https://doi.org/10.1007/s10950-010-9199-2, 2010.
Taghizadeh-Farahmand, F., Sodoudi, F., Afsari, N., and Mohammadi, N.: A detailed receiver function image of the lithosphere beneath the Kopeh-Dagh (Northeast Iran), J. Seismology, 17, 1207–1221, https://doi.org/10.1007/s10950-013-9388-x, 2013.