the Creative Commons Attribution 4.0 License.
the Creative Commons Attribution 4.0 License.
Chemical heterogeneities in the mantle: progress towards a general quantitative description
Massimiliano Tirone
Chemical equilibration between two different assemblages (peridotite type and gabbro–eclogite type) has been determined using basic thermodynamic principles and certain constraints and assumptions regarding mass and reaction exchange.
When the whole system (defined by the sum of the two subsystems) is in chemical equilibrium the two assemblages will not be homogenized, but they will preserve distinctive chemical and mineralogical differences. Furthermore, the mass transfer between the two subsystems defines two petrological assemblages that separately are also in local thermodynamic equilibrium. In addition, when two assemblages previously equilibrated as a whole in a certain initial mass ratio are held together assuming a different proportion, no mass transfer occurs and the two subsystems remain unmodified.
By modeling the chemical equilibration results of several systems of variable initial size and different initial composition it is possible to provide a quantitative framework to determine the chemical and petrological evolution of two assemblages from an initial state, in which the two are separately in chemical equilibrium, to a state of equilibration of the whole system. Assuming that the local Gibbs energy variation follows a simple transport model with an energy source at the interface, a complete petrological description of the two systems can be determined over time and space. Since there are no data to constrain the kinetics of the processes involved, the temporal and spatial scale is arbitrary. The evolution model should be considered only a semiempirical tool that shows how the initial assemblages evolve while preserving distinct chemical and petrological features. Nevertheless, despite the necessary simplification, a 1-D model illustrates how chemical equilibration is controlled by the size of the two subsystems. By increasing the initial size of the first assemblage (peridotite like), the compositional differences between the initial and the final equilibrated stage become smaller, while on the eclogite-type side the differences tend to be larger. A simplified 2-D dynamic model in which one of the two subsystems is allowed to move with a prescribed velocity shows that after an initial transient state, the moving subsystem tends to preserve its original composition defined at the influx side. The composition of the static subsystem instead progressively diverges from the composition defining the starting assemblage. The observation appears to be consistent for various initial proportions of the two assemblages, which somehow simplify the development of potential tools for predicting the chemical equilibration process from real data and geodynamic applications.
Four animation files and the data files of three 1-D and two 2-D numerical models are available following the instructions in the Supplement.
- Article
(4983 KB) - Full-text XML
-
Supplement
(80 KB) - BibTeX
- EndNote
Our understanding of the Earth and planetary interiors is based on the underlying assumption that thermodynamic equilibrium is effectively achieved on a certain level, which means that the system under consideration is in thermal, mechanical and chemical equilibrium within a certain spatial and temporal domain. Although this may appear to be just a formal definition, it affects the significance of geophysical, petrological and geochemical interpretations of the Earth's interior. While the assumption of thermodynamic equilibrium is not necessarily incorrect, the major uncertainty is the size of the domain on which the assumption is expected to be valid.
The Earth and planetary interior as a whole could be defined to be in mechanical equilibrium when the effect of the gravitational field is compensated for, within a close limit, by a pressure gradient (for simplicity variations of viscous forces are neglected). Even when this is effectively the internal state (one example could perhaps be the interior of Mars), thermodynamic equilibrium most likely is not achieved because it also requires thermal equilibrium (i.e., uniform temperature) and chemical equilibrium (for possible definitions of chemical equilibrium see, for example, Prigogine and Defay, 1954; Denbigh, 1971; Smith and Missen, 1991; Kondepudi and Prigogine, 1998). On a smaller scale instead, local thermodynamic equilibrium could be a reasonable approximation. If the system is small enough, the effect of the gravitational field is negligible and a condition close to mechanical equilibrium is achieved by the near balance between the gravitational force and pressure (locally both density and pressure are effectively uniform and viscous forces are neglected for simplicity). Clearly a perfect balance will lead to static equilibrium. On the other end, dynamic equilibrium makes it harder for chemical and thermal equilibrium to be maintained. In studies of planetary solid bodies it is often reasonable to assume dynamic equilibrium close to a quasi-static condition in which the force balance is close to but not exactly zero. At a smaller scale it is then easier to consider the temperature to also be nearly uniform. The main uncertainty remains the chemical equilibrium condition. On a planetary scale, whether the size of the system under investigation is defined to be on the order of hundreds of meters or a few kilometers, it has little effect on the variation of the gravity force and in most cases on the temperature gradient. But for chemical exchanges, the difference could lead to a significant variation of the extent of the equilibration process. For the Earth's mantle, in particular, this is the case because it is generally considered to be chemically heterogeneous. The topic has been debated for some time (Kellogg, 1992; Poirier, 2000; Schubert et al., 2001; van Keken et al., 2002; Helffrich, 2006) and large-scale geodynamic models to study chemical heterogeneities in the Earth's mantle have been refined over the years (Gurnis and Davies, 1986; Ricard et al., 1993; Christensen and Hofmann, 1994; Walzer and Hendel, 1999; Tackley and Xie, 2002; Zhong, 2006; Huang and Davies, 2007; Brandenburg et al., 2008; Li and al., 2014; Ballmer et al., 2015, 2017). Geochemical (van Keken and Ballentine, 1998; van Keken et al., 2002; Kogiso et al., 2004; Blusztajn et al., 2014; Iwamori and Nakamura, 2014; Mundl et al., 2017) and geophysical (van der Hilst et al., 1997; Trampert et al., 2004; Tommasi and Vauchez, 2015; Zhao et al., 2015; Tesoniero et al., 2016) data essentially support the idea that the mantle develops and preserves chemical heterogeneities through the Earth's history. Even though all the interpretations of the mantle structure are based on the assumption of local thermodynamic equilibrium, the scale of chemical equilibration has never been investigated in much detail. An early study (Hofmann and Hart, 1978) suggested that chemical equilibrium cannot be achieved over geological time, even for relatively small systems (kilometer scale), and hence it must preserve chemical heterogeneities on the same scale. The conclusion was inferred based on volume diffusion data of Sr in olivine at 1000 ∘C. At that time the assessment was very reasonable, although the generalization was perhaps an oversimplification of a complex multiphase multicomponent problem. In any case, significant progress in the experimental methodology to acquire kinetic data and a better understanding of the mechanisms involved suggest that the above conclusion should at least be reconsidered. Based on the aforementioned study, the only mechanism that was assumed to have some influence on partially homogenizing the mantle was mechanical thinning–mixing by viscous deformation (Kellogg and Turcotte, 1987). In addition, there are very limited experimental data on specific chemical reactions relevant to mantle minerals (Rubie and Ross II, 1994; Milke et al., 2007; Ozawa et al., 2009; Gardés et al., 2011; Nishi et al., 2011; Dobson and Mariani, 2014) to set the groundwork for a general reinterpretation of chemical heterogeneities in the mantle.
Perhaps a common misconception is that chemical equilibrium between two lithologies implies chemical homogenization. In other words, if the mantle is heterogeneous, chemical equilibration must not have been effective. This is not necessarily true. A simple example may explain this point. If we consider, for example, the reaction between quartz and periclase to form a variable amount of forsterite and enstatite, , at equilibrium, homogenization would require the formation of a bimineralic single layer made of a mixture of enstatite and forsterite crystals. However, experimental studies (e.g., Gardés et al., 2011) have shown instead the formation of two separate monomineralic layers, one made of polycrystalline enstatite and the other one made of forsterite.
In summary, there are still unanswered questions regarding the chemical evolution of the Earth's mantle; for example, at what spatial and temporal scale we can reasonably assume that a petrological system is at least close to chemical equilibrium? And how does it evolve petrologically and mineralogically?
This study expands a previous contribution that aimed to provide an initial procedure to determine the chemical equilibration between two lithologies (Tirone et al., 2015). The problem was exemplified in an illustration (Fig. 1 in Tirone et al., 2015). Because certain assumptions need to be made, the heuristic solution, further developed here, is perhaps less rigorous than other approaches based on diffusion kinetics that were applied mainly for contact metamorphism problems (Fisher, 1973; Joesten, 1977; Nishiyama, 1983; Markl et al., 1998). However, the advantage is that it is relatively easy to generalize, and it leads towards a possible integration with large-scale geodynamic numerical models while still allowing for a comparison with real petrological data. At the same time it should be clear that to validate this model approach and to constrain the extent of the chemical equilibration process, experimental data should be acquired on the petrological systems investigated here and in the previous study.
The following section (Sect. 2) outlines the revised procedure to determine the two petrological assemblages together forming a system in chemical equilibrium. The revision involves the method used to determine the composition of the two assemblages when they are in equilibrium together, the database of the thermodynamic properties involved and the number of oxides considered in the bulk composition. In addition, since the solids are nonideal solid mixtures (in the previous study all mixtures were ideal), the chemical equilibration requires that the chemical potential of the same components in the two assemblages must be the same (Prigogine and Defay, 1954; Denbigh, 1971). The method is still semi-general in the sense that a similar approach can be used for different initial lithologies with different compositions; however, some assumptions and certain specific restrictions should be modified depending on the problem. The simplified system discussed in the following sections assumes, on one side, a peridotite-like assemblage and a gabbro–eclogite on the other side. Both are considered at a fixed pressure and temperature (40 kbar and 1200 ∘C) and their composition is defined by nine oxides. The general idea is to conceptually describe the proxy for a generic section of the mantle and a portion of a subducting slab. A more general scheme that allows for variations of the pressure and temperature should be considered in future studies.
The results of the equilibration method applied to 43 different systems are presented in Sect. 2.1. The parameterization of the relevant information that can be used for various applications is discussed in Sect. 2.2.
Section 3 presents the first application of a 1-D numerical model applied to pairs of assemblages in variable initial proportions to determine the evolution over time towards a state of equilibration for the whole system. The next section (Sect. 4) illustrates the results of a few simple 2-D dynamic models that assume chemical and mass exchange when one side moves at a prescribed velocity while the other side remains fixed in space. These simple models only serve to illustrate how distinct mineralogical and petrological features are preserved after chemical equilibration has been reached.
All the necessary thermodynamic computations are performed in this study with the program AlphaMELTS (Smith and Asimow, 2005), which is based on the thermodynamic modelization of Ghiorso and Sack (1995) and Ghiorso et al. (2002) for the melt phase, the mixture properties of the solid and certain end-member solids. The thermodynamic properties of most of the end-member solid phases are derived from an earlier work (Berman, 1988). Even though melt is not present at the (P, T, X) conditions considered in this study and other thermodynamic models are also available (Saxena, 1996; Stixrude and Lithgow-Bertelloni, 2005; Piazzoni et al., 2007; de Capitani and Petrakakis, 2010; Holland and Powell, 2011; Duesterhoeft and de Capitani, 2013), AlphaMELTS proved to be a versatile tool to illustrate the method described in this work. It also allows for a seamless transition to potential future investigations in which it would be possible to study the melt products of two equilibrated, or partially equilibrated, assemblages when the P–T conditions are varied.
This section describes in some detail the procedure to determine the transformations of two assemblages after
they are put in contact and the system as a whole reaches a condition of chemical equilibrium.
The bulk composition is described by nine oxides
(SiO2, TiO2, Al2O3, Fe2O3, Cr2O3, FeO, MgO, CaO, Na2O).
Retaining the input format of the AlphaMELTS program, the bulk composition is given in grams.
Pressure and temperature are defined at the beginning of the process and they are kept constant.
Water (thermodynamic phase) is not considered simply
because the mobility of a fluid phase (or melt) cannot be easily quantified and incorporated in the model.
Three independent equilibrium assemblages are retrieved using AlphaMELTS.
These are standard equilibrium computations that consist of solving a constrained minimization of the Gibbs
free energy (van Zeggeren and Storey, 1970; Ghiorso, 1985; Smith and Missen, 1991).
The first two equilibrations involve the bulk compositions of the two assemblages separately.
The third one is performed assuming a weighted average of the bulk composition
of the two assemblages in a predefined proportion, for example 1:1, 5:1 or 100:1, also expressed as f:1, where f=1, 5, 100
(peridotite : gabbro–eclogite). This third computation applies to a whole system in which
the two assemblages are now considered subsystems.
The variable proportion essentially allows for increasingly larger portions of the subsystem mantle to be put in contact with the
subsystem gabbro–eclogite using the factor f to indicate the relative “size” or mass of the material involved.
By using AlphaMELTS
the mineralogical abundance and composition in moles are retrieved from the file phase_main_tbl.txt,
while the chemical potential
for each mineral component in the solid mixture is retrieved from the thermodynamic output file (option 15
in the AlphaMELTS program).
Knowing all the minerals components involved, an independent set of chemical reactions can be easily found (Smith and Missen, 1991).
For the problem at hand, the list of minerals and abbreviations are reported in Table 1,
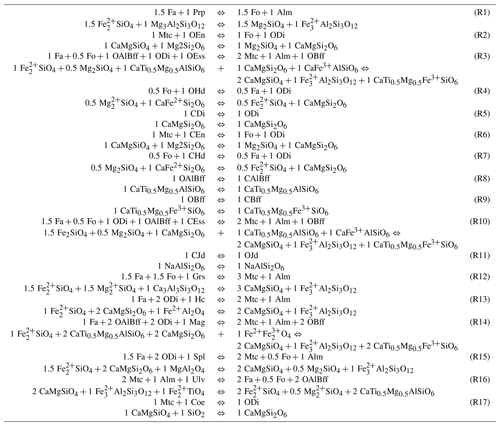
and the set of independent reactions are listed in Table 2.
Table 1List of minerals and mineral components relevant for this study with chemical formulas and abbreviations.
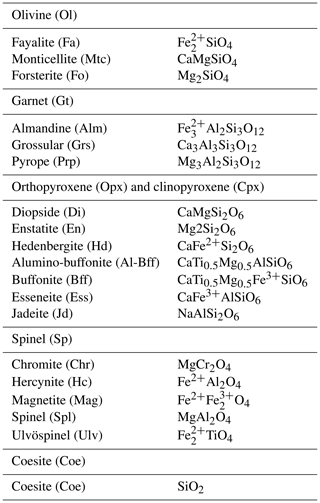
Table 2Set of independent reactions for the list of mineral components in Table 1.
Given the above information, the next step is to determine the bulk composition and the mineralogical assemblages of the two subsystems after they have been put together and equilibration of the whole system has been reached. For this problem the initial amount of moles n of mineral components i in the two assemblages is allowed to vary (Δni), provided that certain constraints are met. The set of constraints can be broadly defined in two categories. The first group consists of relations that are based on general mass, chemical or thermodynamic principles. The second set of constraints is based on certain reasonable assumptions that should be verified by future experimental studies.
The first and most straightforward set of constraints requires that the sum of the moles in the two assemblages should be equal to the moles of the whole system:
where ni(A0) represents the initial number of moles of the mineral component in the first assemblage (A) in equilibrium before it is put in contact with the second assemblage (B). A similar definition applies to ni(B0); Δni(A) and Δni(B) are the variations of the number of moles after the two assemblages are held together, and ni(W) is the number of moles of the component in the whole assemblage (A+B). The size of the whole assemblage is defined by f+1, where f refers to the size of the first assemblage.
Another set of constraints imposes the condition of local chemical equilibrium (Prigogine and Defay, 1954; Denbigh, 1971; Kondepudi and Prigogine, 1998) by requiring that the chemical potentials of the mineral components in the two subsystems cannot differ from the chemical potentials found from the equilibrium computation for the whole assemblage (W):
where μi(A) is the chemical potential of the mineral component in the assemblage A whose number of moles is , and there is a similar expression for the second assemblage B.
Another constraint is given by the sum of the Gibbs free energy of the two subsystems that should be equal to the total Gibbs free energy of the whole system:
where , and there are similar equations for B and W.
The list of reactions in Table 2 allows for the definition of a new set of equations that relates the extent of the reaction ξr with the changes in the moles of the mineral components (Prigogine and Defay, 1954; Kondepudi and Prigogine, 1998). Consider, for example, the garnet component almandine (Alm), which appears in Reactions (R1), (R3), (R10), (R12), (R13), (R14), (R15) and (R16); the following relation can be established:
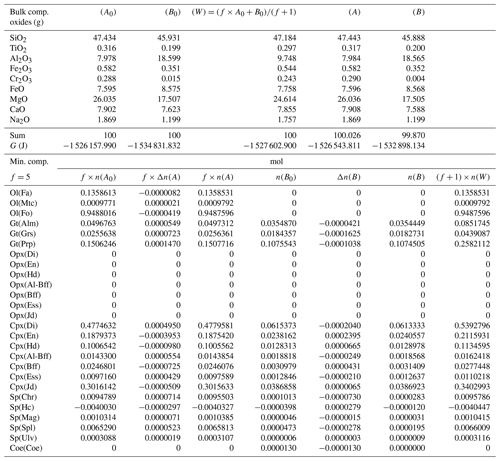
where the extents of the reactions are considered to be potential new variables. However, not necessarily all the ξr should be treated as unknowns. This can be explained by inspecting, for example, Table 3, which provides the input data and the results of the equilibrium modeling for the study cases, in particular the one that assumes an initial proportion 1:1 (f=1). The second and third column on the upper side of the table report the input bulk composition on the two sides. The second and fifth column on the lower part of the table show the results of the thermodynamic equilibrium calculation applied separately to the two subsystems. The last column shows the results for the whole system W. This last column indicates, for example, that orthopyroxene is not present at equilibrium in the whole assemblage. Considering the reactions in Table 2 and the data in Table 3, the EN component in orthopyroxene appears only in Reaction (R2), and since no OEn is present on the B side, the mole change in A can be locked (). Therefore, ξ(R2) is fixed to −0.0700777. The same is also true for ξ(R3), which is uniquely coupled to ΔnOEss(A), furthermore ξ(R4) coupled to ΔnOHd(A), also ξ(R11) coupled to −ΔnOJd(A), and finally ξ(R17) fixed by ΔnCoe(B).
Table 3Summary of the results of one chemical equilibration procedure. The columns (A0) and (B0) describe the initial bulk composition of the two subsystems and the Gibbs free energy G (joules) of the equilibrium assemblages separately. Following the AlphaMELTS input format, the bulk compositions are given in grams. The initial proportion of the whole system is f:1 (f=1) and the whole composition is reported in column (W). Columns (A) and (B) in the upper portion of the table present the results of the chemical equilibration in terms of oxides. Note that the sum of the oxides is not 100, which indicates a mass transfer between the two subsystems. The columns in the lower part of the table show the composition of the mineral components at equilibrium before the two subsystems are put together (f×n(A0) and n(B0) and after equilibration of the whole system (f×n(A) and n(B)). The change in moles (f×Δn(A), Δn(B) is also reported. The last column is the composition of the whole system (W) after equilibration.
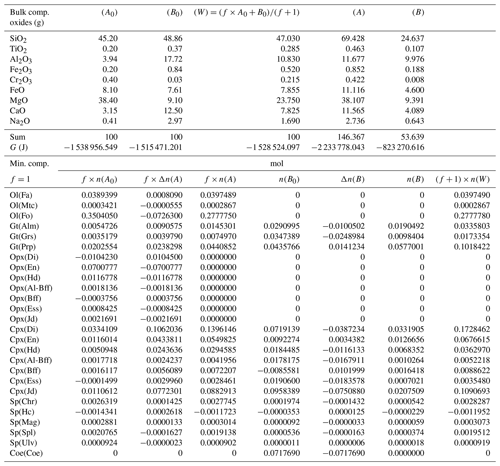
For the problem at hand the above set of relations does not allow for a unique definition of the changes in the moles of the mineral components in the two subsystems. Therefore, additional relations based on some reasonable assumptions have been added to the solution method. Future experimental studies will need to verify the level of accuracy of such assumptions. Certain constraints on the mass exchange can be imposed by comparing the equilibrium mineral assemblage of the whole system (W) with the initial equilibrium assemblages in A0 and B0. For example, Table 3 shows that olivine is present in the whole assemblage W. However, initially olivine is only located in subsystem A0. Therefore, rather than forming a completely new mineral in B, the assumption is that the moles of fayalite (Fa), monticellite (Mtc) and forsterite (Fo) will change only in subsystem A to comply with the composition found for the whole assemblage W. Following this reasoning, the changes in the two subsystems could be set as ΔnFa(A)=0.0008090, , and . In this particular case the same assumption is also applicable to the orthopyroxene components. It is clear that by starting with different bulk compositions, proportions or T–P conditions, alternative assemblages may be formed, and therefore different conditions may apply, but the argument on which the assumption is based should be similar.
Additional constraints based on further assumptions can be considered. For example, garnet appears on both sides A0 and B0. The components pyrope (Prp) and grossular (Grs) contribute only to two reactions, Reactions (R1) and (R12), and in both cases the reactions involve only olivine components that have been fixed in subsystem A, as previously discussed. The assumption that is made here is that the change in the moles of the garnet components in subsystem B will be minimal because no olivine is available in this subsystem. Therefore, the following relation is applied,
and similar relations can also be imposed to the other garnet components, Alm and Grs. The same argument can be applied to the clinopyroxene and spinel components. For example, the spinel component hercynite (Hc) appears only in Reaction (R13), which involves olivine and orthopyroxene components (Fa, ODi) located in subsystem A, and the garnet component Alm that has already been defined by the previous assumption.
The overall procedure is implemented with the use of Minuit (James, 1994), a program that is capable of performing a minimization of multiparameter functions. Convergence is obtained making several calls of the Simplex and Migrad minimizers (James, 1994). The procedure is repeated with different initial values for the parameters Δni(A), Δni(B) and ξr to confirm that a unique global minimum has been found.
2.1 Results of the chemical equilibrium model between two assemblages
The procedure described in the previous section has been applied to 43 different cases, varying the proportion of the two subsystems from 1:1 to 1000:1 and considering different, but related, initial compositions. The initial bulk composition and the proportion factor f of the two subsystems for all 43 cases are included in a table available in the Supplement. For example, the initial compositions for A0 and B0 applied to case no. 11 are taken from Table 4 (column A*) and from Table 3 (column B0); both tables are discussed in this section. Tables 3–7 report the results of the procedure discussed in the previous section for a few cases. Table 3 was briefly introduced earlier to show the initial bulk composition of the two subsystems (upper portion of the table), the initial equilibrium assemblages and the mole changes after the chemical equilibration (lower part of the table). The table also includes the bulk composition in the two subsystems after the chemical equilibration procedure is completed (upper part, columns 5 and 6). These bulk compositions are calculated from the mole abundance of the mineral components shown in the lower part (columns 4 and 7). The total mass of the subsystems is reported as well. Note that a negative abundance of certain mineral components is permissible according to the thermodynamic model developed by Ghiorso and Carmichael (1980) and Ghiorso (2013) as long as the bulk abundance of the related oxides is greater than zero.
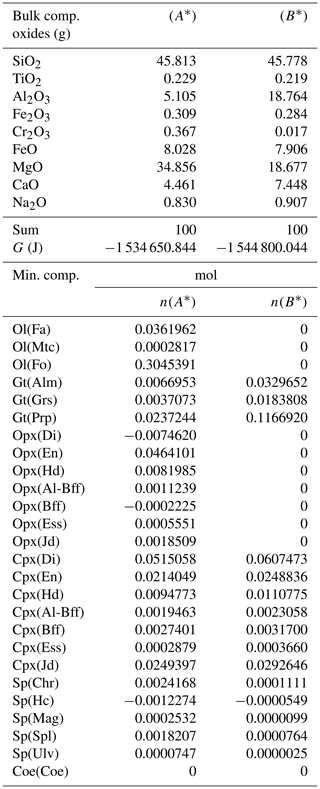
Table 4Normalized bulk composition (A*) and (B*) in the two subsystems taken from the results of the model in Table 3, (A) and (B). The lower part of the table shows the equilibrium mineral composition computed with the program AlphaMELTS for each subsystem separately.
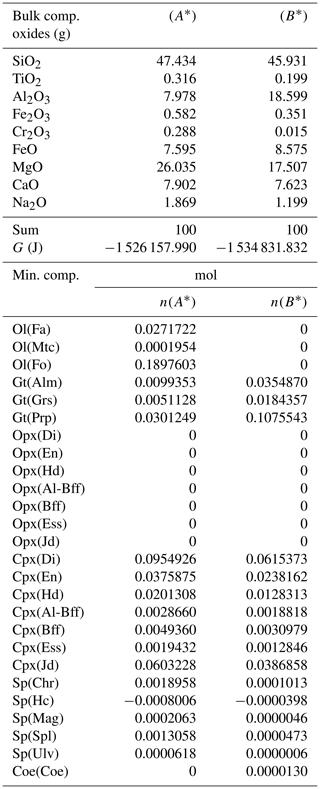
In the example shown in Table 3 there is a significant mass transfer from B to A: mass(A0) = 100, mass(A) = 146.36 and mass(B0) = 100, mass(B) = 53.64 (grams). The table also includes the total Gibbs energy for the subsystems before and after the equilibration of the whole system, which is computed from the output of the program AlphaMELTS after combining the moles of the components and the relative chemical potentials. The total Gibbs free energy is relevant for the parameterization discussed in the next section. Table 4 is a summary of a further analysis aiming to investigate whether there is any pattern in the compositions of the two subsystems. The bulk compositions in the upper portion of the table (A*, B*) are obtained by normalizing the oxides in A and B (upper part, column 5 and 6 of Table 3) to a total mass of 100 g. For example, SiO2 in A* from Table 4 (47.434) is 100 × (SiO2 in A) ∕ (sum of oxides in A) from Table 3, which is equal to 100 × 69.428 ∕ 146.367. The normalized oxides (A*, B*) represent the mass of the components in grams when the total mass is 100 g, which is obviously also equivalent to the weight percent of the components. These bulk compositions can be used for two new Gibbs free energy minimizations, one for each of the two subsystems, to retrieve the correspondent equilibrium assemblages separately. The interesting observation that can be made following the summary in the lower part of Table 4 is that the abundance of the mineral components remains unmodified after scaling the results for the total mass of the system.
For example, using the data from Table 3, the proportion relation gives , which is remarkably close to the moles of almandine found from the separate equilibration calculation reported in Table 4, . In other words, the scaling factor used to define the input oxide bulk composition can be also applied to the equilibrium mineral assemblage.
Based on this observation, some equilibration models have been carried out considering at least one of the initial compositions from a previous model (e.g., A* from a previous equilibration model ⇒ input for a new model A0 or, alternatively, ), while for the other subsystem the initial bulk composition from Table 3 is used again. A special case is the one shown in Table 5 in which both A0 and B0 are taken from the equilibrated and normalized data of the previous model, A* and B*, reported in Table 4. If the proportion in the new model remains the same, 1:1, then clearly no compositional changes are expected since the whole system is already in equilibrium. If the proportion is changed, for example to 5:1 (f=5), the bulk composition of the whole system is different from the bulk composition of the whole system with 1:1 proportion, and the assemblages in the two subsystems may not remain unmodified after equilibration. However, this does not appear to be the case, as shown in Table 5, where Δni(A) and Δni(B) are very small. The results suggest that the moles of the mineral components remain unchanged.
Table 5Summary of the results of a chemical equilibration procedure in which the initial composition of the two subsystems (A0) and (B0) is taken from the outcome of the previous model (A* and B* from Table 4). The initial proportion of the whole system is f:1 (f=5). The description of the results follows the outline of the caption of Table 3.
A more general case with f=5 is presented in Table 6. The model is essentially the same shown in Table 3 but with the proportion of the two initial subsystems set to 5:1. As expected, the results of the equilibration process are different from the results starting with an initial proportion of 1:1 (Table 3). For example, with 1:1, nalm(A)=0.01453, while with 5:1, . The question is whether the observation made for the first studied case with proportion 1:1 can be generalized. In particular, there is the observation that the mineral abundance in the two subsystems from the equilibration procedure of the whole system is equivalent to the one that is obtained from two separate equilibration computations using the normalized bulk compositions A* and B*. Indeed, it appears that the same conclusion can be made for the model with 5:1 initial proportion (Table 7). The number of moles of the almandine component is (Table 6), which can be compared with from Table 7. The similarity has been also observed for all the other models, with f ranging from 1 to 1000.
Table 6Results from a chemical equilibration model with the initial composition of the two subsystems (A0) and (B0) analogous to the one presented in Table 3. The only difference is that the initial proportion of the whole system is f:1 (f=5).
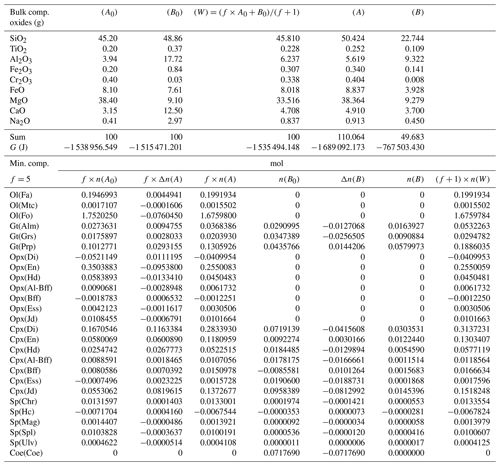
Table 7Normalized bulk composition (A*) and (B*) of the two subsystems taken from the results of the model in Table 6. The lower part of the table shows the equilibrium mineral composition computed with the program AlphaMELTS for each subsystem separately.
2.2 Parameterization of the equilibrium model results for applications
While interesting observations have been made about the mineralogical assemblages in the two subsystems after chemical equilibration, it is still unclear how this type of model can be applied for studies on the chemical evolution of the mantle. Figure 1 summarizes the relevant data that allows for the determination of the bulk composition and the mineralogical assemblage in the two subsystems after the chemical equilibration process is completed.
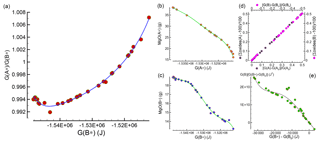
Figure 1Data and relative fitting of 43 study cases that are used to develop the chemical equilibration model. (a) Relation between the ratio and G(B*), which is applied to constrain G(A*) and G(B*) at the interface. Panels (b) and (c) illustrate the relation between G(A*) and G(B*) with MgO bulk abundance. Similar relations are applied for all nine oxides defining the bulk composition. The normalized bulk abundance is intended as grams with respect to a total mass of 100 g, which is equivalent to weight percent. Knowing G(B), the total size of the assemblage at equilibrium can be found assuming that (1) a relation between the mass change and the change in G(B) is established (d). (2) The extension of the assemblage is proportional to the mass change and it takes place along a direction perpendicular to the interface. The total length at equilibrium is then adjusted in accordance with the difference between the spatial average G(B*) of the assemblage and G(B*) at the interface (see the main text for a detailed explanation). The change in size of the second assemblage is also applied on the first assemblage but with opposite sign. Panel (e) allows for the determination of G(B) from the relation with G(B*) at the interface.
The key quantity is the normalized Gibbs energy of the two subsystems after they have been equilibrated, G(A*) and G(B*). The normalized Gibbs energy for an unspecified subsystem (either A* or B*) is defined by the symbol G(*). The quantity can be computed from the AlphaMELTS output after the Gibbs free energy minimization is applied to A* or B*, or it can be simply obtained by scaling G(A) or G(B). Figure 1a shows the relation between the ratio and G(B*), which will be used later to define G(*) at the interface between the two assemblages. The data in the figure for the 43 models have been fitted using a Chebyshev polynomial (Press et al., 1997). By knowing G(*), it is possible to retrieve the abundance of all the oxides defining the bulk composition normalized to 100 g. An example is shown in Fig. 1b and c, which illustrate the data points for MgO in (A*) and (B*) in the 43 study models and the fitting of the points using Chebyshev polynomials.
The mass transfer between the two subsystems can be related to the total Gibbs free energy variation in each of the two subsystems G(A) and G(B). The two relations are almost linear, as shown in Fig. 1d. For practical applications, once a relation is found between G and the normalized G(*), then the mass transfer can be quantified. Figure 1e shows the data points and the data fitting with the Chebyshev polynomial of the function versus . More details on the use of the fitting polynomial functions are provided in the next section.
The chemical and petrological evolution of two assemblages can be investigated with a 1-D numerical model, assuming that the two subsystems always remain in contact and they are not mobile. The problem is assumed to follow a simple conduction–diffusion coupled-type model with variable size for the local variation of G(*), which can be expressed by the following equation for each subsystem:
where S(*) is a scaling factor and G(*) and S(*) refer to either A* or B*. Time t, distance dx(*) and the scaling factor S(*) have no specific units since we have no knowledge of the kinetics of the processes involved. At the moment these quantities are set according to arbitrary units, S(A*) and S(B*) are set to 1, and t, dx(A*) and dx(B*) have different values depending on the numerical simulation. It should be clear that the dynamic model provides only a semiempirical quantitative description of a complex process. The main purpose is to illustrate the general concept and to show that the two assemblages could develop distinct regions evolving towards the condition of chemical equilibrium, while far from the interface area the initial compositions can be preserved for a certain amount of time. A detailed description of how the two subsystems will eventually reach chemical equilibration is beyond the scope of this study.
The numerical solution with grid spacing Δdx(*), uniform on both sides, is obtained using the well-known Crank–Nicolson method (Tannehill et al., 1997). At the interface (defined by the symbol if) the polynomial of the function shown in Fig. 1a is used together with the flux conservation equation,
to retrieve G(A*)if and G(B*)if assuming that . The external boundaries defining the limits of the whole system (symbol l) are assumed to be of closed type or symmetric type. Both are obtained by the condition and , where nA and nB are the total number of grid points on each side (excluding the boundary points). G(A*)l and G(B*)l define the outside boundary limits of the whole system, which represent either the closed end of the system or the middle point of two mirrored images.
To determine the mass transfer and how it affects the length of the two subsystems, the following steps are applied. The polynomial of the relation shown in Fig. 1e is used at the interface point to find G(B)if (from the relation with ). Defining , the length of subsystem B at complete equilibrium would be , where Dx(B0) is the total length of the subsystem at the initial time. The spatial average of G(B*), defined as G(B*)av, can be easily computed. The quantity G(B*)av is needed in the following relation to find the current total length of the subsystem at a particular time:
The same change in length is applied with opposite sign on the other subsystem. The new dimensions and also define new constant grid step sizes, Δdx(A*) and Δdx(B*). The final operation is to re-mesh the values of G(*) at the previous time step onto the new uniform spatial grid.
It is worth mentioning that in the procedure outlined above, converting the change in G to the change in the total length of the subsystem is a two-step process. The first step makes use of the relation between the change in G and the change in the total mass, which is illustrated in Fig. 1d. In the next step the assumption is that the change in mass (and G) is proportional to the change in the total length of the subsystem.
To summarize the numerical procedure, at every time step the complete solution on both sides is obtained by solving Eq. (6) for G(A*) and G(B*) with the boundary conditions imposed for the limits of the whole system and preliminary values for the interface points. Then the interface points are updated using the polynomial function and Eq. (7). The total length is then rescaled to account for the mass transfer and the numerical grid size is updated. This procedure is iterated until the variation between two iterations becomes negligible (typically convergence is set by , where the labels no. 1 and no. 2 refer to two iterative steps).
Once convergence has been reached, the oxide abundance can be found easily using the Chebyshev polynomial parameterization in which each oxide is related to a function of G(A*) or G(B*) (e.g., for MgO see Fig. 1b and c). For convenience the composition is identified in weight percent since the normalized oxides (*) represent the grams of the components with respect to a total mass of 100 g. Finally, knowing temperature, pressure and the variation of the bulk oxide compositions in space and time, a thermodynamic equilibrium calculation can be performed at every grid point using the program AlphaMELTS to determine the local mineralogical assemblage.
Several 1-D numerical simulations have been carried out with the initial proportion ranging from 1:1 to 100:1. Some results from a test case with proportion 1:1 are shown in Fig. 2. The initial total length on both sides is set to (arbitrary units), and the initial spatial grid step is . The time step is set to 4 (arbitrary units) and . The initial bulk compositions of the two assemblages, with separately are in complete thermodynamic equilibrium, are the same as reported in Table 3 for A0 and B0: SiO2=45.2, TiO2=0.20, Al2O3=3.94, Fe2O3=0.20, Cr2O3=0.40, FeO=8.10, MgO=38.40, CaO=3.15, Na2O=0.41 wt % (peridotite side) SiO2=48.86, TiO2=0.37, Al2O3=17.72, Fe2O3=0.84, Cr2O3=0.03, FeO=7.61, MgO=9.10, CaO=12.50 and Na2O=2.97 wt % (gabbro–eclogite side). Figure 2a illustrates the variation of G(*) on both sides at the initial time (black line) and at three different times: 80, 4000 and 20 000 (arbitrary units). Note the increase in the length on the A side and decrease on the B side. Bulk oxide abundance is also computed at every grid point. The bulk MgO (wt %) is reported in Fig. 2b, which shows the progressive decrease on the A side, while MgO increases on the B side. The bulk composition can be used with the program AlphaMELTS to determine the local equilibrium assemblage. Figure 2c–h show the amount of the various minerals in weight percent (solid lines) and the MgO content in each mineral in weight percent (dotted lines), with the exception of coesite in Fig. 2h (SiO2). The complex mineralogical evolution during the chemical equilibration process can be studied in some detail. For example, one can observe the progressive disappearance of orthopyroxene on the peridotite side and the exhaustion of coesite on the gabbro–eclogite side.
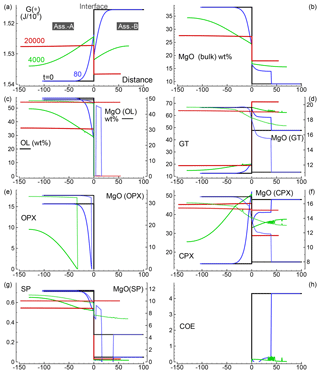
Figure 2Solution of a 1-D model simulation. The initial proportion of the two assemblages is 1:1. (a) G(A*) and G(B*) at three different times and at time zero when the two assemblages separately are considered in chemical equilibrium. (b) Local bulk MgO (wt %) retrieved from the relation with G(*). All the other oxides are retrieved with similar relations. The units of the oxides is weight percent (wt %), which is equivalent to the mass of the components in grams with respect to a total mass of 100 g. (c–g) Mineral abundance (solid lines) and MgO content (dotted lines) in the corresponding minerals. (h) Distribution of coesite. Local mineral abundances and compositions shown in panels (c)–(h) are retrieved after performing thermodynamic computations at every spatial location with the program AlphaMELTS using the bulk oxide abundance exemplified in (b) for MgO. An animation file and complete data for all nine oxides are available following the instructions in the Supplement. Time and distance in arbitrary units. Pressure and temperature are fixed at 40 kbar and 1200 ∘C. The rest of the parameters for the model are defined in the main text.
Similar results are shown in Figs. 3 and 4 for models with the initial proportion set to 5:1 and 50:1, respectively. Differences in the numerical setup of the new test cases can be summarized as follows. For the 5:1 case, Dx(A0)=500, Dx(B0)=100, and the time step is set to 40; for the 50:1 case, Dx(A0)=5000, Dx(B0)=100, Δdx(A0)=5, Δdx(B0)=1 and the time step is set to 800.
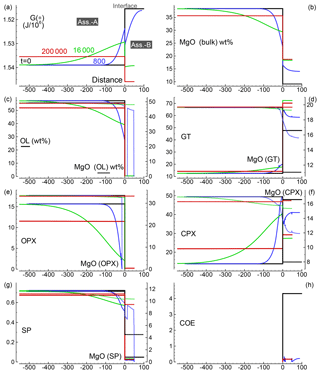
Figure 3Solution of a 1-D model simulation. The initial proportion of the two assemblages is 5:1 (f=5). The description of the panels follows the caption provided for Fig. 2.
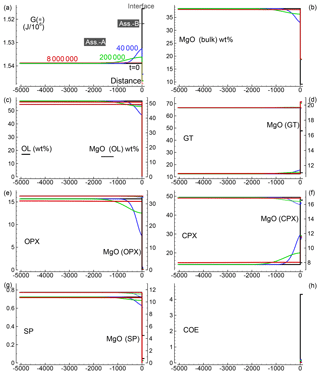
Figure 4Solution for a 1-D model. The initial proportion of the two assemblages is 50:1 (f=50). The description of the panels follows the caption provided for Fig. 2. The raw data file for all nine oxides can be retrieved online, but no animation file is available for this simulation.
A few observations can be made by comparing the three simulations. For example, orthopyroxene on the peridotite side becomes more resilient and the total amount of Opx increases with the size of the initial subsystem. On the other side, it appears that the MgO content in garnet (pyrope component) is greater for the model with starting proportion 5:1 compared to the 1:1 case. However, with initial proportion 50:1, the MgO content does not seem to change any further.
The Supplement provides a link to access the raw data (all nine oxides) for the three test cases with initial proportion 1:1, 5:1 and 50:1. In addition, two animations (1:1 and 5:1 cases) should help to visualize the evolution of the numerical models over time.
A 2-D numerical model makes it possible to study cases in which at least one of the two assemblages becomes mobile. The simplest design explored in this section considers a rectangular box with a vertical interface dividing the two subsystems. The dynamic condition is simply enforced in the model by assuming that one of the two assemblages moves downwards with a certain velocity, replaced by new material entering from the top side, while the other assemblage remains fixed in the initial spatial frame. The whole system evolves over time following the same principles introduced in the previous section. The numerical solution of the 2-D model is approached at every time step in two stages. In the first stage the following equation is applied to both subsystems:
where dx(*) is the general spacing in the x direction representing either dx(A*) or dx(B*), and the vertical spacing dy is assumed to be the same on both sides. This equation is solved numerically using the alternating-direction implicit method (ADI) (Peaceman and Rachford, 1955; Douglas Jr., 1955), which is unconditionally stable with a truncation error (Tannehill et al., 1997). Similar to implicit methods applied for 1-D problems, the ADI method requires only the solution of a tridiagonal matrix.
The numerical procedure described in Sect. 3 to determine G(*) at the interface is also applied here to the 2-D model. The limits of the whole system opposite to the interface (left–right) are also treated similarly, assuming either a closed-type or symmetric-type boundary. For the other two boundaries (top, bottom) the zero flux condition is imposed, and , where ny is the total number of grid points in the y direction (excluding the boundaries).
In the previous section a procedure was developed to account for the mass transfer between the two subsystems. The same method is applied for the 2-D problem. The conceptual difference is that in a 2-D problem the mass change in principle should affect the area defined around a grid point. For practical purposes, however, in this study it only affects the length in the horizontal x direction; hence, re-meshing due to the change in mass is applied only to determine and as well as the two uniform grid step sizes in the x direction, Δdx(A*) and Δdx(B*).
Up to this point the evolution of the system is not different than what was described for the 1-D case. The dynamic component is included at every time step in the second stage of the procedure. It is activated at a certain time assuming that the chosen subsystem moves downwards with a fixed predefined vertical velocity (y component). The material introduced from the top side is assumed to have the same composition of the initial assemblage as defined for the 1-D models in Table 3 (and the same G(A0) and G(B0) values). This is accomplished by assigning G(A0) or G(B0) at a location near the interface, which is defined by the imposed velocity. Then the G(*) points are also shifted according to the prescribed velocity. Values of G(*)y on the original orthogonal grid are obtained by linear interpolation of the shifted G(*) points.
Oxide bulk composition is then retrieved at each grid point over time using the same polynomial functions applied for the 1-D problem. The complete mineralogical assemblage can also be computed using AlphaMELTS as part of a post-process step after the numerical simulation is completed.
Only a few 2-D simulations have been performed specifically considering the initial proportions 1:1, 5:1 and 50:1, assuming that one of the two assemblages is moving downward. Figure 5 summarizes some of the results for the case 5:1 (A), i.e., with moving subsystem A. Initial grid specifications are Dx(A0)=500, Dx(B0)=100, , and (arbitrary units). The time step is set to 16 (arbitrary units). The scaling coefficients Sx(*) and Sy(*) are set to 0.01 (arbitrary units). The dynamic component is activated at time 100 000 with vertical velocity set to 0.00625 (arbitrary units). The figure is a snapshot of the whole system soon after subsystem A has been activated downwards (time 102 400). Figure 5a shows the variation of G(*), while Fig. 5b illustrates the bulk MgO distribution (wt %). The other panels, (c)–(h), present an overview of the mineralogical distribution (flood contour type) and the MgO content in each mineral phase (line contour type), with the exception of Fig. 5h for coesite (SiO2). The panels clearly illustrate the variations introduced by the mobile subsystem A. On the other side, there is apparently no immediate effect on the assemblage B; however, the long-term effect is significant and becomes visible in a later figure (Fig. 7).
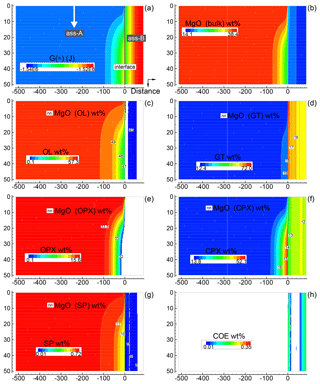
Figure 5Solution of a 2-D model simulation at time 102 400 (arbitrary units). The starting proportion of the two assemblages is 5:1 (f=5). In the initial setup the two assemblages are separately in chemical equilibrium. At time 100 000 a new assemblage A enters from the top side with velocity 0.00625 (arbitrary units). The new assemblage is assumed to have been equilibrated but never previously in contact with assemblage B (the composition of the new assemblage is the same as the assemblage in the initial setup). (a) Spatial variation of G(*). (b) Local distribution of MgO in the bulk assemblage. Similar results are obtained for all the other oxides defining the bulk composition. An animation file and raw data for all nine oxides are available online following the instructions provided in the Supplement. (c–g) Local mineral distribution (color map) and contour lines for the abundance of MgO in the associated minerals. (h) Spatial distribution of coesite. Time and distance in arbitrary units. Pressure and temperature are fixed at 40 kbar and 1200 ∘C. The rest of the parameters for the numerical model are defined in the main text.
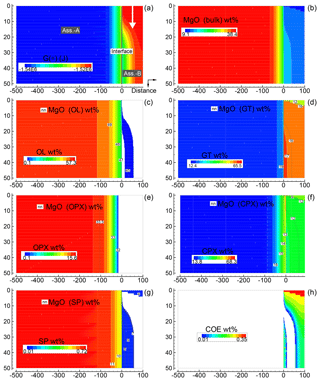
Figure 6Solution of a 2-D model simulation at time 102 400 (arbitrary units). The starting proportion of the two assemblages is 5:1 (f=5). In this model it is assumed that at time 100 000 a new assemblage B enters from the top with velocity 0.00625 (arbitrary units). The description of the panels follows the caption of Fig. 5.
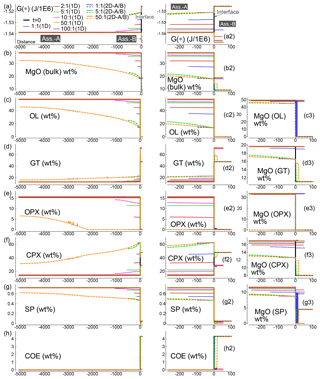
Figure 7Summary of the results for all the 1-D and 2-D numerical models at conditions close to chemical equilibrium for the whole system. The models consider different initial proportions of the two assemblages. In addition, for the 2-D models it is assumed that either assemblage A or B enters from the top side at time 100 000 (arbitrary units) with velocity 0.00625 (arbitrary units). For the 2-D models the profiles represent a horizontal section at the vertical middle point (Dy∕2). (a) Spatial variation of G(*). For clarity, the plot of the 2-D model with 50:1 (B) is truncated at x∼500. (a2) Enlarged view of G(*) near the interface. (b) Variation of bulk MgO (wt %). (b2) Enlarged view of bulk MgO near the interface. (c–g) Spatial variation of mineral abundance. (c2–g2) Mineral abundance zoomed near the interface. (c3–g3) MgO content in the associated minerals near the interface. (h, h2) Distribution of coesite (SiO2).
Figure 6 provides a similar overview for the case assuming 5:1 (B) with subsystem B moving downward. The same numerical conditions described for the previous case apply for this case as well. This figure, which shows only one time frame soon after the subsystem is mobilized, does not appear to reveal new remarkable features. However, advancing the simulation, a clear effect becomes more evident near the interface. In particular, changes in the chemical and mineralogical properties moving away from the top entry side are quite significant. An animation related to Fig. 6 is best suited to illustrate this point. This movie file and another file for the animation related to Fig. 5 can be downloaded following the link provided in the Supplement. The raw data files, which include all nine oxides for both simulations, are also available online.
Figure 7 summarizes the results of all the 1-D and 2-D numerical test models when the whole system approaches or is close to chemical equilibration. In the static scenario, exemplified by the 1-D models (solid lines), by increasing the initial size of subsystem A, the mineralogical and compositional variations tend to be smaller (see panels c–h and enlarged view around the interface, panels c2–h2). It is the expected behavior since any change is distributed over a larger space of the subsystem. The variations of the mineral abundance in assemblage B (gabbro–eclogite type) instead remain quite independent of the initial size of subsystem A. However, the abundance of the minerals is not necessarily the same found in the initial assemblage. In particular, the amount of garnet, clinopyroxene and coesite is quite different from the amount of these minerals in the initial assemblage. This difference is rather unaffected by the initial proportion of the two assemblages, which has been varied from 1:1 (f=1) to 100:1 (f=100).
The composition of the minerals in assemblage A (e.g., MgO illustrated in panels c3–g3) follows a pattern similar to the mineral abundance. As the size of the initial subsystem increases, MgO tends to approach the oxide amount in the initial composition. A different result is observed for the composition of the minerals in assemblage B. Regardless of whether the mineral abundance changes or remains close to the initial amount, the oxide composition varies quite significantly and in most minerals the difference is larger when f is set to higher values.
When one of the subsystems is allowed to move (2-D models), the general observation in the long run is that the dynamic subsystem tends to preserve the assemblage that enters the model. In this study this assemblage is set to be equal to the initial assemblage. Note that the 2-D data plotted in Fig. 7 refer to a horizontal section of extracted points at the middle vertical distance Dy∕2. When subsystem A is mobile (dotted lines), the behavior of assemblage B is similar to the static case, with some minerals changing their initial abundance: garnet, clinopyroxene, coesite and partly spinel. In the reverse case, with B set as the dynamic subsystem, the mineralogical abundance of A differs from the initial assemblage (dashed lines). But unlike the static cases, no significant variations can be noted with the increase in the initial proportion.
In terms of mineral composition (e.g., MgO, panels c3–g3 in Fig. 7), the dynamic subsystem preserves the composition of the entering assemblage. The immobile assemblage instead shows a compositional variation that is larger than any change observed for the static cases. This variation still somehow remains independent of the initial proportion of the two assemblages, at least with .
Complete data for the bulk composition, which include all nine oxides, are available for three 1-D models and two 2-D simulations following the instructions in the Supplement.
The main objective of this work was to show that a chemically heterogeneous mantle does not necessarily mean that different lithologies are in chemical disequilibrium (at least not entirely).
Often geochemical and petrological interpretations of the Earth interior rely on the achievement of thermodynamic equilibrium on a certain scale. The use of phase equilibrium data and partition coefficients, for example, implies that chemical equilibrium has been achieved and is maintained. Curiously, while this assumption is tacitly imposed on the most convenient dimension to interpret observed data, chemical equilibration is ignored when it comes to discussing the presence or the extent of chemical heterogeneities (i.e., chemical equilibration, in this regard, is considered ineffective) (e.g., Morgan, 2001; Ito and Mahoney, 2005a, b; Strake and Bourdon, 2009; Brown and Lesher, 2014).
Geophysical interpretations usually require the specification of certain properties, such as the density for the Earth materials under consideration. For example, when the density is considered representative of real rock assemblages, the system has to be sufficiently small that the gravitational force is almost completely balanced by the pressure effect (viscous forces are ignored for simplicity), effectively establishing a quasi-static or static condition. Under this condition, thermodynamic equilibrium can be achieved when the system is also equilibrated chemically so that petrological constraints can be applied to determine the density of the assemblage. When different lithologies are considered in geophysical applications, it is assumed that chemical equilibrium is never achieved among them, regardless of the size of the system or the temporal scale. For studies whose conclusions are based on geological processes lasting for hundreds or billions of years, such an assumption should be carefully verified considering that chemical and mass exchange are always effective to a certain extent.
The results from 43 study models (Sect. 2.1) suggest that the imposed condition of thermodynamic equilibrium for the whole system (sum of two subsystems) defines two new assemblages that are not homogenized compositionally or mineralogically, and their equilibrated compositions are different from those in the two initial assemblages. The two new assemblages not only define a condition of chemical equilibrium for the whole system but they also represent the equilibration within each separate subsystem. In addition, mass exchange between these equilibrated assemblages does not progress any further when the initial mass proportion of the two is varied and a new equilibration model is imposed to the newly defined whole system.
The results of the study models have been condensed in a series of parameterized functions that can be used for various applications (Sect. 2.2).
A semiempirical quantitative forward model was also developed to describe the evolution of the chemical equilibration process in the mantle. The model has been restricted to one set of values for the pressure and temperature and one pair of bulk compositions indicative of a peridotite type and a gabbro–eclogite type. The gabbro–eclogite type can be interpreted as a portion of a subduction slab. Ignoring a thin sedimentary layer that could possibly peel off during subduction, a large portion of the slab consists also of a depleted peridotite. Three lithologies (mantle peridotite, gabbro, depleted slab peridotite) can probably also be approached with a chemical equilibration model similar to the one presented here. However, it remains to be seen whether the difference in composition with respect to the generic peridotite assumed in this study would lead to significant new results that would justify the additional modeling effort.
Priority was given here to understanding the influence on the final assemblages of various initial proportions of the two subsystems and, to a limited extent, the effect of the initial compositions. The spatial and temporal evolution necessarily assumes arbitrary units. The reason behind this is that a comprehensive approach to study chemical heterogeneities that would include time-dependent experiments and suitable models for the interpretation of the experimental results has not been developed yet. Experimental data are also necessary to validate certain assumptions that were made to model the composition of the two equilibrated assemblages (Sect. 2).
The choice made to describe the variation of G(*) using the transport model presented in Sects. 3 and 4 may seem rather arbitrary. While details of the transition towards chemical equilibration should be investigated by experimental studies, the main point of the models in Sects. 3 and 4 (and of this study) is to show that different lithologies can evolve while preserving distinct chemical and mineralogical features. The idea of using the concept of local Gibbs free energy variations over time and space (Kondepudi and Prigogine, 1998) to describe the chemical changes is a practical means to simplify a problem that otherwise becomes intractable for complex systems. The choice is not a complete abstraction; it is approximately based on the consideration that the mass exchange is not governed by the compositional gradient but by the differences in the chemical potential of the various components in the various phases (e.g., Denbigh, 1971). Ultimately, only extensive experimental studies could determine whether the simple evolution model for G(*) applied in this work to a heterogeneous system can be considered a reasonable approximation for describing the chemical evolution in practical geodynamic mantle models.
Two aspects of the numerical applications presented in the previous sections perhaps deserve further consideration. The assumption made for the composition of the entering assemblage in the 2-D models perhaps should be reconsidered in future studies. The other consideration concerns the boundary condition imposed on the opposite side of the interface between the two assemblages. The assumption is that the whole system is either close to mass exchange or mirror images exist outside the boundary limits. From a geological perspective the first scenario is probably the more difficult to realize. On the other hand, the possibility that periodic repetitions of the same model structure are replicated over a large portion of the mantle, if not the entire mantle, seems more reasonable. Assuming that the timescale is somehow constrained, an investigation of the temporal evolution would still require some kind of assessment of the periodic distribution of the thermodynamic system as a whole.
The 2-D simulations in which one of the assemblages is allowed to move have shown that in the long run the mineralogical abundance and compositional variations are approximately independent of the size of the two subsystems. This observation suggests the possibility of implementing large geodynamic models with evolving petrological systems once the temporal and spatial scale of the chemical changes have been constrained.
At the moment the spatial and temporal variations are arbitrarily defined, but this study shows that the petrological and mineralogical changes may still be approximately quantified, at least at the P–T conditions that have been considered. It would be useful, for example, to select a few bulk compositions for the two subsystems and apply them to the dynamic equilibrium melting (DEM) and dynamic fractional melting (DFM) models that have been developed combining 1-D multiphase flow with AlphaMELTS (Tirone and Sessing, 2017; Tirone, 2018). Perhaps even a simplified model for nonequilibrium fractional crystallization could be applied to try to reproduce observed 3-D chemical zoning in minerals and multicomponent chemical zoning in melts (Tirone et al., 2016). More in general the results should be compared with existing data on melt products and residual solids observed in various geological settings to investigate indirectly, but from a quantitative perspective, the presence of chemical heterogeneities in the mantle should be taken into account. It also becomes possible to determine the variation of physical properties, such as bulk density, and relate them to certain observables, such as seismic velocities. At least on a relative scale, the effect of the compositional variations could be associated with seismic velocity variations, providing in this way more indirect evidence of heterogeneities in the mantle based on a quantitative forward description.
Selected data are available in the Supplement.
The supplement related to this article is available online at: https://doi.org/10.5194/se-10-1409-2019-supplement.
The author declares that there is no conflict of interest.
Thanks to Paula Antoshechkina for taking the time to answer many questions regarding the use of AlphaMELTS (version 1.7) and for fixing on-the-fly minor issues of the program. The commitment of Topical Editor Mike Heap has been truly appreciated. Nothing but sincere appreciation goes to Topical Editor Mike Heap for the hard work he put into handling the review process. Three anonymous reviewers helped to clarify several points in the paper. The work was carried out while visiting the Department of Mathematics and Geosciences at the University of Trieste, Italy. This study was part of a larger comprehensive project aiming to investigate chemical heterogeneities in the mantle by providing a first set of experimental data to determine the kinetics of the equilibration process, establishing a modeling procedure and developing geodynamic numerical applications.
This paper was edited by Michael Heap and reviewed by three anonymous referees.
Ballmer, M. D., Schmerr, N. C., Nakagawa, T., and Ritsema, J.: Compositional mantle layering revealed by slab stagnation at ∼1000-km depth, Science Advances, 1, e1500815, https://doi.org/10.1126/sciadv.1500815, 2015. a
Ballmer, M. D., Houser, C., Hernlund, J. W., Wentzcovitch, R. M., and Hirose, K.: Persistence of strong silica-enriched domains in the Earth's lower mantle, Nat. Geosci., 10, 236–240, https://doi.org/10.1038/ngeo2898, 2017. a
Berman, R. G.: Internally-consistent thermodynamic data for minerals in the system Na2O-K2O-CaO-MgO-FeO-Fe2O3-Al2O3-SiO2-TiO2-H2O-CO2, J. Petrol., 29, 445–552, 1988. a
Blusztajn, J., Shimizu, N., Warren, J. M., and Dick, H. J. B.: In-situ Pb isotopic analysis of sulfides in abyssal peridotites: New insights into heterogeneity and evolution of the oceanic upper mantle, Geology, 42, 159–162, https://doi.org/10.1130/G34966.1, 2014. a
Brandenburg, J. P., Hauri, E. H., van Keken, P. E., and Ballentine, C. J.: A multiple-system study of the geochemical evolution of the mantle with force-balanced plates and thermochemical effects, Earth Planet. Sc. Lett, 276, 1–13, 2008. a
Brown, E. L. and Lesher, C. E.: North Atlantic magmatism controlled by temperature, mantle composition and buoyancy, Nat. Geosci., 7, 820–824, https://doi.org/10.1038/ngeo2264, 2014. a
Christensen, U. R. and Hofmann, A. W.: Segregation of subducted oceanic crust in the convecting mantle, J. Geophys. Res., 99, 19867–19884, 1994. a
de Capitani, C. and Petrakakis, K.: The computation of equilibrium assemblage diagrams with Theriak/Domino software, Am. Mineral., 95, 1006–1016, 2010. a
Denbigh, K.: The principles of chemical equilibrium, 3rd Edn., Cambridge, Cambridge University Press, 494 pp., 1971. a, b, c, d
Dobson, D. P. and Mariani, E.: The kinetics of the reaction of majorite plus ferropericlase to ringwoodite: Implications for mantle upwellings crossing the 660 km discontinuity, Earth Planet. Sc. Lett., 408, 110–118, 2014. a
Douglas Jr., J.: On the Numerical Integration of by Implicit Methods, J. Soc. Ind. Appl. Math., 3, 42–65, 1955. a
Duesterhoeft, E. and de Capitani, C.: TheriakD: An add-on to implement equilibrium computations in geodynamic models, Geochem. Geophy. Geosy., 14, 4962–4967, https://doi.org/10.1002/ggge.20286, 2013. a
Fisher, G. W.: Nonequilibrium thermodynamics as a model for diffusion-controlled metamorphic processes, Am. J. Sci., 273, 897–924, 1973. a
Gardés, E., Wunder, B., Wirth, R., and Heinrich, W.: Growth of multilayered polycrystalline reaction rims in the MgO-SiO2 system, part I: experiments, Contrib. Mineral. Petr., 161, 1–12, 2011. a, b
Ghiorso, M. S.: Chemical mass transfer in magmatic processes I. Thermodynamic relations and numerical aigoritlims, Contrib. Mineral. Petr., 90, 107–120, 1985. a
Ghiorso, M. S.: A globally convergent saturation state algorithm applicable to thermodynamic systems with a stable or metastable omni-component phase, Geochim. Cosmochim. Ac., 103, 295–300, 2013. a
Ghiorso, M. S. and Carmichael, S. E. : A Regular Solution Model for Met-Aluminous Silicate Liquids: Applications to Geothermometry, Immiscibility, and the Source Regions of Basic Magmas, Contrib. Mineral. Petr., 71, 323–342, 1980. a
Ghiorso, M. S. and Sack, R. O.: Chemical mass transfer in magmatic processes IV. A revised and internally consistent thermodynamic model for the interpolation and extrapolation of liquid-solid equilibria in magmatic systems at elevated temperatures and pressures, Contrib. Mineral. Petr., 119, 197–212, 1995. a
Ghiorso, M. S., Hirschmann, M. M., Reiners, P. W., and Kress III, V. C.: The pMELTS: A revision of MELTS for improved calculation of phase relations and major element partitioning related to partial melting of the mantle to 3 GPa, Geochem. Geophy. Geosy., 3, 1–35, https://doi.org/10.1029/2001GC000217, 2002. a
Gurnis, M. and Davies, G. F.: The effect of depth-dependent viscosity on convective mixing in the mantle and the possible survival of primitive mantle, Geophys. Res. Lett., 13, 541–544, 1986. a
Helffrich, G.: Heterogeneity in the mantle-its creation, evolution and destruction, Tectonophysics, 416, 23–31, 2006. a
Hofmann, A. W. and Hart, S. R.: An assessment of local and regional isotopic equilibrium in the mantle, Earth Planet. Sc. Lett., 38, 44–62, 1978. a
Holland, T. J. B. and Powell, R.: An improved and extended internally consistent thermodynamic dataset for phases of petrological interest, involving a new equation of state for solids, J. Metamorph. Geol., 29, 333–383, 2011. a
Huang, J. and Davies, G. F.: Stirring in three-dimensional mantle convection models and implications for geochemistry: Passive tracers, Geochem. Geophy. Geosy., 8, Q03017, https://doi.org/10.1029/2006GC001312, 2007. a
Ito, G. and Mahoney, J.: Flow and melting of a heterogeneous mantle: 1. Importance to the geochemistry of ocean island and mid-ocean ridge basalts, Earth Planet. Sc. Lett., 230, 29–46, 2005a. a
Ito, G. and Mahoney J.: Flow and melting of a heterogeneous mantle: 2. Implications for a non-layered mantle, Earth Planet. Sc. Lett., 230, 47–63, 2005b. a
Iwamori, H. and Nakamura, H.: Isotopic heterogeneity of oceanic, arc and continental basalts and its implications for mantle dynamics, Gondwana Res., 27, 1131–1152, 2014. a
James, F.: MINUIT: Function Minimization and Error Analysis, CERN Program Libr. Long Writeup D506, version 94. 1, Geneva: CERN, 1994. a, b
Joesten, R.: Evolution of mineral assemblage zoning in diffusion metasomatism, Geochim. Cosmochim. Ac., 41, 649–670, 1977. a
Kellogg, L. H.: Mixing in the mantle, Annu. Rev. Earth Planet. Sc., 20, 365–388, 1992. a
Kellogg, L. H. and Turcotte, D. L.: Homogenization of the mantle by convective mixing and diffusion, Earth Planet. Sc. Lett., 81, 371–378, 1987. a
Kogiso, T., Hirschmann, M. M., and Reiners, P. W.: Length scales of mantle heterogeneities and their relationship to ocean island basalt geochemistry, Geochim. Cosmochim. Ac., 68, 345–360, 2004. a
Kondepudi, D. and Prigogine, I.: Modern Thermodynamics, 1st Edn., John Wiley and Sons Ltd, UK, 486 pp., 1998. a, b, c, d
Li, Y., Deschamps, F., and Tackley, P. J.: The stability and structure of primordial reservoirs in the lower mantle: insights from models of thermochemical convection in three-dimensional spherical geometry, Geophys. J. Int., 199, 914–930, 2014. a
Markl, G., Foster, C. T., and Bucher, K.: Diffusion-controlled olivine corona textures in granitic rocks from Lofoten, Norway: calculation of Onsager diffusion coefficients, thermodynamic modelling and petrological implications, J. Metamorph. Geol., 16, 607–623, 1998. a
Milke, R., Dohmen, R., Becker, H. W., and Wirth, R.: Growth kinetics of enstatite reaction rims studied on nano-scale, Part I: Methodology, microscopic observations and the role of water, Contrib. Mineral. Petr., 154, 519–533, 2007. a
Morgan, J. P.: Thermodynamics of pressure release melting of a veined plum pudding mantle, Geochem. Geophy. Geosy., 2, 2000GC000049, https://doi.org/10.1029/2000GC000049, 2001. a
Mundl, A., Touboul, M., Jackson, M. G., Day, J. M. D., Kurz, M. D., Lekic, V., Helz, R. T., and Walker, R. J.: Tungsten-182 heterogeneity in modern ocean island basalts, Science, 356, 66–69, 2017. a
Nishi, M., Kubo, T., Kato, T., Tominaga, A., Funakoshi, K., and Higo, Y.: Exsolution kinetics of majoritic garnet from clinopyroxene in subducting oceanic crust, Earth Planet. Sc. Lett., 189, 47–55, 2011. a
Nishiyama, T.: Steady diffusion model for olivine-plagioclase corona growth, Geochim. Cosmochim. Ac., 47, 283–294, 1983. a
Ozawa, H., Hirose, K., Mitome, M., Bando, Y., Sata, N., and Ohishi, Y.: Experimental study of reaction between perovskite and molten iron to 146 GPa and implications for chemically distinct buoyant layer at the top of the core, Phys. Chem. Miner., 36, 355–363, 2009. a
Peaceman, D. W. and Rachford Jr., H. H.: The Numerical Solution of Parabolic and Elliptic Differential Equations, J. Soc. Ind. Appl. Math., 3, 28–41, 1955. a
Piazzoni, A. S., Steinle-Neumann, G., Bunge, H. P., and Dolejs̆, D.: A mineralogical model for density and elasticity of the Earth's mantle, Geochem. Geophy. Geosy., 8, Q11010, https://doi.org/10.1029/2007GC001697, 2007. a
Poirier, J. P.: Introduction to the physics of the Earth's Interior, 2nd Edn., Cambridge University Press, UK, 312 pp., 2000. a
Press, W. H., Teukolsky, S. A., Vetterling, W. T., and Flannery, B. P.: Numerical Recipes in Fortran 77: The Art of Scientific Computing, 2nd Edn. (reprinted), Cambridge Univ. Press, Cambridge, 933 pp., 1997. a
Prigogine, I. and Defay, R.: Chemical thermodynamics, 1st Edn., London: Longmans, Green and co. Ltd, 543 pp., 1954. a, b, c, d
Ricard, Y., Richards, M., Lithgow-Bertelloni, C., and Le Stunff, Y.: A geodynamic model of mantle density heterogeneity, J. Geophys. Res., 98, 21895–21909, https://doi.org/10.1029/93JB02216, 1993. a
Rubie, D. C. and Ross II, C. R.: Kinetics of the olivine-spinel transformation in subducting lithosphere: experimental constraints and implications for deep slab processes, Phys. Earth Planet. In., 86, 223–241, 1994. a
Saxena, S. K.: Earth mineralogical model: Gibbs free energy minimization computation in the system MgO-FeO-SiO2, Geochim. Cosmochim. Ac., 60, 2379–2395, 1996. a
Schubert, G., Turcotte, D. L., and Olson, P.: Mantle convection in the Earth and planets, 1st Edn., Cambridge University Press, UK, 940 pp., 2001. a
Smith, P. M. and Asimow, P. D.: Adiabat_1ph: A new public front-end to the MELTS, pMELTS, and pHMELTS models, Geochem. Geophy. Geosy., 6, Q02004, https://doi.org/10.1029/2004GC000816, 2005. a
Smith, W. R. and Missen, R. W.: Chemical reaction equilibrium analysis: theory and algorithms, 1st Edn. (reprint), Malabar: Krieger Publishing Company, 364 pp., 1991. a, b, c
Stixrude, L. and Lithgow-Bertelloni, C.: Thermodynamics of mantle minerals I. physical properties, Geophys. J. Int., 162, 610–632, 2005. a
Stracke, A. and Bourdon, B.: The importance of melt extraction for tracing mantle heterogeneity, Geochim. Cosmochim. Ac., 73, 218–238, 2009. a
Tackley, P. and Xie, S.: The thermochemical structure and evolution of Earth's mantle: constraints and numerical models, Philos. T. R. Soc. S.-A, 360, 2593–2609, 2002. a
Tannehill, J. C., Anderson, D., and Pletcher, R. H.: Computational Fluid Mechanics and Heat Transfer, 2nd Edn., Taylor and Francis, Levittown, 792 pp., 1997. a, b
Tesoniero, A., Cammarano, F., and Boschi, L.: S-to-P heterogeneity ratio in the lower mantle and thermo-chemical implications, Geochem. Geophy. Geosy., 17, 2522–2538, https://doi.org/10.1002/2016GC006293, 2016. a
Tirone, M.: Petrological Geodynamics of Mantle Melting II. AlphaMELTS + Multiphase Flow: Dynamic Fractional Melting, Front. Earth Sci., 6, 18, https://doi.org/10.3389/feart.2018.00018, 2018. a
Tirone, M. and Sessing, J.: Petrological Geodynamics of Mantle Melting I. AlphaMELTS + Multiphase Flow: Dynamic Equilibrium Melting, Method and Results, Front. Earth Sci., 5, 81, https://doi.org/10.3389/feart.2017.00081, 2017. a
Tirone, M., Buhre, S., Schmück, H., and Faak, K.: Chemical Heterogeneities in the Mantle: the Equilibrium Thermodynamic Approach, Lithos, 244, 140–150, https://doi.org/10.1016/j.lithos.2015.11.032, 2015. a, b
Tirone, M., Rokitta, K., and Schreiber, U.: Thermochronological evolution of intra-plate magmatic crystallization inferred from an integrated modeling approach: a case study in the Westerwald, Germany, Lithos, 260, 178–190, https://doi.org/10.1016/j.lithos.2016.05.008, 2016. a
Tommasi, A. and Vauchez, A.: Heterogeneity and anisotropy in the lithospheric mantle, Tectonophysics, 661, 11–37, 2015. a
Trampert, J., Deschamps, F., Resovsky, J., and Yuen, D.: Probabilistic Tomography Maps Chemical Heterogeneities Throughout the Lower Mantle, Science, 306, 853–856, 2004. a
van der Hilst, R. D., Widlyantoro, S., and Engdahl, E. R.: Evidence for deep mantle circulation from global tomography, Nature, 386, 578–584, 1997. a
van Keken P. E. and Ballentine, C. J.: Whole-mantle versus layered mantle convection and the role of a high-viscosity lower mantle in terrestrial volatile evolution, Earth Planet. Sc. Lett., 156, 19–32, 1998. a
van Keken, P. E., Hauri, E. H., and Ballentine, C. J.: Mantle mixing: The Generation, Preservation, and Destruction of Chemical Heterogeneity, Annu. Rev. Earth Planet. Sc., 30, 493–525, 2002. a, b
van Zeggeren, F. and Storey, S. H.: The computation of chemical equilibrium, 1st Edn., 176 pp., Cambridge University Press, UK, 1970. a
Walzer, U. and Hendel, R.: A new convection-fractionation model for the evolution of the principal geochemical reservoirs of the Earth's mantle, Phys. Earth Planet. In., 112, 211–256, 1999. a
Zhao, C., Garnero, E. J., McNamara, A. K., Schmerr, N., and Carlson, R. W.: Seismic evidence for a chemically distinct thermochemical reservoir in Earth's deep mantle beneath Hawaii, Earth Planet. Sc. Lett., 426, 143–153, 2015. a
Zhong, S.: Constraints on thermochemical convection of the mantle from plume heat flux, plume excess temperature, and upper mantle temperature, J. Geophys. Res., 111, B04409, https://doi.org/10.1029/2005JB003972, 2006. a
- Abstract
- Introduction
- Modeling chemical equilibration between two assemblages
- Application to the evolution of a 1-D static model with variable extension
- Application to the evolution of a 2-D model with one dynamic assemblage and variable extension
- Summary of the 1-D and 2-D models approaching chemical equilibration
- Conclusions
- Data availability
- Competing interests
- Acknowledgements
- Review statement
- References
- Supplement


