the Creative Commons Attribution 4.0 License.
the Creative Commons Attribution 4.0 License.
 | 21 Nov 2019
Density distribution across the Alpine lithosphere constrained by 3-D gravity modelling and relation to seismicity and deformation
Magdalena Scheck-Wenderoth
Hans-Jürgen Götze
Jörg Ebbing
György Hetényi
the AlpArray Working Group
The Alpine orogen formed as a result of the collision between the Adriatic and European plates. Significant crustal heterogeneity exists within the region due to the long history of interplay between these plates, other continental and oceanic blocks in the region, and inherited crustal features from earlier orogenies. Deformation relating to the collision continues to the present day. Here, a seismically constrained, 3-D structural and density model of the lithosphere of the Alps and their respective forelands, derived from integrating numerous geoscientific datasets, was adjusted to match the observed gravity field. It is shown that the distribution of seismicity and deformation within the region correlates well to thickness and density changes within the crust, and that the present-day Adriatic crust is both thinner and denser (22.5 km, 2800 kg m−3) than the European crust (27.5 km, 2750 kg m−3). Alpine crust derived from each respective plate is found to show the same trend, with zones of Adriatic provenance (Austro-Alpine unit and Southern Alps) found to be denser and those of European provenance (Helvetic zone and Tauern Window) to be less dense. This suggests that the respective plates and related terranes had similar crustal properties to the present-day ones prior to orogenesis. The model generated here is available for open-access use to further discussions about the crust in the region.
- Article
(3190 KB) - Full-text XML
- BibTeX
- EndNote


The Alps are one of the best-studied mountain ranges in the world, yet significant unknowns remain regarding their crustal structure and links that may exist between the localisation of deformation and seismicity in the region and crustal heterogeneity. Significant amounts of seismicity and deformation correspond to plate dynamics, such as at the convergence of the European and Adriatic plates in north-east Italy (Restivo et al., 2016) where the Adriatic plate is observed to act as a rigid indenter, moving northwards and rotating anticlockwise against the weaker European plate (Nocquet and Calais, 2004; Vrabec and Fodor, 2006; Serpelloni et al., 2016). However, numerous large historic seismic events (Fäh et al., 2011; Stucchi et al., 2012; Grünthal et al., 2013), such as the magnitude 6.6 Basel earthquake in 1356 CE, lie substantially intra-plate in areas with low amounts of horizontal surface strain (Sánchez et al., 2018) suggesting that possible inherited features within the crust are also significant factors to their localisation.
Crustal heterogeneities in the European plate, constituting the northern foreland of the Alps, principally derive from different terranes that collided during the Carboniferous age Variscan orogeny (Franke, 2000). Collision during orogenesis resulted in the juxtaposition of crustal domains with differing properties next to one another, such as the Moldanubian and Saxothuringian zones (Babuška and Plomerová, 1992; Freymark at al., 2016), and also resulted in the creation of the Vosges, Black Forest, and Bohemian massifs. The locations of all relevant tectonic features within the region can be found in Fig. 1a.

Figure 1(a) Topography and bathymetry from Etopo 1 (Amante and Eakins, 2009) shown across the Alpine region with the key tectonic features overlaid. Study area is indicated with a black box. The line a–a' represents the cross section in Fig. 3. Solid black lines demark the boundaries of the non-deformed European and Adriatic plates; the location of the Apennine plate is also marked. Dashed black lines indicate different geological domains (St – Saxothuringian Zone; Mn – Moldanubian Zone; Aa – Austro-Alpine unit; Ha – Helvetic Alps; Pa – Penninic Alps; Sa – Southern Alps). Dotted black lines indicate the extent of other tectonic features within these domains (bo – Bohemian Massif; vo – Vosges Massif; bf – Black Forest Massif; tw – Tauern Window; bt – Briançonnais Terrane; iz – Ivrea Zone). Yellow areas bound by a solid grey line indicate the extent of sedimentary basins (urg – Upper Rhine Graben; mb – Molasse Basin; po – Po Basin). (b) Input data source extents: Upper Rhine Graben gravity-constrained model (Freymark et al., 2017); Molasse Basin gravity-constrained model (Przybycin et al., 2015); TRANSALP gravity-constrained model (Ebbing, 2002); Po Basin seismically constrained models (Turini et al., 2014; Molinari et al., 2015); and seismic sections (IESG, 1978; IESG and ETH Zuerich, 1981; Strößenreuther, 1982; Mechie et al., 1983; Zucca, 1984; Gajewski and Prodehl, 1985, 1987; Deichmann et al., 1986; Gajewski et al., 1987; Yan and Mechie, 1989; Zeis et al., 1990; Aichroth et al., 1992; Guterch et al., 1994; Ye et al., 1995; Scarascia and Cassinis, 1997; Enderle et al., 1998; Bleibinhaus and Gebrande, 2006; Brückl et al., 2007; Hetényi et al., 2018a).
As a consequence of the collision of the Adriatic plate with the European plate from the Cretaceous until the present (Handy et al., 2010), heterogeneity within the Alpine orogen is also very pronounced; however, different interpretations exist on the plate provenance of some features. Traditionally, the Alps have been split into distinct zones according to their plate of origin and metamorphic history, such as the Adriatically derived Austro-Alpine unit and Southern Alps, the European-derived Helvetic Alps, and the Penninic zone representing distal margin units and slivers of oceanic crust (Schmid et al., 1989). The Briançonnais crustal block that lies within the Penninic zone derives from the Iberian plate (Frisch, 1979). More recent work examining the plate provenance of Alpine zones has reinterpreted some features such as the Tauern Window from having a Penninic origin to a European plate one (Schmid et al., 2004).
Density distribution throughout the lithosphere of the region is also affected by mantle features and sedimentary depocentres. The three main depocentres within the region are the Po Basin of the southern foreland, the Molasse Basin of the northern foreland and the Upper Rhine Graben, also within the northern foreland, that formed as part of the European Cenozoic Rift System in the Eocene (Dèzes at el., 2004). Anomalously high densities within the crust are present in the Western Alps, in the Ivrea Zone, and along its subsurface continuation to the south to the Ligurian Sea, as a result of a south-east-dipping mantle wedge, where mantle and lower-crustal rocks are present at upper-crustal depths (Zingg et al., 1990) and even at the surface (Pistone et al., 2017, and references therein).
Previous published interpretations of crustal features within the orogen have been primarily based upon 2-D seismic sections (e.g. Brückl et al., 2007), tending to result in simple models. However, lateral differences in crustal structure have been demonstrated, even at short wavelength, for example through the deployment of parallel seismological profiles, spaced 15 km apart across the Eastern Alps (Hetényi et al., 2018a), indicating the need for more complex models. Studies that have integrated multiple geoscientific datasets to create 3-D models of the region have either focussed on smaller subsections of the Alps (Ebbing, 2002; Ebbing et al., 2006) or included the Alps as part of a much larger study area (e.g. Tesauro et al., 2008). Therefore the generation of a 3-D, crustal-scale, gravity-constrained, structural model of the Alps and their forelands at an appropriate resolution could be used to more accurately describe crustal heterogeneity in the region. The generation of such an Alpine-wide specific model is made possible by the existence of seismological results from numerous published deep seismic surveys (e.g. IESG and ETH Zuerich, 1981; Gajewski and Prodehl, 1985; Yan and Mechie, 1989; Ye et al., 1995; Brückl et al., 2007) that have been completed throughout the region and available high-quality global gravity field models (e.g. Förste et al., 2014). Within this current work, such data are integrated in a common frame to give insights into the distribution of densities within the crust as constrained by 3-D gravity modelling across the vast majority of the Alpine region and its forelands for the first time, so that questions about the relationship between the distribution of densities within the crust and seismicity and deformation patterns can be addressed.
Existing geological and geophysical observations from previous published work about the Alps and their respective forelands were used as constraints for the generation of the 3-D structural model. Topography and bathymetry were utilised unaltered from ETOPO1 (Amante and Eakins, 2009), as shown in Fig. 1a. The data integrated to constrain subsurface lithospheric features are shown in Fig. 1b and include regional-scale, gravitationally and seismically constrained models of the TRANSALP study area (Ebbing, 2002), the Molasse Basin (Przybycin et al., 2014) and the Upper Rhine Graben (Freymark et al., 2017); regional-scale, seismically constrained models of the Po Basin, such as MAMBo (Turrini at al., 2014; Molinari et al., 2015); and seismic reflection or conversion depths and their associated P wave velocity from projects such as ALP'75, EGT'86, TRANSALP, ALP 2002, and EASI (IESG, 1978; IESG and ETH Zuerich, 1981; Strößenreuther, 1982; Mechie et al., 1985; Zucca, 1984; Gajewski and Prodehl, 1985, 1987; Deichmann et al., 1986; Gajewski et al., 1987; Yan and Mechie, 1989; Zeis et al., 1990; Aichroth et al., 1992; Guterch et al., 1994; Ye et al., 1995; Scarascia and Cassinis, 1997; Enderle et al., 1998; Bleibinhaus and Gebrande, 2006; Brückl et al., 2007; Hetényi et al., 2018a). The Lithosphere-Asthenosphere Boundary (LAB) was utilised unaltered from Geissler (2010), which was obtained by S receiver functions of teleseismic events.
Constraining data coverage for most subsurface lithospheric features was sufficient; however, thicknesses of unconsolidated sediments were not available across the full modelled region. In regions of less dense data coverage, continental-scale, seismically constrained, integrative best-fit models EuCRUST-07 and EPcrust (Tesauro et al., 2008; Molinari and Morelli, 2011) were also used. Both models provided complete coverage of major structural interfaces and P wave velocities over the whole modelled area at a coarse resolution. Detailed values of unconsolidated sediment thicknesses were only available for the Upper Rhine Graben, the Molasse Basin, and the Po Basin, as the seismic sections utilised lacked the resolution for shallower features and the continental-scale models did not differentiate between sedimentary strata.
The free-air anomaly used was calculated from the global gravity model EIGEN-6C4 using the ICGEM calculation service (Förste et al., 2014; Ince et al., 2019), at a fixed height of 6 km above the datum (Fig. 2, further referred to as observed gravity). As the gravity data source is a hybrid terrestrial and satellite dataset, the potential exists for it to be lacking some of the short wavelength response that a fully terrestrial dataset would possess. The fixed height of 6 km was utilised to account for this, so that the vertical component of the gravity response from the generated regional structural model (further referred to as calculated gravity) and observed gravity can be directly compared during the gravity modelling process.
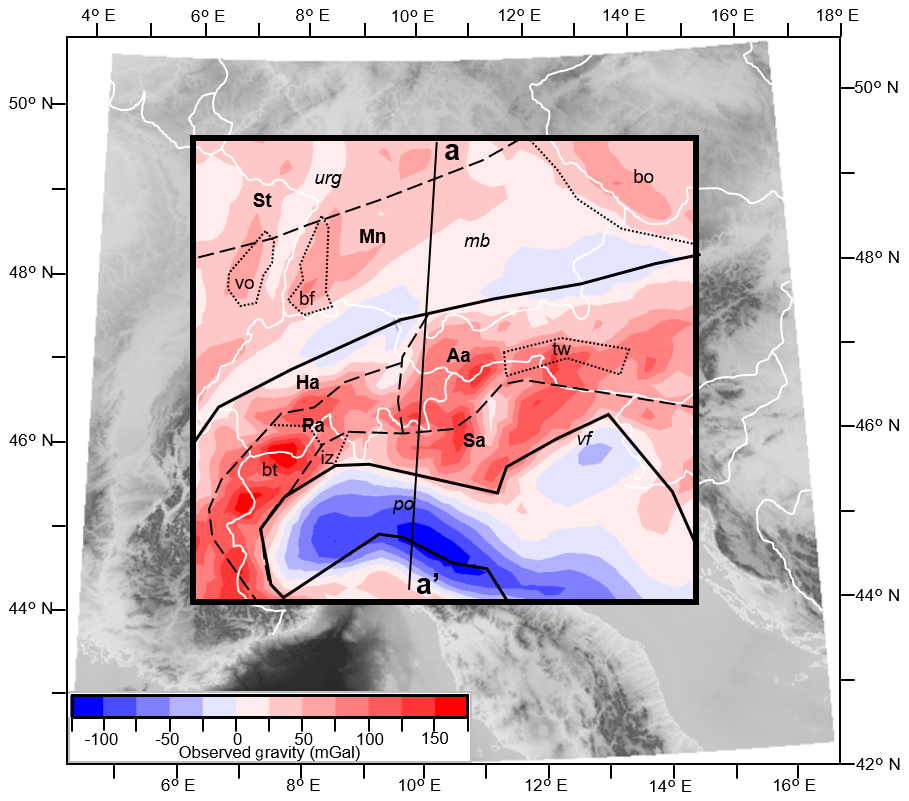
Figure 2Observed gravity of the region. Values calculated from a spherical approximation at 6 km above datum of EIGEN-6C4 global gravity model (Förste et al., 2014) using the ICGEM calculation service (Ince et al., 2019). The line a–a' represents the cross section in Fig. 3. Locations of key tectonic features are overlaid (definitions shown in Fig. 1a caption).
Data from numerous existing geoscientific datasets (see “Input data” section) were integrated to create a gravity-constrained, 3-D, structural and density model of the lithosphere of the Alps and their respective forelands. The study area of this work, indicated in both Figs. 1a and b, focuses on a region of 660 km × 620 km where the highest density of constraining data coverage was compiled. The vast majority of the Alps and their forelands are included, with the Central and Eastern Alps and the northern foreland being the best-covered regions.
The software package Petrel (Schlumberger, 1998) was used for the creation and visualisation of the modelled surfaces in 3-D, representing the key structural and density contrasts within the region. These surfaces were (1) top water; (2) top unconsolidated sediments; (3) top consolidated sediments; (4) top upper crust; (5) top lower crust; (6) top lithospheric mantle; and (7) top asthenospheric mantle. All surfaces were generated with a grid resolution of 20 km × 20 km using Petrel's convergent interpolation algorithm.
The above-mentioned model layers were generated by correlation and integration between data sources, with the exception of the following: (1) the water layer was generated from cropping ETOPO1 to 0 m a.s.l., and no freshwater bodies were added as they are too small to be of impact at the model resolution utilised; (2) the top unconsolidated sediment surface used in the modelling corresponds to topography and bathymetry, which is plotted in Fig. 1a; (3) as a result of unconsolidated sediment thicknesses from the data sources only being present in the Upper Rhine Graben, the Molasse Basin, and the Po Basin, outside of these regions a thickness of 0 was used (this was deemed acceptable because unconsolidated sediment thicknesses are not large enough as to be of impact at the model resolution, outside these regions); (4) the LAB was used unedited from the data source, in spite of its low resolution as it does not represent a significant density contrast. Alpine nappe stacks were included within the consolidated sediments layer of the model.
During correlation and integration, a hierarchy of data source types was used and in the case of contradiction between the different data sources, those of the highest hierarchy were accepted. The hierarchy was derived from the quality, resolution, and consistency of data sources and was as follows: (1) regional-scale, gravitationally and seismically constrained models; (2) regional-scale, seismically constrained models; (3) individual seismic reflection surfaces and interpreted sections; (4) continental-scale, seismically constrained, integrative best-fit models.
No subduction interfaces were modelled, as multiple studies within the region have shown that the effect of different subduction polarities as well as the presence or lack of subducting plates is small. Previous 2-D gravity modelling across the TRANSALP profile has demonstrated that the differences in gravity response between a model of both different subduction polarities and a model setup with no subducted crust were negligible (Deutsch, 2014). Lowe (2019) showed that the contribution of subducting slabs in the region to the gravity field is relatively small (in the range of 30 mGal).
The 3-D gravity modelling software IGMAS+ (Schmidt et al., 2010) was used, which operates by creating triangulated meshes between points on input surfaces and vertical parallel planes, around a body of homogenous density, to calculate their volumetric contribution to the gravity response. Gravity in the model was calculated at 6 km above the datum to be concurrent with the observed gravity. In this way, the short wavelength response of the calculated gravity was not overestimated as mentioned before. The top of the model was also set to a height of 6 km with a density of 0 used to represent the column of air between it and topography. To account for the edge effect of the gravity field, the model was extended by ∼50 % (330 km) in all horizontal directions of the studied area using the surfaces from EuCrust-07 (Tesauro et al., 2008).
The free-air gravity response was used because this work is focussed on the crustal composition of the Alpine region, and considering that up to 4.8 km of crust lies above sea level within the modelled area, removing this from the gravity signal was deemed unacceptable. Additionally, the complex geological setting of the Alps implies that the removal of Alpine topography as a Bouguer slab of homogenous density would potentially introduce errors.
The process of gravity modelling involved the modification of an initial 3-D structural model, comprising surface heights and densities, such that through multiple iterations the resulting model produced a gravity field similar to the observed one. Best practice of such an iterative process allows only one input parameter (density or surface heights) to be altered. Here, the surfaces generated as part of the integration work were not modified during the gravity modelling process as they were better constrained than the densities, leaving only density as a free parameter.
For the calculation of the densities used in the initial structural model, P wave velocities from seismic data sources were converted using the experimentally derived empirical relationship detailed in Brocher (2005). In the absence of seismic data, P wave velocities from the continental-scale models listed in the “Input data” section were used to supplement this, giving coverage over the entire study area. Densities of 1025 and 3320 kg m−3 were assigned to the water layer and the asthenospheric mantle, respectively.
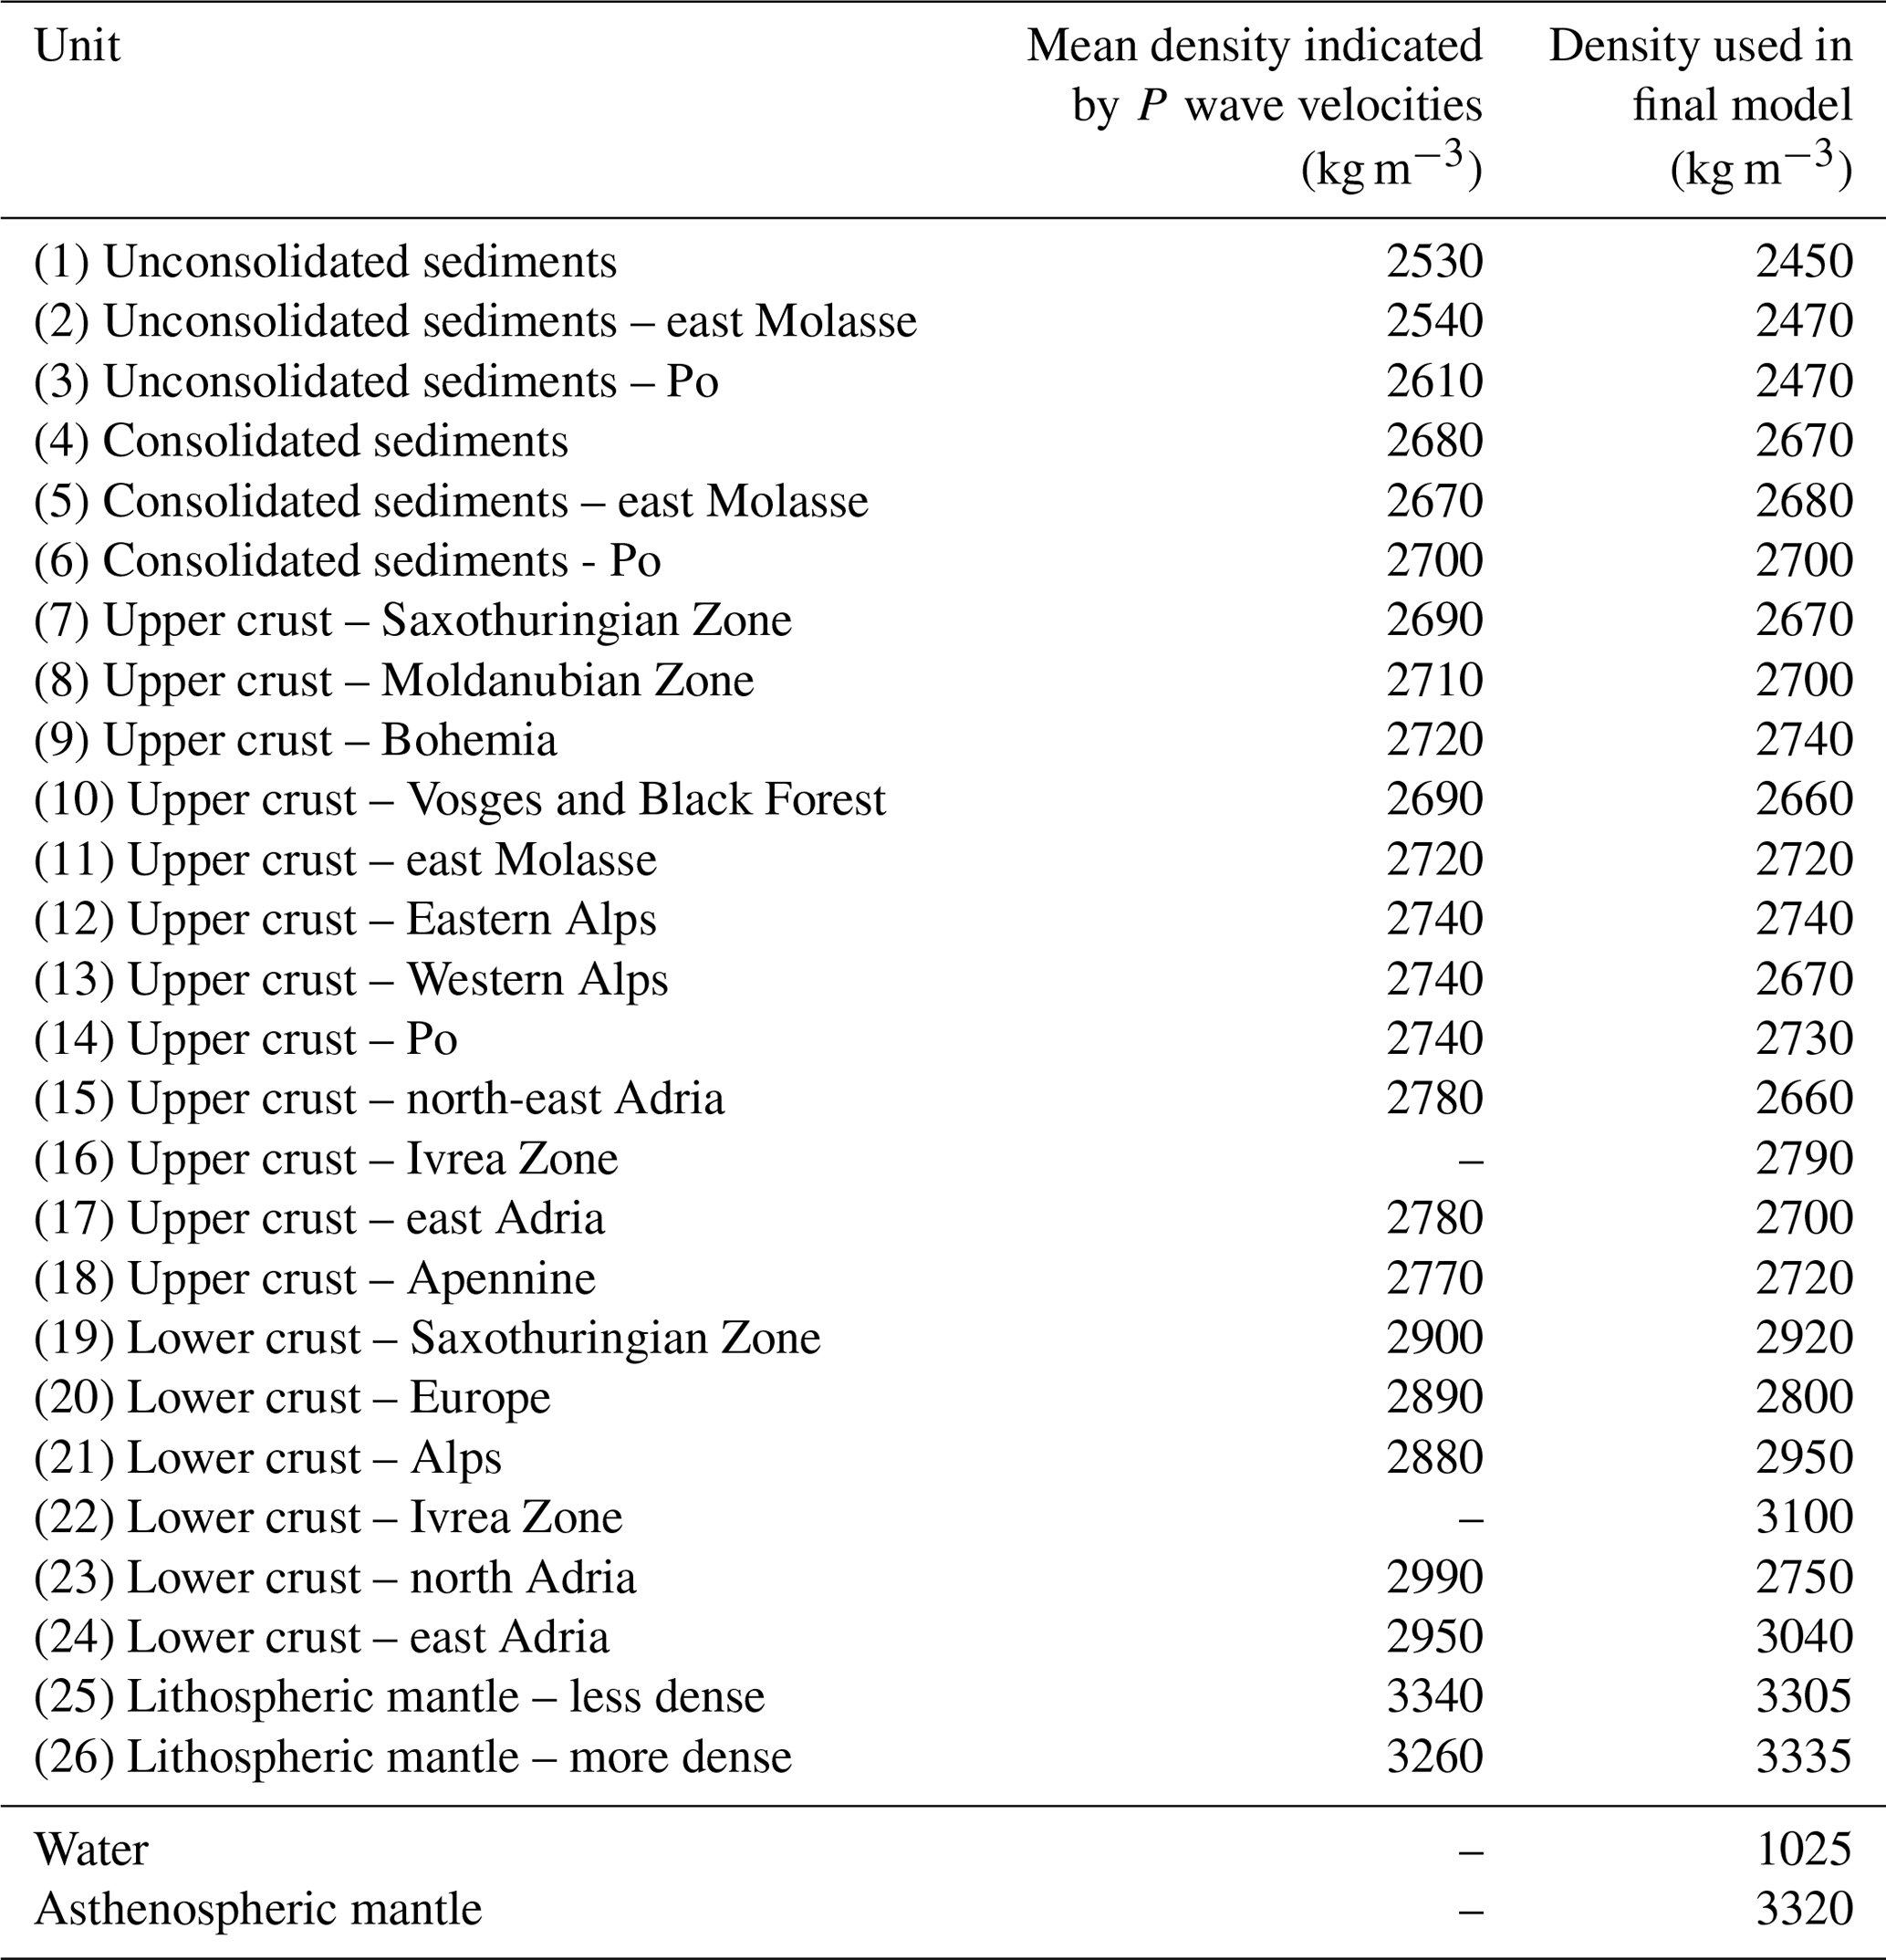
The densities derived from the P wave velocity conversions were then used in conjunction with densities from the input regional-scale, gravitationally and seismically constrained models, to split the layers of the generated model laterally into domains of different density, to reflect the heterogeneous nature of the crust within the region. During the generation of the model, preference was given to the resolution of major density contrasts. Consequently, units of known differing lithology, age, and/or provenance were grouped together, when they appeared to have a similar density to best fit the gravity in the region. An overview of the mean densities of each modelled body, derived from seismic P wave velocities, is presented in Table 1.
Table 1The density of each domain in the model calculated by converting from its mean P wave velocity using the empirical relationship detailed in Brocher (2005) and the density of all domains used in the final model of the region that best reproduce the indications of both the seismic data sources and the gravity field. Locations of each density domain can be found in Fig. 4.
To determine how well the structural model fits the gravity field in the region, the calculated gravity was subtracted from observed gravity during interactive modifications of the location of different domains within each layer and their densities, and the result (further referred to as residual anomaly) was interrogated. No filtering for specific wavelengths was done during gravity modelling, with the full signal being used. No presumptions were made about which tectonic features would require domains of different density, with their location ultimately derived from the gravity modelling process.
In the case of anomalies in the residual gravity field, the depth of the source was estimated to be half the width of the anomaly wavelength and the density of the body lying at that depth was increased for a positive residual anomaly or decreased for a negative residual anomaly. Successive iterations of the model were then generated by modifying the distribution of densities within the model layers. This was repeated until a 3-D structural density model of the region was obtained that best reproduces the indications of both the seismic data sources and the gravity field.
Figure 3 shows a north–south cross section through the generated model illustrating the thickness of all main structural layers, the density domains defined within them, and the calculated and observed gravity of the section. The location of the cross section can be seen in Fig. 1a and is also marked on all figures illustrating the setup of the model.
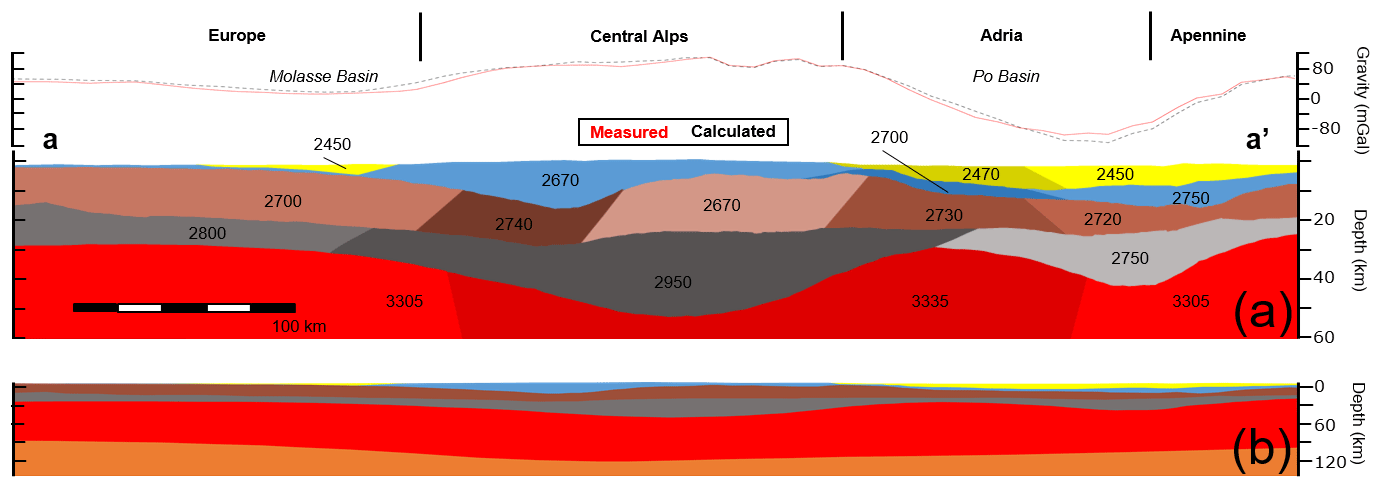
Figure 3Cross sections through generated model showing thickness of model layers. Location is marked in Figs. 1a, 2, and 4–6 as a–a'. Lithospheric mantle layer is shown in red, lower crust is shown in grey, upper crust is shown in brown, consolidated sediments are shown in blue, and unconsolidated sediments are shown in yellow. In (a) density domains within each layer are shown as a change of shade and the density of each domain is labelled. At the top, the observed and calculated gravity anomalies along the cross section are shown. Panel (b) is scaled to show the thicknesses of all layers down to the asthenospheric mantle, shown in orange.
Our model indicates that more heterogeneity is required in the crust than in other model layers to replicate the gravity field and that significant differences exist between the crust of the European and Adriatic plates. Sedimentary thicknesses, both unconsolidated and consolidated, are thinner in the Molasse Basin than in the Po Basin and crustal densities and thicknesses also differ between the plates. Beneath the orogen itself, the result of incorporating all Alpine nappes within the consolidated sediment layer can be observed, with higher thicknesses beneath the central Alps. The whole crust is thickest below the central Alps and is compensated for by higher thickness and density of the lower crust. The observed gravity along with the calculated gravity of the model can also be observed, showing a good fit.
Figure 4 shows the thicknesses of the layers of the generated model, which were created as a result of the correlation and integration work, with the areal extent of all density domains overlaid on top. An overview of the final density of all the bodies composing the model required to fit the gravity field can be found in Table 1.
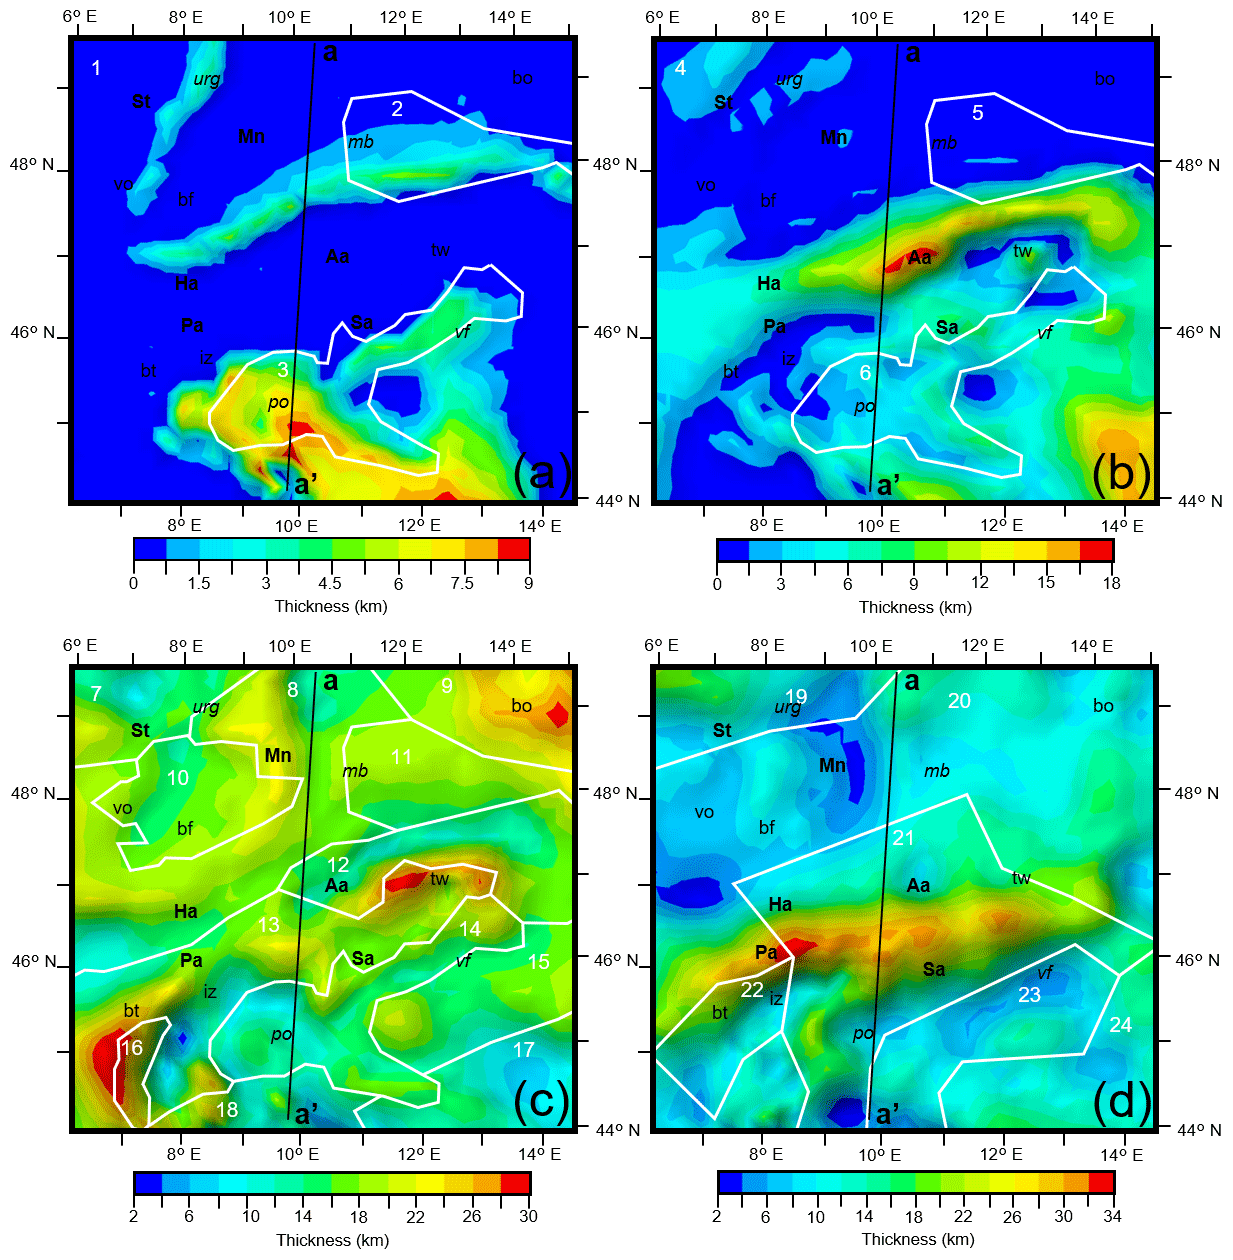
Figure 4Thickness of (a) unconsolidated sediments, (b) consolidated sediments, (c) the upper crust, and (d) the lower crust across the modelled area. Density domains required during modelling within the layer are overlaid in white; domain numbers are shown in white and correspond to Table 1. Locations of key tectonic features are overlaid (abbreviations shown in Fig. 1a caption).
Both sedimentary layers shown in Fig. 4 reflect trends across the region previously identified along the cross section presented in Fig. 3, with thicker and denser sediments in the Po Basin than in the Molasse Basin and large thicknesses of consolidated sediments in the central Alps (18 km) representing the Alpine nappe stacks. Maximum thicknesses of 9 and 12 km were used in the Po Basin for unconsolidated and consolidated sediments, respectively, whilst 6 and 9 km were used in the Molasse Basin. Thicknesses of 3.75 km unconsolidated sediments were used in the deepest part of the Upper Rhine Graben with consolidated sediment thicknesses of up to 3 km. In both of the sedimentary layers, separate density domains were necessary in the eastern Molasse Basin (2470 and 2680 kg m−3) and the Po Basin (2470 and 2700 kg m−3) that were denser than the sediments in the rest of the region (2450 and 2670 kg m−3).
The European upper crust (domains 7–11 in Fig. 4c and Table 1) is thicker but has a similar density on average (20 km and 2700 kg m−3) compared to the Adriatic upper crust (12 km and 2700 kg m−3; domains 14, 15, and 17 in Fig. 4c and Table 1). The densities given for the European and Adriatic crusts are averages of the density domains that comprise them. The thickest regions of upper crust can be found around the Bohemian Massif in the northern foreland and the Briançonnais Terrane and Tauern Window in the Alps reaching a thickness of up to 30 km, whilst thinned upper crust with thicknesses of only 4 km is found below the Adriatic Sea and the Ivrea Zone. Multiple density domains in the upper crust correspond to known tectonic features in the modelled region such as the Variscan Saxothuringian (2670 kg m−3) and Moldanubian (2700 kg m−3) zones, the massifs of Bohemia (2740 kg m−3) and the Vosges/Black Forest (2660 kg m−3) that lie close enough together in the model to be grouped, the Briançonnais Terrane (2790 kg m−3) and the Apennine belt (2720 kg m−3). However, in the Alps and the Adriatic Sea the modelled density domain boundaries do not correspond to specific tectonic features. The Alps are divided roughly north-east (2740 kg m−3) to south-west (2670 kg m−3), being denser in the north-east, while the Adriatic Sea is split roughly north (2660 kg m−3) to south (2700 kg m−3), being denser in the south.
The configuration of the European lower crust (domains 19 and 20 in Fig. 4c and Table 1) is of similar thickness but less dense on average (10 km and 2860 kg m−3) than the Adriatic (10 km and 2910 kg m−3; domains 21, 23 and 24 in Fig. 4c and Table 1). The lower-crustal Alpine root is thicker and denser (2950 kg m−3 and 34 km) than in the rest of the region. Density domains within the lower crust show less correspondence with known tectonic features than those in the upper crust. Of the domains in the lower crust only two correspond roughly to tectonic features: one to the Saxothuringian Variscan domain (2920 kg m−3) and the other to the Briançonnais Terrane (3100 kg m−3). A large region of similar density within the lower crust exists, mostly in the European plate, covering an area including the Moldanubian Variscan domain, the Bohemian Massif, and the Western and Eastern Alps (2800 kg m−3). The central Alps and the western Po Basin are also grouped as a region of similar density (2950 kg m−3). As with the upper crust, the lower crust beneath the Adriatic Sea is split roughly north (2750 kg m−3) to south (3040 kg m−3) with a denser domain in the south. Some lower-crustal density domains in the European and Adriatic plates have been modelled as low as 2800 kg m−3 (domain 20 in Fig. 4c and Table 1) and 2750 kg m−3 (domain 23 in Fig. 4c and Table 1), respectively, and although necessary to fit the gravity anomaly, these values are similar to upper-crustal density values. The other density domains in the lower crust of the region have values that would be expected for this depth level.
Figure 5 shows the depths of the Moho and LAB used in this work. The Moho is shallowest below the Ligurian Sea (20 km) but also shallow beneath the Ivrea Zone (22.5 km) and below the Upper Rhine Graben (25 km). It reaches its deepest point in the crustal root of the Alps at 55 km. The trends in Moho depth noted here correspond well to trends in the Moho map of Spada et al. (2013). However the minimum (Ivrea Zone: 12 km) and maximum (Alpine crustal root: 60 km) depths of the Spada et al. (2013) Moho are more extreme and likely represent more local values than those used in this work. Additionally, our integrated Moho does not contain large vertical steps (28 km in the Northern Apennines) between defined plate domains, such as in the Spada et al. (2013) Moho as these would create large density contrasts within the 3-D model that would present severe difficulties when trying to fit the observed gravity in the region.
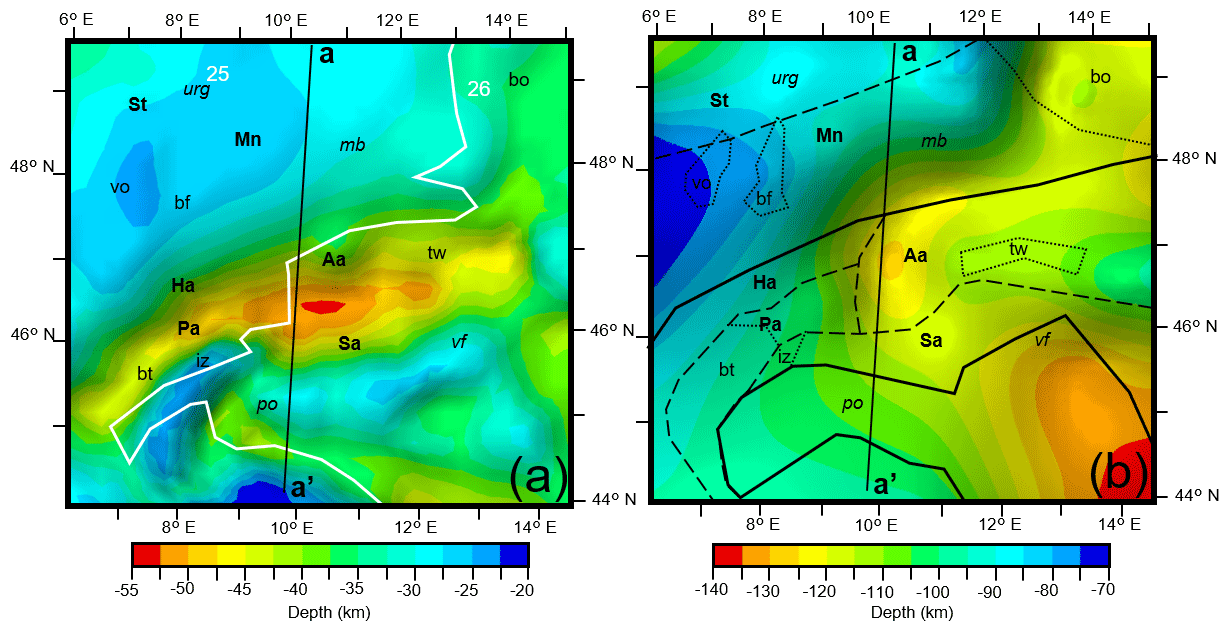
Figure 5(a) Depth to the Moho across the modelled area. Density domains required during modelling within the lithospheric mantle are overlaid in white; domain numbers are shown in white and correspond to Table 1. (b) Depth to the LAB from Geissler et al. (2010) across the modelled area. Locations of key tectonic features are overlaid for both figures (definitions shown in Fig. 1a caption).
From the gravity modelling process it was found necessary to have variation in the density of the lithospheric mantle and that the regions of different density correspond to different thicknesses of the lithosphere (Geissler et al., 2010). Broadly, the lithosphere is thinnest and least dense to the north-west of the region (70 km and 3305 kg m−3) whilst being thickest and densest to the south-east (140 km and 3335 kg m−3) below the Adriatic Sea. The shallowing of the LAB below the Alps could correspond to the boundary between the Austro-Alpine unit and Helvetic–Penninic Alps.
The observed gravity in the modelled region is visible in Fig. 2, while the calculated gravity response is shown in Fig. 6. The residual anomaly can be observed in Fig. 6 demonstrating the good fit achieved by the generated structural model. Almost all of the modelled area reproduces the observed gravity to ±25 mGal with the exception of a couple of isolated regions where the misfit between observed and calculated gravity slightly exceeds that value. As the polarity of both anomalies indicates that less density is required to fit the gravity field, they correspond to Moho highs and their wavelength would suggest the top surface of the Moho as the source of the anomaly. The anomalies likely stem from isolated Moho depths that are slightly too shallow. As crustal densities were not the source of these anomalies and surface heights remained fixed during the modelling process, no changes were made to account for these anomalies so that a more representative density configuration of the regional crust could be calculated.
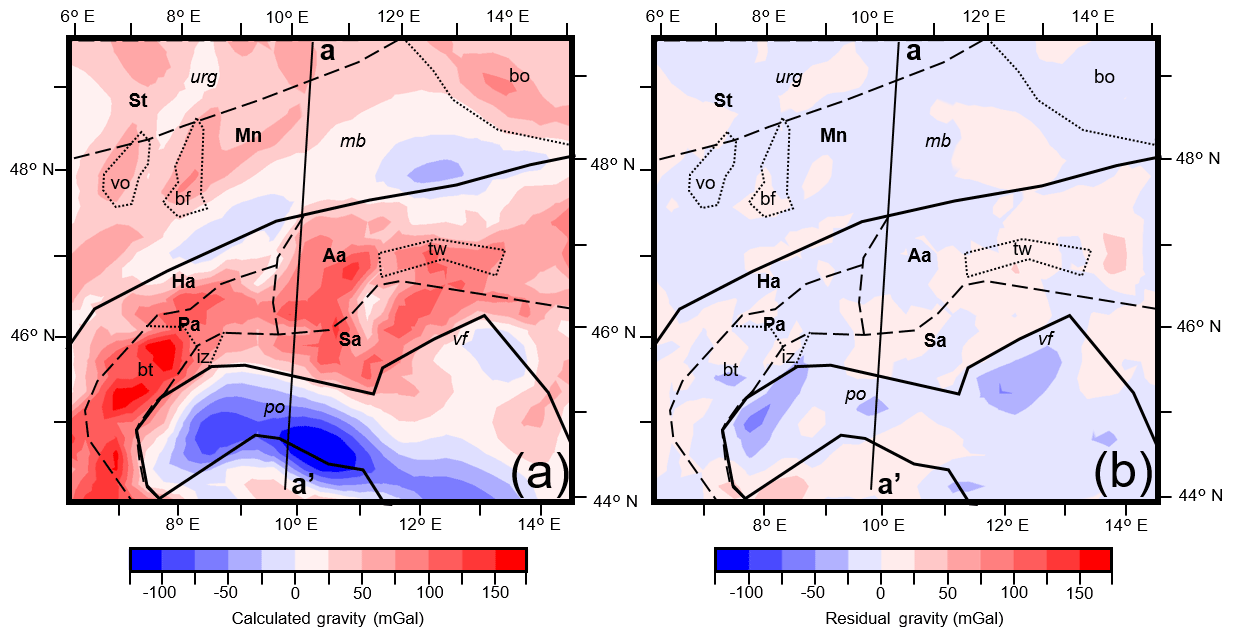
Figure 6(a) Calculated gravity at 6 km above the datum resulting from the final structural and density model. (b) Residual gravity (observed gravity–calculated gravity) of the best-fit model. Locations of key tectonic features are overlaid for both figures (definitions shown in Fig. 1a caption).
The thickness and average density of the modelled crust throughout the region are shown in Fig. 7. The lateral variation in average density is obtained as a weighted average calculated from the thicknesses and densities of the upper crust and the lower crust at every point in the model. Overall the crust is thicker and less dense on average in the European plate (27.5 km and 2750 kg m−3) compared to the Adriatic (22.5 km and 2850 kg m−3). The thickest crust corresponds to the crustal root of the Central Alps (55 km). Areas of thinned crust are found below the sedimentary depocentres of the Po Basin and the Upper Rhine Graben, which can additionally be seen extending south and west of its surface location; however, the crust does not appear significantly thinned beneath the Molasse Basin. Whilst the Adriatic crust is denser on average than the European crust, it has more extreme density variations within it, such as a modelled low-density crust in the north of the Adriatic indenter that coincides with the Veneto–Friuli plain (2700 kg m−3), immediately adjacent to much denser crust lying to the south below the Adriatic Sea (2900 kg m−3).
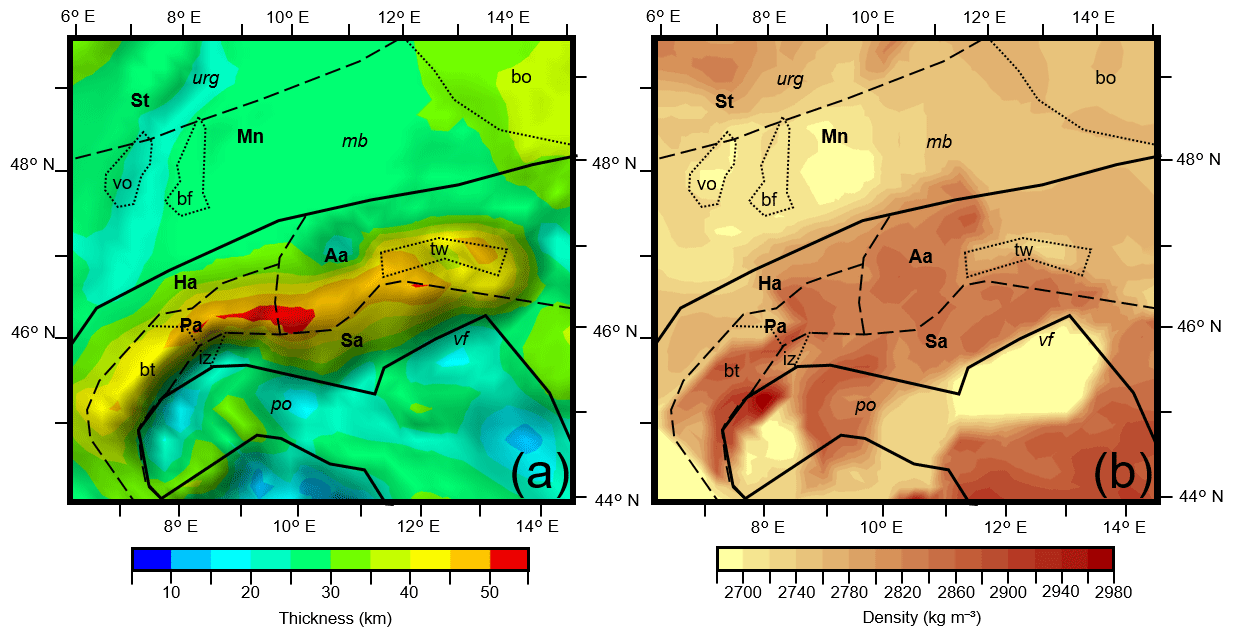
Figure 7(a) Thickness and (b) average density of the entire crust across the modelled area. Solid lines demark the boundaries of Alpine zones; the dotted black lines indicate the extent of the non-accreted Adriatic plate. Locations of key tectonic features are overlaid (definitions shown in Fig. 1a caption).
Density contrasts within the crust correlate spatially with the locations of some Alpine zone boundaries as defined in the literature (Schmid et al., 1989, 2004). The Briançonnais Terrane can be seen as a higher-density block contrasting with the rest of the zones that surround it. The Southern Alps can also be identified as a dense block, with its borders to the Briançonnais Terrane and the Austro-Alpine zone clearly defined in the east of the modelled region. The Tauern Window can also be clearly identified as a relatively lower-density zone within the Austro-Alpine zone.
Figure 8 also shows the thickness and average density of the modelled crust but additionally shows their correspondence with large earthquakes and ongoing surface deformation. The thickness of the crust is overlaid with present-day vertical displacement rates (Sternai et al., 2019) in Fig. 8a, and the average density of the crust is overlaid with present-day horizontal surface strain distribution (Sánchez et al., 2018), earthquakes of a moment magnitude of 6 or larger (Fäh et al., 2011; Stucchi et al., 2012; Grünthal et al., 2013), and the location of modelled upper-crust domain boundaries in Fig. 8b, so that relationships between crustal features and recent deformation and seismicity can be interrogated.
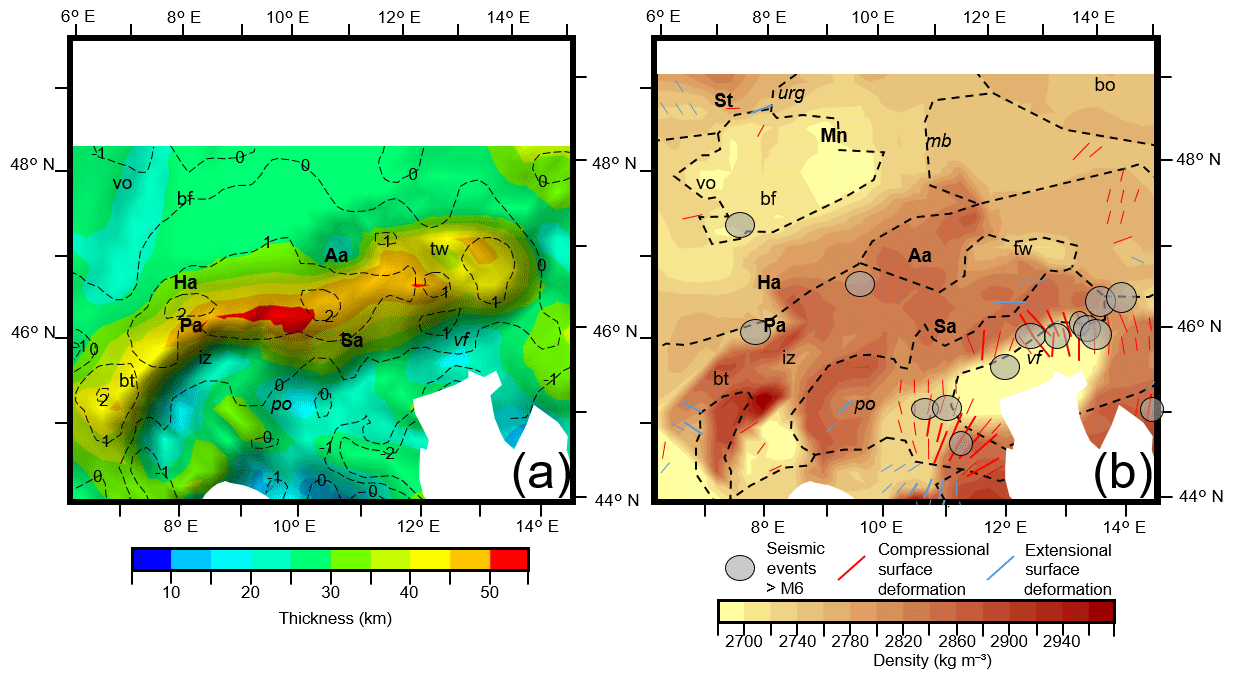
Figure 8(a) Thickness of the crust across the modelled area overlaid with vertical displacement rates (Sternai et al., 2019). Dotted black lines indicate isolines of the vertical displacement rates in millimetre per year. (b) Average density of the crust across the modelled area overlaid with geodetically derived horizontal surface strain distribution (Sánchez et al., 2018) and seismic events of a moment magnitude larger than 6 (Fäh et al., 2011; Stucchi et al., 2012; Grünthal et al., 2013). Bar orientation indicates orientation of maximum surface strain. Dotted black lines indicate the upper-crust density domains of the final structural and density model. Regions where the overlaid data were not available have been whited out in both figures. Locations of key tectonic features are overlaid for both figures (abbreviations shown in Fig. 1a caption).
Within the Alps a strong correlation exists between the thickness of the crust and vertical displacement rates at the surface. Regions of modelled thickened crust correspond to high positive rates of vertical displacement. Regions of thinned crust, such as the Po Basin and the Upper Rhine Graben, were found to correspond to negative vertical displacements. Differing rates of vertical displacement can also be observed in the western Molasse and eastern Molasse Basin, with the west uplifting and the east subsiding. The transition between these two behaviours in the Molasse Basin corresponds to the boundary of the modelled density domain boundaries in the sedimentary and upper-crustal layers, separating the denser eastern region of the basin and the less dense western portion of the basin.
Among regions with a pronounced change in the density of the crust, such as the plate boundary between the Adriatic plate and the Southern Alps, there is coincidence with large earthquakes (Fig. 8b). Whilst not every large earthquake corresponds to a contrast in the average density of the crust, they all correspond to the location of density domain boundaries within the upper crust as defined in the generated model. Horizontal surface strain distribution also corresponds to the location of density domain boundaries within the upper crust as defined in the model, with the direction of maximum horizontal strain predominantly perpendicular to the domain boundaries.
5.1 Alpine zone provenance
Differing methods of classifying the Alpine zones have been adopted over time; however, the results presented here would support work that utilises tectonic reconstructions and constrain zones based on the plate the crust originated from (e.g. Schmid et al., 2004). Crust derived from different terranes could potentially be assumed to have differing properties such as density, and from the model produced in this work, that is found to be the case. From the results, correlation can be observed between zones of different density in the model and Alpine zones as defined by tectonic reconstructions and paleogeography, such as the dense Briançonnais Terrane and Southern Alps and the less dense Tauern Window.
As no density domain geometries were predefined during the modelling stage, the correlation of these domains within the generated model to known features adds validity to the generated model. However, caution should be exercised with the exact location of domain boundaries due to many geological cross sections (e.g. Schmid et al., 2004) showing that tectonic domains cropping out at the surface are offset or not continuous at depth. As this was not possible to implement during the gravity modelling workflow, an offset is often present between features in the average crustal densities (Fig. 7c) and the location of the associated feature at the surface. Two examples of this are in the north of the Briançonnais Terrane and the Tauern Window, suggesting these features have subsurface geometries that differ from their surface expression. Nevertheless the bulk average densities allow for the location of density distinct tectonic features in the crust.
Additionally, Alpine zones of Adriatic provenance were found, in general, to be denser than those of European provenance, a trend also noted in the present-day densities of the Adriatic and European crusts, potentially indicating that prior to orogenesis this was also the case. Alpine zones derived from Adriatic continental crust such as the Austro-Alpine unit and Southern Alps appear denser, in general, than the Helvetic zone, derived from the European continental crust, and Tauern Window. The Briançonnais Terrane derives from neither Europe nor Adria and appears as such in our model, as the region of highest density in the area. These observations are consistent with the interpretation that the provenance of crust within the Alps can potentially be indicated by its properties, such as density, implying that as the Alpine zones were emplaced at different times during orogenesis, the respective plates prior to orogenesis could have had similar crustal properties to the present-day ones.
Regions in the generated model exist with similar provenance and differing densities, indicating that factors other than provenance would also influence their densities. This is exemplified by the Helvetic and Penninic Alps, both deriving from the European plate, which possess a boundary between them that corresponds to an average crustal density contrast. Additionally, some expected boundaries between crusts of different provenances are obscured by other elements of the model. The transition from the European, Helvetic, and Peninnic to Adriatic Austro-Alpine units corresponds to the thickest area of the crustal root, where lower-crust percentages are much higher than upper-crustal ones, creating a region of high-density crust in the model that masks the transition from European to Adriatic crust, when looking at average crustal densities.
5.2 Deformation and seismicity
The correlation between present-day horizontal surface deformation and large seismic events with density contrasts within the crust in the generated model would suggest the localisation of deformation along these features. Previous works have also shown correspondence between the localisaton of seismicity at density contrasts within the crust, such as at crustal block boundaries (Dentith and Featherstone, 2003), providing further validity to our model. As we are working with a coarse-resolution crustal model to identify major features, we found it appropriate to compare it to a sparse seismic catalogue comprising only the largest (M>6) events allowing for a first-order identification of this correlation. Due to the complex structural nature of an active orogen it is difficult to relate seismicity purely to density contrasts in the crust at higher spatial resolution, as the interplay of faults and collisional processes plays a major role in localising seismicity (Serpelloni et al., 2016), while a non-negligible part of earthquakes occurs away from known faults (Hetényi et al. 2018b). However, due to the inherently different properties of crustal blocks of different provenance, it presents the likelihood that major faults and other structures likely to accommodate seismicity would form at the boundaries between these blocks.
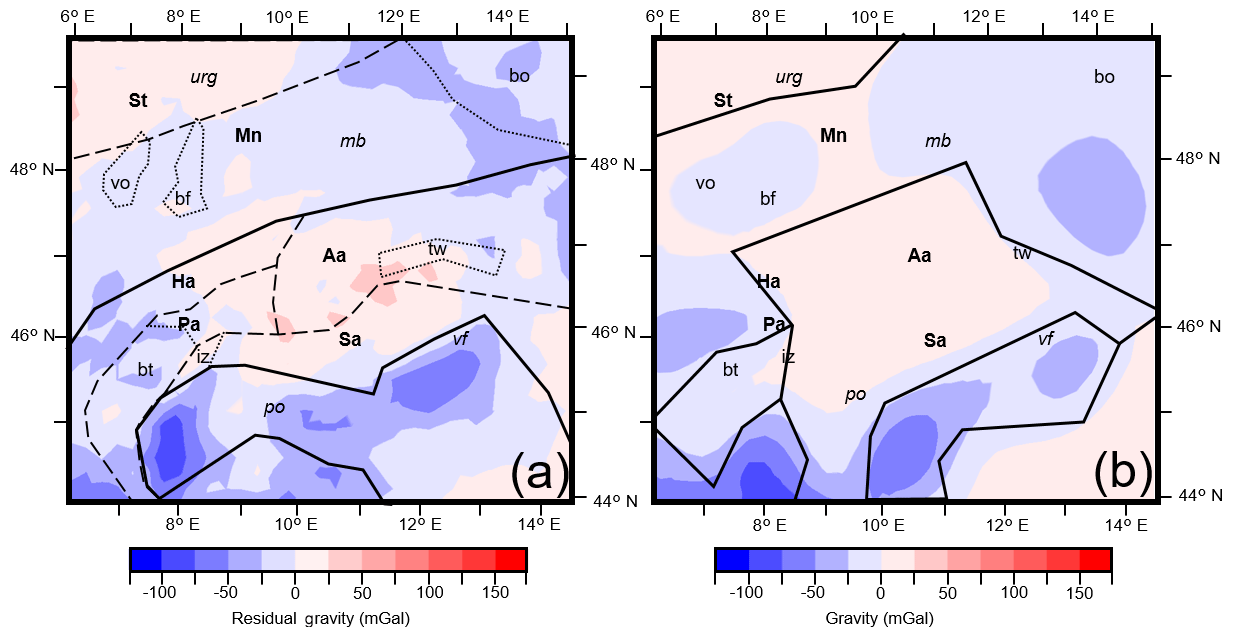
Figure 9(a) Residual gravity (observed gravity–calculated gravity) of a test model with lower-crust densities for the Europe and north Adria domains set to values indicated directly from P wave velocities using conversion suggested by Brocher (2005). (b) Difference in gravity residual between the best-fit model (Fig. 6b) and the model shown in Fig. 9a. Lower-crustal density domains of the best-fit model are overlaid in black.
All large seismic events in the region coincide with the modelled location of upper-crustal density domain boundaries; however, not all correlate with contrasts in the average density of the crust. This fact would suggest that within the Alps, upper-crustal density contrasts are a more likely location for the localisation of seismicity than lower-crustal ones. Observations of the occurrence of seismicity at depth within the Alps have shown that it is predominantly present within the upper crust (Deichmann, 1992; Serpelloni et al., 2016; Wiemer, et al., 2017), supporting interpretations made from the derived model. However, regions exist within the model that have both average crustal density contrasts and upper-crustal density domain boundaries that do not coincide with seismic events, indicating that there are additional controlling factors to the localisation of seismicity.
Observations of the correlation between positive vertical displacement at the surface (Sternai et al., 2019) and thickened crust within the modelled region and negative vertical displacement and thinned crust also strengthen the validity of the model, with this behaviour expected due to isostasy. The crust is significantly thinned beneath the Po Basin of the southern foreland, while it is not in the Molasse Basin of the northern foreland, explaining the discrepancy in sedimentary thicknesses noted before. This could also indicate different driving mechanisms for the formation of either basin, with the Molasse Basin potentially lacking significant subsidence due to being formed predominantly through flexure and the Po Basin being formed through both flexural and active extensional processes. Alternatively the thinned crust below the Po Basin could purely represent an inherited crustal feature. Deriving the driving processes for the sedimentary basin formation within the region remains outside the scope of the present work; however, the accurate constraint of the thinned crust in these regions through the use of gravity provides the scope for this to be identified in future projects.
The results presented in this work indicate crustal properties that would support observations from previous works (Sternai et al., 2019) on the dynamics of the region. Whilst correlation can be observed between vertical displacement at the surface and thickened or thinned crust, some regions such as the Molasse Basin show a crust of similar thickness throughout but present a change in the polarity of surface vertical motion. The crustal densities of the model generated here would support this change, with the transition occurring at the boundary of density domains in the crust and the denser eastern portion exhibiting subsidence and the less dense western portion exhibiting uplift.
Previous works on the dynamics of the Adriatic plate show that it acts as a more rigid indenter than the European plate as it moves northwards rotating anticlockwise into it (Nocquet and Calais, 2004; Vrabec and Fodor, 2006; Serpelloni et al., 2016). Our model shows that the Adriatic crust is denser than the European crust and seismic velocities are also higher in the Adriatic crust than in the European crust (e.g. IESG, 1978; IESG and ETH Zuerich, 1981; Strößenreuther, 1982; Scarascia and Cassinis, 1997; Bleibinhaus and Gebrande, 2006; Brückl et al., 2007). Higher densities and velocities indicate an on average more mafic lithology for these domains, potentially suggesting that they may be stronger than the European crust. The properties of the plates, as modelled here, would suggest that in the present-day convergence of the Eastern Alps the denser Adriatic crust would subduct under the European crust, which fits with the subduction polarity identified in teleseismic tomographies (Lippitsch et al., 2003) and high-resolution receiver function analysis interpreted with other datasets (Hetényi et al., 2018a). However, as stated by Kästle et al. (2019), there is no consistent model of Alpine subduction; it is a complex system that has evolved over time with more influencing factors than plate densities alone. Gravity-constrained bulk average densities of the crust and lithospheric mantle in the region, however, provide strong constraints for future work to identify the nature of Alpine subduction.
5.3 Model uncertainty
Whilst the densities used in the final best-fit model often correspond very closely to those derived from the P wave velocities (Table 1), there are exceptions. In general these are not of concern, such as the opposite tendencies of the more or less dense lithospheric mantles, as the modelled bodies are large volumes of homogenous density that in the real world contain much more heterogeneity. The seismic velocities only provide a fraction of coverage through any of the bodies; therefore, it is expected that the density indicated by P wave velocity to density conversions will not accurately represent its bulk effect on the gravity field, and as such they have been used for initial indications of density and the final densities indicated through gravity constraint.
In the European and north Adriatic domains of the lower crust, however, values are more typical of upper crust, which requires more scrutiny. The sensitivity of the model to density alterations in these crustals has been demonstrated in Fig. 9. There, a model run with lower-crustal densities in north Adria and Europe derived directly from P wave velocities to density conversions is shown. The density of the European lower crust has been raised from 2800 to 2890 kg m−3, and the lower crust of north Adria has been raised from 2750 to 2990 kg m−3. Figure 9a shows the residual gravity (calculated–observed) of this altered lower-crust model, and its difference to the residual of the best-fit model is shown in Fig. 9b.
The figure indicates that density changes in the lower crust ∼100–200 kg m−3 can affect the gravity field by up to 100 mGal and that using lower-crust densities indicated by the P wave velocity to density conversions in Europe and north Adria causes significant misfits. As mentioned previously, the only free parameter during the gravity modelling phase was density. With these low crustal densities required to fit the gravity field and the P wave velocity to density conversions from the upper-crust regions fitting so closely, the likely explanations are that either the lower crust in those regions is in fact of a low density or the lower crust is thinner than in the initial structural model, in turn allowing for a slightly denser lower crust. In either case the average density of the crust as presented in Fig. 8 would largely remain unchanged and these regions would still represent regions of low-density crust.
Although correlations are noted between lateral variation in density distribution in the crust and observations such as plate dynamics and the localisation of large earthquakes and recent deformation, the causes of these observations must be further investigated. Planned future modelling will look more closely at the features of the crust by creating thermal and rheological models to investigate the driving forces behind the observed correlations and potentially help to better explain trends noted in this work. Work is also progressing on constraining deeper structures in the region, such as the mantle, allowing for better constraints on crustal features in the future.
Although the generated model fits the observed gravity well across almost all of the modelled region, it represents a simplified version of the geology below the surface that is not able to account for all the complexity of the real world, and as such, inaccuracies within the model exist. Additionally, whilst the location of density domains in the model remains a non-unique solution, efforts were made to minimise errors by using seismic data and indications from previous modelling (see “Input data” section) to constrain the densities within each layer and density domain boundaries. Although these uncertainties cannot fully be accounted for, by only dealing with features and trends appropriate to the scale of the model, they are severely mitigated. At the scale of the Alps and their forelands as described in this work, irrespective of localised changes to surface heights or densities, the overall trends identified would not be altered.
By creating the first gravity-constrained, 3-D structural and density model of the lithosphere focussed on the Alps and their respective forelands, insights were gained into the distribution of densities at depth within the crust. The findings suggest that the present-day Adriatic crust is both thinner (22.5 km) and denser (2800 kg m−3) than the European crust (27.5 km, 2750 kg m−3). Crust derived from different terranes was also found to have significantly different densities with Alpine zones of Adriatic provenance. The Austro-Alpine unit and Southern Alps were found to be denser and those of European provenance such as the Helvetic zone and Tauern Window to be less dense, indicating the respective plates prior to orogenesis may be assumed to have had similar crustal properties to the present day.
Our modelled anomaly showed a good fit to the observed gravity with maximum misfits of around ±25 mGal across the whole region. It was further validated by density domains defined in the model corresponding to known tectonic features, large earthquakes corresponding to crustal density contrasts, and surface vertical displacements corresponding to crustal thicknesses. The causes of these observations and correlations cannot be explained solely from the results of this work. Therefore, planned future modelling will generate thermal and rheological models to give further insight into the crustal architecture of the region as well the causes of the localisation of deformation and seismicity.
The structural model generated in this work is publicly available and can be found at https://doi.org/10.5880/GFZ.4.5.2019.004 (Spooner et al., 2019).
The complete member list of the AlpArray Working Group can be found at http://www.alparray.ethz.ch.
Hans-Jürgen Götze and Jörg Ebbing contributed pre-existing gravity models from the region and advised on the gravity modelling workflow and utilisation of the software used to carry it out. György Hetényi contributed seismic data for the work and advised on the interpretation of the crust and Moho in the Eastern Alps. Magdalena Scheck-Wenderoth advised on the entire workflow and the interpretation of results. Cameron Spooner carried out the modelling work and prepared the paper with contributions from all co-authors.
The authors declare that they have no conflict of interest.
The authors would like to thank the Deutsche Forschungsgemeinschaft (DFG) for funding the Mountain Building Processes in Four Dimensions (4-D-MB) SPP that this work was produced as part of, the AlpArray initiative for their support, and both Andrea Argnani and one anonymous reviewer for their constructive comments.
The article processing charges for this open-access publication were covered by a Research Centre of the Helmholtz Association.
This paper was edited by Susanne Buiter and reviewed by Andrea Argnani and one anonymous referee.
Aichroth, B., Prodehl, C., and Thybo, H.: Crustal structure along the Central Segment of the EGT from seismic-refraction studies, Tectonophysics, 207, 43–64, https://doi.org/10.1016/0040-1951(92)90471-h, 1992.
Amante, C. and Eakins, B. W.: ETOPO1 1 Arc-Minute Global Relief Model: Procedures, Data Sources and Analysis, NOAA Technical Memorandum NESDIS, NGDC-24, 1–19, https://doi.org/10.7289/V5C8276M, 2009.
Babuška, V. and Plomerová, J.: The lithosphere in central Europe – seismological and petrological aspects, Tectonophysics, 207, 141–163, https://doi.org/10.1016/0040-1951(92)90475-l, 1992.
Bleibinhaus, F. and Gebrande, H.: Crustal structure of the Eastern Alps along the TRANSALP profile from wide-angle seismic tomography, Tectonophysics, 414, 51–69, https://doi.org/10.1016/j.tecto.2005.10.028, 2006.
Brocher, T.: Empirical Relations between Elastic Wavespeeds and Density in the Earth's Crust, B. Seismol. Soc. Am., 95, 2081–2092, https://doi.org/10.1785/0120050077, 2005.
Brückl, E., Bleibinhaus, F., Gosar, A., Grad, M., Guterch, A., Hrubcová, P., Keller, G., Majdański, M., Šumanovac, F., Tiira, T., Yliniemi, J., Hegedűs, E., and Thybo, H.: Crustal structure due to collisional and escape tectonics in the Eastern Alps region based on profiles Alp01 and Alp02 from the ALP 2002 seismic experiment, J. Geophys. Res., 112, 25 pp., https://doi.org/10.1029/2006jb004687, 2007.
Deichmann, N.: Structural and rheological implications of lower-crustal earthquakes below northern Switzerland, Phys. Earth Planet. In., 69, 270–280, https://doi.org/10.1016/0031-9201(92)90146-m, 1992.
Deichmann, N., Ansorge, J., and Mueller, S.: Crustal structure of the Southern Alps beneath the intersection with the European Geotraverse, Tectonophysics, 126, 57–83, https://doi.org/10.1016/0040-1951(86)90220-9, 1986.
Dentith, M. and Featherstone, W.: Controls on intra-plate seismicity in southwestern Australia, Tectonophysics, 376, 167–184, https://doi.org/10.1016/j.tecto.2003.10.002, 2003.
Deutsch, C.: 2-D Gravity Modeling and Evaluation of the Lithospheric Structure of the Alpine Collision Zone along the TRANSALP Profile, Masters Thesis, Freien Universität Berlin, 1–48, 2014.
Dèzes, P., Schmid, S., and Ziegler, P.: Evolution of the European Cenozoic Rift System: interaction of the Alpine and Pyrenean orogens with their foreland lithosphere, Tectonophysics, 389, 1–33, https://doi.org/10.1016/j.tecto.2004.06.011, 2004.
Ebbing, J.: 3-D Dichteverteilung und isostatisches Verhalten der Lithosphäre in den Ostalpen, Ph.D Thesis, Freien Universität Berlin, 1–143, 2002.
Ebbing, J., Braitenberg, C., and Götze, H.: The lithospheric density structure of the Eastern Alps, Tectonophysics, 414, 145–155, https://doi.org/10.1016/j.tecto.2005.10.015, 2006.
Enderle, U., Schuster, K., Prodehl, C., Schulze, A., and Bribach, J.: The refraction seismic experiment GRANU95 in the Saxothuringian belt, southeastern Germany, Geophys. J. Int., 133, 245–259, https://doi.org/10.1046/j.1365-246x.1998.00462.x, 1998.
Fäh, D., Giardini, D., Kästli, P., Deichmann, N., Gisler, M., Schwarz-Zanetti, G., Alvarez-Rubio, S., Sellami, S., Edwards, B., Allmann, B., Bethmann, F., Wössner, J., Gassner-Stamm, G., Fritsche, S., and Eberhard, D.: ECOS-09 Earthquake Catalogue of Switzerland Release 2011 Report and Database, Public catalogue, 17 April 2011, Swiss Seismological Service ETH Zurich, Report SED/RISK/R/001/20110417, 2011.
Förste, C., Bruinsma, S. L., Abrikosov, O., Lemoine, J. M., Marty, J. C., Flechtner, F., Balmino, G., Barthelmes, F., and Biancale, R.: EIGEN-6C4 The latest combined global gravity field model including GOCE data up to degree and order 2190 of GFZ Potsdam and GRGS Toulouse, GFZ Data Services, https://doi.org/10.5880/icgem.2015.1, 2014.
Franke, W.: The mid-European segment of the Variscides: tectonostratigraphic units, terrane boundaries and plate tectonic evolution, Geol. Soc. Lond. Special Publications, 179, 35–61, https://doi.org/10.1144/gsl.sp.2000.179.01.05, 2000.
Freymark, J., Sippel, J., Scheck-Wenderoth, M., Bär, K., Stiller, M., Fritsche, J., and Kracht, M.: The deep thermal field of the Upper Rhine Graben, Tectonophysics, 694, 114–129, https://doi.org/10.1016/j.tecto.2016.11.013, 2017.
Frisch, W.: Tectonic progradation and plate tectonic evolution of the Alps, Tectonophysics, 60, 121–139, https://doi.org/10.1016/0040-1951(79)90155-0, 1979.
Gajewski, D. and Prodehl, C.: Crustal structure beneath the Swabian Jura, SW Germany, from seismic refraction investigations, J. Geophys., 56, 69–80, 1985.
Gajewski, D. and Prodehl, C.: Seismic refraction investigation of the Black Forest, Tectonophysics, 142, 27–48, https://doi.org/10.1016/0040-1951(87)90293-9, 1987.
Gajewski, D., Holbrook, W., and Prodehl, C.: A three-dimensional crustal model of southwest Germany derived from seismic refraction data, Tectonophysics, 142, 49–70, https://doi.org/10.1016/0040-1951(87)90294-0, 1987.
Geissler, W., Sodoudi, F., and Kind, R.: Thickness of the central and eastern European lithosphere as seen by S receiver functions, Geophys. J. Int., 181, 604–634, https://doi.org/10.1111/j.1365-246x.2010.04548.x, 2010.
Grünthal, G., Wahlström, R., and Stromeyer, D.: The SHARE European Earthquake Catalogue (SHEEC) for the time period 1900–2006 and its comparison to the European-Mediterranean Earthquake Catalogue (EMEC), J. Seismol., 17, 1339–1344, https://doi.org/10.1007/s10950-013-9379-y, 2013.
Guterch, A., Grad, M., Janik, T., Materzok, R., Luosto, U., Yliniemi, J., Lück, E., Schulze, A., and Förste, K.: Crustal structure of the transition zone between Precambrian and Variscan Europe from new seismic data along LT-7 profile (NW Poland and eastern Germany), C. R. Acad. Sci. Paris, 319, 1489–1496, 1994.
Handy, M., M. Schmid, S., Bousquet, R., Kissling, E., and Bernoulli, D.: Reconciling plate-tectonic reconstructions of Alpine Tethys with the geological–geophysical record of spreading and subduction in the Alps, Earth-Sci. Rev., 102, 121–158, https://doi.org/10.1016/j.earscirev.2010.06.002, 2010.
Hetényi, G., Plomerová, J., Bianchi, I., Kampfová-Exnerová, H., Bokelmann, G., Handy, M., and Babuška, V.: From mountain summits to roots: Crustal structure of the Eastern Alps and Bohemian Massif along longitude 13.3∘ E, Tectonophysics, 744, 239–255, https://doi.org/10.1016/j.tecto.2018.07.001, 2018a.
Hetényi, G., Epard, J. L., Colavitti, L., Hirzel, A.H., Kiss, D., Petri, B., Scarponi, M., Schmalholz, S. M., and Subedi, S.: Spatial relation of surface faults and crustal seismicity: a first comparison in the region of Switzerland, Acta Geod. Geophys., 53, 39–461, https://doi.org/10.1007/s40328-018-0229-9, 2018b.
IESG: Alp 75 d-h, Boll. di Geofisica Teorica ed Applicata, 20, 287–302, 1978.
IESG and ETH Zuerich: Südalp 77 b-d, Boll. di Geofisica Teorica ed Applicata, 23, 297–330, 1981.
Ince, E. S., Barthelmes, F., Reißland, S., Elger, K., Förste, C., Flechtner, F., and Schuh, H.: ICGEM – 15 years of successful collection and distribution of global gravitational models, associated services, and future plans, Earth Syst. Sci. Data, 11, 647–674, https://doi.org/10.5194/essd-11-647-2019, 2019.
Kästle, E. D., Rosenberg, C., Boschi, L., Bellahsen, N., Meier, T., and El-Sharkawy, A.: Slab Break-offs in the Alpine Subduction Zone, Solid Earth Discuss., https://doi.org/10.5194/se-2019-17, 2019.
Lippitsch, R., Kissling, E., and Ansorge, J.: Upper mantle structure beneath the Alpine orogen from high-resolution teleseismic tomography, J. Geophys. Res., 108, 1–15, https://doi.org/10.1029/2002jb002016, 2003.
Lowe, M.: Sensitivity study on separation of crustal and mantle contribution to the Alpine gravity field, Masters Thesis, Christian-Albrechts-Universität Kiel, in preparation, 2019.
Mechie, J., Prodehl, C., and Fuchs, K.: Seismic refraction investigations of crust and uppermost mantle structure beneath the Rhenish Massif, Tectonophysics, 118, 159–160, https://doi.org/10.1016/0040-1951(85)90165-9, 1985.
Molinari, I. and Morelli, A.: EPcrust: a reference crustal model for the European Plate, Geophys. J. Int., 185, 352–364, https://doi.org/10.1111/j.1365-246x.2011.04940.x, 2011.
Molinari, I., Argnani, A., Morelli, A., and Basini, P.: Development and Testing of a 3-D Seismic Velocity Model of the Po Plain Sedimentary Basin, Italy, B. Seismol. Soc. Am., 105, 753–764, https://doi.org/10.1785/0120140204, 2015.
Nocquet, J. and Calais, E.: Geodetic Measurements of Crustal Deformation in the Western Mediterranean and Europe, Pure Appl. Geophys., 161, 661–681, https://doi.org/10.1007/s00024-003-2468-z, 2004.
Pistone, M., Müntener, O., Ziberna, L., Hetényi, G., and Zanetti, A.: Report on the ICDP workshop DIVE (Drilling the Ivrea-Verbano zonE), Sci. Dril., 23, 47–56, https://doi.org/10.5194/sd-23-47-2017, 2017.
Przybycin, A., Scheck-Wenderoth, M., and Schneider, M.: Assessment of the isostatic state and the load distribution of the European Molasse basin by means of lithospheric-scale 3-D structural and 3-D gravity modelling, Int. J. Earth Sci., 104, 1405–1424, https://doi.org/10.1007/s00531-014-1132-4, 2014.
Restivo, A., Bressan, G., and Sugan, M.: Stress and strain patterns in the Venetian Prealps (north-eastern Italy) based on focal-mechanism solutions, B. Geofis. Teor. Appl., 57, 13–30, 2016.
Sánchez, L., Völksen, C., Sokolov, A., Arenz, H., and Seitz, F.: Present-day surface deformation of the Alpine region inferred from geodetic techniques, Earth Syst. Sci. Data, 10, 1503–1526, https://doi.org/10.5194/essd-10-1503-2018, 2018.
Scarascia, S. and Cassinis, R.: Crustal structures in the central-eastern Alpine sector: A revision of the available DSS data, Tectonophysics, 271, 157–188, https://doi.org/10.1016/s0040-1951(96)00206-5, 1997.
Schlumburger: Petrel (Version 2011.1.2), available at: https://www.software.slb.com/products/petrel (last access: 18 November 2018), 1998.
Schmid, S., Aebli, H., Heller, F., and Zingg, A.: The role of the Periadriatic Line in the tectonic evolution of the Alps, Geol. Soc. Lond. Special Publications, 45, 153–171, https://doi.org/10.1144/gsl.sp.1989.045.01.08, 1989.
Schmid, S., Fügenschuh, B., Kissling, E., and Schuster, R.. Tectonic map and overall architecture of the Alpine orogen, Eclogae Geol. Helv., 97, 93–117, https://doi.org/10.1007/s00015-004-1113-x, 2004.
Schmidt, S., Götze, H. J., Fichler, C, Ebbing, J., and Alvers, M. R.: 3-D Gravity, FTG and magnetic modeling: the new IGMAS + software, Geoinformatik 2010, 91–96, 2010.
Serpelloni, E., Vannucci, G., Anderlini, L., and Bennett, R. Kinematics, seismotectonics and seismic potential of the eastern sector of the European Alps from GPS and seismic deformation data, Tectonophysics, 688, 157–181, https://doi.org/10.1016/j.tecto.2016.09.026, 2016.
Spada, M., Bianchi, I., Kissling, E., Agostinetti, N., and Wiemer, S. Combining controlled-source seismology and receiver function information to derive 3-D Moho topography for Italy, Geophys. J. Int., 194, 1050–1068, https://doi.org/10.1093/gji/ggt148, 2013.
Spooner, C., Scheck-Wenderoth, M., Götze, H. J., Ebbing, J., and Hetényi, G.: 3D Gravity Constrained Model of Density Distribution Across the Alpine Lithosphere, GFZ Data Services, https://doi.org/10.5880/GFZ.4.5.2019.004, last access: 18 November 2019.
Sternai, P., Sue, C., Husson, L., Serpelloni, E., Becker, T., Willett, S., Faccenna, C., Di Giulio, A., Spada, G., Jolivet, L., Valla, P., Petit, C., Nocquet, J., Walpersdorf, A., and Castelltort, S.: Present-day uplift of the European Alps: Evaluating mechanisms and models of their relative contributions, Earth-Sci. Rev., 190, 589–604, https://doi.org/10.1016/j.earscirev.2019.01.005, 2019.
Strößenreuther, U.: Die Struktur der Erdkruste am Südwestrand der Böhmischen Masse, abgeleitet aus refraktionsseismischen Messungen der Jahre 1970 und 1978/79, Ph.D. Thesis, Universität München, 1982.
Stucchi, M., Rovida, A., Gomez Capera, A., Alexandre, P., Camelbeeck, T., Demircioglu, M., Gasperini, P., Kouskouna, V., Musson, R., Radulian, M., Sesetyan, K., Vilanova, S., Baumont, D., Bungum, H., Fäh, D., Lenhardt, W., Makropoulos, K., Martinez Solares, J., Scotti, O., Živčić, M., Albini, P., Batllo, J., Papaioannou, C., Tatevossian, R., Locati, M., Meletti, C., Viganò, D., and Giardini, D.: The SHARE European Earthquake Catalogue (SHEEC) 1000–1899, J. Seismol., 17, 523–544, https://doi.org/10.1007/s10950-012-9335-2, 2012.
Tesauro, M., Kaban, M., and Cloetingh, S.: EuCRUST-07: A new reference model for the European crust, Geophys. Res. Lett., 35, 1–5, https://doi.org/10.1029/2007gl032244, 2008.
Turrini, C., Lacombe, O., and Roure, F.: Present-day 3-D structural model of the Po Valley basin, Northern Italy, Mar. Petrol. Geol., 56, 266–289, https://doi.org/10.1016/j.marpetgeo.2014.02.006, 2014.
Vrabec, M. and Fodor, L.: Late Cenozoic tectonics of Slovenia: structural styles at the northeastern corner of the Adriatic microplate, in: The Adria microplate: GPS geodesy, tectonics and hazards, edited by: Pinter, N., Grenerczy, G., Weber, J., Stein, S., and Medak, D., Nato Scie Series, IV, earth and environmental science, Vol. 61, Springer, Dordrecht, 151–158, 2006.
Wiemer, S., Kraft, T., Trutnevyte, E., and Roth, P.: “Good Practice” Guide for Managing Induced Seismicity in Deep Geothermal Energy Projects in Switzerland, SED, Swiss Seismological Service at ETH Zürich, 1–69, https://doi.org/10.3929/ethz-b-000254161, 2017.
Yan, Q. and Mechie, J.: A fine structural section through the crust and lower lithosphere along the axial region of the Alps, Geophys. J. Int., 98, 465–488, https://doi.org/10.1111/j.1365-246x.1989.tb02284.x, 1989.
Ye, S., Ansorge, J., Kissling, E., and Mueller, S.: Crustal structure beneath the eastern Swiss Alps derived from seismic refraction data, Tectonophysics, 242, 199–221, https://doi.org/10.1016/0040-1951(94)00209-r, 1995.
Zeis, S., Gajewski, D., and Prodehl, C.: Crustal structure of southern Germany from seismic refraction data, Tectonophysics, 176, 59–86, https://doi.org/10.1016/0040-1951(90)90259-b, 1990.
Zingg, A., Handy, M., Hunziker, J., and Schmid, S.: Tectonometamorphic history of the Ivrea Zone and its relationship to the crustal evolution of the Southern Alps, Tectonophysics, 182, 169–192, https://doi.org/10.1016/0040-1951(90)90349-d, 1990.
Zucca, J. J.: The crustal structure of the southern Rhine graben from the reinterpretation of seismic refraction data, J. Geophys. Z. Geophys., 55, 13–22, https://doi.org/10.23689/fidgeo-3178, 1984.