the Creative Commons Attribution 4.0 License.
the Creative Commons Attribution 4.0 License.
 | 13 May 2019
Experimental grain growth of quartz aggregates under wet conditions and its application to deformation in nature
Junichi Fukuda
Hugues Raimbourg
Ichiko Shimizu
Kai Neufeld
Holger Stünitz
Grain growth of quartz was investigated using two quartz samples (powder and novaculite) with water under pressure and temperature conditions of 1.0–2.5 GPa and 800–1100 ∘C. The compacted powder preserved a substantial porosity, which caused a slower grain growth than in the novaculite. We assumed a grain growth law of with grain size d (µm) at time t (seconds), initial grain size d0 (µm), growth exponent n, a constant k0 (µmn MPa−r s−1), water fugacity (MPa) with the exponent r, activation energy Q (kJ mol−1), gas constant R, and temperature T in Kelvin. The parameters we obtained were , , , and for the powder and , , , and for the novaculite. The grain growth parameters obtained for the powder may be of limited use because of the high porosity of the powder with respect to crystalline rocks (novaculite), even if the differences between powder and novaculite vanish when grain sizes reach ∼70 µm. Extrapolation of the grain growth laws to natural conditions indicates that the contribution of grain growth to plastic deformation in the middle crust may be small. However, grain growth might become important for deformation in the lower crust when the strain rate is < 10−12 s−1.
- Article
(14606 KB) - Full-text XML
- BibTeX
- EndNote


Grain size is one of the key factors contributing to the rheological behavior of materials. A reduction of grain size during deformation operates in all rheological levels of the crust, as it can be caused by fracturing, dynamic recrystallization, dissolution–precipitation, and reaction (summarized in Handy (1990) with natural examples). An increase in grain size, termed grain growth, is typically driven by a reduction in the surface energy of grains, resulting in microstructures of larger grains with less curved boundaries. When grain growth takes place in a dense solid medium with grains touching one another, the process facilitating growth is the migration of grain boundaries. In a dry system, grain boundary migration constitutes the diffusion of atoms across a grain boundary. If fluid wets the boundary, grain boundary migration may involve the solution, transport, and precipitation of the material. Grain boundary migration is a generic process that can be driven by surface energy (e.g., in grain growth) or by internal energy (e.g., strain energy in the form of dislocations leading strain-induced grain boundary migration; Poirier and Guillopé, 1979). During viscous deformation, the competition between grain size reduction and grain growth (i.e., surface- or internal-energy-driven migration) controls the grain size and is the basis for piezometry (e.g., Derby, 1990; Shimizu, 2008; Austin and Evans, 2007). Furthermore, grain size reduction and grain growth may control processes of weakening through the transition from grain-size-insensitive to grain-size-sensitive creep (e.g., Schmid, 1982; Rutter and Brodie, 1988). Therefore, grain growth is an important process to understand microstructural development as a function of time (Olgaard and Evans, 1988).
Grain growth laws for constituents of the Earth have been determined experimentally for calcite (Tullis and Yund, 1982; Olgaard and Evans, 1988; Davis et al., 2011), quartz (Tullis and Yund, 1982; Fukuda et al., 2018), feldspar (Dresen et al., 1996), olivine (Karato, 1989), and other materials (Evans et al., 2001; Karato, 2008). A grain growth law is written as follows:
where d is the grain size at time t, n is the growth exponent, d0 is the initial grain size, and k is a rate constant. A simple rate constant can be written as follows:
where k0 is a constant, Q is the activation energy, R is the gas constant, and T is the temperature in Kelvin. Nishihara et al. (2006) determined a grain growth law for wadsleyite, and they proposed additional terms such as oxygen fugacity and water content, the latter being a function of water fugacity and water activity. However, there have been few studies in which other parameters, in addition to those in Eq. (2), have been investigated. The n value is generally assumed to be 2 or 3 when it is not determined. This is based on a theoretical assumption, which includes simplified grain-boundary free energy, grain shape, grain boundary mobility, grain curvature, and effects of impurity (Brook, 1976; Atkinson, 1988). However, even the difference between n=2 and n=3 gives a drastic change in the rate of grain growth (Karato, 2008). The experimental studies mentioned above reported n values of up to ∼10.
For our study we focused on the grain growth of quartz, which is a major constituent of the crust. As mentioned above, the contribution of grain growth to deformation can be important through a change in grain size, which leads to a change in deformation mechanism (grain-size-insensitive creep and/or grain-size-sensitive creep). There have been many deformation experiments, as well as a theoretical approach (Fukuda and Shimizu, 2017), on quartz to derive flow laws for grain-size-insensitive creep (e.g., Jaoul et al., 1984; Luan and Paterson, 1992; Gleason and Tullis, 1995; Rutter and Brodie, 2004a; Holyoke and Kronenberg, 2013, and references therein), grain-size-sensitive creep (Rutter and Brodie, 2004b), and mixtures of these two creep types (Fukuda et al., 2018; Richter et al., 2018). When grain-size-insensitive creep operates, a reduction in grain size due to dynamic recrystallization has commonly been observed. Grain growth can operate in parallel with grain size reduction, thus stabilizing the grain size towards an equilibrium value, which can be expressed, for example, as a paleopiezometer (Twiss, 1977; Stipp and Tullis, 2003; Stipp et al., 2006; Shimizu, 2008; Cross et al., 2017) or a paleowattmeter (Austin and Evans, 2007). Grain size paleopiezometers and flow laws have been applied to natural samples under targeted pressure and temperature conditions. The strain rate can often be estimated because the flow law involves strain rate () as a function of stress (σ) with a stress exponent (p) (namely, ) (e.g., Stipp et al., 2002; Menegon et al., 2011; Okudaira and Shigematsu, 2012). However, when the relationship between grain size and deformation is considered, the contribution of grain growth needs to be considered.
For the grain growth of quartz, experimental data were reported by Tullis and Yund (1982) and Fukuda et al. (2018). However, their data for various pressure and temperature conditions are limited. Moreover, Tullis and Yund (1982) assumed a grain growth law of with p=0.5, while Fukuda et al. (2018) assumed n=2 in Eq. (1). The grain growth of natural quartz was also investigated by Joesten (1983) and Okudaira et al. (2013), and growth exponents of n=2 were assumed in both studies, although Joesten (1983) also assumed n=3 for Eq. (2). Thus, the growth exponent needs to be determined carefully. Michibayashi and Imoto (2012) performed grain growth experiments on agate, and their original samples showed shape- and crystallographic-preferred orientations (SPO and CPO). After the experiments, their samples maintained the CPO and SPO and showed a growth exponent of n=4.4. Maintaining CPO and SPO during grain growth is unusual, so their samples and results might be special cases. Tullis and Yund (1982) discussed the effects of pore H2O pressure on quartz grain growth. However, their data at different pressures are limited, and the effect of water was not given in their grain growth law. A confining pressure effect was discussed by Wightman et al. (2006) using the experimental data of Tullis and Yund (1982). For the grain growth of the mineral wadsleyite, instead of considering the effect of confining pressure, Nishihara et al. (2006) considered the effect of water fugacity. Water fugacity is also important for plastic deformation, and it has been discussed and/or introduced in flow laws since the mid-1990s (e.g., Gleason and Tullis, 1995; Kohlstedt et al., 1995; Rutter and Brodie, 2004a, b; Holyoke and Kronenberg, 2013; Fukuda and Shimizu, 2017; Fukuda et al., 2018). Water fugacity could be a simplified parameter that involves water content and water activity (e.g., Kohlstedt et al., 1996; Nishihara et al., 2006). Based on these studies, a water fugacity term with an exponent r can be added to Eq. (2) as follows:
For our study we followed the grain growth law defined by Eqs. (1) and (3), and we determined the parameters experimentally. We used two different quartz samples, novaculite and powder, and for both we added different amounts of water under different conditions of temperature and pressure. We will first discuss the differences in grain growth between the two types of starting material, and we will then discuss the contribution of grain growth to deformation under natural conditions.
Arkansas novaculite is composed of fine grains of quartz 0.5–10 µm in size under a light microscope. Large clasts up to 100 µm in size are also visible, and these may be the relics of fossils (Fig. 1a). Some cracks and pores can be observed (Fig. 1b–f). Many apparent pores are surface effects due to the plucking of grains during polishing, as observed in the reflected light mode of the microscope (Fig. 1f) and in the secondary electron (SE) mode of the scanning electron microscope (SEM) (Fig. 1g). More than 99 % of the material is quartz, and other phases include mica and magnesite. The SEM–SE image for a broken surface of the novaculite shows dense grains and tight grain boundaries (Fig. 1h). An electron-backscattered diffraction (EBSD) band contrast image shows clear grain shapes (Fig. 1i).
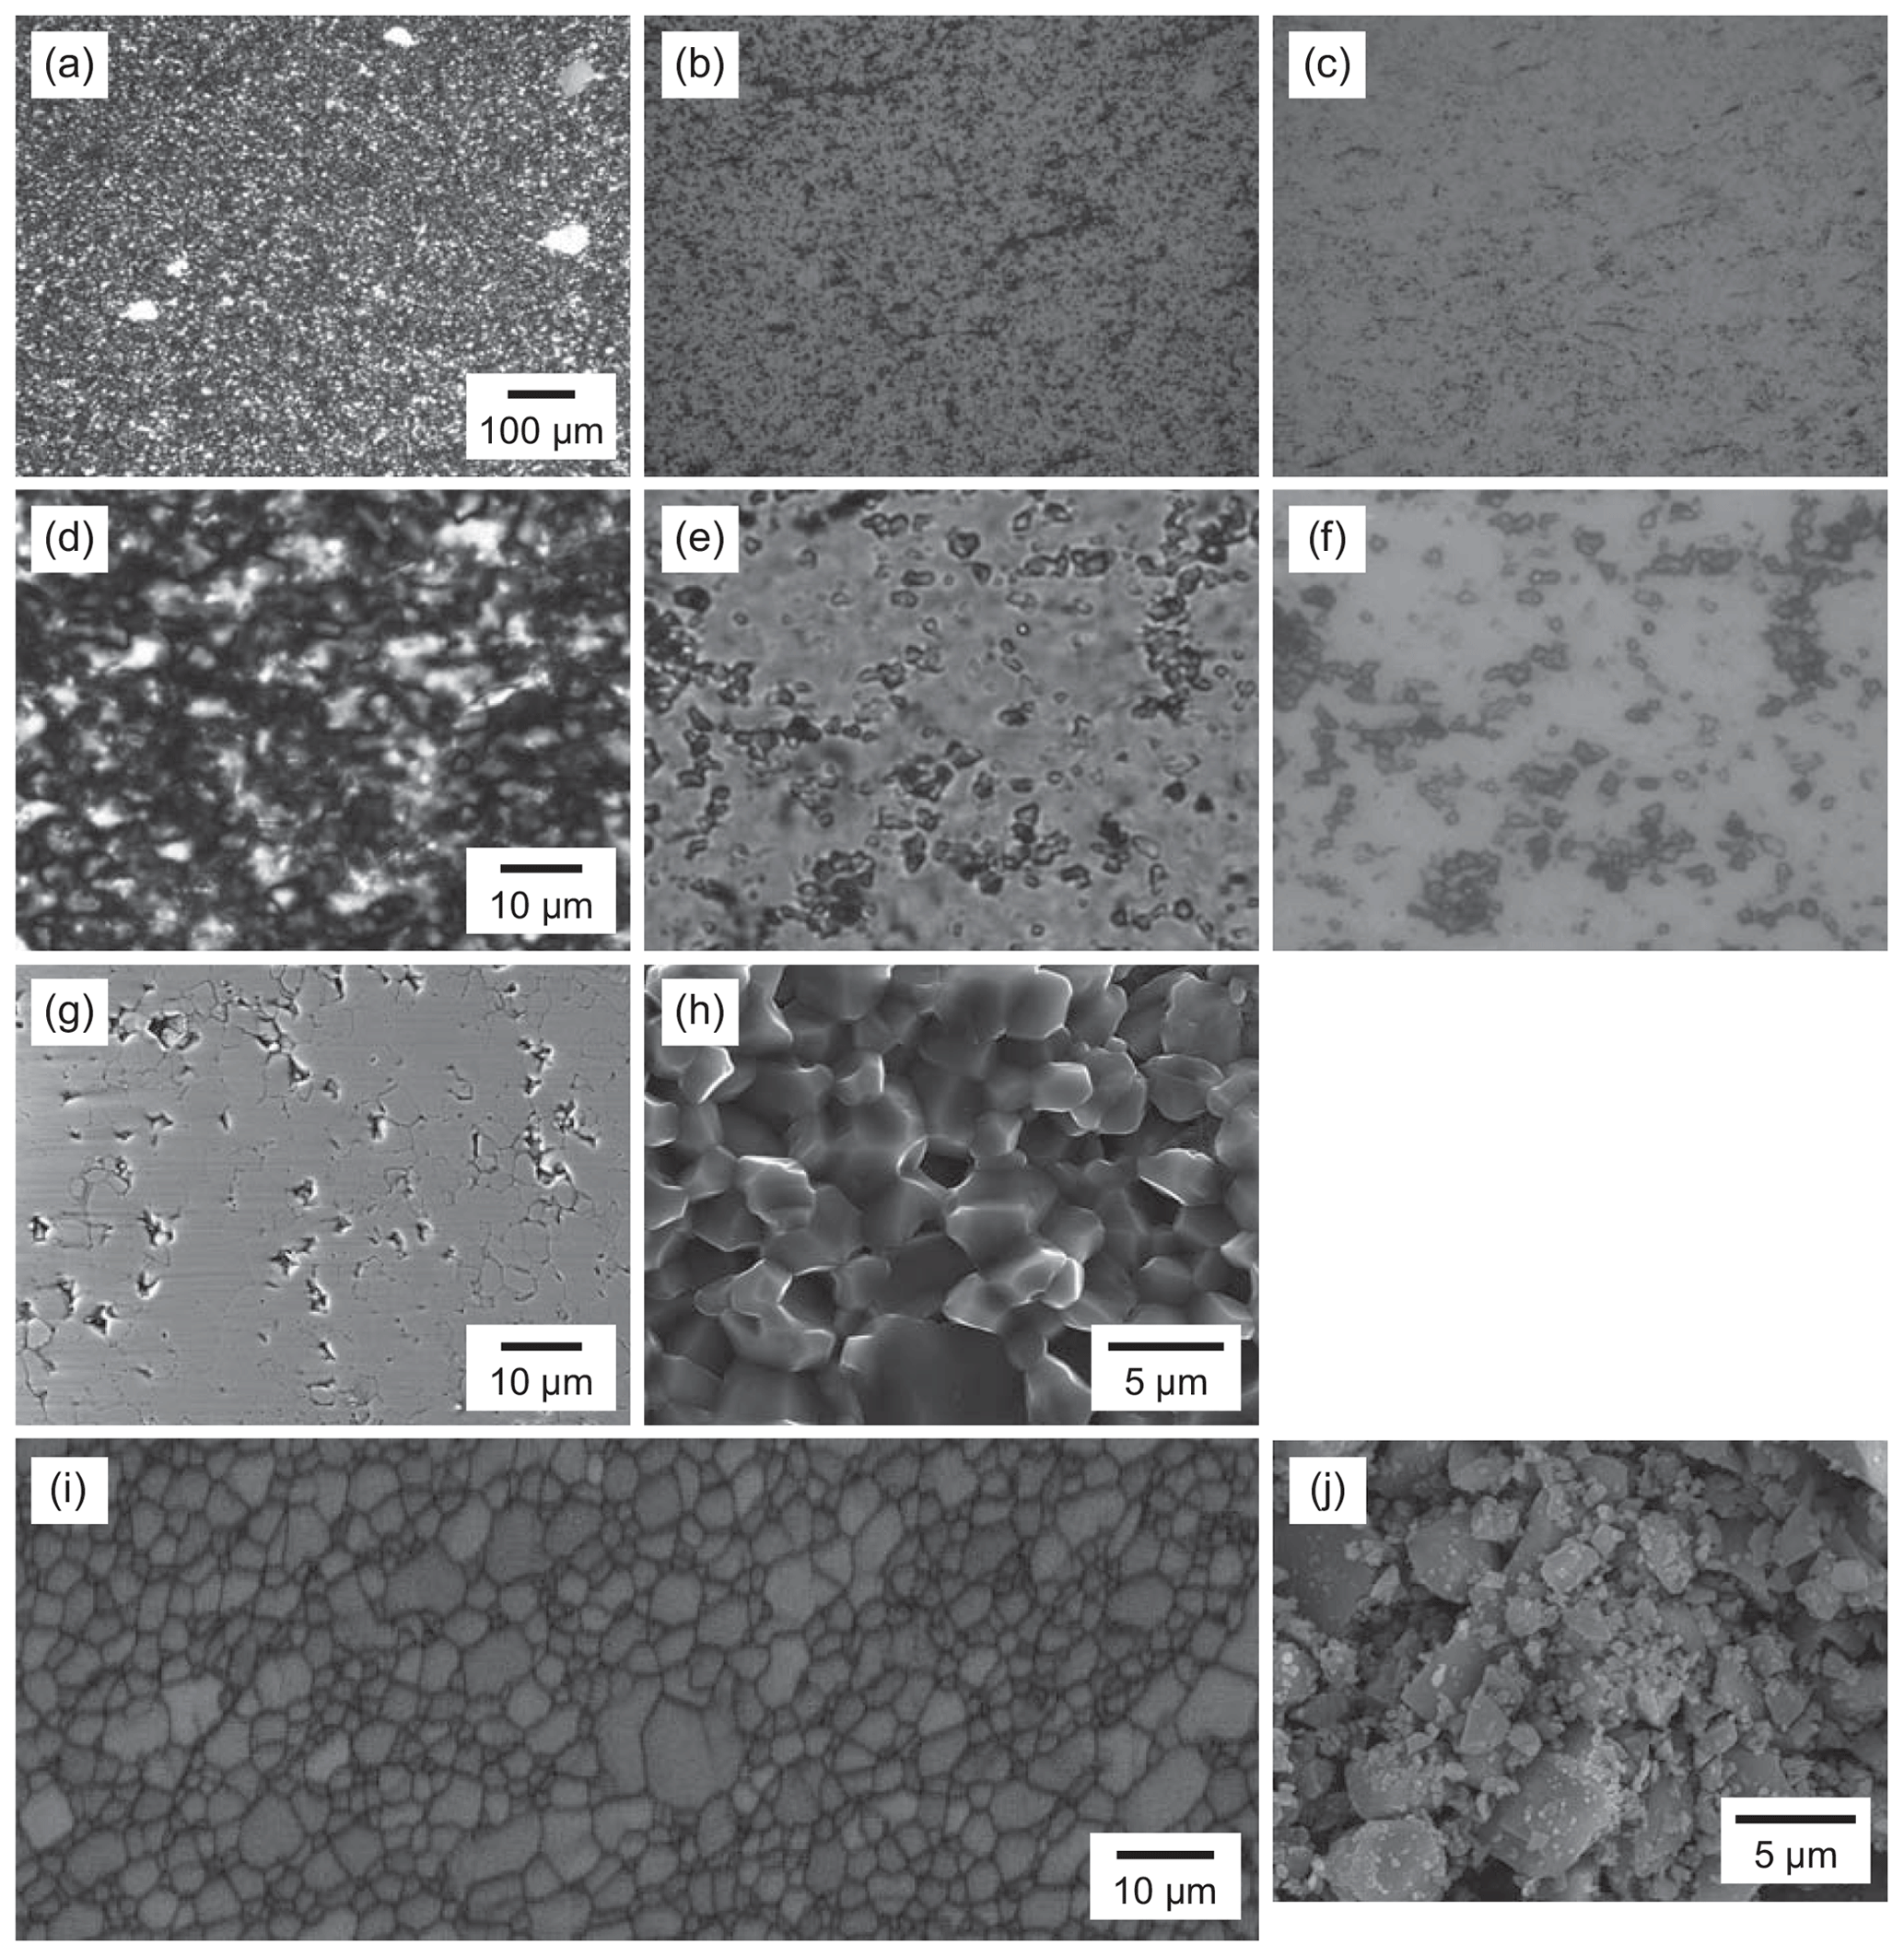
Figure 1Textures of two different starting samples of quartz. (a–i) Novaculite. (j) Quartz powder (MIN-U-SIL 5). (a–c) Light photomicrographs and (d–f) enlarged images; (a, d) in cross-polarized light, (b, e) in plane-polarized light; (c, f) in reflected light. (g) SEM image of a polished surface. (h) SEM image of a broken surface. (i) EBSD band contrast image. (j) SEM image of the powder.
The powder material (MIN-U-SIL 5) is > 99 % quartz, and according to the product sheet, very small amounts of Fe, Al, Ti, Al, Ca, Mg, Na, and K are also present. The SEM–SE image of the powder sample shows grains from submicron size to ∼8 µm (Fig. 1j). The amount of adsorbed water in the powder is ∼0.25 wt %, as measured by weight loss after heating at 120 ∘C. The powder re-adsorbs the same amount of water after ca. 1 h. In contrast, the amount of adsorbed water in the novaculite is below the detection limit using the same method.
The grain size of the starting novaculite sample was determined from EBSD band contrast images (Fig. 1i). Outlines of each grain were traced and grain sizes determined using Image J software as diameters of equivalent circles (root mean square; Fig. 2a). The grain size of the powder sample was determined with a Beckman Coulter particle counter in H2O suspension (Fig. 2b). The grain size ranges of the novaculite and powder samples are 0.6–10 and 0.2–10 µm, respectively, which are consistent with those observed in Fig. 1. The average grain sizes of the initial samples of novaculite and powder were determined with standard deviations as 3.1±1.6 and 2.4±1.7 µm, respectively. These two average grain sizes are used as d0. The grain size range of the powder and the average grain size are consistent with those reported by Kim et al. (2005), and the median value reported by the manufacturer is 1.7 µm. The techniques of grain size determination for these two initial samples were different from the techniques used for the samples after the experiments (using light photomicrographs; shown later). However, the d0 values are small compared with the grain sizes after our experimental series (d), so they would not significantly affect the determinations of the other parameters in the grain growth law (Eqs. 1 and 3).
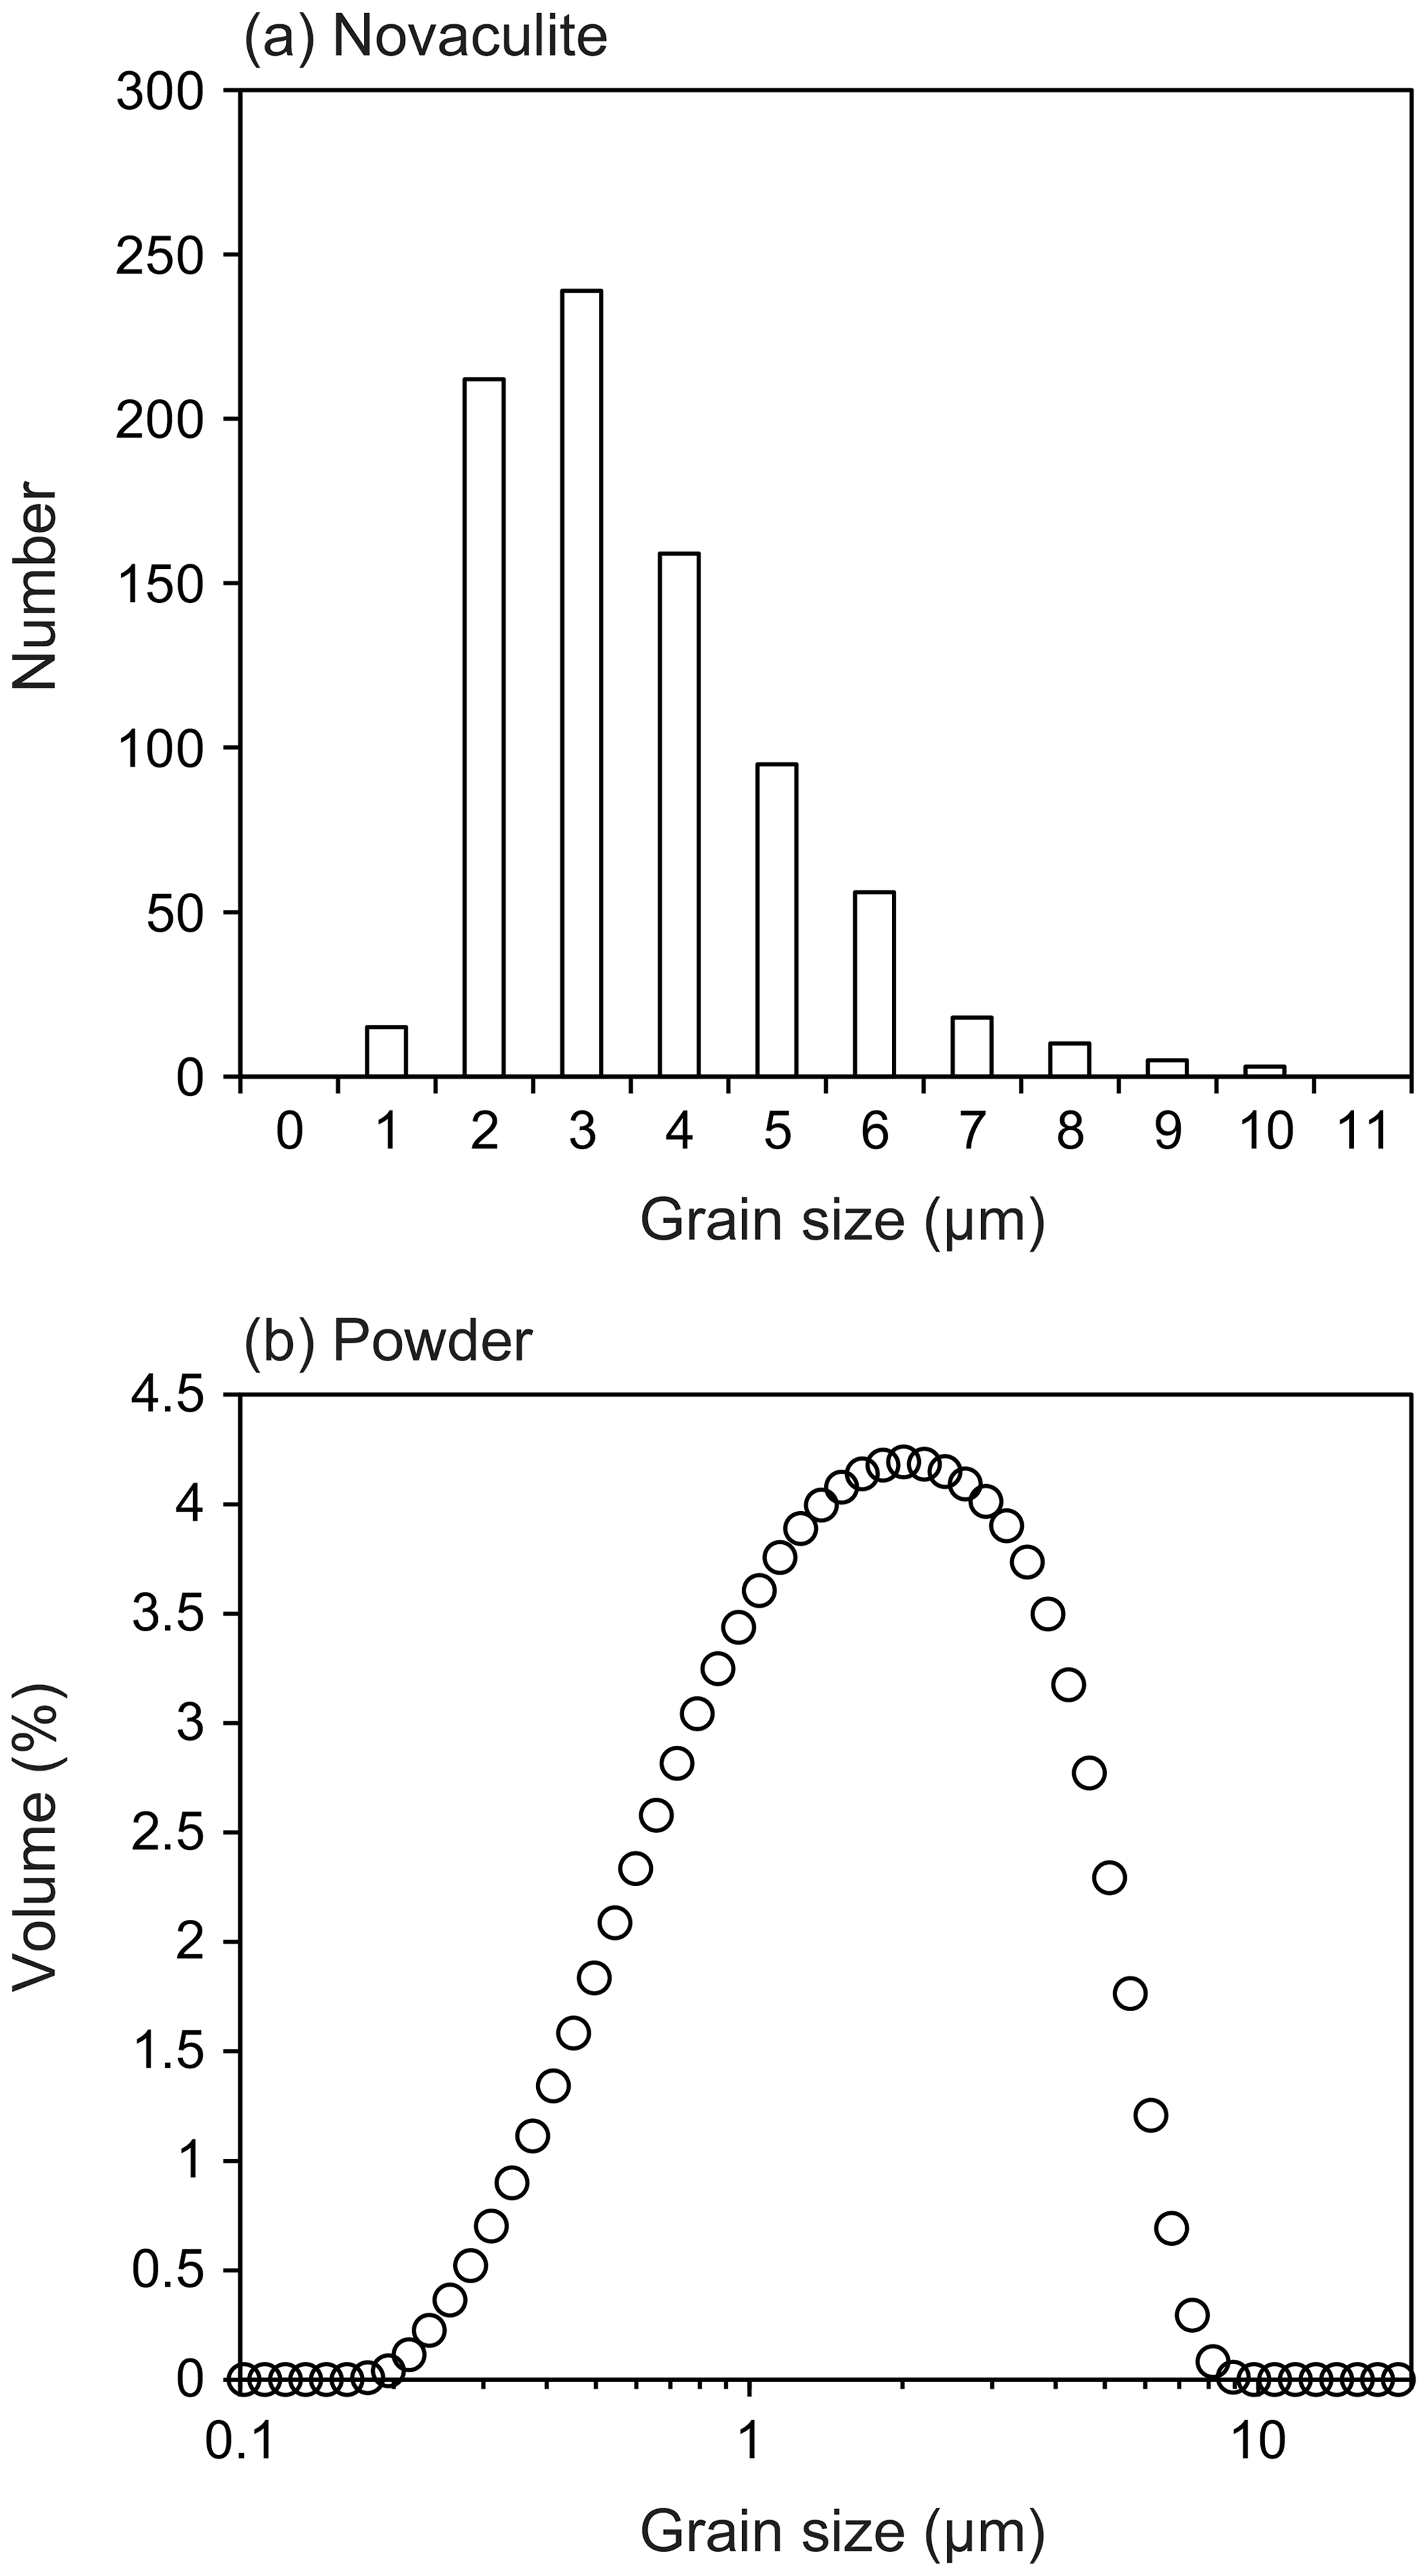
Figure 2Grain size analyses of the starting samples. (a) Novaculite grain sizes obtained from grain outlines in EBSD band contrast images. The average grain size is 3.1±1.6 µm (standard deviation). (b) Grain sizes of the quartz powder sample measured with a particle counter. The average grain size is 2.4±1.7 µm. These two average grain sizes were used as d0.
3.1 Experimental procedures
We performed grain growth experiments using a piston cylinder apparatus. Pressure conditions were 1.0, 1.5, 2.0, and 2.5 GPa, and temperature conditions were 800, 900, 1000, and 1100 ∘C. Annealing durations were from 6 to 240 h. We used sample assemblies with total diameters of 12.5 or 18.8 mm for experiments at high (2.0 and 2.5 GPa) or low pressure (1.0 and 1.5 GPa), respectively (Fig. 3). The sample assembly is after, e.g., Prouteau et al. (2001) and Prouteau and Scaillet (2013), which showed systematic changes in rock compositions (mid-ocean ridge basalt) in Pt capsules depending on the amounts of added water. In addition, previous studies measured electrical conductivity for various rock types with different amounts of water (e.g., Gaillard, 2004; Pommier et al., 2008; Laumonier et al., 2015). They used the piston cylinder with the talc-pressure-medium assembly for pressure up to ∼3 GPa and a gas-pressure-medium vessel without talc for pressure down to ∼50 MPa under temperature conditions of 400–1300 ∘C. The results for pressure, temperature, and sample water contents using these two different apparatuses are systematically correlated. The dehydration reaction of talc can occur in our experimental conditions (e.g., Bose and Ganguly, 1995) and may be an additional water (hydrogen) source. However, these studies proved that the dehydration reaction of talc does not affect the water environment in Pt capsules including samples and water. Water fugacities at given conditions of pressure and temperature were calculated from the molar volume and the equation of state of pure water using the data of Pitzer and Sterner (1994) and Sterner and Pitzer (1994).
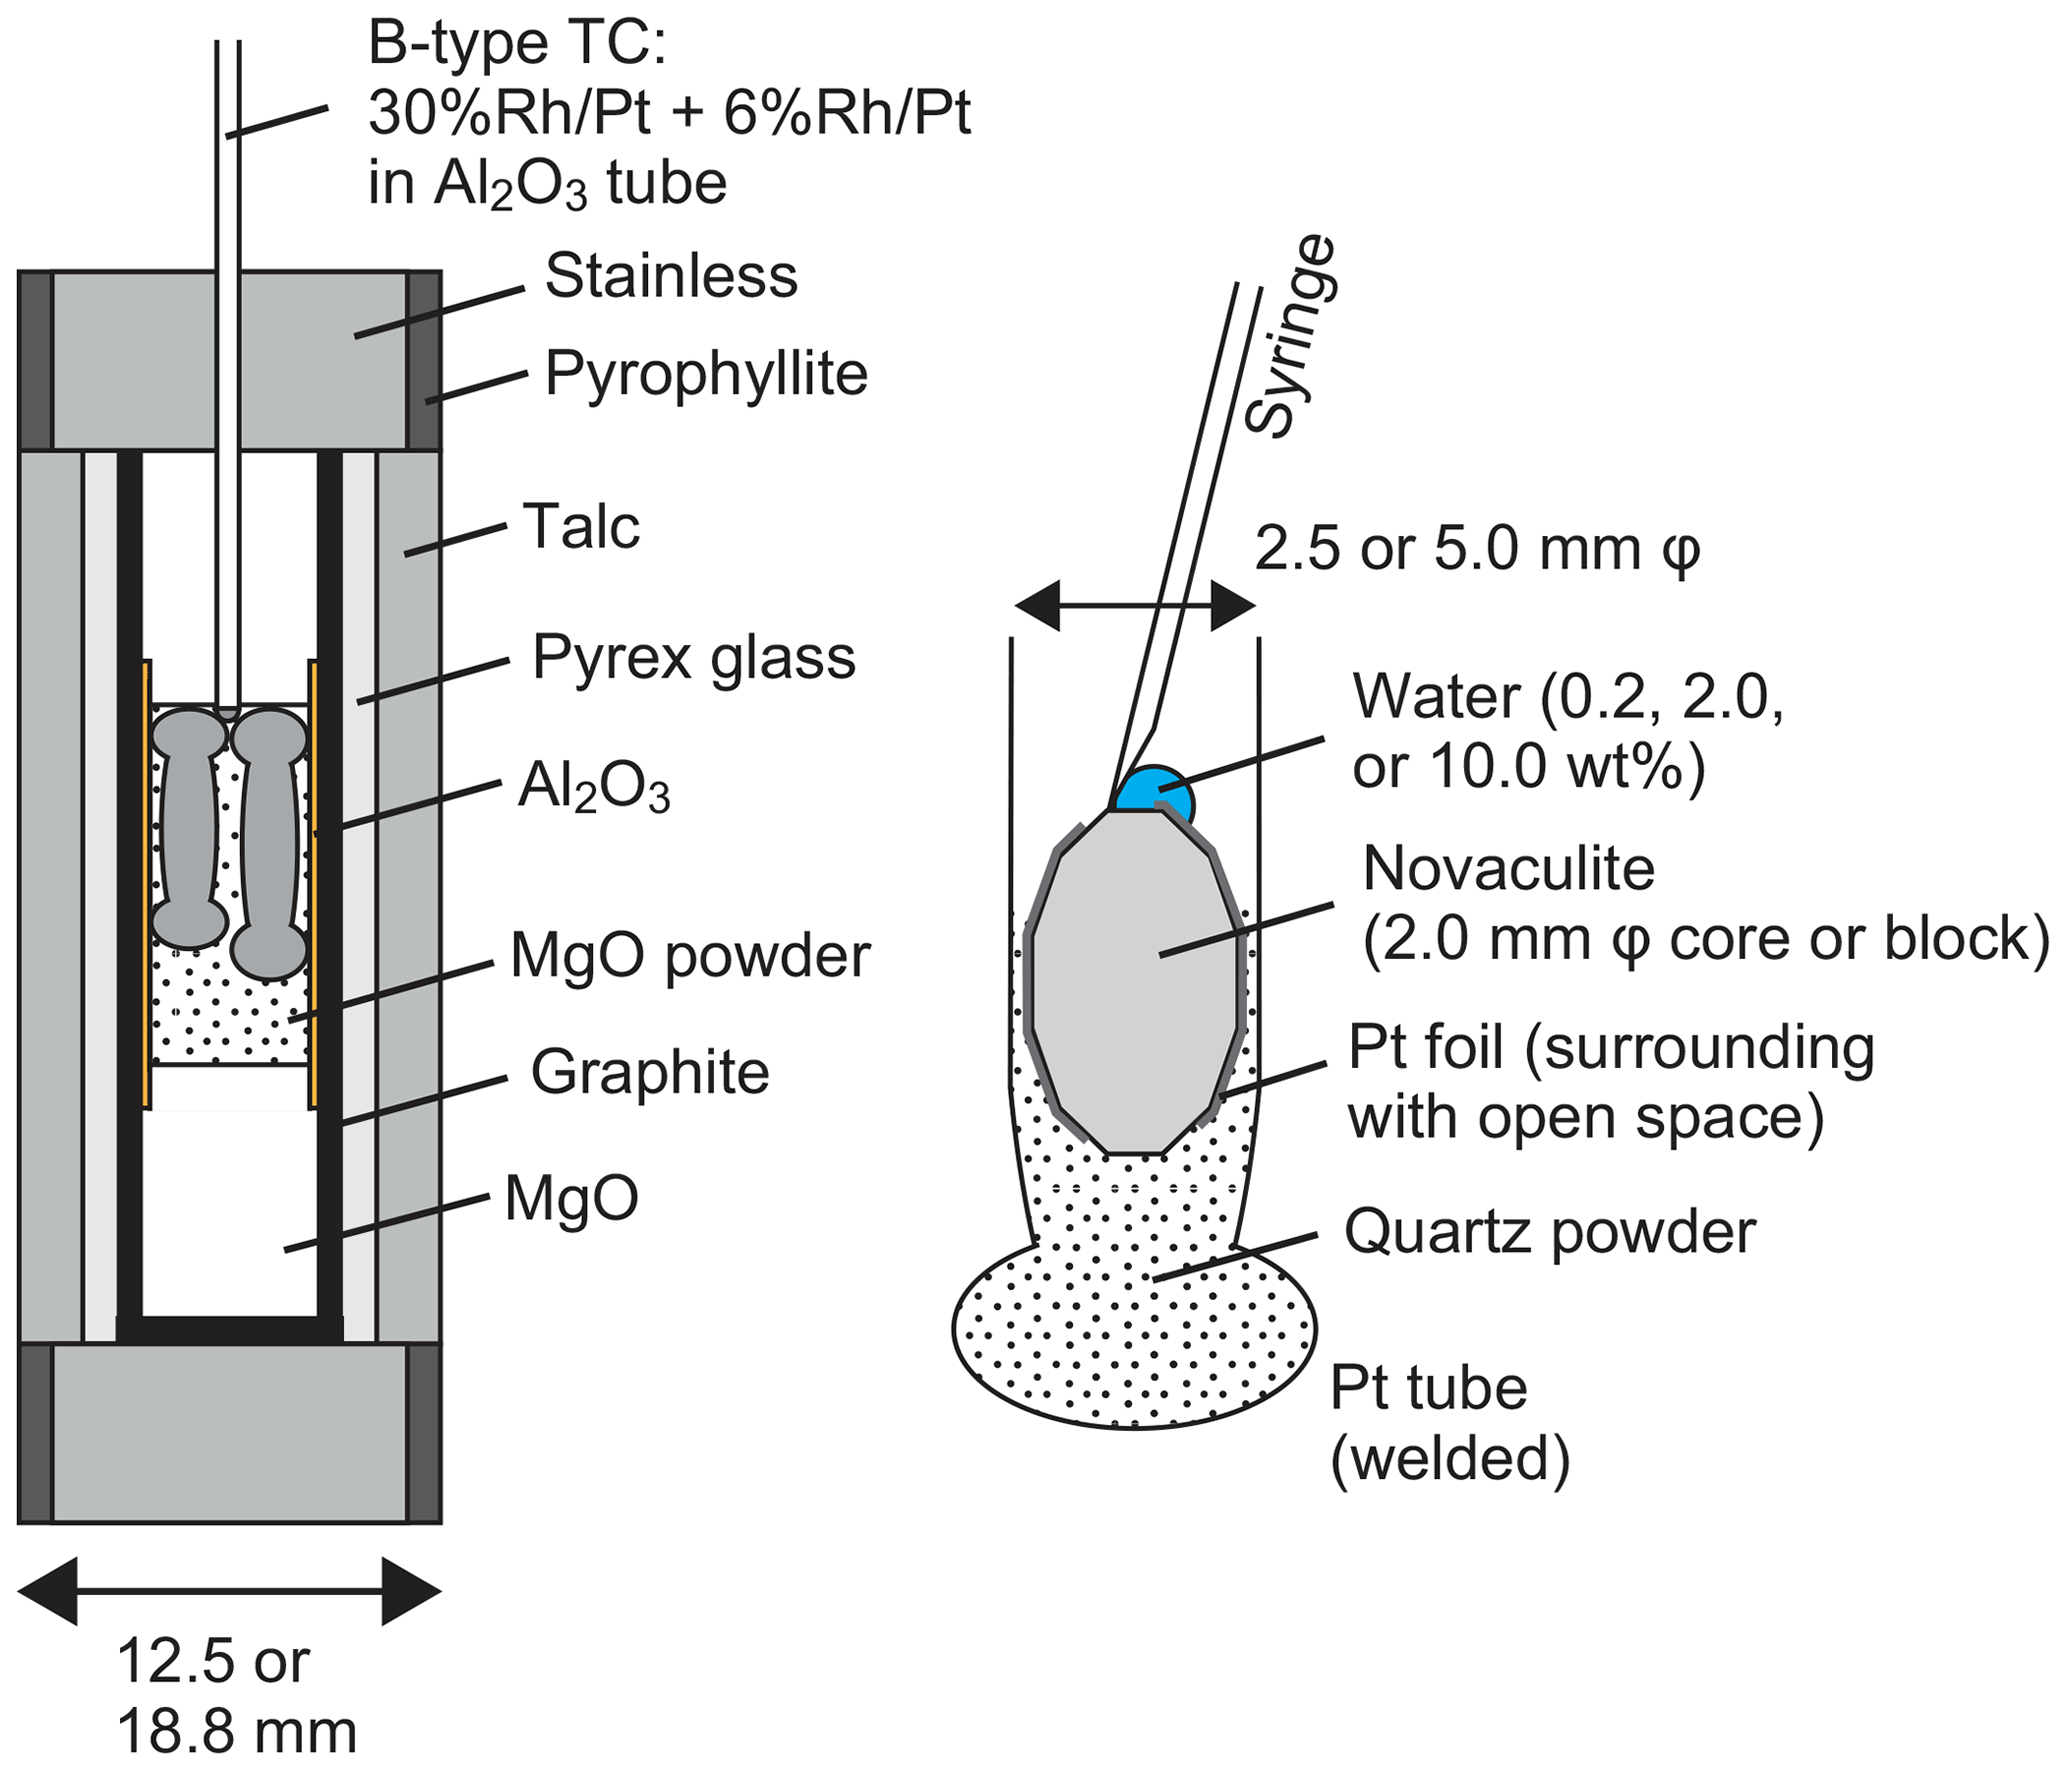
Figure 3Sample assembly (left) and preparation of the novaculite, quartz powder, and water in a Pt tube (right).
We used up to two 2.5 mm diameter Pt capsules for the 12.5 mm assembly and up to three 2.5 mm diameter Pt capsules or one 5.0 mm diameter Pt capsule for the 18.8 mm assembly. The total lengths of the capsules were 10–14 mm. The differences in the lengths of the Pt capsules as well as their orientations distinguished the samples during sample preparation and after the experiments. The preparation of Pt capsules was as follows. First, one side of a Pt tube was welded. Second, a powder sample of ∼0.02 g was put into a welded 2.5 mm Pt tube, or a powder sample of ∼0.1 g was put into a 5.0 mm tube. Third, a similar amount of a novaculite core with a diameter of 2.0 mm was put into the 2.5 mm Pt tube or a novaculite block into the 5.0 mm tube. The powders were compressed by pressing the novaculite samples into the capsules. For some experiments, the novaculite was wrapped in Pt foil, and the presence of this Pt foil was useful in distinguishing samples after experiments in a section of a Pt capsule. Then, water of 0.2, 2.0, or 10 wt % of the total weight of the two samples was added onto the novaculite using a microsyringe. The novaculite was never entirely wrapped in Pt foil so that water could diffuse into the novaculite. Finally, the open side of the Pt tube was weld-sealed. We also prepared another novaculite core or small block that had previously been annealed and dried at 900 ∘C in a furnace and then placed it in a Pt capsule with the powder and the original novaculite. The grain sizes of the dried novaculite after grain growth experiments were not different from those of the original novaculite, and all grain sizes we show in this study were obtained from the original novaculite. We also performed experiments without added H2O (i.e., with only novaculite or with novaculite + powder) to test the effects of adsorbed water on the powder.
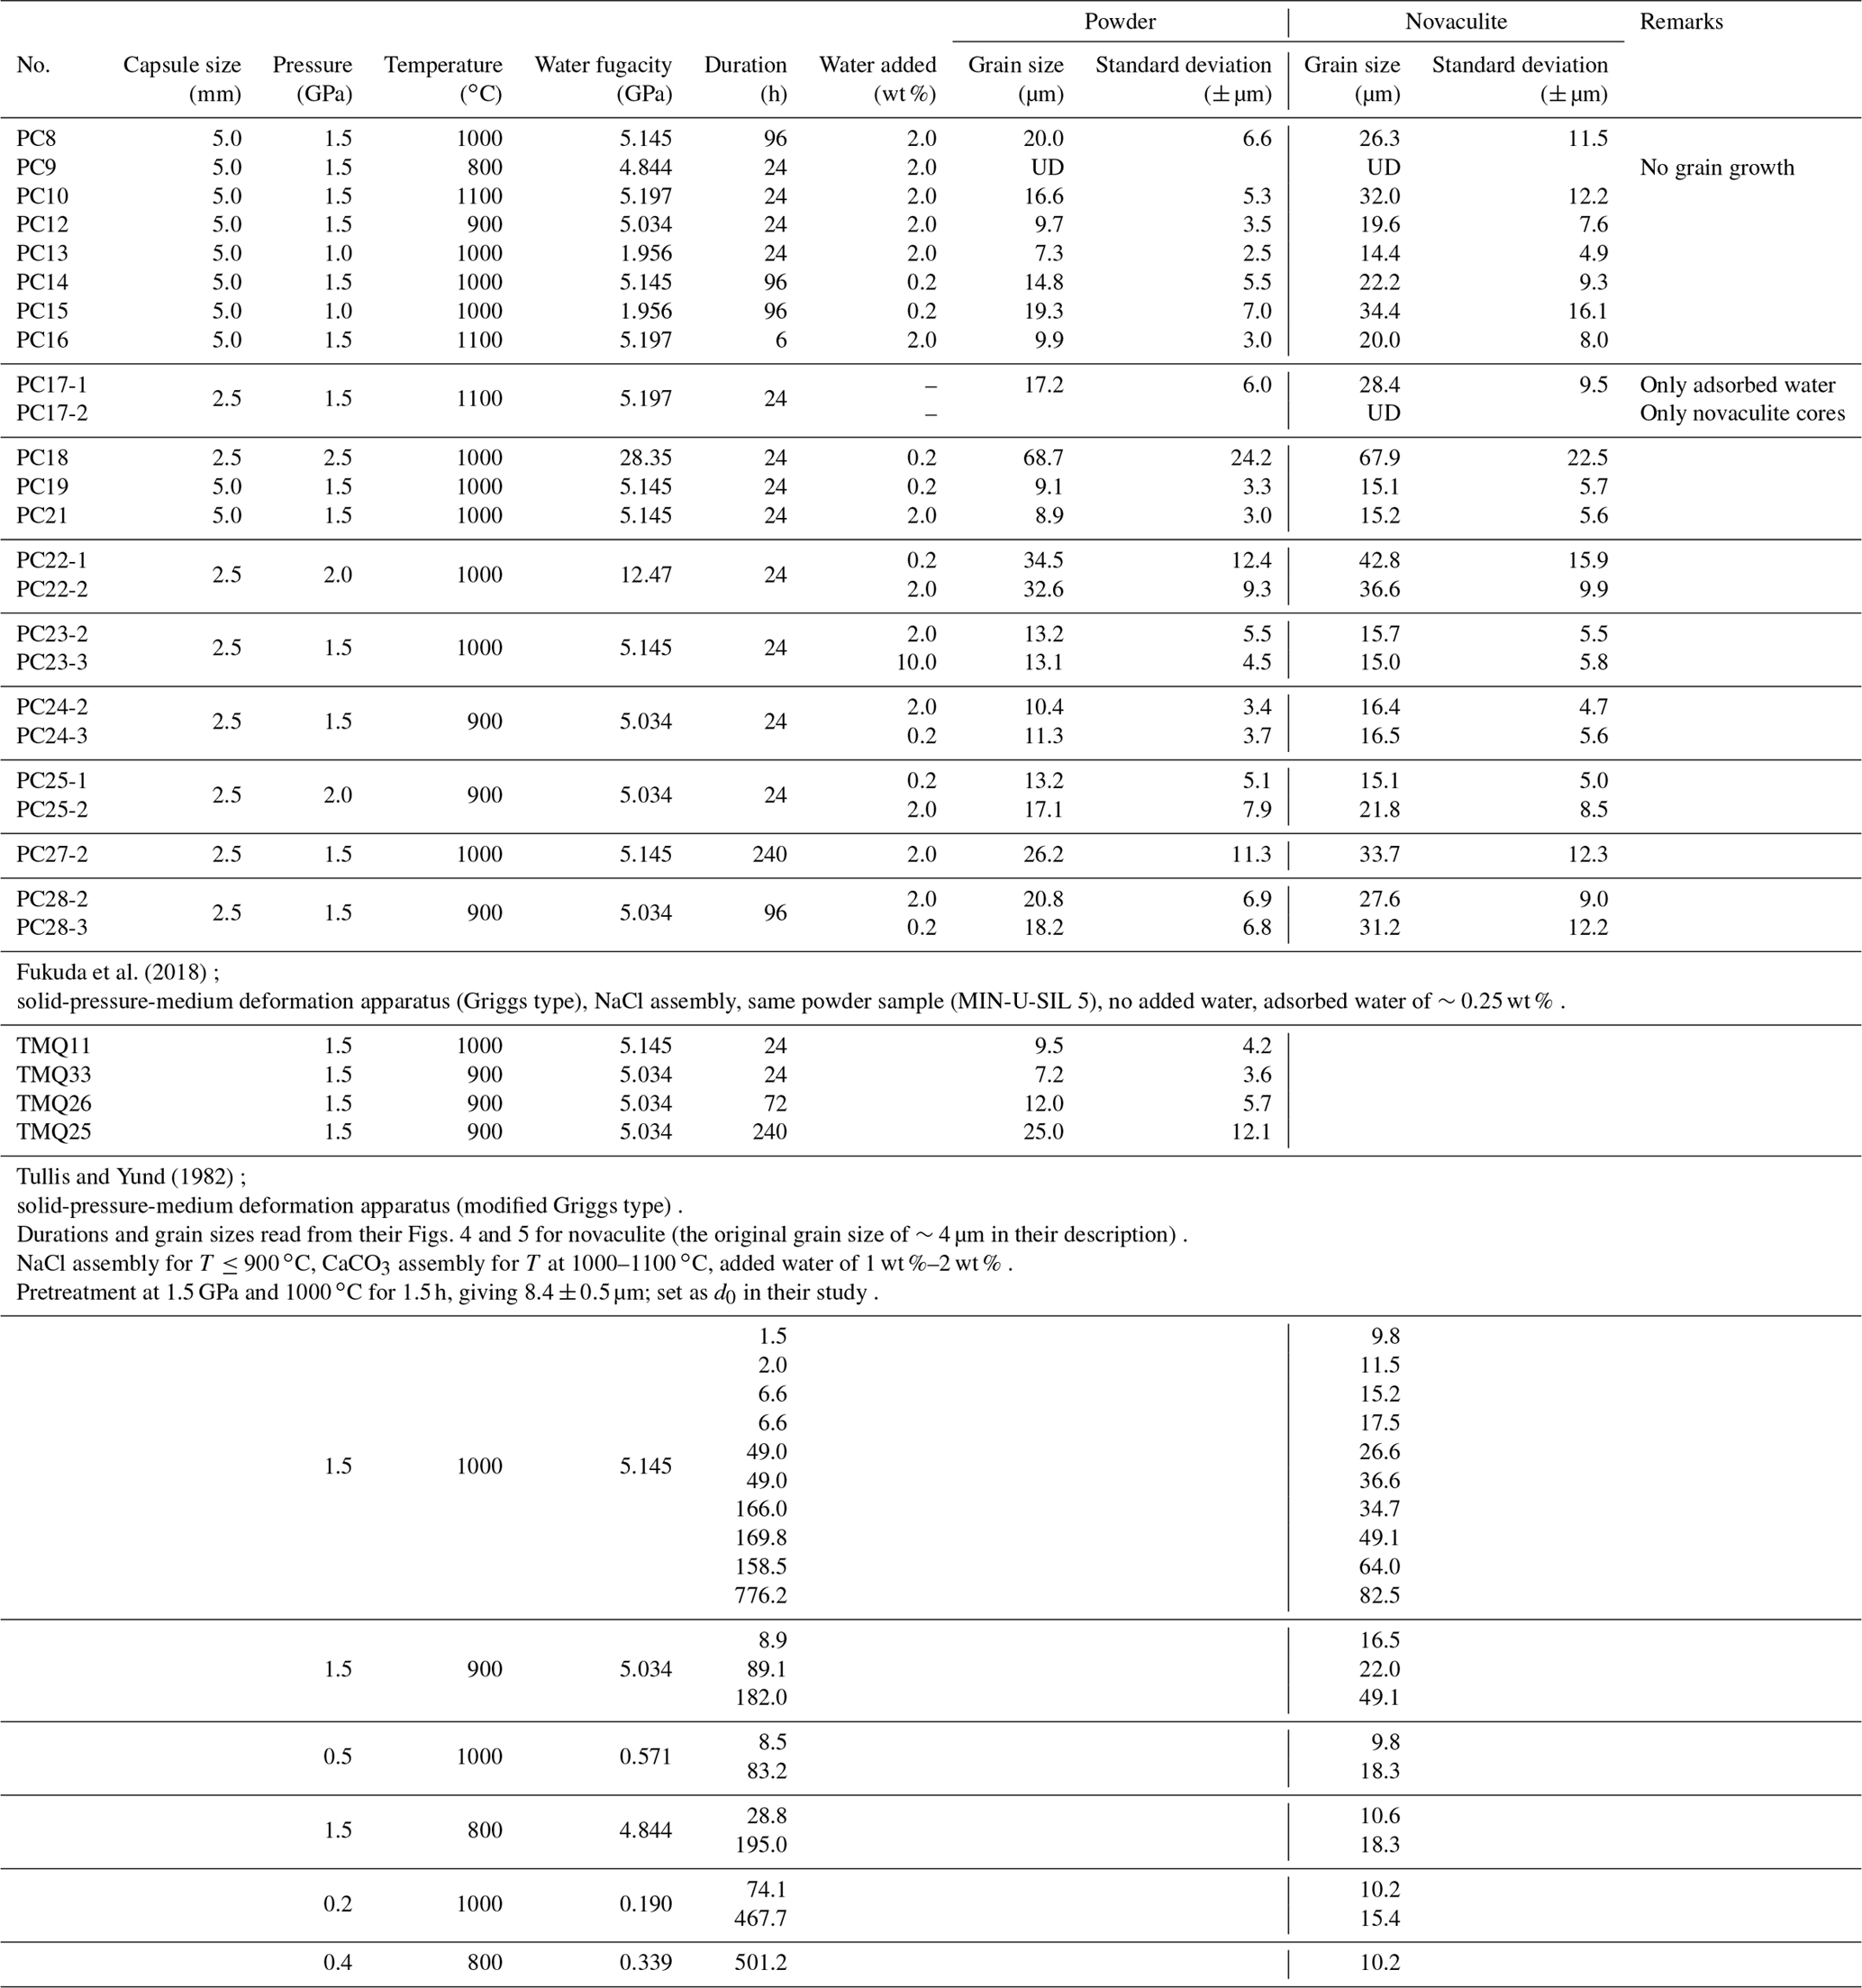
Recovered Pt capsules were cut in half and/or ground along the long axes of the capsules to make thin sections for observation under a polarizing microscope. Epoxy resin was added continuously during thin sectioning to minimize grain plucking from the sample surfaces. Polished sample surfaces and broken surfaces were used for SEM observations after carbon coating. All the experimental conditions and the grain sizes determined are listed in Table 1. Results from Tullis and Yund (1982) for novaculite and Fukuda et al. (2018) for quartz powder (MIN-U-SIL 5) are also shown, and they will be discussed later.
We also used the gas-pressure-medium vessel and performed experiments at 0.3 GPa and 900 ∘C for up to 240 h. However, the powder samples were not sufficiently compressed, and no significant grain growth was observed in either of the samples. Therefore, we will not discuss any further the results from the gas-pressure-medium vessel.
3.2 Grain size analysis after experiments
We determined grain sizes from photomicrographs taken under cross-polarized light, in which each grain is most clearly seen. As the misorientation between grains is always large and grains are not deformed (i.e., no addition of low-angle boundaries), the grain size analysis yielded similar results to the EBSD band contrast images (Fig. 1i). We outlined grains and determined grain sizes using Image J as diameters of equivalent circles (root mean square). Some of the recovered samples showed open grain boundaries that were visible in the photomicrographs, especially when grain sizes were relatively large (ca. > 15 µm; shown below). In such cases, the grains were visible in reflected light, and the grain sizes determined using this mode of observation were not different from those determined using cross-polarized light images. When grains were very small, not every grain could be distinguished under reflected light or with the SEM.
4.1 Observations by light microscopy and grain sizes
Representative light photomicrographs are shown in Fig. 4. The figures include two parts in the case that both the powder and novaculite samples were used together. We refer to “powder sample” or “powder” for convenience, even though the starting material becomes compacted during the experiments. Figure 5 shows the results of representative grain size analyses in our experimental series for which the average grain sizes are small, medium, and large. The grain sizes of the novaculite are up to twice as large as those of the powder samples when the grain sizes are small (< 10 µm). As observed under plane-polarized and reflected light, grain boundaries are usually open (compare Fig. 4a–i), and the openings probably developed during unloading. The open grain boundaries caused grain plucking during thin sectioning, as described previously by Tullis and Yund (1982). Therefore, porosities cannot be clearly determined, but the porosities of the powder samples appear to be higher than those of the novaculite samples (Fig. 4b, e, and h). All the determined grain sizes are listed in Table 1. Grain size heterogeneities were not observed in the Pt capsules, and the choice of capsule diameter (2.5 or 5.0 mm) did not result in any difference in grain size.
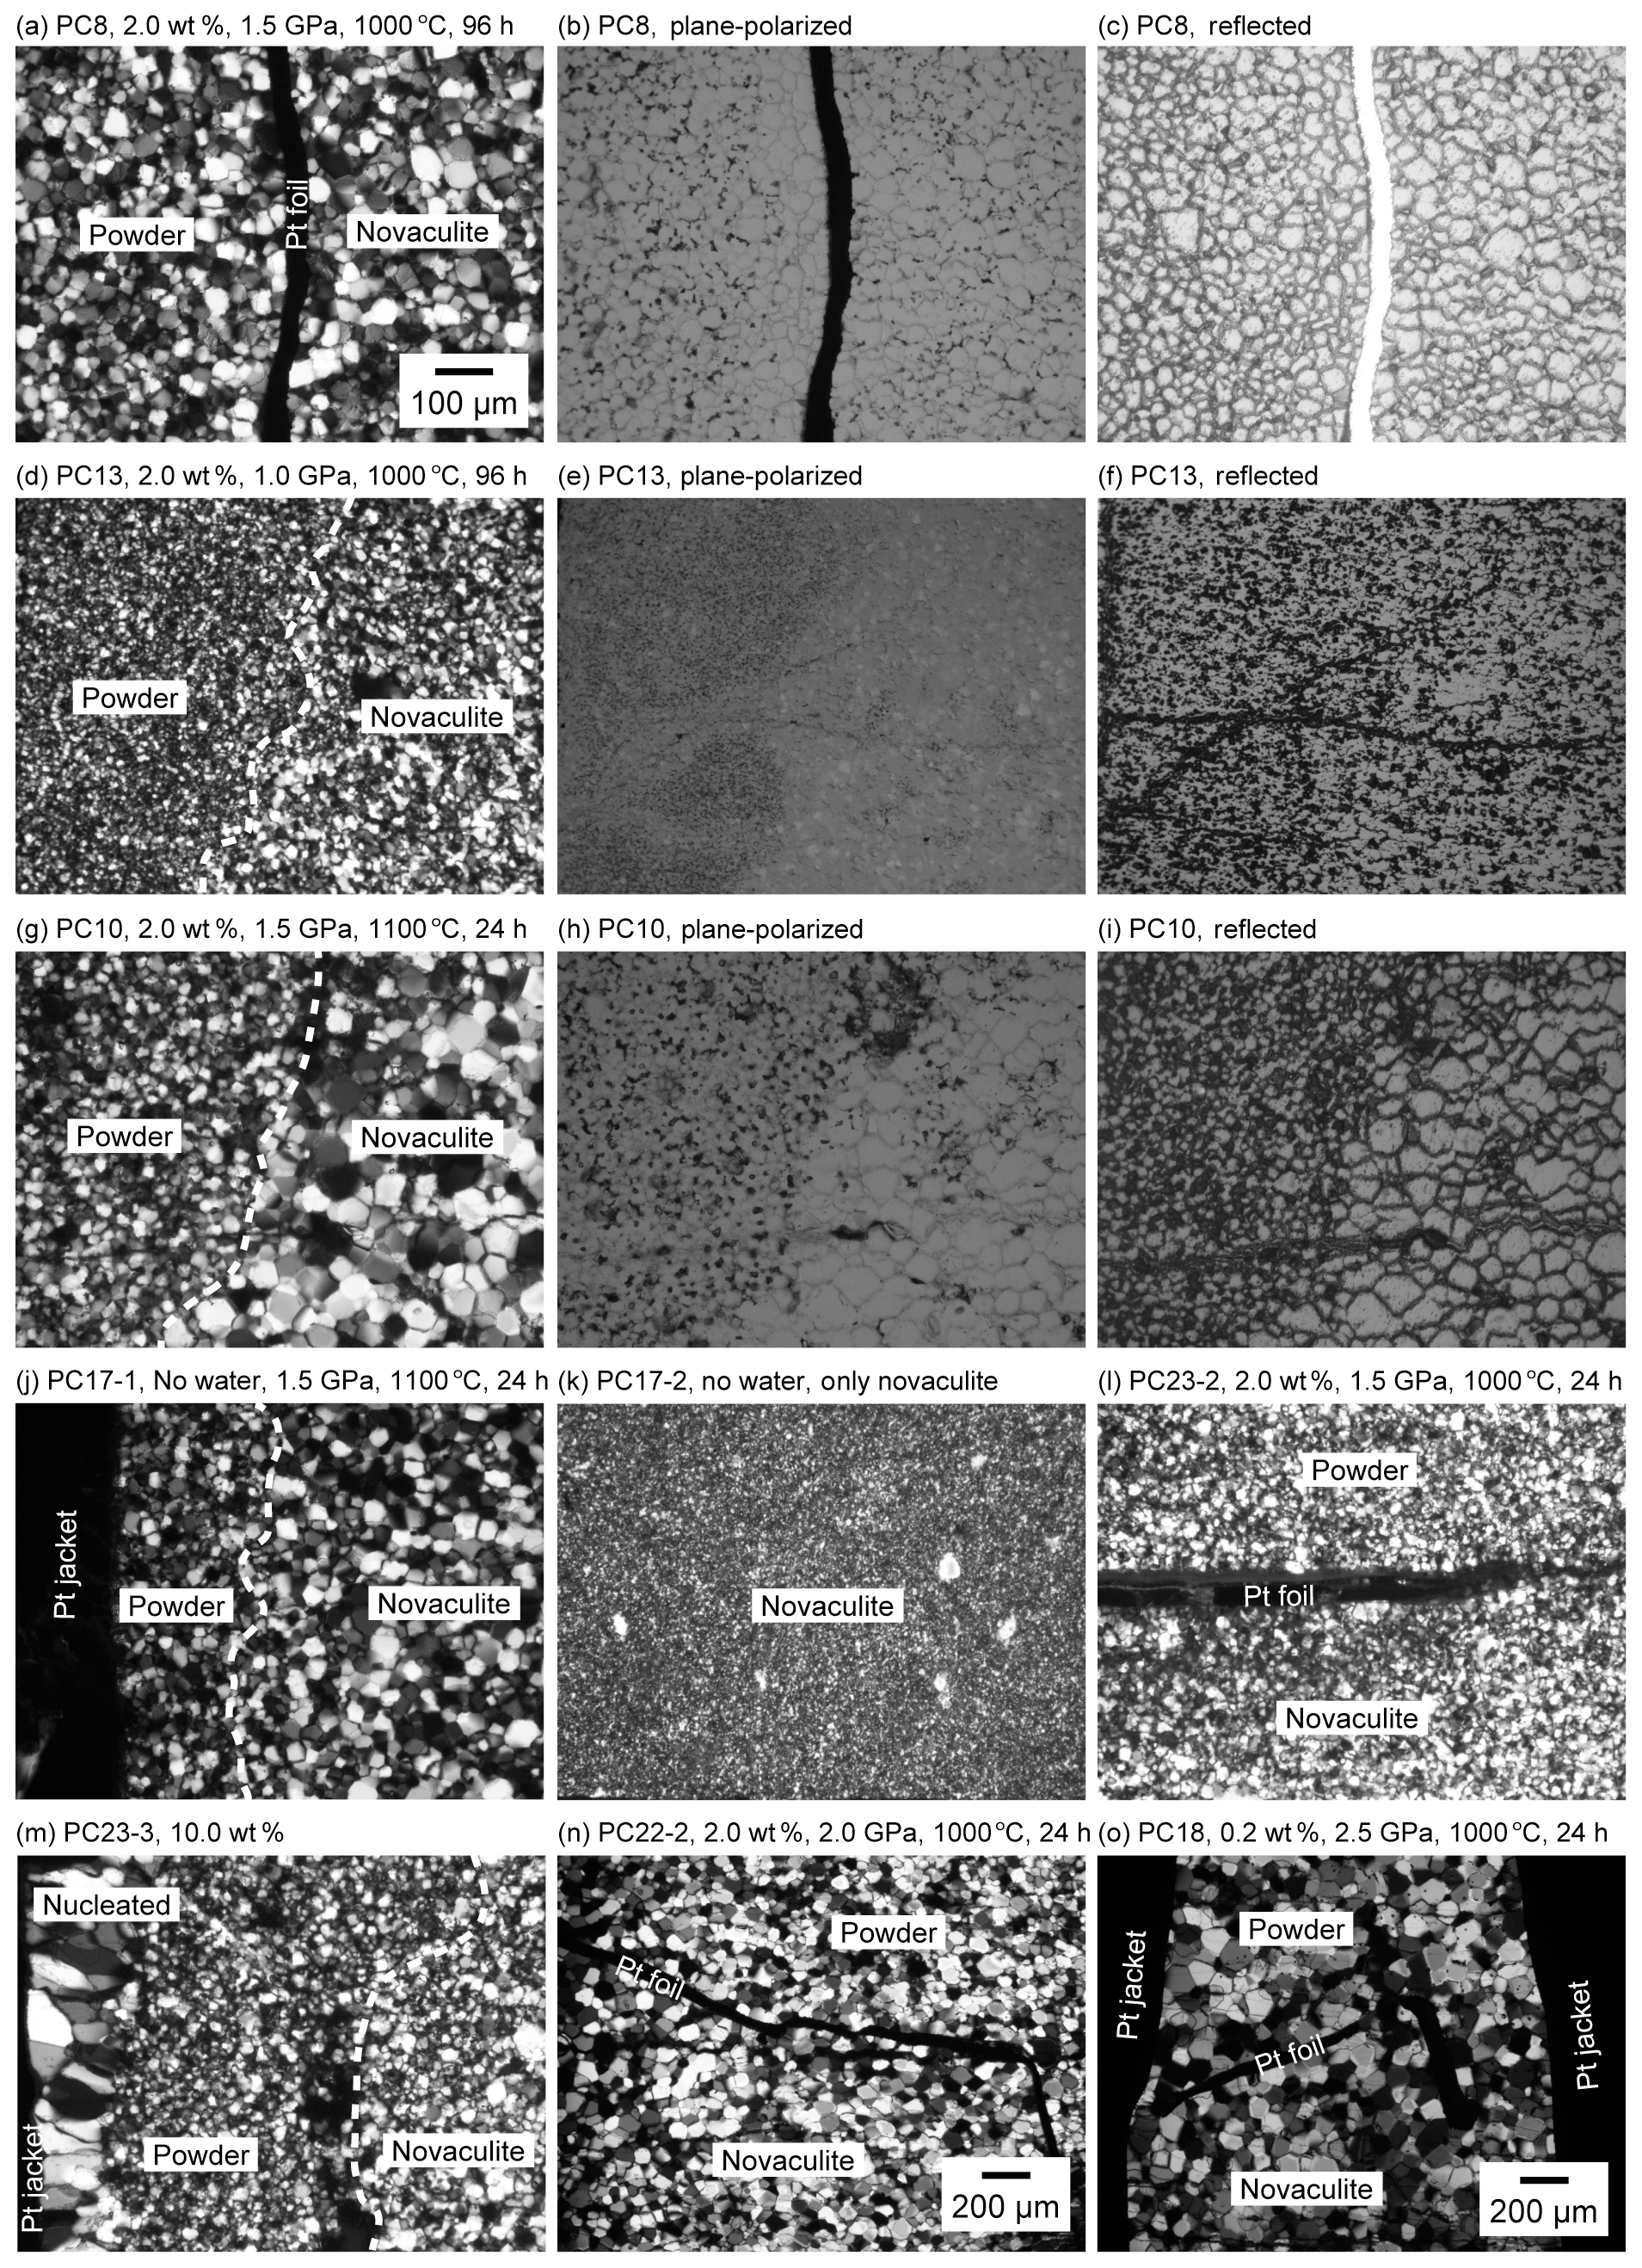
Figure 4Light photomicrographs of the samples after experiments. Photos taken under plane-polarized or reflected light are labeled as such. The other photos were taken under cross-polarized light. Boundaries between the quartz powder and novaculite samples are marked by Pt foils or dashed lines. The magnification for photos without scale bars is the same as that for (a).
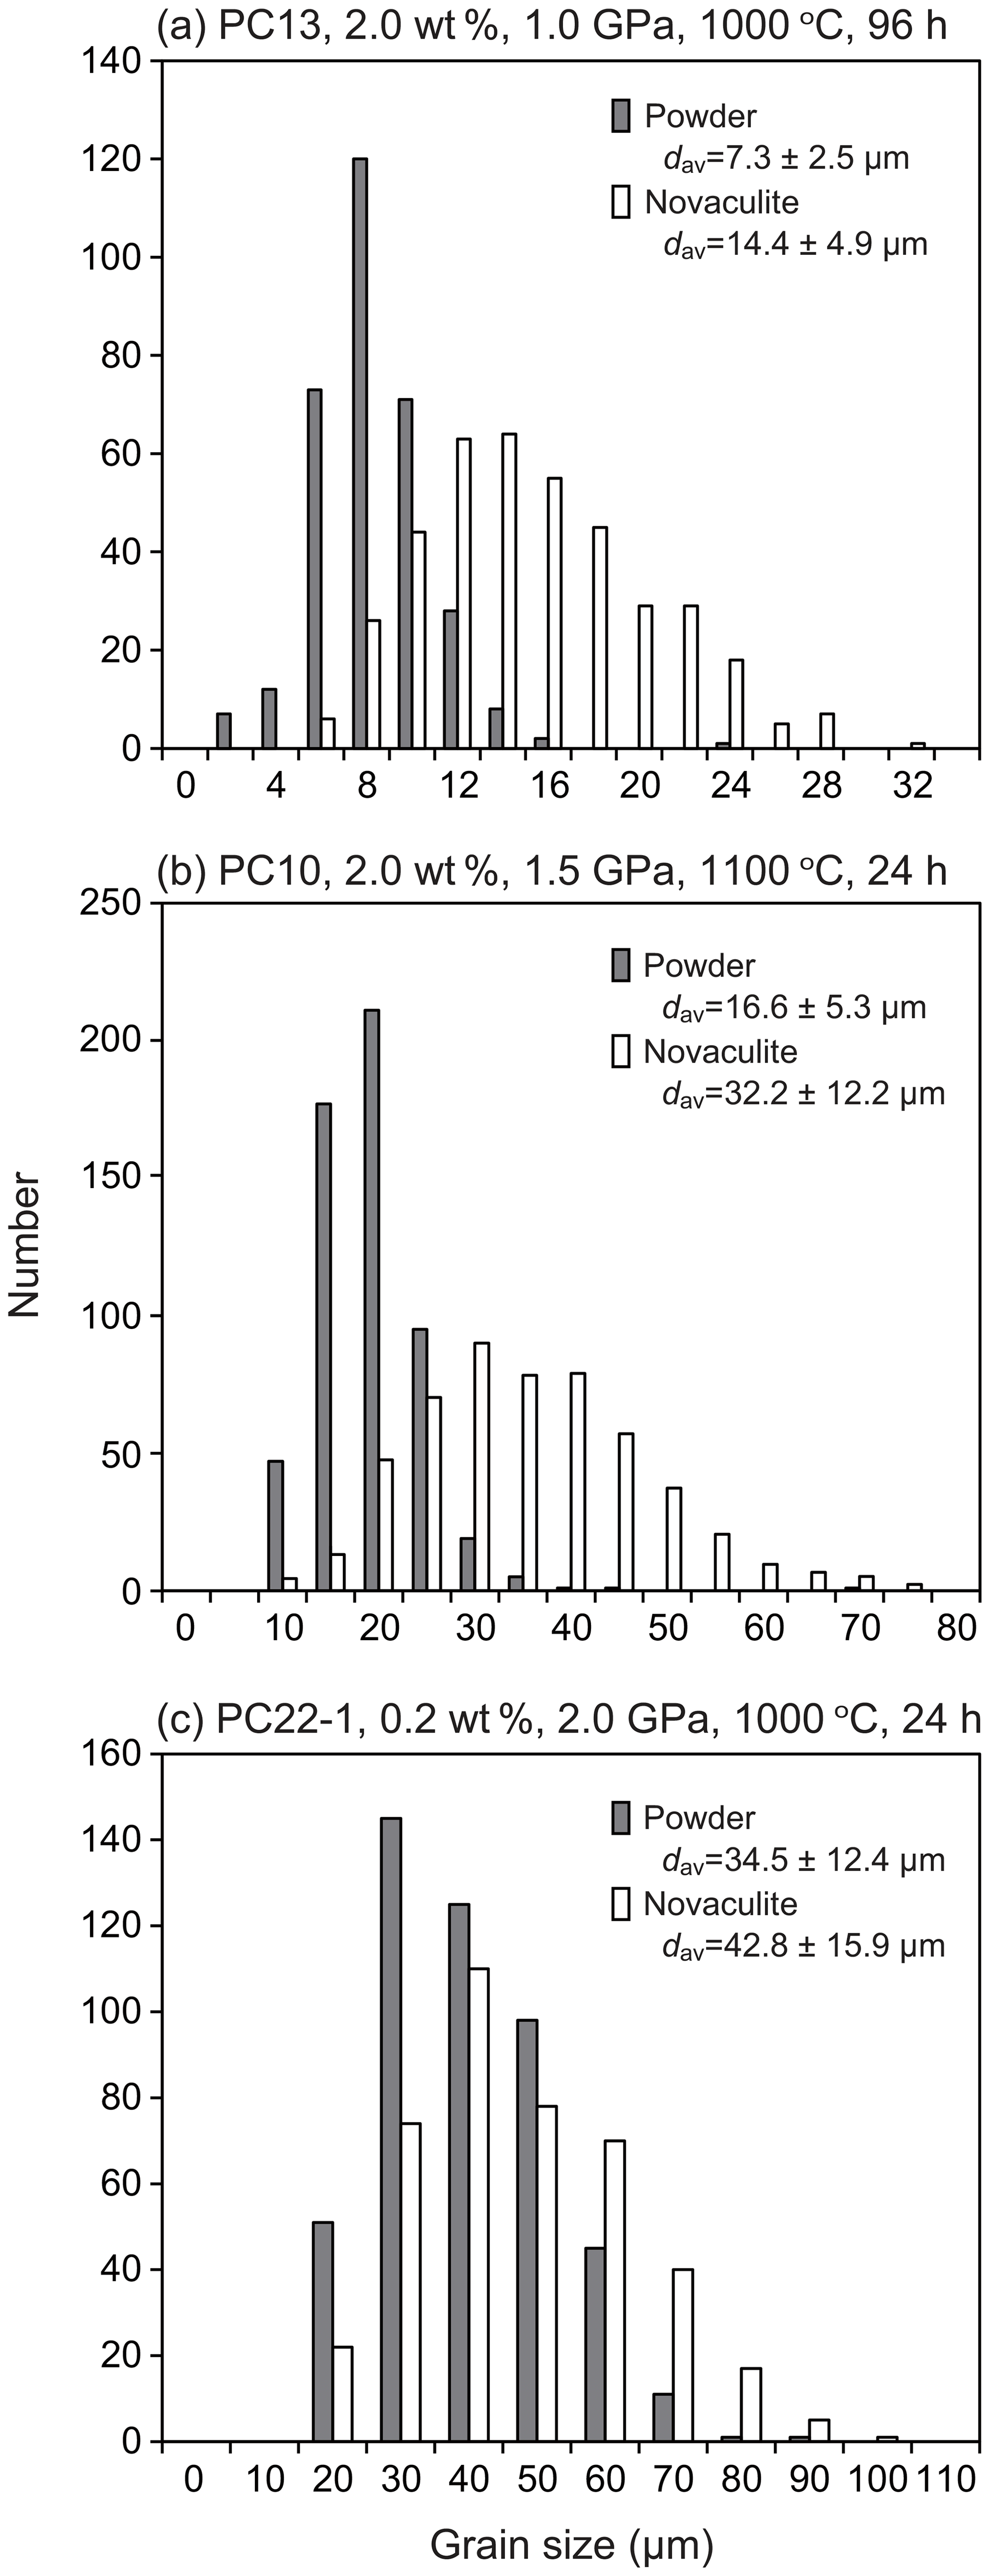
Figure 5Examples of grain size analyses for (a) small, (b) medium, and (c) large grain sizes in our experimental series.
The grain sizes increased with increasing pressure (compare Fig. 4a and d; Fig. 4l, n, and o), temperature (Fig. 4g and l), and duration of the experiment (Fig. 4a and l). See also Table 1 for other experimental results. The grain sizes were similar regardless of whether or not water was added to the powder and novaculite (e.g., Fig. 4g, where 2.0 wt % of water was added, and Fig. 4j, where no water was added). On the other hand, when novaculite only was used without water and no water was added initially, no grain growth was observed (Fig. 4k). This was also described by Tullis and Yund (1982). Thus, the water adsorbed on the powder, representing a proportion of ∼0.25 wt %, was sufficient to enhance grain growth in the samples composed of powder + novaculite. The rate of grain growth did not increase with added water of 0.2, 2.0, or 10 wt % (Fig. 4l and m). However, when 10 wt % water was added, epitaxial growth of quartz grains in the Pt jacket was observed, and the aspect ratios of these grains were up to 4:1 with long axes up to 150 µm (Fig. 4m). The long axes of these grains are aligned perpendicular to the Pt jacket and inner sample. The crystallographic orientations of epitaxially grown grains would correspond to those of the seed crystals in the sample (namely, neighboring power and/or novaculite) on which quartz grains epitaxially grow, similar to studies for quartz vein formations (e.g., Cox and Etheridge, 1983, from natural samples; Okamoto et al., 2011, from experimental samples and simulation). The epitaxial growth of quartz probably occurs because of the separation of the Pt jacket from the sample as a consequence of the injection of pore fluid.
As the grain sizes of the powder and novaculite samples increased, the differences in their grain sizes were reduced (Fig. 6). When the grain sizes of the powder samples were < 10 µm, the grain sizes of the novaculite samples were twice as large. The largest grain size of powder in our experiments was ∼70 µm, obtained at 2.5 GPa and 1000 ∘C for 24 h (PC18; Table 1). In this experiment, the grain sizes of the two samples were not different (Fig. 6). Since the initial grain sizes of the two samples were similar (d0 of the powder was 2.4 µm and d0 of the novaculite was 3.1 µm), the similar largest grain sizes of the two samples probably resulted from the closing of pores in the powder samples as grain sizes increased (compare Fig. 4b, e, and h and the SEM observations shown later).

Figure 6Grain size ratios between the novaculite and quartz powder samples. The ratios decrease with increasing grain size for both types of quartz sample. This is related to the closing of pores in the quartz powder samples.
4.2 Observations by SEM
We used the SEM to observe microstructures on the polished and broken surfaces of the two types of quartz sample (Fig. 7). The SE images of the polished surfaces showed voids with sizes similar to the quartz grain size, especially when the average grain size was small (Fig. 7a and b). These voids were most likely caused by the plucking of grains during thin sectioning. Such voids were less commonly observed when the average grain sizes were larger than ca. 20 µm (Fig. 7c and d). Other smaller voids may represent either plucked grains or pores (Fig. 7a–d). Similar features were observed in the starting novaculite sample (Fig. 1g). Porosities might be reduced with increasing grain size.
The SE images of the broken surfaces show angular grains and straight grain boundaries regardless of grain size (Fig. 7e–h), and similar features were seen in the starting novaculite (Fig. 1h). Although our experiments confirmed the role of water in enhancing grain growth, the broken surfaces did not show the water pockets or rough–irregular grain surfaces that were considered by previous researchers to be associated with the dissolution–precipitation of quartz by water (Mancktelow and Pennacchioni (2004) for wet deformed natural samples and den Brok and Spiers (1991) and Vernooij et al. (2006) for wet deformed experimental samples). The cathodoluminescence (CL) image in Fig. 7i shows dark-colored cores in single quartz grains inside a Pt jacket. The quartz grains that grew epitaxially from the Pt jacket, as seen in the sample with 10 wt % water added (Fig. 4m), did not show such a contrast in core and mantle colors.
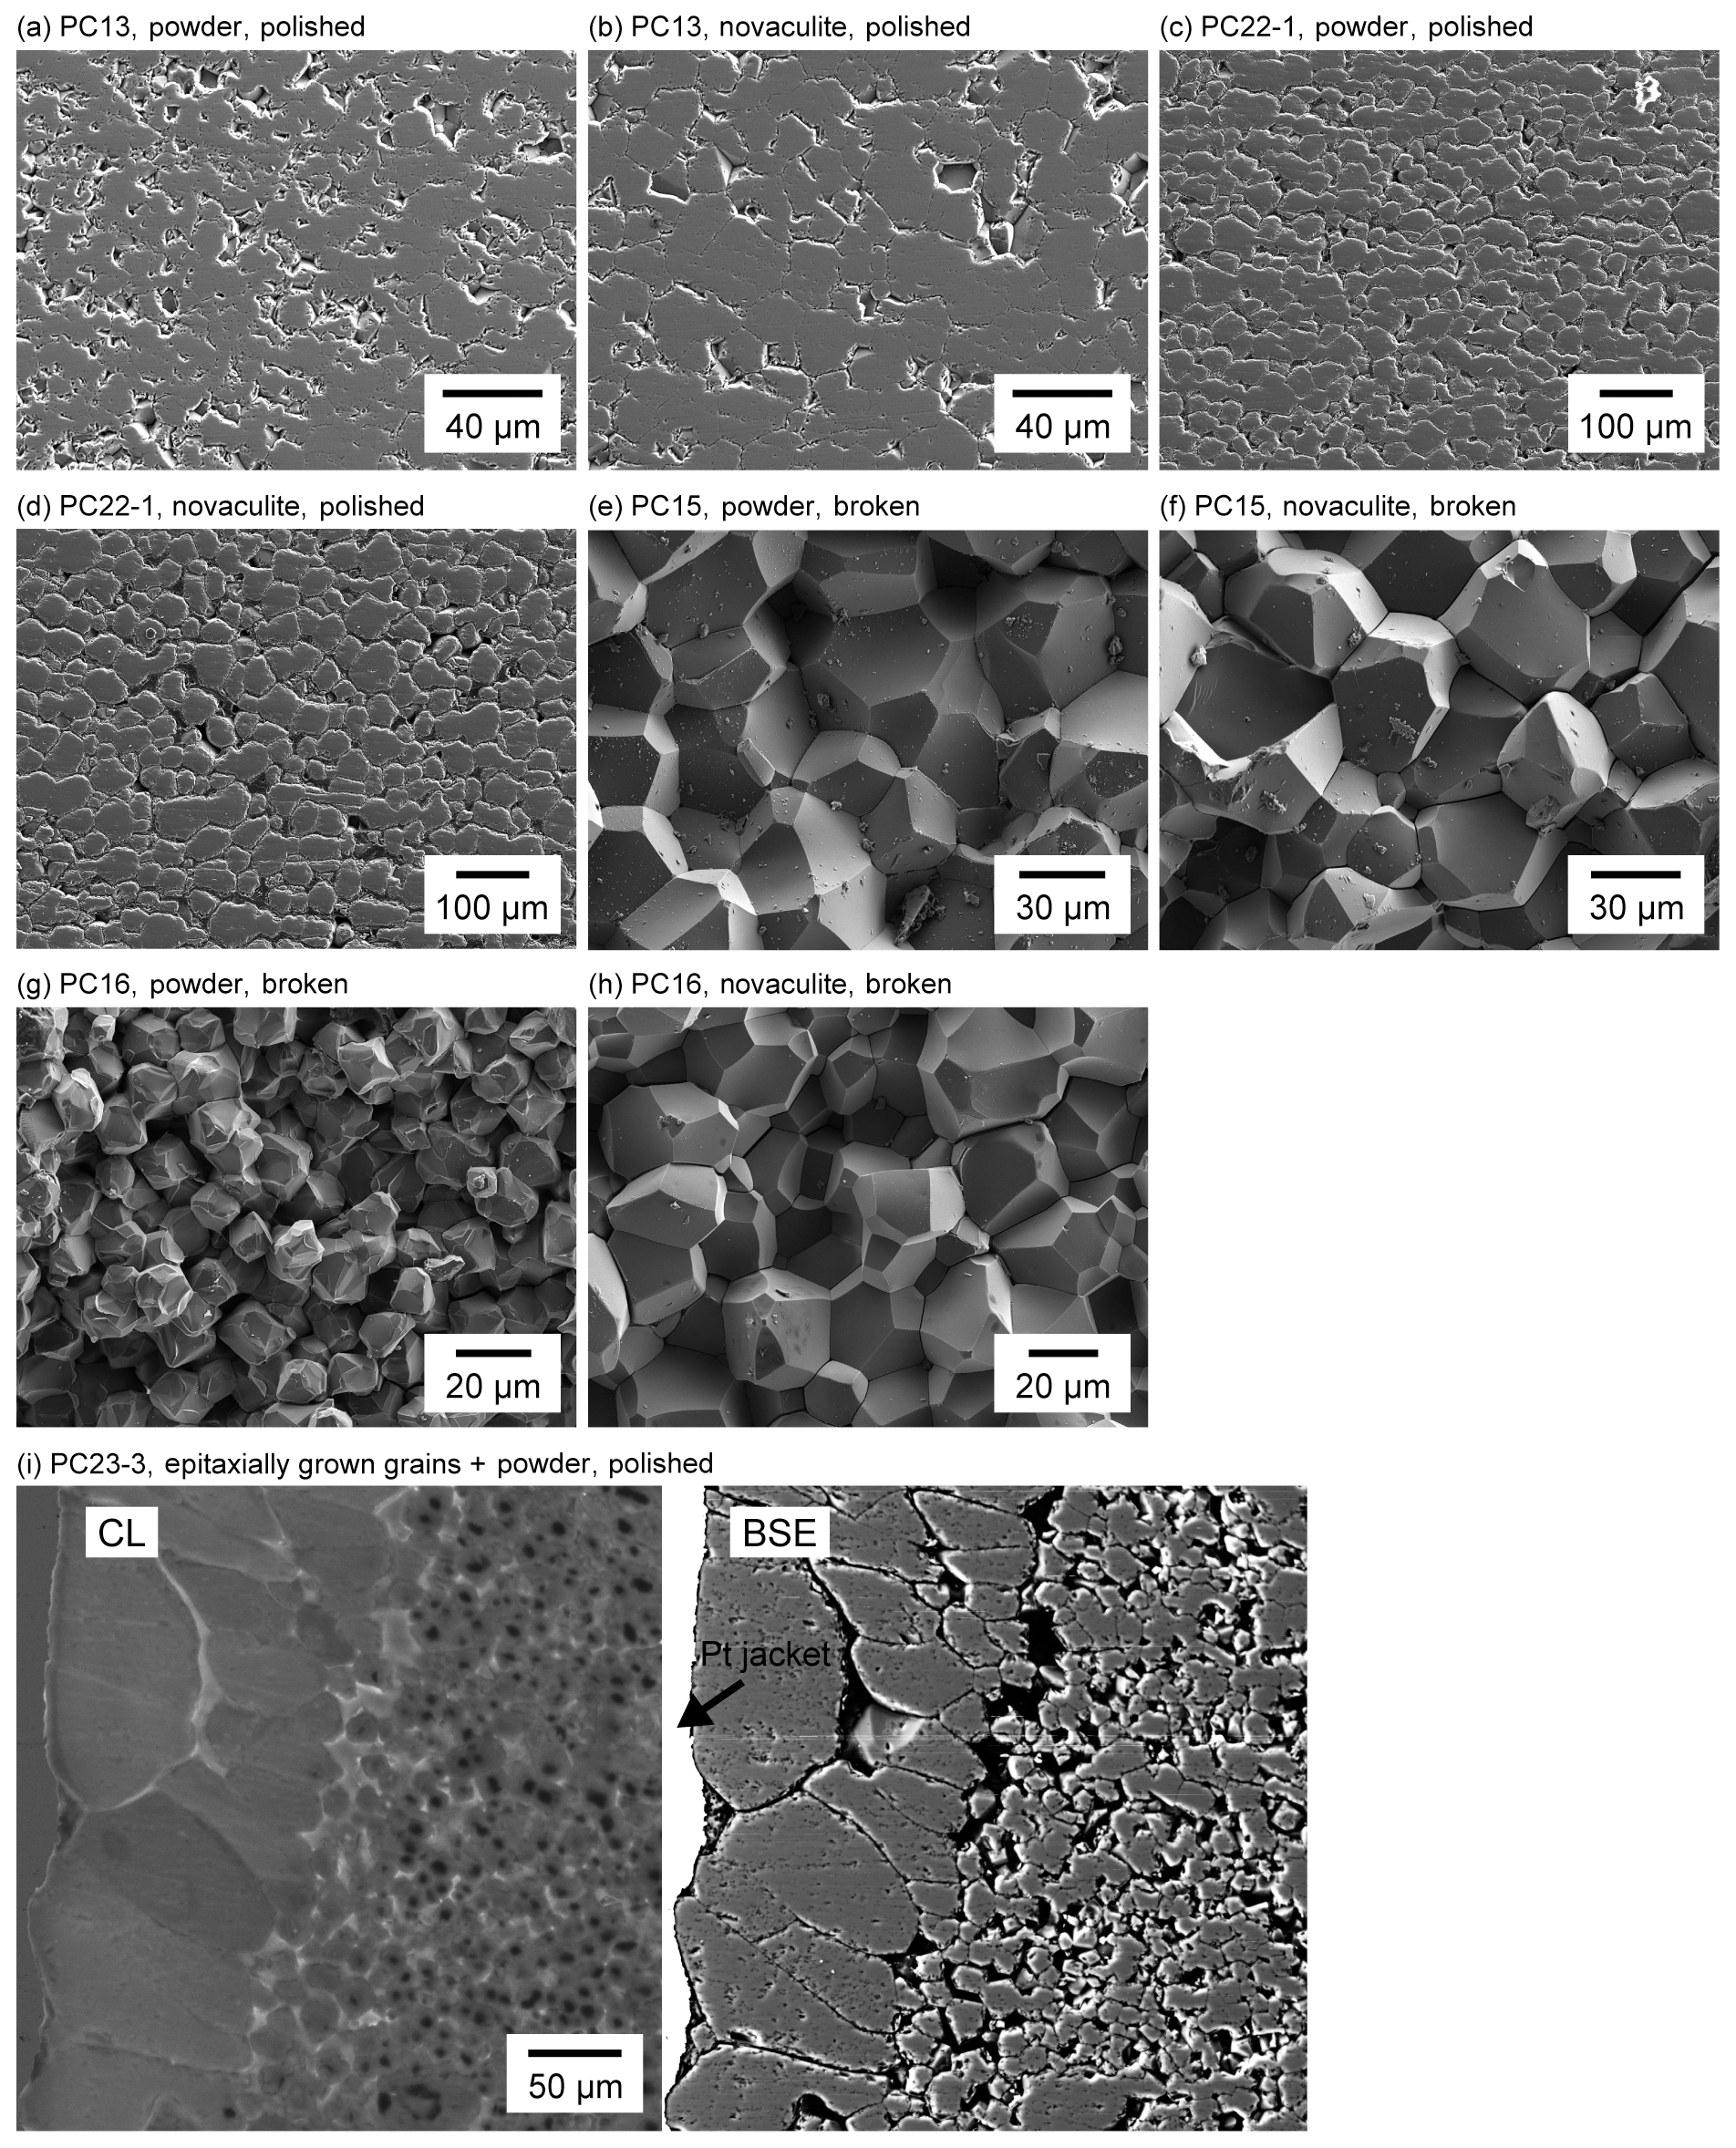
Figure 7SEM images of samples after experiments. (a–d) SE images of polished surfaces. (e–h) SE images of broken surfaces. (i) CL image (left) and BSE image (right) including a Pt jacket part (labeled in the BSE image) where epitaxial growth was observed (the powder part is on the inside).
4.3 Grain growth parameters
We determined grain growth parameters from grain sizes of the powder and novaculite samples obtained at different pressures, temperatures, and durations (Table 1). Figure 8a shows grain sizes of the two samples for different durations and a fixed pressure condition of 1.5 GPa. We also plotted grain size data from Tullis and Yund (1982) for novaculite and from Fukuda et al. (2018) for the powder (MIN-U-SIL 5). Tullis and Yund (1982) subjected their material to “pre-grain growth” treatment at 1.5 GPa and 1000 ∘C with 1 wt %–2 wt % added water for 1.5 h before performing their targeted pressure and temperature condition experiments. The pre-grain growth produced a grain size of 8.4 µm, which was set as d0. They then performed experiments at 0.2–1.5 GPa and 800–1100 ∘C for up to ∼776 h (Table 1). They obtained large data sets at 1.5 GPa and 1000 ∘C, which we have plotted in Fig. 8. However, their data for other PT conditions are limited, and any trends are unclear, so those data are only listed in Table 1. Since we assume a grain growth law of Eq. (1), the slopes of should be unity for specific n values, which were determined from Fig. 8b. The averaged n values for the powder and novaculite in our experiments were and 2.9±0.4, respectively. Our data set for the novaculite at 1.5 GPa and 1000 ∘C in Fig. 8b is similar to the data set of Tullis and Yund (1982) for their novaculite, since Fig. 8b excludes differences in d0 values. The n value calculated from the data of Tullis and Yund (1982) for these conditions is 2.6±0.3, which is consistent with our value.
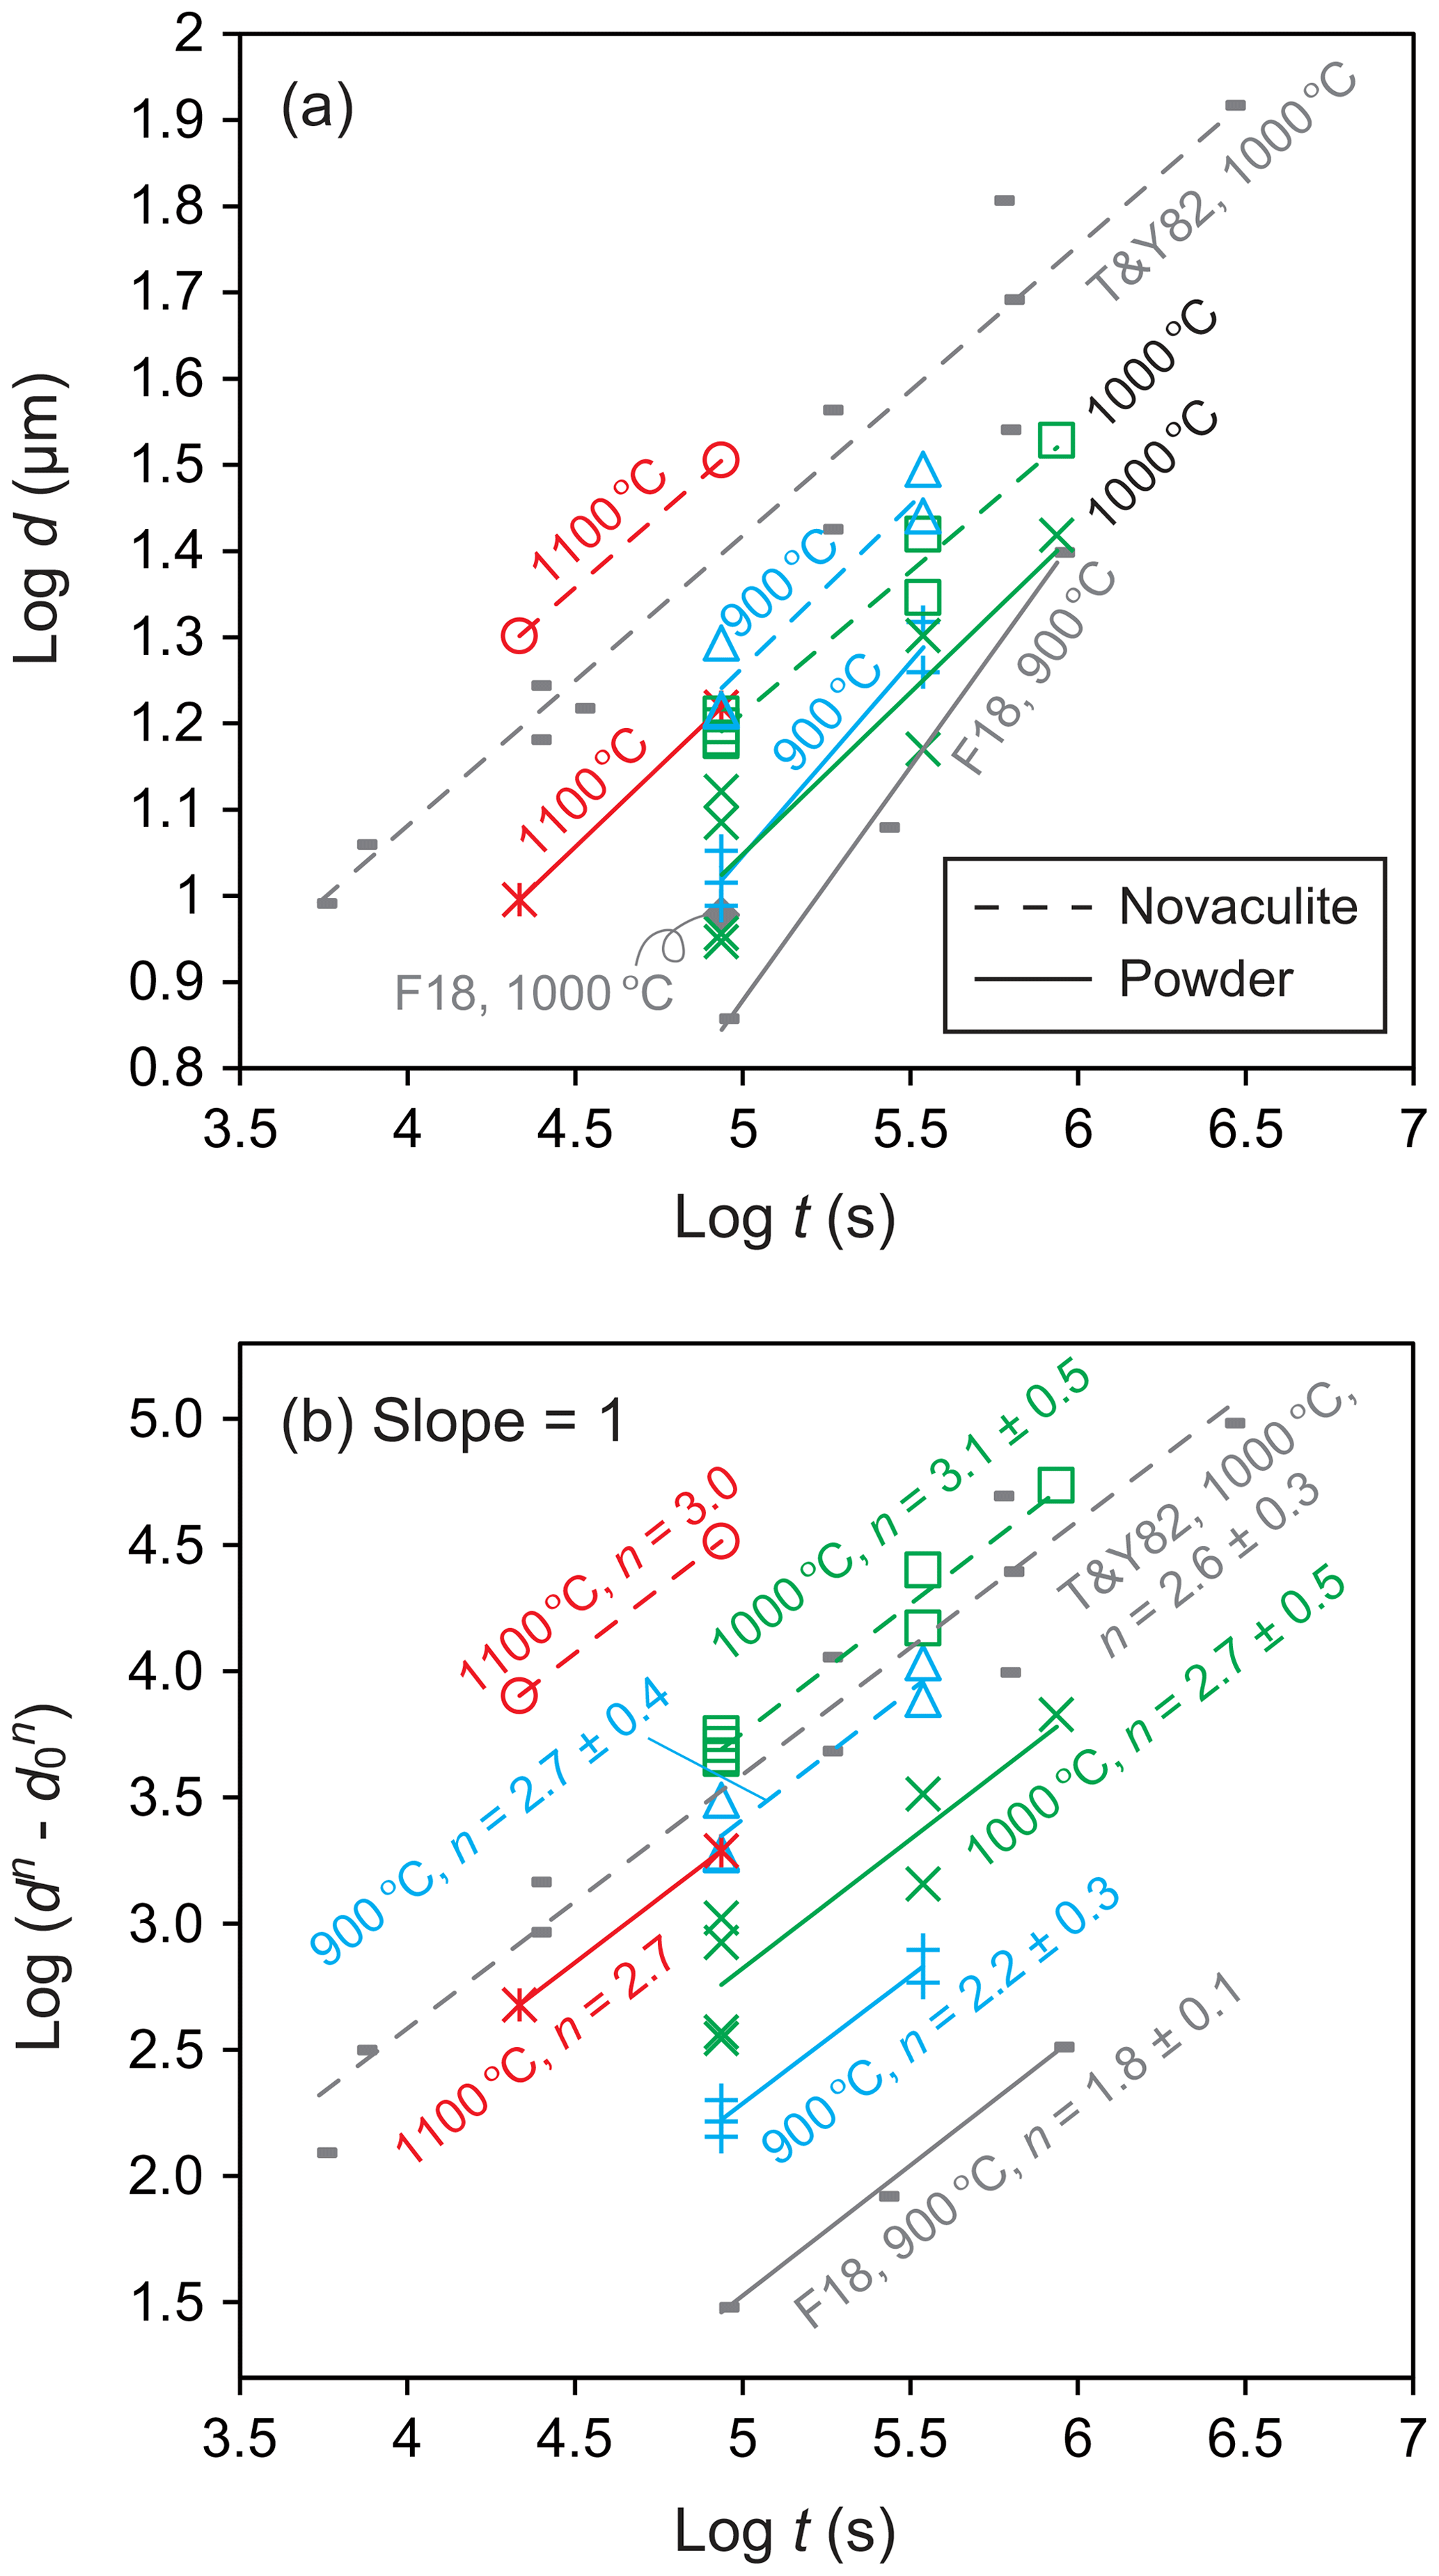
Figure 8Grain sizes at a pressure of 1.5 GPa and for different durations; (a) log d; (b) log ) with changing n values to obtain slopes = 1. Grain sizes in micrometers (µm). Also shown are data from Tullis and Yund (1982) (denoted as T&Y82) for novaculite and from Fukuda et al. (2018) (F18) for powder.
To evaluate the water fugacity dependency, we performed experiments at 1000 ∘C and 1.0–2.5 GPa, which correspond to water fugacities of 2.0–28.4 GPa (Table 1). The grain sizes of the powder and novaculite varied widely from 7.3 to 68.7 µm and from 14.4 to 67.9 µm, respectively. The largest grain sizes of both samples were not different in this experimental series at 2.5 GPa. Following the grain growth law (Eqs. 1 and 3), the relationships between and , in which the slopes correspond to the water fugacity exponent r, are fairly clear for the powder and novaculite with their n values determined above (Fig. 9). The r values determined are 2.3±0.3 for the powder and 1.9±0.4 for the novaculite. The activation energies were determined with these n and r values to be 48.2±34.2 kJ mol−1 for the powder and 59.9±48.8 kJ mol−1 for the novaculite (Fig. 10). The errors are relatively large, and this may be due to dissolution–precipitation and changes in wetting angles under different conditions of pressure and temperature, which we will discuss below.
We determined the constant k0 (µmn MPa−r s−1) for the two samples using all the experimental data in our study and then obtained the following grain growth law defined by Eqs. (1) and (3).
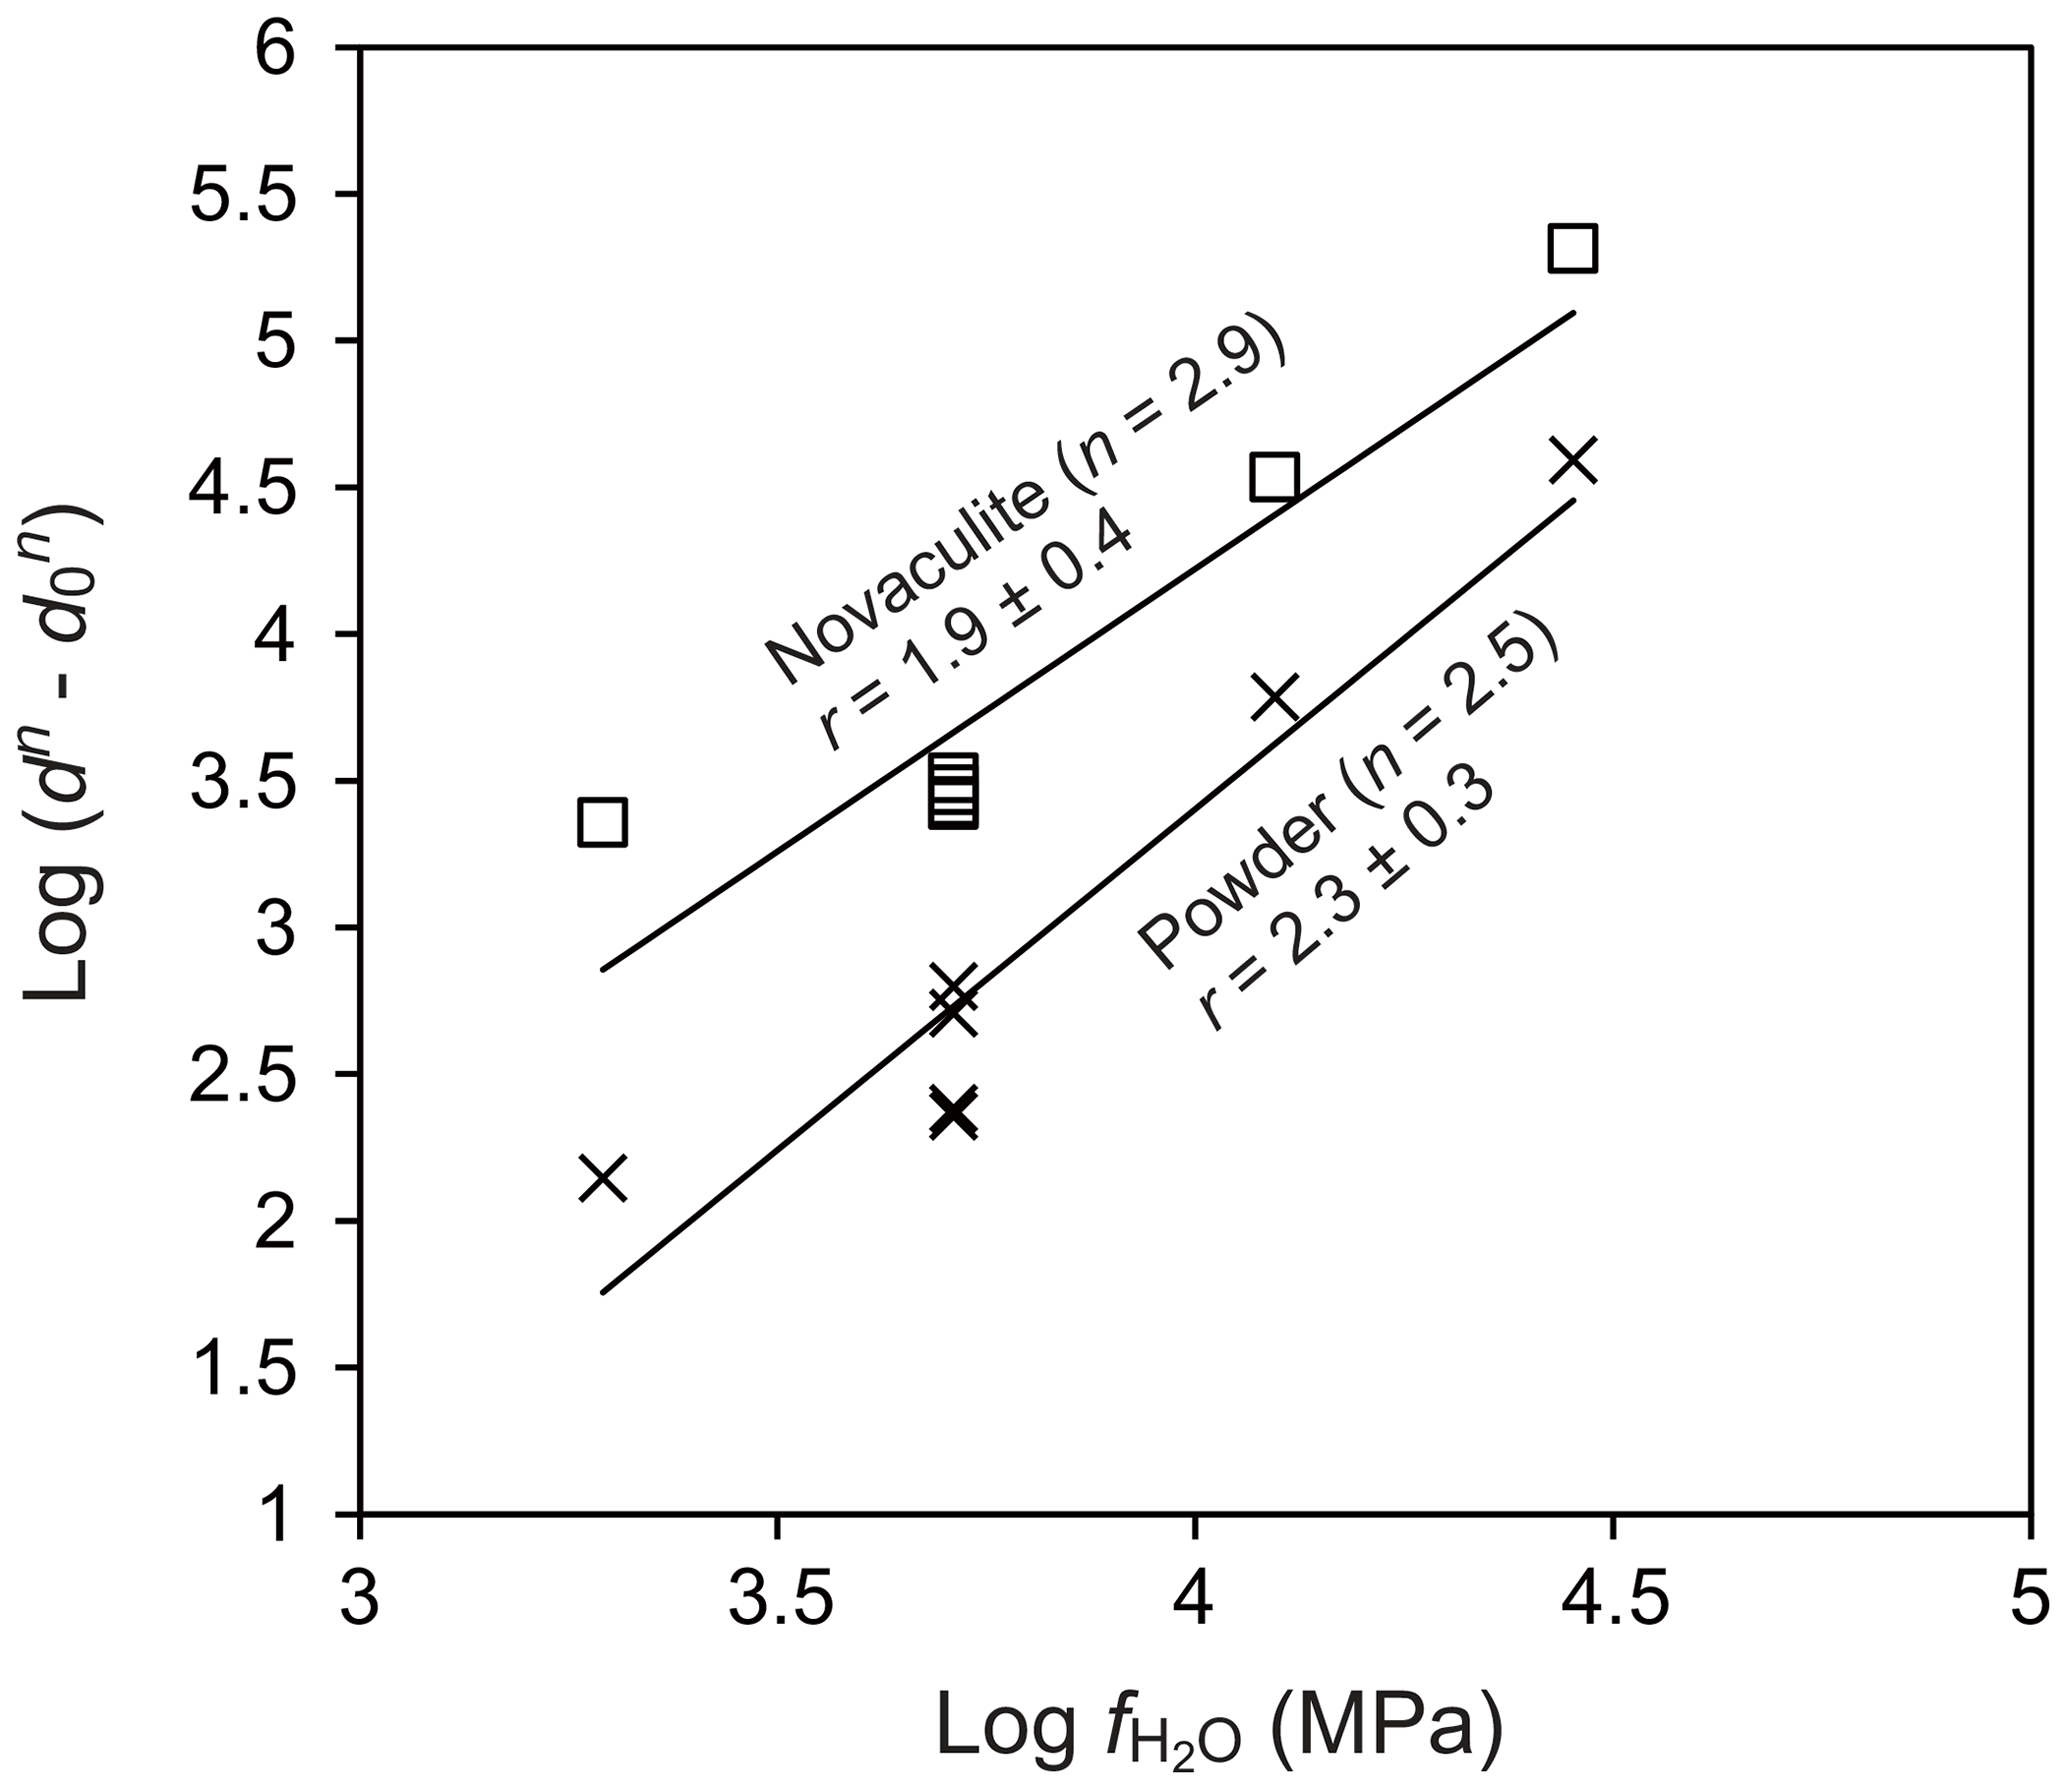
Figure 9Dependence of water fugacity on grain size. Temperature of 1000 ∘C and pressures of 1.0, 1.5, 2.0, and 2.5 GPa. Grain sizes in micrometers (µm).
For the powder,
For the novaculite,
with d and d0 in micrometers (µm), in megapascals (MPa), and t in seconds.
5.1 Grain growth parameters and growth mechanisms
We obtained growth exponents of and 2.9±0.4 for the powder and novaculite samples, respectively. The n value of 2.6±0.3, using the data of Tullis and Yund (1982) for their novaculite at 1.5 GPa and 1000 ∘C, is similar to ours (Fig. 8b). Wightman et al. (2006) estimated a value of n≥3 to account for grain growth in their natural quartz case (Alpine Fault, New Zealand). They also reported n=3.2 and other grain growth parameters (in terms of the effect of pressure) using the data of Tullis and Yund (1982), although the methods of determination were not shown. According to the theoretical estimation of Brook (1976; summarized in Atkinson, 1988), growth exponents depend on the microprocesses involved: n=4 (pore control + surface diffusion), n=3 (pore control + lattice diffusion), n=2 (boundary control + pure system), (boundary control + different mechanisms of impurity). In our experiments, added water of 0.2–10 wt % as well as adsorbed water of 0.25 wt % in the powder could be an impurity in the form of pores, although it also enhances grain growth at grain boundaries. Adsorbed water on the powder will diffuse throughout the two types of sample in a short time and assist grain growth in both the powder and novaculite samples (Fig. 4g–k). The novaculite samples do not show heterogeneities or gradients in grain size within a Pt capsule. Therefore, it is expected that the H2O is uniformly distributed in the “wet” condition. In addition, we note that the temperature and pressure gradients within a Pt capsule were also negligible.
Dissolution–precipitation was confirmed in the form of epitaxial growth when 10 wt % water was added (Figs. 4m and 7i). Hunt and Manning (2012) determined that quartz solubility in water is 0.05–0.50 in mole fractions with increasing pressure and temperature of 1.0–2.0 GPa and 800–1100 ∘C. Dissolved quartz can precipitate in pores that are filled with water. Large amounts of water can also assist dissolution–precipitation as remarkable as the epitaxial growth in the Pt capsule, although we did not see a significant difference in the central capsule part. Quartz grains epitaxially grow with the long axes perpendicular to the Pt jacket and the inner sample (Fig. 4m). In CL images, quartz grains in the powder and novaculite showed contrasts between original and grown grains (Fig. 7i), a phenomenon that has also been observed in natural samples sometimes accompanied by zoning (e.g., Götze et al., 2001; Holness and Watt, 2001; Piazolo et al., 2005). For grain growth, differences in the dihedral angles can be considered. For example, experimental studies by Watson and Brenan (1987) and Holness (1992, 1993) showed that the transition from dihedral angles of less than 60∘ (wet grain boundaries) to those larger than 60∘ (dry grain boundaries) took place at around 900–1000 ∘C at 1.0 GPa, where the angle decreases with decreasing temperature and increasing pressure. Wet grain boundaries would assist diffusion of Si (Farver and Yund, 2000), resultantly causing faster grain growth than in dry grain boundaries. Formations of wet grain boundaries or not under fluctuation might explain some of the large scattering of data for our experiments at 900 ∘C at 1.5 GPa (Fig. 10), and a similar effect is also seen at the same condition for different durations in the data of Tullis and Yund (1982) (Fig. 5 in their study).
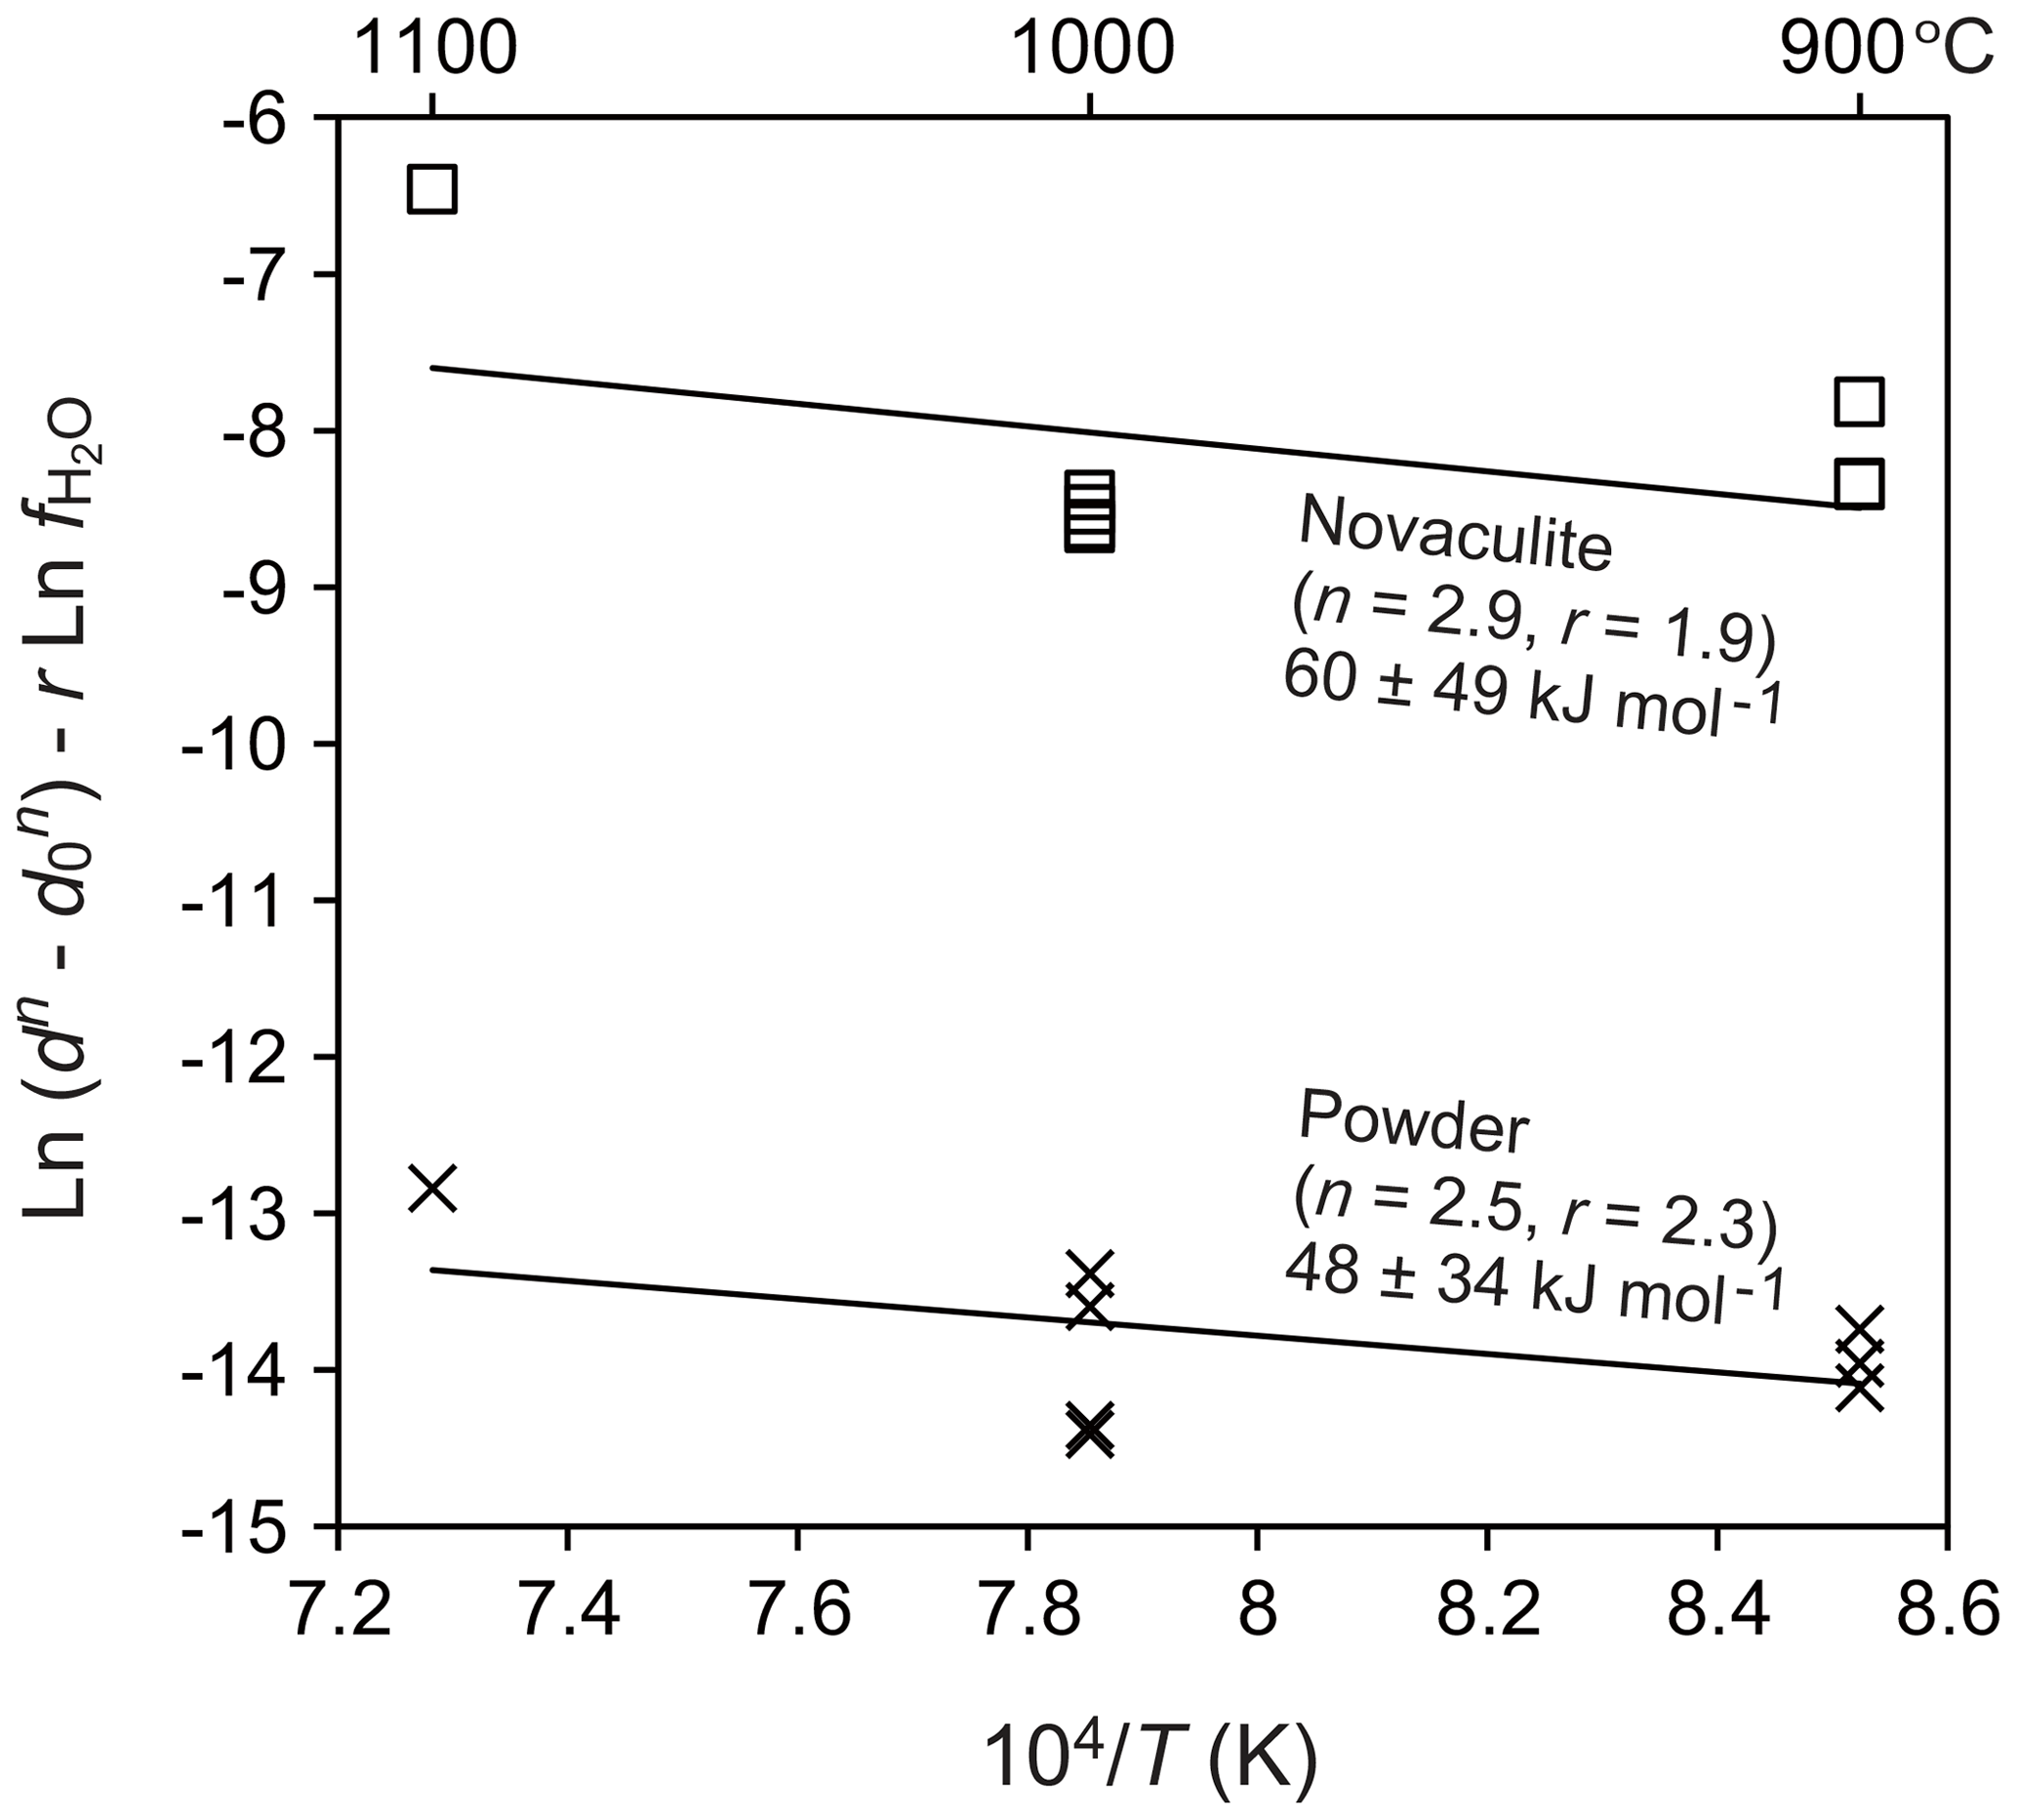
Figure 10Dependence of temperature on grain size. Pressure of 1.5 GPa. Grain sizes in micrometers (µm) and water fugacity in megapascals (MPa).
The powder sample included many more pores than the novaculite sample (Fig. 4b, e, and h). Grain growth of the powder sample with pores was slower than that of the dense novaculite sample because of the limited areas of contact between grains in the powder sample, as water in pores might act as a secondary phase that impedes grain growth, as discussed by Karato (1989) for the grain growth of olivine aggregates. Pore closure was achieved by precipitation, after which the rate of precipitation would be slower than grain boundary migration, which explains the slower grain growth in the powder sample. As grain sizes increased in both types of quartz sample, differences in their grain sizes were smaller (Fig. 6). This is interpreted to have resulted from the closing of pores in the powder samples (Fig. 4b, e, h and Fig. 7a–d). Grain growth for both types of quartz sample became similar when grain sizes were ∼70 µm, obtained at 2.5 GPa and 1000 ∘C for 24 h (Fig. 6), indicating that the pores in the powder had almost closed.
5.2 Application to nature and relation to deformation
We applied the grain growth laws determined from the powder (Eq. 4) and novaculite (Eq. 5) to natural conditions. We note here that the powder included pores that slowed down grain growth, but the porosity could not be evaluated quantitatively because of fracturing during unloading and plucking of grains during thin sectioning. In addition, pores closed with increasing grain size (Fig. 6). Therefore, although the grain growth law obtained from the powder is used here for comparisons with the grain growth law obtained from the novaculite, its use in nature might not be realistic.
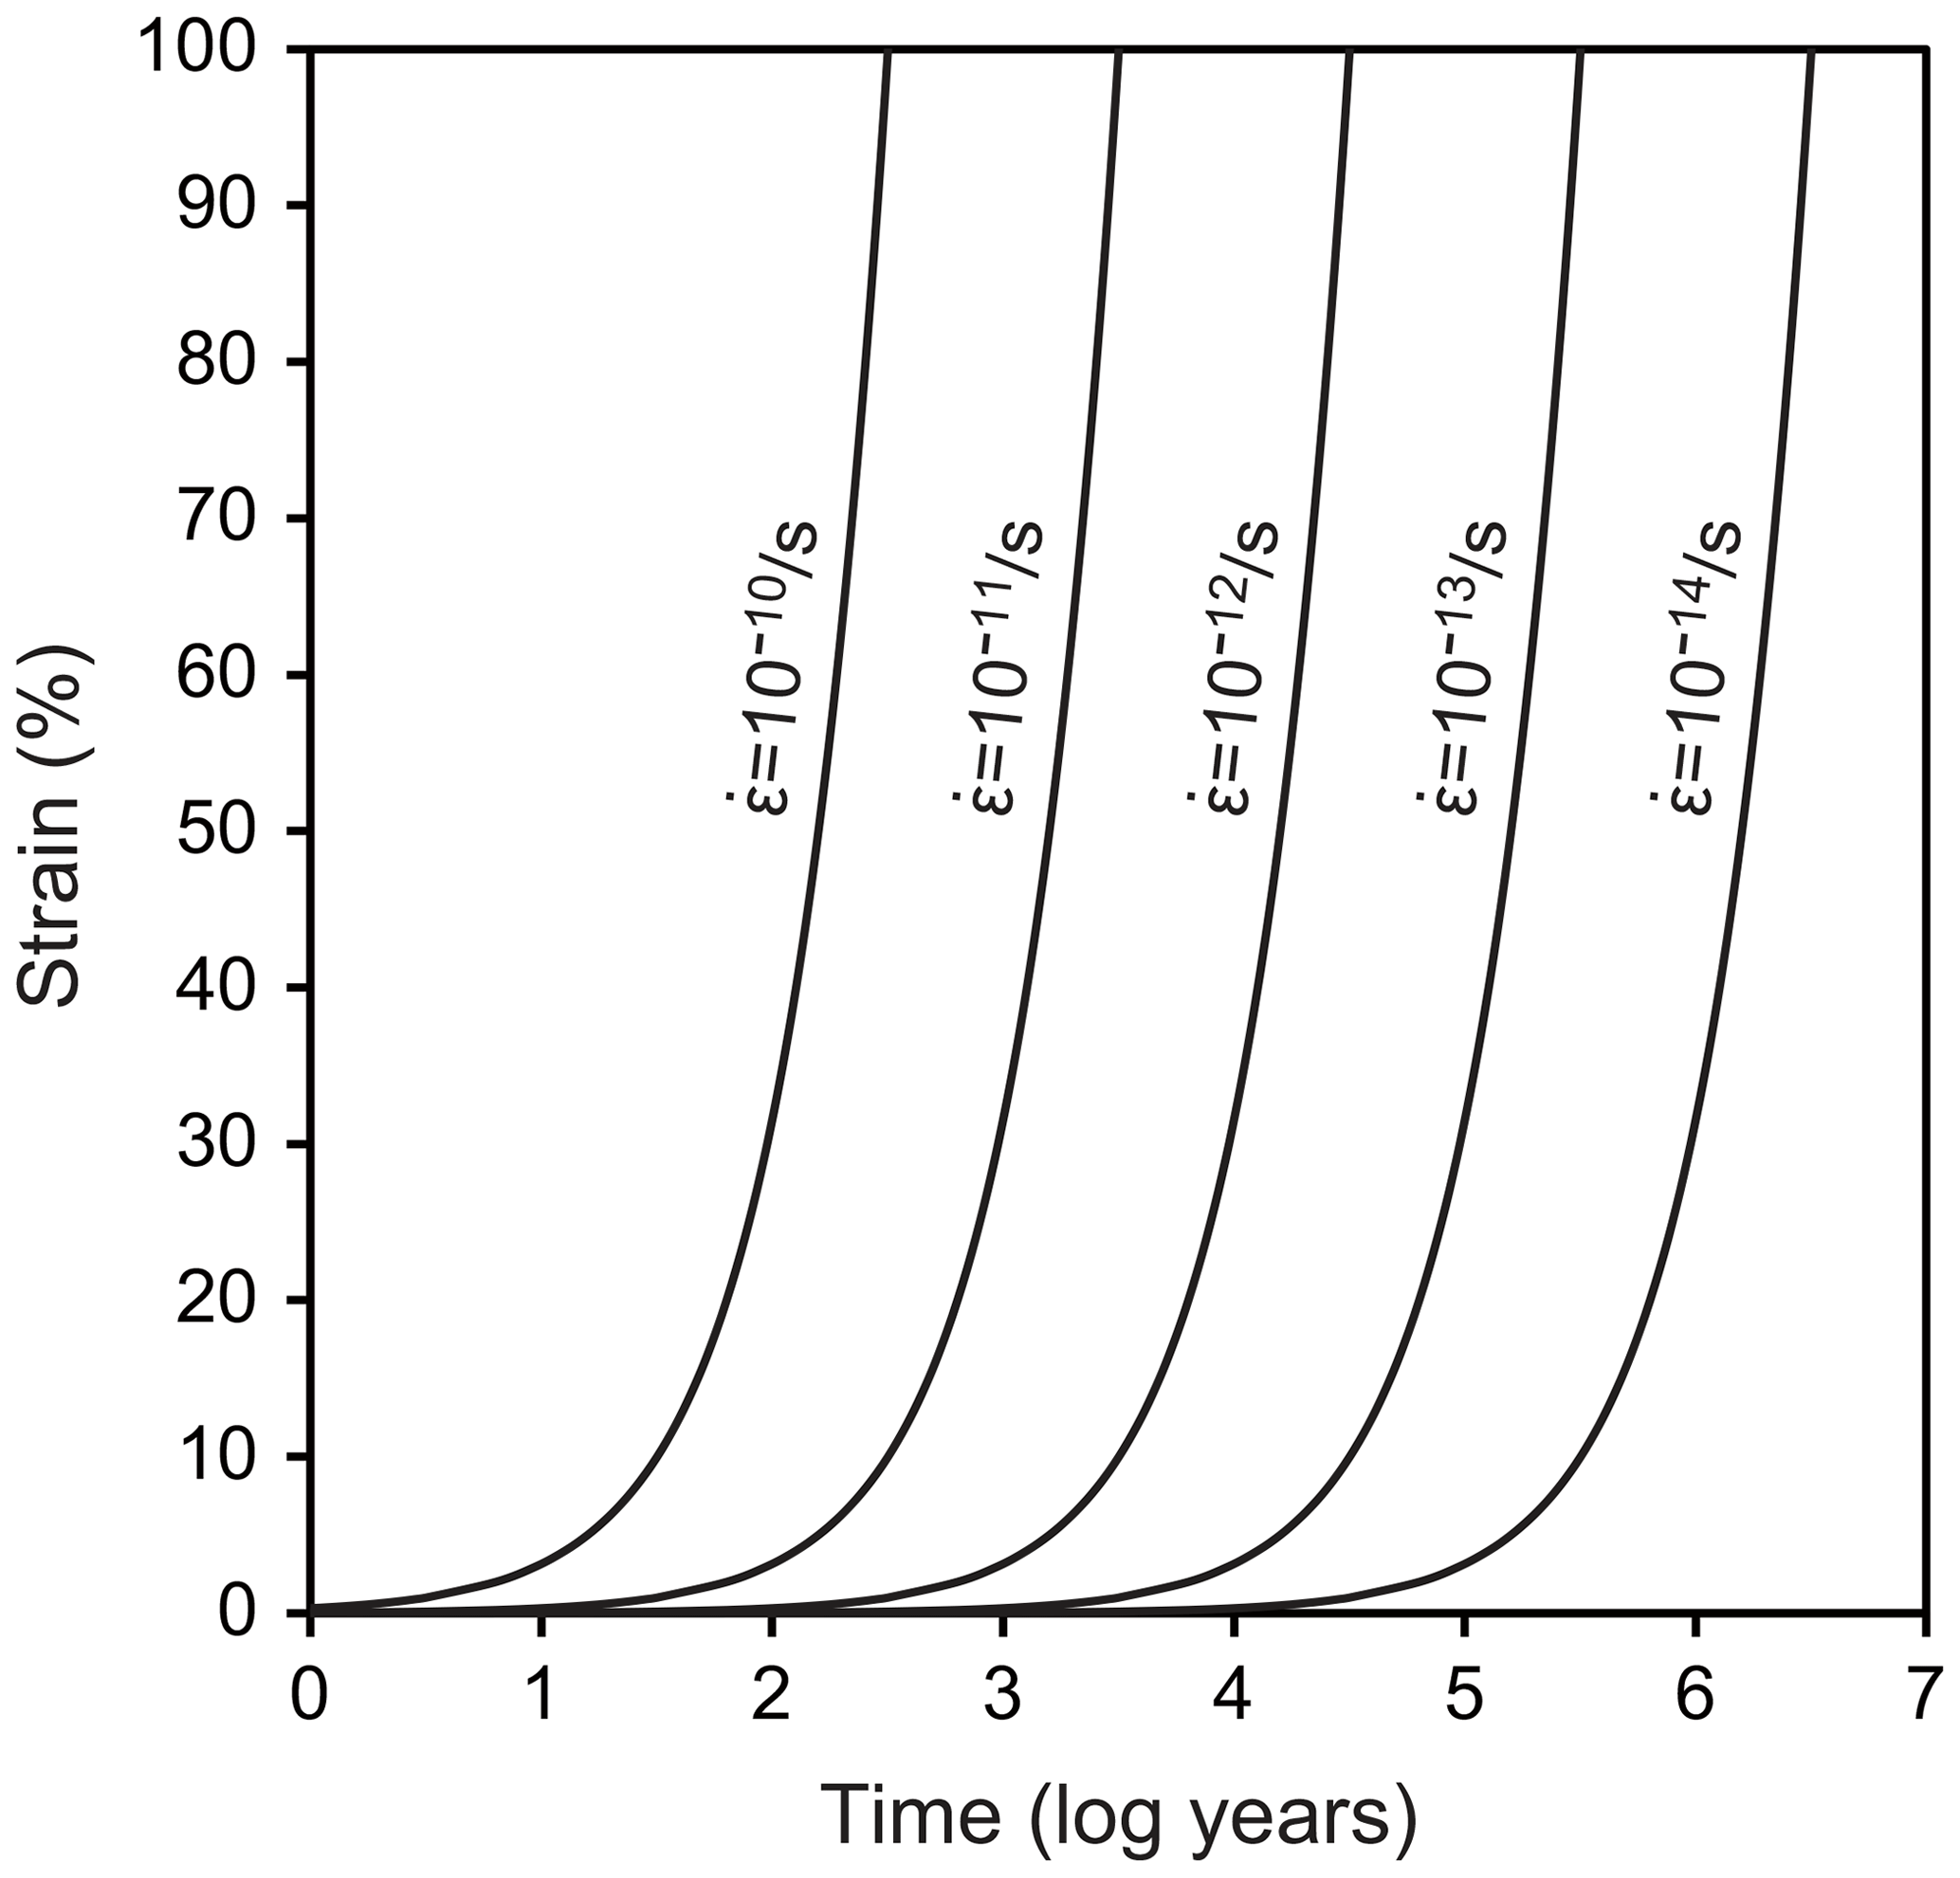
We assumed a representative mid-crustal temperature of 400 ∘C and lower-crustal temperature of 600 ∘C. We set a temperature gradient of 25 ∘C km−1 and a pressure gradient of 27 MPa km−1, which gave water fugacity values for the two temperatures using the molar volume and the equation of state of pure water from Pitzer and Sterner (1994) and Sterner and Pitzer (1994). The temperature of 400 ∘C gave a depth of 16 km, a pressure of 432 MPa, and a water fugacity of 96 MPa. The temperature of 600 ∘C gave a depth of 25 km, a pressure of 648 MPa, and a water fugacity of 464 MPa. We set initial grain sizes of 5, 20, 100, and 300 µm and calculated grain growth over time. These initial grain sizes could have been formed, for example, by dynamic recrystallization, and we will discuss the relationships between these initial grain sizes, grain growth, strain, and strain rates below. The results are shown in Fig. 11. To discuss the relationships between grain growth and plastic deformation, which causes dynamic recrystallization, we calculated the strain accumulated over time under different strain rates in Fig. 12. We note, however, that the volume of recrystallized grains as time passed was not well known. The grain growth period was calculated up to 10 Myr, which corresponds to possible exhumation rates of 1–10 km Myr−1 (e.g., Ring et al., 1999), during which grain growth can be the dominant process.
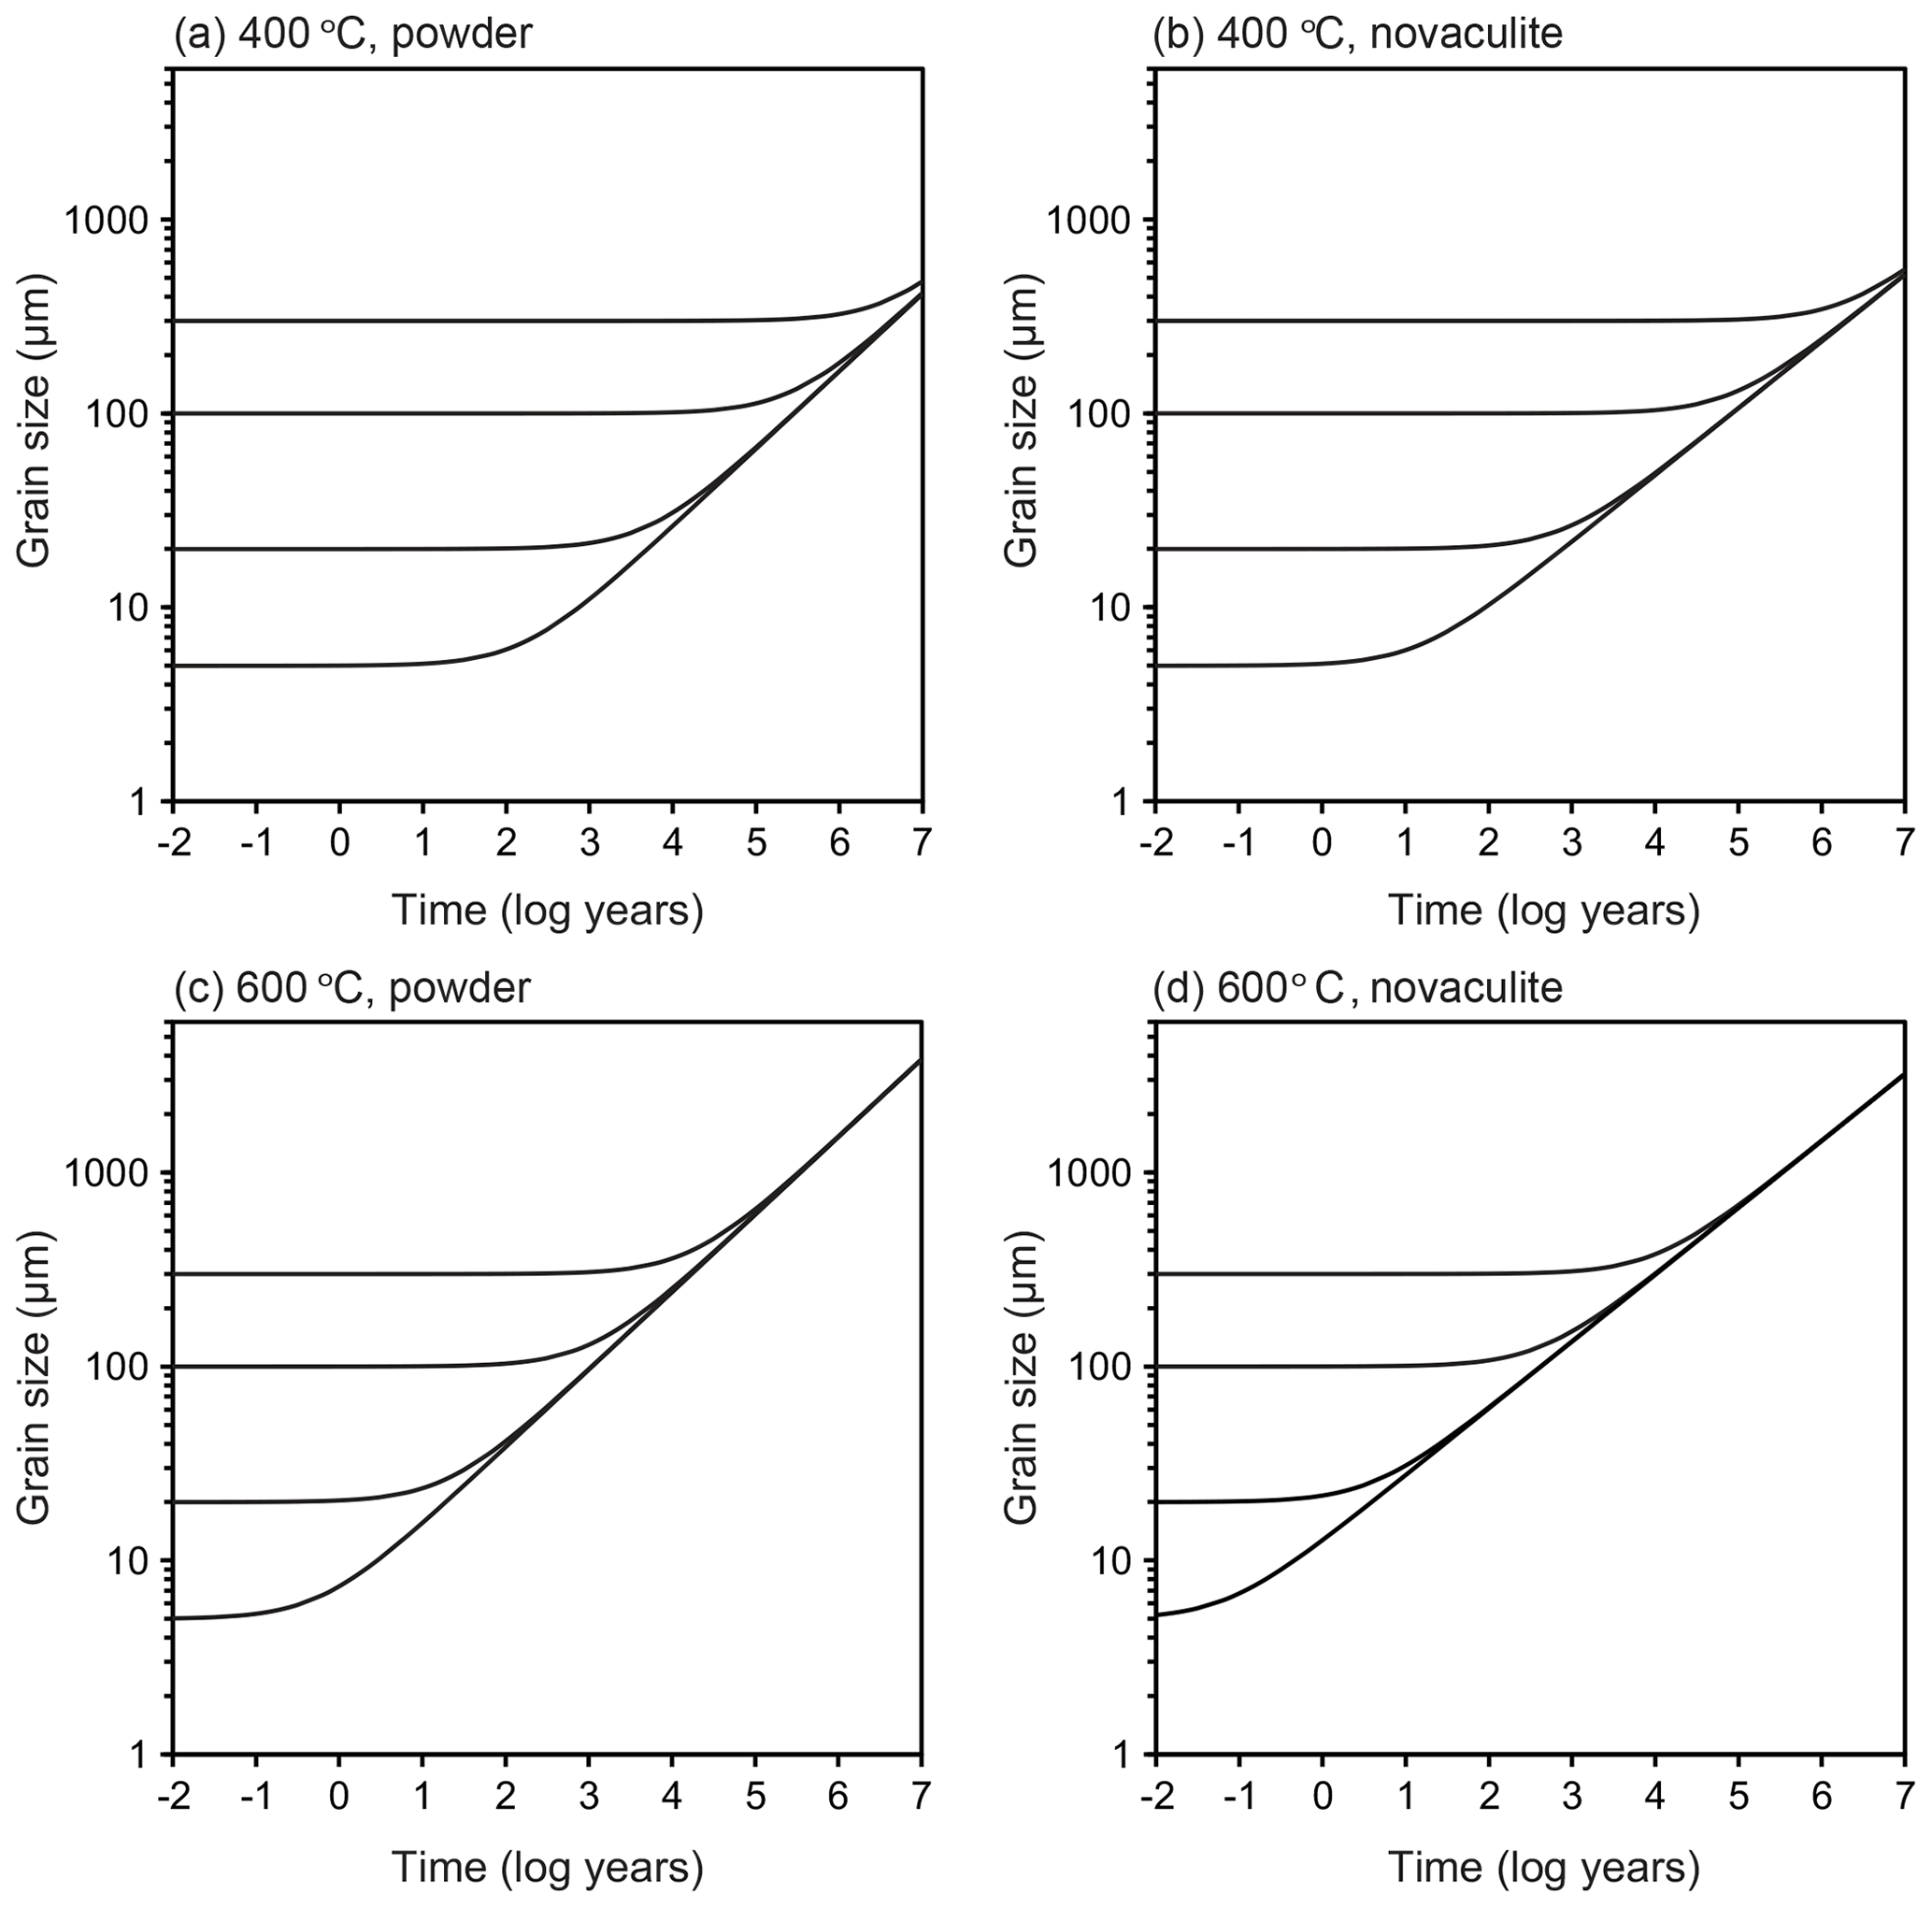
Figure 11Extrapolation to natural conditions using the grain growth laws obtained from the powder and novaculite samples. Initial grain sizes of 5, 20, 100, and 300 µm. (a–b) 400 ∘C. (c–d) 600 ∘C. See text for the settings of other parameters.
At 400 ∘C, when the initial grain size was 5 µm, the grain growth became significant in 102 years for the two grain growth laws (Fig. 11a and b). Initial grain sizes of 5 and 20 µm became the same in 104 years (30 and 40 µm using the grain growth laws obtained from the powder and novaculite, respectively). This is important when one considers the effects of plastic deformation. Researchers who have studied natural samples have estimated strain rates from the deformation histories and/or the relationship to stresses () as 10−10–10−14 s−1 (e.g., Hirth et al., 2001; Stipp et al., 2002; Wightman et al., 2006; Menegon et al., 2011; Okudaira and Shigematsu, 2012; Shimizu, 2014). At this temperature of 400 ∘C, a strain rate of 10−13 s−1 for 104 years gives a strain of only ∼3 %, and almost no strain is accumulated at a strain rate of 10−14 s−1 (Fig. 12). The grain size formed by dynamic recrystallization can be correlated with a function of stress as d∝σZq (Shimizu, 2008, by theory, Stipp et al., 2006, by experiment with the stress corrected by Holyoke and Kronenberg, 2010). Then, if these annealed grain sizes of 30 and 40 µm are incorrectly used as grain size piezometers, the stress will be underestimated by up to ∼280 MPa (i.e., if the grain size of 5 µm was initially formed by dynamic recrystallization, the corresponding stress was 351 MPa according to Shimizu (2008), whereas the grain size of 40 µm, which was caused by grain growth but incorrectly used as a grain size piezometer, corresponds to an apparent stress of 67 MPa).
At 600 ∘C, the effect of grain growth becomes more significant. Grains with initial sizes of < 100 µm grew to ∼200 µm in 104 years (Fig. 11c and d). For a strain rate of > 10−12 s−1 (Fig. 12), dynamic recrystallization can be the dominant process: a strain rate of 10−12 s−1, for example, results in 30 % strain in 104 years. In this case, strain-induced grain boundary migration during dynamic recrystallization (i.e., reduction of dislocation densities) will dominate and form irregular grain boundary shapes, as has been studied with experiments and natural samples (e.g., White, 1977; Jessell, 1987; Hirth and Tullis, 1992; Stipp et al., 2002; Tullis, 2002, and references therein). In this case, theoretical calculations for dynamically recrystallized grain size assume that strain-induced grain boundary migration and static grain boundary migration are balanced, resulting in an equilibrium grain size (e.g., Austin and Evans, 2007; Shimizu, 2008). However, when the strain rate is slower, grain growth may become competitive and dominate the microstructure. When this is the case, it is important to compare such microstructures (with more straight boundaries and larger sizes) to those of nearby quartz containing some impurities, which may have pinned grain growth. Thus, careful microstructural inspections are required before evaluating grain sizes for piezometry. In addition, as evaluated experimentally by Heilbronner and Tullis (2002), grain growth after dynamic recrystallization preserves preexisting crystallographic-preferred orientations formed by plastic deformation although grains show straight grain boundaries. Therefore, a crystallographic-preferred orientation test is not sufficient to infer a potential dominance of grain growth.
Grain growth of a natural quartz sample was discussed in Wightman et al. (2006). As we described in Sect. 5.1, they constructed a grain growth law using experimental data by Tullis and Yund (1982) to explain the grain growth of their quartz sample. The grain size of their sample was considered to have increased from ≤1 to 100 µm during a post-deformation time of ∼4 Myr. They mainly varied temperature conditions of 400–500 ∘C, giving a significant difference in grain growth time (1 order of magnitude) because of the high activation energy of 215 kJ mol−1. The experimental data by Tullis and Yund (1982) do not seem sufficient to argue for the effects of temperature and pressure individually (Table 1). The parameter settings in Wightman et al. (2006) may be possible, but, in contrast, the lower temperature sensitivity of our grain growth laws (e.g., 60 kJ mol−1 for the novaculite) may easily explain their data, giving a consistent grain growth time (Fig. 11) (specifically, grain sizes up to a few hundred micrometers in a few million years for the range of their temperature and pressure conditions with corresponding water fugacities).
Our grain growth laws give a possible contribution of grain growth during and after plastic deformation. Therefore, the effect of grain growth needs to be considered carefully when grain size piezometers are applied to dynamically recrystallized quartz samples. Our study shows that under mid-crustal wet conditions, the effect of grain growth might not be negligible and that under lower-crustal conditions, grain growth might significantly dominate the microstructure.
Grain growth laws for samples of quartz powder and novaculite were determined under wet conditions. The presence of water was necessary for grain growth to occur. Nevertheless, the addition of water above 0.25 wt % did not result in increased rates of growth in the novaculite samples. Furthermore, pores filled with water impeded grain growth, as can be inferred from comparisons between the powder and novaculite samples. The growth exponents, which significantly change growth rates, were determined as for the powder and for the novaculite. The two types of quartz sample also showed a dependence on water fugacity, and the fugacity exponents were for the powder and for the novaculite. We extrapolated our grain growth laws to natural conditions, and we discussed the effects on plastic deformation. Our grain growth laws indicate that after the deformation stage, dynamically recrystallized grains can grow, especially under lower-crustal conditions, when the system has enough time for grain growth. As a consequence, when grain size piezometers are applied to natural quartz, we should bear in mind that these are minimum stresses because grain growth might have taken place. Even during the deformation stage, grain growth might compete with grain size reduction in dynamic recrystallization when the strain rate is < 10−12 s−1.
This study is based on statistical analyses of the data listed in Table 1. The details of the analyzed data are available from the author (JF) upon request (jfukuda@sci.osaka-cu.ac.jp).
JF designed this study, and HR, IS, and HS contributed to the details. KN performed the analyses with EBSD and the particle counter. JF performed the experiments, subsequent analyses of grain size and data, and drafted the main part of the paper. All authors interpreted the data and drafted the paper.
The authors declare that they have no conflict of interest.
We thank Rémi Champallier, Zineb Nabyl, and Fabrice Gaillard for support with the experimental work and Ida Di Carlo for use of the SEM. Takamoto Okudaira is also thanked for useful discussions. Reviews by Andreas Kronenberg and an anonymous reviewer are gratefully acknowledged. This research was supported by Grants-in-Aid for Scientific Research on Innovative Areas (KAKENHI 15K21755 and 26109005) from the Ministry of Education, Culture, Sports, Science, and Technology (MEXT), by a Grant-in-Aid for Scientific Research (KAKENHI 19K04041) from the Japan Society for the Promotion of Science (JSPS), and by the Labex VOLTAIRE (ANR-10-LABX-100-01) from the Ministère de l'Enseignement Supérieur et de la Recherche.
This paper was edited by David Healy and reviewed by Andreas Kronenberg and one anonymous referee.
Atkinson, H. V.: Theories of normal grain growth in pure single phase systems, Acta Metall., 36, 469–491, https://doi.org/10.1016/0001-6160(88)90079-X, 1988.
Austin, N. J. and Evans, B.: Paleowattmeters: A scaling relation for dynamically recrystallized grain size, Geology, 35, 343–346, https://doi.org/10.1130/G23244A.1, 2007.
Bose, K. and Ganguly, J.: Experimental and theoretical studies of the stabilities of talc, antigorite and phase A at high pressures with applications to subduction processes, Earth Planet. Sc. Lett., 136, 109–121, https://doi.org/10.1016/0012-821X(95)00188-I, 1995.
Brook, R. J.: Controlled grain growth, in: Treatise on Materials Science and Technology, Vol. 9, edited by: Wang, F. F. Y., Academic Press, New York, 331–364, https://doi.org/10.1016/B978-0-12-341809-8.50024-3, 1976.
Cox, S. F. and Etheridge, M. A.: Crack-seal fibre growth mechanisms and their significance in the development of oriented layer silicate microstructures, Tectonophysics, 92, 147–170, https://doi.org/10.1016/0040-1951(83)90088-4, 1983.
Cross, A. J., Prior, D. J., Stipp, M., and Kidder, S.: The recrystallized grain size piezometer for quartz: An EBSD-based calibration, Geophys. Res. Lett., 44, 6667–6674, https://doi.org/10.1002/2017GL073836, 2017.
Davis, N. E., Newman, J., Wheelock, P. B., and Kronenberg, A. K.: Grain growth kinetics of dolomite, magnesite and calcite: a comparative study, Phys. Chem. Minerals, 38, 123–138, https://doi.org/10.1007/s00269-010-0389-9, 2011.
Derby, B.: Dynamic recrystallization and grain size, in: Deformation processes in minerals, ceramics and rocks, edited by: Barber, D. J. and Meredith, P. G., Springer, Dordrecht, 354–364, https://doi.org/10.1007/978-94-011-6827-4_14, 1990.
den Brok, S. W. J. and Spiers, C. J.: Experimental evidence for water weakening of quartzite by microcracking plus solution–precipitation creep, J. Geol. Soc. London, 148, 541–548, https://doi.org/10.1144/gsjgs.148.3.0541, 1991.
Dresen, G., Wang, G., and Bai, Q.: Kinetics of grain growth in anorthite, Tectonophysics, 258, 251–262, https://doi.org/10.1016/0040-1951(95)00203-0, 1996.
Evans, B., Renner, J., and Hirth, G.: A few remarks on the kinetics of static grain growth in rocks, Int. J. Earth Sci., 90, 88–103, https://doi.org/10.1007/s005310000150, 2001.
Farver, J. and Yund, R.: Silicon diffusion in a natural quartz aggregate: constraints on solution-transfer diffusion creep, Tectonophysics, 325, 193–205, https://doi.org/10.1016/S0040-1951(00)00121-9, 2000.
Fukuda, J. and Shimizu, I.: Theoretical derivation of flow laws for quartz dislocation creep: Comparisons with experimental creep data and extrapolation to natural conditions using water fugacity corrections, J. Geophys. Res., 122, 5956–5971, https://doi.org/10.1002/2016JB013798, 2017.
Fukuda, J., Holyoke, C. W., and Kronenberg, A. K.: Deformation of fine-grained quartz aggregates by mixed diffusion and dislocation creep, J. Geophys. Res., 123, 4676–4696, https://doi.org/10.1029/2017JB015133, 2018.
Gaillard, F.: Laboratory measurements of electrical conductivity of hydrous and dry silicic melts under pressure, Earth Planet. Sc. Lett., 218, 215–228, https://doi.org/10.1016/S0012-821X(03)00639-3, 2004.
Gleason, G. C. and Tullis, J.: A flow law for dislocation creep of quartz aggregates determined with the molten salt cell, Tectonophysics, 247, 1–23, https://doi.org/10.1016/0040-1951(95)00011-B, 1995.
Götze, J., Plötze, M., and Habermann, D.: Origin, spectral characteristics and practical applications of the cathodoluminescence (CL) of quartz – a review, Miner. Petrol., 71, 225–250, https://doi.org/10.1007/s007100170040, 2001.
Handy, M. R.: The solid-state flow of polymineralic rocks, J. Geophys. Res., 95, 8647–8661, https://doi.org/10.1029/JB095iB06p08647, 1990.
Heilbronner, R. and Tullis, J.: The effect of static annealing on microstructure and crystallographic preferred orientations of quartzites experimentally deformed in axial compression and shear, in: Deformation mechanisms, Rheology and Tectonics: Current status and future perspectives, edited by: de Meer, S., Drury, M. R., de Bresser, J. H. P., and Pennock, G. M., Geol. Soc. London Spec. Publ., 200, 191–218, https://doi.org/10.1144/GSL.SP.2001.200.01.12, 2002.
Hirth, G. and Tullis, J.: Dislocation creep regimes in quartz aggregates, J. Struct. Geol., 14, 145–159, https://doi.org/10.1016/0191-8141(92)90053-Y, 1992.
Hirth, G., Teyssier, C., and Dunlap, W. J.: An evaluation of quartzite flow laws based on comparisons between experimentally and naturally deformed rocks, Int. J. Earth Sci., 90, 70–87, https://doi.org/10.1007/s005310000152, 2001.
Holness, M. B.: Equilibrium dihedral angles in the system quartz-CO2-H2O-NaCl at 800 ∘C and 1–15 kbar: The effect of pressure and fluid composition on permeability of quartzites, Earth Planet. Sc. Lett., 114, 171–184, https://doi.org/10.1016/0012-821X(92)90159-S, 1992.
Holness, M. B.: Temperature and pressure dependence of quartz–aqueous fluid dihedral angles: The control of adsorbed H2O on the permeability of quartzites, Earth Planet. Sc. Lett., 117, 363–377, https://doi.org/10.1016/0012-821X(93)90090-V, 1993.
Holness, M. B. and Watt, G. R.: Quartz recrystallization and fluid flow during contact metamorphism: A cathodoluminescence study, Geofluids, 1, 215–228, https://doi.org/10.1046/j.1468-8123.2001.00015.x, 2001.
Holyoke, C. W. and Kronenberg, A. K.: Accurate differential stress measurement using the molten salt cell and solid salt assemblies in the Griggs apparatus with applications to strength, piezometers and rheology, Tectonophysics, 494, 17–31, https://doi.org/10.1016/j.tecto.2010.08.001, 2010.
Holyoke, C. W. and Kronenberg, A. K.: Reversible water weakening of quartz, Earth Planet. Sc. Lett., 374, 385–390, https://doi.org/10.1016/j.epsl.2013.05.039, 2013.
Hunt, J. D. and Manning, C. E.: A thermodynamic model for the system SiO2-H2O near the upper critical end point based on quartz solubility experiments at 500–1100 ∘C and 5–20 kbar, Geochim. Cosmochim. Acta, 86, 196–213, https://doi.org/10.1016/j.gca.2012.03.006, 2012.
Jaoul, O., Tullis, J., and Kronenberg, A.: The effect of varying water contents on the creep behavior of Hevitree quartzite, J. Geophys. Res., B89, 4298–4312, https://doi.org/10.1029/JB089iB06p04298, 1984.
Jessell, M. W.: Grain-boundary migration microstructures in a naturally deformed quartzite, J. Struct. Geol., 9, 1007–1014, https://doi.org/10.1016/0191-8141(87)90008-3, 1987.
Joesten, R.: Grain growth and grain boundary diffusion in quartz from the Christmas Mountains (Texas) contact aureole, Am. J. Sci., 283A, 233–254, 1983.
Karato, S.: Grain growth kinetics in olivine aggregates, Tectonophysics, 168, 255–273, https://doi.org/10.1016/0040-1951(89)90221-7, 1989.
Karato, S.: Deformation of Earth Materials, Cambridge Univ. Press, New York, 2008.
Kim, J. and Desmond, F. L.: Characteristics of zeta potential distribution in silica particles, Bull. Korean Chem. Soc., 26, 1083–1089, 2005.
Kohlstedt, D. L., Evans, B., and Mackwell, S. J.: Strength of the lithosphere: Constraints imposed by laboratory experiments, J. Geophys. Res., 100, 17587–17602, https://doi.org/10.1029/95JB01460, 1995.
Kohlstedt, D. L., Keppler, H., and Rubie, D. C.: Solubility of water in the α, β, γ phases of (Mg, Fe)2SiO2, Contrib. Mineral. Petrol., 123, 345–357, https://doi.org/10.1007/s004100050161, 1996.
Laumonier, M., Gaillard, F., and Sifré, D.: The effect of pressure and water concentration on the electrical conductivity of dacitic melts: Implication for magnetotelluric imaging in subduction areas, Chem. Geol., 418, 66–76, https://doi.org/10.1016/j.chemgeo.2014.09.019, 2015.
Luan, F. C. and Paterson, M. S.: Preparation and deformation of synthetic aggregates of quartz, J. Geophys. Res., B97, 301–320, https://doi.org/10.1029/91JB01748, 1992.
Mancktelow, N. S. and Pennacchioni, G.: The influence of grain boundary fluids on the microstructure of quartz–feldspar mylonites, J. Struct. Geol., 26, 47–69, https://doi.org/10.1016/S0191-8141(03)00081-6, 2004.
Menegon, L., Nasipuri, P., Stünitz, H., Behrens, H., and Ravna, E.: Dry and strong quartz during deformation of the lower crust in the presence of melt, J. Geophys. Res., 116, B10410, https://doi.org/10.1029/2011JB008371, 2011.
Michibayashi, K. and Imoto, H.: Grain growth kinetics and the effect of crystallographic anisotropy on normal grain growth of quartz, Phys. Chem. Minerals, 39, 213–218, https://doi.org/10.1007/s00269-011-0476-6, 2012.
Nishihara, Y., Shinmei, T., and Karato, S.: Grain-growth kinetics in wadsleyite: Effects of chemical environment, Phys. Earth Planet. Inter., 154, 30–43, https://doi.org/10.1016/j.pepi.2005.08.002, 2006.
Okamoto, A. and Sekine, K.: Textures of syntaxial quartz veins synthesized by hydrothermal experiments, J. Struct. Geol., 33, 1–21, https://doi.org/10.1016/j.jsg.2011.10.004, 2011.
Okudaira, T. and Shigematsu, N.: Estimates of stress and strain rate in mylonites based on the boundary between the fields of grain-size sensitive and insensitive creep, J. Geophys. Res., 117, B03210, https://doi.org/10.1029/2011JB008799, 2012.
Okudaira, T., Bando, H., and Yoshida, K.: Grain-boundary diffusion rates inferred from grain-size variations of quartz in metacherts from a contact aureole, Am. Mineral., 98, 680–688, https://doi.org/10.2138/am.2013.4308, 2013.
Olgaard, D. L. and Evans, B.: Grain growth in synthetic marbles with added mica and water, Contrib. Mineral. Petrol., 100, 246–260, https://doi.org/10.1007/BF00373591, 1988.
Piazolo, S., Prior, D. J., and Holness, M. D.: The use of combined cathodoluminescence and EBSD analysis: A case study investigating grain boundary migration mechanisms in quartz, J. Microsc., 217, 152–161, https://doi.org/10.1111/j.1365-2818.2005.01423.x, 2005.
Pitzer, K. S. and Sterner, S. M.: Equations of state valid continuously from zero to extreme pressures for H2O and CO2, J. Chem. Phys., 101, 3111–3116, https://doi.org/10.1063/1.467624, 1994.
Poirier, J. P. and Guillopé, M.: Deformation induced recrystallization of minerals, Bull. Minéral., 102, 67–74, 1979.
Pommier, A., Gaillard, F., Pichavant, M., and Scaillet, B.: Laboratory measurements of electrical conductivities of hydrous and dry Mount Vesuvius melts under pressure, J. Geophys. Res., 113, B05205, https://doi.org/10.1029/2007JB005269, 2008.
Prouteau, G. and Scaillet, B.: Experimental constrains on sulphur behaviour in subduction zones: Implications for TTG and adakite production and the global sulphur cycle since the Archean, J. Petrol., 54, 183–213, https://https://doi.org/10.1093/petrology/egs067, 2013.
Prouteau, G., Scaillet, B., Pichavant, M., and Maury, R.: Evidence for mantle metasomatism by hydrous silicic melts derived from subducted oceanic crust, Nature, 410, 197–200, https://doi.org/10.1038/35065583, 2001.
Richter, B., Stünitz, H., and Heilbronner, R.: The brittle-to-viscous transition in polycrystalline quartz: An experimental study, J. Struct. Geol., 114, 1–21, https://doi.org/10.1016/j.jsg.2018.06.005, 2018.
Ring, U., Brandon, M. T., Willett, S. D., and Lister, G. S.: Exhumation processes, in: Ductile flow and erosion, edited by: Ring, U., Brandon, M. T., Willett, S. D., and Lister, G. S., Geol. Soc. London Spec. Publ., 154, 1–27, https://doi.org/10.1144/GSL.SP.1999.154.01.01, 1999.
Rutter, E. H. and Brodie, K. H.: The role of tectonic grain size reduction in the rheological stratification of the lithosphere, Geol. Rundsch., 77, 295–307, https://doi.org/10.1007/BF01848691, 295–308, 1988.
Rutter, E. H. and Brodie, K. H.: Experimental intracrystalline plastic flow in hot-pressed synthetic quartzite prepared from Brazilian quartz crystals, J. Struct. Geol., 26, 259–270, https://doi.org/10.1016/S0191-8141(03)00096-8, 2004a.
Rutter, E. H. and Brodie, K. H.: Experimental grain-size sensitive flow of hot-pressured Brazilian quartz aggregates, J. Struct. Geol., 26, 2011–2023, https://doi.org/10.1016/j.jsg.2004.04.006, 2004b.
Schmid, S. M.: Microfabric studies as indicators of deformation mechanisms and flow laws operative in mountain building, in: Mountain building processes, edited by: Hsü, K., Academic Press, London, 95–110, 1982.
Shimizu, I.: Theories and applicability of grain size piezometers: The role of dynamic recrystallization mechanisms, J. Struct. Geol., 30, 899–917, https://doi.org/10.1016/j.jsg.2008.03.004, 2008.
Shimizu, I.: Rheological profile across the NE Japan interplate megathrust in the source region of the 2011 Mw 9.0 Tohoku-oki earthquake, Earth Planet. Space, 66, 73, https://doi.org/10.1186/1880-5981-66-73, 2014.
Sterner, S. M. and Pitzer, K. S.: An equation of state for carbon dioxide valid from zero to extreme pressures, Contrib. Mineral. Petrol., 117, 362–374, https://doi.org/10.1007/BF00307271, 1994.
Stipp, M., Stünitz, H., Heilbronner, R., and Schmid, S. M.: Dynamic recrystallization of quartz: Correlation between natural and experimental conditions, in: Deformation mechanisms, Rheology and Tectonics: Current status and future perspectives, edited by: de Meer, S., Drury, M. R., de Bresser, J. H. P., and Pennock, G. M., J. Geol. Soc. London, 200, 171–190, https://doi.org/10.1144/GSL.SP.2001.200.01.11, 2002.
Stipp, M. and Tullis, J.: The recrystallized grain size piezometer for quartz, Geophys. Res. Lett., 30, 2088, https://doi.org/10.1029/2003GL018444, 2003.
Stipp, M., Tullis, J., and Behrens, H.: Effect of water on the dislocation creep microstructure and flow stress of quartz and implications for the recrystallized grain size piezometer, J. Geophys. Res., 111, B04201, https://doi.org/10.1029/2005JB003852, 2006.
Tullis, J.: Deformation of granitic rocks: Experimental studies and natural examples, in: Plastic deformation of minerals and rocks, edited by: Karato, S. and Wenk, H. R., Rev. Mineral. Geochem., 51, 51–95, https://doi.org/10.2138/gsrmg.51.1.51, 2002.
Tullis, J. and Yund, R. A.: Grain growth kinetics of quartz and calcite aggregates, J. Geol., 90, 301–318, https://doi.org/10.1086/628681, 1982.
Twiss, R. J.: Theory and applicability of recrystallized grain size paleopiezometer, Pure Appl. Geophys., 115, 227–244, https://doi.org/10.1007/978-3-0348-5745-1_13, 1977.
Vernooij, M. G. C., den Brok, B., and Kunze, K.: Development of crystallographic preferred orientations by nucleation and growth of new grains in experimentally deformed quartz single crystals, Tectonophysics, 427, 35–53, https://doi.org/10.1016/j.tecto.2006.06.008, 2006.
Watson, E. B. and Brenan, J. M.: Fluids in the lithosphere, 1. Experimentally-determined wetting characteristics of CO2–H2O fluids and their implications for fluid transport, host-rock physical properties, and fluid inclusion formation, Earth Planet. Sc. Lett., 85, 497–515, https://doi.org/10.1016/0012-821X(87)90144-0, 1987.
White, S.: Geological significance of recovery and recrystallization processes in quartz, Tectonophysics, 39, 143–170, https://doi.org/10.1016/0040-1951(77)90093-2, 1977.
Wightman, R. H., Prior, D. J., and Little, T. A.: Quartz veins deformed by diffusion creep-accommodated grain boundary sliding during a transient, high strain-rate event in the Southern Alps, New Zealand. J. Struct. Geol., 28, 902–918, https://doi.org/10.1016/j.jsg.2006.02.008, 2006.