the Creative Commons Attribution 4.0 License.
the Creative Commons Attribution 4.0 License.
 | 29 May 2019
On the link between Earth tides and volcanic degassing
Florian Dinger
Stefan Bredemeyer
Santiago Arellano
Nicole Bobrowski
Ulrich Platt
Thomas Wagner
Long-term measurements of volcanic gas emissions conducted during the last decade suggest that under certain conditions the magnitude or chemical composition of volcanic emissions exhibits periodic variations with a period of about 2 weeks. A possible cause of such a periodicity can be attributed to the Earth tidal potential. The phenomenology of such a link has been debated for long, but no quantitative model has yet been proposed. The aim of this paper is to elucidate whether a causal link between tidal forcing and variations in volcanic degassing can be traced analytically. We model the response of a simplified magmatic system to the local tidal gravity variations and derive a periodical vertical magma displacement in the conduit with an amplitude of 0.1–1 m, depending on the geometry and physical state of the magmatic system. We find that while the tide-induced vertical magma displacement presumably has no significant direct effect on the volatile solubility, the differential magma flow across the radial conduit profile may result in a significant increase in the bubble coalescence rate at a depth of several kilometres by up to several multiples of 10 %. Because bubble coalescence facilitates separation of gas from magma and thus enhances volatile degassing, we argue that the derived tidal variation may propagate to a manifestation of varying volcanic degassing behaviour. The presented model provides a first basic framework which establishes an analytical understanding of the link between the Earth tides and volcanic degassing.
- Article
(922 KB) - Full-text XML
- BibTeX
- EndNote


Residual gravitational forces of the Moon and the Sun deform the Earth's surface and interior periodically and thus lead to the so-called Earth tides. The tidal potential can be modelled as the result of the interference of an infinite number of sinusoidal tidal harmonics with precisely known frequencies and amplitudes (Darwin, 1883; Doodson, 1921). At the Equator, the tidal potential varies predominantly with a semi-diurnal periodicity. The amplitude of the semi-diurnal cycle is modulated within the so-called spring–neap tide cycle with a periodicity of 14.8 d caused by the interference of the lunar semi-diurnal tide and the solar semi-diurnal tide. The peak-to-peak amplitude of the associated semi-diurnal gravity variations is during spring tide and during neap tide and is at an intermediate level at other times of the cycle. At midlatitudes, the tidal potential varies predominantly with diurnal periodicity, and at other latitudes both periodicities mix. The spring–neap tide cycle is, however, manifested everywhere and has maximum variability at the Equator (Agnew, 2007). The tidal potential firstly gives rise to a periodical elevation of the Earth's crust with a semi-diurnal peak-to-peak variation of up to about 50 cm (maximum at the Equator), and secondly all crustal compartments exhibit an additional semi-diurnal gravity variation by up to (Harrison et al., 1963; Baker, 1984). This gravity variation typically has no effect on the rigid solid crust but can cause fluid movement, e.g. prominently manifested in the form of ocean tides (Ponchaut et al., 2001).
Evidence for tidal impacts on volcanism has been gathered by numerous empirical studies, which detected a temporal proximity between tidal extrema and volcanic eruptions (Johnston and Mauk, 1972; Hamilton, 1973; Dzurisin, 1980) or seismic events (McNutt and Beavan, 1981, 1984; Ide et al., 2016; Petrosino et al., 2018) or found a correlation between the spring–neap tide cycle and variations in volcanic deformation (De Mendoca Dias, 1962; Berrino and Corrado, 1991) or variations in the volcanic gas emissions.
The tide-induced stress variations (∼ 0.1–10 kPa) appear to be negligibly small in comparison to tectonic stresses (∼ 1–100 MPa) or stresses caused by pressure and temperature gradients within a shallow magmatic system (∼1 MPa). The rate of tidal stress change can, however, be around 1 kPa h−1 and thus potentially exceeds stress rates of the other processes by 1 to 2 orders of magnitude (Sparks, 1981; Emter, 1997; Sottili et al., 2007). Furthermore, these subtle stress variations may cause an amplified volcanic reaction, when, for example, the tidal variations cause a widening of tectonic structures (Patanè et al., 1994), a periodic decompression of the host rock (Sottili et al., 2007; Sottili and Palladino, 2012), a variation in the host rock permeability (Bower, 1983; Elkhoury et al., 2006; Manga et al., 2012), self-sealing of hydrothermal fractures (Cigolini et al., 2009), or a mechanical excitation of the uppermost magmatic gas phase (Girona et al., 2018).
First studies on the covariations in tidal patterns and volcanic gas emissions hypothesised a possible tidal impact on the observed sulfur dioxide (SO2) emission fluxes at Masaya (Stoiber et al., 1986) and Kilauea (Connor et al., 1988). Since the 2000s, automatic scanning networks based on UV spectrometers (e.g. Galle et al., 2010) have provided multi-year time series of volcanic gas emissions of SO2 and bromine monoxide (BrO). The availability of such data sets enabled extensive investigation of long-term degassing variations. Correlation with the long-term tidal patterns has been reported for the SO2 emission fluxes of Villarrica and Llaima (Bredemeyer and Hansteen, 2014) and the BrO∕SO2 molar ratios in the gas plume of Cotopaxi (Dinger et al., 2018). Another possible but less significant correlation has been reported for the SO2 emission fluxes of Turrialba (with a periodicity somewhere between 9.1 and 16.7 d; Conde et al., 2014). Furthermore, Lopez et al. (2013) reported a periodicity of roughly 16 d in the SO2 emission fluxes of Redoubt retrieved from the satellite-based Ozone Monitoring Instrument (OMI) – the authors proposed that this periodicity was, however, an artefact of the satellite orbit rather than a tidal signal. In addition, correlation with the long-term tidal patterns have been reported for the diffuse radon degassing of Terceira (Aumento, 2002) and Stromboli (Cigolini et al., 2009).
Cycles in volcanic degassing patterns are not unique to periodicities which match the tidal potential. Many studies reported periodic volcanic degassing patterns with periods of minutes (e.g. Fischer et al., 2002; Boichu et al., 2010; Campion et al., 2012, 2018; Tamburello et al., 2013; Pering et al., 2014; Ilanko et al., 2015; Moussallam et al., 2017; Bani et al., 2017). In contrast, observations of long-term periodicities are rare. Besides the above-mentioned, roughly biweekly periodicities, periodic long-term pattern with periodicities of 50 and 55 d have been observed in the SO2 emission flux of Soufrière Hills (Nicholson et al., 2013) and Plosky Tolbachik (Telling et al., 2015), respectively.
In view of the growing number of studies revealing similar biweekly patterns in volcanic activity, this paper investigates whether causality between the tidal potential and variations in the volcanic degassing is analytically traceable in a comprehensible way. High-temperature gas emissions of persistently strong, passively degassing volcanic systems are commonly thought to be fed by sustained magma convection reaching the uppermost portions of the volcanic conduit, where volatile-rich low-viscosity magma ascends through essentially degassed magma of higher viscosity, which in turn descends at the outer annulus of the conduit (Kazahaya et al., 1994; Palma et al., 2011; Beckett et al., 2014). Magma ascent rates associated with such convective flow typically vary roughly between 1 and 100 m h−1 (Cassidy et al., 2015, 2018) and thus are orders of magnitudes larger than what we can derive for potentially tide-induced vertical magma displacement rates of at most 0.6 m within 6 h (if not further amplified). A comprehensive model of the tidal impact on the magma motion thus requires a coupling of the convective and the tide-induced transport mechanisms.
Our conceptual model aims to provide the first step by investigating the purely tide-induced transport mechanism acting on the low-viscosity inner magma column, neglecting any interference between the magma ascent and the tidal mechanism, i.e. the model ignores the magma convection in the column. We model the response of such a quasi-static magmatic system (volcanic conduit connected to a laterally more extended deeper magma reservoir) to tide-induced gravity variations analogously to the response of a classical mercury thermometer to temperature variations: the tide drives a periodical expansion of the magma in the reservoir, which leads to a periodical vertical displacement of the low-viscosity magma column in the conduit.
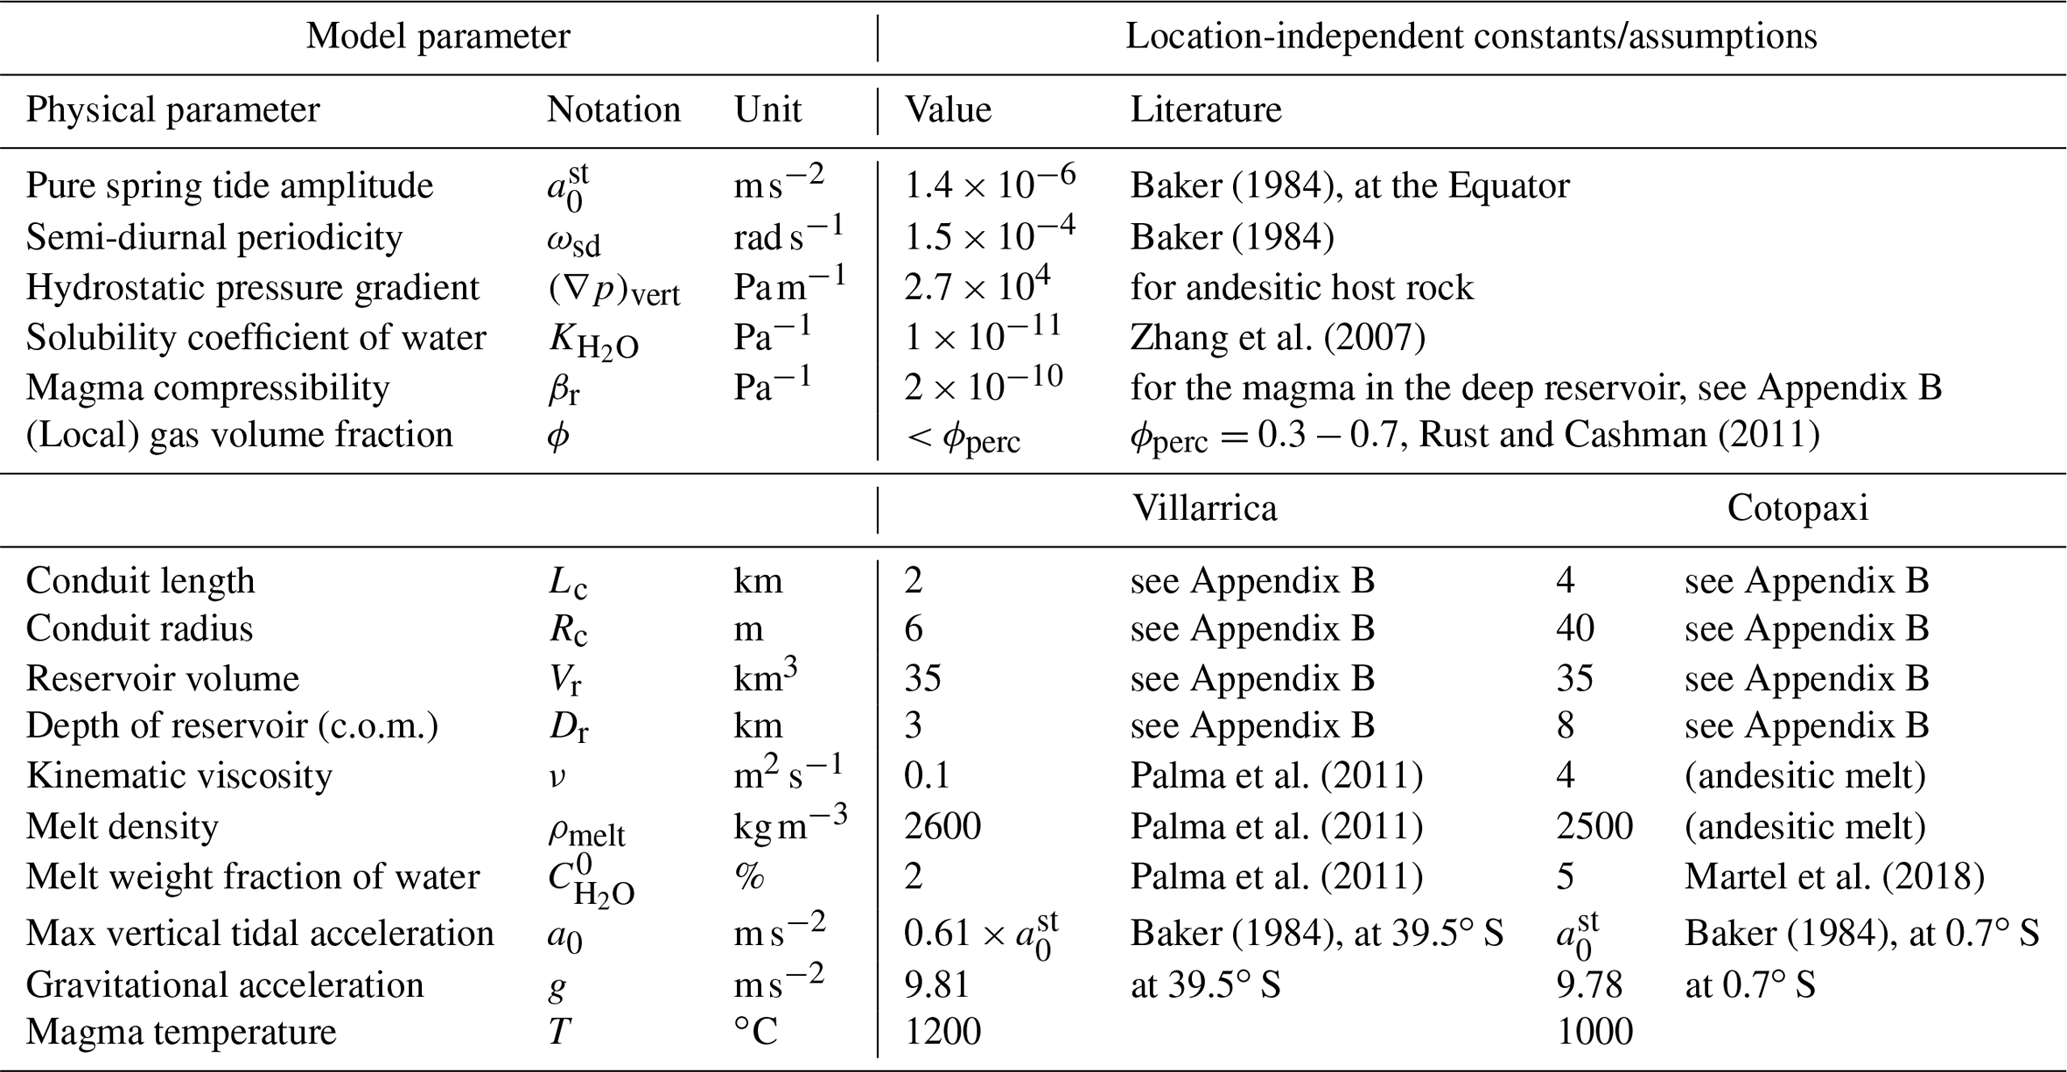
We derive the temporal evolution and amplitude of the vertical magma displacement across the radial conduit profile and examine its impact on the bubble coalescence rate. In order to introduce our novel approach comprehensibly, the modelled processes and conditions are as simplified as suitable; the major simplifications are listed in Appendix A. All findings in this paper are derived analytically. The quantitative model estimates are presented for two exemplary magmatic systems. These examples are intended to match simplified versions of the Villarrica (39.5∘ S) and Cotopaxi (0.7∘ S) volcanoes, where covariation between outgassing activity and Earth tidal movements has been observed previously (Bredemeyer and Hansteen, 2014; Dinger et al., 2018). The associated model parameter sets are listed in Table 1. Further, all quantitative estimates are presented for the spring tide, and the consequences of the contrast between spring tide and neap tide are discussed in the last part of this paper.
2.1 Model set-up
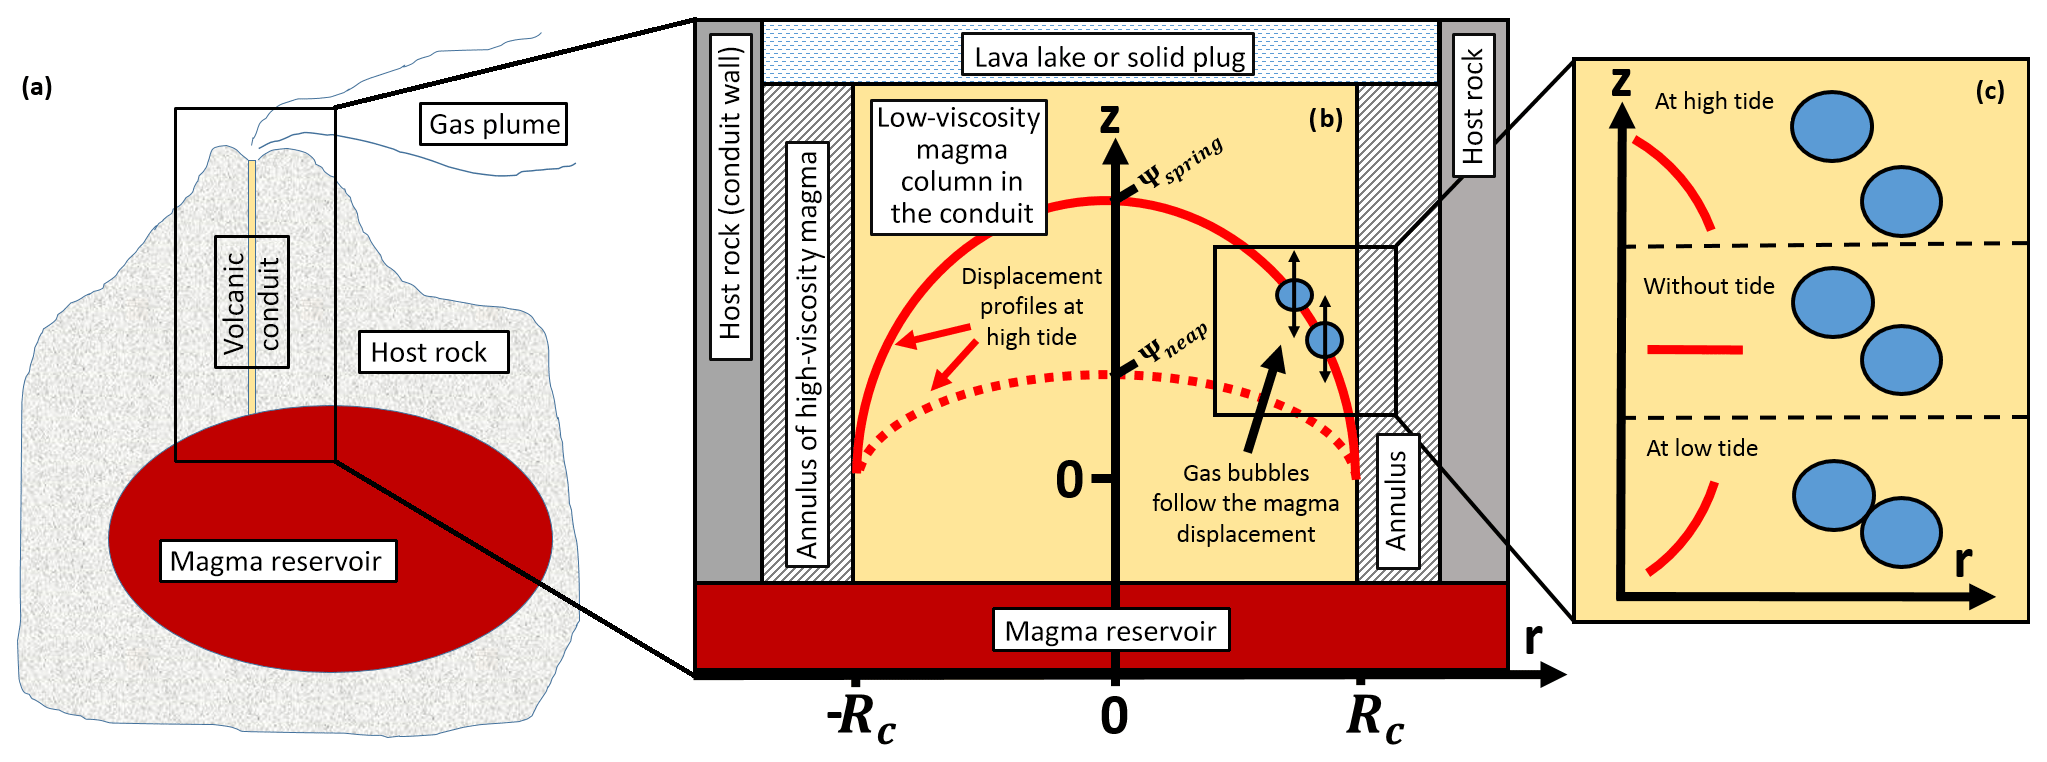
Figure 1Panels (a) and (b): sketch of the model set-up. The model compartments are indicated by white boxes but not depicted to scale. (b) The semi-diurnal tide causes a radial magma displacement profile in the conduit with different amplitudes during spring tide and neap tide. (c) Concept of the tide-enhanced bubble coalescence: two bubbles which are initially close to each other (see “without tide”) exhibit differential vertical tide-induced displacements, which enhances the chance for bubble coalescence (here “at low tide”).
We model the magmatic system analogously to established convection models (Kazahaya et al., 1994; Palma et al., 2011; Beckett et al., 2014), with the exception that the descending high-viscosity magma annulus is assumed to be not affected by the tide-induced dynamics and therefore is considered as an effective part of the host rock, while “conduit” refers in our model exclusively to the ascending low-viscosity magma column. We assume the conduit to be a vertically oriented cylinder with length Lc, radius Rc, and cross-sectional area , which is confined by the penetrated host rock (and high-viscosity magma annulus), connected to a deeper, laterally more extended magma reservoir with volume Vr and centre of mass at a depth Dr, and either exhibiting an open vent or capped by a gas-permeable solid plug (Fig. 1). The magmatic melt in the conduit is modelled as a mixture of a liquid phase and a gas phase having a mean density ρmelt, which varies with pressure and thus depth, a constant kinematic bulk viscosity ν, and homogeneous local flow properties. The magma compressibility β(ϕ) strongly depends on the gas volume fraction ϕ and lies between the compressibility of volatile-rich rock and the compressibility of an ideal gas (see, e.g., Tripoli et al., 2016). The magmatic melt in the reservoir is modelled to be volatile-rich but hosting no gas phase of significant volume and thus having a constant compressibility βr≈β(0). Further, the quasi-static condition implies a steady-state density stratification within the magma and also with respect to the host rock (no neutral buoyancy; Parfitt et al., 1993). In this equilibrium, we assume a constant hydrostatic pressure gradient (∇p)vert.
2.2 Response of the host rock on tidal stresses
Magma pathways are often located at intersection points of large-scale fault systems (Nakamura, 1977; Takada, 1994) or in fault transfer zones (e.g. Gibbs, 1990), where the surrounding host rock geometry is relatively sensitive to directional changes in pressure. The vertical and horizontal components of the tidal force exert additive shear tension on the host rock, potentially causing a compression of the host rock (Sottili et al., 2007) or a differential slip between both sides of the fault system (Ide et al., 2016). Both mechanisms can cause an increase in the areal conduit cross section. Connected to the magma reservoir, such an increasing conduit volume is accompanied by decompression and thus causes magma to flow from the reservoir to the conduit, which pushes the initial magma column in the conduit upwards until the initial hydrostatic pressure gradient is re-established. Vice versa a relative decrease in the areal conduit cross section leads to an effective descent of the initial magma column in the conduit. For a given periodic area increase ΔAc, the amplitude Δzhr of this additive elevation-descent cycle of the centre of mass of the initial magma column is given by
The quantitative scale of tide-induced conduit cross section variations is presumably hardly accessible. The theoretical horizontal components of the tide-induced ground surface displacement are up to about ±7 cm (Baker, 1984). Slip-induced dilation of faults with widths in the sub-centimetre range thus appear to be plausible. For illustration, a conduit radius increase by ΔRc=1 mm would result in an additive vertical centre of mass displacement by Δzhr=0.33 m for Villarrica and Δzhr=0.13 m for Cotopaxi. As a remark, these mechanisms do not require a cylindrical conduit and fault–slip mechanisms would lead to an unidirectional area increase rather than a homogeneous radial increase. Furthermore, the tide could also cause a variation in the host rock permeability (Bower, 1983; Elkhoury et al., 2006; Manga et al., 2012). This mechanism and its possible interference with the concept presented here are ignored in our model.
2.3 Tide-induced magma expansion in the reservoir
The semi-diurnal tide causes a sinusoidal variation in the gravitational acceleration with angular frequency ωsd = 1.5 ⋅ 10−4 rad s−1 and amplitude (equals the half peak-to-peak amplitude) = 1.4 µm s−2 during spring tide and during neap tide. Besides those host rock mechanisms triggered by the tidal stresses, these tide-induced gravity variations may also cause a periodical elevation of the magma in the inner conduit.
The compressible magma in the reservoir is pressurised by the hydrostatic load whose weight is proportional to the local gravitational acceleration g. A reduction in the local gravitational acceleration by a0 leads to a decompression and thus expansion of the magma in the reservoir by . The tidal force can accordingly lead to a periodical magma expansion–shrinkage cycle in the reservoir with a semi-diurnal periodicity and an amplitude modulation within the spring–neap tidal cycle of up to ΔVr∼𝒪(100–1000 m3).
The realisation of this additional magma volume implies a displacement and thus compression of the host rock at the location of maximum host rock compressibility. This is typically true for the conduit. Assuming that the magma expansion in the reservoir ultimately and exclusively causes an increase in the conduit volume, the volume increase causes an elevation of the centre of mass of the initial magma column in the conduit by
In the general case, the additional volume could be realised by a slight increase in the conduit radius by caused, for example, by the tidal stresses. If the magmatic system has an open vent, the additional volume can alternatively be realised by an elevation of the lava lake level and thus without a host rock compression.
Analogously, the tide-induced gravity variations result in an expansion of the initial magma column in the conduit. This effect is, however, typically negligible compared to the reservoir effect for sufficiently large reservoirs (volume contrast between reservoir and conduit of more than 1000; see Table 1); thus, for simplicity we neglect the effect of the expansion of the initial magma column in the conduit.
The responses of the overall magmatic system on the tidal stresses and tide-induced gravity variations act simultaneously and in phase with the tidal force. The overall vertical tide-induced magma displacement in the conduit Δzmax can thus be larger then the individual mechanisms; i.e. . In the following we focus on the reservoir expansion mechanism only in order to keep the derivation of the model parameters strictly analytical. The host rock mechanism is therefore reduced to establishing the required areal conduit cross section increase of ΔRdec.
Baker (1984)Baker (1984)Zhang et al. (2007)Rust and Cashman (2011)Palma et al. (2011)Palma et al. (2011)Palma et al. (2011)Martel et al. (2018)Baker (1984)Baker (1984)Table 1Choice of model parameters, motivated by conditions at (1) Villarrica volcano located at 39.5∘ S hosting a persistent lava lake of basaltic composition and (2) Cotopaxi volcano located at 0.7∘ S, which preferentially erupts andesitic magma and intermittently is capped by a solid plug. If not stated otherwise, all numerical values in this paper are calculated with these parameters.
2.4 Radial flow profile in the conduit
The tide-induced vertical magma displacement in the conduit is delayed and extenuated by a viscosity-induced drag force. We access the temporal evolution and amplitude of the tide-induced displacement via the force (per unit mass) balance acting on the centre of mass of the magma column in the conduit:
where the two model parameters are the bulk damping rate γ and the eigenfrequency ω0 of the magma column. The restoring force ensures that the centre of mass displacement tends towards the current “equilibrium” displacement associated with the current strength of the tidal force, i.e. . We further assume a Newtonian bulk drag force proportional to the flow velocity.
The continuity condition implies that the magma flows faster in the conduit centre than close to the boundary between the low-viscosity and high-viscosity magma or host rock. Accordingly, we assume a no-slip condition at the conduit boundary r=Rc and derive the analytical solution of the tide-induced parabolic vertical displacement profile z(r,t) in the conduit:
with the radial coordinate , the maximum vertical magma displacement amplitude Ψ (which equals twice the centre of mass displacement) and the phase shift φ0 between tidal force and magma displacement in the conduit (see Appendix C).
For Villarrica, the model implies a tidal displacement amplitude of , which lags behind the tide by , where the displacement is predominantly limited by drag force. For Cotopaxi, the tidal displacement amplitude is and lags by , where the displacement is predominantly limited by the restoring force. In comparison, the direct tide-induced gravity variations leads to a variation in the hydrostatic pressure of 10–100 Pa. In the context of the hydrostatic pressure gradient, this pressure variation has a similar effect as a vertical magma displacement by about 1 mm, thus rendering the direct tidal impact negligible compared to the indirect mechanism derived here.
Integrated over a semi-diurnal cycle, the tides do not result in a net magma displacement. A link from tides to degassing thus requires tide-enhanced mechanisms which irreversibly change the state of the magmatic gas phase. Bubble growth constitutes a predominantly exergonic and thus irreversible mechanism because the bubble surface tension inhibits or at least damps bubble shrinkage and dissolution (Prousevitch et al., 1993). Within a tide-induced radial displacement profile, neighbouring gas bubbles can exhibit differential tide-induced vertical displacements potentially enhancing the bubble coalescence rate (see Fig. 1c and Appendix D). The variation in the bubble coalescence rate leads to bigger bubbles and thus the tide can indeed modify an irreversible mechanism.
In this section, we set up a simplified formalisation of the magmatic gas phase and the typically predominant mechanisms which govern the bubble coalescence rate and estimate the relative tide-induced enhancement of the bubble coalescence by a comparison with these classical mechanisms. We consider a magma layer in the conduit at a particular depth; accordingly, the parameters discussed in the following describe the local conditions within a small volume of magma and should not be confused with the integrated bulk values for the total magma column. The variation in the tide-induced enhancement at different magma depths is discussed in the subsequent section.
3.1 Gas bubbles in magmatic melt
The dominant part of the magmatic volatile content is typically water, followed by carbon dioxide, sulfur compounds, and minor contributions from a large number of trace gases such as halogen compounds (Oppenheimer et al., 2014). For simplicity, we assume that all macroscopic properties of the gas phase are dominated by the degassing of water, in particular that the gas volume fraction ϕ exclusively consists of water vapour. The volatile solubility of magmatic melts is primarily pressure dependent, with secondary dependencies on temperature, melt composition, and volatile speciation (Gonnermann and Manga, 2013). The pressure dependency of the water solubility in magmatic melt is given in a first approximation by with the corresponding solubility coefficients (find an empirical formulation in Zhang et al., 2007). For the local gas volume fraction ϕ(p) at a depth associated with the pressure p, we obtain
with the total water weight fraction of the magmatic melt and the mass densities of the gas phase ρgas and of the overall melt (liquid + gas) ρmelt.
The gas phase consists of separated bubbles as long as the gas volume fraction is below the percolation threshold of (the variation is due to the range of different magmatic conditions; Rust and Cashman, 2011). Bubbles typically vary in size following a power law (Cashman and Marsh, 1988; Blower et al., 2003) or a mixed power-law exponential distribution (Le Gall and Pichavant, 2016) and in shape from spherical to ellipsoidal (Rust et al., 2003; Moitra et al., 2013). While models based on polydisperse bubble size distributions are available (Sahagian and Proussevitch, 1998; Huber et al., 2013; Mancini et al., 2016), a common starting point to analyse the temporal evolution of the bubbles is nevertheless the assumption of a monodisperse size distribution of spherical bubbles (Prousevitch et al., 1993; Lensky et al., 2004).
We note the bubble size distribution with respect to the bubble radius (rather than the volume); i.e. the bubble radius is given by with the hypothetical bubble radius Rb(p) of a monodisperse bubble size distribution. An estimate of a power-law bubble size distribution would require three parameters: the exponent and the lower and upper truncation cut-off (Lovejoy et al., 2004). An estimate of a mixed power-law exponential bubble size distribution would require at least two further parameters. The following analysis is conducted for an arbitrary bubble size distribution; nevertheless, for a basic quantitative estimate, we mimic a proper polydisperse bubble size distribution by the simpler single-parametric
with , which represents a monodisperse distribution except for a fraction of q bubbles which emerged from a past coalescence of two bubbles with f=1.
3.2 Bubble motion and bubble coalescence
Diffusion-driven volatile degassing can only take place in the immediate vicinity of a bubble and when the supersaturation pressure is larger than the bubble surface tension (Proussevitch and Sahagian, 2005). The volatile degassing rate is thus controlled by the spatial bubble distribution as well as the bubble size distribution (Lensky et al., 2004). Both distributions change during bubble rise, which is caused by a vertical ascent of the overall magma column or parcel with velocity vmelt and a superimposed bubble buoyancy with a velocity vbuoy which reads for a bubble with radius rb (Stoke's law):
If the buoyancy velocity is negligible compared to the magma ascent, the bubble flow is called “dispersed”; if the bubble buoyancy velocity contributes significantly to the overall bubble ascent, the bubble flow is called “separated” (Gonnermann and Manga, 2013). Rising bubbles grow continuously because of (1) decompression and (2) the increasing volatile degassing rate due to the associated decreases in the magmatic volatile solubility and of the bubble surface tension. Bubble coalescence accelerates the bubble growth.
Bubble coalescence requires two bubble walls to touch and ultimately to merge. Once two bubbles are sufficiently close to each other, near-field processes such as capillary and gravitational drainage cause a continuous reduction in the film thickness between the bubble walls until the bubbles merge after drainage times ranging from seconds to hours depending on the magmatic conditions (Herd and Pinkerton, 1997; Castro et al., 2012; Nguyen et al., 2013).
For small gas volume fractions, however, the initial distance between bubbles is large compared to the bubble dimensions and the coalescence rate is dominated by bubble transport mechanisms acting on longer length scales. Because bubble diffusion is typically negligibly small, bubble walls can only approach when a particular mechanism leads to differential bubble rise velocities or by bubble growth. In magmas with a sufficiently separated bubble flow, two neighbouring bubbles of different size can approach each other vertically due to the differential buoyancy velocities (Manga and Stone, 1994; Lovejoy et al., 2004). In magmas with a dispersed bubble flow, in contrast, the relative position of bubble centres remains fixed; thus, bubble coalescence is controlled by the bubble expansion rate caused by the ascent of the overall magma column (or affected magma parcel).
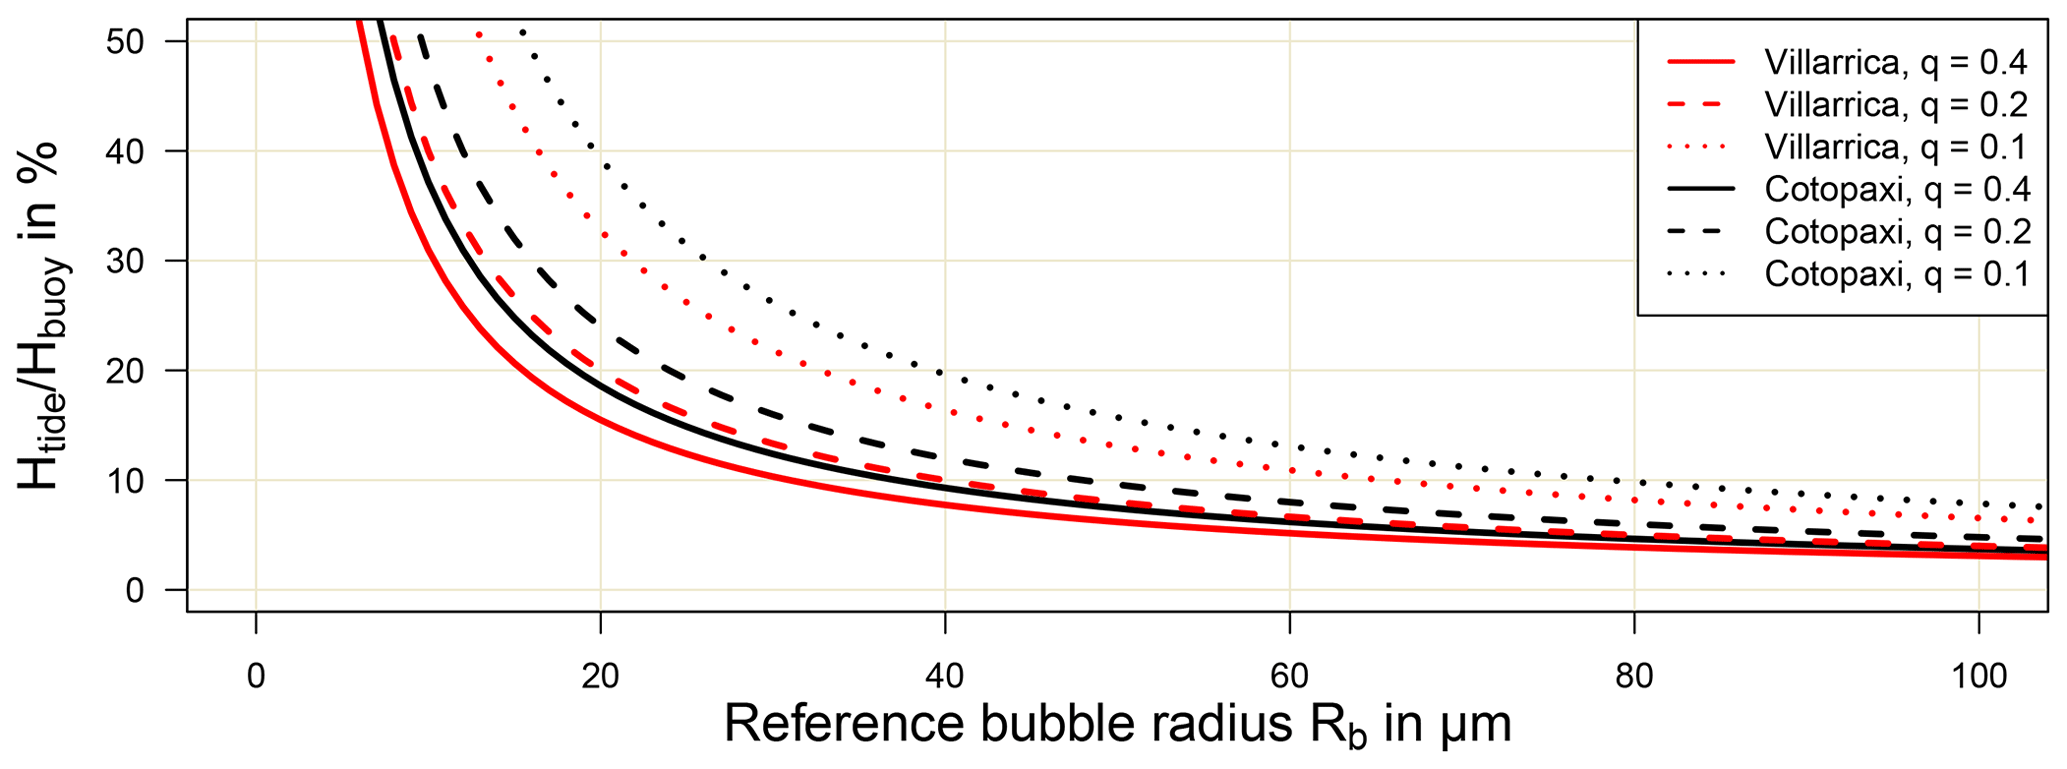
Figure 2Relative contribution of the tidal mechanism (magnitude given by Htide) on the bubble coalescence rate for a purely separated bubble flow (magnitude given by Hbuoy) depending on the reference bubble radius Rb and the degree of polydispersity q. The reference bubble radius is reciprocally linked to the depth of the particular magma layer.
3.3 Comparison of bubble coalescence mechanism
The proposed tide-induced bubble transport mechanism is compared in the following with the classically predominant bubble transport or approaching mechanisms in order to estimate the relative contribution of the tidal mechanism on the overall coalescence rate. We access the (absolute) strength of a particular transport mechanism by its “collision volume” Hi (see Appendix D). The tidal mechanism is noted by Htide. For comprehensibility, we focus on a comparison of the tidal mechanisms with the two “end-member” scenarios of a purely separated (Hbuoy) and a purely dispersed (Hdisp) bubble flow, respectively. A more comprehensive formulation of the classically predominant bubble transport or approaching mechanisms has been proposed, e.g. by Mancini et al. (2016).
For a separated bubble flow, the relative tidal contribution on the bubble coalescence rate depends reciprocally on the reference bubble radius Rb and on the degree of polydispersity q (Fig. 2). For , the tidal mechanism contributes at least 10 % to the overall bubble coalescence rate for a range of reference bubble radii of Rb= 32–65 µm for Villarrica and Rb= 37–78 µm for Cotopaxi. For comparison, Le Gall and Pichavant (2016) obtained from basalt decompression experiments mean bubble radii of (at most, depending on the volatile content) 23 µm for a pressure of 100 MPa (∼ depth of 3.7 km) and of 80 µm for a pressure of 50 MPa (∼ depth of 1.9 km) and concluded an extensive bubble coalescence rate at depth associated with 50–100 MPa. Similarly, Castro et al. (2012) obtained from rhyolite decompression experiments mean bubble radii of 15 µm for a pressure of 100 MPa (∼ depth of 3.7 km) and of 30 µm for a pressure of 40 MPa (∼ depth of 1.5 km). For andesitic magma, the dependency of the bubble size on the pressure is presumably between the values for the basaltic and the rhyolitic magma. We conclude that the tidal mechanism can significantly contribute to the bubble coalescence rate in magma layers at a depth greater than 1 km, associated with bubble radii of 30–80 µm. In contrast, the tidal contribution becomes negligible at shallow levels once the bubble radii are in the millimetre-range which corresponds to the bubble size range at which bubbles efficiently start to segregate from the surrounding melt.
For a dispersed bubble flow, the relative tidal contribution on the bubble coalescence rate depends reciprocally on the magma ascent rate, hardly on the gas volume fraction ϕ, but it depends approximately linearly on the volatile content of the magma (Fig. 3). The tidal contribution causes an enhancement of the bubble coalescence rate equivalent to the enhancement caused by an increase in the magma ascent velocity by about 0.5 m h−1 for Cotopaxi and 2.5 m h−1 for Villarrica for the listed in Table 1. For comparison, the magma ascent velocities in passively degassing volcanic systems vary roughly between 1 and 100 m h−1 (Cassidy et al., 2015, 2018). The tidal mechanism can accordingly contribute by at least several percent but potentially up to several multiples of 10% to the overall bubble coalescence rate. For gas volume fractions exceeding the minimum percolation threshold of ϕperc≈0.3, the model assumption of independent spherical bubbles increasingly loses its validity.
Our model implies a tide-induced periodical vertical magma displacement in the conduit within every semi-diurnal cycle in the order of 0.1–1 m due to magma expansion in the reservoir. At Villarrica, the modelled vertical magma displacement of 0.45 m implies a periodic variation in the lava lake level (whose areal cross section is about 10 times larger than for the conduit; Goto and Johnson, 2011) of about 5 cm. At Cotopaxi, the modelled vertical magma displacement of 0.09 m may apply additive stress on the solid plug.
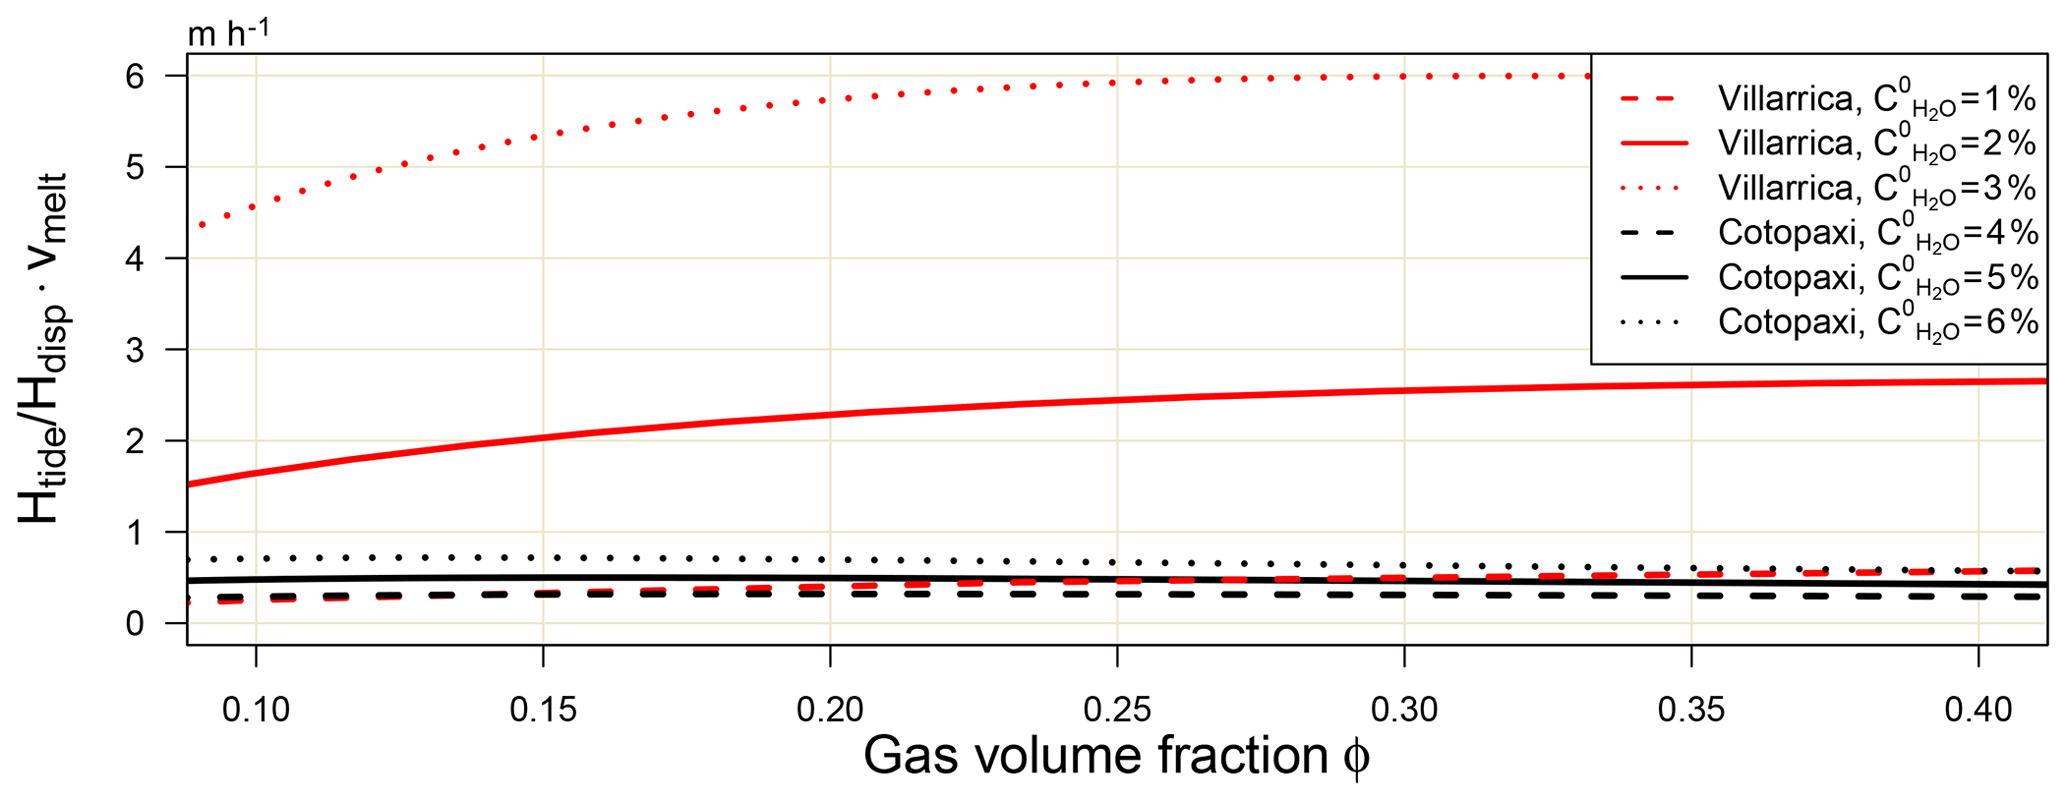
Figure 3Relative contribution of the tidal mechanism (magnitude given by Htide) on the bubble coalescence rate for a purely dispersed bubble flow (magnitude given by Hdisp) depending on the gas volume fraction and the initial water weight fraction of the magmatic melt. The corresponding values for ϕ are calculated with Eq. (5) assuming an ideal gas and magma temperatures of 1200 ∘C for Villarrica and 1000 ∘C for Cotopaxi. The relative tidal contribution is displayed as the equivalent to an enhancement of the magma ascent rate, which would have the same effect on the bubble coalescence rate. The model increasingly loses validity above the percolation threshold of ϕperc≈0.3.
We linked this magma displacement to bubble coalescence and compared the relative strength of the tide-induced bubble transport mechanism with respect to the classically predominant bubble transport mechanisms in magmas hosting a purely separated or a purely dispersed bubble flow. For both scenarios, we found that the tidal contributions to the overall bubble coalescence rate can be in the order of at least several percent up to several multiples of 10 % at a depth of several kilometres. At shallower depth, the direct tide-induced contribution to the overall bubble coalescence rate is rather negligible because the classical transport mechanisms become more efficient.
The tide-enhanced bubble coalescence rate at greater depth can nevertheless affect the gas phase in the overlying shallower layer because the additionally coalesced bubbles have a larger buoyancy velocity as well as a reduced surface tension and can thus stimulate on the one hand enhanced volatile degassing from the melt phase to the gas phase and on the other hand enhanced bubble coalescence rates in overlying layers (Prousevitch et al., 1993). These enhancements can ultimately cause the percolation of the gas phase at a somewhat greater depth compared to the tide-free scenario. In consequence, the magma becomes gas-permeable at this greater depth potentially causing enhanced volcanic gas emissions (Rust and Cashman, 2011; Gonnermann et al., 2017). The additional contributions from this greater depth to the volcanic gas emissions may also slightly shift the chemical composition of the overall gas emissions towards the chemical composition of the gas phase at this greater depth when compared to the tide-free scenario (Burton et al., 2007).
The quantitative results have been derived for the tidal forcing during spring tide. In contrast, the amplitude of the tide-induced mechanism is smaller by a factor of 3 during neap tide. Accordingly, the amplitude of the additional tide-induced contributions to the coalescence rate varies within a spring–neap tide cycle entailing a periodical signal with a period of about 14.8 d superimposed on the (nevertheless potentially much stronger) tide-independent coalescence rate. For a dispersed bubble flow scenario with rather fast magma ascent, a propagation of this superimposed signal from the enhanced coalescence rate via a variation in the percolation depth to the volcanic gas emissions is comprehensible. For a separated bubble flow scenario, however, the gas bubbles may need much more time than one spring–neap tide cycle to rise from a depth of several kilometres to the percolation depth. Magmatic systems can, however, become permeable already at a depth of 1–3 km (Edmonds and Gerlach, 2007; Burton et al., 2007), i.e. where the derived tidal effects are the strongest. In such a scenario, the tide-enhanced bubble coalescence rate could accordingly cause enhanced degassing without a significant delay.
In a scenario with a shallower percolation depth, the periodic pattern could nevertheless propagate to the degassing signal because several crucial parameters such as the mean bubble radius Rb and the gas volume fraction ϕ typically vary rather monotonously with pressure and thus depth (Gonnermann and Manga, 2013), implying a depth dependency of the relative tidal contributions to the bubble coalescence rate. Convolved along the vertical conduit axis, the tide-enhanced coalescence rate may accordingly preserve an overall periodicity driven by the dominant contributions from those magma layers which are particularly sensitive to the tidal mechanism. Moreover, this pressure dependency implies that gas contributions originating from the particularly tide-sensitive depths are more pronounced in the subsequent volcanic gas emissions during spring tide. Therefore, tide-induced variations in the chemical composition within the volcanic gas plumes may be particularly manifested in the relative molar degassing ratios (e.g. Burton et al., 2007; Bobrowski and Giuffrida, 2012; Balcone-Boissard et al., 2016) associated with these depths.
In conclusion, we traced a possible tidal impact from the tidal potential to a magma expansion in the reservoir, to a vertical magma displacement profile in the conduit, and to an enhanced bubble collision rate (and thus an enhanced coalescence rate), and this ultimately motivated a link between the tide-enhanced bubble coalescence rate and the periodical signal in the observed volcanic gas emissions. Furthermore, illustrative quantitative calculations indicated that the proposed tide-induced mechanism could lead to an enhancement of the bubble coalescence rate by up to several multiples of 10%. If propagated from enhanced bubble coalescence to a variation in the magnitude or chemical composition of the volcanic gas emissions, a periodical spring tide signal would be large enough to explain the observed about 2-weekly variations in volcanic gas emissions.
Nevertheless, our conceptual model only aimed at a proof of concept. Future studies may increase the complexity of the model by, e.g., (1) lifting several of our numerous simplifications (Appendix A), (2) incorporating macroscopic tidal mechanisms affecting the host rock explicitly, (3) adding several further microscopic mechanisms such as a tide-induced loosening of bubbles attached to the conduit walls or the tidal impact on crystal orientation, and (4) investigating possible non-linear interferences between the tide-induced dynamics and the tide-independent magma convection flow.
No unpublished data are presented or used.
In our model we applied several simplifications regarding the shape and physical properties of the magma plumbing system. This we did for the sake of clarity and, even more importantly, in order to isolate the tide-induced effect on magma flow and degassing. To achieve this, we (1) modelled the tide-induced magma flow in the conduit neglecting any tide-independent magma dynamics such as magma convection, which implies an initial mechanical and thermodynamic equilibrium between magma and adjacent host rock. The only exception is the discussion of the impact of a constant magma ascent on the bubble coalescence rate. (2) The expansion of the initial conduit magma is neglected. We assume (3) a gas-tight host rock, (4) a cylindrical volcanic conduit, (5) a no-slip condition between conduit wall and magma, and (6) homogeneous magma flow properties. (7) The viscosity of the magma in the conduit is assessed by the effective bulk viscosity. (8) The radial tide-induced magma displacement is neglected. Moreover, (9) bubble coalescence is modelled by bubble collision, neglecting near-field drainage processes, bubble deformation processes, and post-collision coalescence processes. (10) Simple bubble size distributions are chosen, and (11) it is assumed that the volcanic gas phase exclusively consists of water vapour.
The conduit radius is a crucial model parameter. The uppermost 200 m of Villarrica's conduit have frequently been exposed during the decades prior to the 2015 eruption due to pronounced oscillations of the lava lake level (Moussallam et al., 2016; Johnson et al., 2018b). The cross-sectional area of the conduit has a radius of about 30 m (Goto and Johnson, 2011), which at greater depths, however, narrows down to a mean radius of the order of Rc=6 m as is implied by studies based on gas emission magnitudes (Palma et al., 2011) and seismoacoustic properties (Richardson et al., 2014). The active vent of Cotopaxi was capped by an area of hot material with a diameter of 116–120 m during the eruption in 2015 (Johnson et al., 2018a). Although missing an empirical evidence, it is plausible that the mean conduit radius is somewhat narrower, and therefore we assume a (rather conservative) value of Rc=40 m.
Depth and volume of the magma reservoir constitute further crucial model parameters whose empirical estimates come with an even larger uncertainty. Seismic observations conducted at Villarrica imply the existence of a shallow magma reservoir with a lateral diameter of at least 5 km and a vertical extent of about 2.5 km whose centre of mass is located at a depth of around Dr=3 km below the summit (Mora-Stock, 2015), implying a conduit length of about Lc=2 km. Assuming an ellipsoidal magma reservoir, this implies a magma reservoir volume of Vr=35 km3 at Villarrica. The magmatic system of Cotopaxi in contrast seems to be more complex and hosts a rather small magma pocket (2 km3) beneath the SW flank at a depth of about 4 km below the summit (Hickey et al., 2015). Furthermore, seismic observations revealed fluid movements (magma and/or hydrothermal fluids) within a centrally located 85 km3 column spanning 2 to 14 km depth below the summit (Ruiz et al., 1998). This fluid column is assumed to connect the laterally offset shallow pocket with two much larger deeper magma reservoirs, which are situated between 7 and 11 km and somewhere at a depth greater than 16 km below the summit (Arias et al., 2015; Mothes et al., 2017; Martel et al., 2018). For heating 85 km3 of rock, these deep-seated magma reservoirs may be rather large. Missing any accurate volume estimate, we estimate that the upper of the two deep-seated reservoirs hosts a magma volume of Vr=35 km3 with a centre of mass depth of Dr=8 km. The choice of equal reservoir volumes for both Villarrica and Cotopaxi allows for a better comparison of the impact of varying the other volcanic parameters. Further, we assume the small magma pocket as the lower end of the conduit, i.e. with a conduit length of Lc=4 km.
Oscillating centre of mass displacement. After a negligible settling time, the driven oscillator described by Eq. (3) oscillates with semi-diurnal periodicity, and we obtain the general long-term solution
Navier–Stokes equation for periodical pipe flow. When exposed to a constant force (per unit mass) , a viscous fluid in a cylindrical pipe with radius Rc flows with a parabolic velocity profile v0(r), :
When exposed to a periodically varying and thus time-dependent external force , the analytical solution of the flow profile is more complicated (Spurk, 1997):
with the centre of mass velocity of a constant forcing (see Eq. C2), the real part , the imaginary unit i, the Bessel function , and the dimensionless parameter . In the limit N→0, the velocity profile asymptotically adopts the time dependency as well as the magnitude of the external force. For N=1 the exact magnitude is already , and the radial profile shows hardly any deviation from a parabolic profile. For the chosen model parameters (Table 1) and ω=ωsd, we obtain N≈0.2 and thus Eq. (C3) reduces in very good approximation to the familiar
Derivation of the equation of motion (Eq. 4). The vertical velocity of the centre of mass can be obtained as = z0 ⋅ ωsd ⋅ from Eq. (C1) and as from Eq. (C4). Further, we know from Eq. (3). Applying fext(t) to Eq. (C4) reveals and ultimately the fully parameterised equation of motion in Eq. (4).
As is common for most coalescence models (including those cited above), we consider spherical bubbles only. Two spherical bubbles with radii f1⋅Rb and f2⋅Rb (f1 and f2 drawn from ) collide as soon as the distance between their bubble centres is . We introduce the collision volume associated with a bubble with radius f1⋅Rb as the volume enclosing all possible initial locations of the bubble centre of another bubble with radius f2⋅Rb such that both bubbles collide (and thus coalesce) at the latest after a time interval Δt. All bubble collision mechanisms are derived as enhancements of the initial static collision volume
and we consider only those bubble pairs which have not collided already in the initial state. The absolute enhancement of the collision volume due to a particular bubble collision mechanism divided by Δt thus gives the enhancement of the bubble collision rate contributed by the particular mechanism. Because the tide-induced mechanisms are derived for a semi-diurnal cycle, the relative strengths of all coalescence mechanisms are compared with respect to this time interval Δtsd.
The collision volumes of the different collision mechanisms are all derived with the same approach: we fix the position of a bubble with arbitrary radius f1⋅Rb and derive with respect to the relative motion of another bubble with arbitrary radius f2⋅Rb. In each case the initial collision volume H0(f1,f2) is subtracted either already tacitly in the motivation or explicitly mathematically. Higher-order details such as the influence of a third bubble on the numeric results are ignored.
Tide-enhanced bubble collision volume. We fix the horizontal coordinates , , of the first bubble, where the cylindrical symmetry of the conduit allows us to pick the azimuth angle without loss of generality and vary the horizontal coordinates of a second bubbles. The horizontal distance h between the two bubbles is thus given by . Within a semi-diurnal cycle, the peak-to-peak differential tide-induced vertical displacement of two bubbles at the radial coordinates r and r0 is given by Δ ztide(r,r0) = (see Eq. 4). The tide-induced collision volume is then the integral of Δztide(r,r0) integrated over a circle with radius rcoal:
This integral has to be split into two integrals at the angles where the sign of the absolute function changes, which is the case at :
We integrate Htide(r0) over the local spatial bubble distribution in the conduit in order to obtain the average effect. We parameterise the (isotropic) spatial bubble distribution by the depth-independent , which is a homogeneous distribution for α=1 but with all bubbles at the conduit wall if α→∞, respectively. For the averaged tide-induced collision volume, we obtain
The “distribution term” is for an isotropic bubble distribution and approaches unity if all bubbles are close to the host rock. Arguably, the conditions for crystal nucleation and thus bubble nucleation are better close to the host rock where the magma is cooler and more crystals and thus nucleation possibilities are available. Following this reasoning but also because we want to examine the maximum possible tidal impact, we set the distribution term to unity. The “tidal term” contains the information on the scale of the effective tide-induced impact. The “scale term” contains the information on the actual bubble size distribution, highlighting that the relative tidal enhancement is identical for any bubble size distribution, at least in our simple model.
Buoyancy-induced bubble collision volume. Two bubbles with radii have a differential rise velocity , and thus their relative distance changes during the rise. The two bubbles will collide if the larger bubble is below the smaller and if the horizontal distance between their bubble centres is at most rcoal. Accordingly, the buoyancy-induced collision volume Hbuoy is a cylindrical volume with base area and cylinder length Δvbuoy⋅Δtsd:
For a given pair of bubbles with radii , f1 and f2 drawn from , the ratio of the contribution from the tide-induced and the buoyancy-induced collision mechanisms is
The bulk ratio (with respect to the local magma layer) can be obtained by a previous and separate integration of Htide and Hbuoy over f1 and f2 with respect to the actual bubble size distribution (rather than integrating Eq. D11). For the explicit bubble size distribution from Eq. (6), we obtain the bulk collision volumes and ,
and thus the bulk ratio (used for the calculation of Fig. 2):
Growth-induced bubble collision volume. In magma with a dispersed bubble flow (vbuoy≪vmelt), a rising bubble exhibits a pressure decrease rate of
Ignoring accompanying changes in secondary parameters such as melt temperature and magma composition and assuming for simplicity a monodisperse bubble size distribution (thus ), for the enhancement of the collision volume due to a rise-driven pressure decrease by Δp≪p0 (apply Eq. 5 on Eq. D1), we obtain
where we assume that ρmelt is constant and ρgas follows the ideal gas law. Inserting Eq. (D15) in Eq. (D16), we obtain
The ratio of the contribution from the tide-induced and the growth-induced collision mechanism (used for the calculation of Fig. 3) is
All authors have contributed at all stages to the development of the presented model by their critical assessment of the model set-up and the model implications. The particular foci of the individual authors were as follows: FD and UP conceptualised the model set-up; FD and SB contributed expertise on the Earth tides; FD, SB, SA, and NB contributed expertise on volcanic degassing and bubble coalescence; FD, UP, and TW assessed the physical consistency of the model. FD wrote the paper.
The authors declare that they have no conflict of interest.
The authors thank Antonella Longo, Nolwenn Le Gall and another anonymous reviewer for their comments on the paper. We thank the Deutsche Forschungsgemeinschaft for supporting this work within the project DFG PL193/14-1.
The article processing charges for this open-access publication were covered by the Max Planck Society.
This paper was edited by Antonella Longo and reviewed by Nolwenn Le Gall and one anonymous referee.
Agnew, D. C.: Earth Tides, in: Treatise on Geophysics and Geodesy, Elsevier, New York, 2007. a
Arias, G., Molina Polania, C., Ruiz, M., Kumagai, H., Hernandez, S., Plain, M., Mothes, P., Yepez, M., Barrington, C., and Hidalgo, S.: Very Long Period Seismicity Accompanying Increasing Shallower Activity at Cotopaxi Volcano, American Geophysical Union, Fall Meeting, 2015. a
Aumento, F.: Radon tides on an active volcanic island: Terceira, Azores, Geofis. Int., 41, 499–505, 2002. a
Baker, T. F.: Tidal deformations of the Earth, Sci. Prog., 69, 197–233, 1984. a, b, c, d, e, f
Balcone-Boissard, H., Boudon, G., Cioni, R., Webster, J. D., Zdanowicz, G., Orsi, G., and Civetta, L.: Chlorine as a geobarometer for alkaline magmas: Evidence from a systematic study of the eruptions of Mount Somma-Vesuvius, Sci. Rep., 6, 21726, https://doi.org/10.1038/srep21726, 2016. a
Bani, P., Tamburello, G., Rose-Koga, E. F., Liuzzo, M., Aiuppa, A., Cluzel, N., Amat, I., Syahbana, D. K., Gunawan, H., and Bitetto, M.: Dukono, the predominant source of volcanic degassing in Indonesia, sustained by a depleted Indian-MORB, B. Volcanol., 80, 5, https://doi.org/10.1007/s00445-017-1178-9, 2017. a
Beckett, F., Burton, M., Mader, H., Phillips, J., Polacci, M., Rust, A., and Witham, F.: Conduit convection driving persistent degassing at basaltic volcanoes, J. Volcanol. Geoth. Res., 283, 19–35, https://doi.org/10.1016/j.jvolgeores.2014.06.006, 2014. a, b
Berrino, G. and Corrado, G.: Tidal signal in the recent dynamics of Campi Flegrei caldera (Italy), J. Volcanol. Geoth. Res., 48, 93–101, https://doi.org/10.1016/0377-0273(91)90035-X, 1991. a
Blower, J., Keating, J., Mader, H., and Phillips, J.: The evolution of bubble size distributions in volcanic eruptions, J. Volcanol. Geoth. Res., 120, 1–23, https://doi.org/10.1016/S0377-0273(02)00404-3, 2003. a
Bobrowski, N. and Giuffrida, G.: Bromine monoxide/sulphur dioxide ratios in relation to volcanological observations at Mt. Etna 2006–2009, Solid Earth, 3, 433–445, https://doi.org/10.5194/se-3-433-2012, 2012. a
Boichu, M., Oppenheimer, C., Tsanev, V., and Kyle, P. R.: High temporal resolution SO2 flux measurements at Erebus volcano, Antarctica, J. Volcanol. Geoth. Res., 190, 325–336, https://doi.org/10.1016/j.jvolgeores.2009.11.020, 2010. a
Bower, D. R.: Bedrock fracture parameters from the interpretation of well tides, J. Geophys. Res.-Sol. Ea., 88, 5025–5035, https://doi.org/10.1029/JB088iB06p05025, 1983. a, b
Bredemeyer, S. and Hansteen, T. H.: Synchronous degassing patterns of the neighbouring volcanoes Llaima and Villarrica in south-central Chile: the influence of tidal forces, Int. J. Earth Sci., 103, 1999–2012, https://doi.org/10.1007/s00531-014-1029-2, 2014. a, b
Burton, M., Allard, P., Muré, F., and La Spina, A.: Magmatic Gas Composition Reveals the Source Depth of Slug-Driven Strombolian Explosive Activity, Science, 317, 227–230, https://doi.org/10.1126/science.1141900, 2007. a, b, c
Campion, R., Martinez-Cruz, M., Lecocq, T., Caudron, C., Pacheco, J., Pinardi, G., Hermans, C., Carn, S., and Bernard, A.: Space- and ground-based measurements of sulphur dioxide emissions from Turrialba Volcano (Costa Rica), B. Volcanol., 74, 1757–1770, https://doi.org/10.1007/s00445-012-0631-z, 2012. a
Campion, R., Delgado-Granados, H., Legrand, D., Taquet, N., Boulesteix, T., Pedraza-Espitía, S., and Lecocq, T.: Breathing and Coughing: The Extraordinarily High Degassing of Popocatépetl Volcano Investigated With an SO2 Camera, Front. Earth Sci., 6, 163, https://doi.org/10.3389/feart.2018.00163, 2018. a
Cashman, K. V. and Marsh, B. D.: Crystal size distribution (CSD) in rocks and the kinetics and dynamics of crystallization II: Makaopuhi lava lake, Contrib. Mineral. Petr., 99, 292–305, https://doi.org/10.1007/BF00375363, 1988. a
Cassidy, M., Cole, P., Hicks, K. E., Varley, N. R., Peters, N., and Lerner, A. H.: Rapid and slow: Varying magma ascent rates as a mechanism for Vulcanian explosions, Earth Planet. Sc. Lett., 420, 73–84, https://doi.org/10.1016/j.epsl.2015.03.025, 2015. a, b
Cassidy, M., Manga, M., Cashman, K., and Bachmann, O.: Controls on explosive-effusive volcanic eruption styles, Nat. Commun., 9, 2839, https://doi.org/10.1038/s41467-018-05293-3, 2018. a, b
Castro, J. M., Burgisser, A., Schipper, C. I., and Mancini, S.: Mechanisms of bubble coalescence in silicic magmas, B. Volcanol., 74, 2339–2352, https://doi.org/10.1007/s00445-012-0666-1, 2012. a, b
Cigolini, C., Poggi, P., Ripepe, M., Laiolo, M., Ciamberlini, C., Donne, D. D., Ulivieri, G., Coppola, D., Lacanna, G., Marchetti, E., Piscopo, D., and Genco, R.: Radon surveys and real-time monitoring at Stromboli volcano: Influence of soil temperature, atmospheric pressure and tidal forces on 222Rn degassing, J. Volcanol. Geoth. Res., 184, 381–388, https://doi.org/10.1016/j.jvolgeores.2009.04.019, 2009. a, b
Conde, V., Bredemeyer, S., Duarte, E., Pacheco, J. F., Miranda, S., Galle, B., and Hansteen, T. H.: SO2 degassing from Turrialba Volcano linked to seismic signatures during the period 2008–2012, Int. J. Earth Sci., 103, 1983–1998, https://doi.org/10.1007/s00531-013-0958-5, 2014. a
Connor, C. B., Stoiber, R. E., and Malinconico, L. L.: Variation in sulfur dioxide emissions related to earth tides, Halemaumau Crater, Kilauea Volcano, Hawaii, J. Geophys. Res.-Sol. Ea., 93, 14867–14871, https://doi.org/10.1029/JB093iB12p14867, 1988. a
Darwin, G.: Report of a committee for the harmonic analysis of tidal observations, in: Report of the British Association for the Advancement of Science, 49–117, 1883. a
De Mendoca Dias, A.: The volcano of Capelinhos (Azores), the solar activity and the earth-tide, B. Volcanol., 24, 211–221, https://doi.org/10.1007/BF02599348, 1962. a
Dinger, F., Bobrowski, N., Warnach, S., Bredemeyer, S., Hidalgo, S., Arellano, S., Galle, B., Platt, U., and Wagner, T.: Periodicity in the BrO∕SO2 molar ratios in the volcanic gas plume of Cotopaxi and its correlation with the Earth tides during the eruption in 2015, Solid Earth, 9, 247–266, https://doi.org/10.5194/se-9-247-2018, 2018. a, b
Doodson, A. T.: The Harmonic Development of the Tide-Generating Potential, P. R. Soc. Lond. A-Conta., 100, 704, https://doi.org/10.1098/rspa.1921.0088, 1921. a
Dzurisin, D.: Influence of fortnightly Earth tides at Kilauea Volcano, Hawaii, Geophys. Res. Lett., 7, 925–928, https://doi.org/10.1029/GL007i011p00925, 1980. a
Edmonds, M. and Gerlach, T. M.: Vapor segregation and loss in basaltic melts, Geology, 35, 751, https://doi.org/10.1130/G23464A.1, 2007. a
Elkhoury, J. E., Brodsky, E. E., and Agnew, D. C.: Seismic waves increase permeability, Nature, 441, 1135–1138, https://doi.org/10.1038/nature04798, 2006. a, b
Emter, D.: Tidal triggering of earthquakes and volcanic events, 293–309, Springer, Berlin, Heidelberg, https://doi.org/10.1007/BFb0011468, 1997. a
Fischer, T. P., Roggensack, K., and Kyle, P. R.: Open and almost shut case for explosive eruptions: Vent processes determined by SO2 emission rates at Karymsky volcano, Kamchatka, Geology, 30, 1059, https://doi.org/10.1130/0091-7613(2002)030<1059:OAASCF>2.0.CO;2, 2002. a
Galle, B., Johansson, M., Rivera, C., Zhang, Y., Kihlman, M., Kern, C., Lehmann, T., Platt, U., Arellano, S., and Hidalgo, S.: Network for Observation of Volcanic and Atmospheric Change (NOVAC) – A global network for volcanic gas monitoring: Network layout and instrument description, J. Geophys. Res.-Atmos., 115, d05304, https://doi.org/10.1029/2009JD011823, 2010. a
Gibbs, A. D.: Linked fault families in basin formation, J. Struct. Geol., 12, 795–803, https://doi.org/10.1016/0191-8141(90)90090-L, 1990. a
Girona, T., Huber, C., and Caudron, C.: Sensitivity to lunar cycles prior to the 2007 eruption of Ruapehu volcano, Sci. Rep., 8, 1476, https://doi.org/10.1038/s41598-018-19307-z, 2018. a
Gonnermann, H. M. and Manga, M.: Dynamics of magma ascent in the volcanic conduit, in: Modeling Volcanic Processes: The Physics and Mathematics of Volcanism, edited by: Fagents, S. A., Gregg, T. K. P., and Lopes, R. M. C., 55–84, Cambridge University Press, Cambridge, https://doi.org/10.1017/CBO9781139021562.004, 2013. a, b, c
Gonnermann, H. M., Giachetti, T., Fliedner, C., Nguyen, C. T., Houghton, B. F., Crozier, J. A., and Carey, R. J.: Permeability During Magma Expansion and Compaction, J. Geophys. Res.-Sol. Ea., 122, 9825–9848, https://doi.org/10.1002/2017JB014783, 2017. a
Goto, A. and Johnson, J. B.: Monotonic infrasound and Helmholtz resonance at Volcan Villarrica (Chile), Geophys. Res. Lett., 38, L06301, https://doi.org/10.1029/2011GL046858, 2011. a, b
Hamilton, W. L.: Tidal cycles of volcanic eruptions: fortnightly to 19 yearly periods, J. Geophys. Res., 78, 3363–3375, https://doi.org/10.1029/JB078i017p03363, 1973. a
Harrison, J. C., Ness, N. F., Longman, I. M., Forbes, R. F. S., Kraut, E. A., and Slichter, L. B.: Earth-tide observations made during the international geophysical year, J. Geophys. Res., 68, 1497–1516, https://doi.org/10.1029/JZ068i005p01497, 1963. a
Herd, R. A. and Pinkerton, H.: Bubble coalescence in basaltic lava: Its impact on the evolution of bubble populations, J. Volcanol. Geoth. Res., 75, 137–157, https://doi.org/10.1016/S0377-0273(96)00039-X, 1997. a
Hickey, J., Gottsmann, J., and Mothes, P.: Estimating volcanic deformation source parameters with a finite element inversion: The 2001–2002 unrest at Cotopaxi volcano, Ecuador, J. Geophys. Res.-Sol. Ea., 120, 1473–1486, https://doi.org/10.1002/2014JB011731, 2015. a
Huber, C., Su, Y., Nguyen, C. T., Parmigiani, A., Gonnermann, H. M., and Dufek, J.: A new bubble dynamics model to study bubble growth, deformation, and coalescence, J. Geophys. Res.-Sol. Ea., 119, 216–239, https://doi.org/10.1002/2013JB010419, 2013. a
Ide, S., Yabe, S., and Tanaka, Y.: Earthquake potential revealed by tidal influence on earthquake size-frequency statistics, Nat. Geosci., 9, 834–837, 2016. a, b
Ilanko, T., Oppenheimer, C., Burgisser, A., and Kyle, P.: Cyclic degassing of Erebus volcano, Antarctica, B. Volcanol., 77, 56, https://doi.org/10.1007/s00445-015-0941-z, 2015. a
Johnson, J., Ruiz, M., Ortiz, H., Watson, L., Viracucha, G., Ramon, P., and Almeida, M.: Infrasound Tornillos Produced by Volcan Cotopaxi's Deep Crater, Geophys. Res. Lett., 45, 5436–5444, https://doi.org/10.1029/2018GL077766, 2018a. a
Johnson, J. B., Watson, L. M., Palma, J. L., Dunham, E. M., and Anderson, J. F.: Forecasting the Eruption of an Open-Vent Volcano Using Resonant Infrasound Tones, Geophys. Res. Lett., 45, 2213–2220, https://doi.org/10.1002/2017GL076506, 2018b. a
Johnston, M. J. S. and Mauk, F. J.: Earth Tides and the Triggering of Eruptions from Mt Stromboli, Italy, Nature, 239, 266–267, https://doi.org/10.1038/239266b0, 1972. a
Kazahaya, K., Shinohara, H., and Saito, G.: Excessive degassing of Izu-Oshima volcano: magma convection in a conduit, B. Volcanol., 56, 207–216, https://doi.org/10.1007/BF00279605, 1994. a, b
Le Gall, N. and Pichavant, M.: Homogeneous bubble nucleation in H2O- and H2O-CO2-bearing basaltic melts: Results of high temperature decompression experiments, J. Volcanol. Geoth. Res., 327, 604–621, 2016. a, b
Lensky, N., Navon, O., and Lyakhovsky, V.: Bubble growth during decompression of magma: experimental and theoretical investigation, J. Volcanol. Geoth. Res., 129, 7–22, https://doi.org/10.1016/S0377-0273(03)00229-4, 2004. a, b
Lopez, T., Carn, S., Werner, C., Fee, D., Kelly, P., Doukas, M., Pfeffer, M., Webley, P., Cahill, C., and Schneider, D.: Evaluation of Redoubt Volcano's sulfur dioxide emissions by the Ozone Monitoring Instrument, J. Volcanol. Geoth. Res., 259, 290–307, https://doi.org/10.1016/j.jvolgeores.2012.03.002, 2013. a
Lovejoy, S., Gaonac'h, H., and Schertzer, D.: Bubble distributions and dynamics: The expansion-coalescence equation, J. Geophys. Res.-Sol. Ea., 109, b11203, https://doi.org/10.1029/2003JB002823, 2004. a, b
Mancini, S., Forestier-Coste, L., Burgisser, A., James, F., and Castro, J.: An expansion-coalescence model to track gas bubble populations in magmas, J. Volcanol. Geoth. Res., 313, 44–58, https://doi.org/10.1016/j.jvolgeores.2016.01.016, 2016. a, b
Manga, M. and Stone, H.: Interactions between bubbles in magmas and lavas: effects of bubble deformation, J. Volcanol. Geoth. Res., 63, 267–279, https://doi.org/10.1016/0377-0273(94)90079-5, 1994. a
Manga, M., Beresnev, I., Brodsky, E. E., Elkhoury, J. E., Elsworth, D., Ingebritsen, S. E., Mays, D. C., and Wang, C.-Y.: Changes in permeability caused by transient stresses: Field observations, experiments, and mechanisms, Rev. Geophys., 50, https://doi.org/10.1029/2011RG000382, 2012. a, b
Martel, C., Andújar, J., Mothes, P., Scaillet, B., Pichavant, M., and Molina, I.: Storage conditions of the mafic and silicic magmas at Cotopaxi, Ecuador, J. Volcanol. Geoth. Res., 354, 74–86, https://doi.org/10.1016/j.jvolgeores.2018.02.006, 2018. a, b
McNutt, S. R. and Beavan, R. J.: Volcanic earthquakes at Pavlof Volcano correlated with the solid earth tide, Nature, 294, 615–618, https://doi.org/10.1038/294615a0, 1981. a
McNutt, S. R. and Beavan, R. J.: Patterns of earthquakes and the effect of solid earth and ocean load tides at Mount St. Helens prior to the May 18, 1980, eruption, J. Geophys. Res.-Sol. Ea., 89, 3075–3086, https://doi.org/10.1029/JB089iB05p03075, 1984. a
Moitra, P., Gonnermann, H. M., Houghton, B. F., and Giachetti, T.: Relating vesicle shapes in pyroclasts to eruption styles, B. Volcanol., 75, 691, https://doi.org/10.1007/s00445-013-0691-8, 2013. a
Mora-Stock, C. N.: Seismic Structure and Seismicity of Villarrica Volcano (Southern Central Chile), Ph.D. thesis, University of Kiel (Germany), 2015. a
Mothes, P. A., Ruiz, M. C., Viracucha, E. G., Ramón, P. A., Hernández, S., Hidalgo, S., Bernard, B., Gaunt, E. H., Jarrín, P., Yépez, M. A., and Espín, P. A.: Geophysical Footprints of Cotopaxi's Unrest and Minor Eruptions in 2015: An Opportunity to Test Scientific and Community Preparedness, in: Advances in Volcanology, 1–30, Springer, Berlin, Heidelberg, https://doi.org/10.1007/11157_2017_10, 2017. a
Moussallam, Y., Bani, P., Curtis, A., Barnie, T., Moussallam, M., Peters, N., Schipper, C. I., Aiuppa, A., Giudice, G., Álvaro, A., Velasquez, G., and Cardona, C.: Sustaining persistent lava lakes: Observations from high-resolution gas measurements at Villarrica volcano, Chile, Earth Planet. Sc. Lett., 454, 237–247, https://doi.org/10.1016/j.epsl.2016.09.012, 2016. a
Moussallam, Y., Tamburello, G., Peters, N., Apaza, F., Schipper, C. I., Curtis, A., Aiuppa, A., Masias, P., Boichu, M., Bauduin, S., Barnie, T., Bani, P., Giudice, G., and Moussallam, M.: Volcanic gas emissions and degassing dynamics at Ubinas and Sabancaya volcanoes; implications for the volatile budget of the central volcanic zone, J. Volcanol. Geoth. Res., 343, 181–191, https://doi.org/10.1016/j.jvolgeores.2017.06.027, 2017. a
Nakamura, K.: Volcanoes as possible indicators of tectonic stress orientation – principle and proposal, J. Volcanol. Geoth. Res., 2, 1–16, https://doi.org/10.1016/0377-0273(77)90012-9, 1977. a
Nguyen, C. T., Gonnermann, H. M., Chen, Y., Huber, C., Maiorano, A. A., Gouldstone, A., and Dufek, J.: Film drainage and the lifetime of bubbles, Geochem. Geophys. Geosys., 14, 3616–3631, https://doi.org/10.1002/ggge.20198, 2013. a
Nicholson, E., Mather, T., Pyle, D., Odbert, H., and Christopher, T.: Cyclical patterns in volcanic degassing revealed by SO2 flux timeseries analysis: An application to Soufrière Hills Volcano, Montserrat, Earth Planet. Sc. Lett., 375, 209–221, https://doi.org/10.1016/j.epsl.2013.05.032, 2013. a
Oppenheimer, C., Fischer, T., and Scaillet, B.: Volcanic Degassing: Process and Impact, in: Treatise on Geochemistry (Second Edition), 111–179, Elsevier, Amsterdam, https://doi.org/10.1016/B978-0-08-095975-7.00304-1, 2014. a
Palma, J. L., Blake, S., and Calder, E. S.: Constraints on the rates of degassing and convection in basaltic open-vent volcanoes, Geochem. Geophys. Geosys., 12, https://doi.org/10.1029/2011GC003715, 2011. a, b, c, d, e, f
Parfitt, E., Wilson, L., and Head, J.: Basaltic magma reservoirs: factors controlling their rupture characteristics and evolution, J. Volcanol. Geoth. Res., 55, 1–14, https://doi.org/10.1016/0377-0273(93)90086-7, 1993. a
Patanè, G., Frasca, A., Agodi, A., and Imposa, S.: Earth tides and Etnean volcanic eruptions: an attempt at correlation of the two phenomena during the 1983, 1985 and 1986 eruptions, Phys. Earth Planet. In., 87, 123–135, https://doi.org/10.1016/0031-9201(94)90026-4, 1994. a
Pering, T., Tamburello, G., McGonigle, A., Aiuppa, A., Cannata, A., Giudice, G., and Patanè, D.: High time resolution fluctuations in volcanic carbon dioxide degassing from Mount Etna, J. Volcanol. Geoth. Res., 270, 115–121, https://doi.org/10.1016/j.jvolgeores.2013.11.014, 2014. a
Petrosino, S., Cusano, P., and Madonia, P.: Tidal and hydrological periodicities of seismicity reveal new risk scenarios at Campi Flegrei caldera, Sci. Rep., 8, 13808–13808, https://doi.org/10.1038/s41598-018-31760-4, 2018. a
Ponchaut, F., Lyard, F., and Provost, C. L.: An Analysis of the Tidal Signal in the WOCE Sea Level Dataset, J. Atmos. Ocean. Tech., 18, 77–91, 2001. a
Prousevitch, A. A., Sahagian, D. L., and Anderson, A. T.: Dynamics of diffusive bubble growth in magmas: Isothermal case, J. Geophys.l Res.-Sol. Ea., 98, 22283–22307, https://doi.org/10.1029/93JB02027, 1993. a, b, c
Proussevitch, A. and Sahagian, D.: Bubbledrive-1: A numerical model of volcanic eruption mechanisms driven by disequilibrium magma degassing, J. Volcanol. Geoth. Res., 143, 89–111, https://doi.org/10.1016/j.jvolgeores.2004.09.012, 2005. a
Richardson, J. P., Waite, G. P., and Palma, J. L.: Varying seismic-acoustic properties of the fluctuating lava lake at Villarrica volcano, Chile, J. Geophys. Res.-Sol. Ea., 119, 5560–5573, https://doi.org/10.1002/2014JB011002, 2014. a
Ruiz, M., Guillier, B., Chatelain, J.-L., Yepes, H., Hall, M., and Ramon, P.: Possible causes for the seismic activity observed in Cotopaxi Volcano, Ecuador, Geophys. Res. Lett., 25, 2305–2308, https://doi.org/10.1029/98GL01689, 1998. a
Rust, A., Manga, M., and Cashman, K.: Determining flow type, shear rate and shear stress in magmas from bubble shapes and orientations, J. Volcanol. Geoth. Res., 122, 111–132, https://doi.org/10.1016/S0377-0273(02)00487-0, 2003. a
Rust, A. C. and Cashman, K. V.: Permeability controls on expansion and size distributions of pyroclasts, J. Geophys. Res.-Sol. Ea., 116, 111–132, https://doi.org/10.1029/2011JB008494, 2011. a, b, c
Sahagian, D. L. and Proussevitch, A. A.: 3D particle size distributions from 2D observations: stereology for natural applications, J. Volcanol. Geoth. Res., 84, 173–196, https://doi.org/10.1016/S0377-0273(98)00043-2, 1998. a
Sottili, G. and Palladino, D. M.: Tidal modulation of eruptive activity at open-vent volcanoes: evidence from Stromboli, Italy, Terra Nova, 24, 233–237, https://doi.org/10.1111/j.1365-3121.2012.01059.x, 2012. a
Sottili, G., Martino, S., Palladino, D. M., Paciello, A., and Bozzano, F.: Effects of tidal stresses on volcanic activity at Mount Etna, Italy, Geophys. Res. Lett., 34, l01311, https://doi.org/10.1029/2006GL028190, 2007. a, b, c
Sparks, R. S. J.: Triggering of volcanic eruptions by Earth tides, Nature, 290, 448, https://doi.org/10.1038/290448a0, 1981. a
Spurk, J. H.: Fluid Mechanics, Springer, Berlin Heidelberg, 1997. a
Stoiber, R. E., Williams, S. N., and Huebert, B. J.: Sulfur and halogen gases at Masaya Caldera Complex, Nicaragua: Total flux and variations with time, J. Geophys. Res.-Sol. Ea., 91, 12215–12231, https://doi.org/10.1029/JB091iB12p12215, 1986. a
Takada, A.: The influence of regional stress and magmatic input on styles of monogenetic and polygenetic volcanism, J. Geophys. Res.-Sol. Ea., 99, 13563–13573, https://doi.org/10.1029/94JB00494, 1994. a
Tamburello, G., Aiuppa, A., McGonigle, A. J. S., Allard, P., Cannata, A., Giudice, G., Kantzas, E. P., and Pering, T. D.: Periodic volcanic degassing behavior: The Mount Etna example, Geophys. Res. Lett., 40, 4818–4822, https://doi.org/10.1002/grl.50924, 2013. a
Telling, J., Flower, V., and Carn, S.: A multi-sensor satellite assessment of SO2 emissions from the 2012–13 eruption of Plosky Tolbachik volcano, Kamchatka, J. Volcanol. Geoth. Res., 307, 98–106, https://doi.org/10.1016/j.jvolgeores.2015.07.010, 2015. a
Tripoli, B. A., Cordonnier, B., Zappone, A., and Ulmer, P.: Effects of crystallization and bubble nucleation on the seismic properties of magmas, Geochem., Geophys. Geosys., 17, 602–615, https://doi.org/10.1002/2015GC006123, 2016. a
Zhang, Y., Xu, Z., Zhu, M., and Wang, H.: Silicate melt properties and volcanic eruptions, Rev. Geophys., 45, https://doi.org/10.1029/2006RG000216, 2007. a, b
- Abstract
- Introduction
- Tide-induced magma displacement in the conduit
- Tide-enhanced bubble coalescence
- Discussion and conclusions
- Data availability
- Appendix A: List of applied mayor simplifications
- Appendix B: Quantitative estimates for the geometrical model parameters
- Appendix C: Calculation of tide-induced conduit flow
- Appendix D: Calculation of the collision volumes
- Author contributions
- Competing interests
- Acknowledgements
- Financial support
- Review statement
- References