the Creative Commons Attribution 4.0 License.
the Creative Commons Attribution 4.0 License.
 | 16 Nov 2020
Multiphase, decoupled faulting in the southern German Molasse Basin – evidence from 3-D seismic data
Vladimir Shipilin
David C. Tanner
Hartwig von Hartmann
Inga Moeck
We use three-dimensional seismic reflection data from the southern German Molasse Basin to investigate the structural style and evolution of a geometrically decoupled fault network in close proximity to the Alpine deformation front. We recognise two fault arrays that are vertically separated by a clay-rich layer – lower normal faults and upper normal and reverse faults. A frontal thrust fault partially overprints the upper fault array. Analysis of seismic stratigraphy, syn-kinematic strata, throw distribution, and spatial relationships between faults suggest a multiphase fault evolution: (1) initiation of the lower normal faults in the Upper Jurassic carbonate platform during the early Oligocene, (2) development of the upper normal faults in the Cenozoic sediments during the late Oligocene, and (3) reverse reactivation of the upper normal faults and thrusting during the mid-Miocene. These distinct phases document the evolution of the stress field as the Alpine orogen propagated across the foreland. We postulate that interplay between the horizontal compression and vertical stresses due to the syn-sedimentary loading resulted in the intermittent normal faulting. The vertical stress gradients within the flexed foredeep defined the independent development of the upper faults above the lower faults, whereas mechanical behaviour of the clay-rich layer precluded the subsequent linkage of the fault arrays. The thrust fault must have been facilitated by the reverse reactivation of the upper normal faults, as its maximum displacement and extent correlate with the occurrence of these faults. We conclude that the evolving tectonic stresses were the primary mechanism of fault activation, whereas the mechanical stratigraphy and pre-existing structures locally governed the structural style.
- Article
(21395 KB) - Full-text XML
- BibTeX
- EndNote


In the last decade, there has been an increasing interest in foreland basins because some of them contain deep aquifers that host geothermal resources (e.g. Schulz et al., 2004; Weides and Majorowicz, 2014). Understanding of tectonic evolution and fault kinematics is crucial to evaluate potential geothermal reservoirs, which at depths below 3 km are primarily hosted in interconnected fractures and constrained by faults (Moeck, 2014).
Foreland basins have complex deformation structures that range from normal faults towards the foreland to contractional and inverted faults near the orogenic front (DeCelles and Giles, 1996; Tavani et al., 2015). Such deformation patterns show that the basin were subject to a variety of stress states that develop during the lithospheric flexuring, subsidence, and sedimentation as the orogenic front progresses forward. Locally, the stress states may be modified by inherited structures, such as pre-existing faults (Tavani et al., 2015; Wibberley et al., 2008), and differences in mechanical behaviour of rock layers (Ferrill et al., 2017). The resultant composite structural history can be correctly deciphered using a three-dimensional approach, as can be derived from three-dimensional seismic datasets.
The focus of this work is an in-depth analysis of deformation structures in the southernmost part of a typical foreland basin system, the German Molasse Basin. A number of basin-scale structural studies were carried out in the 1980s and 1990s, based on a large amount of 2-D seismic data acquired for hydrocarbon exploration (e.g. Bachmann et al., 1982, 1987; Müller et al., 1988; Bachmann and Müller, 1992). The increasing interest in geothermal exploitation in recent years, and therefore the acquisition of 3-D seismic data, has allowed more detailed studies of the complexly deformed areas (e.g. Lüschen et al., 2011; von Hartmann et al., 2016; Budach et al., 2017). Nevertheless, the tectonic and stratigraphic factors controlling the evolution of the structure of the German Molasse Basin have not been fully described as yet.
Using a 3-D seismic reflection dataset, acquired in the area of Geretsried, 30 km south of Munich (Fig. 1), our aim is to understand the complex structure and tectonic evolution of part of this basin, proximal to the European Alpine deformation front. To achieve this, we analyse the seismic data to (i) reconstruct the temporal and spatial evolution of the fault network within the foreland basin sequence and its Mesozoic substratum, and (ii) evaluate the impact of the evolving stress field, pre-existing deformation structures, and mechanical stratigraphy on fault evolution, structural style, and kinematic interactions between faults.
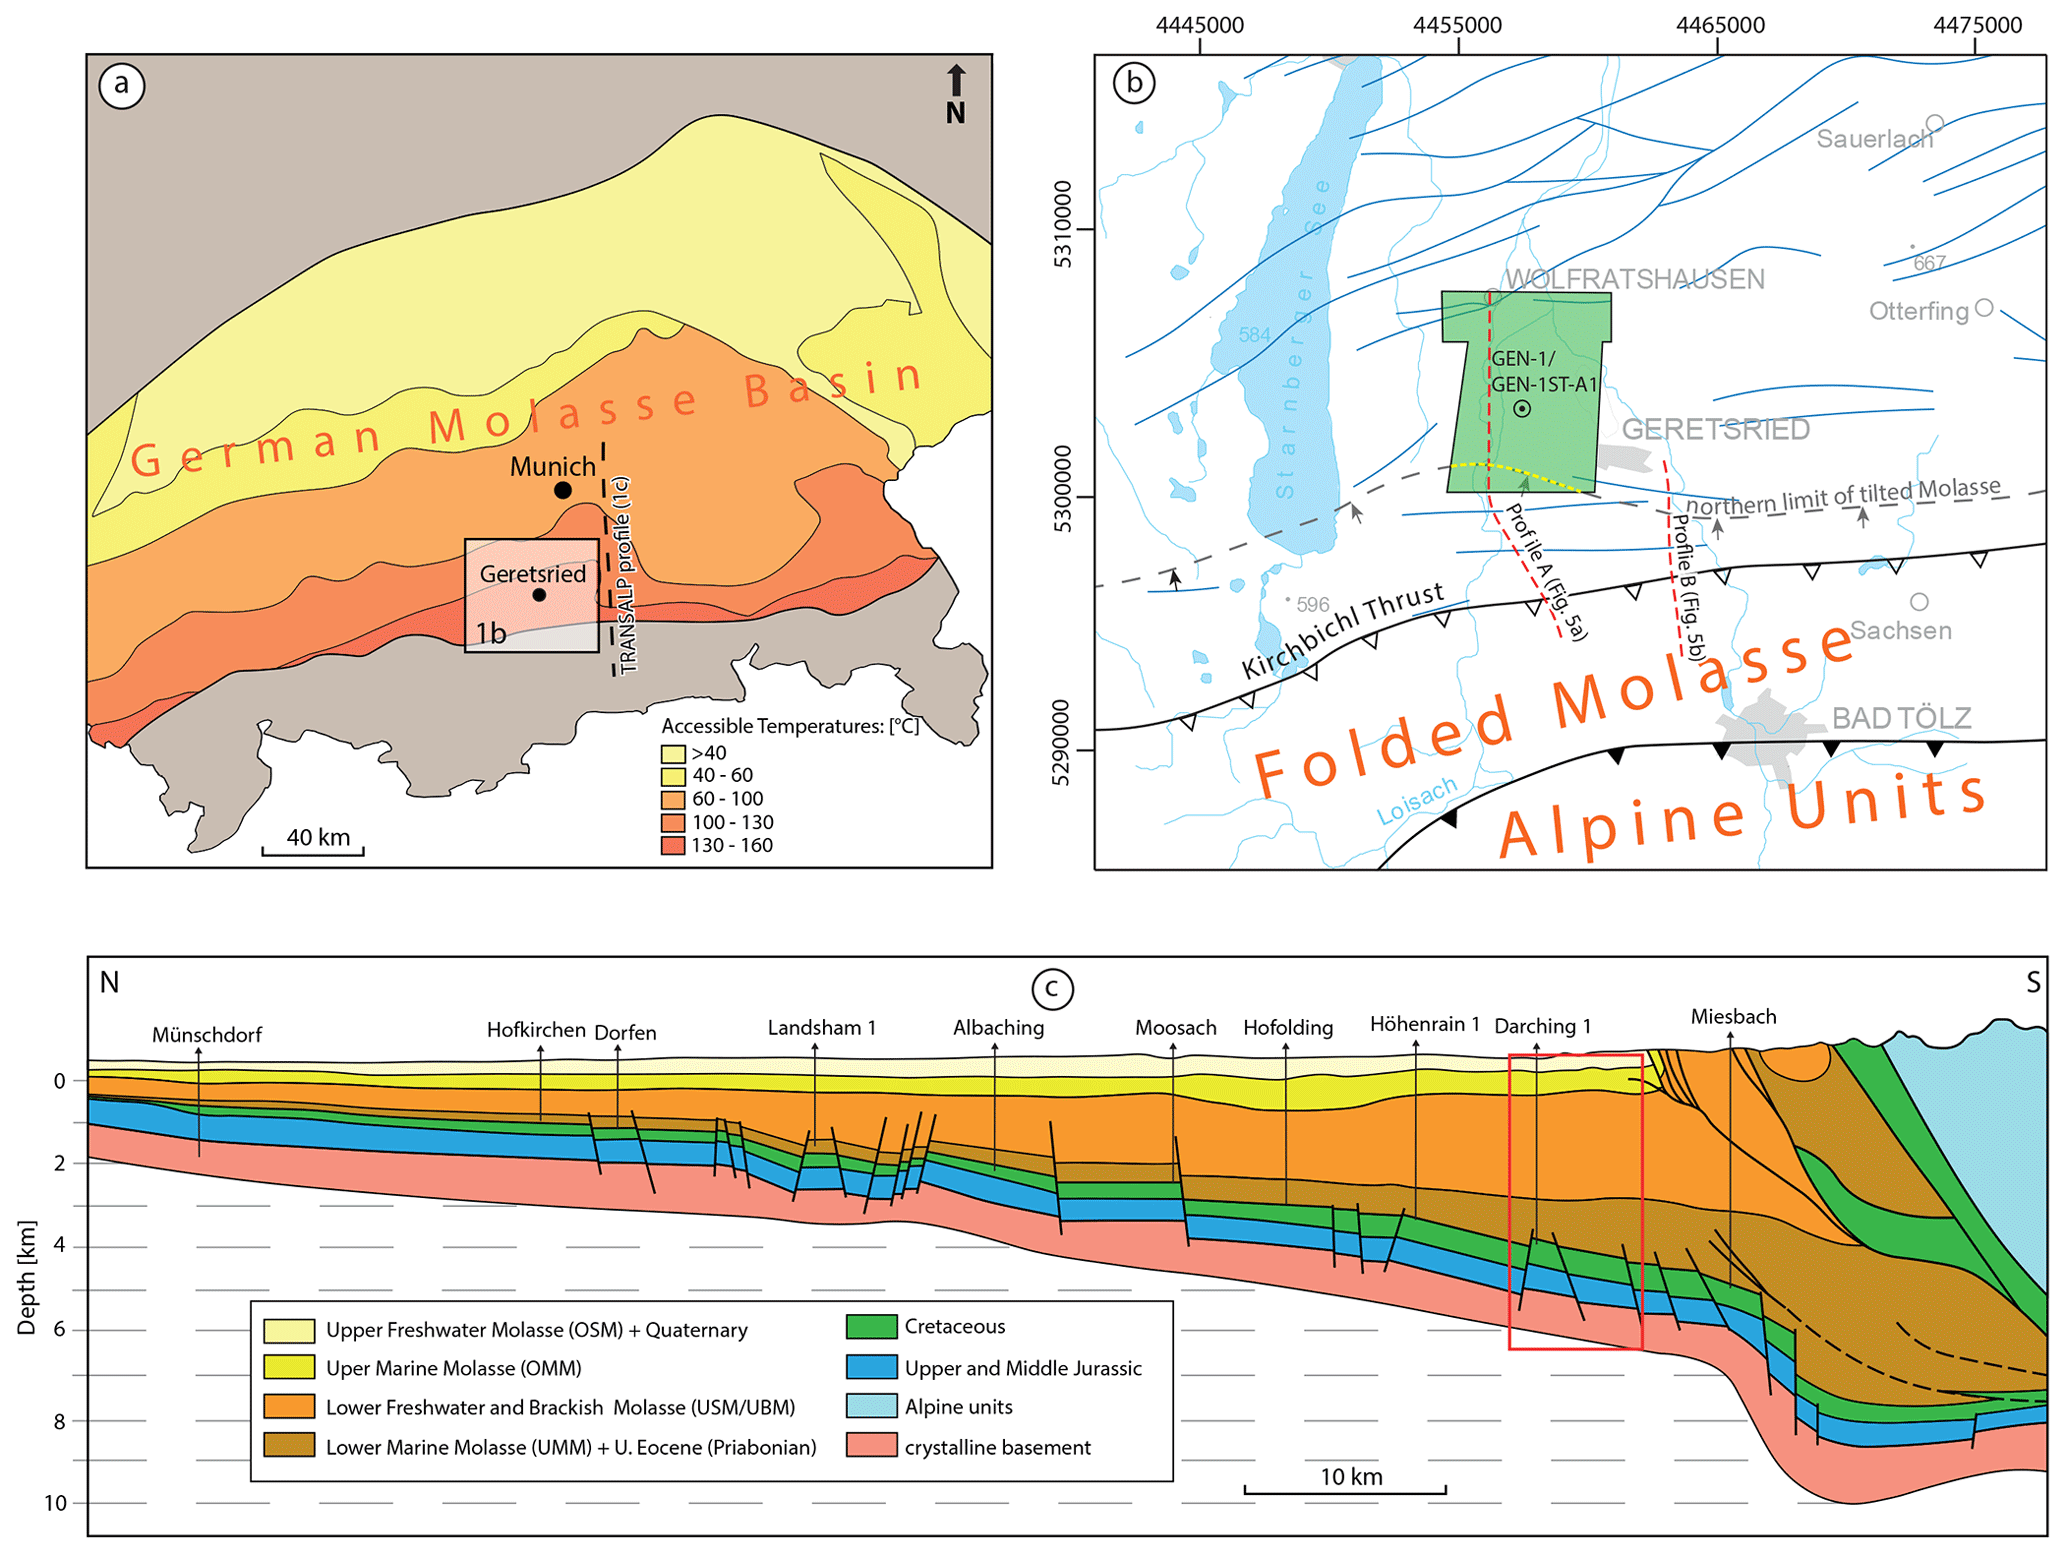
Figure 1(a) Outline of the German Molasse Basin with geothermal areas (Agemar et al., 2014). The black box marks area shown in panel (b). The dashed black line shows the location of the regional cross-section in panel (c). (b) Close-up of the study area, showing the extent of the 3-D seismic survey, the location of two seismic profiles, and well GEN-1. Blue lines are traces of major normal faults in the Upper Jurassic carbonate platform (GeoMol Team, 2005). The dashed grey line marks the N limit of the tilted Molasse according to the tectonic map of the Folded Molasse by Ortner et al. (2015). The dashed yellow line shows the N extent of the Geretsried fold. (c) Simplified cross-section across the Molasse Basin, based on the interpretation of the seismic TRANSALP profile (after Lüschen et al., 2006), located 30 km to the east of the study area. The red box marks the projection of the study area.
The German Molasse Basin (GMB) is part of the North Alpine Foreland Basin (Fig. 1) that evolved on the subducting European margin in response to the late Eocene Alpine collision (Frisch, 1979; Lemcke, 1973; Bachmann et al., 1982; Ziegler et al., 1995). Orogenic loading and consequent flexure of the foreland plate created a wedge-shaped basin fill in front of the advancing Alps (Allen et al., 1991; Bachmann and Müller, 1992). Flexural subsidence was accompanied by the formation of longitudinal (i.e. foredeep-parallel) normal faults (Lemcke, 1988; Bachmann et al., 1982; Ziegler, 1990; Bachmann and Müller, 1992).
From the Jurassic to mid-Cretaceous, the region of the future GMB evolved as a passive margin (Frisch, 1979; Ziegler, 1990; Pfiffner, 1992). Submergence of the southern European margin in the Jurassic led to the deposition of lower and Middle Jurassic marine shales and the Upper Jurassic carbonates on a gently sloping, shallow platform (Meyer and Schmidt-Kaler, 1990). Subsequent phases of eustatically induced regression and transgression in the Cretaceous resulted in sedimentation of shallow-water carbonates, glauconitic sandstone, and deep-water marls and shales (Fig. 2; Bachmann et al., 1987).
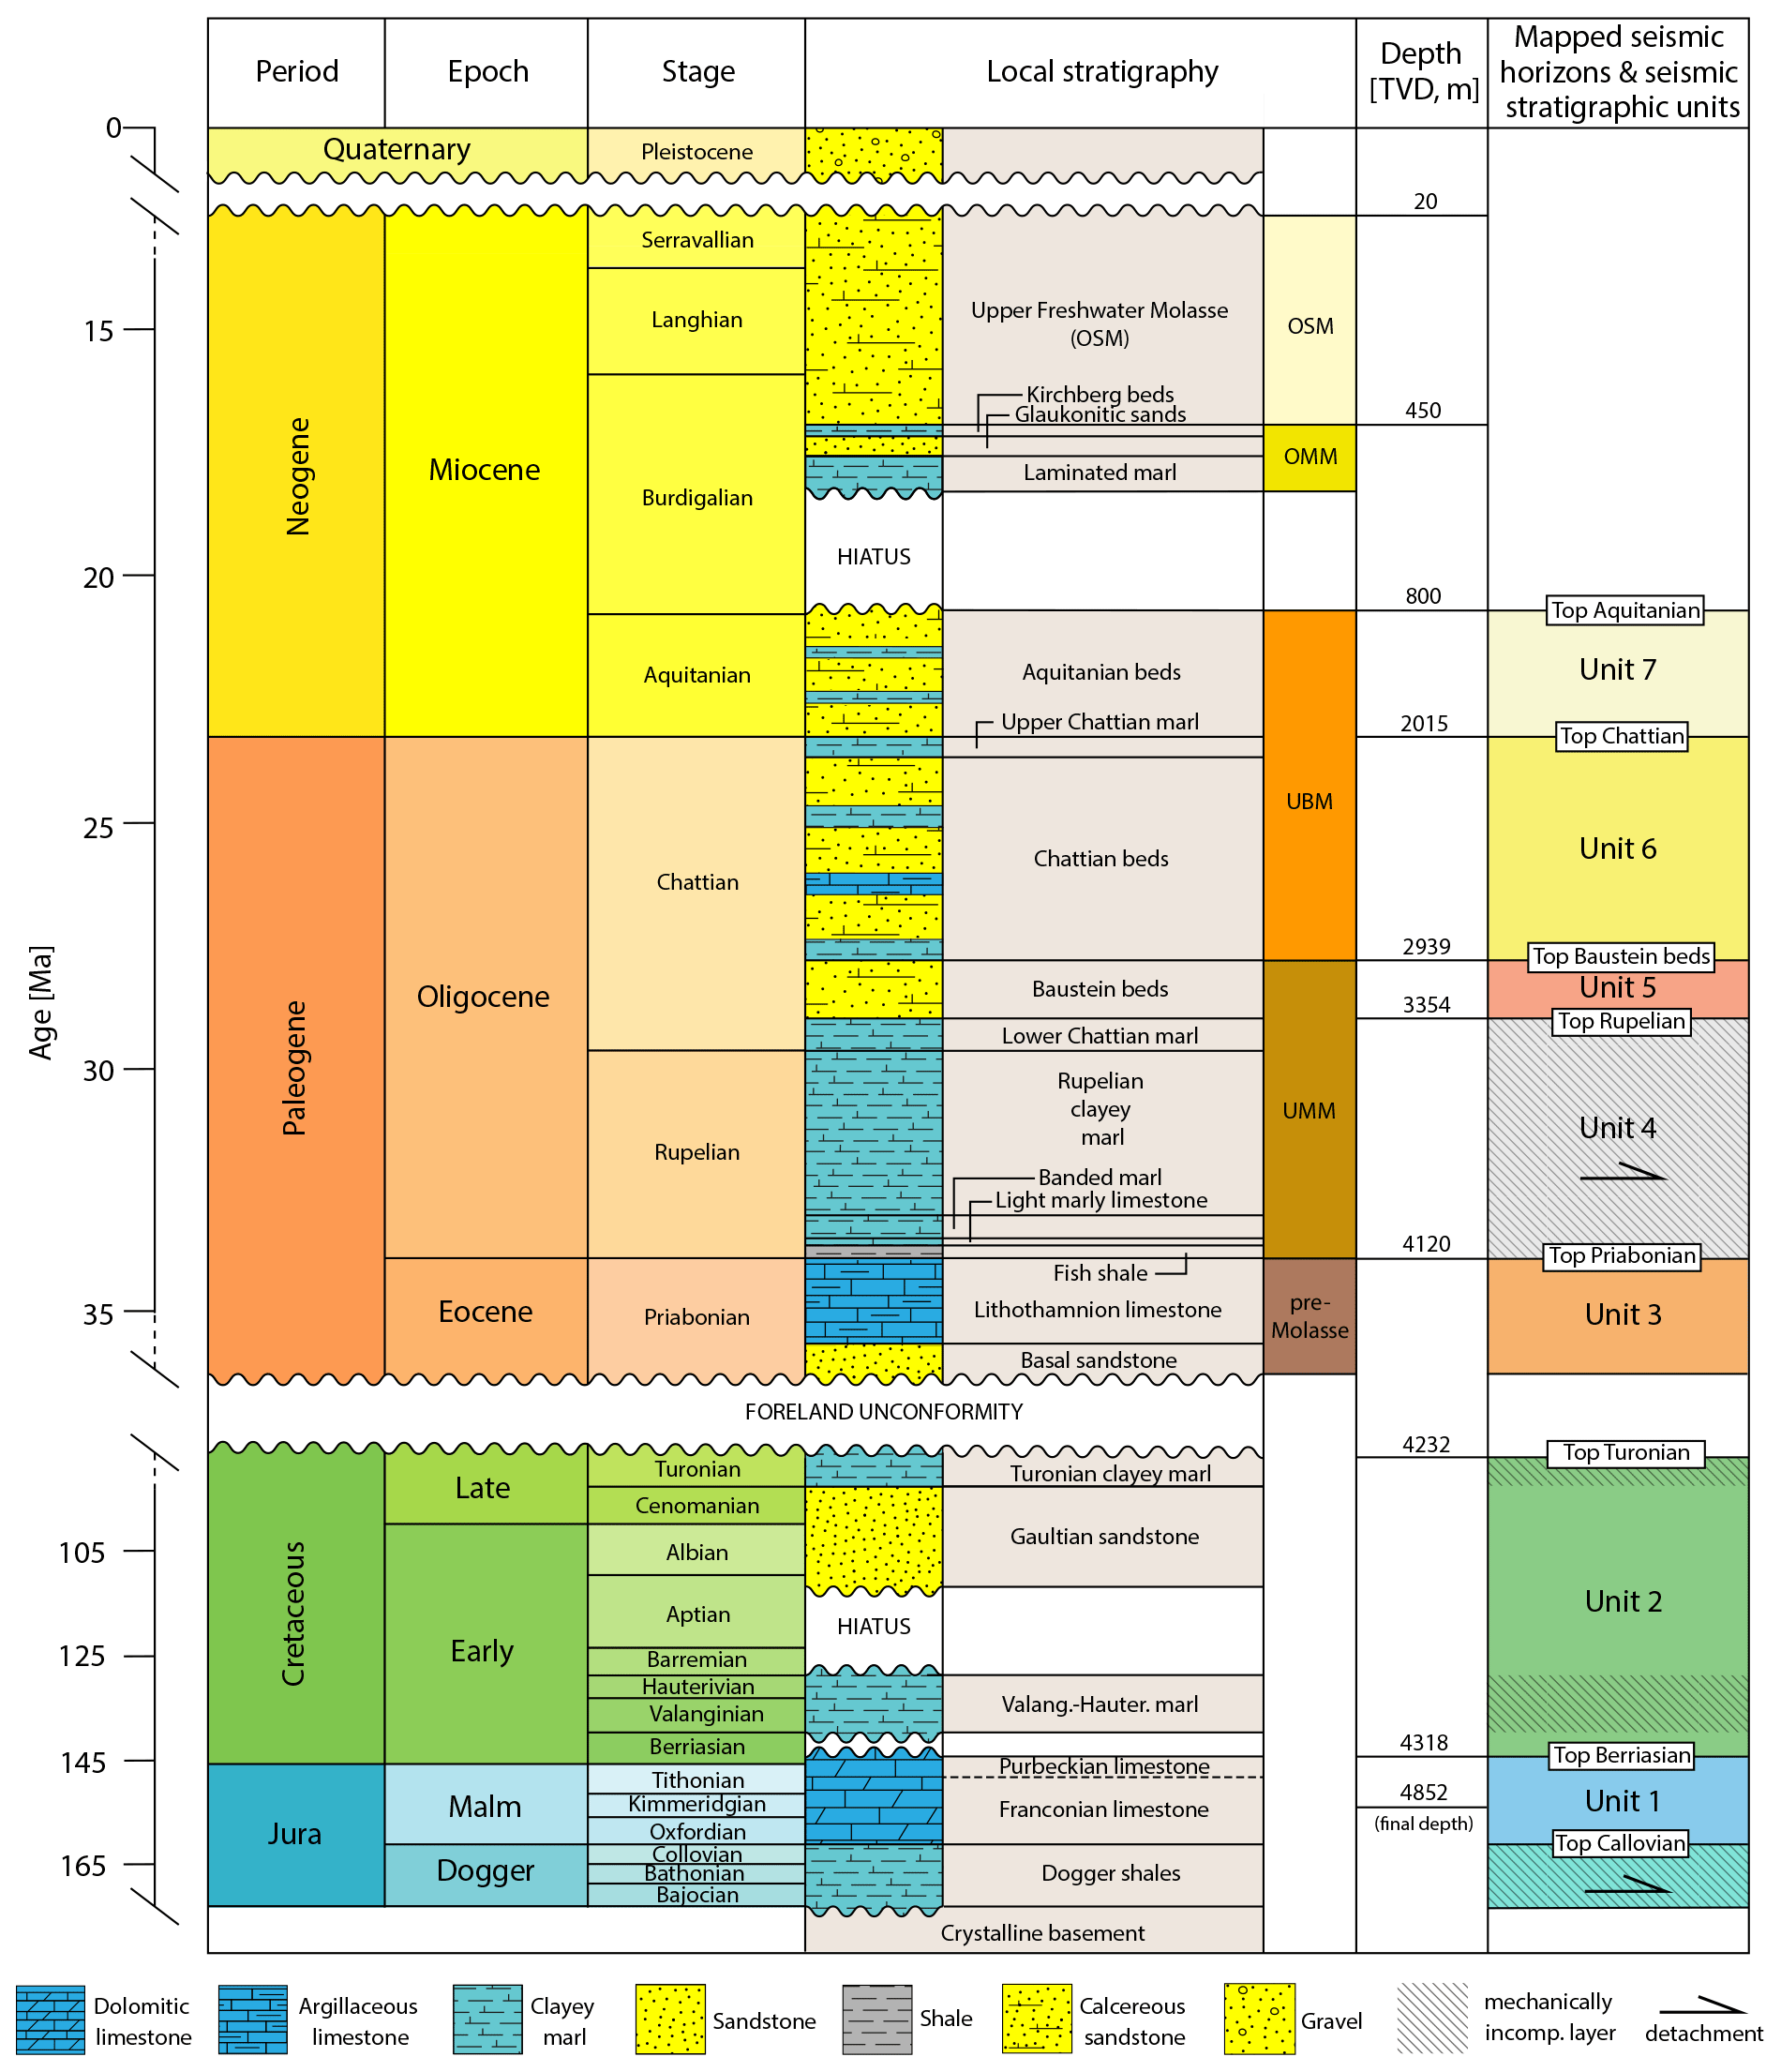
Figure 2Detailed stratigraphy of the study area. Formation tops in depth were taken from the GEN-1 well. Qualitative mechanical stratigraphy (Fischer, 1960; Müller, 1970; Budach et al., 2017) and the location of inferred detachments (Bachmann et al., 1982; Müller et al., 1988; Ortner et al., 2015; von Hartmann et al., 2016) are also indicated. Mapped seismic horizons, and the stratal units they bound, are depicted in the right column. For stratigraphic abbreviations, see Fig. 1c.
The sedimentation of the Mesozoic passive margin terminated with the onset of Late Cretaceous compressional deformation. This is widely accepted to have been caused by the inception of the NW-directed Alpine thrusting (Ziegler, 1987, 1990). However, Kley and Voigt (2015) argue that the Late Cretaceous pulse of the NNE–SSW-oriented contraction reflects the change of Africa's motion relative to Europe from the south-easterly to the north-easterly direction. As the result of the Late Cretaceous intraplate contraction, the Mesozoic passive margin was subjected to inversion and erosion (Bachmann and Müller, 1991; Roeder and Bachmann, 1996). Erosion continued throughout the Palaeocene to middle Eocene (Lemcke, 1981) due to the subsequent uplift of the flexural forebulge that migrated across the foreland in advance of the Alpine orogen (Allen et al., 1991). The late Eocene flexural subsidence in the GMB marked the onset of foredeep sedimentation. As the Alpine orogen continued to move forward, the basin fill progressively onlapped in a NW direction onto the truncated Mesozoic basement and locally onto Palaeozoic rocks (Lemcke, 1988; Freudenberger and Schwerd, 1996), forming an angular basal unconformity, referred to as the forebulge unconformity by Allen et al. (1991).
The foreland basin fill can be subdivided into late Eocene “pre-Molasse” and Oligocene to Miocene “Molasse” sequences (Sissingh, 1997). The deposition of the pre-Molasse sequence occurred during an early marine transgression and is characterised by non-molasse sedimentation of shallow-marine basal sandstone (Basissandstein) and Lithothamnion limestone (Lithothamnienkalk) (Sissingh, 1997; Zweigel et al., 1998). The overlying Molasse sequence accumulated in the course of two subsequent transgressive–regressive megacycles. Traditionally, the Molasse sequence is subdivided into, from older to younger, the Lower Marine Molasse (Untere Meeresmolasse, UMM), the Lower Freshwater Molasse (Untere Süßwassermolasse, USM), the Upper Marine Molasse (Obere Meeresmolasse, OMM), and the Upper Freshwater Molasse (Obere Süßwassermolasse, OSM) (Figs. 1c and 2; von Guembel, 1861).
The deposition of the UMM started in the early Oligocene (Rupelian) during a late marine transgression, as the basin deepened rapidly (Bachmann and Müller, 1992; Sissingh, 1997). It is characterised by the widespread accumulation of pelitic sediments – fish shale (Fischschiefer), light marly limestone (Hellermergelkalk), banded marl, and Rupelian clayey marl (Kuhlemann and Kempf, 2002). Subsequent marine regression in the mid-Oligocene (Rupelian/Chattian) resulted in deposition of littoral Baustein beds (Diem, 1986; Kuhlemann and Kempf, 2002). In the late Oligocene to early Miocene (Chattian and Aquitanian), during the deposition of the USM, continental conditions were established in the western basin part, while marine sedimentation continued in the deeper part of the basin, to the east of Munich. The central GMB was dominated by a coastal to shallow-marine setting, resulting in accumulation of the transitional Lower Brackish Molasse (Untere Brackwassermolasse, UBM). It is composed of the Chattian and Aquitanian beds, termed the Cyrena beds, – an alternation of calcareous sandstones, marlstones, limestones, and coal (Freudenberger and Schwerd, 1996).
The second transgressive–regressive megacycle began in the early Miocene (Burdigalian) with transgression of OMM marls over the Aquitanian–Burdigalian unconformity (Fig. 2; Lemcke, 1988; Zweigel et al., 1998). Although the foreland flexuring was ongoing in the GMB during deposition of the OMM (Ortner et al., 2015), the foreland subsidence decreased significantly with the onset of OMM deposition (Zweigel et al., 1998). Despite decreasing subsidence, marine conditions were established in the basin due to a decrease in sediment supply accompanied by the relief reduction in the Eastern Alps (Zweigel et al., 1998; Kuhlemann and Kempf, 2002). By the beginning of the mid-Miocene (Langhian), when deposition of the OSM had started, continental conditions prevailed across the entire GMB (Lemcke, 1988).
At the southern basin margin, the Folded (Subalpine) Molasse was formed by thrusting and incorporation of the proximal foreland basin sediments into the Alpine wedge (Fig. 1c; Bachmann et al., 1987; Reinecker et al., 2010; Ortner et al., 2015). Thermochronological data suggest that the thrusting in the Folded Molasse continued into the late Miocene (von Hagke et al., 2015). From approximately 8.5 Ma onwards, the GMB experienced isostatically induced uplift and erosion (Lemcke, 1973).
The main database for this investigation is a Kirchhoff pre-stack, depth-migrated, 3-D seismic reflection survey. It was acquired in 2010 for geothermal exploration and covers an area of approximately 40 km2 in the southern part of the GMB (Fig. 1). The seismic volume has a record length of 5000 ms two-way travel time (TWT) with a 36-fold bin size of 25 m by 25 m. It is displayed with the Society of Exploration Geophysicists (SEG) standard polarity; that is, positive and negative impedance contrasts are depicted as peaks (red) and troughs (blue), respectively. The vertical stratigraphic resolution ranges from approximately 20 m within the Cenozoic Molasse sediments to approximately 55 m at the base of the carbonate platform. Additionally, we used paper copies of two approximately 7 km long seismic profiles that were acquired in 1987 to investigate the deformation style at the transition between the Foreland (Plateau) Molasse and the Folded Molasse. The profiles are located south and south-east of the 3-D seismic survey area (Fig. 1b) and therefore allowed us also to investigate the southward extent of the structures identified within the 3-D seismic survey.
The seismic reflection data are supplemented by a vertical seismic profile and formation top data from the only borehole available within the study area – GEN-1 – down to the intermediate level of the Upper Jurassic carbonate platform (Fig. 2). We used time-to-depth picks obtained from the vertical seismic profile to calibrate the interval migration velocities. The resultant velocity model was used for time-to-depth conversion.
4.1 3-D seismic interpretation
The 3-D seismic reflection survey was interpreted in the time domain using Schlumberger Petrel® seismic interpretation software. We used the vertical seismic profile data to tie well stratigraphy to the seismic dataset. This provided age constraints for seven seismic horizons that were mapped across the dataset from the top of the Purbeckian limestone, which corresponds to the top Berriasian, up to the highest seismically recognisable horizon – top Aquitanian (Fig. 2). An additional horizon – the inferred base of the carbonate platform (top Callovian) – was also interpreted. For this interval, there is no well control and vertical seismic resolution is poor. We picked a prominent positive-phase reflection that can be considered the base of the carbonate platform, given the reported 600–650 m thickness of the latter (Lemcke, 1988), and expected strong acoustic impedance contrast due to a change in lithology, and therefore velocity and density, from the Upper Jurassic carbonates to the Middle Jurassic clastics.
To better detect faults, we implemented a fault enhancement filter on the seismic dataset and used seismic volume attributes, such as variance and curvature. The fault enhancement filter suppresses random noise and enhances amplitudes at fault locations, resulting in sharper fault edges. Hence, high variance anomalies became more pronounced, highlighting faults that have discrete offsets. The curvature attribute was used to infer the presence of faults where a discrete offset is succeeded by a “curved” reflection shape. Such curved geometries could be the seismic expression of subseismic conjugate faulting, plastic deformation in the presence of mechanical stratigraphy, or an imaging artefact due to lateral changes of seismic velocities at faults (Marfurt, 2018).
Subsequently, the variance and curvature volumes were co-rendered to map the full extent of the faults. The faults were traced on time slices in multi-attribute display and then mapped on vertical sections in reflectivity display. The vertical sections were preferentially oriented perpendicular to the strike of the faults, with a line spacing of 75–100 m.
4.2 Structural modelling
In addition to 3-D seismic interpretation of key stratigraphic horizons and faults, we created a consistent 3-D structural model to analyse the three-dimensional relationship between faults and sedimentation. For the modelling, the interpreted stratigraphic horizons and faults were depth-converted and imported as ASCII point sets into SKUA-GOCAD®. We used two interpolation methods to construct triangulated surfaces from point sets; (i) direct triangulation for fault modelling, and (ii) discrete smooth interpolation for stratigraphic surface modelling. The former method directly tessellates the surfaces, whereby the interpreted points are used as hard constraints to form the vertices of triangles. In the latter method, the interpreted points are not directly part of the surface. Instead, the discrete smooth interpolation creates a trend surface, whereby the interpreted points are honoured as soft constraints in a least-square sense (Mallet, 2002). The resultant surface has a minimum distance to the points and is therefore representative of the original interpretation. We chose the latter method for stratigraphic horizon modelling, because it minimises the artificial roughness of the surfaces, which is inherited from the interpretation due to a large amount of data points. To model displacement of stratigraphic horizons along faults, we used the “modelling horizon-to-fault contacts” module in the “structural modelling” workflow. It consists of two steps:
-
The first step is the calculation of a horizon-to-fault contact line between the current geometry of the horizon and the fault. New irregularly spaced points are created within the horizon surface, along the contact with the fault.
-
The second step is the construction of a faulted horizon. The horizon surface is opened along the fault plane using the discrete smoothing interpolation algorithm. The original point set is used as control points to allow the interpolation algorithm to keep the faulted horizon as close as possible to the original point set. Points within the vicinity of the fault are considered of a high interpretation uncertainty, and therefore we excluded the points within 50 m of the fault from the interpolation process.
From the structural model, we used the following tools to obtain temporal and spatial constraints on the evolution of the investigated fault network:
- i.
Isochore maps of the key stratigraphic units allow us to analyse thickness variations across faults to infer their syn-depositional activity (e.g. Jackson and Larsen, 2009; Tvedt et al., 2013; Ziesch et al., 2017). The isochore maps were generated by computing vertical distance between the modelled horizon surfaces bounding a stratigraphic unit and projecting this information (as a scalar value at every triangle node) onto the basal horizon. The algorithm calculates the vertical distance from the basal horizon surface to the nearest top horizon surface, so that overlapping of surfaces due to contractional faulting does not produce an artefact. The major limitations of this method are the computational artefacts associated with the gaps on the top surface produced by normal faults. The computational algorithm attributes zero values to the area of the basal horizon surface directly beneath the fault gap and interpolates minimal values to the adjacent regions to avoid abrupt thickness change to 0 m. This results in significant thinning of a stratigraphic unit towards a fault, which is in fact a computational error.
- ii.
Allan maps (juxtaposition diagrams) show the throw distribution in a view perpendicular to the fault surface and therefore provide insight into the growth and linkage history of the fault (Allan, 1989). A juxtaposition diagram is constructed by projecting fault cut-offs of the stratigraphic horizons onto a plane that is perpendicular to the pole of the fault surface. To quantify throw distribution, we created polylines at fault cut-offs with nodes at a constant interval of 50 m and plotted them on a depth vs. fault strike-length diagram. Additionally, we produced vertical throw distribution plots (t–z plots) for selected faults to quantify their growth and propagation (e.g. Cartwright et al., 1998; Baudon and Cartwright, 2008a, b, c; Tvedt et al., 2013).
5.1 Seismic stratigraphy
The good quality of the seismic data, along with the lithological constraints of the mapped horizons, enabled us to establish a seismic-stratigraphic framework of the study area, and characterise depositional patterns of the basin fill. The identified horizons define seven seismic-stratigraphic units, as shown on the representative seismic profiles in Fig. 3. The stratigraphic framework (Fig. 3) qualitatively depicts the mechanical stratigraphy of the identified units, providing information on the competence contrast rather than actual rock strength. The latter is difficult to assess for rocks at the time they were deformed (Ferrill et al., 2017). The stratigraphic units are specified as either competent or incompetent, based on the published interpretation of their mechanical behaviour from outcrop and well data (Fischer, 1960; Müller, 1970; Budach et al., 2017) and on the mechanical properties from literature, e.g. von Hartmann et al. (2016). Figure 3 shows also inferred locations of detachment horizons (Bachmann et al., 1982; Müller et al., 1988; Ortner et al., 2015; von Hartmann et al., 2016).
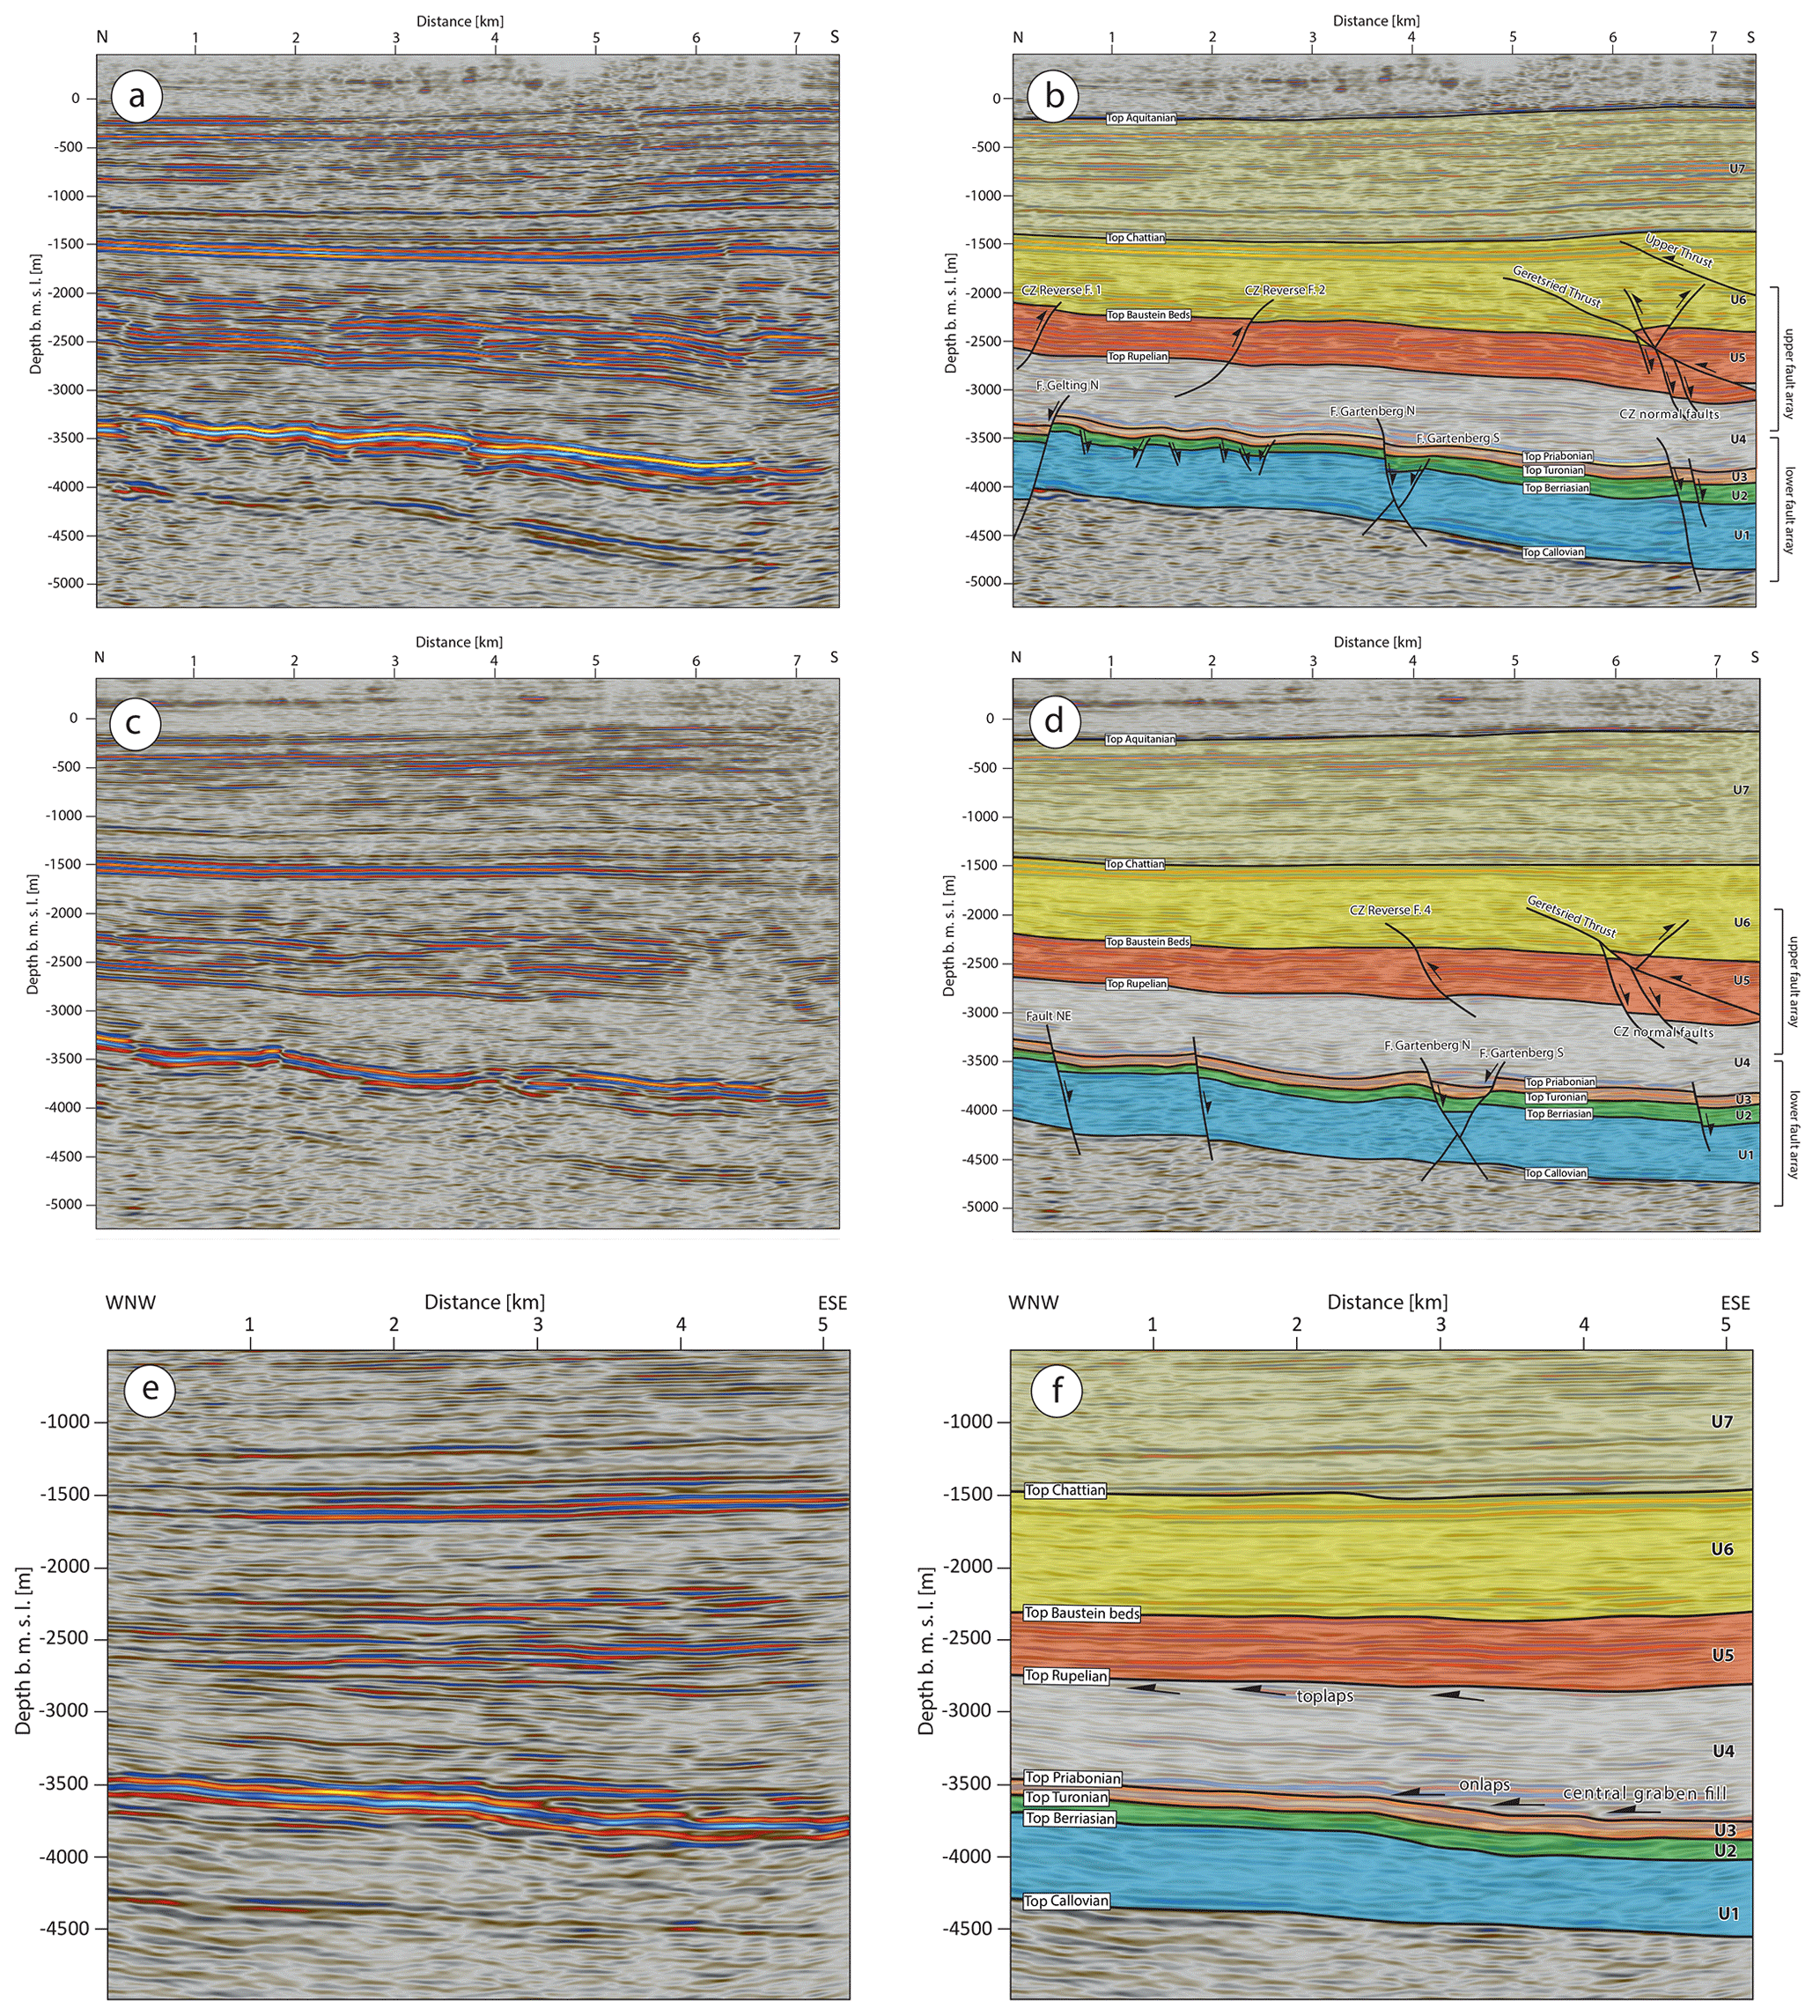
Figure 3(a) N–S-oriented seismic section across the centre of the 3-D survey, where panel (b) shows interpreted seismic-stratigraphic units and faults. (c, d) N–S-oriented seismic section across the eastern margin of the 3-D survey. The faults we refer to in this work are named. (e, f) WNW–ESE-oriented seismic section through the central graben, along its strike. It shows thinning of Unit 1 (carbonate platform), onlapping and toplapping of reflections within Unit 4. See Fig. 6 for location of the sections.
Unit 1 corresponds to the Upper Jurassic carbonate platform that has a heterogeneous, low-frequency seismic expression. Seismic patterns in its lower part are characterised by approximately 150 m thick, relatively continuous, moderate-amplitude reflections, whereas seismic patterns in the middle and upper parts exhibit alternating chaotic to subparallel, low to moderate-amplitude reflectivity. The base of the unit is marked by a low-frequency, locally incoherent reflection interpreted as top Callovian. In contrast, the upper-bounding reflection, top Berriasian, is generally continuous and easy to correlate even when extensively faulted.
Units 2 and 3 constitute a package of continuous, low-frequency, and high-amplitude seismic events that reflect contrasting lithologies. Unit 2 corresponds to mechanically incompetent Cretaceous shales, marls and a thin layer of sandstone, whereas Unit 3 represents competent upper Eocene (Priabonian) sediments – basal sandstone and Lithothamnion limestone (Budach et al., 2017). Unit 2 thickens substantially southwards (from approximately 90 m to approximately 170 m), which is in agreement with the regional northward-oriented truncation of the Cretaceous sediments. In contrast, Unit 3 only slightly thickens to the south.
Low-amplitude, semi-continuous reflections of Unit 4 onlap onto the upper boundary of Unit 3 – top Priabonian. It is the most prominent reflection across the survey, marking an abrupt change from shallow-marine to deep-marine sedimentation during the early Oligocene (Rupelian). It also marks the transition from the competent Unit 3 to an incompetent Unit 4 (Fischer, 1960; Müller, 1970; Budach et al., 2017; von Hartmann et al., 2016). Poor reflectivity of Unit 4 is explained by low impedance contrast within the Rupelian clayey marls. At the top, the unit is marked by toplap terminations below a continuous, moderate-amplitude negative reflection – top Rupelian (Fig. 3e, f). The unit shows a profound thickness increase from approximately 600 m in the north to approximately 800 m in the south.
Unit 5 is characterised by parallel, highly continuous and high-amplitude reflections that correspond to more competent Baustein beds (Budach et al., 2017). Strong impedance contrasts within the unit are attributed to interlayering of sandstones and marls. Unit 5 has a uniform stratigraphic thickness across the survey.
Unit 6 overlies Unit 5 in a concordant manner. While its lowest part has similar reflection characteristics to Unit 5, reflectivity and continuity of seismic events of the middle part decrease upwards. This is due to the increasing marl content, as evidenced by the GEN-1 well (Fig. 2). Thus, mechanical competence of the unit also decreases upwards. The uppermost part of the unit is characterised by continuous, high-amplitude reflections, which are caused by sandstone–marlstone alternations. To the south, the dip direction of bedding changes from southward to northward due to the folding-related deformation. Unit 6 increases in thickness to the south, giving it a wedge-shape geometry.
The seismic response of Unit 7 consists of moderately continuous, low- to moderate-amplitude reflections. The frequency of the seismic events increases upwards within the unit. It corresponds to the Aquitanian sandstone–marlstone series that show no thickness change.
5.2 Structural framework
The 3-D structural model shows that the study area contains two distinct fault arrays that are geometrically (vertically) decoupled and a thrust (Fig. 4). We term these decoupled fault arrays the lower and the upper. In the former, faults do not extent upwards beyond clay-rich Unit 4 (Rupelian), and in the latter, faults terminate downwards within Unit 4 (Fig. 3b, d). The geometry and distribution of the lower faults is depicted on the multi-attribute and depth-structure maps of top Turonian (Fig. 6a, b), while the geometry and distribution of the upper faults is depicted on the multi-attribute and depth-structure maps of top Rupelian (Fig. 6c, d) and top Baustein beds (Fig. 6e, f). The strike direction of the thrust is shown on the multi-attribute and depth-structure maps of top Baustein beds (Fig. 6e, f).
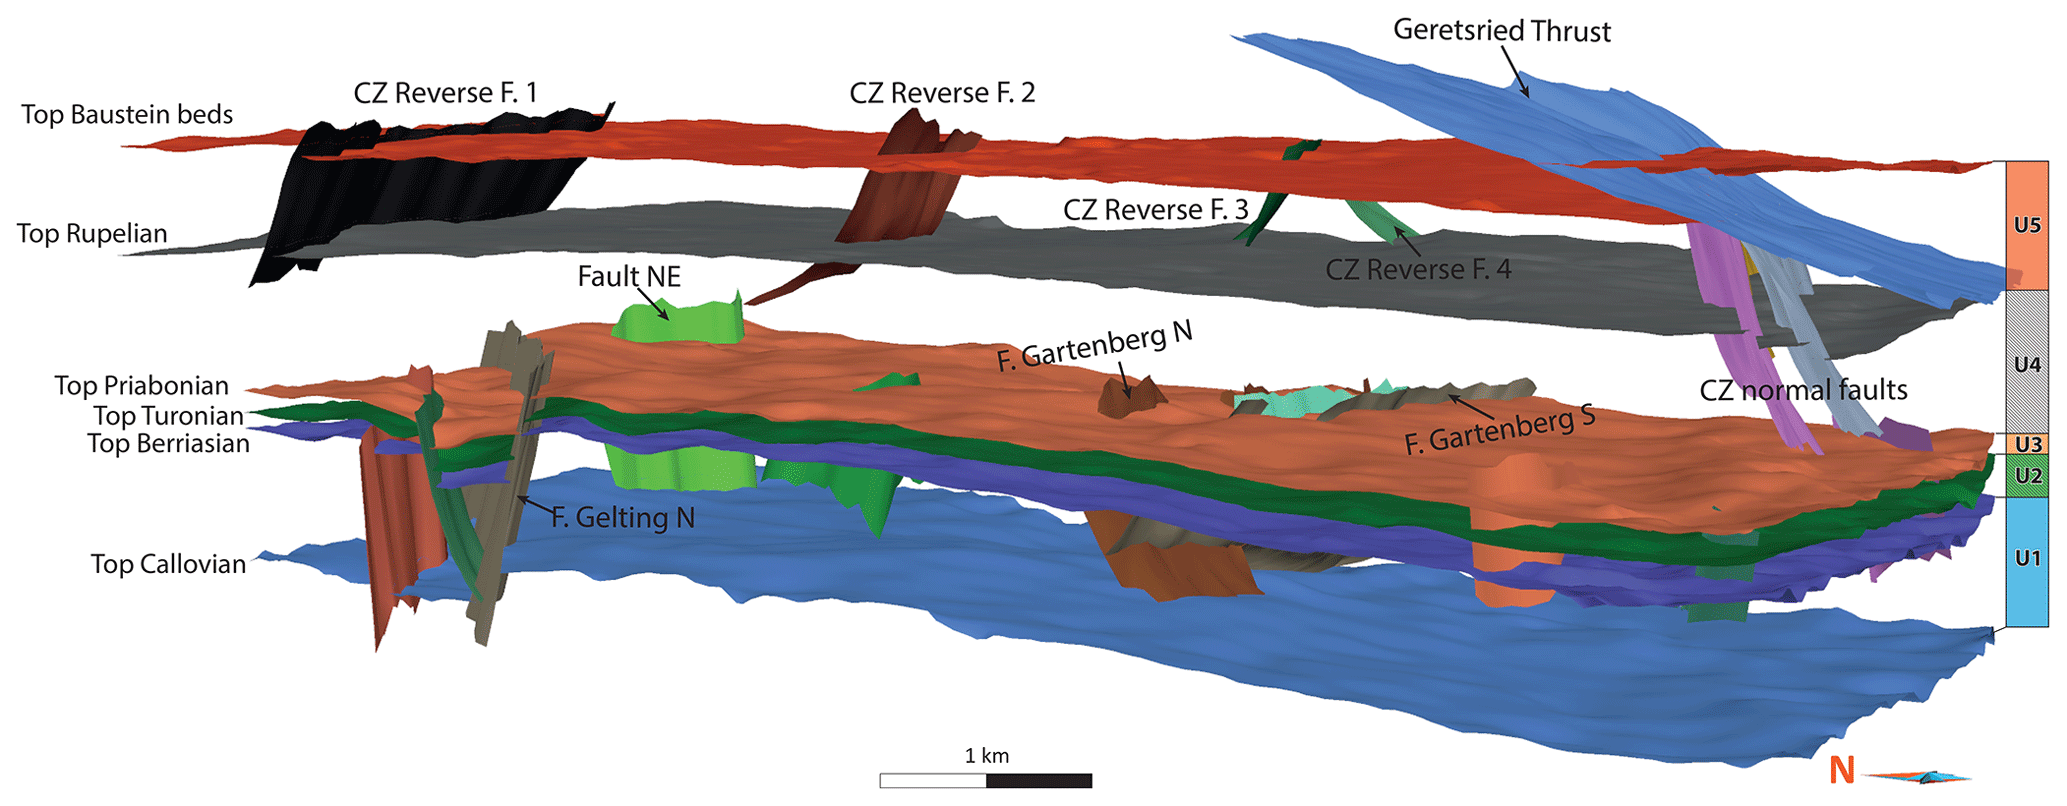
Figure 4Oblique WSW view of the 3-D structural model showing two distinct fault arrays. The faults we refer to in this work are named.
5.2.1 Lower fault array
The lower fault array consists of normal faults that are parallel with respect to the Alpine deformation front, striking WSW–ENE or W–E and dipping towards either the orogen or the foreland (Fig. 6a, b). In cross-section, the majority of the faults appear planar and dip 75 to 85∘, except for the Gartenberg S and Gartenberg N faults that have shallower dip angles of 60 to 65∘ (Fig. 3b, d).
With respect to their vertical extent and the stratigraphy they displace, the lower faults are subdivided, for descriptive purposes, into major and minor faults. The major faults offset crystalline basement and tip out upward into Unit 4 (Rupelian) (e.g. Gelting N, north-eastern (NE) faults), where the Rupelian reflections blanket the fault tips (Figs. 3a–d, 5a). In contrast, the minor faults show no discernible offset of the basement and tip out upward within either Unit 2 (Cretaceous) or lowermost Unit 4 (Rupelian). The tips of the minor faults that do not breach Unit 2 (Cretaceous) are overlain by monoclines (Fig. 3b, d).
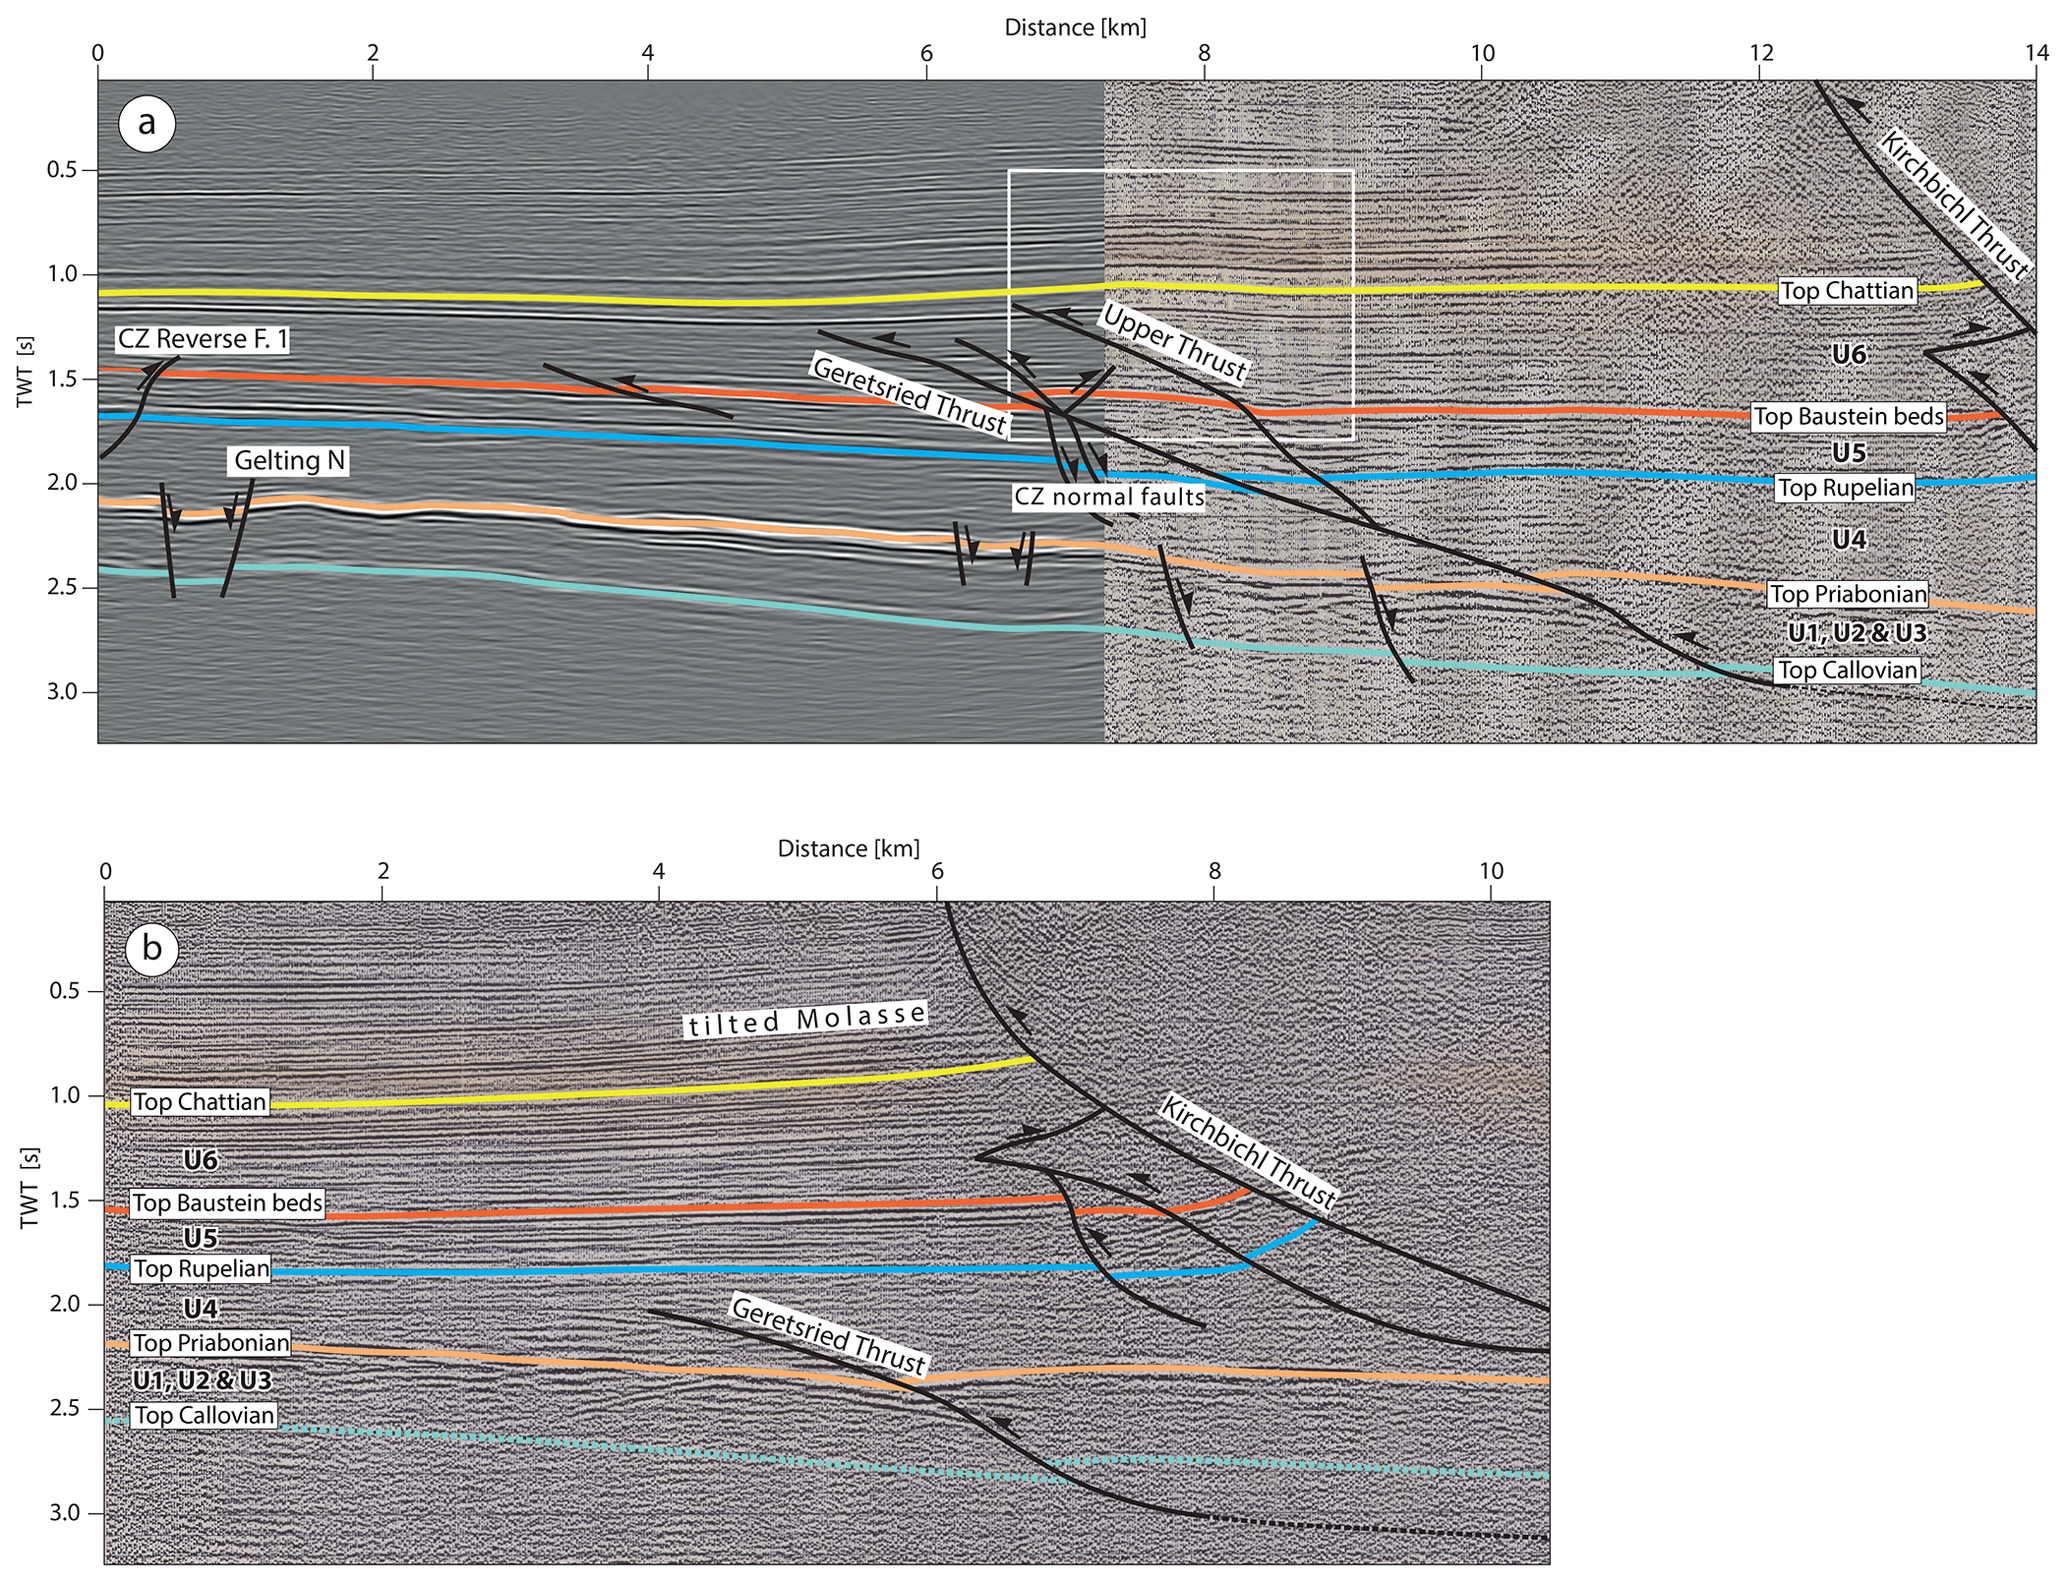
Figure 5(a) N–S-oriented seismic time profile A across the study area to the frontal thrust (i.e. Kirchbichl Thrust) of the Folded Molasse. It was produced by merging a cross-section from the 3-D Geretsried seismic survey (left) and a 2-D seismic line acquired in 1987 (right). The profile shows the extent and the cross-sectional geometry of the two major thrusts. The white box marks thrust-related folding within the hanging-wall of the Geretsried Thrust. For the location of profile A, see Figs. 1b and 6a–c, h. (b) N–S-oriented seismic time profile B approximately 3–5 km south-east of the Geretsried survey area. Note that the zone of tilted Molasse is much broader at this location. For the location of profile B, see Fig. 1b.
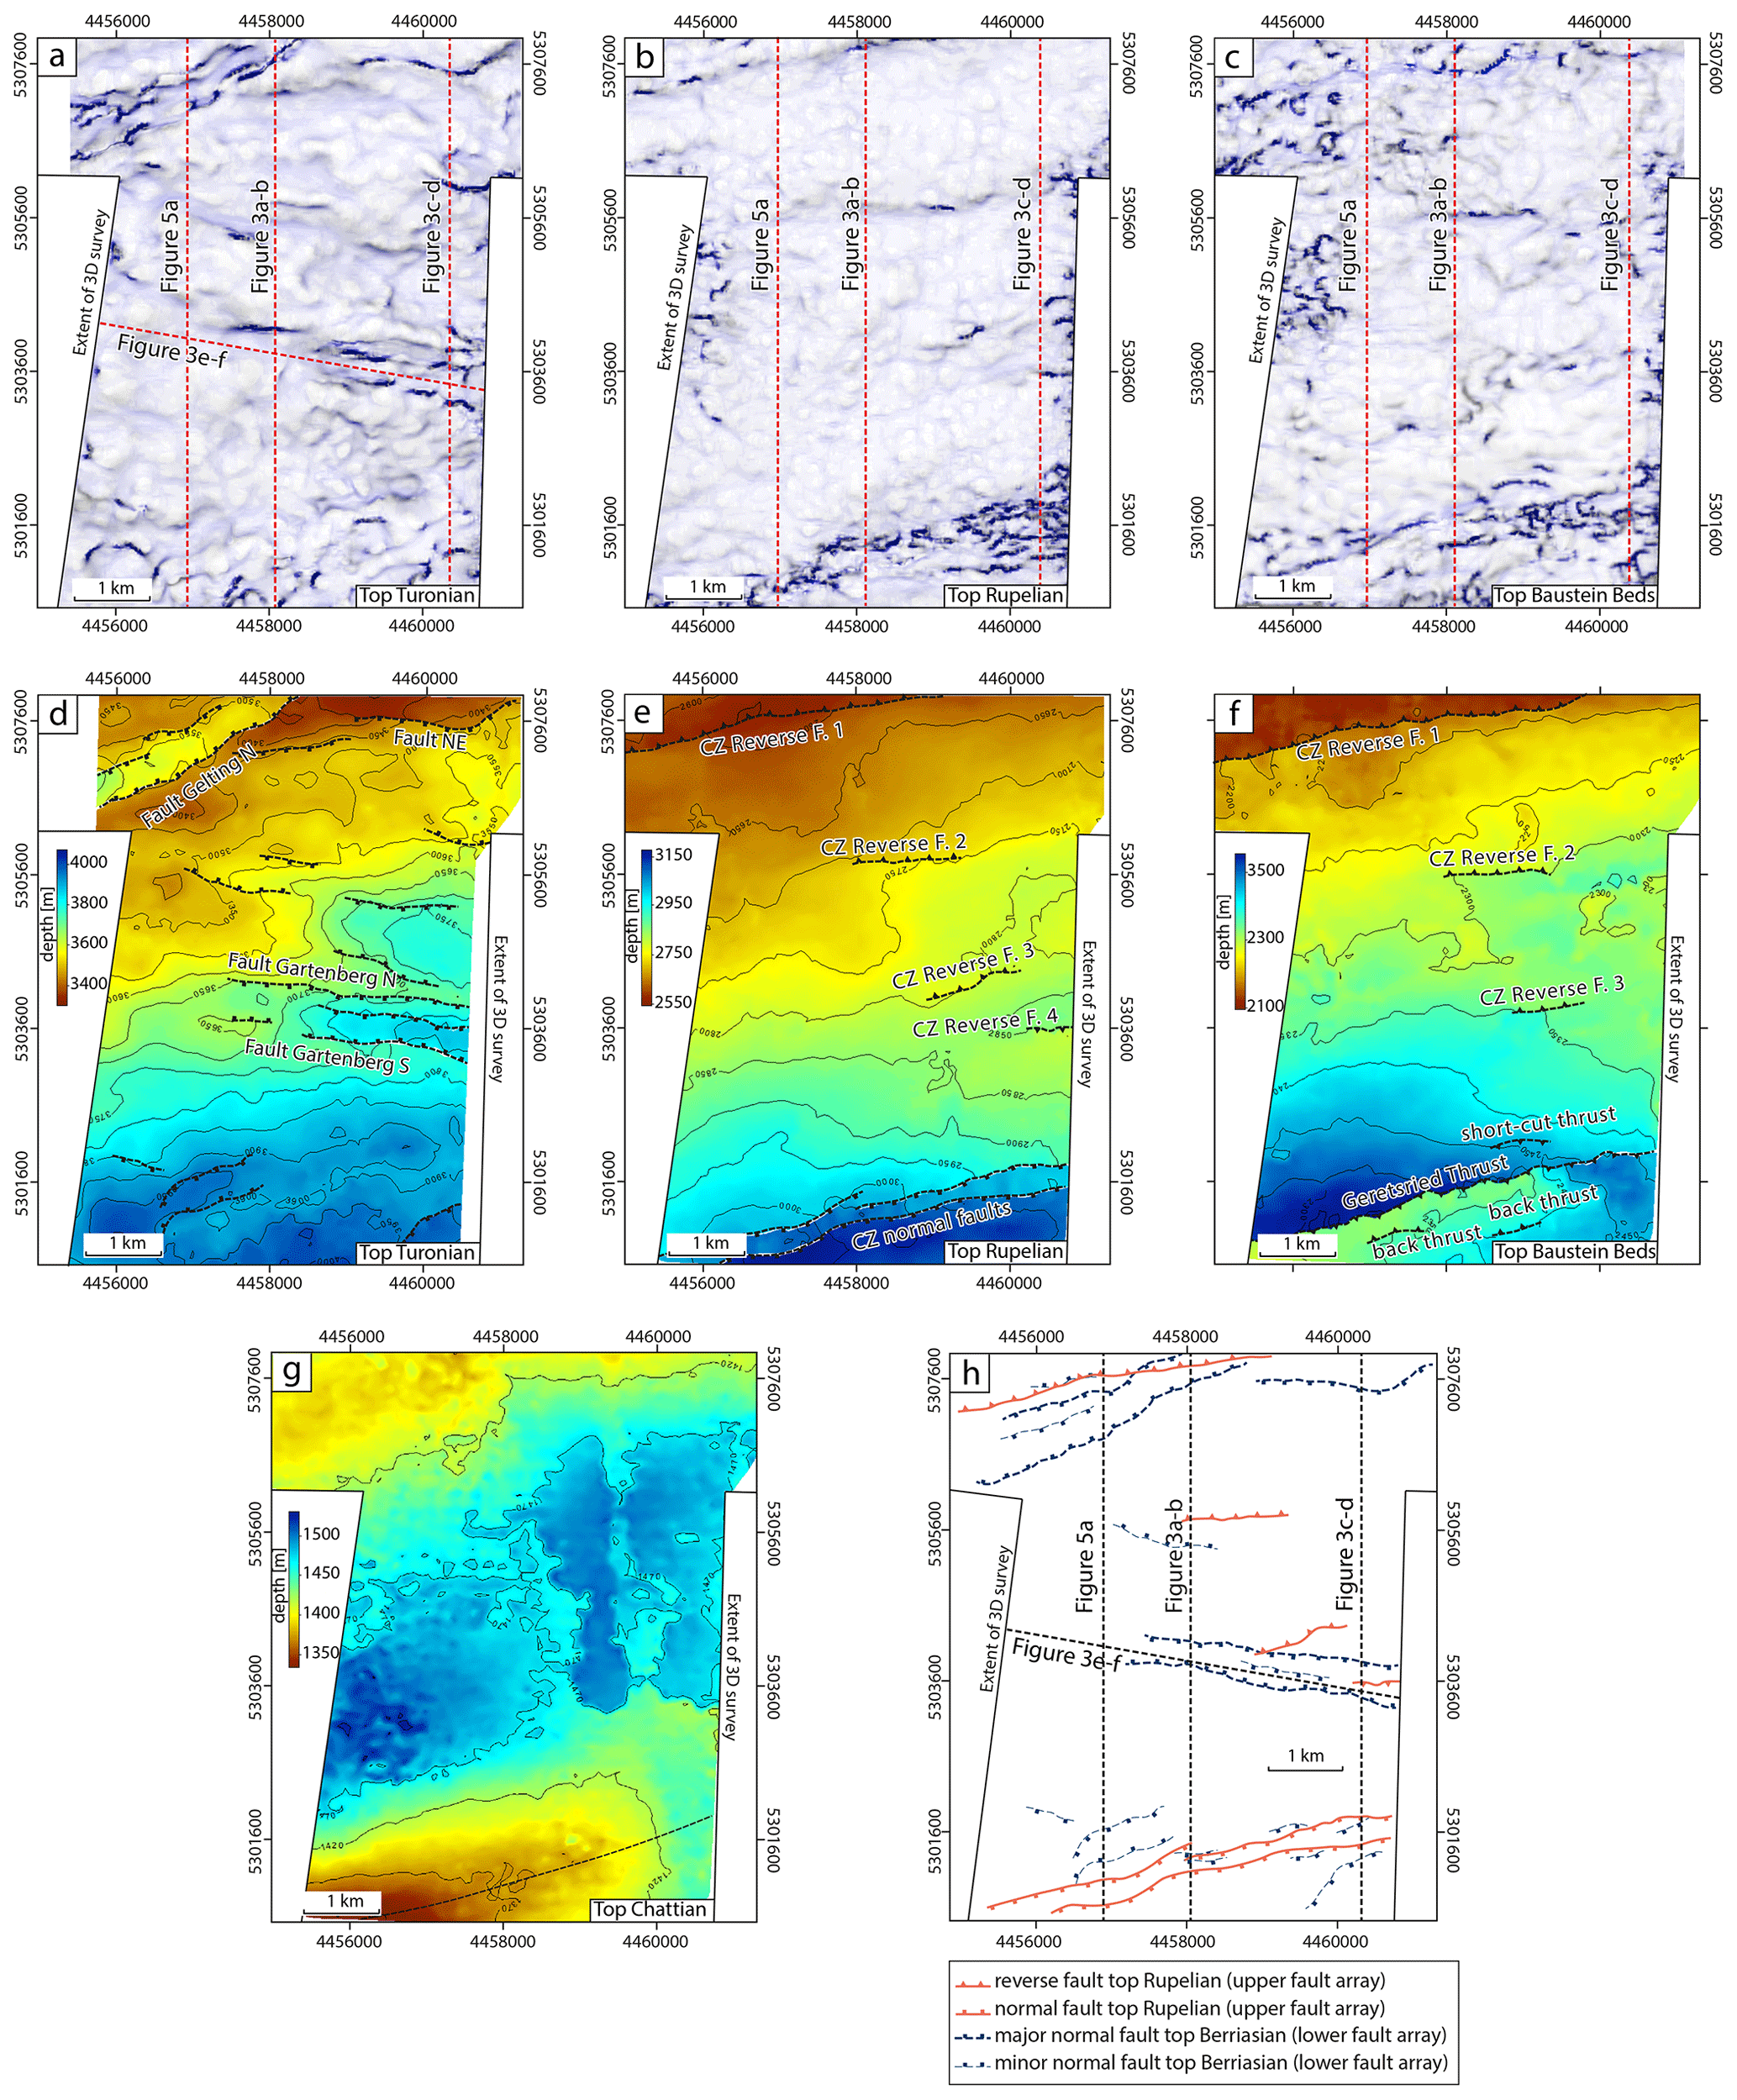
Figure 6Co-rendered variance and most negative curvature multi-attribute maps and depth-structure maps showing (a, d) lower fault array at top Turonian and (b, e) upper fault array at top Rupelian and (c, f) at top Baustein beds. (g) Depth-structure map of top Chattian showing termination of the Geretsried fold to ENE. Dashed line represents the fold hinge. (h) Map of fault traces that were interpreted within the 3-D seismic volume.
Two prominent graben structures in the NW and centre of the study area are defined by major conjugate faults (Fig. 6a, b). The largest displacement across the NW graben is accommodated on the NW-dipping master fault, the Gelting N Fault, with approximately 150 m of throw at top Berriasian. Displacement along the northern flank of this graben is distributed across SE- and S-dipping conjugate faults. In contrast, the central graben switches its polarity along strike from the northern boundary fault, the Gartenberg N Fault, to the southern boundary fault, the Gartenberg S Fault. In the western segment, maximum displacement of approximately 120 m is accrued at top Berriasian on the former fault, whereas in the eastern segment, the largest displacement of approximately 150 m at top Berriasian is accrued on the Gartenberg S Fault. Displacement on the bounding faults of the central graben at top Callovian are difficult to determine. It probably falls below the vertical resolution limit of 55 m at this depth.
5.2.2 Upper fault array
The upper fault array exhibits reverse fault geometry in the central and northern parts of the study area – Cenozoic (CZ) reverse faults 1, 2, 3, and 4 (Figs. 4, 6d, f) and normal fault geometry in the southern part – Cenozoic (CZ) normal faults (Figs. 4, 6d). The upper faults strike approximately in the same direction as the lower faults. In the map view, the traces of the upper faults at top Rupelian show considerable offset from the traces of the lower faults at top Berriasian (Fig. 6h). The lateral extent of the upper faults does not correlate with the lateral extent of the lower faults (Fig. 6h). Like the lower faults, the upper faults have alternating dip directions; they dip either to the S or to the N (Figs. 4, 6d, f). The dip angles of the CZ reverse faults range from 50 to 60∘, whereas the CZ faults showing normal fault geometry dip more steeply – 65 to 70∘.
The upper faults offset the mechanically competent Unit 5 (Baustein beds) and die out upwards in Unit 6 (Chattian) and extend downwards into Unit 4 (Rupelian) (Fig. 3a–d), where the observation of internal deformation is hindered by the semi-transparent reflections. The CZ reverse faults have low throw magnitudes that do not exceed 50 m at both top Rupelian and top Baustein beds. In contrast, the CZ faults with normal fault geometry reach maximum throw values at top Rupelian that are twice those of the reverse faults (approximately 100 m; Fig. 6d).
5.2.3 Thrust faults
The normal faults of the upper fault array are overprinted by the extensive Geretsried Thrust that dips 20 to 35∘ to the S and has two branches. Its upper branch dips parallel to the lower thrust within Unit 6 (Chattian) (Fig. 5a). Both thrust faults terminate with ramps within Unit 6 (Chattian) – no upper detachment is observed.
To understand the evolution of the thrust faults that dominate the deformation pattern of the Cenozoic sequence in the southern part of the study area, we investigated their geometries, up to the Kirchbichl Thrust, the frontal thrust of the Folded Molasse. Seismic profiles A and B (Fig. 5a and b, respectively) depict the southward continuation of the Geretsried Thrust. In the western profile (profile A), the Geretsried Thrust seems to be connected to a basal décollement below the carbonate platform, approximately 4 km south of the study area. It truncates both the Mesozoic and Cenozoic units over a distance of approximately 7 km, dying out in the upper part of Unit 6 (Chattian). An upper thrust branches from the main Geretsried Thrust within Unit 4 (Rupelian), with a steeper dip (approximately 45∘) within Unit 5 (Baustein beds). The flat-ramp geometry of the Geretsried Thrust creates a distinct NNW-verging hanging-wall anticline – the Geretsried fold. Where the Geretsried Thrust cuts through the linkage zone, i.e. relay ramp, between the two CZ normal faults, the core of the Geretsried fold is deformed by two back-thrusts and a shallow-dipping reverse fault that accommodate shortening of Units 5 and 6 (Fig. 3a–d). Here, the thrust dips steeper (approximately 35∘) and the fold core exhibits typical asymmetry, with a narrower forelimb and a broader, shallow-dipping backlimb. In the eastern profile (profile B), the Geretsried Thrust likewise truncates the carbonate platform but terminates already within Unit 4 (Rupelian). There is no thrust-related folding above the Geretsried Thrust beyond Unit 4.
The profiles A and B also illustrate the overall tectonic style at the northern edge of the Alpine orogen, which is dominated by a simple overthrust (the Kirchbichl Thrust). A notable feature that distinguishes the two profiles from each other is the geometry of the upper Cenozoic reflections, close to the Kirchbichl Thrust; in profile A, the reflections are subhorizontal, whereas in profile B they are tilted to the N, showing increasing dip towards the Kirchbichl Thrust.
5.3 Structural analysis of selected faults
To infer the syn-depositional activity of the interpreted faults, we analysed thickness variations of the seismic-stratigraphic units using isochore maps (Fig. 7). Unit 1 (Upper Jurassic) displays substantial thinning within the central graben (Figs. 3e–f and 7a). Such thickness reduction could be the result of sequential slip of the conjugate Gartenberg S and Gartenberg N faults that crosscut within Unit 1 and offset each other (Fig. 3b, d) (e.g. Ferrill et al., 2000, 2009; Budach et al., 2017). Unit 1 also shows slight thinning of hanging-wall blocks of minor faults that do not reach into the basement. Isochore map in Fig. 7b shows no consistent thickening of Unit 2 (Cretaceous) across all major faults. There are however local thickness variations in form of footwall thinning and hanging-wall thickening across the Gartenberg S Fault, eastern segment of the Gartenberg N and NE faults, and the central segment of the Gelting N Fault. In the south, local depocentres are observed in Unit 2 that are not related to fault activity. Unit 3 (Priabonian) thickens only across the Gartenberg N Fault (Fig. 7c). In contrast to the underlying units, the Rupelian clayey marl of Unit 4 (Rupelian) clearly exhibit a syn-kinematic nature, particularly where faults emerge from the carbonate platform (Fig. 7d). This is especially evident within the central and the NE grabens, where the Rupelian strata is thicker than to the north or south of the graben-bounding faults. Furthermore, we observe onlapping of the Rupelian reflections onto the top Priabonian reflection in the easternmost margin of the graben (Fig. 3e, f). In the southern part, there is a profound thickness decrease of Unit 4 associated with downthrow of the hanging-wall blocks of the upper CZ normal faults affecting the overlying Unit 5 (Baustein beds) (Fig. 7d). Unit 5 displays no thickness variations across upper faults, except in the south-east, where it is thickened by displacement on the Geretsried Upper Thrust (Fig. 7e). Although Unit 6 (Chattian) in Fig. 7f continuously thickens towards the S, it thins within the hanging-wall anticline (i.e. the Geretsried fold).
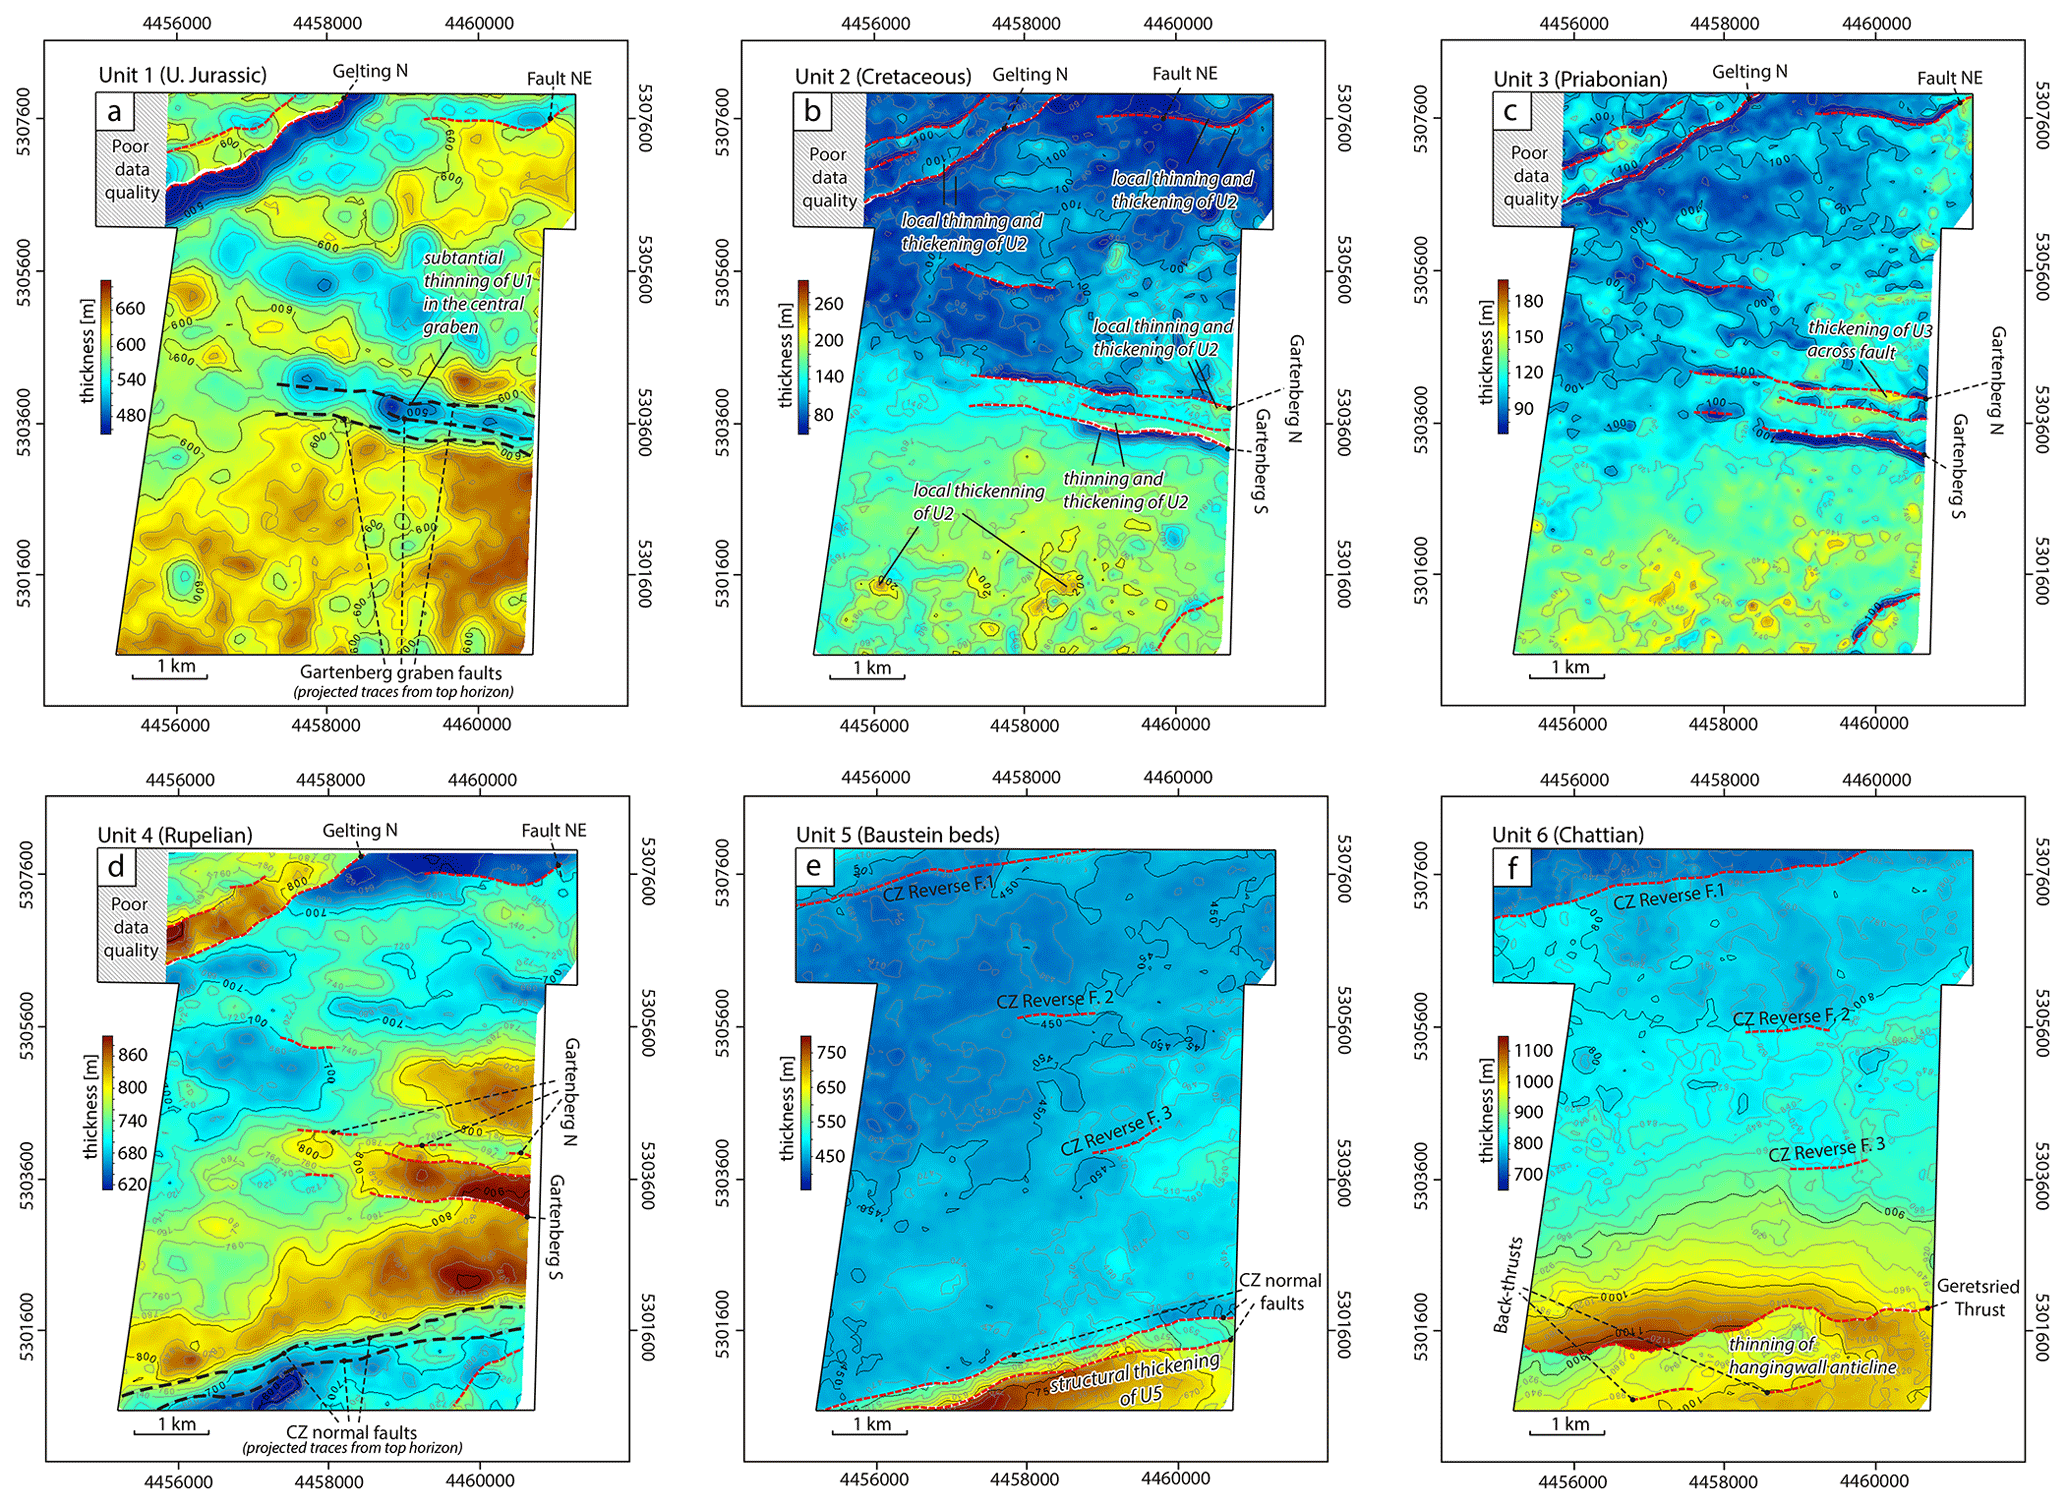
Figure 7Isochore maps of the five stratigraphic units depicting sediment thickness changes and syn-kinematic growth strata. (a) Unit 1 (carbonate platform; Oxfordian to early Berriasian); (b) Unit 2 (Valanginian–Hauterivian marl, Gaultian sandstone, Turonian marl; Valanginian to Turonian); (c) Unit 3 (basal sandstone, Lithothamnion limestone; Priabonian); (d) Unit 4 (Rupelian clayey marls; Rupelian); Unit 5 (Baustein beds; late Rupelian–early Chattian); (f) Unit 6 (Chattian sandstones; Chattian). Note that the thickness minima on the footwall of the faults on thickness maps of Units 2 and 3 are not stratigraphic in origin but are computational artefacts associated with the fault gap on top surface. See text for discussion.
Figure 8 depicts Allan maps and throw-depth diagrams of NE, Gartenberg S, and Gelting N faults, respectively, that are used to specify the temporal evolution of the lower faults. The NE Fault is fully imaged by the seismic data. This allows us to document the geometry of its tip lines at the lateral terminations. The tip lines converge up- and down-dip from top Berriasian and must eventually meet within Unit 4 and the basement, correspondingly (Fig. 8a). The largest throw is located at top Berriasian (approximately 100 m, as shown in profile 3), from which it decreases both up- and downwards (Fig. 8a). The upward decrease of throw is gradual in profiles 1 and 2, whereas in profiles 3 and 4, throw minima are observed (Fig. 8a). These correspond to the local thinning and thickening of Unit 2 at the eastern segment of the fault plane (Fig. 7b). The Gartenberg S Fault has no detectable throw at top Callovian, so only three cut-off polygons are available for the throw analysis (Fig. 8b). Similar to NE Fault, the lateral extent of the Gartenberg S Fault decreases up-dip, and the fault throw is the largest at top Berriasian. All throw minima are located at top Turonian on t–z profiles (Fig. 8b). For the Gelting N Fault, it is more difficult to establish a distinct trend of throw distribution (Fig. 8c). This could be due to the overall poorer image quality at the fault region, which introduces uncertainty in cut-off picking, especially at top Callovian. Generally, the throw on the Gelting N Fault is distributed equally from top Callovian to top Priabonian, with a minor throw reduction at top Turonian (Fig. 8c). As shown in the t–z plot (Fig. 8c), the throw values vary mostly only by approximately 25 m.
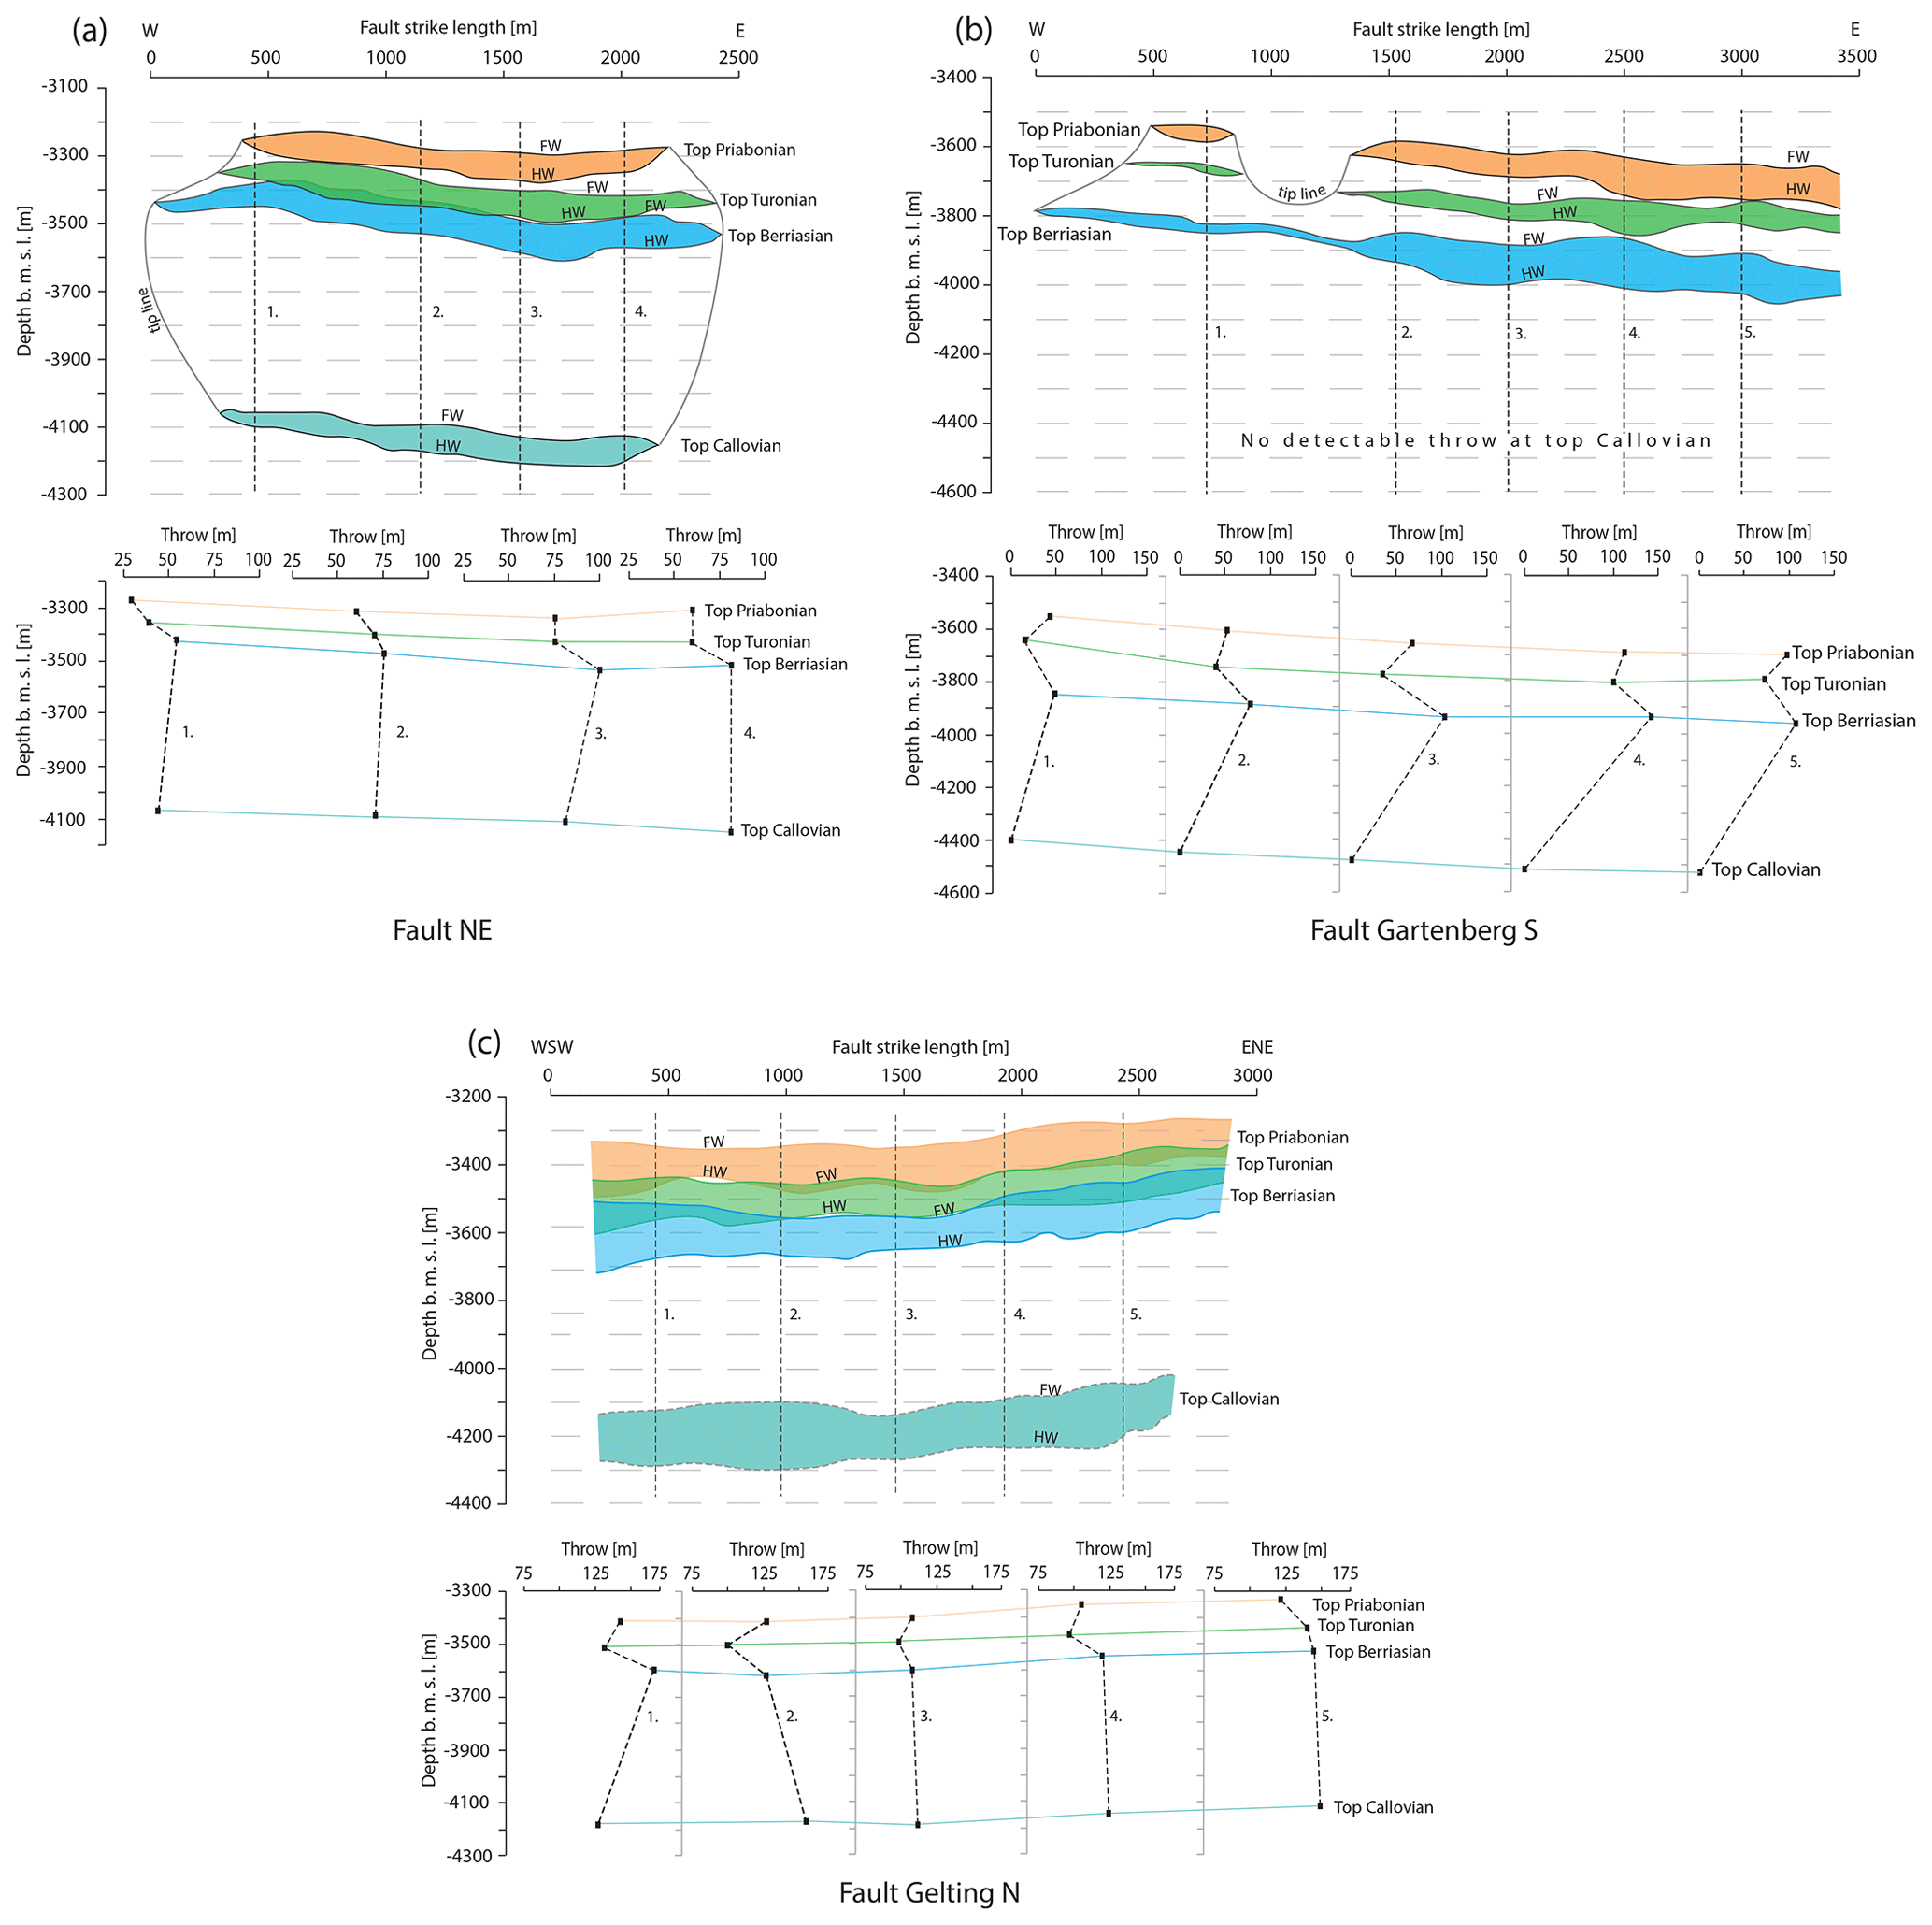
Figure 8Allan maps and t–z plots for the (a) NE, (b) Gartenberg S, and (c) Gelting N faults. Footwall and hanging-wall cut-offs are abbreviated as FW and HW, respectively. (a) NE Fault: the throw decreases from top Berriasian stratigraphically upwards and downwards. The cut-offs of the horizons form a near-elliptical shape. (b) Gartenberg S Fault: the cut-off polygons show upward bifurcation of the Gartenberg S Fault. Note throw reduction at top Turonian. (c) Gelting N Fault: the throw distribution shows no significant throw variations along the displaced horizons.
An Allan map of the Geretsried Thrust depicts the distribution of its throw at top Baustein beds (Fig. 9). The thrust rapidly loses throw to the east: from approximately 250 m in the westernmost extent of the survey area to the negative throw values of approximately 50 m in the easternmost extent. The negative throw values are presumably the result of the residual slip on the pre-existing CZ normal faults that were not completely reversed. Similarly, the upper branch of the Geretsried Thrust dies out to the east within the study area. The loss of displacement on the thrust faults is reflected by the eastward termination of the Geretsried fold (Fig. 6g). Due to poor resolution of the uppermost part of the seismic volume recognition of growth strata above the Geretsried fold is not possible.

Figure 9Alan map of the Geretsried Thrust at top Baustein beds (red for “positive” throw and blue for “negative” throw) and of the underlying normal faults at top Rupelian (grey). Note substantial decrease of throw on the Geretsried Lower Thrust to the E. See text for discussion. Footwall and hanging-wall cut-offs are abbreviated FW and HW, respectively.
The deformation pattern in our study area is characterised by two geometrically decoupled fault arrays, with both normal and reverse sense of slip, and the through-going Geretsried Thrust. Such a deformation pattern documents three distinct phases of faulting activity, which indicates a palaeostress change during the evolution of the foreland basin. In this section, we interpret our observations on reflection configuration, fault throw distribution, stratal thickness variations, and spatial relationships between faults to describe the temporal and spatial evolution of the faults in the Geretsried area. Furthermore, we discuss the governing factors on the evolution of the fault network that defined the present-day deformation pattern, such as evolving stress states, pre-existing deformation structures, and mechanical stratigraphy.
6.1 Temporal and spatial evolution of the fault network
Structural analysis suggests that the investigated fault network evolved in three phases: (1) normal faulting in the early Oligocene (Rupelian), (2) normal faulting in the late Oligocene (Chattian), and (3) reverse and thrust faulting in the mid-Miocene.
The first faulting phase occurred in the early Oligocene (Rupelian) and resulted in the formation of the lower fault array. Two lines of stratigraphic evidence provide time constraints for the activity of the lower fault array; (1) substantial thickening of the syn-orogenic Rupelian strata across faults (Fig. 7d), and (2) onlap and discordant patterns of the Rupelian reflections within the hanging-wall blocks (e.g. Fig. 3e, f). Faulting activity ceased before the sedimentation of Rupelian was complete, as the fault tips are covered by the Rupelian reflections and there is no apparent offset at top Rupelian (Figs. 3a–d and 5a). These findings are in accordance with the works of Bachmann and Müller (1991) and Sissingh (1997), who report late Eocene to early Oligocene syn-sedimentary faulting in the southern part of the GMB, based on the interpretation of regional seismic profiles.
The upper faults with reverse sense of slip most probably formed as normal faults, as suggested by their strike (i.e. WSW–ENE strike) and steep dips. The absence of geometrical coupling between the lower and upper faults and their overall distinct geometries (e.g. varying lengths, considerable fault trace offset, opposite dip directions) indicate that the latter faults developed independently from the former faults, in the shallower Cenozoic level. We infer that they developed during the second faulting phase in the late Oligocene (Chattian). The evidence, such as (1) limited thickness variations across faults in the Baustein strata (Fig. 7d), and (2) termination of the fault tips within the Chattian strata (Fig. 3a–d), shows that the upper faults initiated after the deposition of the Baustein beds (Unit 5) and were syn-sedimentary during deposition of the Chattian sandstones (Unit 6).
The third faulting phase is signified by the reverse reactivation of the upper normal faults, development of the Geretsried Thrust, and thrust-related folding in the mid-Miocene times. Due to the resolution limit in the upper part of the 3-D seismic cube, it was impossible to recognise growth strata above the Geretsried fold that could provide age constraints for the contractional deformation. However, we hypothesise that the Geretsried Thrust was contemporaneous with the frontal thrusts of the Folded Molasse, because it is rooted below the Folded Molasse and is thus kinematically related to the frontal thrusts. The documented age of the growth strata within the tilted footwall of the Kirchbichl Thrust indicates that the contractional deformation started in the late middle Miocene (Serravallian) (Unger, 1989; Ortner et al., 2015).
6.2 Stress field evolution
The temporal and spatial evolution of the deformation structures in the Geretsried area was primarily controlled by the evolving stress states in the foreland foredeep. Each of the identified faulting phases marks changes in the stress field at the study area related to the northward propagation of the Alpine orogen.
The longitudinal strike of the lower and upper faults, with respect to the Alpine orogenic front, implies that they formed due to the flexure-induced deformation on the foredeep slope. It has been recognised that during foreland flexuring, the upper part of the bending plate experiences extension, the lower part – compression, and a central horizon is neutral (Turcotte and Schubert, 1999; Price and Cosgrove, 1990). Within the region of maximum flexure (i.e. foreland forebulge), elastic bending facilitates an extensional stress field with an effective minimum stress oriented perpendicular to the trend of the foredeep (Bradley and Kidd, 1991; Bachmann and Müller, 1992; Londoño and Lorenzo, 2004; Langhi et al., 2011). As the syn-orogenic load within the foredeep increases towards the orogen, the subvertical maximum principle stress increases as well. Consequently, normal faults form in a basinward position with respect to the region of maximum flexure, striking parallel to the foredeep axis (Tavani et al., 2015).
The first faulting phase initiated in the early Oligocene (early Rupelian), as evidenced from the seismic data. At this time, the GMB was characterised by a limited sediment supply (Zweigel et al., 1998). Hence, we imply that the magnitude of the subvertical stress was low as the lower fault array formed. Presumably, the lower normal faults occurred in the distal foredeep, close to the region of maximum flexure, where the magnitude of the horizontal compression was still small enough for the differential stress to cause normal faulting. As the Alpine orogen moved forward, the magnitude of the horizontal stress component increased, resulting in termination of normal faulting in the late Rupelian.
The second faulting phase occurred in the late Oligocene (Chattian). Zweigel et al. (1998) document a drastic increase of sedimentation rates at this time due to the increase in the topographic relief in the Alpine orogen. A rapid thickening of the sedimentary load must have resulted in an increase of the vertical stress that eventually exceeded horizontal compression, resulting in renewed normal faulting. The existence of a subvertical maximum stress in the late Oligocene–early Miocene is also implied from the build-up of overpressure in the Rupelian sequence that is related to high sedimentation rates during this time (Müller et al., 1988; Müller and Nieberding, 1996; Drews et al., 2018). The evidence for overpressure in the Rupelian is derived from the pore pressure estimates on the basis of seismic and sonic velocities, as well as drilling mud weights.
While the increase of the vertical component of the stress field triggered activation of the upper normal faults, the vertical gradient of the horizontal component, oriented perpendicular to the trend of the foredeep, must have governed the position of fault initiation. Due to the ongoing flexuring in the Chattian, the horizontal stress magnitude within the foredeep is expected to be smaller at shallower stratigraphic levels and conversely larger at deeper stratigraphic levels. The numerical model of stress in the Molasse Basin by von Hartmann et al. (2016) confirms the existence of the vertical stress gradients within the basin fill during the Cenozoic flexure. We therefore explain the independent development of the upper fault array in the shallower Cenozoic by lower magnitudes of the horizontal stress component that existed at this interval and acted perpendicular to the planes of the longitudinal faults. The horizontal stress component must have been the least principal stress for the normal faulting to initiate.
Reverse reactivation of the upper normal faults, thrusting and folding deformation during the third faulting phase point to a stress regime, in which the magnitude of the horizontal stress component, oriented parallel to the shortening direction, exceeded the magnitude of the vertical stress component. Such stress field configuration must have been established in the mid-Miocene as the Alpine thrust wedge approached the study area. The N–S directed shortening was first accommodated by the reverse reactivation of the longitudinal upper normal faults due to their inherited low cohesion and favourable orientation, and then eventually by the development of new thrusts.
6.3 Pre-existing structures
Inherited deformation structures have been recognised to influence structural style, i.e. kinematic and geometrical interaction between faults in the foreland settings (e.g. Butler, 1989; Tavarnelli and Peacock, 1999; Scisciani et al., 2001; Bry et al., 2004; Calamita et al., 2012; Tavani et al., 2015). In this subsection, we attempt to shed light on the following two questions:
-
Did any of the lower faults develop from inherited pre-orogenic faults?
-
What is the kinematic relationship between the Geretsried Thrust and directly underlying faults with normal fault geometries?
6.3.1 Pre-orogenic inheritance: did any of the lower faults develop from inherited pre-orogenic faults?
Pre-orogenic normal faults that are oriented subparallel to the developing fold-and-thrust belt are the favourable structures to be extensionally reactivated during foreland flexuring (Butler, 1989; Bry et al., 2004; Tavani et al., 2015, 2018). In the Swiss Molasse Basin, the basement structures are interpreted to act as the loci of the flexure-induced normal faulting (Jon Mosar, personal communication, 2018). In the GMB, Budach et al. (2017) and Mraz et al. (2018) report reactivation of the Mesozoic normal faults during the Cenozoic flexuring. Based on our structural evidence, we discuss in this section whether in this study the analysed faults of the lower fault array had a pre-orogenic origin.
The results of throw distribution on the lower faults show three major trends from top Berriasian down to top Callovian (i.e. near top basement): (i) throw diminishes (Fault NE; Fig. 8a), (ii) throw decreases nearly to zero (Gartenberg S and Gartenberg N faults; Figs. 3a–d and 8b), and (iii) throw remains constant (Gelting N Fault; Fig. 8c). The former two cases suggest that the faults propagated into the basement from the shallower stratigraphic unit. The near-elliptical tip lines of the NE and Gartenberg S faults imply an initially elliptical slip distribution on these faults (Barnett et al., 1987). Such slip distribution is characteristic of blind fault growth by radial propagation, whereby the site of fault nucleation typically corresponds to the region of maximum displacement (Watterson, 1986; Barnett et al., 1987; Walsh and Watterson, 1987; Baudon and Cartwright, 2008a, b). The throw distribution on the NE, Gartenberg S, and Gartenberg N faults shows that the maximum displacement could occur between top Callovian and top Berriasian, suggesting that these faults nucleated within the carbonate platform and were not rooted in the basement. The Gelting N Fault is the only fault in our study area that could have originated within the pre-fractured basement, since it shows no decrease in displacement with depth, down to top Callovian.
A substantial upward decrease in fault throw from top Berriasian to top Turonian, as is observed in the study area on the NE (Fig. 8a) and Gartenberg S faults (Fig. 8b), has been also reported 25 km to the NNE and 55 km to the W, in the Unterhaching and Mauerstetten geothermal sites, respectively (Budach et al., 2017; Mraz et al., 2018). Such high displacement gradients can indicate either (1) fault interaction with the free surface, i.e. syn-sedimentary activity, if the displacement gradient increase coincides with the stratigraphic expansion of the displaced units across faults or (2) propagation across a mechanical barrier, if there is no stratigraphic expansion (Baudon and Cartwright, 2008a). The former case is confirmed in the Unterhaching and Mauerstetten areas, where it is inferred that the faults were syn-sedimentary in the Mesozoic. In contrast, in the Geretsried area, we do not observe stratigraphic expansion of the Mesozoic units across the analysed faults. The local thickening of Unit 2 in the hanging-wall is accompanied by thinning in the footwall. This indicates ductile deformation within Unit 2 in response to fault propagation. Based on this evidence, we rule out the possibility that the identified faults originated in the Mesozoic and accommodated further extension in the Cenozoic.
6.3.2 Early orogenic inheritance: what is the kinematic relationship between the Geretsried Thrust and directly underlying faults with normal fault geometries?
Early orogenic inheritance plays a significant role in the spatial evolution of the contractional deformation. A characteristic geometrical relationship between the Geretsried Thrust and the directly underlying normal faults suggests a possible kinematic interaction between them in the past. Such overprinting relationships between flexure-induced normal faults and later developed contractional structures have been recognised in foreland basins at the toe of the orogenic wedges elsewhere (e.g. Scisciani et al., 2001; Bry et al., 2004; Calamita et al., 2012). In the GMB, approximately 25 km east of our study area, Müller (1975/1976) interpreted a frontal thrust structure with a similar geometry to the Geretsried Thrust that also truncates an early orogenic normal fault. The fact that the Geretsried Thrust dies out rapidly to the east suggests that the thrust interpreted by Müller (1975/1976) must have formed separately from the Geretsried Thrust.
According to Tavani et al. (2015), thrust fault nucleation and propagation may occur even in a strike-slip faulting stress regime, facilitated by the reverse reactivation of pre-existing normal faults that strike perpendicular to the shortening direction. These authors argue that the strain at the tips of positively inverted faults or in the overstep areas between them produces a local contractional stress field and causes re-orientation of the maximum principal stress axis until it reaches a favourable angle with the bedding, eventually resulting in slip. Such a local perturbation of the stress field at the tips of the inverted faults may favour nucleation and propagation of an about 30∘ dipping, new fault segment that further develops into a thrust fault. It is likely that the Geretsried Thrust developed according to this scenario. An approximately 30–35∘ dipping thrust ramp must have initiated in the step-over area between the CZ normal faults, as they were undergoing reverse reactivation, and from there propagated both upwards and downwards. It eventually reached beneath the Upper Jurassic carbonate platform and connected to a basal décollement beneath it. The prominent Geretsried fold above the thrust ramp most probably developed due to the buttressing of the thrust displacements against the pre-existing normal faults (e.g. Butler, 1989; Scisciani et al., 2001).
The early orogenic inheritance could have locally influenced the style of deformation in the transition zone between the Foreland Molasse and the Folded Molasse. Our interpretation of profiles A and B (Fig. 5a and b, respectively) confirms already existing interpretations, which characterise the Folded Molasse front in the study area by a simple overthrust without a major triangle zone at depth (e.g. Schwerd and Thomas, 2003; Thomas et al., 2006; Ortner et al., 2015). Despite the absence of a large triangle zone, which, as has been documented, controls the width of the tilted Molasse (e.g. Müller et al., 1988), the upper Cenozoic reflections are tilted in profile B. Such a reflection pattern must represent true tilting of the beds and is unlikely to be an imaging artefact, i.e. velocity pull-up, as in such a case similar tilting would be also observed in profile A. Presumably, the area increase between the tilted upper beds and the subhorizontal lower beds in profile B was produced by a diffuse, i.e. distributed, subseismic strain. In contrast, in profile A, no subseismic deformation of such a scale took place, as the tilted Molasse is absent. The northern limit of the tilted Molasse on the tectonic map of the Folded Molasse by Ortner et al. (2015) within the study area is in fact the northern extent of the Geretsried fold (Fig. 1b). We postulate that in the study area the shortening was primarily accommodated by the Geretsried Thrust, which prevented large subseismic strain in front of the thrusts of the Folded Molasse. To the east, in the absence of inherited extensional structures and therefore thrust faulting, the shortening was accommodated by distributed subseismic deformation and consequent amplification of the tilted zone in front of the Kirchbichl Thrust.
6.4 Mechanical stratigraphy
The fault growth in the southern GMB is influenced by the different mechanical behaviour of rock layers. We show in this subsection that mechanically incompetent layers within the Meso-Cenozoic sequence act as fault propagation barriers, resulting in variations in fault plane geometries, development of extensional forced folding and decoupling of the lower and upper fault arrays.
6.4.1 Growth of the lower faults
As we postulated in the previous subsection, the majority of the lower faults nucleated in the carbonate platform and grew by radial propagation. The down-dip propagation of individual faults could have been affected by the mechanical behaviour of the Dogger shales/marls (below top Callovian). For instance, substantial decrease in fault throw on faults Gartenberg N and Gartenberg S could indicate that at this boundary faults intersect a less competent layer that accommodates deformation by distributed deformation. Up-dip propagation was restricted by the Turonian layer of Unit 2. We postulate that the aforementioned high displacement gradient for the NE and Gartenberg S faults (Fig. 8a, b) resulted from the additional slip that accumulated at the mechanical boundary for the faults to propagate through the barrier (e.g. Wilkins and Gross, 2002; Baudon and Cartwright, 2008a).
Two features point to a restricting behaviour of the Turonian marls: (1) extensional forced folding above tips of normal faults and (2) the staircase geometry of the Gartenberg S Fault. Mechanically incompetent layers accommodate pre-failure strain by distributed ductile deformation, which causes extensional forced folding and thinning of the incompetent layer at the footwall (Walsh and Watterson, 1987; Withjack et al., 1990; Childs et al., 1996; Withjack and Callaway, 2000; Schöpfer et al., 2006; Ferrill et al., 2012). In our study area, this kind of deformation is especially evident above the minor lower faults (Fig. 3a–d). Here, unbreached monoclines indicate that fault propagation was arrested by the clay-rich Turonian layer, hindering the faults' interaction with the free surface. Hanging-walls of the major lower faults that managed to propagate across the Turonian barrier locally exhibit normal drag, which presumably formed as precursory monoclines were breached (Fig. 3c, d). Extensional forced folding is also confirmed by local thinning and thickening of the Turonian clayey marls across the faults (Fig. 7b).
The staircase geometry of the Gartenberg S Fault (Fig. 3c, d) indicates fault growth by vertical segment linkage in the presence of a mechanical barrier (Childs et al., 1996; Walsh et al., 2003; Schöpfer et al., 2006). According to the coherent fault model by Walsh et al. (2003) and discrete element models of Schöpfer et al. (2006), kinematically connected fault segments first initiate in strong layers, whereas weak layers deform by ductile flow. Increasing strain results in shear failure of the weak layers and eventual linkage of the fault segments. The resulting through-going fault thus attains a staircase geometry. The shallower dip of the Gartenberg S Fault within the Turonian marls corresponds to the throw minimum at top Turonian that separates two throw maxima at top Berriasian and top Priabonian (Fig. 8b). We propose that ductile deformation of the Turonian clayey marls promoted vertical fault segmentation of the Gartenberg S Fault, whereby an upper fault segment formed in the more competent Unit 3 (Priabonian) and linked downwards with the lower segment of Gartenberg S within Unit 2 (Cretaceous).
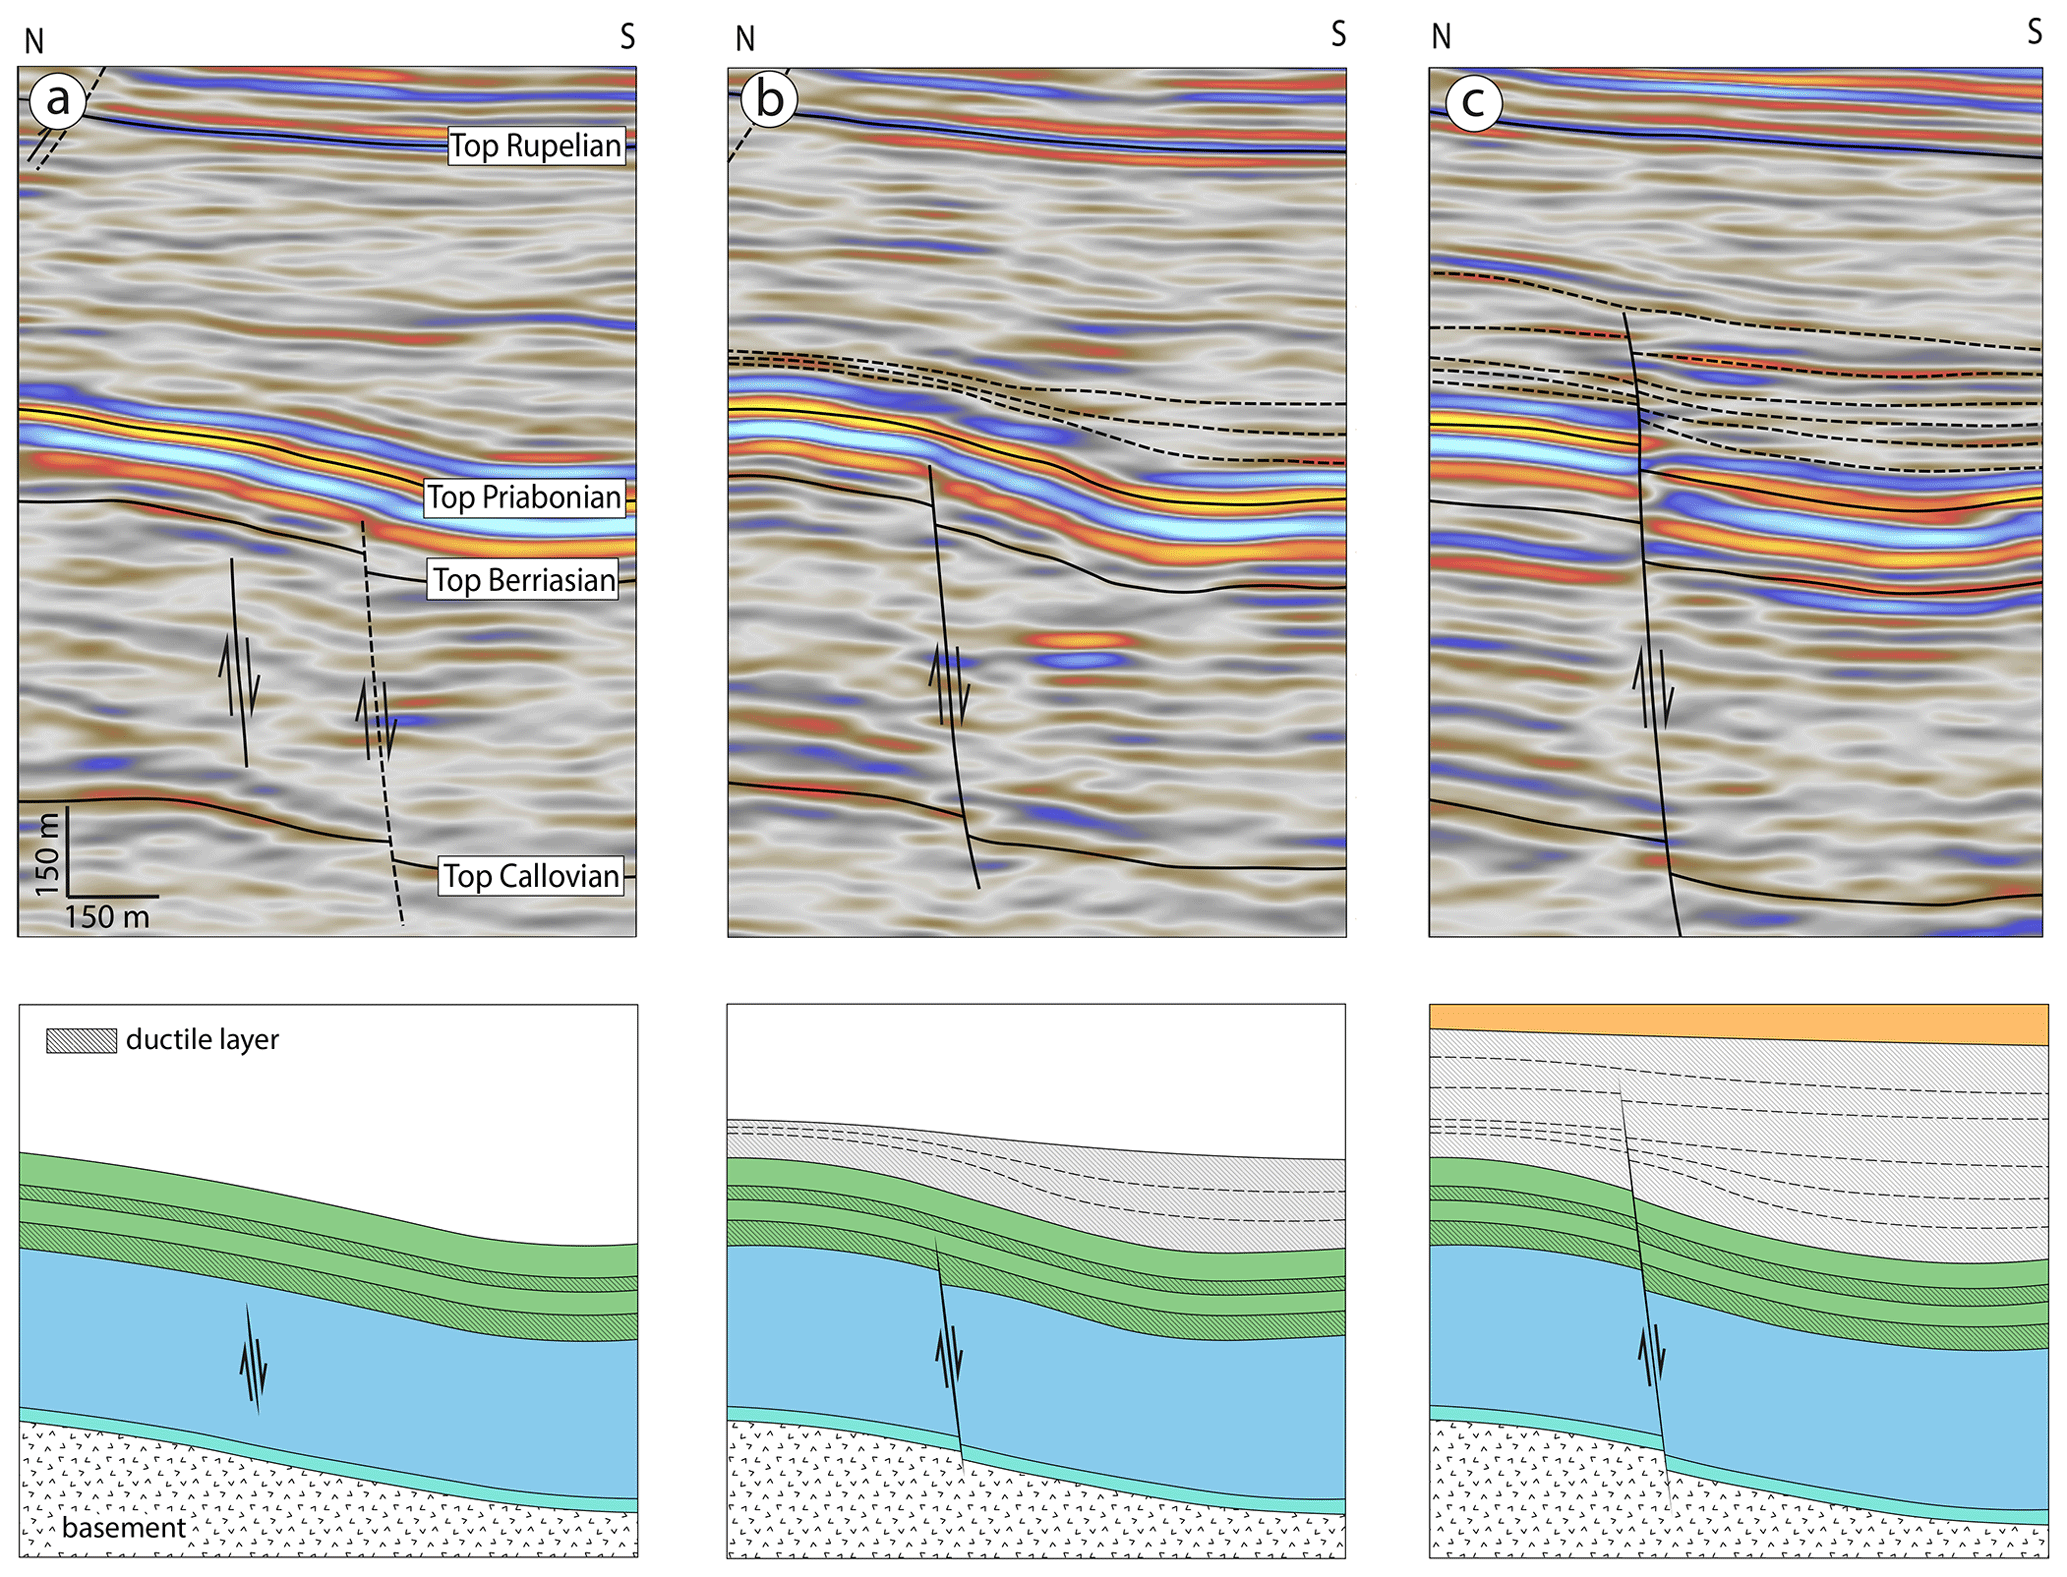
Figure 10Stages of lower fault evolution based on the example of NE Fault: (a) nucleation of the NE Fault within the carbonate platform; (b) up-dip propagation of the fault inhibited by multi-layered stratigraphy. Overlying units are forced to flex; (c) eventually, the fault breaches the monocline. The stagnant fault tip is buried by the later Rupelian sediments.
Having considered the impact of mechanical stratigraphy, we propose the following growth history of the lower faults, which is illustrated in Fig. 10:
-
Lower normal faults initiated within the carbonate platform and possibly, in the case of the Gelting N Fault, in the basement.
-
The faults propagated radially from the point of nucleation as blind faults. The up-dip propagation was inhibited by the Turonian marls, resulting in monoclinal folding of the overlying layers. Minor faults were arrested by the mechanical barrier, whereas major faults continued to propagate across it, in individual cases, by vertical segment linkage.
-
As fault slip continued, major faults breached the monoclines above them and reached the free surface during sedimentation of the Rupelian clayey marl, thereby switching from being blind to emergent. Eventually, faulting ceased and the stagnant fault tips were buried by the later Rupelian sediments.
6.4.2 Decoupled evolution of the fault network
As we have put forward in the previous subsection on stress field evolution, the stress conditions in the Chattian were favourable for the independent development of the upper faults in the Cenozoic interval. Faults are expected to nucleate first in the most competent unit of the multi-layered Cenozoic sequence, since the less competent units are able to accommodate greater pre-failure strain (Eisenstadt and De Paor, 1987; Ferrill et al., 2017). The fault geometries suggest that the upper faults nucleated indeed within the competent Baustein beds, and grew by both up- and downward propagation. Such isolated fault growth within the Cenozoic Molasse is also reported approximately 35 km E of our study area by von Hartmann et al. (2016), where the authors observe decrease in throw from central to outermost portions of the Cenozoic faults, both up- and down-dip.
As the upper faults propagated downward into the incompetent Unit 4 (Rupelian), they failed to connect with the lower faults by incidental dip linkage (e.g. Baudon and Cartwright, 2008c; Langhi et al., 2011). They flattened out within the Rupelian sediments, which are expected to have a lower angle of internal friction and contain detachment horizons (Müller et al., 1988; Ortner et al., 2015). Although the observation of fault geometry within the Rupelian sequence is limited by its semi-transparent and non-coherent reflection configuration, the listric nature of the CZ normal faults can be inferred from the thinning of Unit 4 (Rupelian) across these faults (Fig. 7d).
At the same time, it is unlikely that the lower faults accommodated Chattian deformation by reactivation and upward propagation. We do not observe monoclinal folding within the mechanically weak Rupelian strata that would have developed if the lower faults had propagated across it (Schöpfer et al., 2006). We postulate that the upward propagation of the lower faults was inhibited due to the mechanical behaviour of the Rupelian clayey marls that acted as a propagation barrier. In the latter case, the extensional strain could be accommodated by ductile, i.e. distributed, subseismic deformation within the Rupelian Unit 4. We conclude that the fault evolution in the presence of a thick mechanical barrier resulted in a decoupled structural style, as has been previously reported for the geometrically decoupled fault systems by Ferrill et al. (2007), Langhi et al. (2011), Lewis et al. (2013), and Deckers (2015).
We used 3-D seismic data from the Geretsried area to analyse the structure and evolution of the fault network proximal to the European Alpine front. Structural analysis reveals that the fault network developed in three syn-orogenic deformation phases: (i) lower normal faulting in the early Oligocene, (ii) upper normal faulting in the late Oligocene, and (iii) reverse and thrust faulting in the mid-Miocene. We demonstrate that these temporal phases correlate with the evolution of the stress field as the Alpine orogen moved forward. While the tectonic stresses are responsible for fault initiation, local stress “modifiers”, such as pre-existing structures and mechanical stratigraphy, govern the location of fault nucleation and its further spatial development.
A key observation of this study is that the lower and upper fault arrays developed independently, both temporally and spatially, with nucleation loci in the Upper Jurassic carbonate platform for the former fault array and in the Baustein beds for the latter. Vertical gradients of the flexural stresses pre-defined decoupled initiation of the upper faults with respect to the lower faults, whereas the mechanically incompetent Rupelian clayey marls inhibited further geometrical connection of the two fault arrays. The decoupled style of fault evolution has implications for geothermal exploration in the GMB, since we expect the isolated lower faults to develop less interconnected fractures and be more prone to healing by secondary mineralisation than through-going faults with a prolonged activity, which are observed elsewhere in the basin. In this respect, further investigations are required to establish correlation between the decoupled faulting style and the mechanical behaviour of the Rupelian clayey marls.
Furthermore, we document kinematic interaction between the upper normal faults and frontal thrusts. In particular, we postulate that the reactivation of CZ normal faults facilitated the initiation of the Geretsried Thrust, thereby preventing accumulation of distributed subseismic strain at the front of the Folded Molasse. We therefore emphasise the importance of the early orogenic structures on the style of contractional deformation in the transition zone between the foreland and the Folded Molasse.
The seismic data are not publicly accessible. The results of the seismic model are presented in the article. Detailed results can be provided by the first author on request.
VS designed the study, carried out the seismic interpretation and 3-D structural modelling, wrote the manuscript, and prepared the figures. DCT participated in analysing the structural results and in the writing of the manuscript. HvH contributed in interpreting the seismic data and drafting the manuscript. IM initiated the study. All authors commented, read, and approved the final manuscript.
The authors declare that they have no conflict of interest.
We thank Enex Power Germany GmbH and Wintershall Dea GmbH for access to seismic and well data and permission to publish images from these data. Seismic data acquisition and processing were carried out by DMT GmbH. We also thank Stefano Tavani and Hugo Ortner for their thorough reviews, which helped to improve this article. Jonas Kley, Jennifer Ziesch, Sonja Wadas, and Tom Schintgen are thanked for their useful comments on the manuscript.
This research has been supported as part of the project “Play Type” by the German Ministry for Economic Affairs and Energy (grant no. 0324210A).
This paper was edited by Virginia Toy and reviewed by Stefano Tavani and Hugo Ortner.
Agemar, T., Alten, J., Ganz, B., Kuder, J., Kühne, K., Schumacher, S., and Schulz, R.: The geothermal information system for Germany – GeotIS, Z. Dtsch. Ges. Geowiss., 165, 129–144, https://doi.org/10.1127/1860-1804/2014/0060, 2014. a
Allan, U. S.: Model for hydrocarbon migration and entrapment within faulted structures, AAPG Bull., 73, 803–811, https://doi.org/10.1306/44B4A271-170A-11D7-8645000102C1865D, 1989. a
Allen, P. A., Crampton, S. L., and Sinclair, H. D.: The inception and early evolution of the North Alpine Foreland Basin, Switzerland, Basin Res., 3, 143–163, https://doi.org/10.1111/j.1365-2117.1991.tb00124.x, 1991. a, b, c
Bachmann, G. H. and Müller, M.: The Molasse Basin, Germany: evolution of a classic petroliferous foreland basin, in: Generation, Accumulation and Production of Europe's Hydrocarbons, edited by: Spencer, A. M., Spec. Publ. Eur. Assoc. Petrol. Geoscien, No. 1, 263–276, Springer-Verlag, Berlin, 1991. a, b
Bachmann, G. H. and Müller, M.: Sedimentary and structural evolution of the German Molasse Basin, Eclogae Geol. Helv., 85, 519–530, 1992. a, b, c, d, e
Bachmann, G. H., Dohr, G., and Müller, M.: Exploration in a classic thrust belt and its foreland, Bavarian Alps, Germany, AAPG Bull., 66, 2529–2542, https://doi.org/10.1306/03B5AC69-16D1-11D7-8645000102C1865D, 1982. a, b, c, d, e
Bachmann, G. H., Müller, M., and Weggen, K.: Evolution of the Molasse Basin (Germany, Switzerland), Tectonophysics, 137, 77–92, https://doi.org/10.1016/0040-1951(87)90315-5, 1987. a, b, c
Barnett, J. A. M., Mortimer, J., Rippon, J. H., Walsh, J. J., and Watterson, J.: Displacement geometry in the volume containing a single normal fault, AAPG Bull., 71, 925–937, https://doi.org/10.1306/948878ED-1704-11D7-8645000102C1865D, 1987. a, b
Baudon, C. and Cartwright, J. A.: 3D seismic characterisation of an array of blind normal faults in the Levant Basin, Eastern Mediterranean, J. Struct. Geol., 30, 746–760, https://doi.org/10.1016/j.jsg.2007.12.008, 2008a. a, b, c, d
Baudon, C. and Cartwright, J. A.: Early stage evolution of growth faults: 3D seismic insights from the Levant Basin, Eastern Mediterranean, J. Struct. Geol., 30, 888–898, https://doi.org/10.1016/j.jsg.2008.02.019, 2008b. a, b
Baudon, C. and Cartwright, J. A.: The kinematics of reactivation of normal faults using high resolution throw mapping, J. Struct. Geol., 30, 1072–1084, https://doi.org/10.1016/j.jsg.2008.04.008, 2008c. a, b
Bradley, D. C. and Kidd, W. S. F.: Flexural extension of the upper continental crust in collisional foredeeps, Bull. Geol. Soc. Am., 103, 1416–1438, https://doi.org/10.1130/0016-7606(1991)103<1416:FEOTUC>2.3.CO;2, 1991. a
Bry, M., White, N., Singh, S., England, R., and Trowell, C.: Anatomy and formation of oblique continental collision: South Falkland basin, Tectonics, 23, TC4011, https://doi.org/10.1029/2002TC001482, 2004. a, b, c
Budach, I., Moeck, I., Lüschen, E., and Wolfgramm, M.: Temporal evolution of fault systems in the Upper Jurassic of the Central German Molasse Basin: case study Unterhaching, Int. J. Earth Sci. (Geol. Rundsch.), 107, 635–654, https://doi.org/10.1007/s00531-017-1518-1, 2017. a, b, c, d, e, f, g, h, i
Butler, R. W. H.: The influence of pre-existing basin structure on thrust system evolution in the Western Alps, Geol. Soc. Lond. Spec. Publ., 44, 105–122, https://doi.org/10.1144/GSL.SP.1989.044.01.07, 1989. a, b, c
Cartwright, J. A., Bouroullec, R., James, D., and Johnson, H. D.: Polycyclic motion history of some Gulf Coast growth faults from high-resolution displacement analysis, Geology, 26, 819–822, https://doi.org/10.1130/0091-7613(1998)026<0819:PMHOSG>2.3.CO;2, 1998. a
Calamita, F., Pace, P., and Satolli, S.: Coexistence of fault-propagation and fault-bend folding in curve-shaped foreland fold-and-thrust belts: Examples from the Northern Apennines (Italy), Terra Nova, 24, 396–406, https://doi.org/10.1111/j.1365-3121.2012.01079.x, 2012. a, b
Childs, C., Nicol, A., Walsh, J. J., and Watterson, J.: Growth of vertically segmented normal faults, J. Struct. Geol., 18, 1389–1397, https://doi.org/10.1016/S0191-8141(96)00060-0, 1996. a, b
DeCelles, P. G. and Giles, K. A.: Foreland basin systems, Basin Res., 8, 105–123, https://doi.org/10.1046/j.1365-2117.1996.01491.x, 1996. a
Deckers, J.: Decoupled extensional faulting and forced folding in the southern part of the Roer Valley Graben, Belgium, J. Struct. Geol., 81, 125–134, https://doi.org/10.1016/j.jsg.2015.08.007, 2015. a
Diem, B.: Die Untere Meeresmolasse zwischen Saane (Westschweiz) und der Ammer (Oberbayern), Eclogae Geol. Helv., 79, 493–559, 1986. a
Drews, M. C., Bauer, W., Caracciolo, L., and Stollhofen H.: Disequilibrium compaction overpressure in shales of the Bavarian Foreland Molasse Basin: Results and geographical distribution from velocity-based analyses, Mar. Petrol. Geol., 24, 37–50, https://doi.org/10.1016/j.marpetgeo.2018.02.017, 2018. a
Eisenstadt, E. and De Paor, D. G.: Alternative model of thrust-fault propagation, Geology, 15, 630–633, https://doi.org/10.1130/0091-7613(1987)15<630:AMOTP>2.0.CO;2, 1987. a
Freudenberger, W. and Schwerd, K.: Erläuterungen zur geologischen Karte von Bayern 1 : 500 000, Bayerisches Geologisches Landesamt, München, 329 pp., 1996. a, b
Ferrill, D. A., Morris, A. P., Stamatakos, J. A., and Sims, D.: Crossing conjugate normal faults, AAPG Bull., 84, 1543–1559, https://doi.org/10.1306/8626BEF7-173B-11D7-8645000102C1865D, 2000. a
Ferrill, D. A., Morris, A. P., and Smart, K. J.: Stratigraphic control on Extensional fault propagation folding: Big Brushy Canyon monocline, Sierra del Carmen, Texas, Geol. Soc. Lond. Spec. Pub., 292, 203–217, https://doi.org/10.1144/SP292.12, 2007. a
Ferrill, D. A., Morris, A. P., and McGinnis, R. N.: Crossing conjugate normal faults in field exposures and seismic data, AAPG Bull., 93, 1471–1488, https://doi.org/10.1306/06250909039, 2009. a
Ferrill, D. A., Morris, A. P., and McGinnis, R. N.: Extensional fault-propagation folding in mechanically layered rocks: The case against the frictional drag mechanism, Tectonophysics, 576–577, 78–85, https://doi.org/10.1016/j.tecto.2012.05.023, 2012. a
Ferrill, D. A., Morris, A. P., McGinnis, R. N., Smart, K. J., Wigginton, S. S., and Hill, N. J.: Mechanical stratigraphy and normal faulting, J. Struct. Geol., 94, 275–302, https://doi.org/10.1016/j.jsg.2016.11.010, 2017. a, b, c
Fischer, W.: Stratigraphische und tektonische Beobachtungen im Gebiet der Mumauer Mulde und Steineberg Mulde (Oberbayern, Allgäu und Vorarlberg), Bull. Ver. Schweiz. Petrol.-Geol. U.-Ing., 27, 39–57, 1960. a, b, c
Frisch, W.: Tectonic progradation and plate tectonic evolution of the Alps, Tectonophysics, 69, 121–139, https://doi.org/10.1016/0040-1951(79)90155-0, 1979. a, b
GeoMol Team: GeoMol – Assessing subsurface potentials of the Alpine Foreland Basins for sustainable planning and use of natural resources, Project Report, LfU, Augsburg, 188 pp., 2005. a
Jackson, C. A.-L. and Larsen, E.: Temporal and spatial development of a gravity-driven normal fault array: Middle–Upper Jurassic, South Viking Graben, northern North Sea, J. Struct. Geol., 31, 388–402, https://doi.org/10.1016/j.jsg.2009.01.007, 2009. a
Kley, J. and Voigt, T.: Late Cretaceous intraplate thrusting in central Europe: Effect of Africa-Iberia-Europe convergence, not Alpine collision, Geology, 36, 839–842, https://doi.org/10.1130/G24930A.1, 2015. a
Kuhlemann, J. and Kempf, O.: Post-Eocene evolution of the North Alpine Foreland Basin and its response Alpine tectonics, Sediment. Geol., 152, 45–78, https://doi.org/10.1016/S0037-0738(01)00285-8, 2002. a, b, c
Langhi, L., Ciftci, N. B., and Borel, G. D.: Impact of lithospheric flexure on the evolution of shallow faults in the Timor foreland system, Mar. Geol., 284, 40–54, https://doi.org/10.1016/j.margeo.2011.03.007, 2011. a, b, c
Lemcke, K.: Zur nachpermischen Geschichte des nördlichen Alpenvorlandes, Geologica Bavarica, 69, 5–48, 1973. a, b
Lemcke, K.: Das heutige geologische Bild des deutschen Alpenvorlandes nach drei Jahrzehntehn Öl- und Gasexploration, Eclogae Geol. Helv., 74, 1–18, https://doi.org/10.5169/seals-165086, 1981. a
Lemcke, K.: Geologie von Bayern, Bd. 1, Das bayerische Alpenvorland vor der Eiszeit, E. Schweizerbart'sche Verlagsbuchhandlung, Stuttgart, 1988. a, b, c, d, e
Lewis, M. M., Jackson, C. A. L., and Gawthorpe, R. L.: Salt-influenced normal fault growth and forced folding: the Stavanger fault system, North Sea, J. Struct. Geol., 54, 156–173, https://doi.org/10.1016/j.jsg.2013.07.015, 2013. a
Londoño, J. and Lorenzo, J. M.: Geodynamics of continental plate collision during late tertiary foreland basin evolution in the Timor Sea: constraints from foreland sequences, elastic flexure and normal faulting, Tectonophysics, 392, 37–54, https://doi.org/10.1016/j.tecto.2004.04.007, 2004. a
Lüschen, E., Borrini, D., Gebrande, H., Lammerer, B., Millahn, K., Neubauer, F., and Nicolich, R.: TRANSALP – deep crustal Vibroseis and explosive seismic profiling in the Eastern Alps, Tectonophysics, 414, 9–38, https://doi.org/10.1016/j.tecto.2005.10.014, 2006. a
Lüschen, E., Dussel, M., Thomas, R., and Schulz, R.: 3D seismic survey for geothermal exploration at Unterhaching, Munich, Germany, First Break, 29, 45–54, https://doi.org/10.3997/1365-2397.2011002, 2011. a
Mallet, J.-L.: Geomodeling. Applied Geostatistics Series, Oxford University Press, New York, USA, 612 pp., 2002. a
Marfurt, K. J.: Chapter 2, Seismic Attributes and What They Measure, in: Distinguished Instructor Series: Seismic Attributes as the Framework for Data Integration Throughout the Oilfield Life Cycle, SEG Books, 25–150, https://doi.org/10.1190/1.9781560803522.ch2, Society of Exploration Geophysicists (SEG), Tulsa, 2018. a
Meyer, R. K. F. and Schmidt-Kaler, H.: Paläogeographischer Atlas des Süddeutschen Oberjura (Malm), E. Schweizerbart'sche Verlagsbuchhandlung, Stuttgart, 1990. a
Moeck, I.: Catalog of geothermal play types based on geologic controls, Renew. Sust. Energ. Rev., 37, 867–882, https://doi.org/10.1016/j.rser.2014.05.032, 2014. a
Mraz, E., Moeck, I., Bissman, S., and Hild, S.: Multiphase fossil normal faults as geothermal exploration targets in the Western Bavarian Molasse Basin: Case study Mauerstetten, Z. Dt. Ges. Geowiss., 169, 389–411, https://doi.org/10.1127/zdgg/2018/0166, 2018. a, b
Müller, M.: Das Ergebnis der Bohrung Staffelsee 1 als Grundlage für neue Vorstellungen über Bau und Untergrund der gefalteten Molasse, Geologica Bavarica, 63, 86–106, 1970. a, b, c
Müller, M.: Bohrung Miesbach 1: Ergebnisse der ersten im Rahmen des Erdgastiefenaufschlußprogramms der Bundesregierung mit offentlichen Mitteln geförderten Erdgastiefbohrung, Compendium, 75/76, 63–67, 1975/1976. a, b
Müller, M. and Nieberding, F.: Principles of abnormal pressures related to tectonic developments and their implication for drilling activities (Bavarian Alps, Germany), in: Oil and Gas in Alpidic Thrusbelts and Basins of Central and Eastern Europe, edited by: Wessely, G. and Liebl, W., 119–126, EAGE Spec. Pub., Amsterdam, 1996. a
Müller, M., Nieberding, F., and Wanninger, A.: Tectonic style and pressure distribution at the northern margin of the Alps between Lake Constance and the River Inn, Geol. Rundsch., 77, 787–796, https://doi.org/10.1007/BF01830185, 1988. a, b, c, d, e, f
Ortner, H., Aichholzer, S., Zerlauth, M., Pilser, R., and Fügenschuh, B.: Geometry, amount, and sequence of thrusting in the Subalpine Molasse of western Austria and southern Germany, European Alps, Tectonics, 34, 1–30, https://doi.org/10.1002/2014TC003550, 2015. a, b, c, d, e, f, g, h, i
Pfiffner, O. A.: Tectonic evolution of Europe – Alpine Orogeny, in: A Continent Revealed: The European Geotraverse, edited by: Blundell, D., Freeman, R., and Mueller, S., University Press Cambridge, Cambridge, UK, 180–190, https://doi.org/10.1017/CBO9780511608261, 1992. a
Price, N. J. and Cosgrove, J. W.: Analysis of geological structures, Cambridge University Press, Cambridge, 502 pp., 1990. a
Reinecker, J., Tingay, M., Müller, B., and Heidbach, O.: Present-day stress orientation in the Molasse Basin, Tectonophysics, 482, 129–138, https://doi.org/10.1016/j.tecto.2009.07.021, 2010. a
Roeder, D. and Bachmann, G.: Evolution, structure and petroleum geology of the German Molasse Basin, Mem. Mus. Natl. Hist. Nat., 170, 263–284, 1996 a
Schöpfer, M. P. J., Childs, C., and Walsh, J. J.: Location of normal faults in multilayer sequences, J. Struct. Geol., 28, 816–833, https://doi.org/10.1016/j.jsg.2006.02.003, 2006. a, b, c, d
Schulz, R., Thomas, R., Jung, R., and Schellschmidt, R.: Geoscientific prospect evaluation for the Unterhaching geothermal power plant, Z. Angew. Geol., 50, 28–36, 2004. a
Scisciani, V., Tavarnelli, E., and Calamita, F.: Styles of tectonic inversion within syn-orogenic basins: examples from the Central Apennines, Italy, Terra Nova, 13, 321–326, https://doi.org/10.1046/j.1365-3121.2001.00352.x, 2001. a, b, c
Sissingh, W.: Tectonostratigraphy of the North Alpine Foreland Basin: correlation of Tertiary depositional cycles and orogenic phases, Tectonophysics, 282, 223–256, https://doi.org/10.1016/S0040-1951(97)00221-7, 1997. a, b, c, d
Schwerd, K. and Thomas, R.: Tektonische Strukturen am Alpennordrand bei Miesbach/Oberbayern in reflexionsseismischen Profilen – die Grenze zwischen Vorland und Faltenmolasse sowie die Basisüberschiebung von Helvetikum/Ultrahelvetikum und Rhenodanubischem Flysch, Z. Dtsch. Geol. Ges., 153, 187–207, 2003. a
Tavani, S., Storti, F., Lacombe, O., Corradetti, A., Muñoze, J. A., and Mazzoli, S.: A review of deformation pattern templates in foreland basin systems and fold-and-thrust belts: Implications for the state of stress in the frontal regions of thrust wedges, Earth-Sci. Rev., 141, 82–104, https://doi.org/10.1016/j.earscirev.2014.11.013, 2015. a, b, c, d, e, f
Tavani, S., Corradetti, A., Sabbatino, M., Morsalnejad, D., and Mazzoli, S.: The Meso-Cenozoic fracture pattern of the Lurestan region, Iran: The role of rifting, convergence, and differential compaction in the development of pre-orogenic oblique fractures in the Zagros Belt, Tectonophysics, 749, 104–119, https://doi.org/10.1016/j.tecto.2018.10.031, 2018. a
Tavarnelli, E. and Peacock, D. C. P.: From extension to contraction in syn-orogenic foredeep basins: the Contessa section, Umbria-Marche Apennines, Italy, Terra Nova, 11, 55–60, https://doi.org/10.1046/j.1365-3121.1999.00225.x, 1999. a
Thomas, R., Schwerd, K., Bram, K., and Fertig, J.: Shallow high-resolution seismics and reprocessing of industry profiles in southern Bavaria: The Molasse and the northern Alpine front, Tectonophysics, 414, 87–96, https://doi.org/10.1016/j.tecto.2005.10.025, 2006. a
Turcotte, D. L. and Schubert, G.: Geodynamics, J. Wiley and Sons, New York, 1982. a
Tvedt, A. B. M., Rotevatn, A., Jackson, C. A.-L., Fossen, H., and Gawthorpe, R. L.: Growth of normal faults in multilayer sequences: A 3D seismic case study from the Egersund Basin, Norwegian North Sea, J. Struct. Geol., 55, 1–20, https://doi.org/10.1016/j.jsg.2013.08.002, 2013. a, b
Unger, H. J.: Die Lithozonen der Oberen Süßwassermolasse Südostbayerns und ihre vermutlichen zeitlichen Äquivalente gegen Westen und Osten, Geol. Bav., 94, 19–237, 1989. a
von Guembel, C. W.: Geognostische Beschreibung des bayerischen Alpengebirges und seines Vorlandes, J. Perthes, 1, 1–440, 1861. a
von Hagke, C., Lujiendjik, E., Ondrak, R., and Lindow, J.: Quantifying erosion rates in the Molasse basin using a high resolution data set and a new thermal model, Geotect. Res., 97, 94–97, https://doi.org/10.1127/1864-5658/2015-36, 2015. a
von Hartmann, H., Tanner, D. C., and Schumacher, S.: Initiation and development of normal faults within the German alpine foreland basin: The inconspicuous role of basement structures, AGU Tectonics, 35, 1560–1574, https://doi.org/10.1002/2016TC004176, 2016. a, b, c, d, e, f, g
Walsh, J. J. and Watterson, J.: Distributions of cumulative displacement and seismic slip on a single normal fault surface, J. Struct. Geol., 9, 1039–1046, https://doi.org/10.1016/0191-8141(87)90012-5, 1987. a, b
Walsh, J. J., Bailey, W. R., Childs, C., Nicol, A., and Bonson, C. G.: Formation of segmented normal faults: A 3-D perspective, J. Struct. Geol., 25, 1251–1262, https://doi.org/10.1016/S0191-8141(02)00161-X, 2003. a, b
Watterson, J.: Fault dimensions, displacements and growth, Pure Appl. Geophys., 124, 365–373, https://doi.org/10.1007/BF00875732, 1986. a
Weides, S. and Majorowicz, J.: Implications of spatial variability in heat flow for geothermal resource evaluation in large foreland basins: the case of the Western Canada Sedimentary Basin, Energies, 7, 2573–2594, https://doi.org/10.3390/en7042573, 2014. a
Webberley, C. A. J., Yielding, G., and Di Toro, G.: Recent advances in the understanding of fault zone internal structure: a review, in: The internal structure of fault zones: fluid flow and mechanical properties, edited by: Wibberley, C. A. J., Kurz, W., Imber, J., Holdsworth, R. E., and Collettini, C., Geological Society, London, Special Publication, 299, 5–33, https://doi.org/10.1144/SP299.2, 2008. a
Wilkins, S. J. and Gross, M. R.: Normal fault growth in layered rocks at Split Mountain, Utah: influence of mechanical stratigraphy on dip linkage, fault restriction and fault scaling, J. Struct. Geol., 24, 1413–1429, https://doi.org/10.1016/S0191-8141(01)00154-7, 2002. a
Withjack, M. O., Olson, J. E., and Peterson, E.: Experimental models of extensional forced folds, AAPG Bull., 74, 1038–1054, https://doi.org/10.1306/0C9B23FD-1710-11D7-8645000102C1865D, 1990. a
Withjack, M. O. and Callaway, S.: Active normal faulting beneath a salt layer: an experimental study of deformation patterns in the cover sequence, AAPG Bull., 84, 627–651, https://doi.org/10.1306/C9EBCE73-1735-11D7-8645000102C1865D, 2000. a
Ziegler, P. A.: Late Cretaceous and Cenozoic intraplate compressional deformations in the Alpine foreland – a geodynamic model, Tectonophysics, 137, 399–420, https://doi.org/10.1016/0040-1951(87)90330-1, 1987. a
Ziegler, P. A.: Geological Atlas of Western and Central Europe, Shell Internationale Petroleum Maatschappij, B.V., The Hague, 1990. a, b, c
Ziegler, P. A., Cloetingh, S., and van Wees, J.-D.: Dynamics of intra-plate compressional deformation: the Alpine foreland and other examples, Tectonophysics, 252, 7–59, https://doi.org/10.1016/0040-1951(95)00102-6, 1995. a
Ziesch, J., Aruffo, C. M., Tanner, D. C., Beilecke, T., Dance, T., Henk, A., Weber, B., Tenthorey, E., Lippmann, A., and Krawczyk, C. M.: Geological structure of the CO2CRC Otway Project site, Australia: Fault kinematics based on quantitative 3D seismic interpretation, Basin Res., 29, 129–148, https://doi.org/10.1111/bre.12146, 2017. a
Zweigel, J., Aigner, T., and Luterbacher, H.: Eustatic versus tectonic controls an Alpine foreland basin fill: Sequence stratigraphy and subsidence analysis in the SE German Molasse, in: Cenozoic Foreland Basins of Western Europe, edited by: Mascle, A., Geol. Soc., London, 299–323, 1998. a, b, c, d, e, f