the Creative Commons Attribution 4.0 License.
the Creative Commons Attribution 4.0 License.
 | 11 Dec 2020
Micro- and nano-porosity of the active Alpine Fault zone, New Zealand
Martina Kirilova
Virginia Toy
Katrina Sauer
François Renard
Klaus Gessner
Richard Wirth
Xianghui Xiao
Risa Matsumura
Porosity reduction in rocks from a fault core can cause elevated pore fluid pressures and consequently influence the recurrence time of earthquakes. We investigated the porosity distribution in the New Zealand's Alpine Fault core in samples recovered during the first phase of the Deep Fault Drilling Project (DFDP-1B) by using two-dimensional nanoscale and three-dimensional microscale imaging. Synchrotron X-ray microtomography-derived analyses of open pore spaces show total microscale porosities in the range of 0.1 %–0.24 %. These pores have mainly non-spherical, elongated, flat shapes and show subtle bipolar orientation. Scanning and transmission electron microscopy reveal the samples' microstructural organization, where nanoscale pores ornament grain boundaries of the gouge material, especially clay minerals. Our data imply that (i) the porosity of the fault core is very small and not connected; (ii) the distribution of clay minerals controls the shape and orientation of the associated pores; (iii) porosity was reduced due to pressure solution processes; and (iv) mineral precipitation in fluid-filled pores can affect the mechanical behavior of the Alpine Fault by decreasing the already critically low total porosity of the fault core, causing elevated pore fluid pressures and/or introducing weak mineral phases, and thus lowering the overall fault frictional strength. We conclude that the current state of very low porosity in the Alpine Fault core is likely to play a key role in the initiation of the next fault rupture.
- Article
(14143 KB) - Full-text XML
-
Supplement
(2271 KB) - BibTeX
- EndNote


Fault mechanics, fault structure, and fluid flow properties of damaged fault rocks are intimately related (e.g., Gratier and Gueydan, 2007; Faulkner et al., 2010). Fault rupture is associated with intense brittle fracturing that enhances porosity, and thus permeability, and therefore also possible rates and directions of fluid propagation within fault zones (e.g., Girault et al., 2018). Conversely, post-seismic recovery mechanisms (gouge compaction and pressure solution processes) result in reductions in porosity, permeability, and fluid flow (Renard et al. 2000; Faulkner et al., 2010; Sutherland et al., 2012). These processes may cause elevated pore fluid pressures within fault cores and trigger frictional failure (e.g., Sibson, 1990; Gratier et al., 2003; Zhu et al., 2020). Therefore, the state of porosity within rocks from fault cores can play a key role in fault slip. The Alpine Fault of New Zealand is late in its seismic cycle (Cochran et al., 2017), so studying it allows us to investigate pre-earthquake conditions that may influence earthquake nucleation and rupture processes. Recently, drilling operations were undertaken in this fault zone to investigate the in situ conditions (Sutherland et al. 2012, 2017). Slug tests in the DFDP-1B borehole (Sutherland et al., 2012) and laboratory permeability measurements of core samples (Carpenter et al., 2014) indicate permeability decreases by 6 orders of magnitude with increasing proximity to the fault. Furthermore, Sutherland et al. (2012) documented a 0.53 MPa fluid pressure difference across the principal slip zone (PSZ) of the fault, which suggests that the fault core has significantly lower permeability than the surrounding cataclasite units. It is therefore interpreted as acting as a fault seal that limits fluid circulation within its hanging wall (Sutherland et al., 2012). Permeability variations like this are closely associated with the porosity evolution of fault cores and thus are likely to affect the fault strength and seismic properties (Sibson, 1990; Renard et al., 2000; Gratier and Gueydan, 2007).
In this study, we investigate the porosity distribution in rocks from the Alpine Fault core and consider the potential effects of this porosity on fault strength. We have measured open pore spaces in these rocks from X-ray computed tomography (XCT) datasets and examined pore morphology by implementing quantitative shape analyses. Lithological and microstructural characteristics of these samples were performed by using scanning electron microscopy (SEM) and transmission electron microscopy (TEM).
New Zealand's Alpine Fault (Fig. 1a) is a major active crustal-scale structure that ruptures in a large earthquake every 291±23 years, the last one of which occurred in 1717 (Cochran et al., 2017). The fault is the main constituent of the oblique transform boundary between the Australian Plate and the Pacific Plate, accommodating around 75 % of the relative plate motion. Ongoing dextral strike-slip at 27±5 mm yr−1 along the fault has resulted in a total strike separation of ∼480 km over the last 25 Myr (Norris and Cooper, 1995, 2001; Norris and Toy, 2014). In Neogene times, a dip-slip component added to the fault motion has resulted in more than 20 km of vertical uplift of the hanging wall (Norris and Cooper, 1995, 2001; Norris and Toy, 2014). Consequently, rocks comprising the hanging wall of the fault have been exposed in various outcrops, where they can be studied in detail. The amphibolite facies Alpine Schist is the metamorphic protolith of a ∼1 km thick mylonite zone, which has been exhumed from depth and now structurally overlies an up to 50 m thick zone of brittlely deformed cataclasites and gouges (e.g., Norris and Cooper, 1995, 2001; Norris and Toy, 2014). These rocks have been investigated in outcrops and from samples collected in three boreholes during the two phases of the Deep Fault Drilling Project (DFDP-1A, DFDP-1B, and DFDP-2B; Fig. 1a) along the Alpine Fault (Sutherland et al., 2012; Toy et al., 2015, 2017).
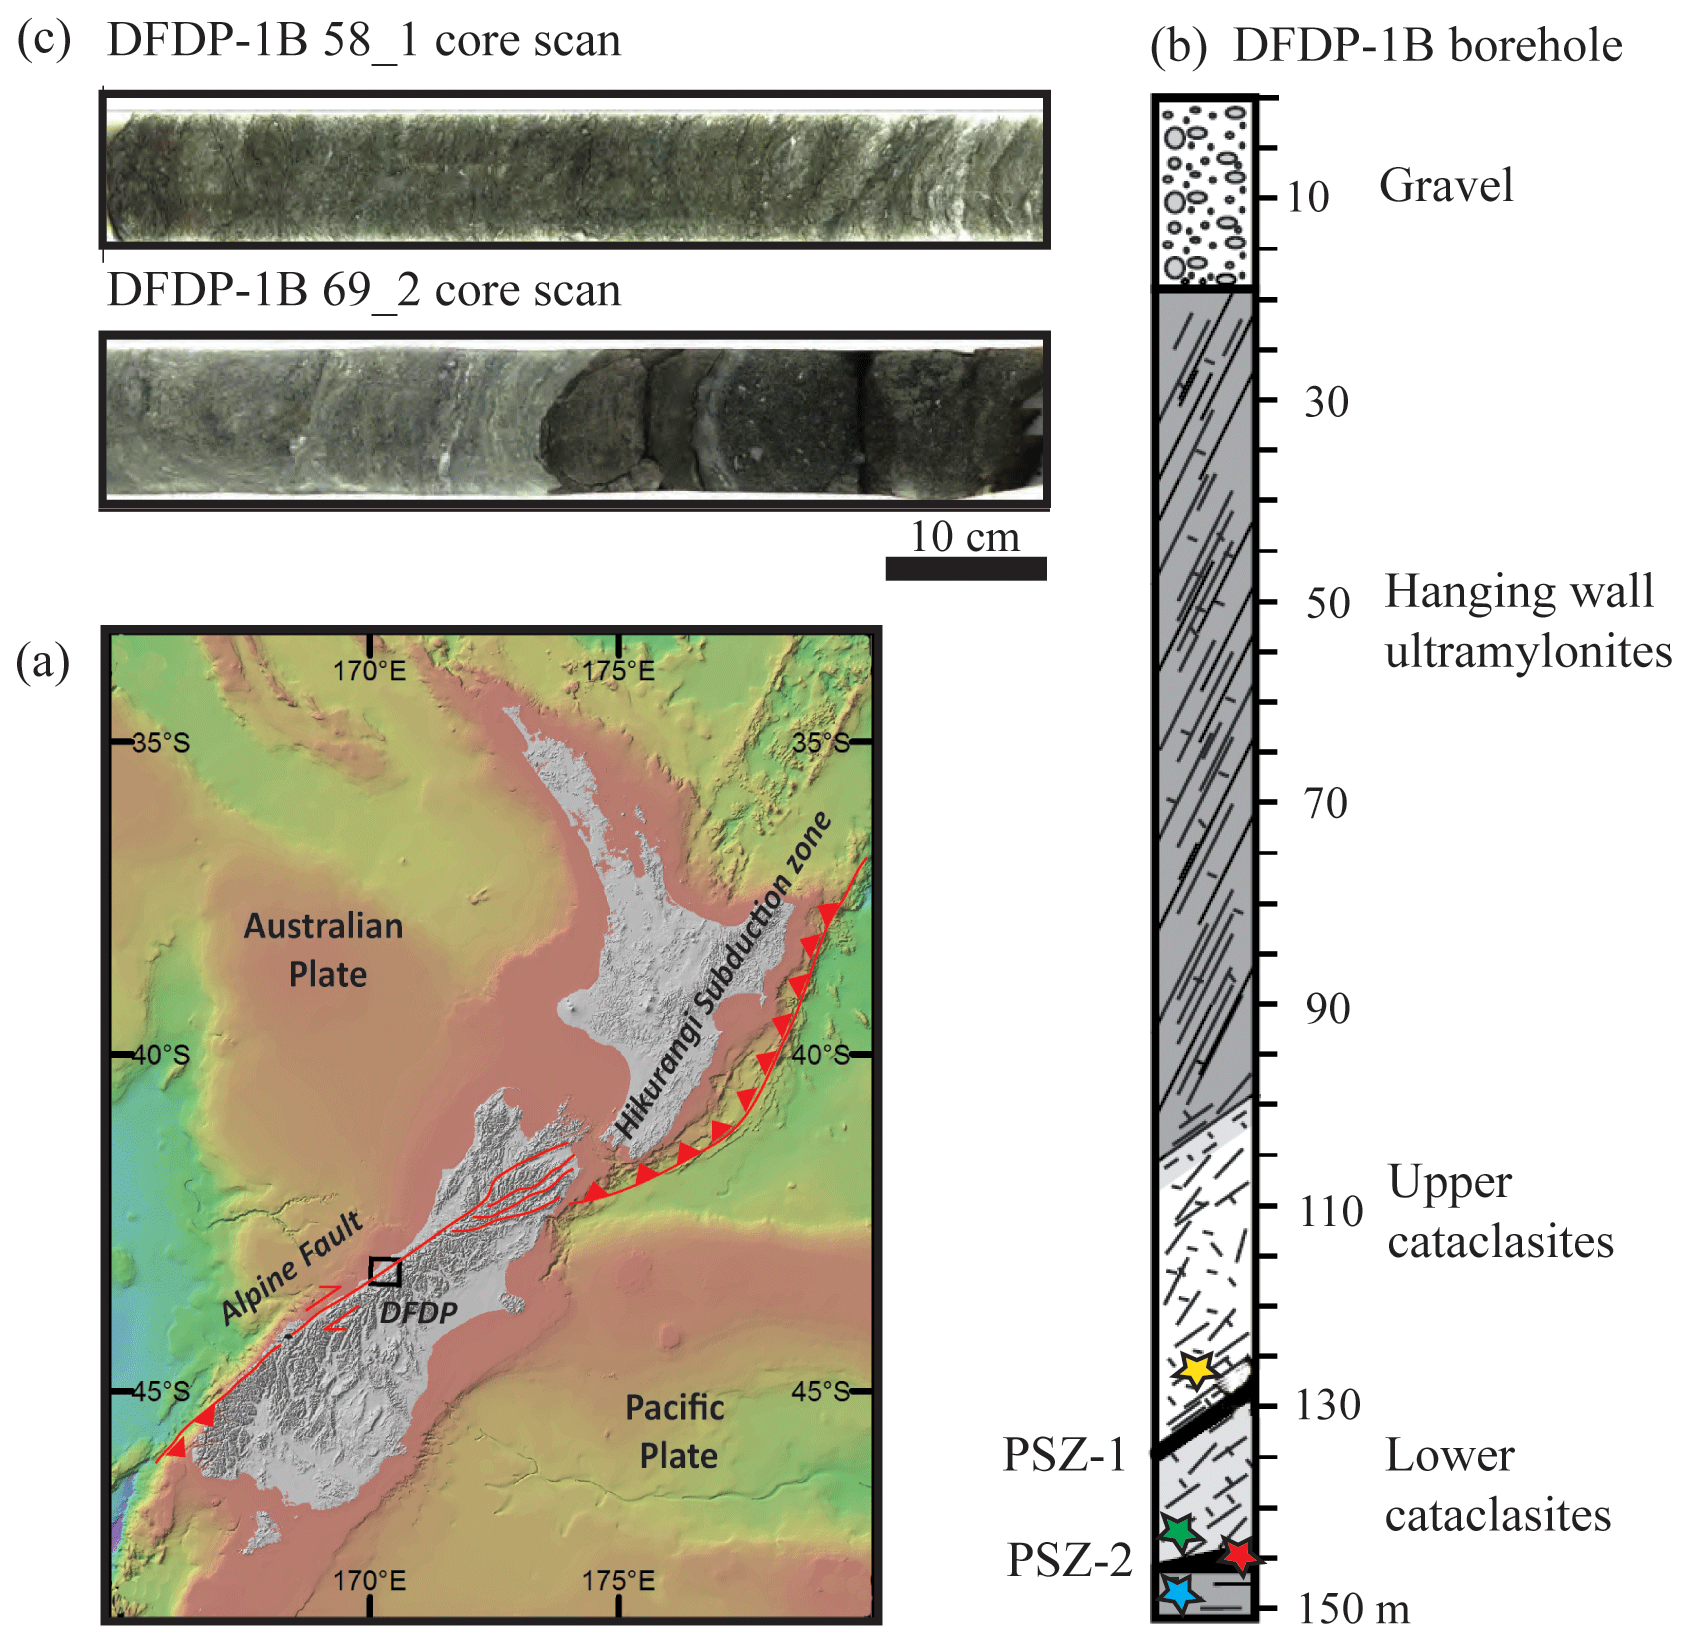
Figure 1(a) Location map of DFDP drill sites (a bathymetric map compiled by NIWA, the National Institute of Water and Atmospheric Research). Drill site coordinates: 43∘17′5′′ S, 170∘24′22′′ E. (b) Schematic diagram of the sampled lithologies in DFDP-1B borehole (modified after Sutherland et al., 2012). (c) Scans of DFDP-1B drill core. Samples were collected from the locations indicated with stars: yellow – DFDP-1B 58_1.9; green – DFDP-1B 69_2.48; red – DFDP-1B 69_2.54; blue – DFDP-1B 69_2.57.
Most of the brittle shear displacement along the fault has been accommodated within the fault core, which includes PSZ gouges and cataclasite-series rocks (Toy et al., 2015). Both in surface outcrops and drill core samples, the Alpine Fault manifests itself as a thin (5 to 20 cm thick) gouge zone with a predominantly random fabric of clay-rich material (Toy et al., 2015; Schuck et al., 2020). This cohesive but uncemented layer has a grain size significantly finer than the surrounding cataclasite units, which shows that the material was reworked only within this layer, most probably as a result of ultra-comminution due to multiple shear events under brittle conditions (Boulton et al., 2012; Toy et al., 2015). The local presence of authigenic smectite clays (Schleicher et al., 2015) and calcite and/or chlorite mineralization within sealed fractures and in the gouge matrix (Williams et al. 2017) indicate that mineral reactions are restricted to an alteration zone within the fault core (Sutherland et al., 2012; Schuck et al., 2020). The Alpine Fault core has been interpreted as having formed during a cyclical history of mineralization, shear, and fragmentation (Toy et al., 2015). In addition, in the DFDP-1B borehole (Fig. 1b, Sutherland et al., 2012) fault gouges occur at two distinct depths: 128.1 m (PSZ-1) and 143.85 m (PSZ-2); this shows that the slip was not localized within a single gouge layer (Toy et al., 2015).
3.1 Samples
Porosity analyses were performed on four samples representing PSZ gouges and cataclasites of the Alpine Fault core, which were recovered from the DFDP-1B borehole (Fig. 1b, c; Sutherland et al., 2012). These are DFDP-1B 58_1.9, DFDP-1B 69_2.48, DFDP-1B 69_2.54, and DFDP-1B 69_2.57. Sample nomenclature includes drill core run number, section number, and centimeters measured from the top of each section. These samples were recovered from drilled depth of 126.94, 143.82, 143.88, and 143.91 m, respectively.
Detailed lithological and microstructural descriptions of the DFDP-1B drill core were carried out simultaneously with and after the drilling operations by the DFDP-1 Science Team, and these data were later summarized by Toy et al. (2015). Samples DFDP-1B 58_1.9 and DFDP-1B 69_2.48 belong to foliated cataclasite units (Fig. 1b, c; Toy et al., 2015), described as ultracataclasites with gouge-filled shear zones located above PSZ-1 and PSZ-2, respectively. Sample DFDP-1B 69_2.54 represents the gouge layer that defines PSZ-2, whereas sample DFDP-1B 69_2.57 is composed of brown ultracataclasites that belong to the lower-cataclasite unit (Fig. 1b, c; Toy et al., 2015).
3.2 X-ray computed tomography (XCT)
We imaged the samples using X-ray absorption tomography, where the signal intensity depends on how electron density and bulk density attenuate a monochromatic X-ray along its path through the material (e.g., Fusseis et al., 2014). We acquired the X-ray microtomography data for this study at the 2-BM beamline of the Advanced Photon Source, Argonne National Laboratories, USA, in December 2012. The non-cylindrical samples of ∼7 mm height and ∼4 mm diameter were mostly drilled parallel to the foliation, mounted on a rotary stage, and imaged with a beam energy of 22.5 keV. A charge-couple device camera collected images at 0.25∘ rotation steps over 180∘. A sample-detector distance of 70 mm yielded a field of view of 2.81 mm. The voxel size (i.e., spatial sampling) was 1.3 µm, and the spatial resolution ranged from 2 to 3 times the voxel size. We have reconstructed the datasets with a filtered back-projection parallel beam reconstruction into 32 bit gray level volumes consisting of voxels using X-TRACT (Gureyev et al., 2011).
3.3 Analyses of XCT datasets
Data analyses and image processing were performed using the commercial software Avizo 9.1™ (Fig. 2). Initially, the datasets were rescaled to 8 bit grayscale volumes for enhanced computer performance. In addition, small volumes of interest were cropped from the whole volume before a non-local means filter was applied to reduce noise (Buades et al., 2005). For each voxel, this filter compares the value of this voxel with all neighboring voxels in a given search window. A similarity between the neighbors determines a correction applied to each voxel (e.g., Thomson et al., 2018).
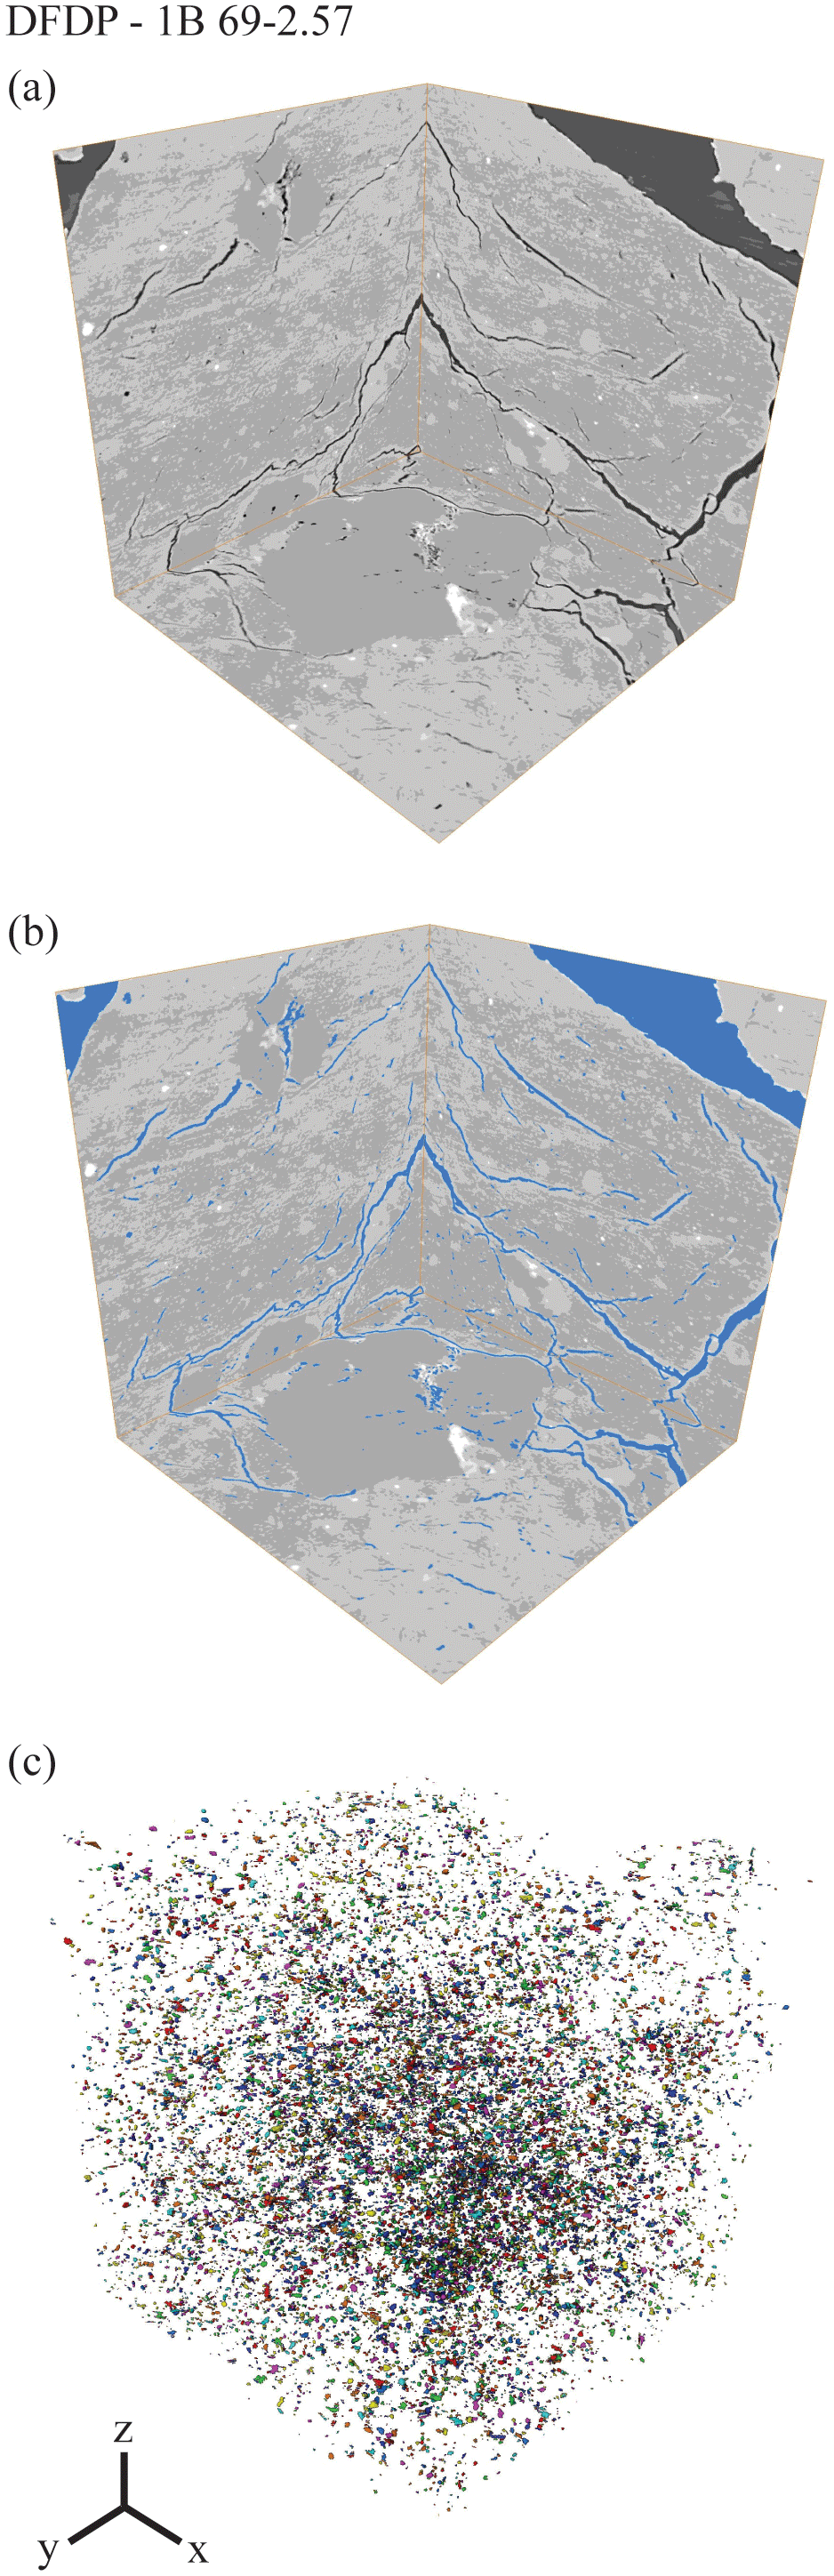
Figure 2X-ray tomography data processing workflow. (a) Grayscale images in xy, xz, and yz directions (b). Threshold of the darkest grayscale phase in each sample, corresponding to voids (pores and fractures). (c) 3D volume of the segmented pore spaces after removal of the fractures due to sample decompaction and coring damaging effects.
On the filtered grayscale images, pores were identified as disconnected materials of the darkest grayscale range (Figs. 2a and S1 in the Supplement). The corresponding grayscale values were thresholded, and the datasets were converted into binary form. This step is called segmentation. Several segmentation techniques exist, from thresholding at a given grayscale value (e.g., Ianossov et al., 2009; Andrew et al., 2013) to deep-learning algorithms (Ma et al., 2020). It is up to the user to choose the segmentation technique that is most appropriate to analyze a given dataset. To our knowledge, no single segmentation technique can be generalized and universally used independently of the nature of the samples. In the present study, we have chosen a simple segmentation technique by applying a threshold to the grayscale images to separate the void space from the solid. This technique has been used in many studies in the last 2 decades to characterize porosity in rocks, including some very recent studies in rock physics (Macente et al., 2019; Renard et al., 2019). The segmented porosity volume depends strongly on the choice of the threshold and some studies have demonstrated that the final porosity estimated by different segmentation methods can vary by 20 % (Andrä et al., 2013). However, when the level of noise in the data is low, the differences in porosities estimated by different segmentation techniques are negligible (Andrew, 2018). Our data were acquired at a synchrotron where the parallel beam and high photon flux ensured a low level of the noise in the images. In addition, application of a non-local-means filter applied to our data reduced the noise level. For these reasons, we consider that it was robust to apply a simple thresholding technique to this dataset but acknowledge that the porosity values we estimate could differ by <20 % from the “true” porosity of the rock (see Andrä et al., 2013; Hapca et al., 2013).
However, our segmentation procedure also captured cracks within a sample, which are likely to result from depressurization during core recovery (Figs. 2b and S1 in the Supplement). To omit the cracks, we utilized the morphological operation “connected components” available in the software Avizo 9.1, which allows volumes larger than the selected number of connected voxels to be excluded from the binary label images. To each sample we applied upper limits of 20 (43.94 µm3), 50 (109.85 µm3), 100 (219.7 µm3), and 200 (439.4 µm3) face-connected voxels. Total porosity estimates based on these operations are presented as percentages of the sample volume in Table S1 in the Supplement. Unfortunately, this methodology results in either loss of larger pores or inclusion of small cracks depending on the implemented limit of connected components, and thus the calculated porosities include significant bias. Therefore, the operation “connected components” was used only for visualization purposes, and clusters of 200 face-connected voxels were created to show the 3D volumes of segmented pore spaces (Fig. 2c)
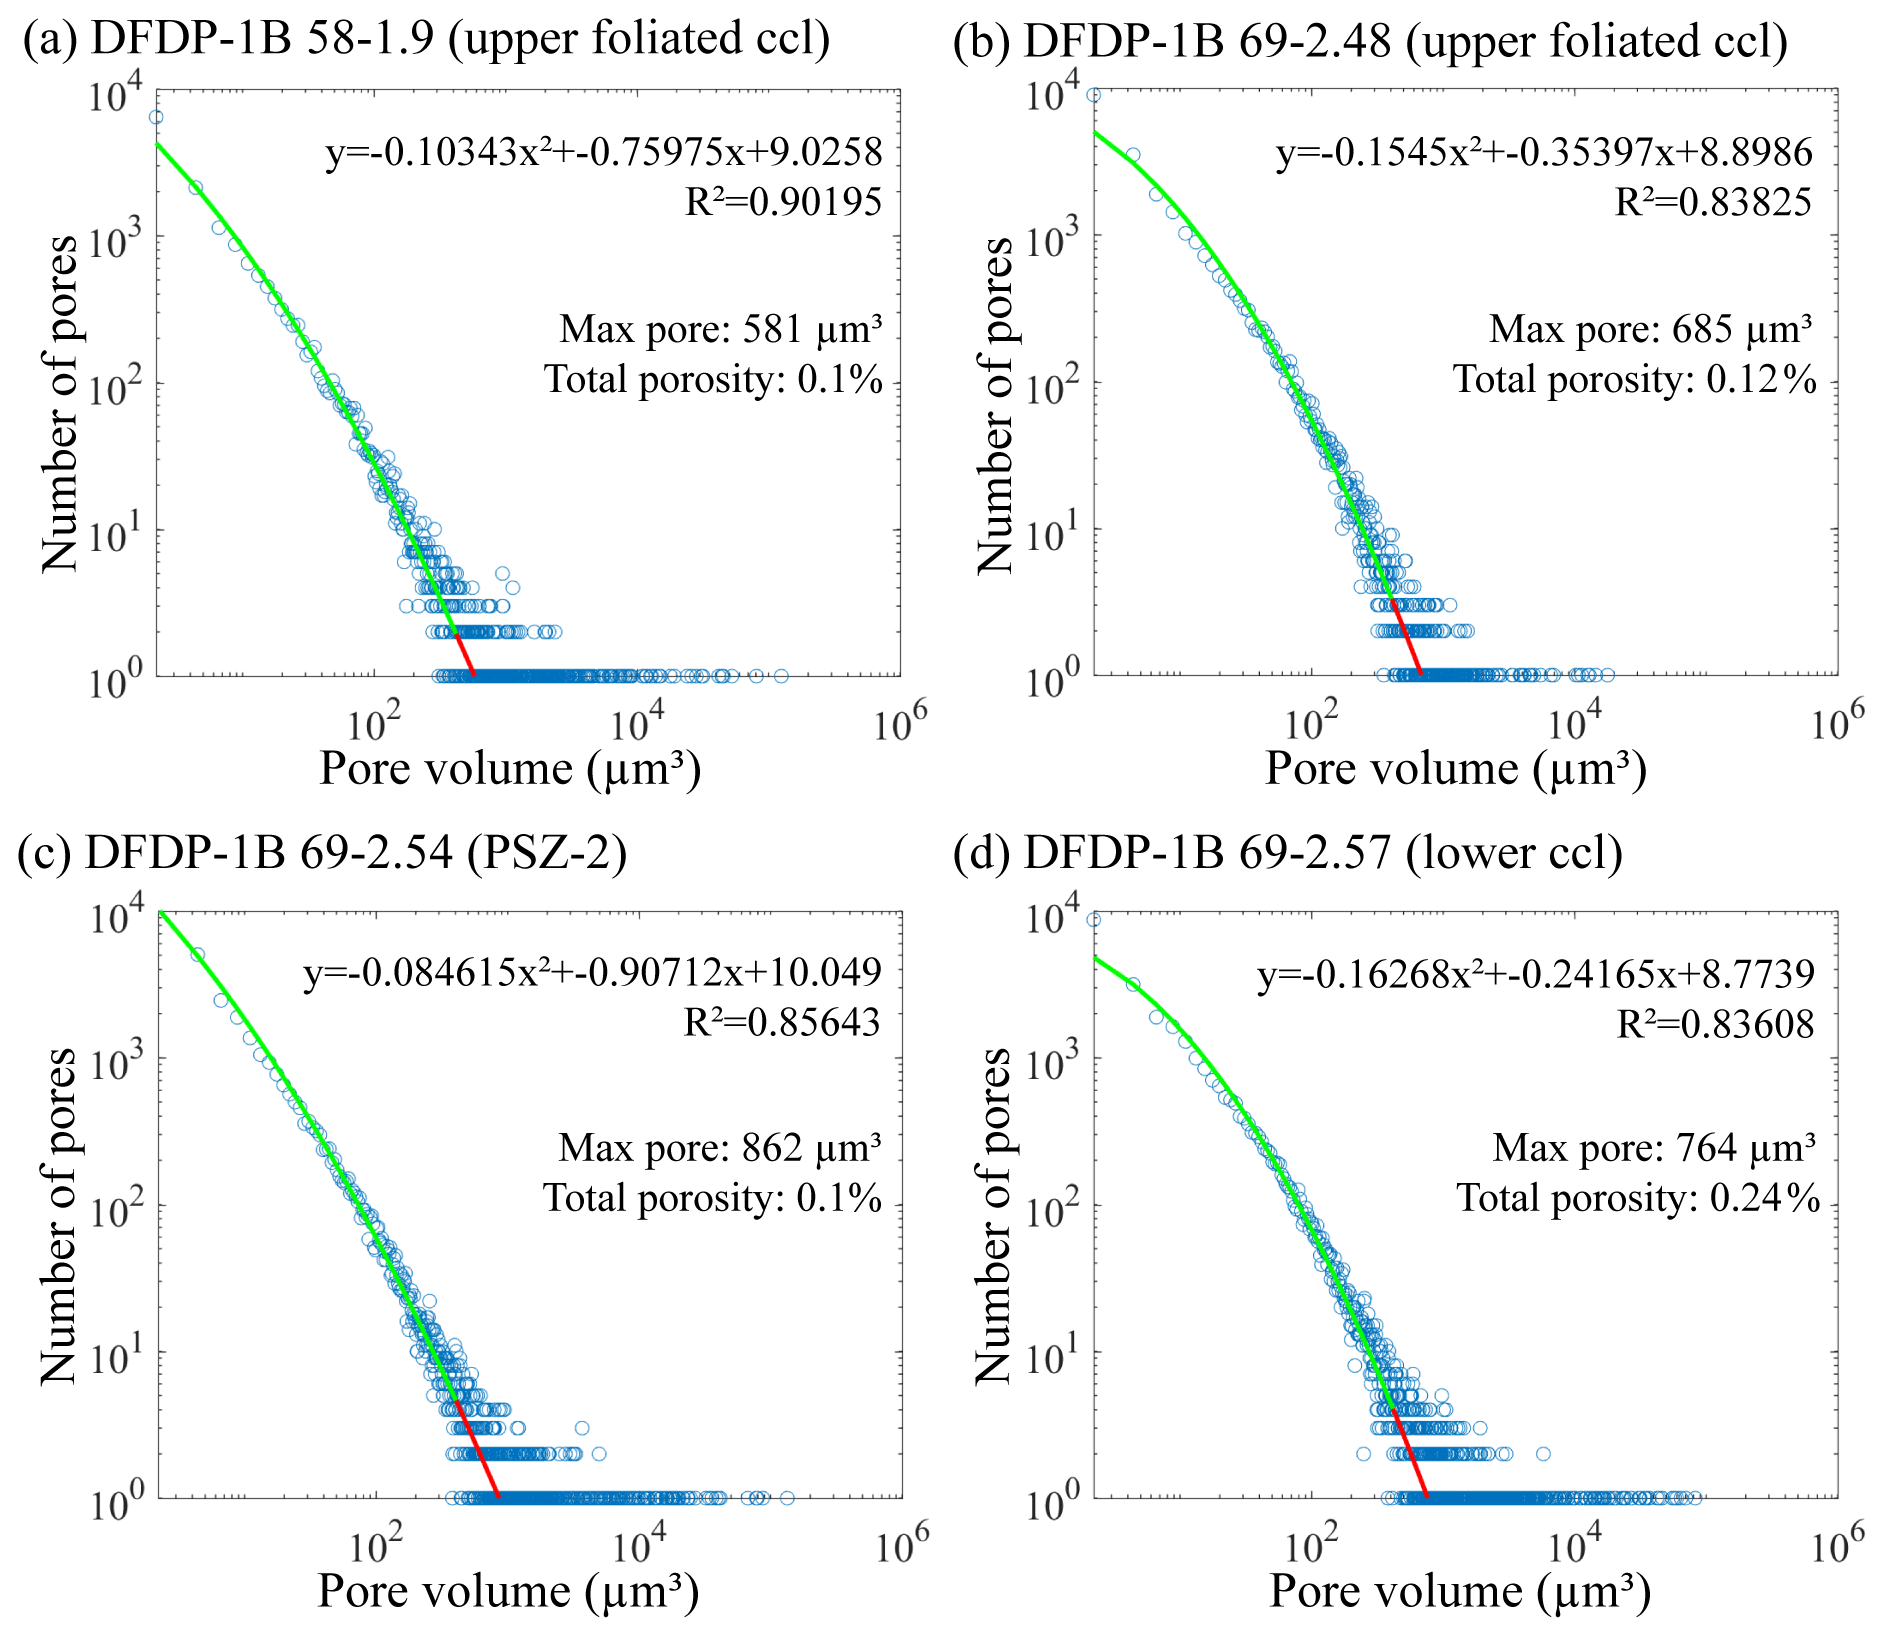
Figure 3Plots of pore volume vs. number of pores for each sample. Estimates of total porosity and size of the maximum expected pore are also shown, as well as the curve fitting function for each dataset.
Instead, the volumes and shape characteristics of segmented materials (including cracks, i.e., without any data limitation) were exported from the Avizo software in numerical format, and volume distributions within a sample were plotted on a logarithmic scale (Fig. 3). Data up to a specific volume size were fit to a polynomial curve, and then the curve was extrapolated to the x-axis intercept, which is the expected maximum pore size (Fig. 3). For each sample the total porosity was then estimated by integrating the curve, which excludes all volumes on the right side of the curve. Total porosities are presented as a percentage of the whole sample volume (Fig. 3). The implemented equations are given in the Supplement.
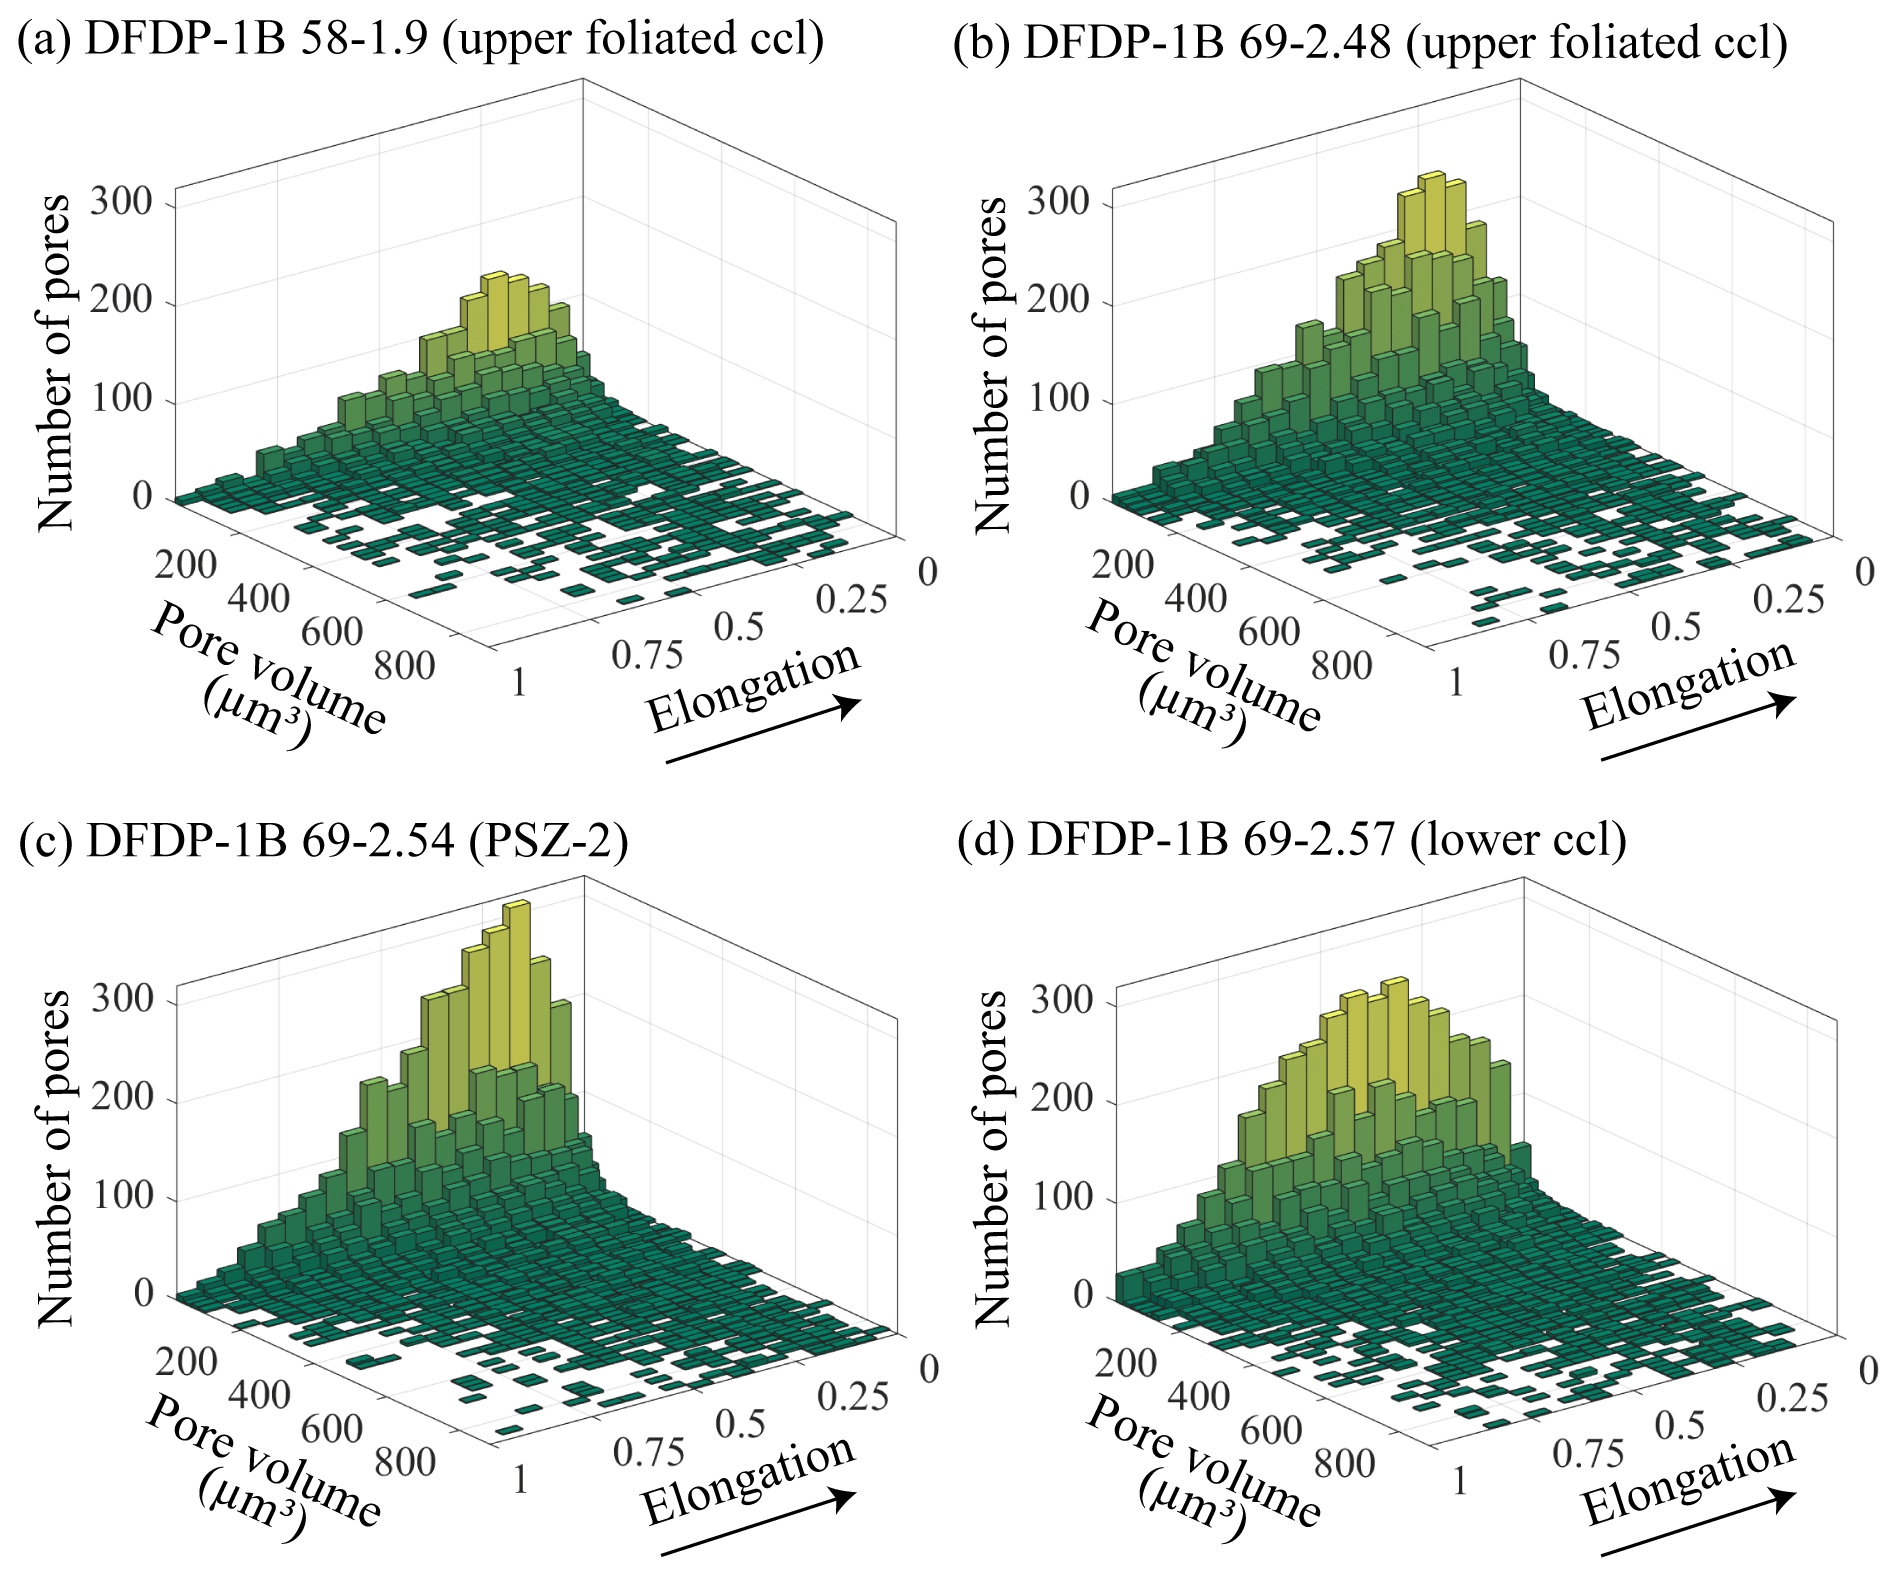
Figure 4Bivariate histograms showing elongation vs. pore volume (µm3) and number of pores for each sample. The arrow indicates the direction of increasing elongation. Here, the elongation is defined as the ratio between the medium and the largest eigenvalues (i.e., axis) of each pore.
Pore shapes were analyzed on bivariate histograms plotted by using the numerical pore characteristics, previously extracted from the Avizo software. Only pore volumes between 21.97 µm3 (10 voxels) and 878.8 µm3 (400 voxels) were included to avoid bias in the data due to an insufficient voxel count and the presence of cracks, respectively. Individual pores in our dataset are separated (Fig. 2c). The covariance matrix of each pore was calculated, and the three eigenvalues of this covariance matrix were extracted. These three values correspond to the three main orthogonal directions in each pore (i.e., the longest, medium, and shortest axes), and we use them as proxies to describe pore geometry. Thus, their amplitudes provide information on the spatial extension of a given pore and its shape. The ratio between the medium and largest eigenvalues of each pore defines its elongation (Fig. 4), the ratio between the smallest and the largest eigenvalues defines its sphericity (Fig. 5), and the ratio of the smallest and the medium eigenvalues defines its flatness (Fig. 6).
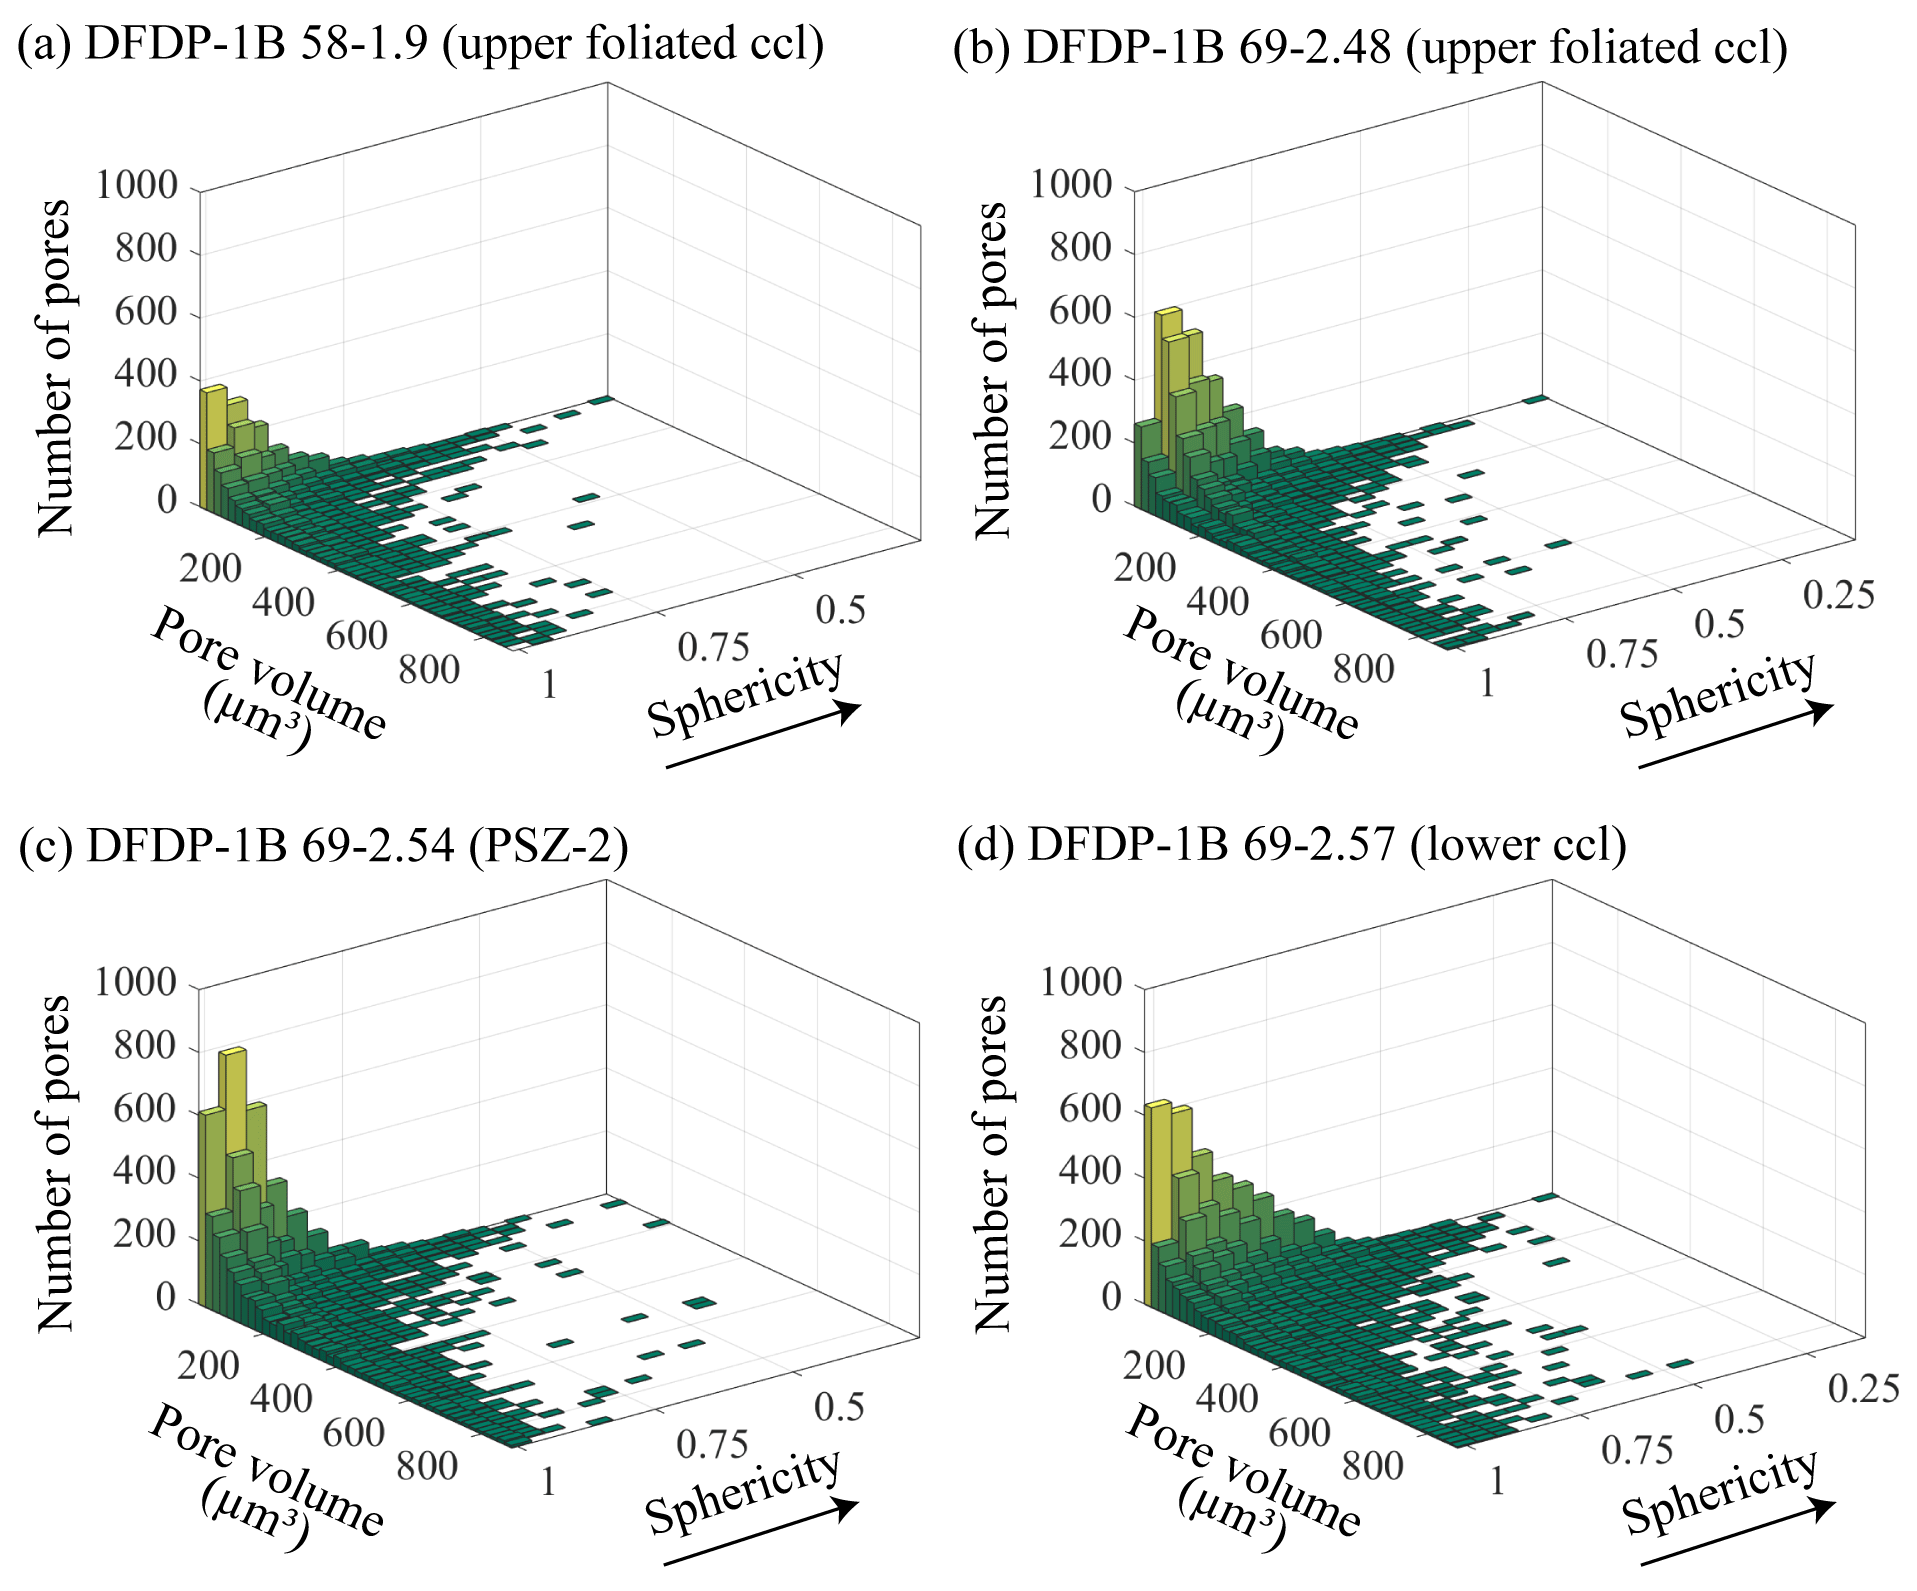
Figure 5Bivariate histograms showing sphericity vs. pore volume (µm3) and number of pores for each sample. The arrow indicates the direction of increasing sphericity. Here, the sphericity is defined as the ratio between the smallest and the largest eigenvalues (i.e., axis) of each pore.
The angles θ and φ that describe the orientation of the longest eigenvalue (i.e., axis) of each pore with respect to the global orthogonal axes system of the 3D scan were calculated. These angles were translated into trend and plunge and then plotted on a lower-hemisphere equal-area stereographic projection with a probability density contour to display the distribution of pore unit orientations (Fig. 7).
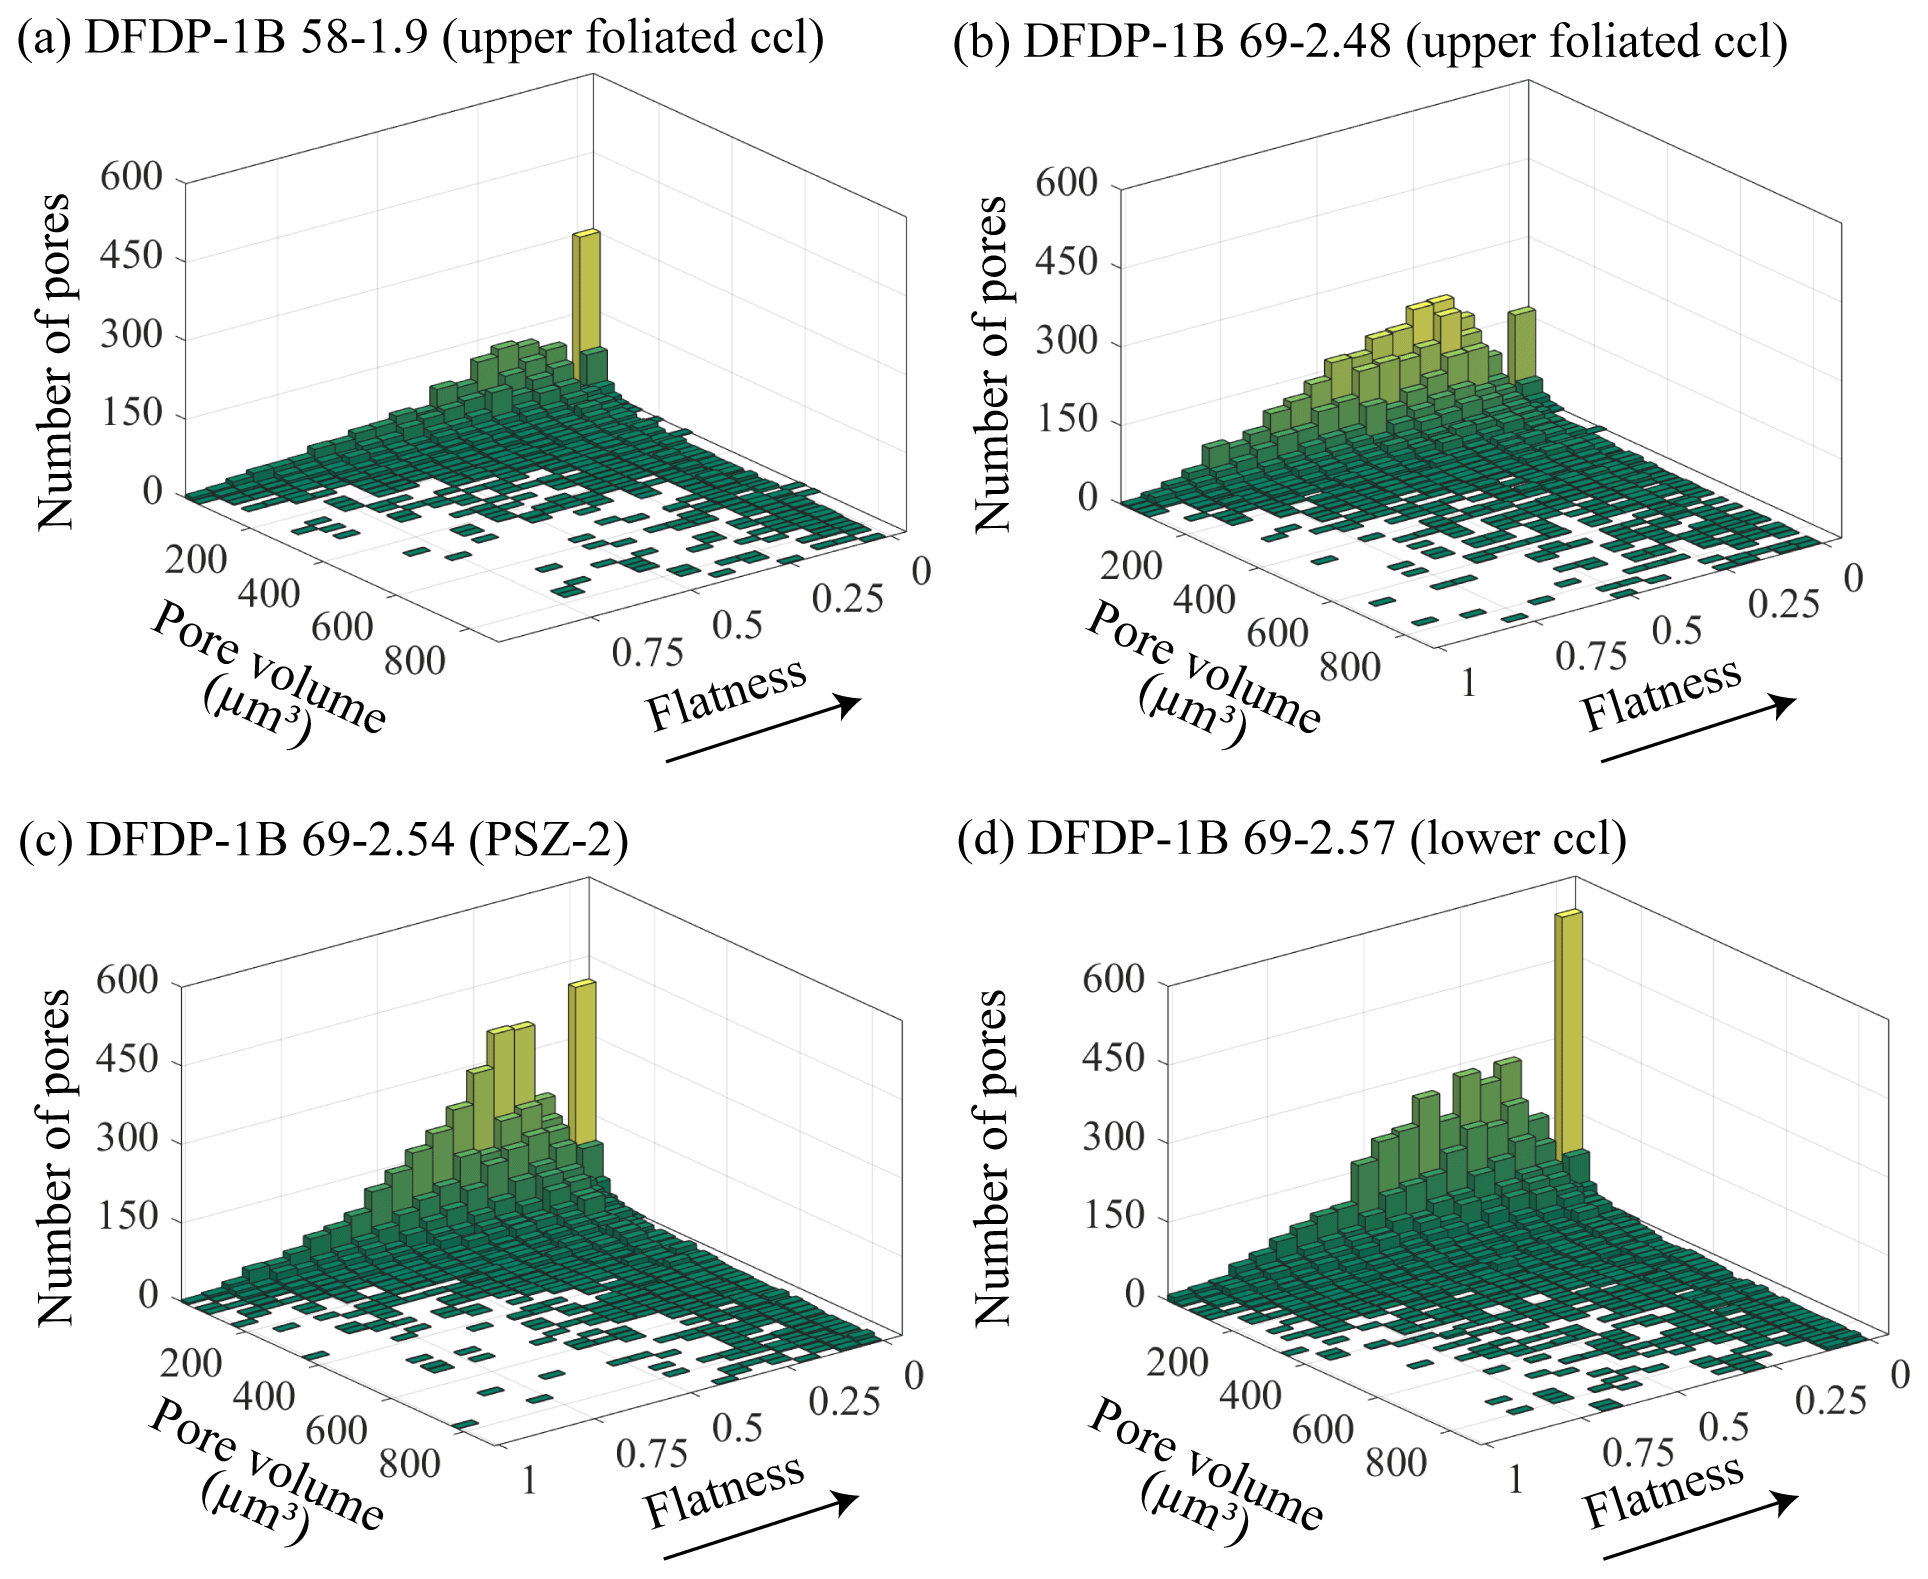
Figure 6Bivariate histograms showing flatness vs. pore volume (µm3) and number of pores for each sample. The arrow indicates the direction of increasing flatness. Here, the flatness is defined as the ratio of the smallest and the medium eigenvalues (i.e., axis) of each pore.
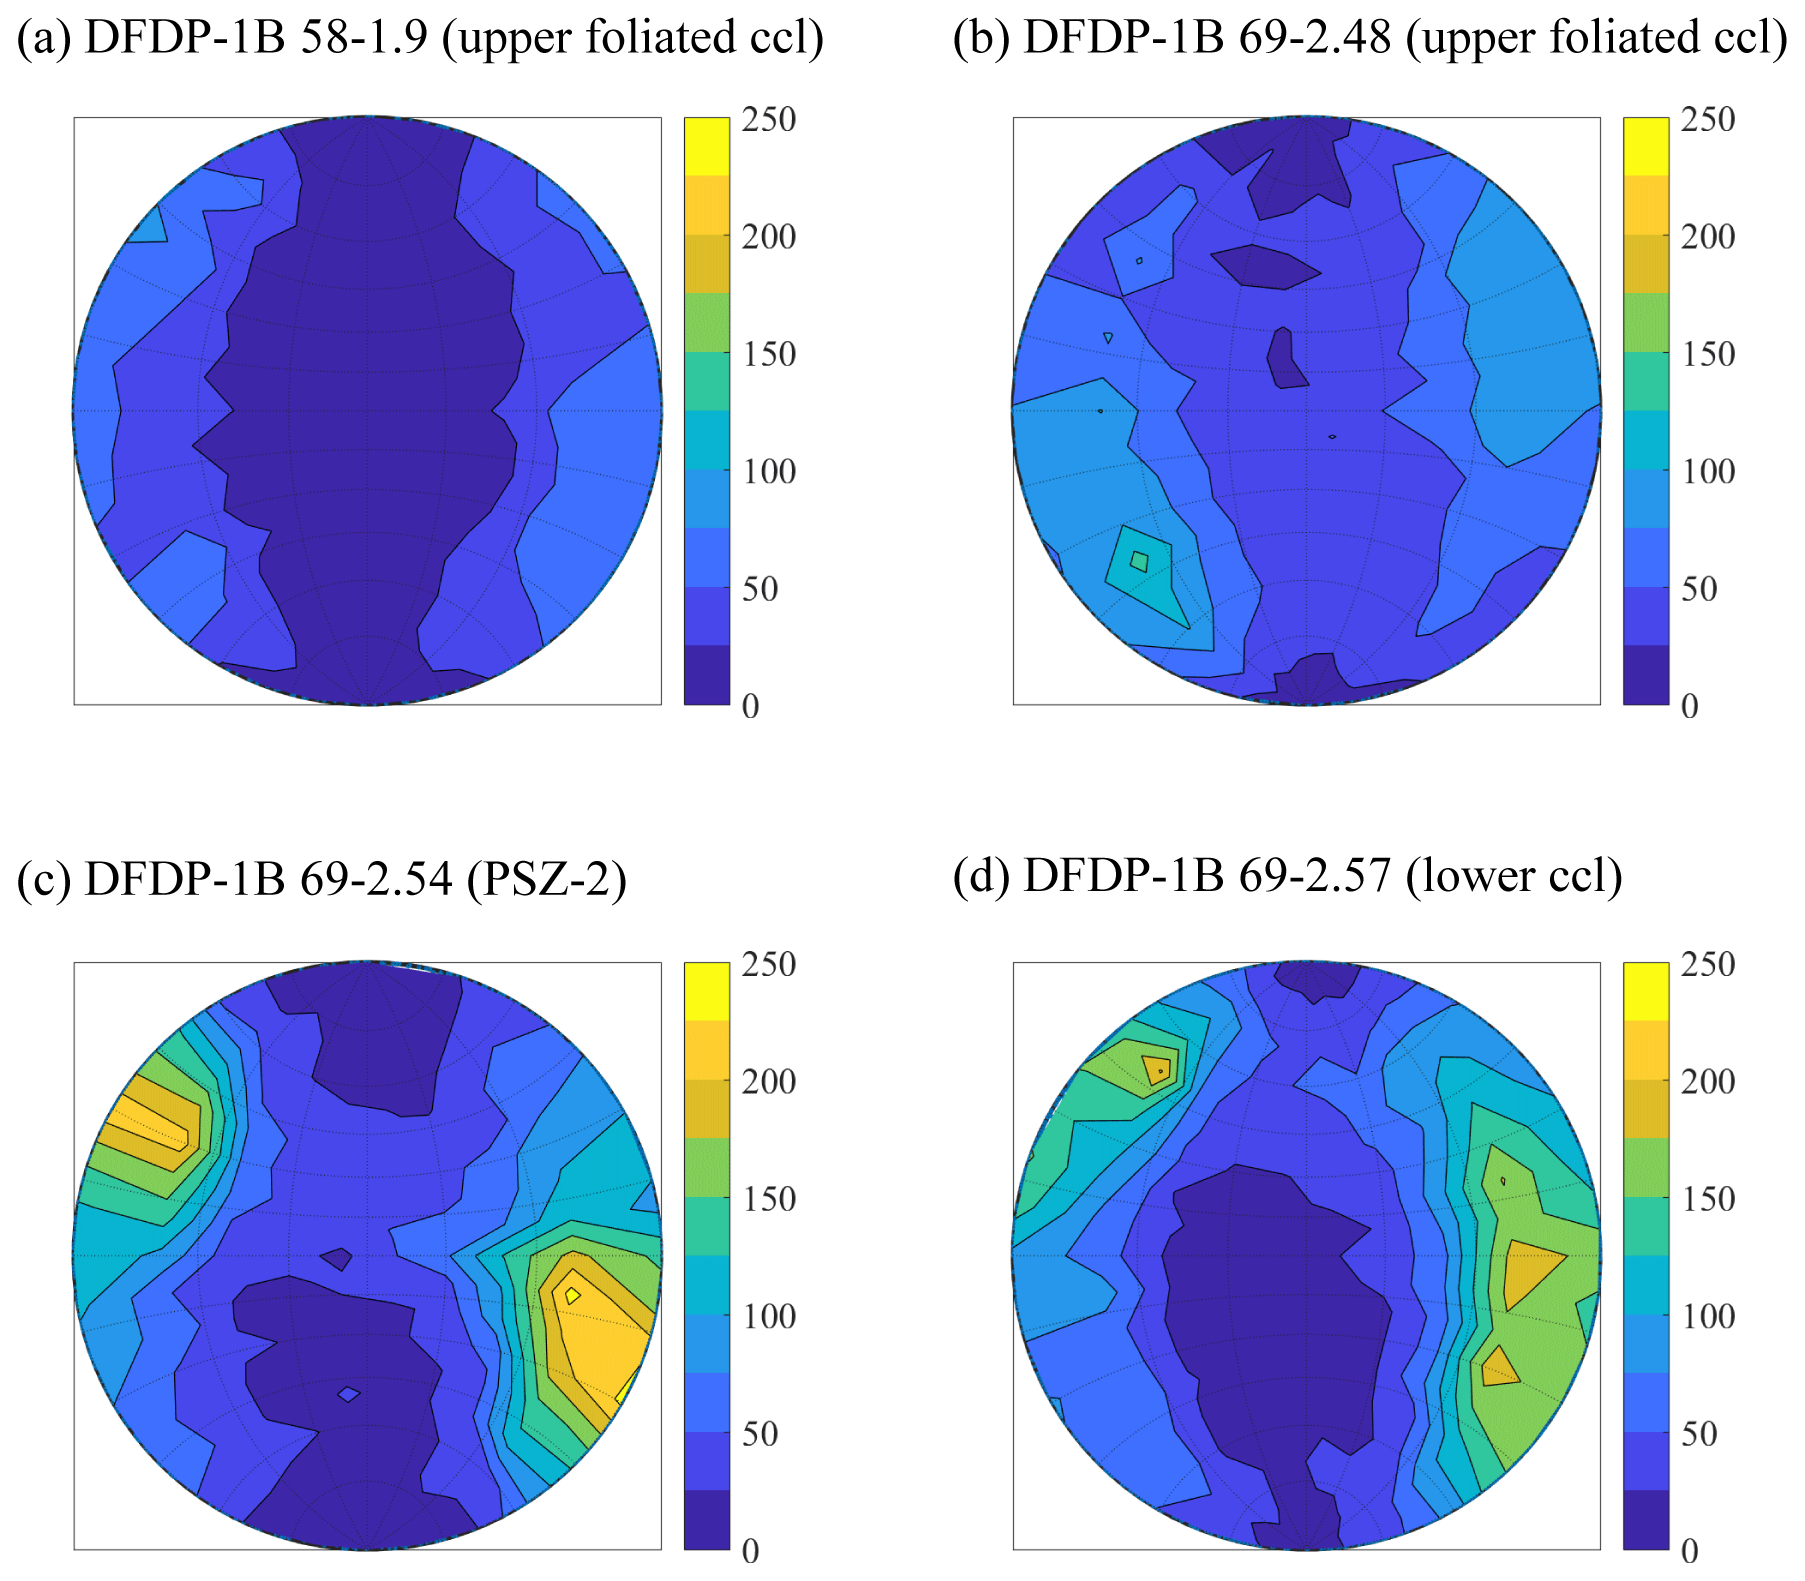
Figure 7Distribution of pore unit orientations plotted on a lower-hemisphere equal-area stereographic projection with a probability density contour.
3.4 Scanning electron microscopy (SEM)
SEM images were collected on Zeiss Sigma-FF-SEM at the University of Otago's Centre for Electron Microscopy. The SEM was operated at a working distance of 8.5 mm, an accelerating voltage of 10 keV, and a 120 µm aperture with a dwell time of 100 µs. EDS maps were created by using the Aztec Software (https://www.oxford-instruments.com/products/microanalysis/energy-dispersive-x-ray-systems-eds-edx/eds-for-sem/eds-software-aztec, last access: 30 November 2020).
3.5 Transmission electron microscopy (TEM)
TEM images were collected on a FEI Tecnai G2 F20 X-Twin transmission electron microscope, located at the German Research Centre for Geosciences (GFZ), Potsdam, Germany (Fig. 9). The instrument is equipped with a field-emission gun (FEG) electron source and a high-angle annular dark-field (HAADF) detector. Images were collected from samples placed on a Gatan double-tilt holder at an accelerating voltage of 200 kV. These TEM samples were prepared by focused ion beam (FIB) milling at GFZ Potsdam using a HELIOS system operated at an accelerating voltage of 30 kV.
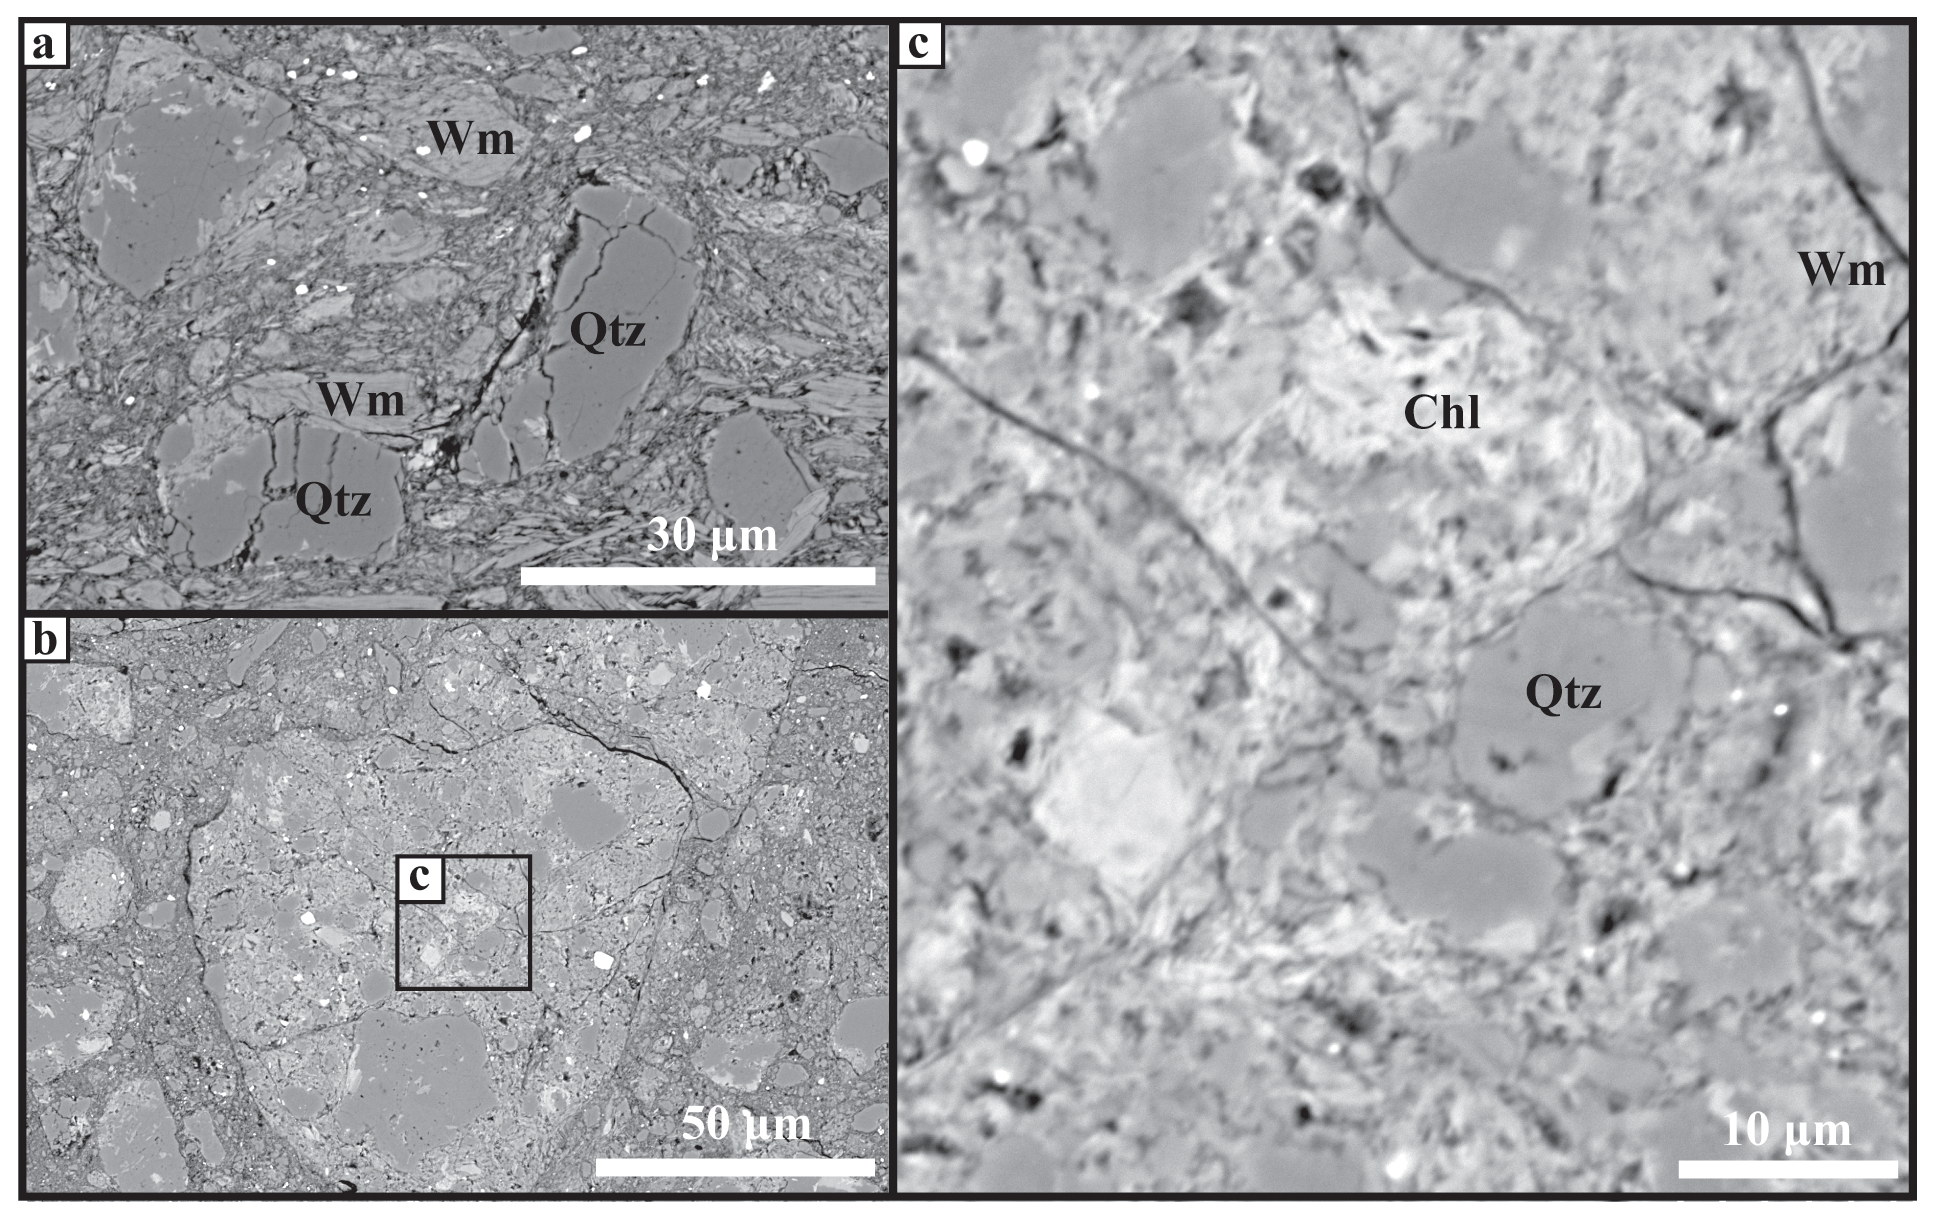
Figure 8Scanning electron images collected from sample DFDP 1B 69_2.48 showing the existing mineral associations. (a) Subrounded and intensely fractured quartz and white mica clasts, within fine matrix material. (b) Reworked cataclasite clasts in phyllosilicate-rich matrix. (c) Fine chlorite and white mica aggregates between quartz clasts. (Qtz: quartz; Wm: white mica; Chl: chlorite.)
4.1 XCT-derived characteristics of porosity
All samples contain low total porosities, ranging from 0.1 % to 0.24 % (Fig. 3). If different segmentation techniques were applied, a variability in the range that Andrew (2018) demonstrated would be reasonable (from nearly 0 % to 20 %) and would correspond to porosities between 0.08 % and 0.29 % in our samples. It can be noted that the lower-cataclasite sample (DFDP-1B 69_2.57) has twice as much pore space (Fig. 3d) as any of the other samples. The characterized pore volume distributions range over almost 3 orders of magnitude for all samples (Fig. 3). Furthermore, the expected maximum pore volume was estimated to be largest in the PSZ-2 sample (DFDP-1B 69_2.54), reaching 862 µm3 (Fig. 3c).
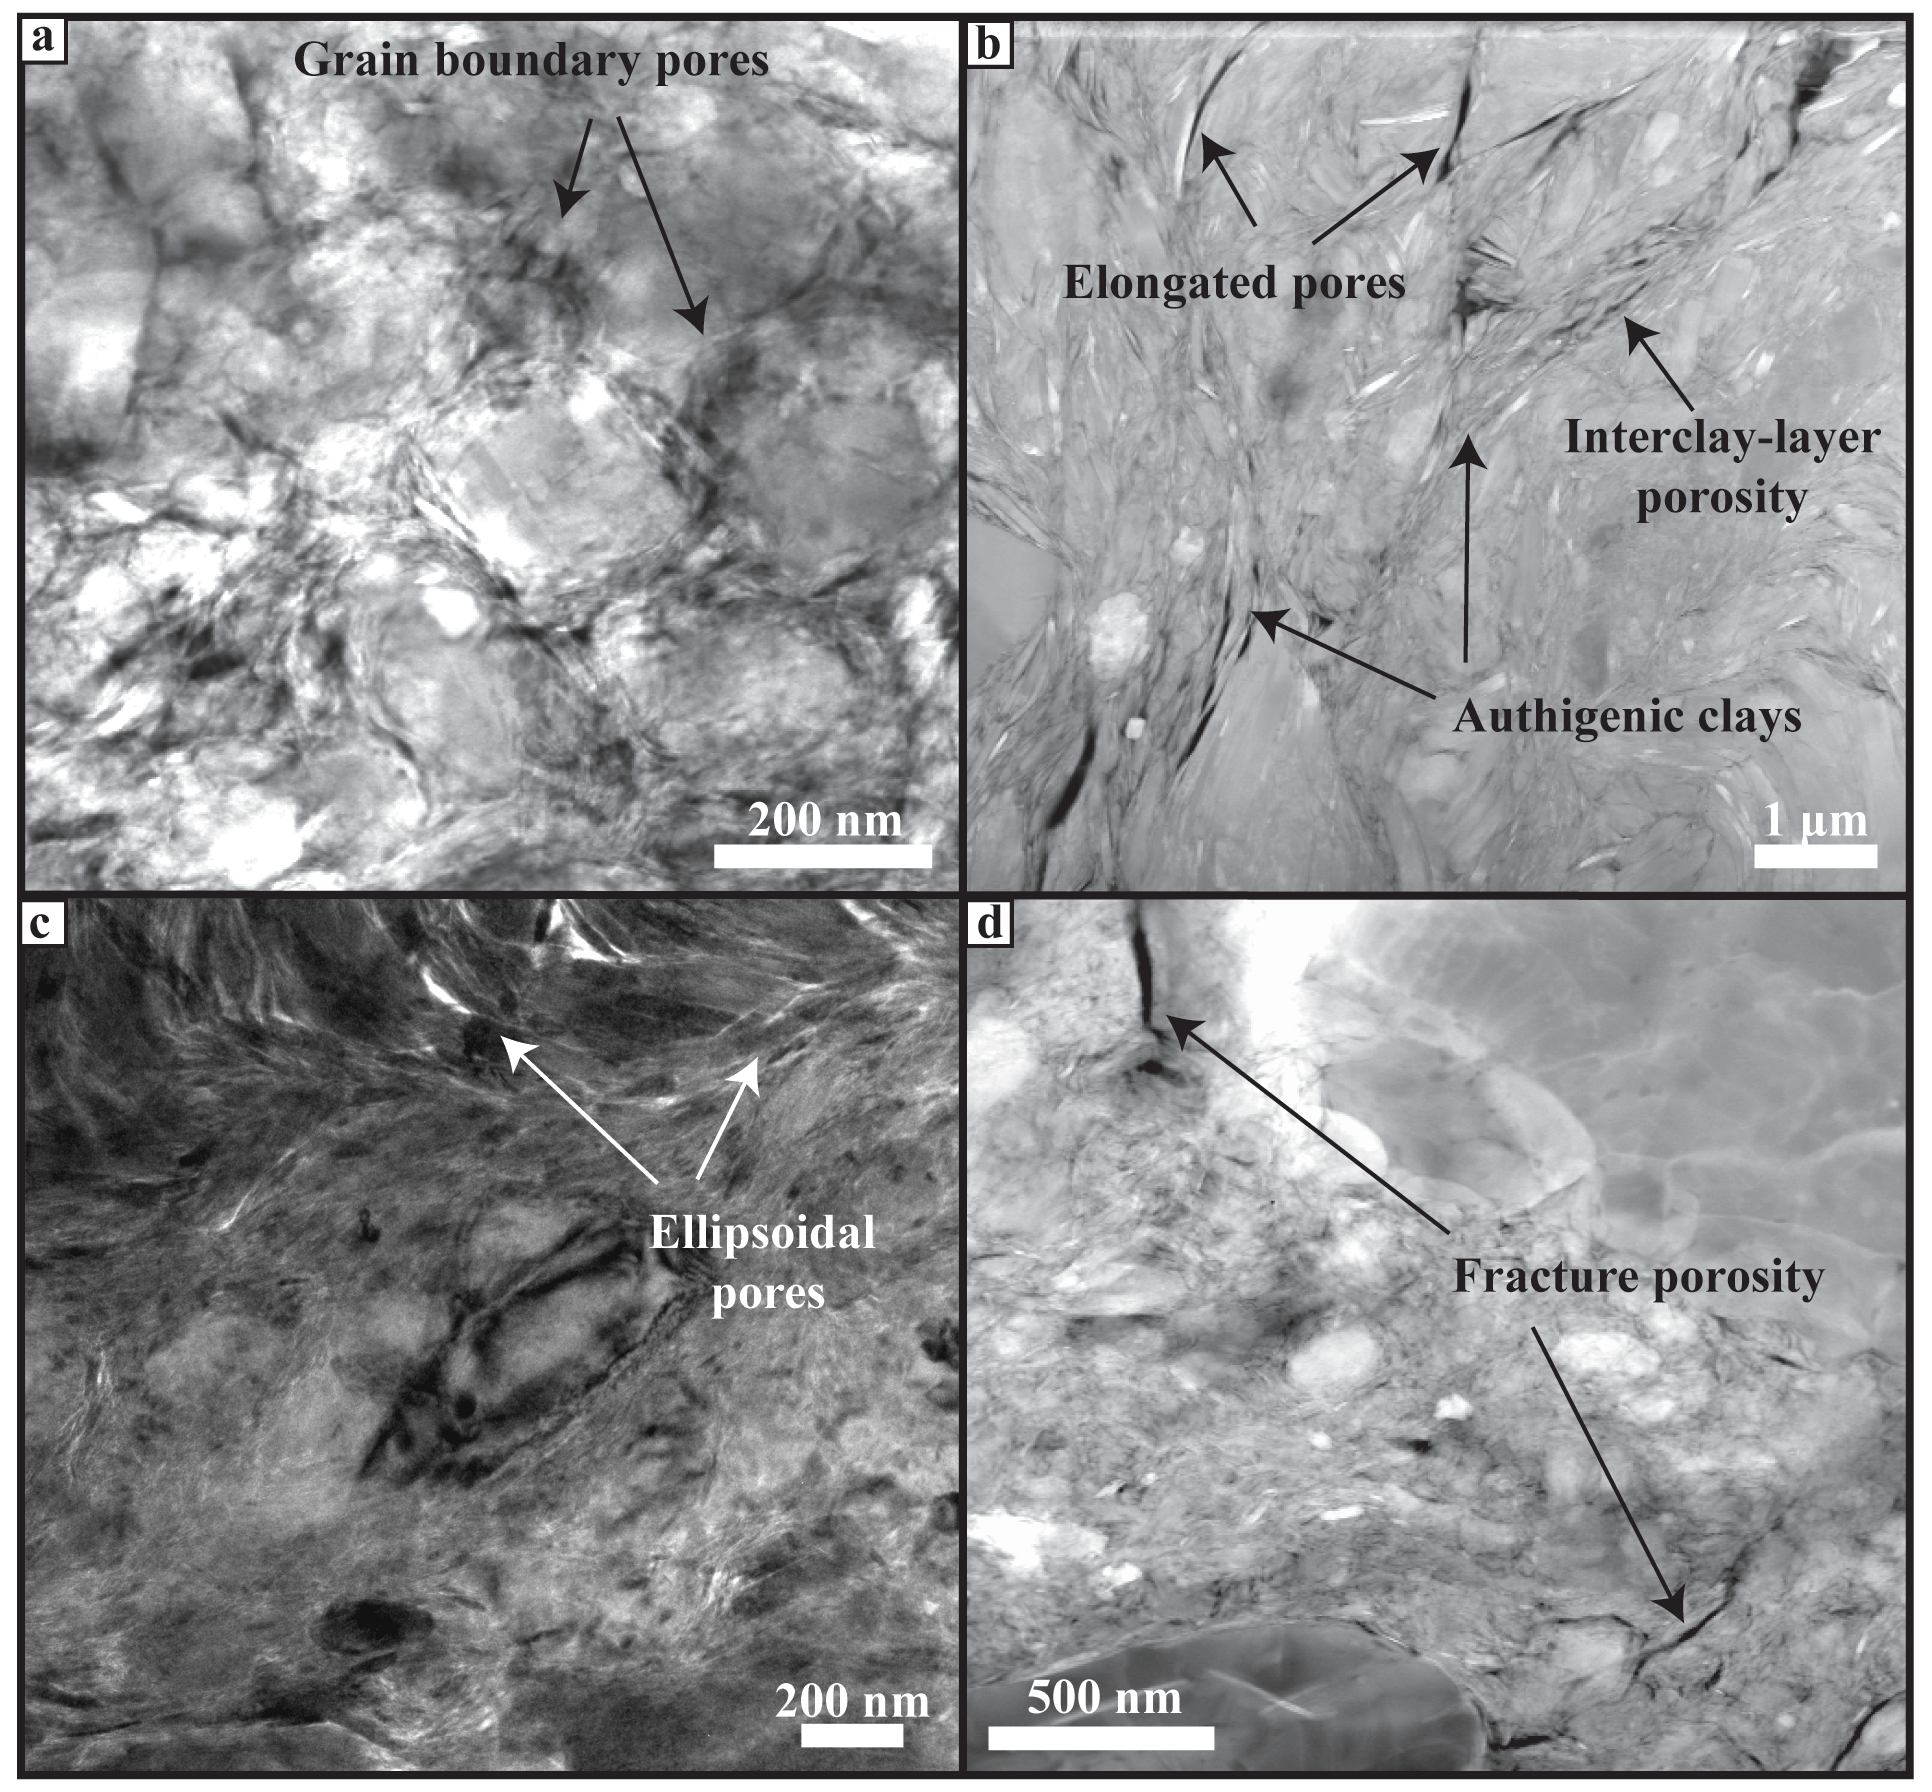
Figure 9Transmission electron microscopy images collected from the gouge sample DFDP-1B 69_2.54 (PSZ-2). Panels (a) and (c) are bright-field (BF) images, where porosity appears as bright contrast areas. Panels (b) and (d) are high-angle annular dark-field (HAADF) images, where pores appear as dark contrasts areas. (a) TEM bright-field image of homogeneous fault gouge area. Quartz–feldspar grains, wrapped by fine authigenic clays, displaying fringe morphologies. Pores with subangular shape distributed along grain boundaries. (b) HAADF image of phyllosilicate-rich gouge area. Coexistence of fine authigenic clays with coarser clay mineral grains. Elongated pores and interlayer porosity. (c) TEM bright-field image of ellipsoidal pores in phyllosilicate-rich areas. Examples of strain shadows along quartz–feldspar grains. (d) HAADF image of fracture porosity along grain boundaries of quartz–feldspar grains.
In all samples, shape analyses of pores with volumes between 21.97 µm3 (10 voxels) and 878.8 µm3 (400 voxels) demonstrate predominantly elongated (Fig. 4), non-spherical (Fig. 5), and flat pore shapes (Fig. 6). This is particularly pronounced for the smaller pore volumes. The number of elongated pores per sample increases in the upper foliated cataclasites (Fig. 4a and b) with increasing proximity to PSZ-2, where most elongated pores occur (Fig. 4c). Conversely, the lower-cataclasite sample demonstrates proportionally fewer elongated pores within the sample (Fig. 4d). The degree of sphericity is uniform for all samples, and pores appear as mainly non-spherical (Fig. 5). A few isolated spherical pores are manifested only by small pore volumes (Fig. 5). A trend of increasing the number of flat pores is observed with increasing sample depth (Fig. 6), and most flat pores are detected in the lower cataclasite (Fig. 6d).
The orientations of the individual pore units show two distinctive peaks with opposite vergence, defining bipolar distributions of pore orientations (Fig. 7). The observed bipolarity is subtle in samples DFDP-1B 58_1.9 (Fig. 7a) and DFDP-1B 69_2.48 (Fig. 7b) and more obvious in samples DFDP-1B 69_2.54 (Fig. 7c) and DFDP-1B 69_2.57 (Fig. 7d).
4.2 Microstructural characteristics of porosity
To demonstrate the microstructural arrangement of the cataclasites, we show representative SEM images from sample DFDP-1B 69_248 (Fig. 8), previously described as a “lower foliated cataclasite” by Toy et al., 2015. SEM images presented here reveal rounded to subrounded crystalline clasts up to 100 µm in diameter (Fig. 8a, b), which consist of ∼50 % plagioclase, ∼40 % K-feldspar, and ∼10 % quartz and are elongated at angles of 0–30∘ to the foliation. The surrounding matrix material is composed of finer grains (<30 µm in diameter) of white micas, chlorite, K-feldspar, calcite, and Ti oxide (Fig. 8c). Numerous quartz clasts contain microfractures, filled by calcite and/or chlorite.
TEM characterization of the gouge material from PSZ-2 (sample DFDP-1B 69_2.54) reveals that the Alpine Fault gouges are composed of angular quartz and/or feldspar fragments (∼200 nm in size), wrapped by smaller phyllosilicates (<100 nm long). This random fabric is ornamented by nanoscale pores (<50 nm), distributed along all grain and phase boundaries but especially abundant within or around clay minerals (Fig. 9a).
The gouge material also demonstrates phyllosilicate-rich areas, defined by an increase in the clay∕clast ratio. In these zones, fine (<100 nm long) and coarser (few µm long) clay grains coexist and are aligned in wavy fabric that surrounds sporadic protolith fragments (Fig. 9b). Pore spaces are again distributed along the boundaries of the constituent mineral grains, but some of them are larger (∼0.5 µm) with thin ellipsoidal or elongated shapes (Fig. 9b, c). These pores are commonly associated with inter-clay-layer porosity. Large size pores are also observed along quartz–feldspar phase boundaries. These latter pores are associated with multiple grains and occasionally disrupt the boundaries and, thus, were labeled as fracture porosity (Fig. 9d).
5.1 Characteristics of porosity within the Alpine Fault core
Porosity analyses of samples from or in close proximity to the two PSZs encountered in the DFDP-1B drill core reveal total pore volumes between 0.1 % and 0.24 % (Fig. 3). These values are significantly lower than the porosity estimates from other active faults in the world, such as 0.2 to 5.7 % total porosity in the core of the Nojima Fault, Japan (Surma et al., 2003) and 0 % to 18 % in the San Andreas Fault core (Blackburn et al., 2009). The Alpine Fault core contains total pore space volumes comparable only with the lower porosities in these previous studies. It should be noted that the smallest pore spaces captured in the XCT datasets are 1.3 µm in size due to acquisition constraints, whereas nanoscale porosity was identified on the TEM images. Therefore, the estimated total porosities from XCT data represent only minimum values of the open pore spaces in the Alpine Fault core. TEM images presented here mainly focus on nanoscale materials (Fig. 9a, c, d) but were also used to describe the distribution of micro-porosity in these rocks (Fig. 9b). The pores visible on grain and phase boundaries in Fig. 9b have similar sizes to the pores segmented on XCT images (>1.3 µm in diameter); thus we conclude that this is the typical habit of both nano- and micro-pores within the Alpine Fault core (Fig. 9). In addition, both quantitative micro-porosity shape analyses (Figs. 4, 5, and 6) and nano-pores identified on TEM images (Fig. 9) reveal that a significant population of pores is predominantly non-spherical with elongated, flat shapes. We attribute this observation to the tendency of these pores to ornament clay minerals where pores are distributed and elongated along their (001) planes (Fig. 9b, c, and d).
Foliation in the upper cataclasites is defined by clay-sized phyllosilicates that become more abundant with proximity to the PSZ (Toy et al., 2015), where a weak clay fabric is developed (Schleicher et al., 2015). This gradual enrichment in clay minerals coincides with the subtle development of bipolar distributions of pore orientations with increasing sample depth (Fig. 7). This observation and the fact that pores are mainly distributed along grain boundaries of clays (Fig. 9) suggest that the distribution of clay minerals also controls pore orientations within the Alpine Fault core. Previously, the phyllosilicate foliation in the Alpine Fault cataclasites has been used to define shear direction (Toy et al., 2015). Thus, we speculate that pore orientations in these rocks are also systematically related to the kinematic framework of the shear zone. If these pores represent remnants of fluid channels, their spatial orientation is likely to reflect the fluid flow directions during deformation. To address this possibility more data for systematic analyses of pore orientations are needed.
5.2 Porosity reduction within the Alpine Fault core
The comparatively lower porosity estimates of the Alpine Fault core compared to other active faults (e.g., the Nojima Fault, Surma et al., 2003, and the San Andreas Fault, Blackburn et al., 2009) could be attributed to the fact that the Alpine Fault is late in its c. 300-year seismic cycle and the last seismic event occurred in 1717 (Cochran et al., 2017). Thus, we propose that the fault has almost completely sealed. Porosity of fault cores is believed to evolve during the seismic cycle, since fault rupture can cause porosities to increase up to 10 % (Marone et al., 1990), and subsequent healing mechanisms (such as mechanical compaction of the fault gouge and/or elimination of pore spaces within the fault core due to pressure solution processes) cause porosity to decrease over time (Sibson, 1990; Renard et al., 2000; Faulkner et al., 2010). SEM data presented here show that fine-grained chlorite and muscovite grains formed as a cement in the cataclastic matrix (Fig. 8c). Our TEM data reveal the abundance of newly precipitated authigenic clays, wrapped around coarser clay minerals (Fig. 9b). Furthermore, delicate clay minerals form fringe structures (Fig. 9a) and strain shadows (Fig. 9c) around larger quartz–feldspar grains. These microstructural observations demonstrate that pressure solution processes operated within these rocks (Toy et al., 2015).
Evidence for pressure solution processes has been previously documented in all units comprising the Alpine Fault core (Toy et al., 2015). Abundant precipitation of alteration minerals (Sutherland et al., 2012), calcite-filled intragranular and cross-cutting veins (Williams et al., 2017), and the occurrence of newly formed smectite clays (Schleicher et al., 2015) indicate extensive fluid–rock reactions. In addition, anastomosing networks of opaque minerals (such as graphite; Kirilova et al., 2017), which define foliation in the upper cataclasites (Toy et al., 2015), have been interpreted as being concentrated by pressure solution processes during aseismic creep (Toy et al., 2015; Gratier et al., 2011). The petrological characteristics of the Alpine Fault core lithologies indicate that solution transfer was likely the dominant mechanism for pore closure within these rocks.
Porosity estimates presented here are so low that presumably negligible variations in between samples can represent significant gradients in porosity. For example, the increase in total porosity in sample DFDP-1B 69–2.57 with only 0.14 % manifests itself as twice as many open pore spaces in comparison to the rest of the analyzed samples (Fig. 3). In addition, this is the only footwall sample analyzed here and, as already mentioned in Sect. 3.1, does not contain any gouge material. Post-rupture porosity reduction is known to operate 3 to 4 times faster within fine-grained fault gouges than in coarser-grained cataclasites (Walder and Nur, 1984; Sleep and Blanpied, 1992; Renard et al., 2000), which may explain the porosity differences demonstrated above. Furthermore, previous studies documented less carbonate and phyllosilicate filling of cracks in the Alpine Fault footwall cataclasites than in the hanging wall cataclasites (Sutherland et al., 2012; Toy et al., 2015), suggesting more reactive fluids are present and isolated within the hanging wall of the Alpine Fault. Thus, more intense dissolution–precipitation processes took place in the fault's hanging wall, which very likely resulted in more efficient porosity reduction, as demonstrated by our porosity estimates (Fig. 3).
5.3 Effects of porosity on the Alpine Fault strength
Very low-porosity estimates are presented here (Fig. 3). Very low permeabilities of 10−18 m2 were also measured experimentally in clay-rich cataclasites and gouges from the Alpine Fault zone (Carpenter et al., 2014). In addition, the documented difference in total porosities between the hanging wall and footwall samples (Fig. 3) may be interpreted as reflecting different intensities of pressure solution processes and thus compartmentalization of percolating fluids. Our porosity data show a spatial trend similar to the permeability measurements of Carpenter et al. (2014). This observation yields increased confidence in the interpretation of Carpenter et al. (2014) of a permeability gradient with distance from the PSZ, which itself acts as a hydraulic seal (Sutherland, et al., 2012). The existence of such a barrier to flow is characteristic of faults undergoing creep and locked faults (Rice, 1992; Labaume et al., 1997; Wiersberg and Erzinger, 2008). However, much higher permeabilities in the surrounding damaged rocks (Carpenter et al., 2014) allow fast propagation of fluids within them and can cause localization of high fluid pressures on one side or the other of a hydraulic seal (Sibson, 1990). Such fluid pressures can enhance gouge compaction and pressure solution processes, which will eventually introduce zones of weakness and thus may trigger fault slip (Faulkner et al., 2010).
Previous studies and the observations presented here show that fluids were present in the Alpine Fault rocks. Fluid-filled pores represent a favorable environment for mineral precipitation, which can affect the fault strength in two ways: (i) a very small decrease in these critically low total porosities due to mineral precipitation would cause fluid pressurization, which is a well-known fault-weakening mechanism described by Byerlee (1990) and Sibson (1990); however, this pressure increase could be slightly offset by the inclusion of fluids into new hydrous minerals; (ii) deposition of frictionally weak phases (such as clay minerals and graphite), especially if they decorate grain contacts and/or form interlinked weak layers, would lower the overall frictional strength (Rutter et al., 1976; Niemeijer et al., 2010).
Precipitated authigenic clay minerals were identified in our TEM data (Fig. 9) and also documented by previous studies (Schleicher et al., 2015). As well as having low frictional strengths (Moore and Lockner, 2004), clay minerals may also contribute to the formation of an impermeable seal if they form an aligned fabric, which can enhance the likelihood of fluid pressurization in the fault rocks (Rice, 1992; Faulkner et al., 2010). In addition, graphite, which was previously documented in these rocks (Kirilova et. al., 2017), may effectively weaken the fault due to mechanical smearing (Rutter et al., 2013) and/or localized precipitation within strained areas (Upton and Craw, 2008). Such graphite precipitation within shear surfaces was previously documented by Kirilova et al. (2017).
In summary, the presence of trapped fluids in the low-porosity rocks of the Alpine Fault core possibly controls the mechanical behavior of the fault and could be responsible for future rupture initiation due to fluid pressurization and/or precipitation of weak mineral phases. This hypothesis is further supported by an experimental study showing that the DFDP-1 gouges are frictionally strong in the absence of elevated fluid pressure (Boulton et al., 2014).
Analyses of XCT datasets and TEM images of borehole samples from the core of the Alpine Fault reveal micro- and nanoscale pores, distributed along grain boundaries of the constituent mineral phases, especially clay minerals. The tendency of these pores to ornament clays defines their predominantly non-spherical, elongated, flat shapes and the bipolar distribution of pore orientations. The documented extremely low total porosities (in the range 0.1 %–0.24 %) in these rocks suggest effective porosity reduction and fault healing. Microstructural observations presented here and documented in previous studies indicate that pressure solution processes were the dominant healing mechanism and that fluids were present in these rocks. Therefore, fluid-filled pores may be places where elevated pore fluid pressures develop, due to further mineral precipitation that decreases the already critically low total porosities. Alternatively, these pores may also facilitate the deposition of weak mineral phases (such as clay minerals and graphite) that may very effectively weaken the fault. We conclude that the current state of the fault core porosity is possibly a controlling factor in the mechanical behavior of the Alpine Fault and will likely play a key role in the initiation of the next fault rupture.
Avizo screenshots, total porosity estimates, Matlab script, and numerical data of pore volumes can be found in the Supplement.
The supplement related to this article is available online at: https://doi.org/10.5194/se-11-2425-2020-supplement.
MK reconstructed, processed, and analyzed the XCT datasets presented here, interpreted the TEM data, and prepared the paper. Most of this work was performed during MK's PhD under the academic guidance of VT. VT and KG collected the XCT data with technical support by XX. FR and KS contributed with valuable discussion about XCT data analyses and edited the paper. RW enabled TEM data acquisition and provided his expertise on TEM data interpretation. RM collected and analyzed the presented SEM data. The final version of this paper benefits from collective intellectual input.
The authors declare that they have no conflict of interest.
This research used resources of the Advanced Photon Source, a US Department of Energy (DOE) Office of Science User Facility operated for the DOE Office of Science by Argonne National Laboratory under Contract No. DE-AC02-06CH11357. We thank Sherry Mayo for helping with the reconstruction process of XCT data and Andrew Squelch for providing use of the Avizo workstation, located at CSIRO, Perth, Australia during the initial data analyses. Special thanks to Reed Debaets for assistance with the development of Matlab code. Klaus Gessner publishes with permission of the Executive Director, Geological Survey of Western Australia.
This research has been supported by the Advanced Photon Source, Chicago (grant no. GUP 31177), Nvidia Corporation, Royal Society of New Zealand’s Rutherford Fellowship (grant no. 16-UOO-001), the Ministry of Business and Innovation's Endeavor Fund, New Zealand (grant no. C05X1605/GNS-MBIE00056), the Tectonics and Structure of Zealandia Program at GNS Science (grant no. GNS-DCF00020), and publishing bursary funding provided by the University of Otago.
This open-access publication was funded
by Johannes Gutenberg University Mainz.
This paper was edited by Florian Fusseis and reviewed by James Gilgannon and Michel Bestmann.
Andrä, H., Combaret, N., Dvorkin, J., Glatt, E., Han, J., Kabel, M., Keehmd, Y., Krzikallac, F., Leed, M., Madonnae, C., Marshb, M., Mukerjic, T., Saengere, E. H., Sainf, R., Saxenac, N., Rickera, S., Wiegmanna, A., and Zhanf, X.: Digital rock physics benchmarks – Part I: Imaging and segmentation, Comput. Geosci., 50, 25–32, 2013.
Andrew, M.: A quantified study of segmentation techniques on synthetic geological XRM and FIB-SEM images, Comput. Geosci., 22, 1503–1512, 2018.
Berryman, K. R., Cochran, U. A., Clark, K. J., Biasi, G. P., Langridge, R. M., and Villamor, P.: Major earthquakes occur regularly on an isolated plate boundary fault, Science, 336, 1690–1693, 2012.
Blackburn, E. D., Hadizadeh, J., and Babaie, H. A.: A microstructural study of SAFOD gouge from actively creeping San Andreas Fault zone: Implications for shear localization models, in: AGU Fall Meeting Abstracts, 2009.
Boulton, C., Carpenter, B. M., Toy, V., and Marone, C.: Physical properties of surface outcrop cataclastic fault rocks, Alpine Fault, New Zealand, Geochem. Geophy. Geosy., 13, Q01018, https://doi.org/10.1029/2011GC003872, 2012.
Boulton, C., Moore, D. E., Lockner, D. A., Toy, V. G., Townend, J., and Sutherland, R.: Frictional properties of exhumed fault gouges in DFDP-1 cores, Alpine Fault, New Zealand, Geophys. Res. Lett., 41, 356–362, 2014.
Buades, A., Coll, B., and Morel, J. M.: A non-local algorithm for image denoising, Computer Vision and Pattern Recognition, IEEE Comput. Soc. Conf., 2, 60–65, 2005.
Byerlee, J.: Friction, overpressure and fault normal compression, Geophys. Res. Lett., 17, 2109–2112, 1990.
Carpenter, B. M., Kitajima, H., Sutherland, R., Townend, J., Toy, V. G., and Saffer, D. M.: Hydraulic and acoustic properties of the active Alpine Fault, New Zealand: Laboratory measurements on DFDP-1 drill core, Earth Planet. Sc. Lett., 390, 45–51, 2014.
Cochran, U. A., Clark, K. J., Howarth, J. D., Biasi, G. P., Langridge, R. M., Villamor, P., Berryman, K. R., and Vandergoes, M. J.: A plate boundary earthquake record from a wetland adjacent to the Alpine fault in New Zealand refines hazard estimates, Earth Planet. Sc. Lett., 464, 175–188, 2017.
Faulkner, D. R., Jackson, C. A. L., Lunn, R. J., Schlische, R. W., Shipton, Z. K., Wibberley, C. A. J., and Withjack, M. O.: A review of recent developments concerning the structure, mechanics and fluid flow properties of fault zones, J. Struct. Geol., 32., 1557–1575, 2010.
Fusseis, F., Xiao, X., Schrank, C., and De Carlo, F.: A brief guide to synchrotron radiation-based microtomography in (structural) geology and rock mechanics, J. Struct. Geol., 65, 1–16, 2014.
Girault, F., Adhikari, L. B., France-Lanord, C., Agrinier, P., Koirala, B. P., Bhattarai, M., and Perrier, F.: Persistent CO2 emissions and hydrothermal unrest following the 2015 earthquake in Nepal, Nat. Commun., 9, 2956, https://doi.org/10.1038/s41467-018-05138-z, 2018.
Gratier, J. P. and Gueydan, F.: Effect of Fracturing and Fluid–Rock Interaction on Seismic Cycles, Tectonic Faults: Agents of Change on a Dynamic Earth, 95, 319e356, https://doi.org/10.7551/mitpress/6703.001.0001, 2007.
Gratier, J.-P., Favreau, P., and Renard, F.: Modelling fluid transfer along California faults when integrating pressure solution crack sealing and compaction processes, J. Geophys. Res., 108, 2104, https://doi.org/10.1029/2001JB000380, B2, 2003.
Gratier, J. P.: Fault permeability and strength evolution related to fracturing and healing episodic processes (years to millennia): the role of pressure solution, Oil and Gas Science and Technology – Revue d'IFP Energies nouvelles, 66, 491–506, 2011.
Gureyev, T. E., Nesterets, Y., Ternovski, D., Wilkins, S. W., Stevenson, A. W., Sakellariou, A., and Taylor, J. A.: Toolbox for advanced x-ray image processing, in Advances in Computational Methods for X-Ray Optics II edited by: Sanchez del Rio, M., Chubar, O., Advances in Computational Methods for X-Ray Optics II, San Diego, USA, 21–25 August 2011, SPIE – The International Society of Optics and Photonics 8141, 2011.
Iassonov, P., Gebrenegus, T., and Tuller, M.: Segmentation of X-ray computed tomography images of porous materials: A crucial step for characterization and quantitative analysis of pore structures. Water Resour. Res., 45, W09415, https://doi.org/10.1029/2009WR008087, 2009.
Janssen, C., Wirth, R., Reinicke, A., Rybacki, E., Naumann, R., Wenk, H. R., and Dresen, G.: Nanoscale porosity in SAFOD core samples (San Andreas Fault), Earth Planet Sc. Lett., 301, 179–189, 2011.
Hapca, S. M., Houston, A. N., Otten, W., and Baveye, P. C.: New local thresholding method for soil images by minimizing grayscale intra-class variance, Vadose Zone J., 12, vzj2012.0172, doi10.2136/vzj2012.0172, 2013.
Labaume, P., Maltman, A.J., Bolton, A., Teissier, D., Ogawa, Y., and Takizawa, S.: Scaly fabrics in sheared clays from the décollement zone of the Barbados accretionary prism, in: Proc. ODP, Sci. Results, 156: College Station, edited by: Shipley, T. H., Ogawa, Y., Blum, P., and Bahr, J. M., , TX (Ocean Drilling Program), 59–77, https://doi.org/10.2973/odp.proc.sr.156.013, 1997.
Kirilova, M., Toy, V. G., Timms, N., Halfpenny, A., Menzies, C., Craw, D., Beyssac, O., Sutherland, R., Townend, J., Boulton, C., Carpenter, B., Cooper, A., Grieve, J., Little, T., Morales, L., Morgan, C., Mori, H., Sauer, K., Schleicher, A., Williams, J., and Craw, L.: Textural changes of graphitic carbon by tectonic and hydrothermal processes in an active plate boundary fault zone, Alpine Fault, New Zealand, Geological Society, London, Special Publications, 453, SP453-13, 2017.
Ma, X., Kittikunakorn, N., Sorman, B., Xi, H., Chen, A., Marsh, M., Mongeau, A., Piché, N., WilliamsIII, E. O., and Skomski, D.: Application of Deep Learning Convolutional Neural Networks for Internal Tablet Defect Detection: High Accuracy, Throughput, and Adaptability, J. Pharm. Sci., 109, 1447–1457, 2020.
Macente, A., Vanorio, T., Miller, K. J., Fusseis, F., and Butler, I. B.: Dynamic Evolution of Permeability in Response to Chemo-Mechanical Compaction, J. Geophys. Res.-Sol. Ea., 124, 11204–11217, 2019.
Marone, C., Raleigh, C. B., and Scholz, C. H.: Frictional behavior and constitutive modeling of simulated fault gouge, J. Geophys. Res.-Sol. Ea., 95, 7007–7025, 1990.
Niemeijer, A., Marone, C., and Elsworth, D.: Fabric induced weakness of tectonic faults, Geophys. Res. Lett., 37, L03304, https://doi.org/10.1029/2009GL041689, 2010.
Norris, R. J. and Cooper, A. F.: Origin of small-scale segmentation and transpressional thrusting along the Alpine fault, New Zealand, Geol. Soc. Am. Bull., 107, 231–240, 1995.
Norris, R. J. and Cooper, A. F.: Late Quaternary slip rates and slip partitioning on the Alpine Fault, New Zealand, J. Struct. Geol., 23, 507–520, 2001.
Norris, R. J. and Toy, V. G.: Continental transforms: A view from the Alpine Fault, J. Struct. Geol., 64, 3–31, 2014.
Renard, F., Gratier, J. P., and Jamtveit, B.: Kinetics of crack-sealing, intergranular pressure solution, and compaction around active faults, J. Struct. Geol., 22, 1395–1407, 2000.
Renard, F., McBeck, J., Cordonnier, B., Zheng, X., Kandula, N., Sanchez, J. R., Kobchenko, M., Noiriel, C., Zhu, W., Meakin, P., Fusseis, F., and Dag K. Dysthe: Dynamic in situ three-dimensional imaging and digital volume correlation analysis to quantify strain localization and fracture coalescence in sandstone, Pure Appl. Geophys., 176, 1083–1115, 2019.
Rice, J. R.: Fault stress states, pore pressure distributions, and the weakness of the San Andreas fault, Int. Geophys., 51, 475–503, 1992.
Rutter, E. H. and Elliott, D.: The kinetics of rock deformation by pressure solution, Philos. T. R. Soc. A, 283, 203–219, 1976.
Rutter, E. H., Hackston, A. J., Yeatman, E., Brodie, K. H., Mecklenburgh, J., and May, S. E.: Reduction of friction on geological faults by weak-phase smearing, J. Struct. Geol., 51, 52–60, 2013.
Schleicher, A. M., Sutherland, R., Townend, J., Toy, V. G., and Van Der Pluijm, B. A.: Clay mineral formation and fabric development in the DFDP-1B borehole, central Alpine Fault, New Zealand, New Zeal. J. Geol. Geop., 58, 13–21, 2015.
Schuck, B., Schleicher, A. M., Janssen, C., Toy, V. G., and Dresen, G.: Fault zone architecture of a large plate-bounding strike-slip fault: a case study from the Alpine Fault, New Zealand, Solid Earth, 11, 95–124, https://doi.org/10.5194/se-11-95-2020, 2020.
Sibson, R. H.: Conditions for fault-valve behaviour, Geol. Soc. Spec. Publ., 54, 15–28, 1990.
Sleep, N. H. and Blanpied, M. L.: Creep, compaction and the weak rheology of major faults, Nature, 359, 687–692, 1992.
Surma, F., Géraud, Y., and Pezard, P.: Porosity network of the Nojima fault zone in the Hirabayashi hole (Japan), in: EGS-AGU-EUG Joint Assembly, 2003.
Sutherland, R., Eberhart-Phillips, D., Harris, R. A., Stern, T., Beavan, J., Ellis, S Henrys, S., Cox, S., Norris, R. J., Berryman, K. R., and Townend, J.: Do great earthquakes occur on the Alpine fault in central South Island, New Zealand?, in: A continental plate boundary: tectonics at South Island, New Zealand, Geophysical Monograph, American Geophysical Union, 235–251, 2007.
Sutherland, R., Toy, V. G., Townend, J., Cox, S. C., Eccles, J. D., Faulkner, D. R Prior, D. J., Norris, R. J., Mariani, E., Boulton, C., and Carpenter, B. M.: Drilling reveals fluid control on architecture and rupture of the Alpine fault, New Zealand, Geology, 40, 1143–1146, 2012.
Sutherland, R., Townend, J., Toy, V., Upton, P., Coussens, J., Allen, M., and Boles, A.: Extreme hydrothermal conditions at an active plate-bounding fault, Nature, 546, 137–140, https://doi.org/10.1038/nature22355, 2017.
Toy, V. G., Boulton, C. J., Sutherland, R., Townend, J., Norris, R. J., Little, T. A., and Scott, H.: Fault rock lithologies and architecture of the central Alpine fault, New Zealand, revealed by DFDP-1 drilling, Lithosphere, L395-1, https://doi.org/10.1130/L395.1, 2015.
Toy, V. G, Sutherland, R., Townend, J., Allen, M. J., Becroft, L., Boles, A., Boulton, C., Carpenter B., Cooper, A., Cox, S. C., Daube, D., Faulkner, D. R., Halfpenny, A., Kato, N., Keys, S., Kirilova, M., Kometani, Y., Little, T., Mariani, E., Melosh, B., Menzies, C. D., Morales, L., Morgan, C., Mori, H., Niemeijer, A., Norris, R., Prior, D., Sauer, K., Schleicher, A. M., Shigematsu, N., Teagle, D. A. H., Tobin, H., Valdez, R., Williams, J., Yeo, S., Baratin, L., Barth, N., Benson, A., Boese, C., Célérier, B., Chamberlain, C. J., Conze, R., Coussens, J., Craw, L., Doan, M., Eccles, J., Grieve, J., Grochowski, J., Gulley, A., Howarth, J., Jacobs, K., Capova, L., Jeppson, T, Langridge, R., Mallyon, D., Marx, R., Massiot, C., Mathewson, L., Moore, J., Nishikawa, O., Pooley, B, Pyne, A., Savage, M.K., Schmitt, D., Offord, S., Upton, P., Weaver, K. C., Wiersberg, T., Zimmer, M., and DFDP-2 Science Team: Bedrock Geology of DFDP-2B, Central Alpine Fault, New Zealand, New Zeal. J. Geol. Geop., 60, 497–518, 2017.
Upton P. and Craw D.: Modelling the role of graphite in development of a mineralised mid-crustal shear zone, Macraes mine, New Zealand, Earth Planet. Sc. Lett., 266, 245–255, 2008.
Walder, J. and Nur, A.: Porosity reduction and crustal pore pressure development, J. Geophys. Res.-Sol. Ea., 89, 11539–11548, 1984.
Wiersberg, T. and Erzinger, J.: Origin and spatial distribution of gas at seismogenic depths of the San Andreas Fault from drill-mud gas analysis, Appl. Geochem., 23, 1675–1690, 2008.
Williams, J. N., Toy, V. G., Smith, S. A., and Boulton, C.: Fracturing, fluid-rock interaction and mineralisation during the seismic cycle along the Alpine Fault, J. Struct. Geol., 103, 151–166, 2017.
Zhu, W., Allison, K. L., Dunham, E. M., and Yang, Y.: Fault valving and pore pressure evolution in simulations of earthquake sequences and aseismic slip, Nat. Commun., 11, 4833, https://doi.org/10.1038/s41467-020-18598-z, 2020.