the Creative Commons Attribution 4.0 License.
the Creative Commons Attribution 4.0 License.
 | 09 Apr 2020
Abutting faults: a case study of the evolution of strain at Courthouse branch point, Moab Fault, Utah
Heijn van Gent
Janos L. Urai
Slip planes and slip directions of subsequent generations of faults were measured and analysed in the interaction damage zone of two abutting faults in porous sandstones in order to understand the palaeostress/palaeostrain evolution.
The Courthouse branch point of the Moab Fault in SE Utah (USA) is a much-studied, spectacular outcrop of two abutting faults, located in the footwall block of the main fault and in the hanging wall block of the abutting fault. The abutting fault is synthetic to the main fault. The outcrop shows a wide range of deformation structures and fault-related diagenesis such as striated slip planes, deformation bands, veins, Liesegang bands and copper-rich mineralization.
By combining our own measurements with published data on the relative age of these structures, we classified the data in four sets. Using a Numeric Dynamic Analysis (NDA) to calculate the orientation of the kinematic axes we found three different palaeo-extension directions in the four sets, recording the evolution of stress/strain axes during the abutting process.
The first phase of deformation is regional extension in the NE–SW direction. As the second fault approached the main fault from its footwall side and the two faults started to become kinematically linked, the extension direction changed so that the overall extension became perpendicular to the approaching fault (NW–SE). Finally, the extension direction changed back to being perpendicular to the first segment (NE–SW) when the two faults became geometrically linked and regional extension became dominant again.
- Article
(14642 KB) - Full-text XML
- BibTeX
- EndNote


Damage zones can extend from tens to hundreds of metres away from the fault core, and their evolution in porous sandstones has been the subject of numerous studies (see for example, Aydin and Johnson, 1978; Cartwright et al., 1995; Shipton and Evans, 2002; Shipton and Cowie, 2003; Davatzes and Aydin, 2003; Davatzes et al., 2003, 2005; Crider and Peacock, 2004; Kim et al., 2004; Johansen et al., 2005; Fossen, 2010; Soliva et al., 2016; and Peacock et al., 2017a, b).
Although at the regional scale the stress field and kinematics of extensional tectonics are well established (Anderson, 1951), less is known of the interaction of faults at the local scale (Walsh and Watterson, 1991; Peacock, 2002; Nicol et al., 2010; Duffy et al., 2015; Delogkos et al., 2017; Peacock et al., 2017a), though this is where damage zones and the associated flow of geofluids are most important (Walsh et al., 1998; Lonergan, 2007; Rotevatn et al., 2009a; Yale, 2003; Eichhubl et al., 2009; Duffy, 2015).
Peacock et al. (2017a, b) suggested that flow was already affected in the “interaction damage zone” as the faults approached each other before becoming kinematically linked. The partitioning of strain at this scale can compartmentalize reservoirs or provide conduits for fluid flow, depending on the mode of failure (Aydin and Johnson, 1978; Ingram and Urai, 1999; Johansen et al., 2005; Rotevatn et al., 2007; Bozkurt Çiftçi and Bozkurt, 2007; Urai et al., 2008; Eichhubl et al., 2009; Ferrill et al., 2009; Rotevatn et al., 2009b; van Gent et al., 2010a, Vrolijk et al., 2016, Kettermann and Urai, 2015). In this study we focus on the evolution in the stress and strain field in a single-tip fault interaction (Fossen et al., 2005), in which one fault grows towards another. Peacock et al. (2017a) called this an “abutting fault interaction”, where the synchronously growing abutting fault is synthetic to the main fault until the two faults become hard linked and slip together, without crosscutting.
We use the orientation and slip direction of subsequent generations of minor faults as input for palaeostress and palaeostrain analysis. We document changes in the extension direction and related local stress field over time, which we correlate with the transition from isolated faults, (stage i), through interacting, kinematically linked faults, (stage ii), to geometrically linked abutting faults, (stage iii). Understanding the stress and strain evolution of such a structure is a key step towards understanding the fluid pathways in the subsurface.
Peacock et al. (2017a) described the interaction of abutting faults as a continuous process in a regional stress field with three evolutionary stages. First the faults are far from each other and do not interact. The faults start to interact as they approach each other and become kinematically linked. Interaction can be indicated by deformation structures in the acute bisector. In the final stage the approaching fault abuts to the main fault, and they become geometrically linked along a branch line. From this point on, both faults slip parallel to this line; the faults become hard linked.
1.1 Regional geology
The study area is located on the Colorado Plateau near Moab, Utah (USA), where evaporites of the Paradox Formation were deposited on basement in the Carboniferous (Doelling, 2002; Nuccio and Condon, 1996; Foxford et al., 1996). The Lower Jurassic aeolian Navajo sandstone is overlain by the Middle Jurassic Dewey Bridge Member, a calcareous, medium- to fine-grained sandstone. The Slick Rock Member is a part of the Middle Jurassic Entrada Fm. This is a reddish to orange, fine-grained and cross-bedded aeolian sandstone, which is overlain by the greyish-yellow sandstones of the Moab Member (Curtis Fm.). Directly overlying the Moab Member is the Late Jurassic terrestrial Morrison formation, consisting of siltstones, fine-grained sandstones, nodular limestones and conglomerates, with occasional dinosaur bones.
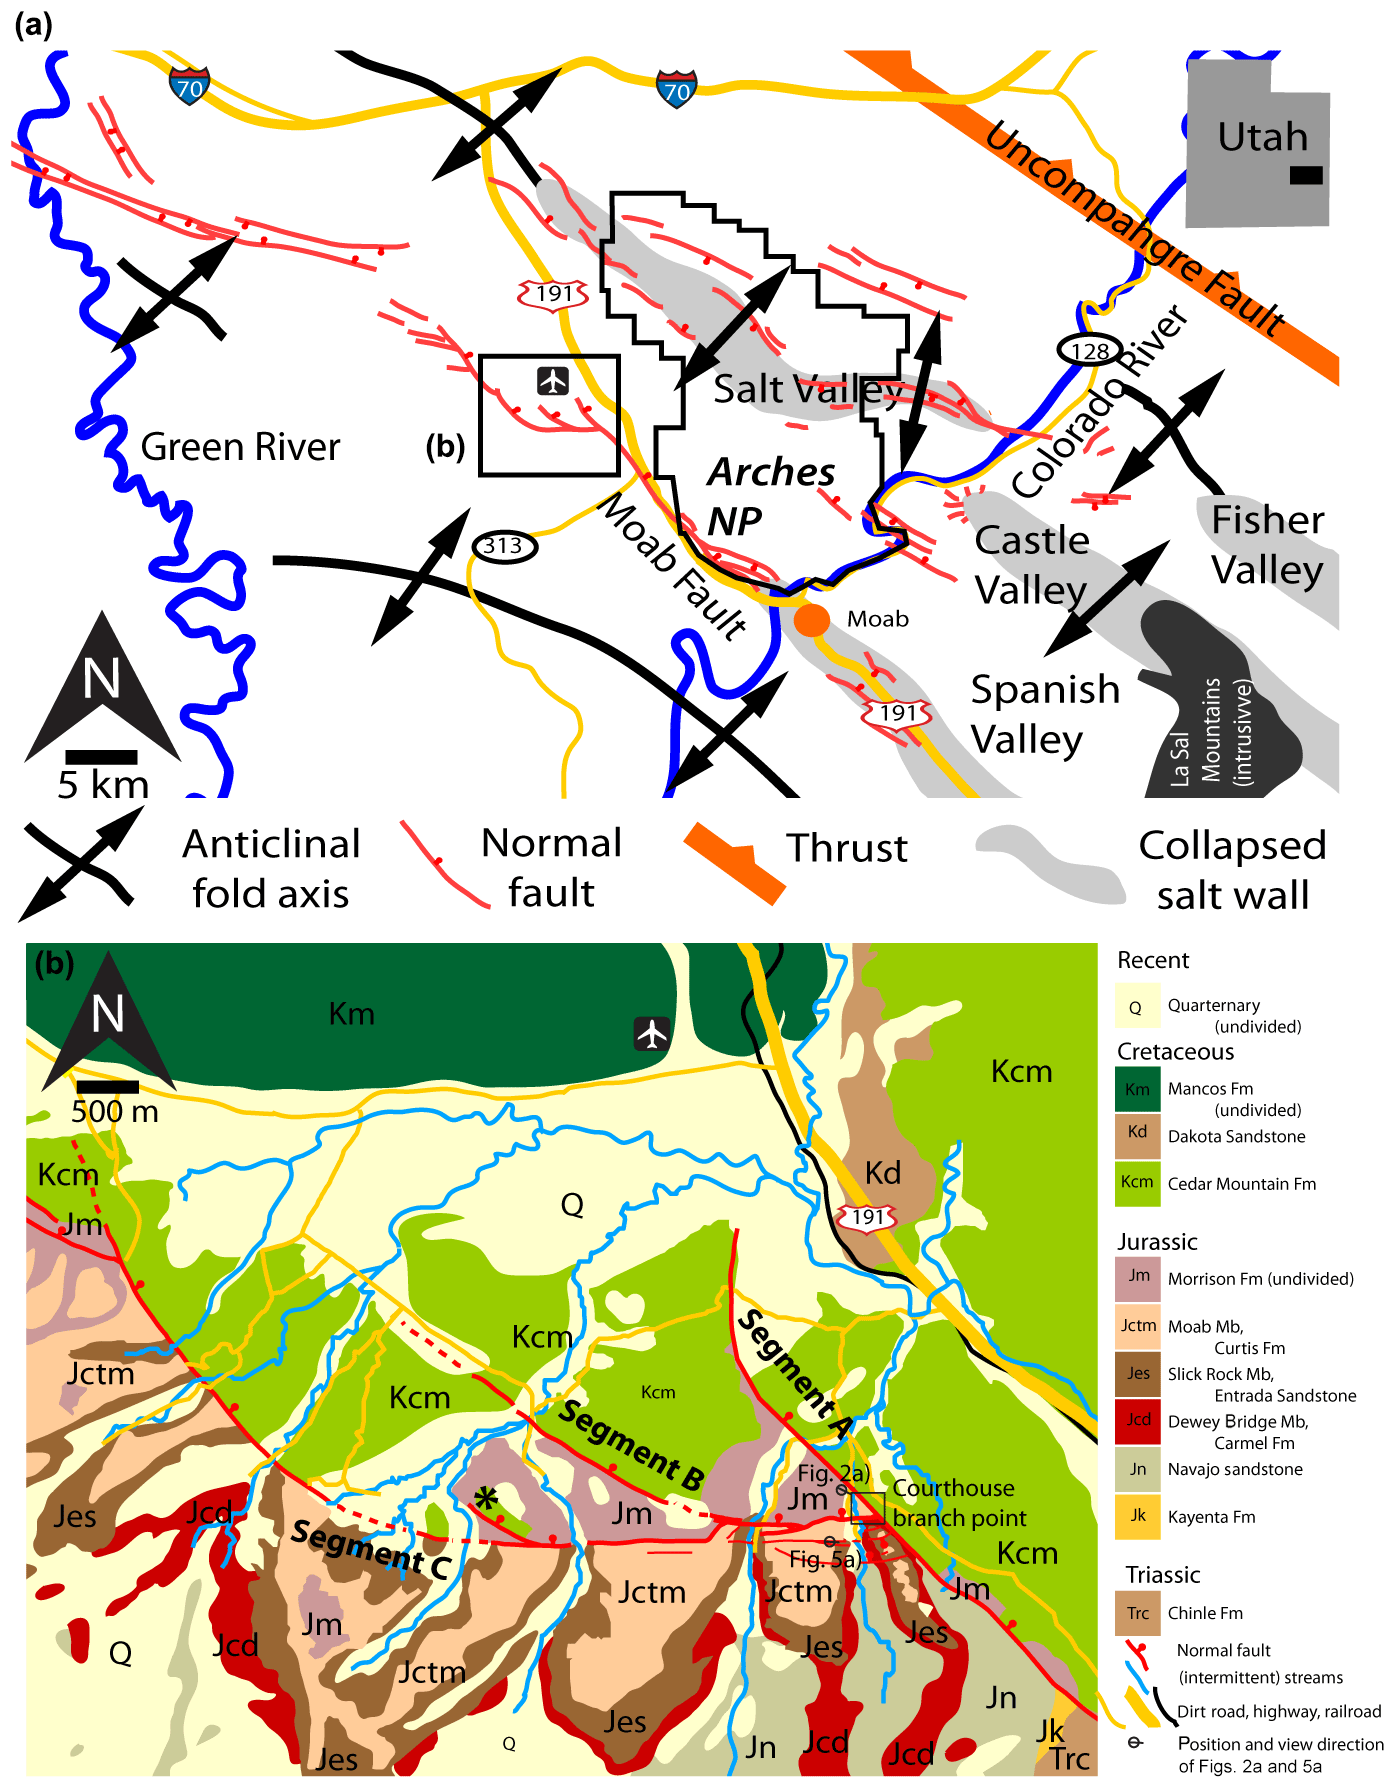
Figure 1(a) Simplified geological map of the Moab area, showing the study area in the box. (b) Geological map of the study area. The box denotes the position of the CHJ and the locations and view direction for Figs. 2a and 5. Maps are modified from Nuccio and Condon, 1996; Doelling, 2002; Gutiérrez, 2004; Fossen et al., 2005; Johansen et al., 2005; and Eichhubl et al., 2009, with our own observations. Coordinates of top left and bottom right corners of the maps: (a) 38.963783∘ N, −110.183635∘ W; 38.468487∘ N, −109.139748∘ W, (b) 38.754977∘ N, −109.810685∘ W; 38.691298∘ N, −109.710322∘ W.
In the Jurassic, major salt-cored anticlines (Fig. 1a) developed in the Moab area (Doelling, 2002; Foxford et al., 1996), with numerous salt-related faults and salt welds in the overburden. The salt-related Moab Fault is described in detail in Foxford et al. (1998) and in many other publications. With a maximum throw of ∼950 m near the entrance of the Arches National Park and a length of around 45 km (Foxford et al., 1996, 1998), the Moab Fault likely initiated as salt weld but shows clear characteristics of brittle normal faulting in the study area. The fault offsets rocks from Late Carboniferous to Cretaceous. It was active from the Triassic to mid-Jurassic during salt tectonics and again from mid-Cretaceous to Early Tertiary when the salt dissolved and the salt structures collapsed (Foxford et al., 1996, 1998). Maximum burial depths of 2–3 km and temperatures of around 80 ∘C were reached in the Entrada sandstone (Nuccio and Condon, 1996; Fossen, 2010).
In aerial and satellite photos the exposed sandstones of the Colorado Plateau display a dense network of subvertical joints in many locations, which formed due to the uplift of the Colorado Plateau in the Tertiary (Cruikshank and Aydin, 1995; Foxford et al., 1996; Kettermann et al., 2015). Similar structures are visible in the footwall of the Moab Fault in the Moab Member. They postdate the activity of the Moab Fault (Cruikshank and Aydin, 1995; Fossen, 2010).

Figure 2Outcrop and sample photos. (a) The CHJ, as seen from the NW. Larger deformation structures are already visible from this distance. See Fig. 1b for location and view direction of this photo. Panels (b) and (c) show typical examples of striated slip planes. (d) Photograph of a sample cut perpendicular to the slip plane and parallel to the striations. Note the increase in deformation band density towards the slip plane, as well as the bleaching of the sandstone near the slip plane. A picture of the sample is shown in the inset. (e) Photomicrograph with crossed polarizers; a thin section of the sample shown in (d). The deformation bands are clearly cataclastic. Deformation band density increases towards the slip plane at this scale too.
1.2 Outcrop description
We focus here on an outcrop near the northern termination of the Moab Fault (Fig. 1) with a number of hard-linked strands (Fig. 1), which likely developed as breached relay ramps (Foxford et al., 1998; Fossen and Rotevatn, 2016). This is opposed to a secondary fault splaying from the main fault. This implies that the growing abutting fault (Segment B, Figs. 1b and 2) arrived at the junction after the main Moab Fault (Segment A). A third segment (Segment C) is exposed further to the west. At the intersection of Segments A and B, a spectacular outcrop of abutting faults is found, Courthouse Junction branch point (CHJ) (Fossen et al., 2005; Figs. 1, 2 and 3; Foxford et al., 1996; Davatzes and Aydin, 2003; Davatzes et al., 2005; Eichhubl et al., 2009; Johansen et al., 2005). The two faults abut at an angle of 64∘. The intersecting damage zones are exposed in the footwall of Segment A and the hanging wall of Segment B (see box in Figs. 1b and 2a).
The triangular CHJ outcrop exposes grey-yellow sandstones of the Moab Member (with patches of Morrison Fm on top), while the Courthouse Canyon to the south exposes older rocks, including the Navajo sandstone. The Moab Member typically has a porosity of around 20 %–25 % (Antonellini and Aydin, 1994), which is strongly reduced, to between 17 % and 1 % at the CHJ (Eichhubl et al., 2009; Johansen et al., 2005). Foxford et al. (1998) constrained the throw along Segment A to about of 370 m just south of Courthouse Rock (see Fig. 2 for location) and between 100 and 20 m in Mill Canyon, just north of Courthouse Rock (Fig. 1b). Eichhubl et al. (2009) estimated a throw on Segment A of about 200 m at the CHJ and on Segment B on the order of 100 m.
Johansen et al. (2005) published a detailed map of the outcrop, showing the distribution, location and interaction (crosscutting relationships) between the different structure types mapped. These include joints and three types of deformation bands, including thick deformation bands (ThickDB) and thin deformation bands (ThinDB), occasionally with a slip plane (ThinDB-S). All of these types occur in bundles or clusters. While the ThickDB (∼1–1.5 mm wide) are dominated by large grain size (∼50–150 µm) and occasional undeformed grains, the ThinDB are truly cataclastic with grain size <5 µm. Johansen et al. (2005) used crosscutting relationships to demonstrate that the ThickDB are older than the ThinDB. In addition, ThinDB were subdivided into seven separate evolutionary sets (Fig. 12 in Johansen et al., 2005). Our own observations are consistent with this, and we will rely on the analysis of Johansen et al. (2005) in the remainder of the paper.
Occasionally, ThinDB in a bundle display smooth, corrugated surfaces (Fig. 2b–e), which are interpreted as slip planes (ThinDB-S) by Johansen et al. (2005). These are the slip surfaces that are measured in this study. Because they are corrugated slip surfaces, rather than cataclastic bands, we assume that they follow the Mohr–Coulomb failure criterion. These slip surfaces are relatively small compared to the entire deformation band bundle.
Eichhubl et al. (2009) also reported joints in CHJ. Some occur along deformation band bundles, indicating that some of the jointing postdates cataclasis, in agreement with the regional trend. Davatzes et al. (2005) used a static-elastic calculation of stress at CHJ to explain the formation of these joints, controlled by changes in remote tectonic stress, burial depth, fluid pressure and rock properties.
2.1 Palaeostress and palaeostrain
The reconstruction of either the palaeostress or the palaeostrain tensor from fault slip data has a long history but is not yet considered a mature field of structural geology (Simon, 2019). Nevertheless, palaeostress and palaeostrain reconstructions have added significantly to our toolbox to understand brittle deformation in the crust (Angelier, 1985; Angelier et al., 1985; Bles et al., 1989; Kleinspehn et al., 1989; Choi et al., 2001; Vandycke, 2002; Dyksterhuis et al., 2005; Martínez-Martínez, 2006; Bozkurt Çiftçi and Bozkurt, 2007; Balsamo et al., 2008; Sippel et al., 2009; van Gent et al., 2009, 2010b). Many of these studies draw inferences from the first-order, regional-scale stress fields (Gölke and Coblentz, 1996; Gruenthal and Stromeyer, 1994; Warners-Ruckstuhl et al., 2013).
Understanding the evolution of third-order local stress perturbations around a group of interacting faults (Peacock et al., 2017a) is mostly based on numerical models (see e.g. Ackermann and Schlische, 1997; Thomas and Pollard, 1993; Gupta and Scholz, 2000; Maerten et al., 2002; Davatzes et al., 2005; Nikolinakou et al., 2011). Outcrop scale examples include changing extension directions inside relay ramps (Bozkurt Çiftçi and Bozkurt, 2007), stress analyses based on focal mechanisms (Larroque et al., 1987; Liang and Wyss, 1991; Wyss et al., 1992; Plateaux et al., 2009), palaeostress changes around fault tips (Balsamo et al., 2008) and interaction of core complexes with their associated fault systems (Martínez-Martínez, 2006).
Palaeostress and palaeostrain reconstruction algorithms share many assumptions, although they differ strongly in their approach. Only the orientations and the relative sizes (expressed in the ratio R) of the principal stresses or strains ( are reconstructed, not the full tensor. This produces (in the case of palaeostress using the “dynamic fault slip analysis”) a “reduced stress tensor” and for the “kinematic palaeostress analysis” a reduced strain tensor. In the case of coaxial deformation these can be considered to coincide with the stress axes and the reduced stress ratio (Sperner et al., 1993; Sperner, 1996; Ilic and Neubauer, 2005), but the differences in infinitesimal strain (earthquake analysis) and finite strain (fault slip data) have not yet been fully addressed. For a more complete discussion of these issues see Angelier (1994), Ramsay and Lisle (2000), Celerier et al. (2012) and Simon (2019).
The kinematic approach is based on the Mohr–Coulomb criterion (Coulomb, 1776; Mohr, 1900) and assumes a high shear-stress-to-normal-stress ratio. An example is the Numeric Dynamic Analysis (NDA), which calculates the orientation of the kinematic axes and the kinematic reduced ratio. These methods treat all faults as being newly formed. A further requirement is that the contraction and extension axes lie in the plane defined by the slip direction and the fault plane normal. This makes this method unsuitable for the use with faults with oblique striae and reactivated faults (Sperner, 1996). These methods also require the assumption of an angle of internal friction (generally assumed to be 30∘), neglecting the natural variability of this parameter (Sperner, 1996; Sperner et al., 1993).
The dynamic method assumes that a slip on a fault plane will be parallel to the direction of maximum-resolved shear stress on the fault plane (Wallace, 1951; Bott, 1959). The Direct Stress Inversion method (DSI) (Angelier, 1979, 1984, 1990) is an example of a Wallace-and-Bott-type palaeostress analysis, in which this argument is inverted. Important assumptions of stress inversion are that the stress field is homogeneous, each fault is independent of the others, they are not coeval and they do not interact (Simon, 2019).
Celerier et al. (2012) and Simon (2019) discuss the similarities between palaeostress and palaeostrain analysis and the simple geometric relationships that are sometimes observed between strain and stress axes when the fault and slip orientations are clustered. However, in cases when these orientations are more scattered, the two approaches yield different results. Celerier et al. (2012) argue that “by summing each fault contribution to obtain global strain tensor, strain tensor may be well suited for averaging strain within a volume”. The inverse methods of stress analysis on the other hand may be more suited to separate heterogeneous data.
Separating heterogeneous fault orientation–slip direction pairs into homogenous subsets, which can reasonably be considered to originate from a single phase, is one of the major challenges in palaeostress calculations (see for example Sippel et al., 2009, and references therein), and individual faults that are wrongly assigned or are overprinted by a later stress state can cause the inversion algorithm to fail. We assume that in CHJ the structures evolved under the same regional stress field but are interacting with each other, causing overprinting and local stress rotations. For this reason, a palaeostrain analysis is in our opinion more suited to analyse this outcrop.
We used the implementation of NDA in the program Tectonics FP (Ortner et al., 2002, http://www.tectonicsfp.com/, last access: January 2011). For completeness and discussion, the palaeostress results of the DSI method are also included in the figures. We indicate cases where palaeostress and palaeostrain axes are very similar.
2.2 Field observations
We measured the orientation of both the slip planes with polished surfaces as well as the undulations, which are interpreted to represent the slip direction (see Angelier, 1994; Doblas, 1998, Fig. 2b and c) in the different generations of deformation band bundles, following the set numbering and evolutionary sequence of Johansen et al. (2005). Macroscopic observations on samples cut perpendicular to the slip plane show an increase of deformation band frequency towards the slip plane, in addition to a bleaching of the matrix (Fig. 2d). Observations in thin sections show an anastomosing network of cataclastic deformation bands with a significant reduction in grain size (Fig. 2e), in agreement with Aydin and Johnson (1978) and Fossen et al. (2007). This demonstrates that there is a genetic relation between bundles and slip planes and suggests that these slip planes form under the same stress conditions as the bundle. The slickensides do not react with HCl. We note that if the slip planes had formed late and in a single event, a palaeostress/strain analysis on the different sets would yield the same result. More data from detailed optical and broad-ion-beam-polished scanning electron microscope (SEM) micrographs of samples of deformation bands from this outcrop can be found in Komoroczi (2014).
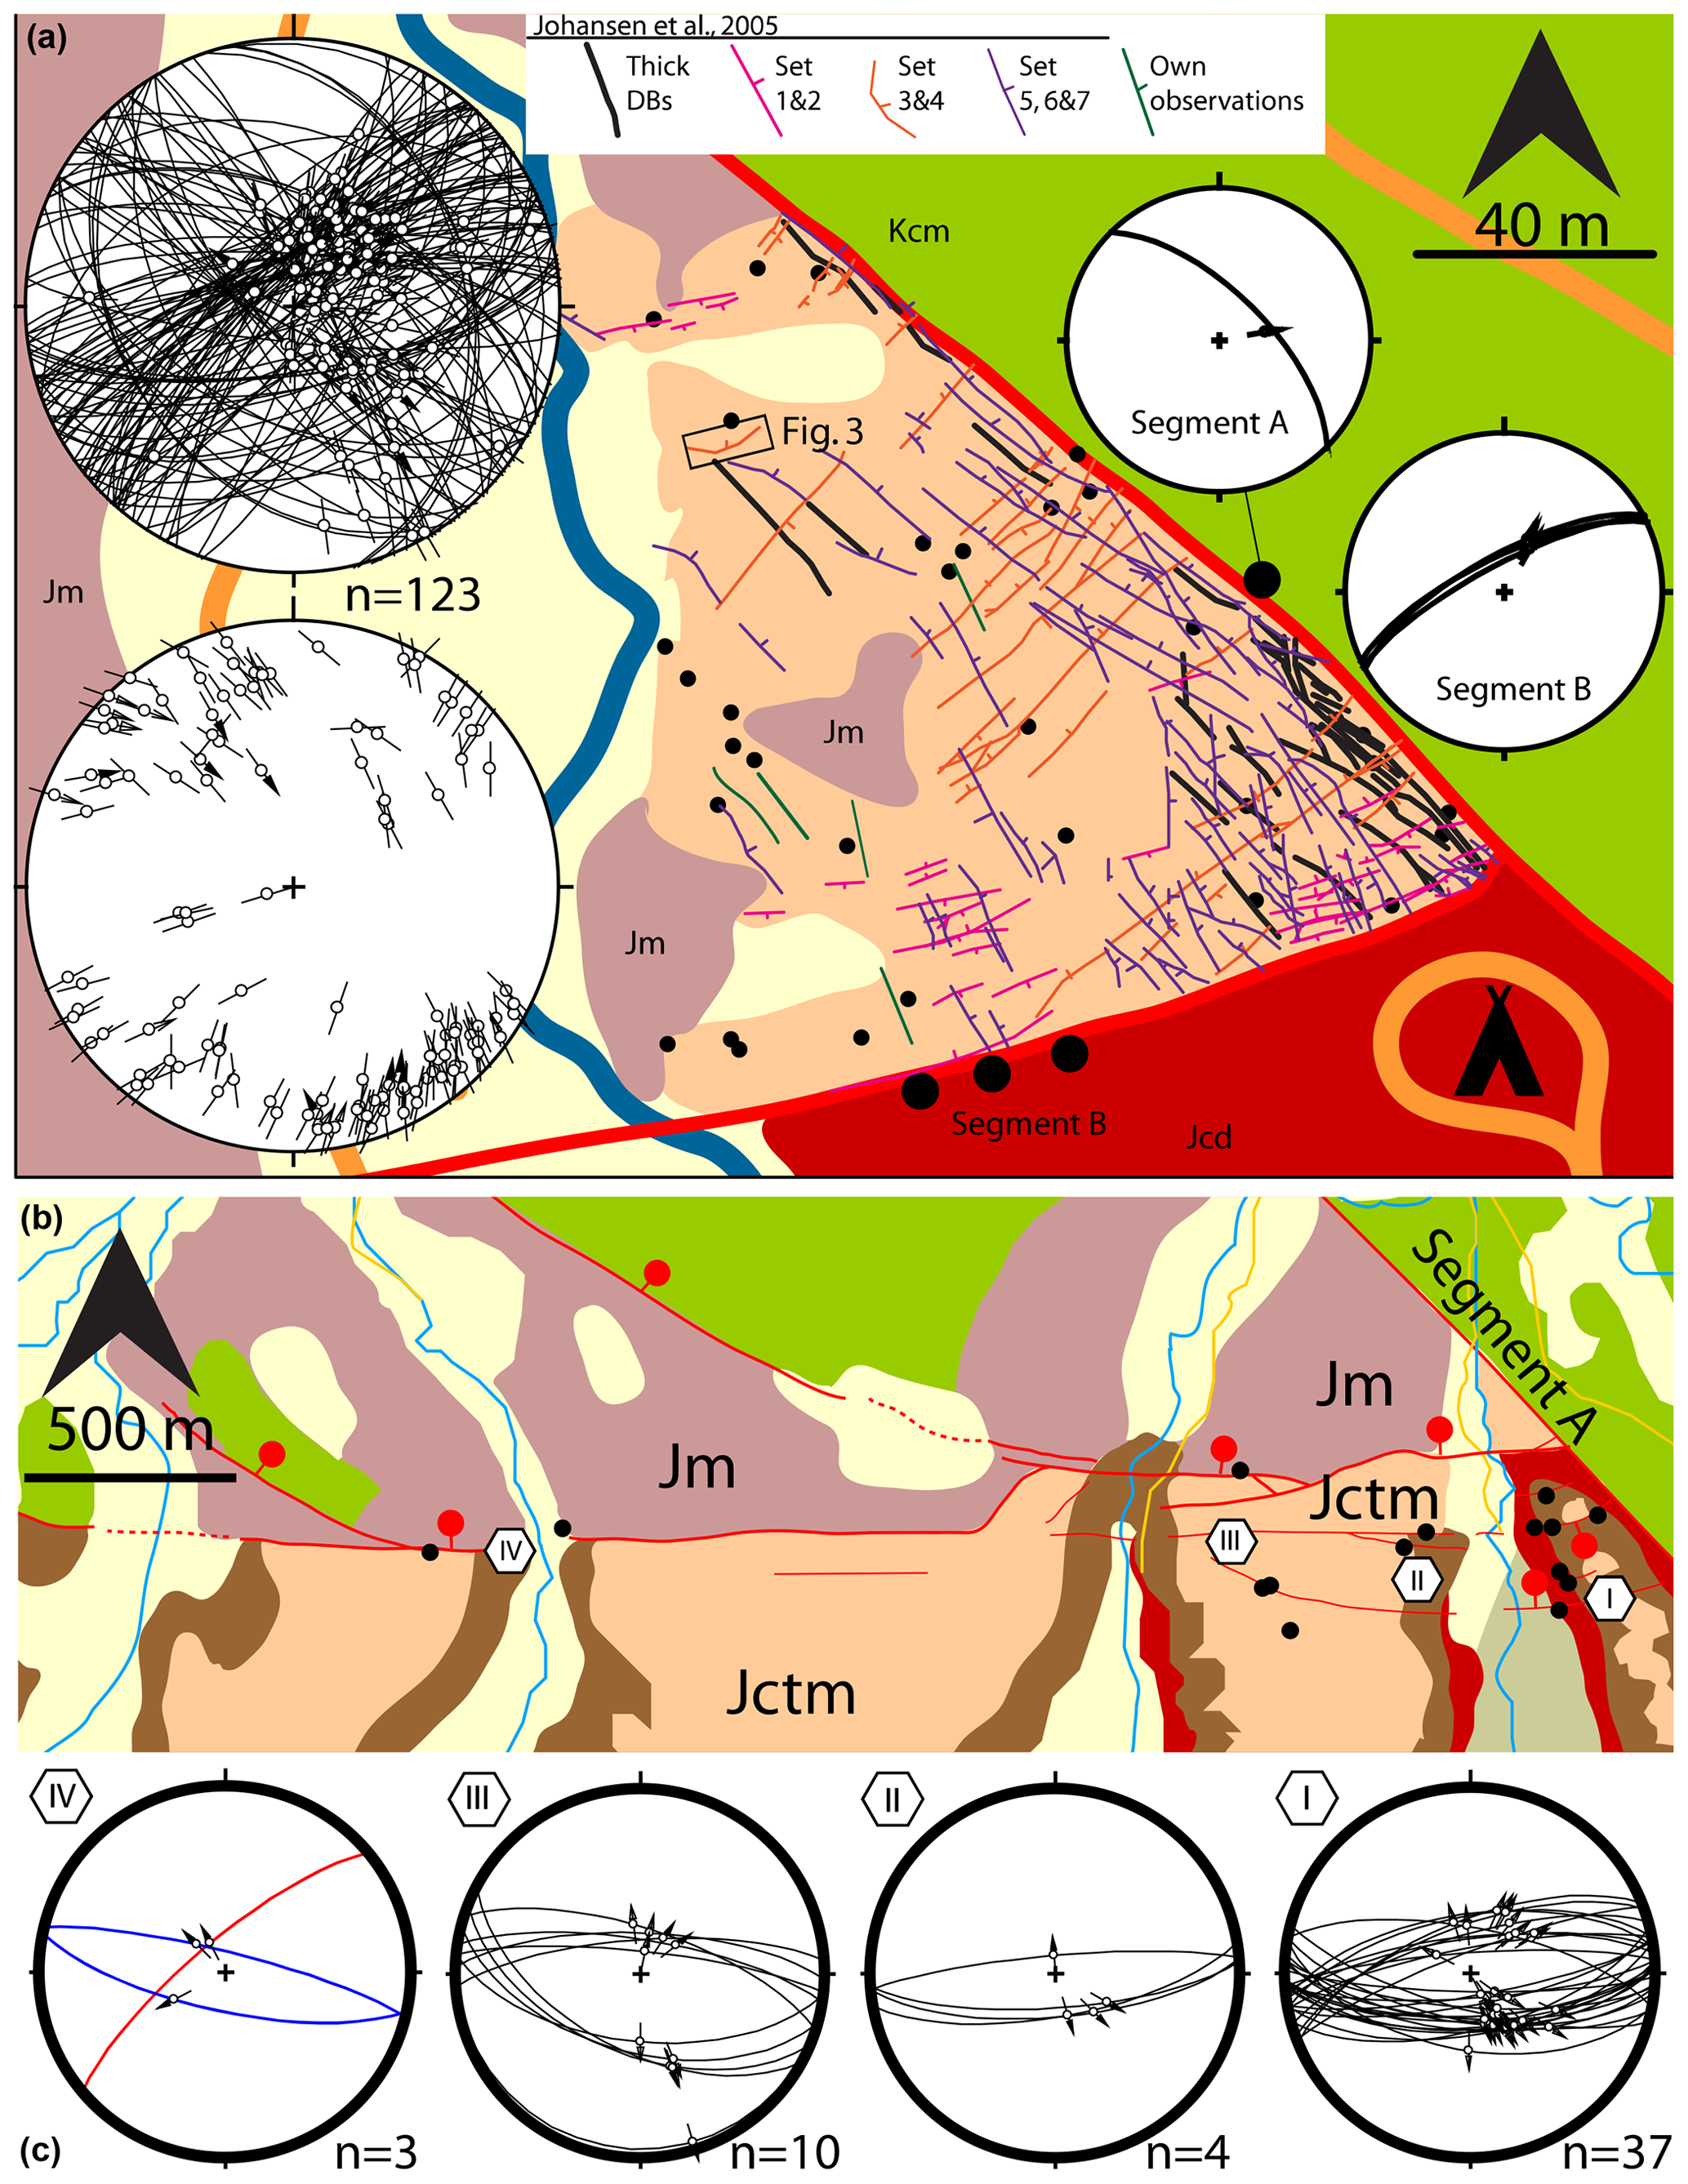
Figure 3(a) Map of the Courthouse Junction outcrop with GPS stations (dots) of the locations where striated slip planes were measured in (33 locations; 123 measurements). A sketch map of the different sets of deformation bands is included, based on Johansen et al. (2005) and our own observations (length >5 m). Stereograms show the measured striated fault planes, as an Angelier lower-hemisphere plot and as a Hoeppener plot. The small stereograms show faults and striations in the two fault segments. See Fig. 1 for key. Panel (b) is the same as (a) but along Segments B and C, at 15 stations with 60 measurements (separated in four locations; I–IV). (c) Stereonets for these locations.
In Fig. 3, we augment the different sets mapped by Jonhansen et al. (2005) with our own observations. We have only included deformation band bundles longer than 5 m. GPS stations not associated with a drawn line are of shorter bundles or isolated slip planes. The “forking geometry” (Simón, 2019), formed by Segment B and the long deformation band bundle of Set 3 and 4 (see Fig. 3a) against Segment A, supports the interpretation that Segment B abuts against Segment A. We collected 207 separate fault orientation–slip direction measurements from the larger CHJ area (see Fig. 3). The bulk of these measurements (n=123) are collected at the CHJ outcrop (Fig. 3a). The remaining data come from both inside the fault zone and from the footwall of Segments B and C (Fig. 3b) where very similar-looking slip planes were found, associated with deformation band bundles. The observed slip planes often form conjugate sets. Measurements at the CHJ and those on top of the unnamed tower directly west of the Courthouse Rock are in the Moab Member, while those at the base of the Courthouse Rock (Fig. 3b) are in the Slick Rock and Dewey Bridge members. Those inside the fault zone of Segments B and C are in either Slick Rock or Moab members.
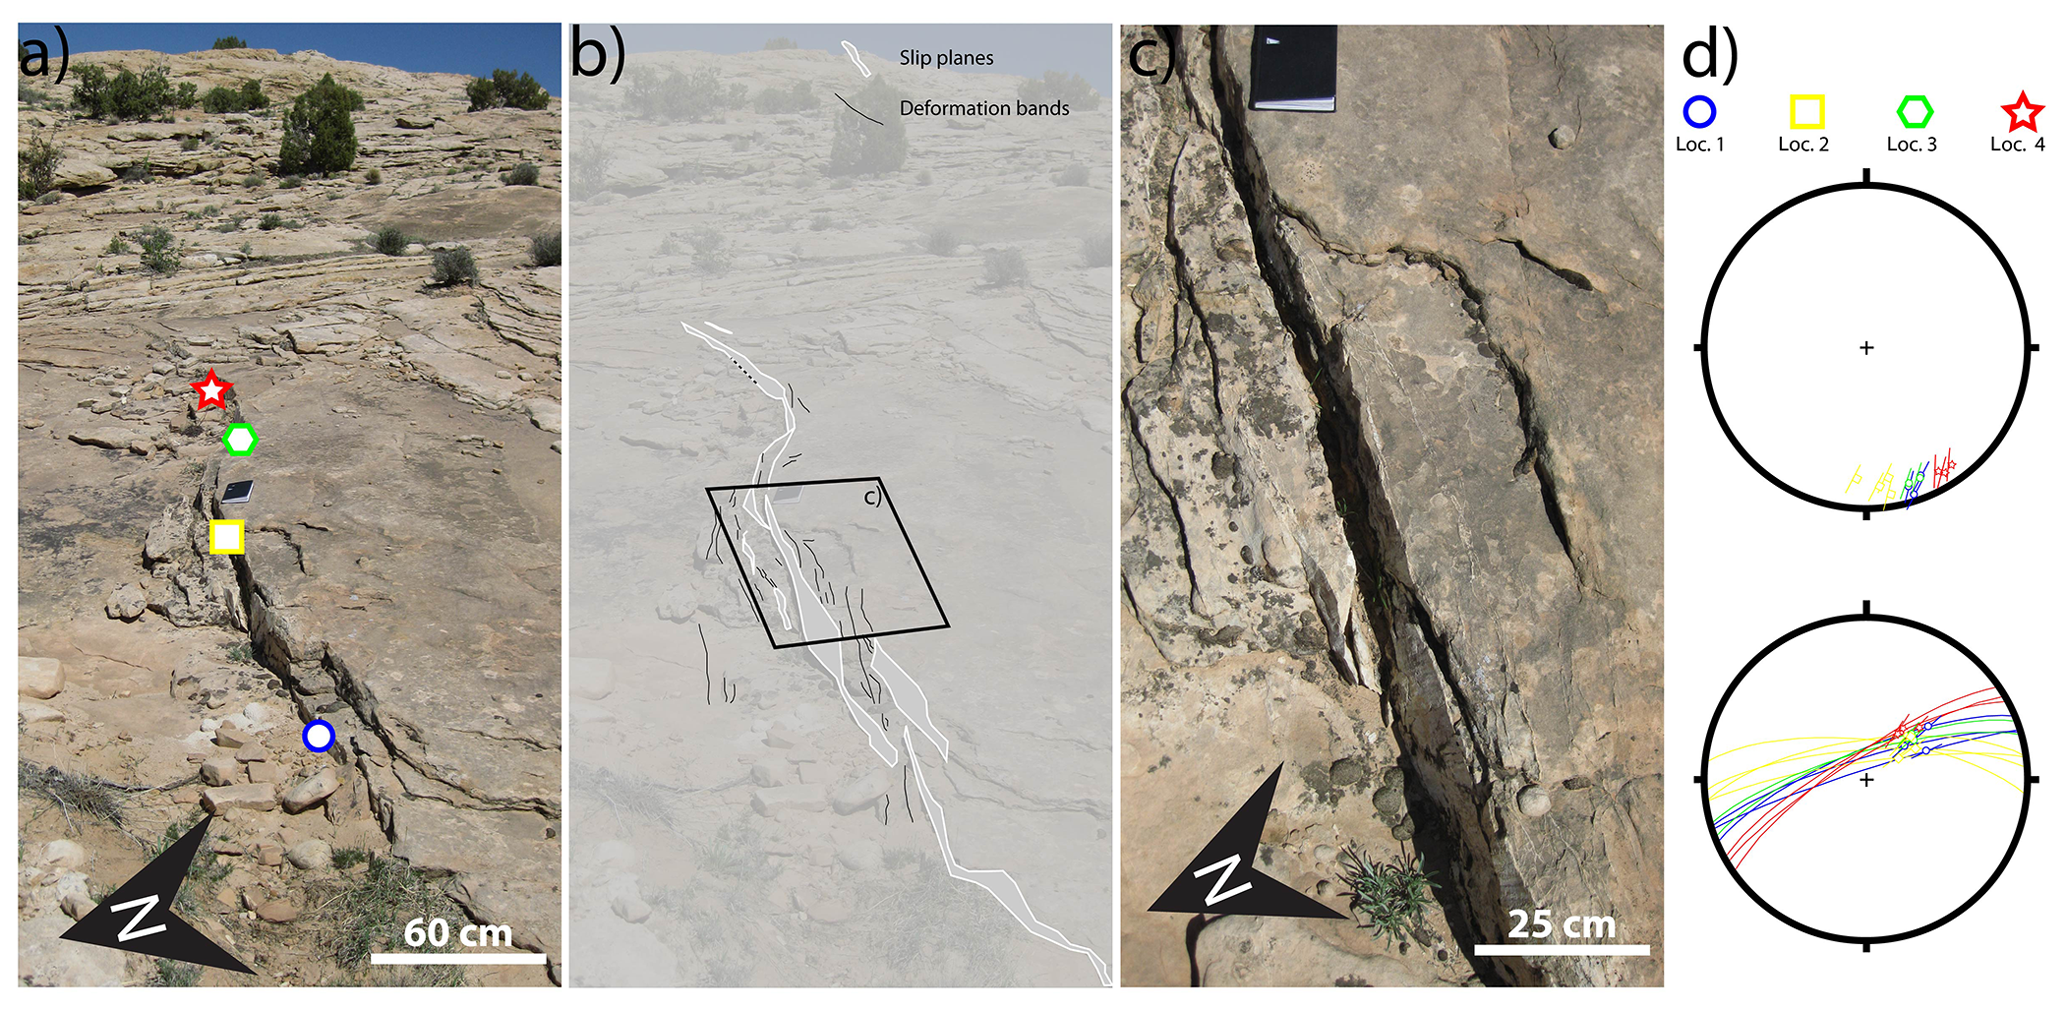
Figure 4(a) An undulating slip plane in a bundle of deformation bands. Symbols show measurement locations. For location, see Fig. 3 (b) interpreted field image of (a). (c) Detail of (a), showing the slip plane in the core of a bundle of deformation bands. (d) Stereographic plot of the orientation and slip direction at the four locations, shown in (a). In (d), both the Hoeppener plot (top) and the great circle plot (bottom) show that these locations exhibit significantly different orientations of the structure but that the slip directions are similar. The colours and symbols in (d) correspond to those in (a).
Where ThinDB-S have undulations on the metre and smaller scale (see Fig. 4), the different slip directions are generally parallel (Fig. 4d). The observation that slip planes typically occur in the core of a deformation band bundle is illustrated by this example (Fig. 4b and c). To better capture the variability of slip direction and reduce the effect of individual outliers due to local spurious orientations or measurement errors, we measured the fault plane and striation orientation up to three times on a single structure, about a metre apart. The authors strived to include all visible slip planes, but because a reasonable outcrop quality is required to measure both the orientation of the surface and the corrugations, not all of the visible slip planes were included in the final analysis.
Like Johansen et al. (2005), we did not observe slip planes in the set consisting of ThickDB, which are associated with Segment A, but the seven sets associated with ThinDB can all be recognized in our data set of fault orientation–slip direction pairs.
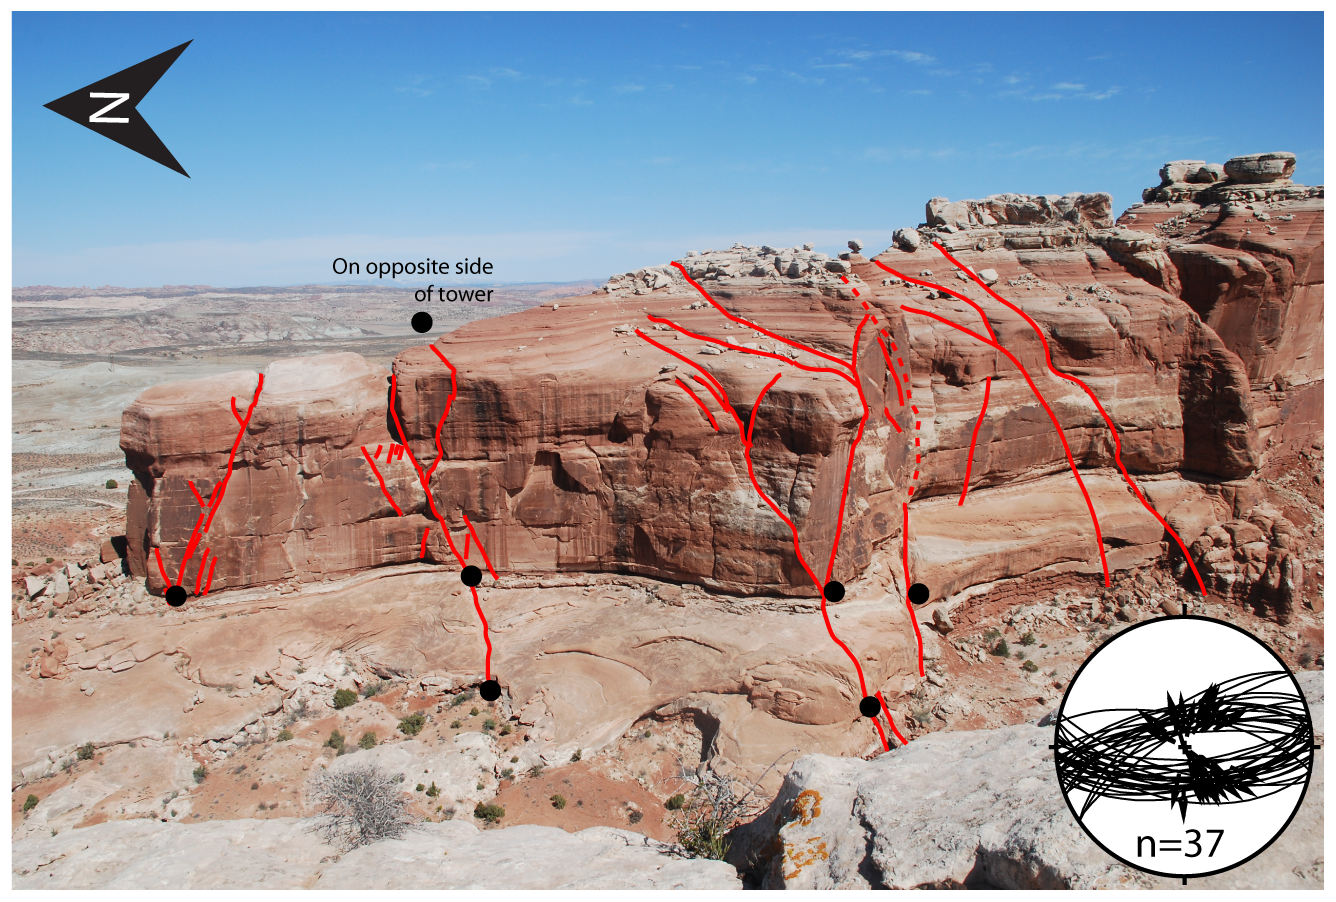
Figure 5View of the western face of the northern termination of the Courthouse Rock (location I), with visible faults interpreted. The 27 measurements of striated slip planes are recorded at the stations indicated with the black dots. Width of view is about 400 m. Stereonet shows the measured planes and slip directions. See Fig. 1b for location and direction info. CHJ is just off the image, to the north.
Fault orientation–slip direction pairs measured outside of the Branch Point were grouped into four locations (I–IV) from east to west (see Fig. 3b), based on their geographical spread. Data from location I contain many observations along the base of the Courthouse Rock in the footwall of Segment B, directly south of the branch point (see Figs. 1 and 5).
No polished slip planes and slickensides are observed on Segments A and B, but observations of the metre-scale undulations of the main fault structures show slip on these structures was dip slip (at least in the final stages of movement; Fig. 3a).
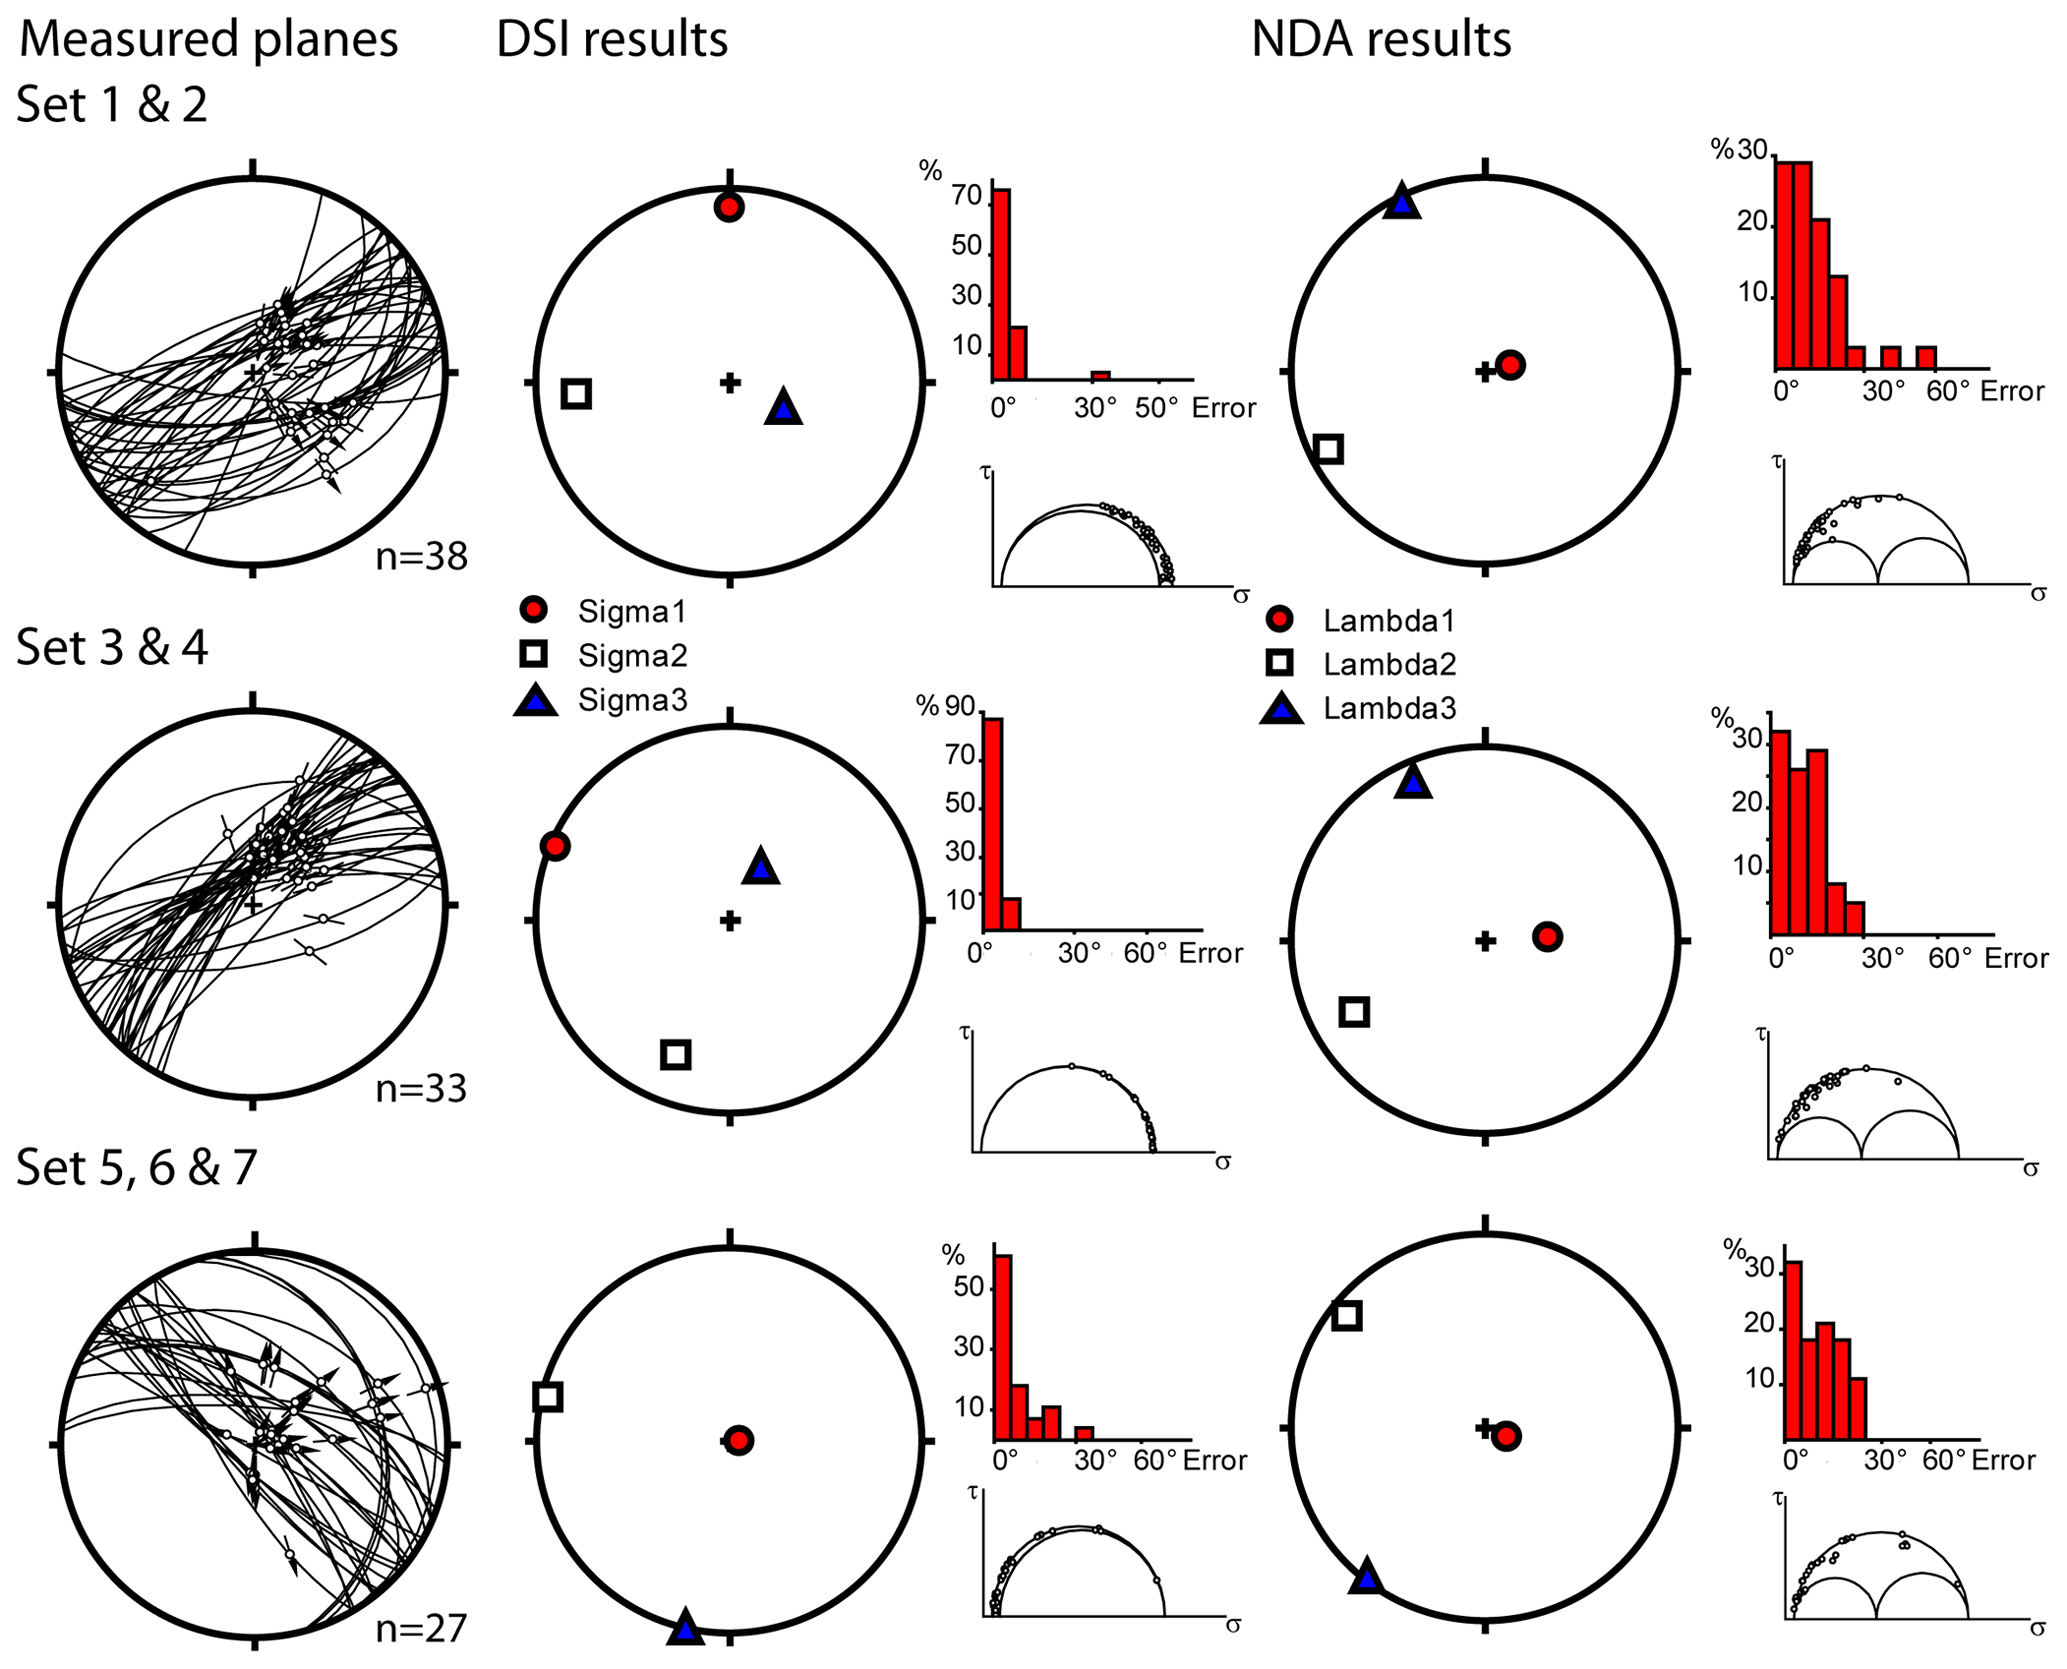
Figure 6Fault plane orientation–slip direction and palaeostress (DSI) and palaeostrain (NDA) results (for the three sets) from CHJ (Fig. 3a). The separation is based on Johansen et al. (2005), with kinematically related sets combined into a single data set.
3.1 Separating the data from Courthouse Junction
We separated our 123 fault orientation–slip direction pairs from CHJ into the seven evolutionary sets, following the subdivision of Johansen et al. (2005), using the average orientations and published locations to differentiate them. Our own observations were classified into their scheme, using the orientation only. Since Set 1 and Set 2, Set 3 and Set 4 are conjugates (the average poles are at an angle of around 60∘), we combined these into “Set 1 and 2”, “Set 3 and 4”. The remaining data were grouped into “Set 5, 6 and 7” when we demonstrated this combined set produces kinematically consistent results (see Fig. 6).
3.2 Palaeostrain results at the Courthouse Junction
The calculated palaeostress/palaeostrain results at CHJ are shown in Fig. 6. As discussed above, we focus on strain axes calculated using NDA. Results show extension in the NW–SE direction for Set 1 and 2 and Set 3 and 4. For Set 1 and 2 the extension axis has the direction and for Set 3 and 4, , with R values of 0.48 and 0.46 respectively. The maximum compressive strain axis is near vertical for Set 1 and 2 but is rotated slightly towards the west in the lower hemisphere stereoplot for Set 3 and 4. The results for Set 5, 6 and 7 show extension in the NE–SW direction (orientation ), with an R value of 0.47. We note that the DSI palaeostress axes for this particular set are broadly similar to the palaeostrain axes, although the R values for both methods are very different.
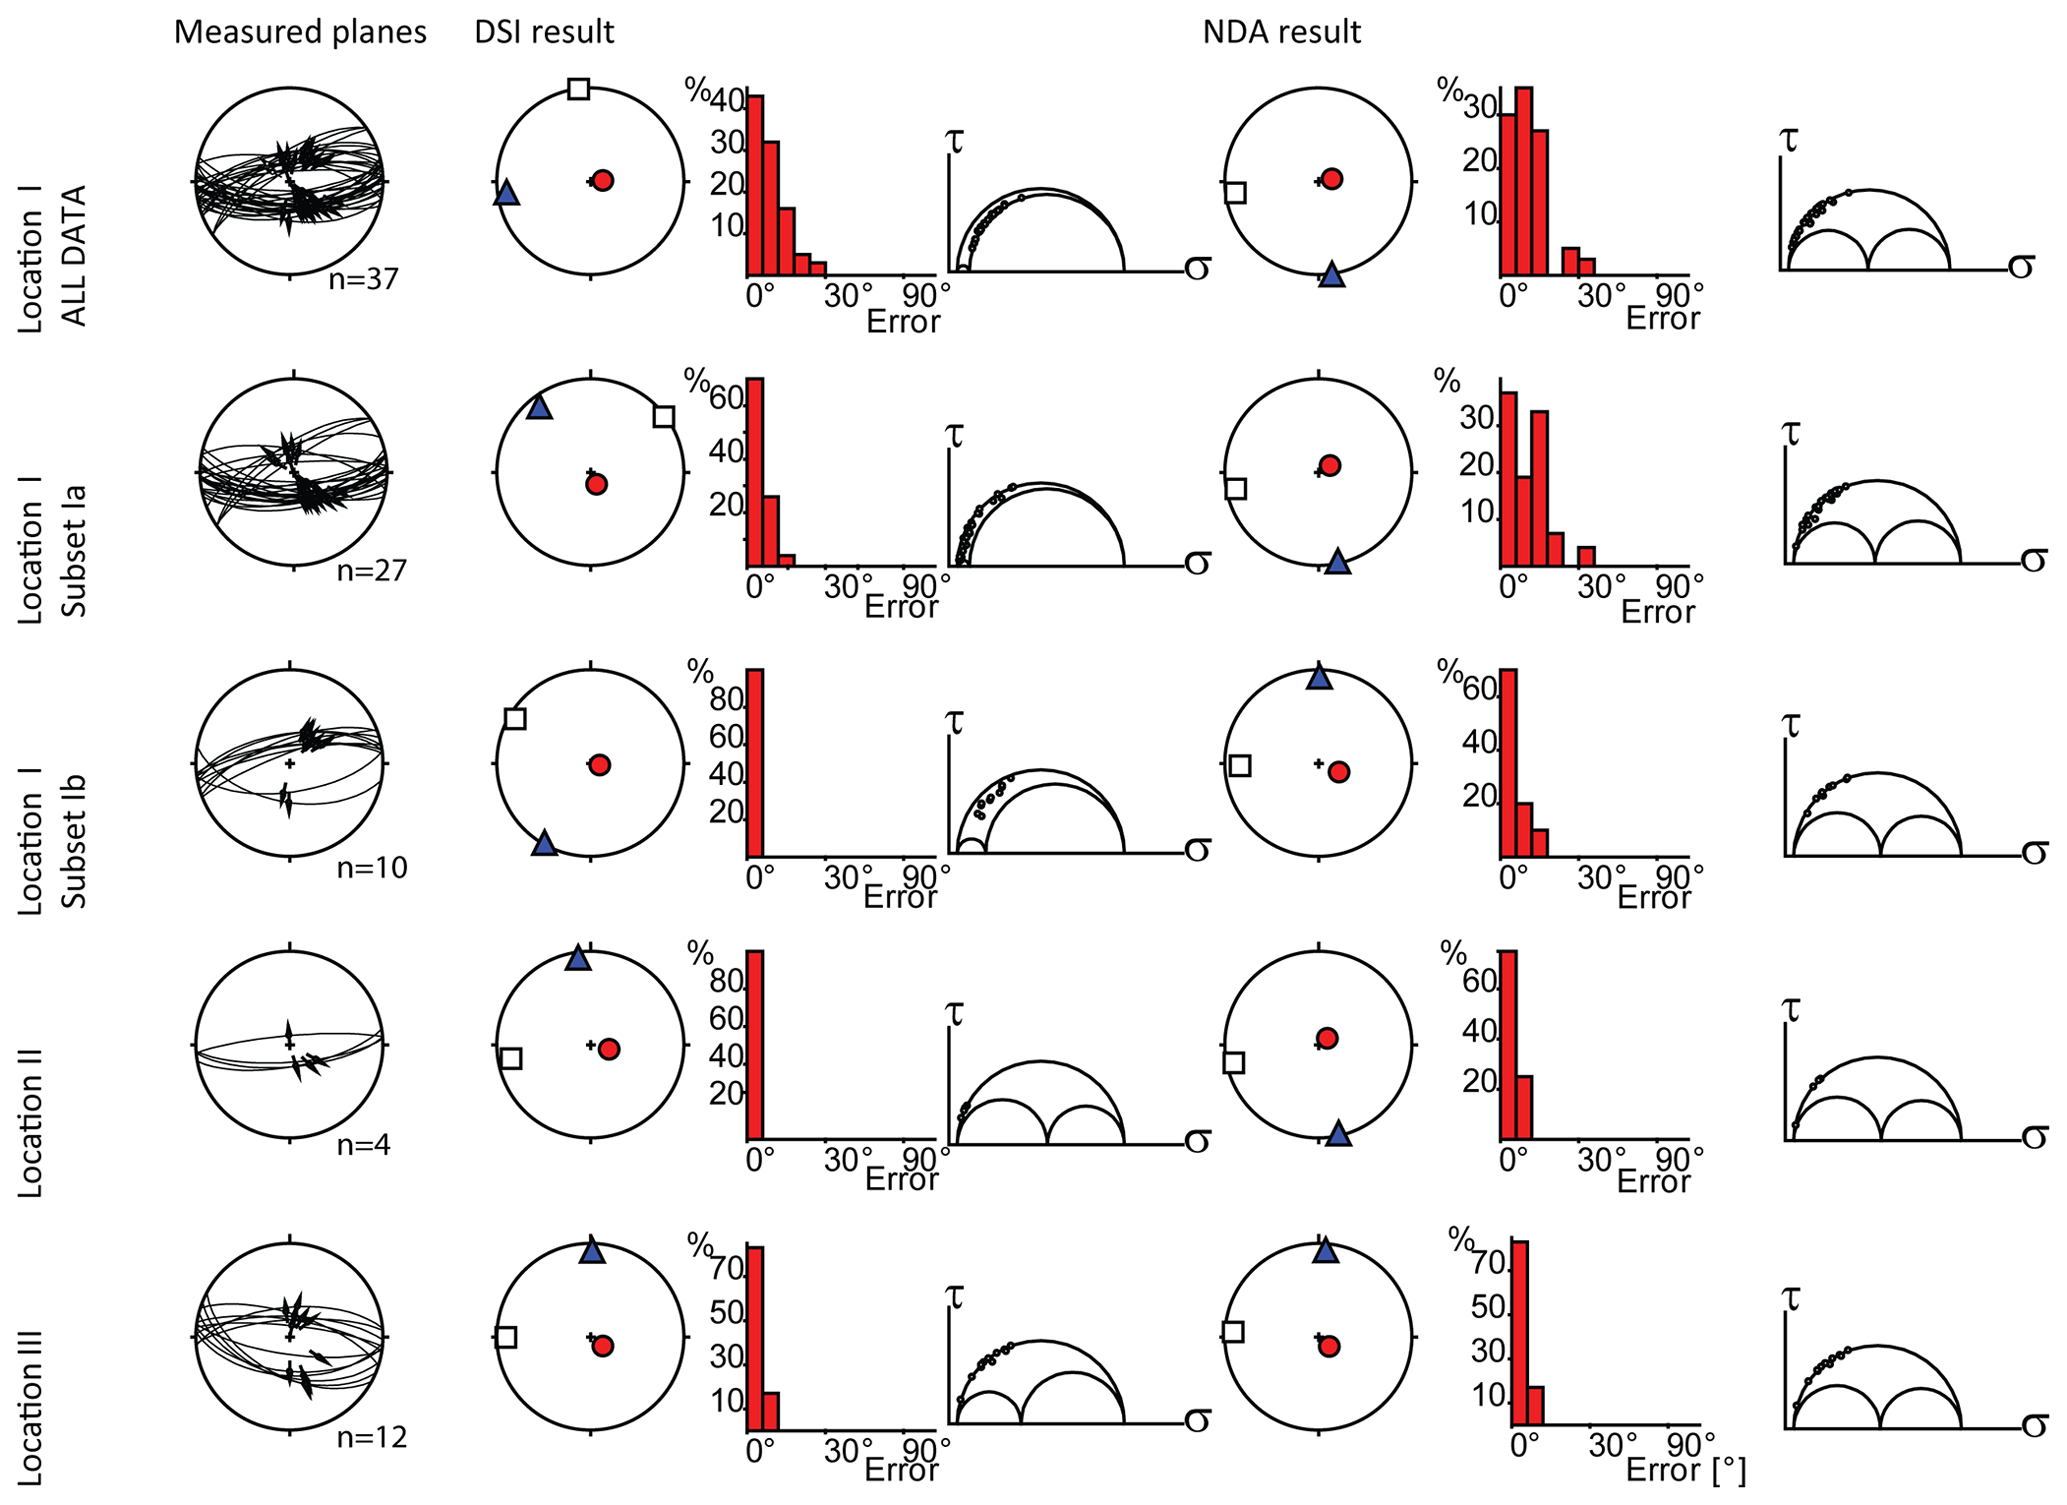
Figure 7Fault plane orientation–slip direction and palaeostress (DSI) and palaeostrain (NDA) results from locations I to III along Segments B and C. No palaeostress results are shown for location IV, as the number of observations here was too low to obtain a valid result.
3.3 Palaeostrain results for the study area outside the CHJ
Figure 7 shows the palaeostrain/palaeostress results outside CHJ. At location I (Figs. 1, 5), 37 measurements were collected in the footwall of Segment B (Fig. 5). Based on the distribution of slip directions, we separated the data in two subsets (Set Ia and Set Ib). Since we did not observe crosscutting relations at this locality, we cannot determine relative age relationships. By separating the data from location I into Sets Ia and Ib, the variance reduces for both methods. The histogram of Fig. 7 shows the angular mismatch between the measured orientation of slip on a fault plane and the calculated slip direction on that plane, providing a quality control. It can be seen that the mismatch is quite small. Both Set Ia and Set Ib as well as the full data set in location I show a vertical maximum compressive strain axis and a north–south extension direction. The palaeostress results for Set Ia are broadly similar to the palaeostrain results.
In location II and location III, the palaeostress and palaeostrain axes are very similar. As these locations are in the footwall of Segment B, away from major fault interactions, it seems reasonable that here the main palaeostress requirements of a homogeneous stress field and independency between the faults are met. As a result, NDA and DSI produce results that are similar, with a vertical maximum compressive stress/strain axis and N–S extension direction.
The data at location IV in Fig. 3 are insufficient to calculate a stress or strain tensor; at least four but preferably 15 independent measurements are required (Sperner, 1996; Sperner et al., 1993; Simon, 2019). The sample location east of the stream in location IV (red great circle in Fig. 3) has an anomalous orientation compared to the north-dipping fault at the western location (blue great circles), but slip directions are near parallel, suggesting reactivation of an earlier structure. The slip directions do not fit the expected north–south extension. This might be due to the perturbation of the stress field by the nearby branch point on Segment C with the minor fault structure (highlighted with an ∗ in Fig. 1b).
3.4 Interpretation and discussion
Our observations of the relative timing of the different sets of deformation bands are consistent with those of Johansen et al. (2005) based on cross-cutting relationships. Johansen et al. (2005) conclude that their set 1 and set 2 and their set 3 and set 4 have developed roughly simultaneously, based on similar orientations, during the approach and initial interaction of Segments A and B. Johansen et al. (2015) describe their set 5, set 6 and set 7 to have formed directly after Segment B abutted against Segment A.
Our study shows that Set 1 and 2 and Set 3 and 4 formed under similar extension directions, supporting the interpretation of Johansen et al. (2005) and suggesting a more complex history with gradually rotating deformation axes. Our Sets 5, 6 and 7 are kinematically consistent (but not conjugate); thus we interpret them to have formed roughly at the same time. In this set, the palaeostress axes are consistent with the palaeostrain axes, while this is not the case for combined Set 1 and 2 and Set 3 and 4. Similar to the situation described above for locations II and III, Set 5, 6 and 7 is interpreted to be the only set in CHJ where the requirements of a homogeneous stress field and independency between the faults are met. Thus, both methods produce similar results here. The same can be observed for the palaeostress results of location Ia, outside of CHJ.
3.5 Deformation during the transition from kinematically to geometrically linked abutting faults
In this study we used both kinematic and dynamic analysis of fault slip data. Using the analysis of Johansen et al. (2005) to separate data from different generations, the strain-based NDA method, which averages strain in a volume, can analyse this evolution. The NDA method yields consistent results over the study area, which is a reasonable result for this system (Celerier et al., 2012). In those locations where we can reasonably assume a homogenous stress field and no fault interaction, we found similar stress and strain axes. In the other locations where the relation between calculated stress and strain axes diverges, we infer that this is because DSI cannot separate the effects of the gradually rotating stress field as Segment B approaches Segment A.
Figure 8 summarizes the evolution of the stress state in three stages, assuming coaxial deformation, as (i) Segments A and B are isolated, (ii) kinematically linked and (iii) geometrically linked.
For stage (i), our observations are consistent with the interpretation of Johansen et al. (2005) that Segment A formed first. Since no striated slip planes are observed here, we assume a vertical σ1 and estimate σ3 at 40–45∘, perpendicular to Segment A. This is interpreted as the regional stress field. ThickDB also formed during this phase (Johansen et al., 2005).
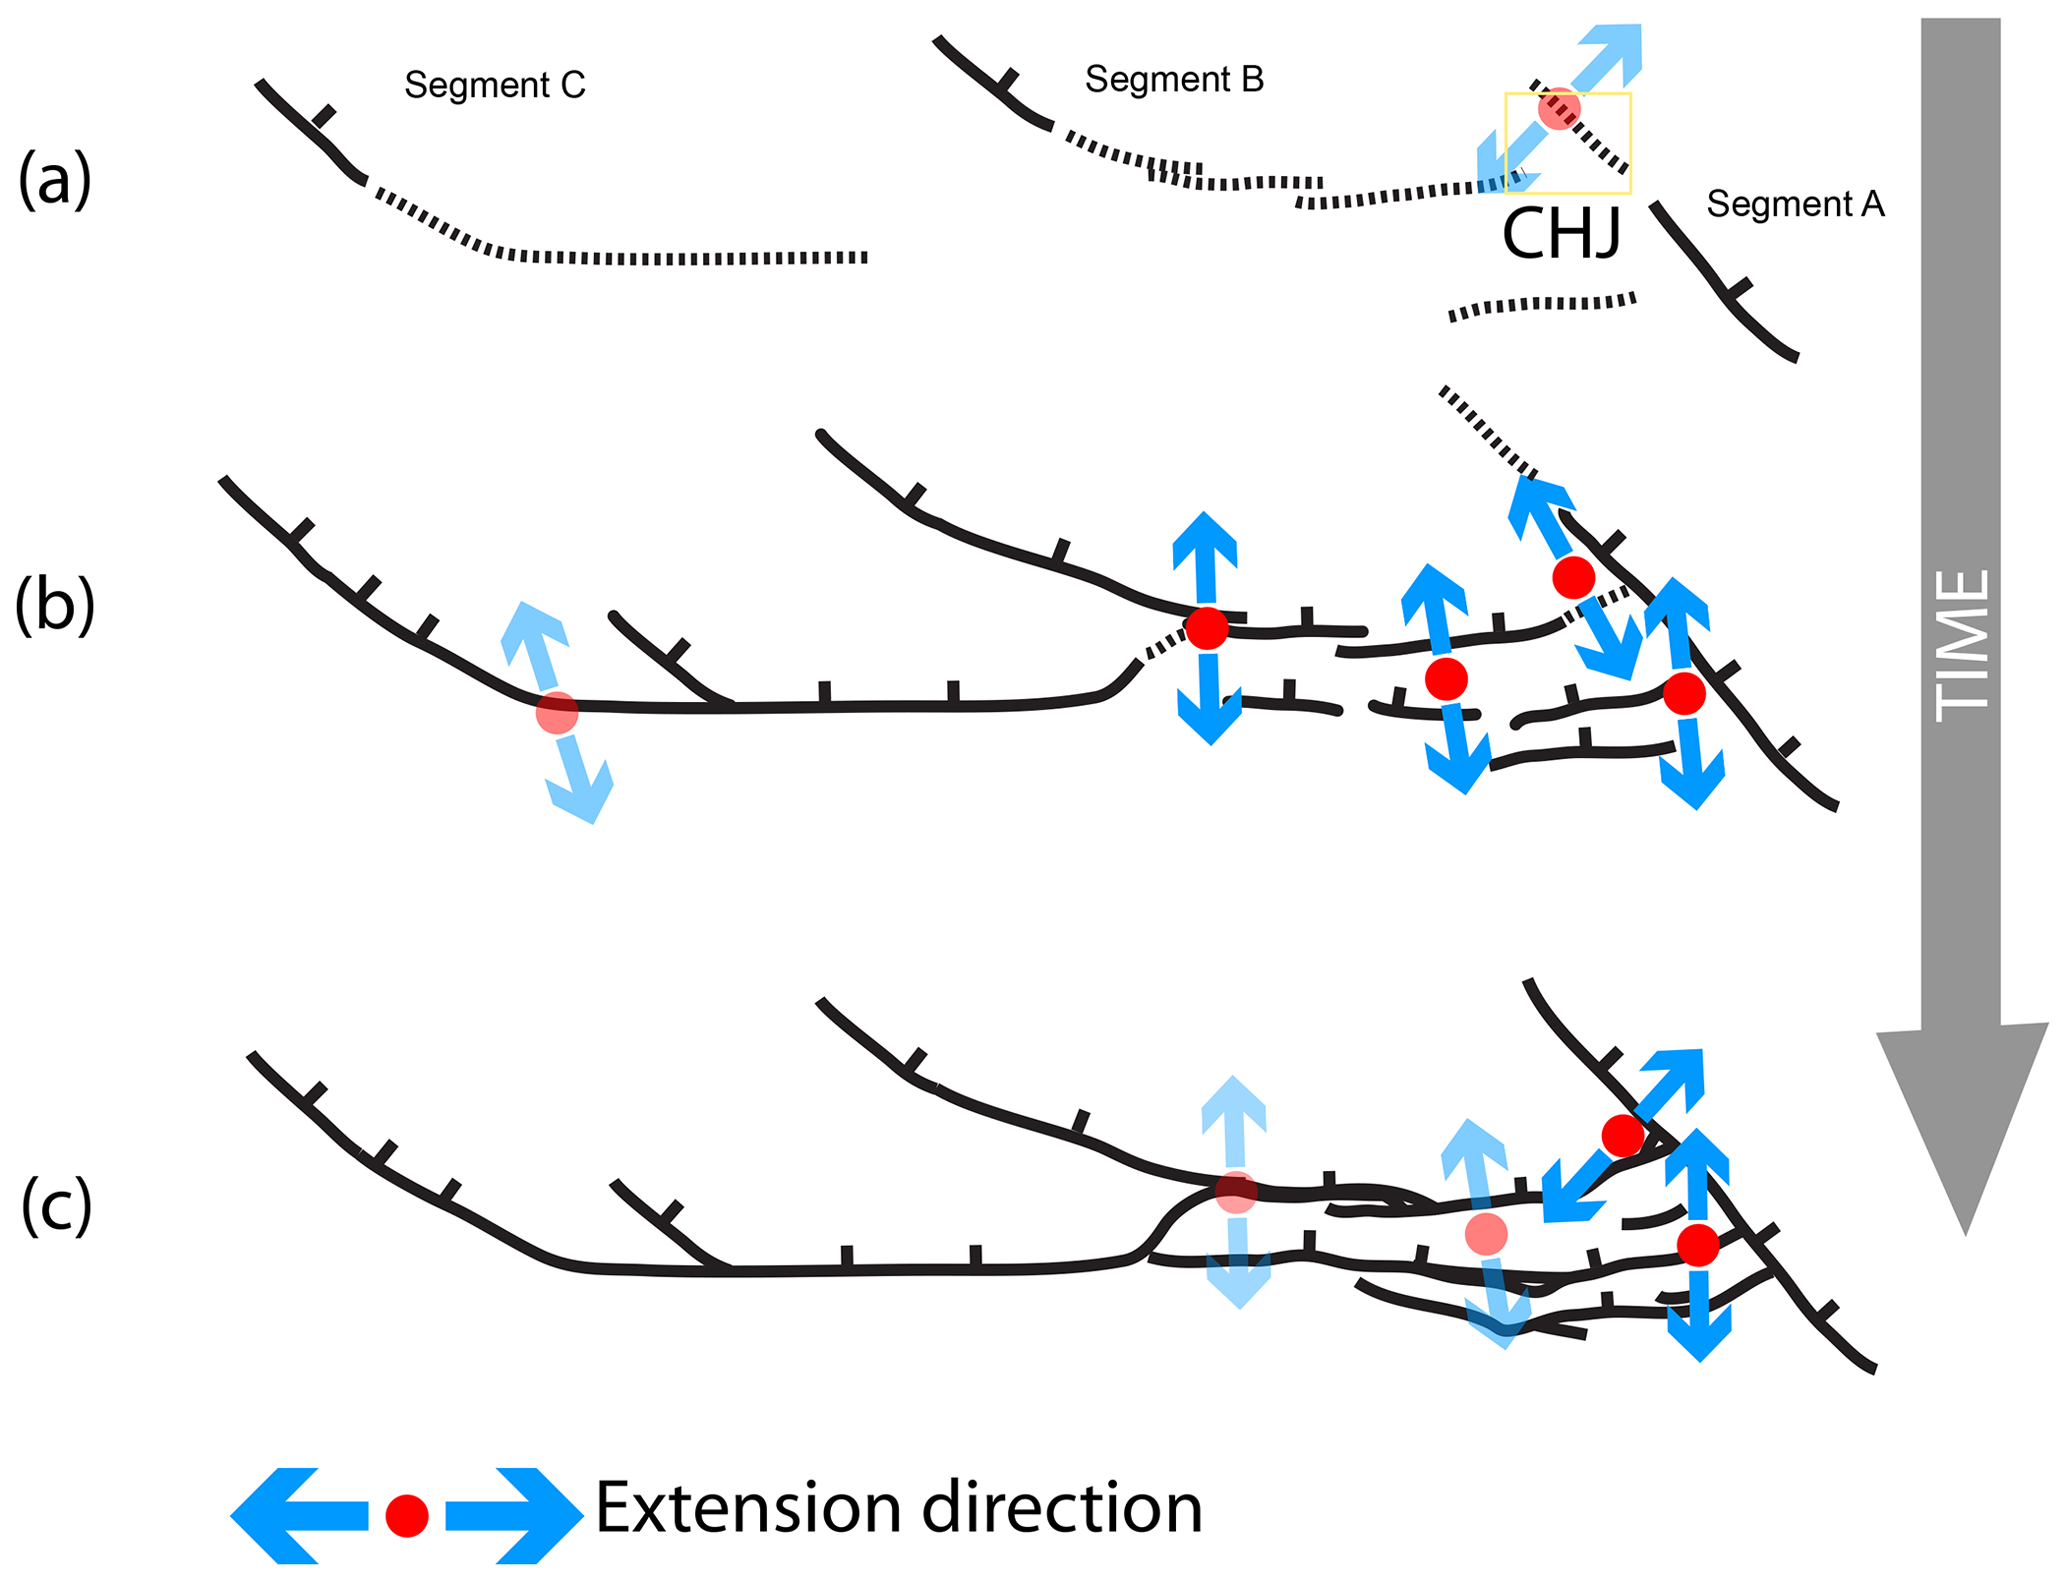
Figure 8Sketch of the evolution of the Courthouse Junction branch point (CHJ). Broken lines are damage zones in front of normal faults (lines) (see Peacock et al., 2017b). Blue arrows point in the direction of extension; light blue symbols are inferred. (a) The faults are isolated. The Moab Fault (Segment A) forms under the influence of the regional NE–SW extension direction (based on fault undulations on Segment A and the thick deformation bands set, described by Johansen et al., 2015). (b) When Segment B, initially formed as a parallel fault, started to rotate and approached Segment A, the segments became kinematically linked, and the minimum principal stress rotated at CHJ to the NW–SE (deformation band Sets 1 and 2 and 3 and 4). (c) When Segments A and B connected and became hard linked or geometrically linked, the minimum principal stress at CHJ rotated back to the regional stress state (deformation band Set 5, 6 and 7). The outline of these sketches corresponds roughly to the area shown in Fig. 3b.
In stage (ii) (Fig. 8b), the two faults start to interact. Set 1 and 2 start to form in the damage zone around the fault tip of Segment B and develop further in the interaction damage zone, in a heterogeneous rotating stress field. This stress field eventually causes a second group of deformation structures (set 3 and 4) to form. The difference in orientation of the extension axis between the results of Set 1 and 2 and Set 3 and 4 is small, but the maximum principle strain (λ1 in Fig. 6) rotates slightly away from vertical.
In stage (iii) the Segments A and B connected and became geometrically hard linked. The stress state in the Courthouse branch point rotates back to regional extension direction of NE–SW tension as seen in the NDA analysis of Set 5, 6 and 7 (Fig. 8c).
The relative timing of the observations outside CHJ is poorly constrained, but extension at locations I, II and III was roughly N–S (Fig. 8b). If we assume that Set Ia formed before Set Ib, the rotation caused by the linkage of Segments A and B corresponds to the minor rotation of axes at this location. In locations II and III we infer that the stress states were not influenced by the connection of Segments A and B, and deformation axes are assumed to be relatively constant here. At location IV our data suggest that extension was with a slight anticlockwise rotation.
The changes in orientation of the principal stresses over time in CHJ are interpreted to show the local, third-order stress evolution. The northern termination of the Moab Fault (Segments A, B and C but before the relay ramps between them were breached) initially formed in a regional stress field, an overall NE–SW regional extension. The approach of Segment B as the relay ramp was breaching caused local stress rotations around the fault tip, causing new structures to form. Thomas and Pollard (1993) showed that near-tip stresses in models of en échelon mode I fractures in a similar geometry dominate over the regional stresses and these stresses change before oblique intersection. Davatzes et al. (2005) modelled the stress state at a branch point by combining observations from the Courthouse branch point and the branch point close to location IV (Fig. 3). Their models are iterative, and the calculated stress orientations are similar to our results.
Peacock at al. (2017a) discussed how the interaction damage zone can influence fluid flow before the faults become geometrically linked. Eichubl et al. (2009) inferred that most diagenetic cement deposits in the CHJ are associated with Set 5, 6 and 7, which formed after the faults became hard linked. They identify the structures associated with this set as joints and not as deformation bands. Johansen et al. (2005) however shows that joints in the CHJ formed inside a deformation band (an observation shared by us), and thus jointing postdates the formation of deformation bands. This suggests that the diagenetic overprint in the CHJ is later than the abutting of the fault.
We analyse subsequent generations of striated minor fault planes in the overprinting damage zones of interacting normal faults in porous sandstone, at Courthouse Junction, near Moab, UT.
By combining our own measurements with published data on the relative age of these structures, we classified the observations in four sets. Using numeric dynamic analysis (NDA) the orientation of the kinematic axes was calculated for three of these sets, and inferences were made on the first set. We found three different palaeo-extension directions in the sets, recording the evolution of stress/strain axes during the abutting process.
Stage 1 of deformation direction is a regional extension in the NE–SW direction. In this case study of a single-tip interaction of abutting faults, we find a near-90∘ rotation of the extension direction (from NE–SW to NW–SE) as the stress fields around the main fault and the abutting faults start to interact when they are kinematically linked in stage (ii). Once the faults abut and become geometrically linked, stage (iii), there is a rotation back to the regional extension direction. This evolution represents a third-order local change in the regional stress field, caused by relay ramp breaching and abutting faults.
Data of this study are available on reasonable request from the author.
HvG performed the field investigation, data analysis and conceptualized, and wrote the first draft. JLU provided supervision, in-depth discussions and validation throughout, including extensive revisions of the original draft.
The authors declare that they have no conflict of interest.
We thank Bert de Wijn and Andreas Frischbutter (Wintershall) as well as Janneke IJmker, Steffen Abe, Frank Strozyk, Myron Thomas and Zoltan Komoroczi for discussions of and critical comments on the paper. The authors thank Fabrizio Balsamo and an anonymous reviewer for constructive criticisms, which much improved the paper, as well as the topical editor, Federico Rossetti, for overseeing the review process.
This paper was edited by Federico Rossetti and reviewed by Fabrizio Balsamo and one anonymous referee.
This work was funded by Wintershall GmbH through the “Tight Gas Initiative” of Wintershall and RWTH Aachen University.
Ackermann, R. V. and Schlische, R. W.: Anticlustering of small normal faults around larger faults, Geology, 25, 1127–1130, doi:10.1130/0091-7613, 1997.
Anderson, E. M.: The dynamics of faulting and dyke formation with applications to Britain, First edition, Oliver and Boyd, Edinburgh, 206 pp., 1951.
Angelier, J.: Determination of the mean principal directions of stresses for a given fault population, Tectonophysics, 56, 17–26, doi:10.1016/0040-1951(79)90081-7 , 1979.
Angelier, J.: Tectonic analysis of fault slip data sets, J. Geophys. Res., 89, 5838–5848, doi:10.1029/JB089iB07p05835, 1984.
Angelier, J.: Extension and rifting – the Zeit region, Gulf of Suez., J. Struct. Geol., 7, 605–612, doi:10.1016/0191-8141(85)90032-X, 1985.
Angelier, J.: Inversion of field data in fault tectonics to obtain the regional stress-III, A new rapid direct inversion method by analytical means, Geophysics Journal International, 103, 363–376, doi:10.1111/j.1365-246X.1990.tb01777.x, 1990.
Angelier, J.: Fault Slip Analysis and Paleostress Reconstruction, in: Continental Deformation, edited by: Hancock, P. L., Pergamon Press, Oxford, 53–100, 1994.
Angelier, J., Colletta, B., and Anderson, R. E.:. Neogene paleostress changes in the Basin and Range: A case study at Hoover Dam, Nevada-Arizona, Geol. Soc. Am. Bull., 96, 347–361, doi:10.1130/0016-7606, 1985.
Aydin, A. and Johnson, A. M.: Development of faults as zones of deformation bands and as slip surfaces in sandstones, Pure Appl. Geophys., 116, 931–942, doi:10.1007/BF00876547, 1978.
Balsamo, F., Storti, F., Piovano, B., Salvini, F., Cifelli, F., and Lima, C.: Time dependent structural architecture of subsidiary fracturing and stress pattern in the tip region of an extensional growth fault system, Tarquinia basin, Italy, Tectonophysics, 454, 54–69, doi:10.1016/j.tecto.2008.04.011, 2008.
Bles, J. L., Bonijoly, D., Castaing, C., and Gros, Y.: Successive post-Variscan stress fields in the French Massif Central and its borders (Westerns European plate): comparison with geodynamic data, Tectonophysics, 79–111, doi:10.1016/0040-1951(89)90185-6, 1989.
Bott, M. H. P.: The mechanics of oblique slip faulting, Geol. Mag., 96, 109–117, doi:10.1017/S0016756800059987, 1959.
Bozkurt Çiftçi, N. and Bozkurt, E.: Anomalous stress field and active breaching at relay ramps: a field example from Gediz Graben, SW Turkey, Geol. Mag., 144, 687–699, doi:10.1017/S0016756807003500, 2007.
Cartwright, J. A., Trudgill, B. D., and Moore, J. M.: Fault growth by segment linkage: an explanation for scatter in maximum displacement and trace length data from the Canyonlands Grabens of SE Utah, J. Struct. Geol., 9, 1319–1326, doi:10.1016/0191-8141(95)00033-A, 1995.
Celerier, B., Etchecopar, A., Bergerat, F., Vergely, P., and Arthaud, F.: Inferring stress from faulting: from Early concepts to inverse methods, Tectonophysics, Elsevier, 581, 206–219, doi:10.1016/j.tecto.2012.02.009, 2012.
Choi, P.-Y., Kwon, S.-K., Hwang, J.-H., Lee, S. R., and An, G.-O.: Paleostress analysis of the Pohang-Ulsan area, Southeast Korea: tectonic sequence and timing of block rotation, Geosci. J., 5, 1–18, doi:10.1007/BF02910169, 2001.
Coulomb, C. A.: Sur une application des règles maximis et minimis à quelques problèmes de statique à l'architecture, Acad. Sci. Paris Mém. Math. Phys., 7, 343–382, 1776.
Crider, J. G. and Peacock, D. C. P.: Initiation of brittle faults in the upper crust: a review of field observations, J. Struct. Geol., 26, 691–707, doi:10.1016/j.jsg.2003.07.007, 2004.
Cruikshank, K. M. and Aydin, A.: Unweaving the joints in Entrada Sandstone, Arches National Park, Utah, J. Struct. Geol., 17, 409–421, doi:10.1016/0191-8141(94)00061-4, 1995.
Davatzes, N. C. and Aydin, A.: Overprinting faulting mechanisms in high porosity sandstones of SE Utah, J. Struct. Geol., 25, 1795–1813, doi:10.1016/S0191-8141(03)00043-9, 2003.
Davatzes, N. C., Aydin, A., and Eichhubl, P.: Overprinting faulting mechanisms during the development of multiple fault sets in sandstone, Chimney Rock fault array, Utah, USA, Tectonophysics, 363, 1–18, doi:10.1016/S0040-1951(02)00647-9, 2003.
Davatzes, N. C., Eichhubl, P., and Aydin, A.: Structural evolution of fault zones in sandstone by multiple deformation mechanisms: Moab fault, Southeast Utah., Geol. Soc. Am. Bull., 117, 135–148, doi:10.1130/B25473.1, 2005.
Delogkos, E., Childs, C., Manzocchi, T., and Walsh, J. J.: The role of bed-parallel slip in the development of complex normal fault zones, J. Struct. Geol., 97, 199–211, doi:10.1016/j.jsg.2017.02.014, 2017.
Doblas, M.: Slickenside kinematic indicators, Tectonophysics, 295, 187, doi:10.1016/S0040-1951(98)00120-6, 1998.
Doelling, H. H.: Geologic map of the Moab and eastern part of the San Rafael Desert Quadrangles, Grand and Emery counties, Utah, and Mesa county, Colorado, Map 180, Utah, Geological Survey, 2002.
Duffy, O., Bell, R. E., Jackson, C. A.-L., Gawthorpe, R. L., and Whipp, P. S.: Fault growth and interactions in a multiphase rift fault network: Horda Platform, Norwegian North Sea, J. Struct. Geol., 80, 99–119, doi:10.1016/j.jsg.2015.08.015, 2015.
Dyksterhuis, S., Müller, R. D., and Albert, R. A.: Paleostress field evolution of the Australian continent since the Eocene, J. Geophys. Res.-Sol. Ea., 110, B05102, doi:10.1029/2003JB002728, 2005.
Eichhubl, P., Davatz, N. C., and Becker, S. P: Structural and diagenetic control of fluid migration and cementation along the Moab fault, AAPG Bull., 93, 653–681, doi:10.1306/02180908080, 2009.
Ferrill, D. A., Morris, A. P., and McGinnes, R. N.: Crossing conjugate normal faults in filed exposures and seismic data, AAPG Bull., 93, 1471–1488, doi:10.1306/06250909039, 2009.
Fossen, H.: Deformation bands formed during soft-sediment deformation: Observations from SE Utah, Mar. Petrol. Geol., 27, 215–222, doi:10.1016/j.marpetgeo.2009.06.005, 2010.
Fossen, H. and Rotevatn, A.: Fault linkage and relay structures in extensional settings – A review, Earth-Sci. Rev., 154, 14–28, doi:10.1016/j.earscirev.2015.11.014, 2016.
Fossen, H., Schultz R. A., Shipton, Z. K., and Mair, K.: Deformation bands in sandstone: a review, J. Geol. Soc. London, 164, 755–769, doi:10.1144/0016-76492006-036, 2007.
Fossen, H., Johansen, T. E. S., Hesthammer, J., and Rotevatn, A.: Fault interaction in porous sandstone and implications for reservoir management; examples from southern Utah, AAPG Bull., 89, 1593–1606, doi:10.1306/07290505041, 2005.
Foxford, K. A., Garden, I. R. , Guscott, S. C., Burley, S. D., Lewis, J. L. L., Walsh, J. J., and Watterson J.: The field geology of the Moab Fault, in: Geology and Resources of the Paradox Basin, edited by: Huffmann, A. C., Lund W. R. L., and Godwin, L. H., Utah Geological Association Guidebook, 265–283, 1996.
Foxford, K. A., Walsh, J. J., and Watterson, J.: Structure and content of the Moab Fault Zone, Utah, USA, and its implications for fault seal prediction, edited by: Jones, G., Fisher, Q. J., and Knipe, R. J., Faulting, Fault Sealing and Fluid Flow in Hydrocarbon Reservoirs, J. Geol. Soc. London, 147, 87–103, doi:10.1144/GSL.SP.1998.147.01.06, 1998.
Gölke, M. and Coblentz, D.: Origins of the European regional stress field, Tectonophysics, 266, 11–24, doi:10.1016/S0040-1951(96)00180-1, 1996.
Gruenthal, G. and Stromeyer, D.: The recent crustal stress field in Central Europe sensu lato and its quantitave modelling, Geol. Mijnbouw, 73, 173–180, 1994.
Gupta, A. and Scholz, C. H.: A model of normal fault interaction based on observations and theory, J. Struct. Geol., 22, 865–879, doi:10.1016/S0191-8141(00)00011-0, 2000.
Gutiérrez, F.: Origin of the salt valleys in the Canyonlands section of the Colorado Plateau: Evaporite-dissolution collapse versus tectonic subsidence, Geomorphology, 57, 423–435, doi:10.1016/S0169-555X(03)00186-7, 2004.
Ilic, A. and Neubauer, F.: Tertiary to recent oblique convergence and wrenching of the Central Dinarides: Constraints from a palaeostress study, Tectonophysics, 410, 465–484, doi:10.1016/j.tecto.2005.02.019, 2005.
Ingram, G. M. and Urai, J. L.: Top-seal leakage through faults and fractures; the role of mudrock properties, Geological Society Special Publications, 158, 125–135, 1999.
Johansen, T. E. S., Fossen, H., and Kluge, R.: The impact of syn-faulting porosity reduction on damage zone architecture in porous sandstone: an outcrop example from the Moab Fault, Utah, J. Struct. Geol., 27, 1469–1485, doi:10.1016/j.jsg.2005.01.014, 2005.
Kettermann, M., Grützner, C., van Gent, H. W., Urai, J. L., Reicherter, K., and Mertens, J.: Evolution of a highly dilatant fault zone in the grabens of Canyonlands National Park, Utah, USA – integrating fieldwork, ground-penetrating radar and airborne imagery analysis, Solid Earth, 6, 839–855, https://doi.org/10.5194/se-6-839-2015, 2015.
Kettermann, M. and Urai, J. L.: Changes in structural style of normal faults due to failure mode transition: First results from excavated scale models, J. Struct. Geol., 74, 105–116, doi:10.1016/j.jsg.2015.02.013, 2015.
Kim, Y.-S., Peacock, D. C. P., and Sanderson, D. J.: Fault damage zones, J. Struct. Geol., 26, 503–517, doi:10.1016/j.jsg.2003.08.002, 2004.
Kleinspehn, K. L., Pershing, J., and Teyssier, C.: Paleostress stratigraphy: A new technique for analyzing tectonic control on sedimentary-basin subsidence, Geology, 17, 253–256, doi:10.1130/0091-7613, 1989.
Komoróczi, Z.: Fractures and faults in tight gas sandstones: a study using laboratory and field data, Doctoral thesis, Faculty of Georesources and Materials Engineering, RWTH Aachen University, available at: http://publications.rwth-aachen.de/record/482027/files/482027.pdf (last access: December 2019), 2014.
Larroque, J. M., Etchecopar, A., and Philip, H.: Evidence for the permutation of stresses (sigma)1 and (sigma)2 in the Alpine foreland: the example of the Rhine graben, Tectonophysics, 144, 315–322, doi:10.1016/0040-1951, 1987.
Liang, B. and Wyss, M.: Estimates of orientations of stress and strain tensors based on fault-plane solutions in the epicentral area of the great Hawaiian earthquake of 1868, B. Seismol. Soc. Am., 81, 2320–2334, 1991.
Lonergan, R. J. H. J. L., Rawnsley, K., and Sanderson, D. J. (Eds.): Fractural Reservoirs, The Geological Society London, London, 285 pp., 2007.
Maerten, L., Gillespie, P., and Pollard, D. D.: Effects of local stress perturbation on secondary fault development, J. Struct. Geol., 24, 145–153, doi:10.1016/S0191-8141(01)00054-2, 2002.
Martínez-Martínez, J. M.: Lateral interaction between metamorphic core complexes and less-extended, tilt-block domains: the Alpujarras strike-slip transfer fault zone (Betics, SE Spain), J. Struct. Geol., 28, 602–620, doi:10.1016/j.jsg.2006.01.012, 2006.
Mohr, O.: Welche Umstände bedingen die Elastitätsgrenze und den Bruch eines Materials?, Z. Ver. Dtsch. Ing., 44, 1524, 1572–1577, 1900.
Nicol, A., Walsh, J. J., Villamor, P., Seebeck, H., and Berryman, K. R.: Normal fault interactions, paleoearthquakes and growth in an active rift. J. Struct. Geol., 32, 1101–1113, doi:10.1016/j.jsg.2010.06.018, 2010.
Nikolinakou, M. A., Luo, G., Hudec, M. R., and Flemings, P. B.: Geomechanical modeling of stresses and pore pressures in mudstones adjacent to salt bodies, Presented at the 45th US Rock Mechanics/Geomechanics Symposium, 26–29 June 2011, American Rock Mechanics Association, San Francisco, California, USA, 1–8, 2011.
Nuccio, V. F. and Condon, S. M.: Burial and Thermal History of the Paradox Basin, Utah and Colorado, and Petroleum Potential of the Middle Pennsylvanian Paradox Formation, Report, US Geological Survey, Reston, VA, USA, 47 pp., 1996.
Ortner, H., Reiter, F., and Acs, P.:. Easy handling of tectonic data: the programs TectonicVB for Mac and Tectonics FP for Windows(tm), Comput. Geosci., 28, 1193–1200, https://doi.org/10.1016/S0098-3004(02)00038-9, 2002.
Peacock, C. P.: Propagation, interaction and linkage in normal fault systems, Earth-Sci. Rev., 58, 121–142, doi:10.1016/S0012-8252(01)00085-X, 2002.
Peacock, D., Nixon, C., Sanderson, D., Rotevatn, A., and Zuluaga, L.: Interacting faults, J. Struct. Geol., 97, 1–22, doi:10.1016/j.jsg.2017.02.008, 2017a.
Peacock, C. P. Dimmen, V., Rotevatn, A., and Sanderson, D. J.: A broader classification of damage zones, J. Struct. Geol., 102, 179–192, doi:10.1016/j.jsg.2017.08.004, 2017b.
Plateaux, R., Angelier, J., Bergerat, F., Cappa, F., and Stefánsson, R.: Stress changes induced at neighbouring faults by the June 2000 earthquakes, South Iceland Seismic Zone, Terra Nova, 22, 79–86, doi:10.1111/j.1365-3121.2009.00919.x, 2009.
Ramsay, J. G. and Lisle, R. J.: The Techniques of modern structural geology Volume 3: Applications of continuum mechanics in structural geology, Academic Press, London, 700–1061, 2000.
Rotevatn, A., Tveranger, J., Howell, J. A., and Fossen, H.: Dynamic investigation of the effect of a relay ramp on simulated fluid flow: geocellular modelling of the Delicate Arch Ramp, Utah, Petrol. Geosci., 15, 45–58, doi:10.1144/1354-079309-779, 2009a.
Rotevatn, A., Buckley, S. J., Howell, J. A., and Fossen, H.: Overlapping faults and their effect on fluid flow in different reservoir types: A LIDAR-based outcrop modeling and flow simulation study, AAPG Bull., 93, 407–427, doi:10.1306/09300807092, 2009b.
Rotevatn, A., Fossen, H., Hesthammer, J., Aas, T. E., and Howell, J.: Are relay ramps conduits for fluid flow?, Structural analysis of a relay ramp in Arches National Park, Utah, in: Fractured Reservoirs, edited by: Lonergan, L., Jolly, R., Rawnsley, K., and Sanderson, D. J., London, 55–71, doi:10.1144/GSL.SP.2007.270.01.04, 2007.
Shipton, Z. K. and Evans, J. P.: Structural Heterogeneity and Permeability in Faulted Eolian Sandstone: Implications for Subsurface Modeling of Faults, AAPG Bull., 86, 869–883, doi:10.1306/61EEDBC0-173E-11D7-8645000102C1865D, 2002.
Shipton, Z. K. and Cowie, P. A.: A conceptual model for the origin of fault damage zone structures in high-porosity sandstone, J. Struct. Geol., 25, 333–344, doi:10.1016/S0191-8141(02)00037-8, 2003.
Simón, J. L.: Forty years of paleostress analysis: Has it attained maturity?, J. Struct. Geol., 125, 124–133, doi:10.1016/j.jsg.2018.02.01, 2019.
Sippel, J., Scheck-Wenderoth, M., Reicherter, K., and Mazur, S.: Paleostress states at the south-western margin of the Central European Basin System – Application of fault-slip analysis to unravel a polyphase deformation pattern, Tectonophysics, 470, 129–146, doi:10.1016/j.tecto.2008.04.010, 2009.
Sperner, B.: Computer programs for the kinematic analysis of brittle deformation structures, in: Tübinger Geowissenschaftliche Arbeiten, Reihe A, Geologie, Paläontologie, Stratigraphie, edited by: Frisch, W., Tübingen, Eberhard Karls University of Tübingen, 1996.
Sperner, B., Ratschbacher, L., and Ott, R.: Fault-striae analysis: a Turbo pascal program for graphical presentation and reduced stress tensor calculation, Comput. Geosci., 19, 1361–1388, doi:10.1016/0098-3004(93)90035-4, 1993.
Soliva, R., Ballas, G., Fossen, H., and Philit, S.: Tectonic regime controls clustering of deformation bands in porous sandstone, Geology, 44, 423–426, doi:10.1130/G37585.1, 2016.
Thomas, A. L. and Pollard, D. D.: The geometry of echelon fractures in rock: implications from laboratory and numerical experiments, J. Struct. Geol., 15, 323–334, doi:10.1016/0191-8141(93)90129-X, 1993.
Urai, J. L., Nover, G., Zwach, C., Ondrak, R., Schöner, R., and Kroos, B.: Transport Processes, in: Dynamics of Complex Intracontinental Basins: The Central European Basin System, Springer, 367–388, 2008.
van Gent, H. W., Back, S., Urai, J. L., Kukla, P. A., and Reicherter, K.: Paleostresses of the Groningen area, the Netherlands – results of a seismic based structural reconstruction, Tectonophysics, 470, 147–161, doi:10.1016/j.tecto.2008.09.038, 2008.
van Gent, H. W., Holland, M., Urai, J. L., and Loosveld, R.: Evolution of fault zones in carbonates with mechanical stratigraphy – insights from scale models using layered cohesive powder, J. Struct. Geol., 32, 1375–1391, doi:10.1016/j.jsg.2009.05.006, 2010a.
van Gent, H. W., Back, S., Urai J. L., and Kukla, P. A.: Small-scale faulting in the Upper Cretaceous of the Groningen Block (The Netherlands): 3D seismic interpretation, fault plane analysis and paleostress, J. Struct. Geol., 32, 537–553, doi:10.1016/j.jsg.2010.03.003, 2010b.
Vandycke, S.: Paleostress records in Cretaceous formations in NW Europe: extensional and strike-slip events in relationships with Cretaceous-Tertiary inversion tectonics, Tectonophysics, 357, 119—136, doi:10.1016/S0040-1951(02)00365-7, 2002.
Vrolijk, P., Urai, J. L., and Kettermann, M.: Clay Smear: Review of Mechanisms and Applications, J. Struct. Geol., 86, 95–152, doi:10.1016/j.jsg.2015.09.006, 2016.
Wallace, R. E.: Geometry of shearing stress and relation to faulting, J. Geol., 59, 111–130, 1951.
Walsh, J. J. and Watterson, J.: Geometric and kinematic coherence and scale effects in normal fault systems, in: The Geometry of Normal Faults, edited by: Roberts, A. M., Yielding, G., and Freeman, B., London, Geological Society of London, 193–203, 1991.
Walsh, J. J., Watterson, J., Heath, A. E., and Childs, C.: Representation and scaling of faults in fluid flow models, Petrol. Geosci., 4, 241–251, doi:10.1144/petgeo.4.3.241, 1998.
Warners-Ruckstuhl, K., Govers, R., and Wortel, R.:. Tethyan collision forces and the stress field of the Eurasian Plate, Geophys. J. Int., 195, 1–15, doi:10.1093/gji/ggt219, 2013.
Wyss, M., Liang, B., Tanigawa, R., and Wu, X.: Comparison of orientations of stress and strain tensors based on fault plane solutions in Kaoiki, Hawaii, J. Geophys. Res., 97, 4769–4790, doi:10.1029/91JB02968, 1992.
Yale, D. P.: Fault and stress magnitude controls on variations in the orientation of in situ stress, Geol. Soc. London, 209, 55–64, doi:10.1144/GSL.SP.2003.209.01.06, 2003.