the Creative Commons Attribution 4.0 License.
the Creative Commons Attribution 4.0 License.
 | 08 Jun 2020
Monitoring crustal CO2 flow: methods and their applications to the mofettes in West Bohemia
Josef Vlček
Martin Lanzendörfer
Monitoring of CO2 degassing in seismoactive areas allows the study of correlations of gas release and seismic activity. Reliable continuous monitoring of the gas flow rate in rough field conditions requires robust methods capable of measuring gas flow at different types of gas outlets such as wet mofettes, mineral springs, and boreholes. In this paper we focus on the methods and results of the long-term monitoring of CO2 degassing in the West Bohemia/Vogtland region in central Europe, which is typified by the occurrence of earthquake swarms and discharge of carbon dioxide of magmatic origin. Besides direct flow measurement using flowmeters, we introduce a novel indirect technique based on quantifying the gas bubble contents in a water column, which is capable of functioning in severe environmental conditions. The method calculates the mean bubble fraction in a water–gas mixture from the pressure difference along a fixed depth interval in a water column. Laboratory tests indicate the nonlinear dependence of the bubble fraction on the flow rate, which is confirmed by empirical models found in the chemical and nuclear engineering literature. Application of the method in a pilot borehole shows a high correlation between the bubble fraction and measured gas flow rate. This was specifically the case for two coseismic anomalies in 2008 and 2014, when the flow rate rose during a seismic swarm to a multitude of the preseismic level for several months and was followed by a long-term flow rate decline. However, three more seismic swarms occurring in the same fault zone were not associated with any significant CO2 flow anomaly. We surmise that this could be related to the slightly farther distance of the hypocenters of these swarms compared to the two ones which caused the coseismic CO2 flow rise. Further long-term CO2-flow monitoring is required to verify the mutual influence of CO2 degassing and seismic activity in the area.
- Article
(7859 KB) - Full-text XML
- BibTeX
- EndNote


Long-term monitoring of crustal fluids activity provides a unique opportunity to better understand the relationships among tectonic processes, seismic activity, and migration of fluids in the Earth's crust. Carbon dioxide of deep origin represents a link between deep-seated magmatic sources of CO2, the fluid migration paths in the crust, which are controlled by the tectonic stress field, and the Earth surface's. The presented study is focused on the monitoring of CO2 degassing in the West Bohemia/Vogtland area, which is located in the western part of the Bohemian Massif (BM), the largest coherent surface exposure of basement rocks in central Europe. The western BM is hosting a junction of three tectonometamorphic units, Saxothuringian, Teplá–Barrandian, and Moldanubian (Franke, 2000). It is intersected by two regional tectonic structures, the NE–SW-trending Eger Rift (ER) and NNW–SSE-trending Mariánské Lázně Fault (MLF) (Fig. 1).
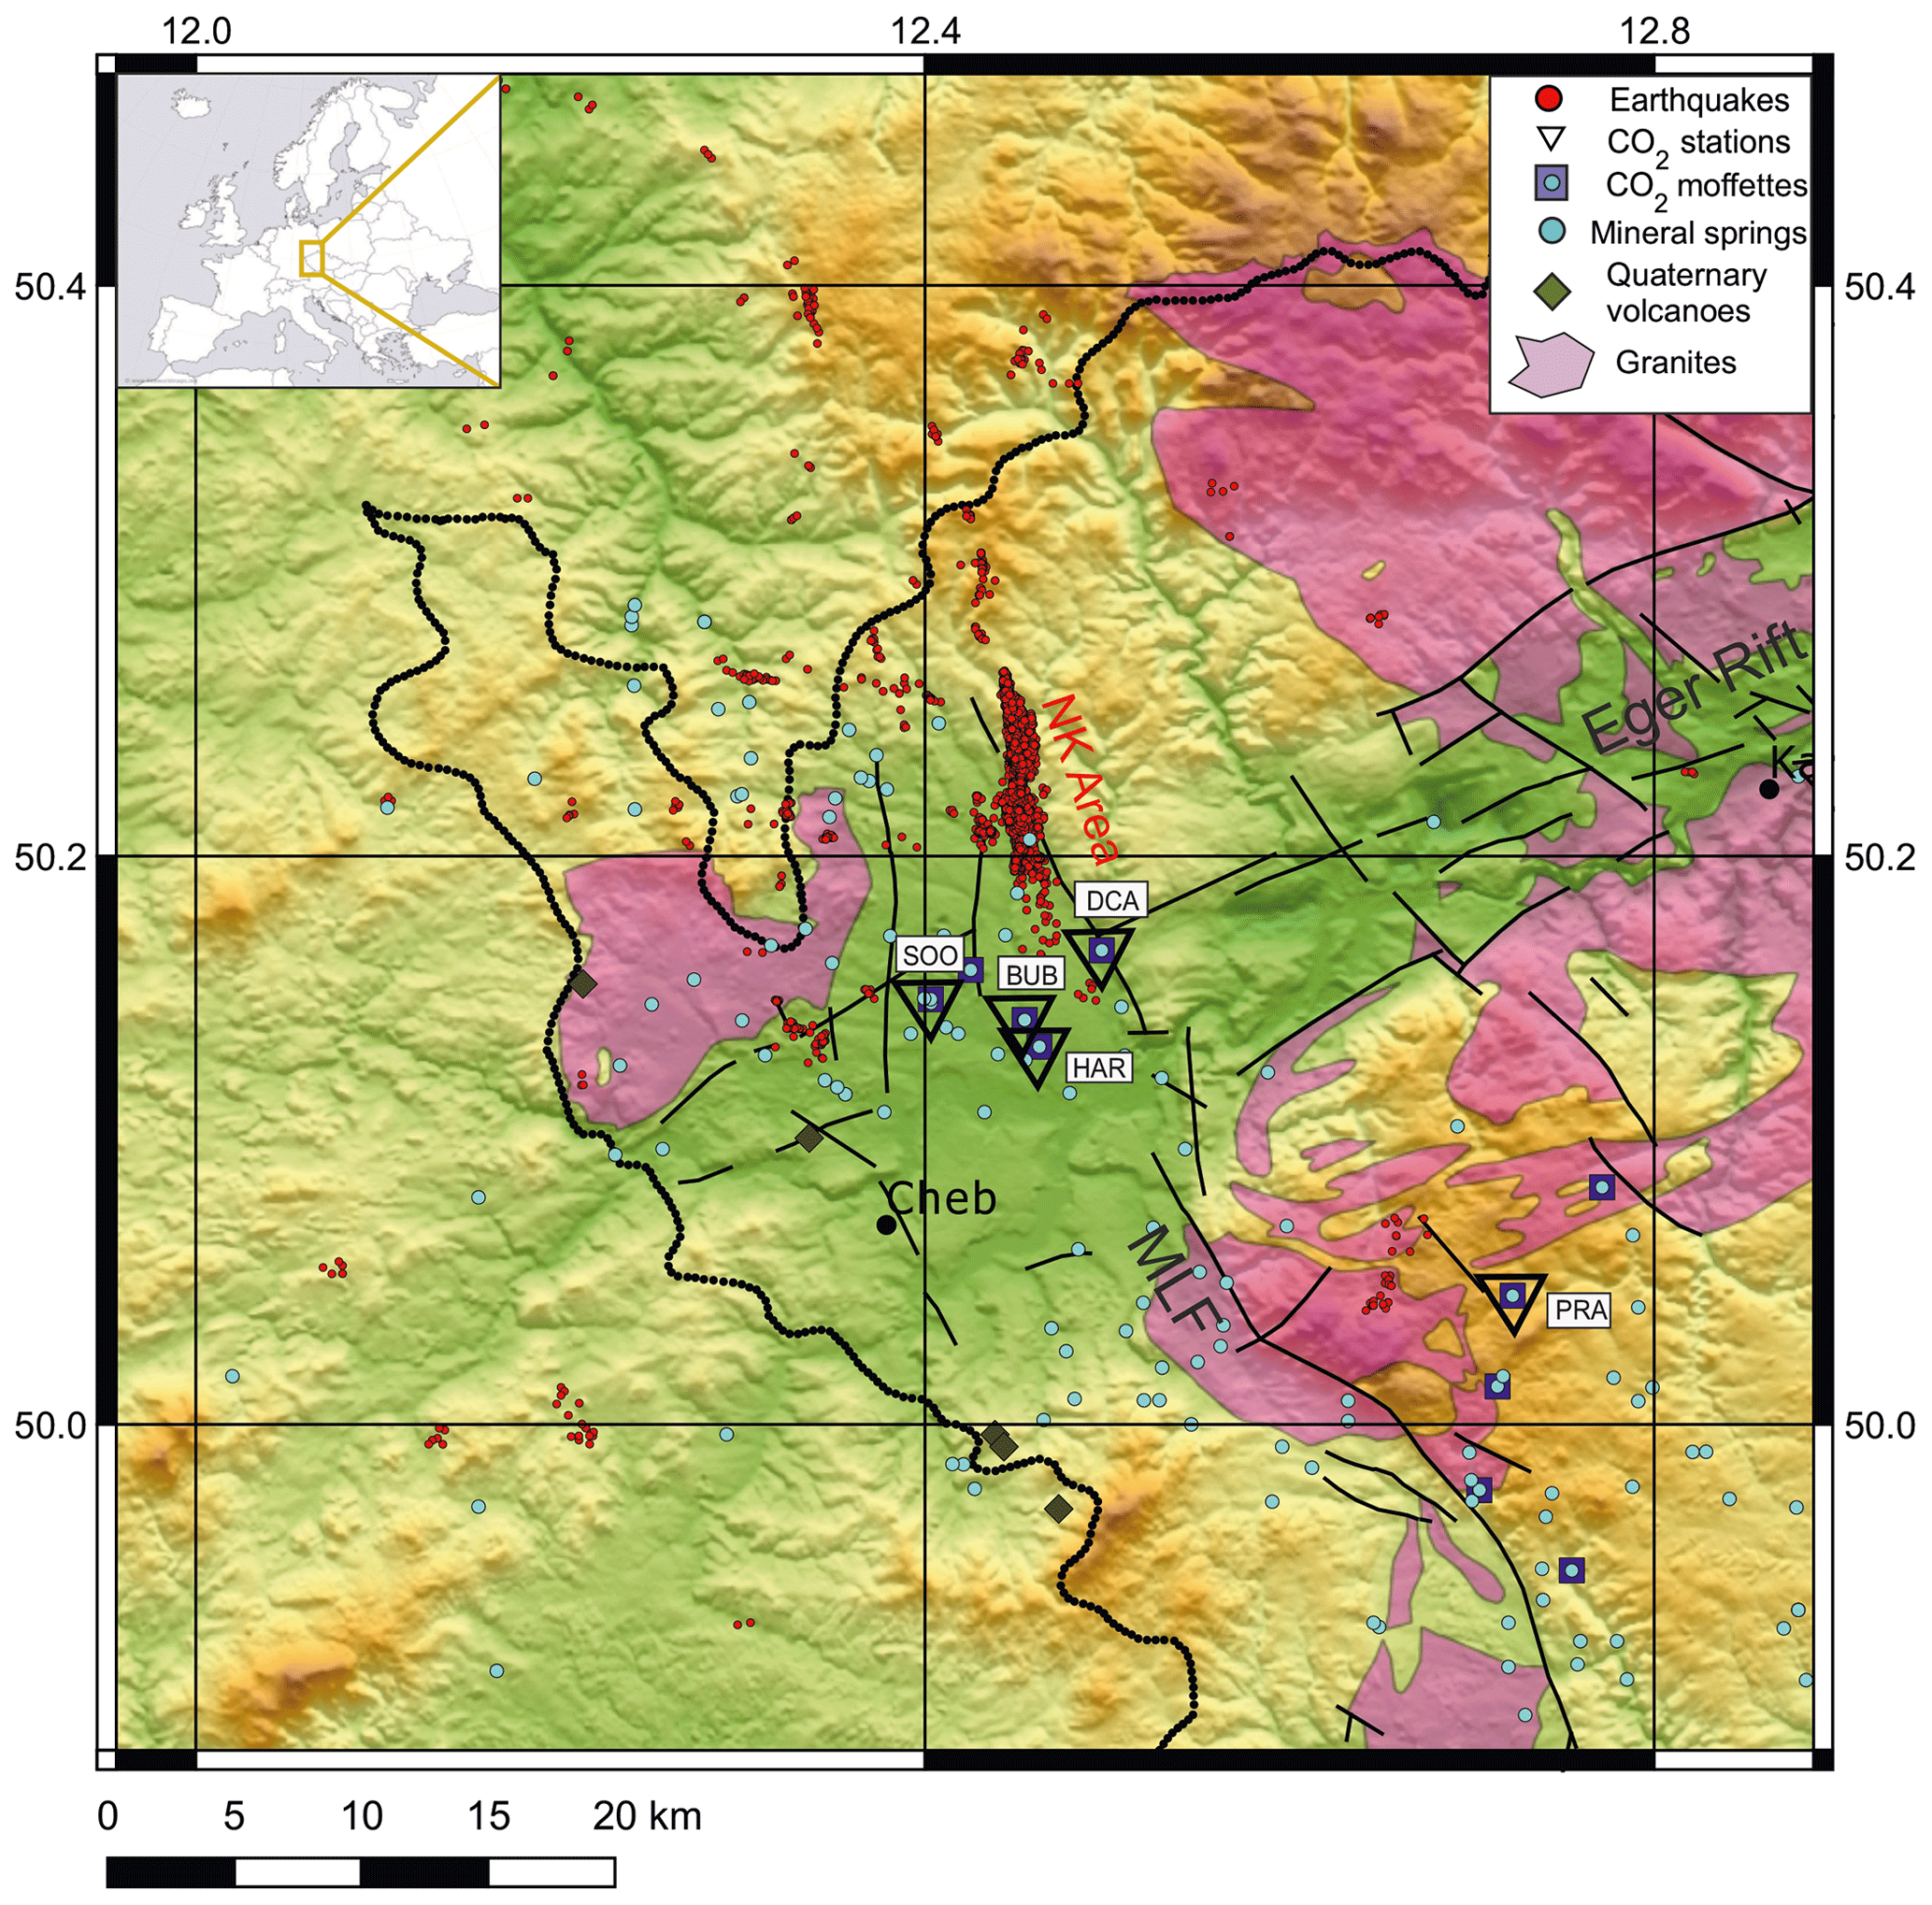
Figure 1Relief map of the West Bohemia/Vogtland region with the fault network, granite units, and major fault zones as Mariánské Lázně Fault (MLF) and Eger Rift. Seismic events, the major focal zone of Nový Kostel (NK area), CO2 monitoring stations, CO2 mofettes and mineral springs, and Quaternary volcanoes are also indicated (see the legend).
The Tertiary ER is a 300 km long striking structure characterized by elevated heat flow and Cenozoic volcanism, and its formation is thought to be related to Alpine collision (Ziegler, 1992). The Late Variscan MLF was reactivated several times during the geological history up to Cenozoic when it participated in the formation of the Cheb Basin (CB). CB is typified by a blocky structural fabric due to a network of faults. Besides the NNW and NW morphologically expressed marginal faults, faults striking NE, E–W, and N–S were also identified within the basin (Špičáková et al., 2000; Bankwitz et al., 2003).
The present geodynamic activity is manifested by earthquake swarms, massive CO2 degassing of mantle origin, and Quaternary volcanism (Fischer et al., 2014). Seismic activity in the form of earthquake swarms is concentrated in the area of CB, in particular the Nový Kostel focal zone (Fig. 1), where more than 80 % of seismic energy is released in frames of the whole seismogenic region. Here the hypocenters form a N–S-trending, steeply dipping belt in the depth range from 6 to 10 km; however, no clear fault outcrop has been identified that would match the focal zone geometry. The prevailing focal mechanisms coincide very well with the orientation of the fault zone striking 169∘ derived from the hypocenter trend. Inversion of focal mechanisms for stress field yields maximum compression direction in the range N135–155∘ E, which coincides well with the average direction N144∘ E in western Europe (Fischer et al., 2014). This direction is, however, parallel to the strike of the MLF, which indicates a passive role of the MLF in the present stress field (Vavryčuk, 2011).
The strongest earthquakes usually do not exceed ML 4.5, as was the case of all the eight major instrumentally recorded swarms between 1985 and 2018.
The concentration of the geodynamic phenomena in this small region is not clearly understood. Some authors relate this seismic activity to intersecting crustal faults (e.g., Bankwitz et al., 2003) or to fluids of mantle origin (e.g., Bräuer et al., 2003), which could originate from active magmatic underplating (Hrubcová et al., 2017).
The degassing occurs in the form of CO2-rich mineral waters and wet and dry mofettes in several degassing fields. Carbon dioxide is the carrier phase for mantle-derived minor components such as helium, the isotope ratios of which are the best tool to determine whether the fluids are of crustal or mantle-derived origin; high 3He∕4He ratios indicate that ascending gases are of mantle origin (Bräuer et al., 2003). The highest portions of mantle-derived helium (up to 6 Ra, where Ra corresponds to the 3He∕4He ratio of the atmosphere) were found in the CB; the Karlovy Vary (KV) degassing center has the lowest 3He∕4He ratios of 2.5 Ra. Lower He-isotope ratios (e.g., 3He∕4He < 6 Ra) probably reflect the gas mixing with crustal-derived He along fluid pathways (Bräuer et al., 2008). Also, the δ13C values in the CO2-rich gas escapes indicate their origin in the upper mantle (Weinlich et al., 1999; Bräuer et al., 2003). CO2 flow monitoring in West Bohemia has been conducted since the 1990s in a rather discontinuous way. The longest-running observation project is probably the monitoring of radon activity in Bad Brambach (Heinicke and Koch, 2000; Koch et al., 2003), which has been conducted since 1989.
Gas flow is concentrated in three degassing centers: Cheb Basin, Mariánské Lázně, and Karlovy Vary (KV) (Weinlich et al., 1999; Geissler et al., 2005; Kämpf et al., 2007). They are characterized by a high gas flow with daily discharge of dozens of tons of gas (Nickschick et al., 2015) with CO2 concentrations of more than 99 vol %. Cheb Basin also has the highest concentration of seismic activity, which makes it ideal for studying the relations between seismicity and gas flow. Interestingly, many studies of the local earthquake swarms show that they may be related to pressurized fluids in the crust and the ascent of gas. This has been pointed out by numerous researchers including Špičák and Horálek (2000), Hainzl and Fischer (2002), Fischer and Horálek (2005), and Hainzl et al. (2016), based on space-time analysis of the seismicity, Horálek et al. (2002), Vavryčuk (2002), and Vavryčuk and Hrubcová (2017), on the basis of moment tensor analysis, and Dahm and Fischer (2014) and Bachura and Fischer (2016), based on Vp∕Vs analysis of the volume of hypocenters. The last two studies show that compressible fluids are required to explain the low velocity ratio observed in the course of seismic activity.
Another long-time monitoring was carried out as part of the “Research of CO2 pressure field in the area of West Bohemian spas” project funded by the Ministry of the Environment of the Czech Republic from 1996 to 2005. Gas flow in open boreholes and gas pressure in closed boreholes were monitored at 11 gas escape sites in the Cheb Basin and near Mariánské Lázně (Škuthan et al., 2001; Hron and Škuthan, 2006). Monitoring of pressure in a closed well was preferred at many project sites since the functioning of mechanical flowmeters was unreliable due to condensation and freezing. A different type of CO2 flow monitoring was carried out by Faber et al. (2009), who measured diffuse gas flow by determining CO2 concentration in soil gas at two stations in the Nový Kostel fault zone. CO2 flow monitoring was also conducted by Jens Heinicke (personal communication, 2019) in the Bublák mofette from 2008 to 2014 by recording the acoustic noise of bubbles below the water table, a method which is similar to that used by Koch et al. (2003). No convincing observation of seismogenic CO2 flow anomaly was, however, presented in the abovementioned studies.
Mapping of CO2 emanations was conducted in the area by Nickschick et al. (2015). They used an infrared gas analyzer and accumulation chambers to measure CO2 flux and CO2 soil concentration in the mofette field of Hartoušov and found that the diffuse gas flow in dry vents accounts for a high portion of the mofette field's total gas production.
The measurement of CO2 flow presented in this paper began in 2009 in the Hartoušov mofette field with the use of a laboratory chamber flowmeter. Despite problems from the condensation of moisture and freezing temperatures, which resulted in time series gaps, we observed a massive post-seismic CO2 flow increase shortly after the first ML 3.5 mainshock of the 2014 seismic sequence. A comparison with the fault valve model showed a striking fit, which indicated that the earthquake fracture released gas accumulated in the reservoir beneath hypocenters (Fischer et al., 2017). This gave us a reason to extend the monitoring and test different, more durable, gas flow measurement methods. In this paper, we introduce the principles for our approaches and give a basic comparison of them. We also present the data recorded from the Hartoušov, Bublák, Soos, and Prameny stations (see Fig. 1) and evaluate their response to air pressure and temperature and their possible relation to seismicity.
Two types of CO2 degassing are observed in West Bohemia/Vogtland: (i) diffuse gas flow in soil and (ii) massive gas discharge in mofettes and mineral springs. While gas diffusion in soil is influenced by soil moisture and other local conditions, among other factors, gas flow in massive sources is independent of environmental conditions and should reflect the influence of the gas source in the depth. The deep roots of CO2 mofettes were also documented by a massive increase in CO2 flow in the Hartoušov mofette that began about 4 d after the start of seismic activity in 2008 and 2014 (Fischer et al., 2017). This points to the relatively fast speed of gas migration in the upper crust and qualifies mofettes as favorable places to monitor the amount of leaking gas. Since 2015, the current monitoring at Hartoušov has been extended to other places in order to provide robust measurements capable of recording possible future gas anomalies at multiple sites. Because the conditions differed among the monitored sites, different measurement methods were designed. In this study, we distinguish between direct and indirect gas flow measurement methods (Camarda et al., 2006). The direct methods directly record the volume of gas per minute and require that gas flow be captured by a funnel or borehole. The indirect methods either involve deriving gas flow from the bubble fraction in water (pressure probes are placed beneath the water table) or rely on measuring gas overpressure in a closed borehole, or, finally, they calculate CO2 flux from the concentration of gradients in the soil (Baubron et al., 1990). The dynamic concentration method is based on measuring the CO2 content in a mixture of soil gas and air obtained by a special probe placed vertically in the soil. The dynamic concentration is proportional to the soil CO2 flux according to an empirical relationship, which depends on soil permeability (Gurrieri and Valenza, 1988).

2.1 Monitoring network
Five gas escape sites were monitored in the period described: Hartoušov, Bublák, Soos, Dolní Částkov, and Prameny (see Table 1, the map in Fig. 1 and photos in Fig. 2). While the first three are located in mofette fields, the remaining are boreholes which tap mineral spring sources.
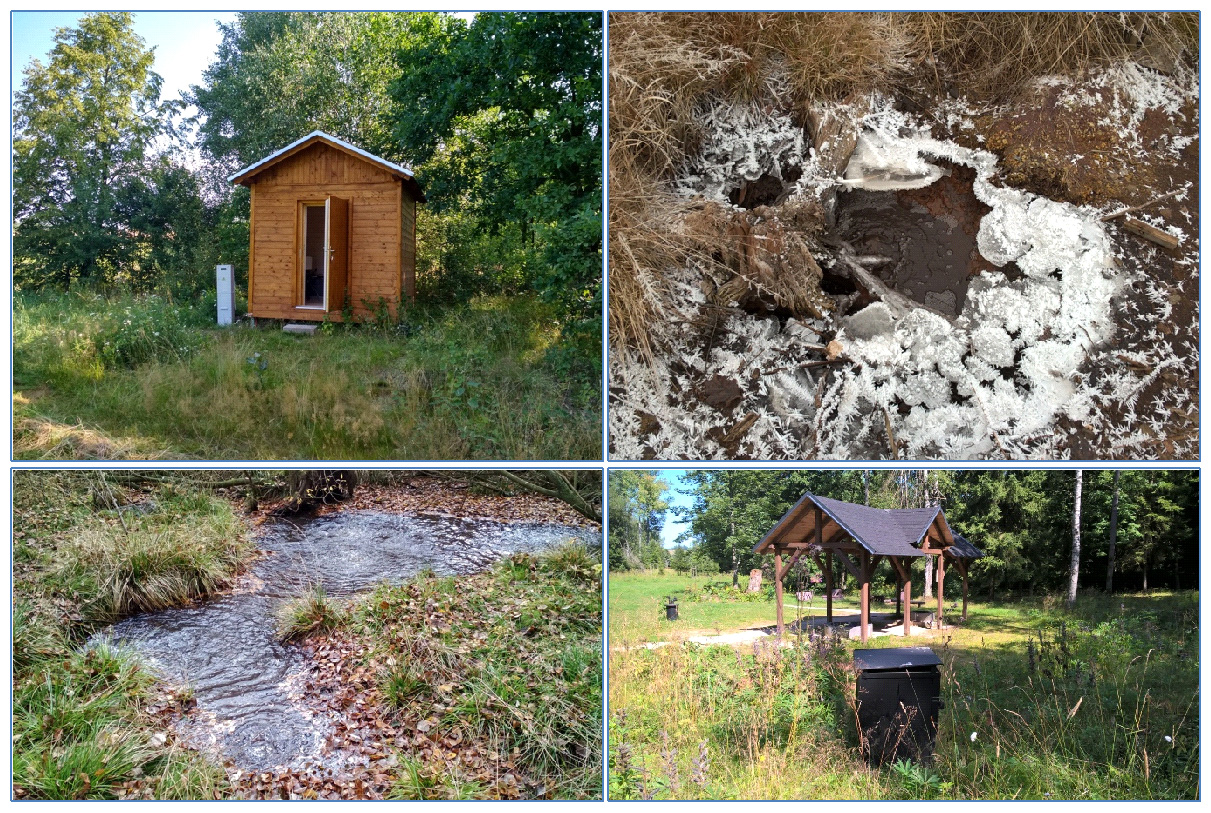
The pilot site of Hartoušov is located in a wooden hut above a 28.2 m deep F1 borehole, which taps a CO2-saturated, pressurized aquifer. The plastic borehole casing, with an inner diameter of 115 mm, is perforated in the depth range of 20–28 m. Water level measurements date back to 2007, and gas flow has been measured here using a drum chamber gas flowmeter since 2009. The sensitivity of this type of instrument to environmental conditions (freezing or evaporation of the working liquid) caused gaps in the recorded time series. Since 2013, there have only been brief gaps thanks to the use of a different type of working liquid, improvements in the condenser separation, and thermal insulation. This direct field gas flow measurement is used as a reference for testing different flow measurement devices prior to their installation at other sites. Additional permanent measurements include water pressure in several depth levels, water temperature, and air temperature and pressure. In 2016, a 108.5 m deep borehole F2 was drilled in the Hartoušov mofette with the aim of studying geo–bio interactions (Bussert et al., 2017). It showed a CO2 overpressure of 5 bar and was converted to a closed monitoring borehole with continuous measurements of downhole pressure and temperature, and wellhead pressure. A broadband seismometer was installed in a depth of 70 m in the year 2019.
The Bublák station has been located in a natural mofette in a swamp since 2015. To avoid interfering with natural conditions at this site, the equipment is buried underground, which does not allow for direct gas flow measurement. Instead, the differential water level is measured and used as a proxy for the volumetric fraction of free gas in water; see Sect. 2.3. Because of the rising bubbles, the water does not freeze in winter, making this measurement quite stable. The Soos station has been located in a natural mofette field since 2015, and the gas from a single mofette is captured by a funnel allowing for direct gas flow measurement. The small size of the metal box shelter and the need to use battery power, however, do not make it possible to prevent the freezing of the system in winter. The water level and temperature in the mofette and the volumetric fraction of free gas are measured here using an electric resistivity probe. In Dolní Částkov, the gas escapes both through a shallow borehole and the surrounding soil, which makes the flow measurements rather unstable. The Prameny station is located on top of a 100 m deep closed borehole (HJ-3A, drilled 1994) with degassing mineral water. Conditions at this site allow only for the measurement of the water level, temperature and wellhead gas pressure, which have been available since 2009.
2.2 Direct CO2 flow measurement methods
Long-term gas flow monitoring in the field must meet various requirements. It should provide sufficiently accurate data of gas flow, which may contain dirt particles and moisture in changing field conditions of temperature, humidity, and air pressure. The presence of carbon dioxide further creates a highly corrosive environment, which the sensors should withstand. Commercial flowmeters are usually not designed to meet these demands. We have tested (at SOOS and Dolní Částkov stations) the MEMS (Micro-electro-mechanical systems) flowmeter, which is based on heat convection in moving gas. It works on the principle of a Wheatstone bridge, where changes in the resistivity of the resistor are measured according to the temperature changes caused by the flow of gas through a heater placed in the middle of the sensor (Dmytriw et al., 2007). These low-cost sensors, however, failed in our tests. None of the MEMS flowmeters tested measured for longer than 4 months, despite the installation of filters to capture solid particles and moisture from the gas before entering the sensor. A popular way of measuring gas flow is the Venturi-type flowmeter, which works by measuring the drop-in pressure at a constriction in a tube. Our tests of similar devices failed due to temperature drifts of the sensor and electronics, which were of the same order as the CO2 flow variations. Direct flow measurement methods also include the acoustic method based on the Doppler effect, which is commonly used for water flow measurement. This, however, does not appear to be suitable for gas, which contains fewer particles acting as diffractors than liquid.
The standard flowmeters with rotating mechanical parts driven directly by the gas flow were also found not suitable due to the corrosive CO2 environment. Better performance was achieved with a drum-type chamber flowmeter, which contains a revolving measuring drum within a packing liquid (we use low-viscosity oil). The measuring drum compulsorily measures volume by periodically filling and emptying four rigid measuring chambers. This chamber laboratory instrument was found suitable for field measurement, where sufficient space and nonfreezing temperatures can be guaranteed. It has been used as the primary flowmeter at the Hartoušov F1 borehole.
2.3 Indirect CO2 flow measurement methods
2.3.1 Gas pressure in a closed borehole
In a closed borehole tapping a gas-saturated aquifer, an overpressure builds up whose magnitude has been speculated to reflect the amount of gas entering the aquifer from below (e.g., Hron and Škuthan, 2006). However, a profound discussion of exactly how the deep CO2 leakage affects the measured overpressure is still absent, to the best of our knowledge. Considering a CO2 flux summing the flux through the top of the aquifer in the vicinity of the borehole, q1, and the possible gas leakage through the borehole, q2, and assuming simply that the borehole overpressure p is proportional to the both, then p follows the equation
where K1 and K2 are the permeability factors related to the ceiling of the aquifer and to the borehole sealing, respectively. Hence, the measured overpressure is not only proportional to the gas flux controlled by deep processes but also influenced by the permeability of the superficial layer as well as by any possible leaks through the wellhead. In particular, any variation in sealing layer properties, caused, e.g., by the actual weather conditions, is then directly projected onto the pressure measured.
Accordingly, in spite of the easy implementation of the pressure measurements in a closed borehole, we used this method only at the Prameny site, where technical and logistic conditions did not allow the installation and maintenance of a flow measurement. Excessive influence of K1 on the measured pressure can be suppressed by introducing a controlled leakage in the wellhead, which ensures that K2 is not small in comparison to K1 as has been implemented at Prameny station.
2.3.2 Bubble fraction in water
We have used the bubble fraction monitoring method since observing a striking coincidence between the gas flow rate and groundwater level (see later in this section) increase in the Hartoušov F1 borehole during the 2014 seismic sequence (Fischer et al., 2017). Within a few months after the beginning of the sequence, the gas flow rate in the borehole increased 5-fold and the measured water level by more than 1 m. Since then, both quantities have indicated an overall gradual decrease back to their original levels.
Instead of the notion of groundwater level, adopted in Fischer et al. (2017) and other works, we stick to the more strictly defined terms pressure head and hydraulic head in the present paper, which is due a few explanatory comments. Within a steady water column resting in a borehole (or a narrow mofette), the hydraulic head (defined as the sum of the pressure head and elevation) is independent of the elevation and is referred to as the groundwater level, as it coincides with the elevation of the free water surface observed in the borehole. This is why the exact elevation of the actual placement of the pressure probes in the borehole is usually disregarded, and the term groundwater level is used somewhat loosely without risk of any confusion. In the case of a continuous bubbly flow through the borehole, however, hydraulic head is not a depth-independent quantity but rather inevitably increases with elevation. An intuitive explanation is that the mean density of the water–gas bubbles mixture is markedly lower than that of water (this is, however, merely an approximation; see also Sect. 2.5). Following this simple concept, the density of the mixture would be (disregarding the density of the gas CO2 as negligible)
where ϕ(z) denotes the volumetric fraction of bubbles in the water column profile at elevation z, and ρw stands for the mass density of the water in the well (say, clear water at a given constant temperature). Denoting by ψ(z) the pressure head, related to the actual pressure p(z) through , with g being the gravitational acceleration and b the barometric pressure (Fig. 3a), and denoting by the hydraulic head, we assert that the difference in the measured pressures, pressure head and hydraulic head, equals
That is, the hydraulic head h(z) measured in the borehole increases with elevation by a factor equal to the volumetric fraction of the bubbles in the borehole profile. Here, for the sake of brevity, we abstract from the time dependence of all quantities.
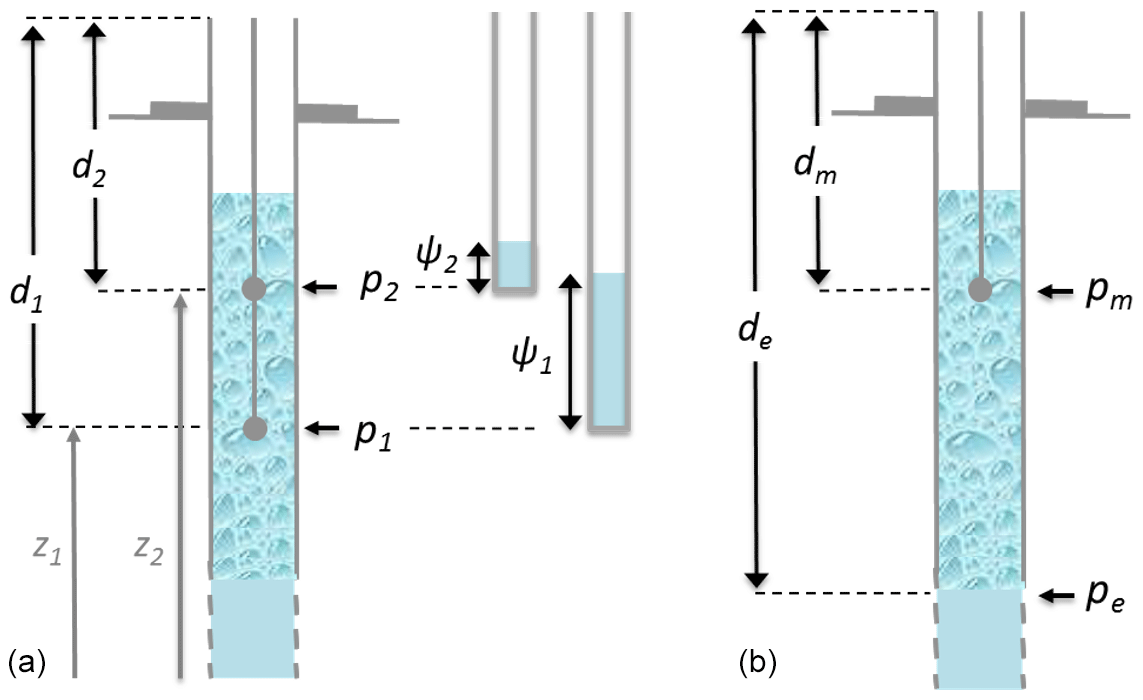
Figure 3Measurement of pressure in the borehole with ascending bubbles: the measured pressure p and the related pressure head ψ at two different depths d1 and d2 within the bubble column using the (a) differential method; pressure within the bubble column pm and beneath pe used to determine the mean bubble fraction using the (b) integral method. Note that the difference in altitudes .
The mean bubble fraction within the measured section of the water column can thus be defined as
As the ascending gas bubbles expand due to the decreasing pressure, both the volumetric flux of the gas and the bubble fraction ϕ(z) increase correspondingly with elevation. In order to obtain a quantity independent of the depths of the pressure probes, a further correction needs to be applied. A reasonable approximation can be obtained based on the following simplification. We assume that the gas expands isothermally, so that its volumetric flux is inversely proportional to pressure, and that the bubble fraction is approximately proportional to the volumetric flux, so that we can write
where ϕ0 represents the bubble fraction at the reference pressure p0 (which we later set as 100 kPa). Further, approximating the pressure profile between the two pressure probes by a linear function
we obtain (by substituting ϕ(z) into Eq. (2) and integrating) the formula for ϕ0; let us call this the projected bubble fraction,
One should note that the quantity obtained here is subject to some uncertainty due to a number of simplifications and that it only gives the approximated volumetric fraction and not the gas flow rate itself (see Sect. 2.5).
In the Hartoušov F1 borehole, the pressure head had been measured until September 2018 by one pressure gauge in the depth of 8 m, well above the bubble entry point. In Fischer et al. (2017), the corresponding hydraulic head was referred to as the groundwater level. As proposed in the paper, we split its time variation into two parts: the variation (a) in the hydraulic head he(t) at the bottom of the bubble flow column and (b) in its increase through the column due to the gas bubbles. The optimal solution to obtain data for (a), which was implemented in Hartoušov F1 in late 2018, is to measure the pressure head in a depth beneath the bubble entry point directly by a dedicated pressure probe (Fig. 3b). While direct measurement was unavailable, it was supposed that (a) is given only by the surrounding hydrogeologic situation and is unaffected by the gas flow. A single measurement of the pressure at the bubble occurrence depth by Fischer et al. (2017), corrected by a continuous pressure head record from a nearby observation well in Hrzín 8 km away, which is not affected by the CO2 gas flow, was used as he(t). Note that he(t) also describes the hydraulic head in any depth beneath the occurrence of bubbles. While Fischer et al. (2017) considered the possibility that the gas exsolution depth varies with time, we argue here (see Sect. 2.4) that the gas bubbles have to appear at the penetrated section of the Hartoušov F1 borehole. This allows us to determine the mean volumetric fraction of the bubbles using Eq. (3) with h1(t)=hm(t) being the hydraulic head measured at the depth dm=4 m and h2(t)=he(t) being the hydraulic head measured at the bubble entry depth (or anywhere below), which we suppose to be at the upper part of the penetrated section at de=20.5 m (Fig. 3).
In Fig. 4 the record of he(t) and hm(t) and the resulting projected bubble fraction ϕ0(t) defined by Eq. (4) are shown for the whole period studied in Fischer et al. (2017). We refer to this method as the integral method.
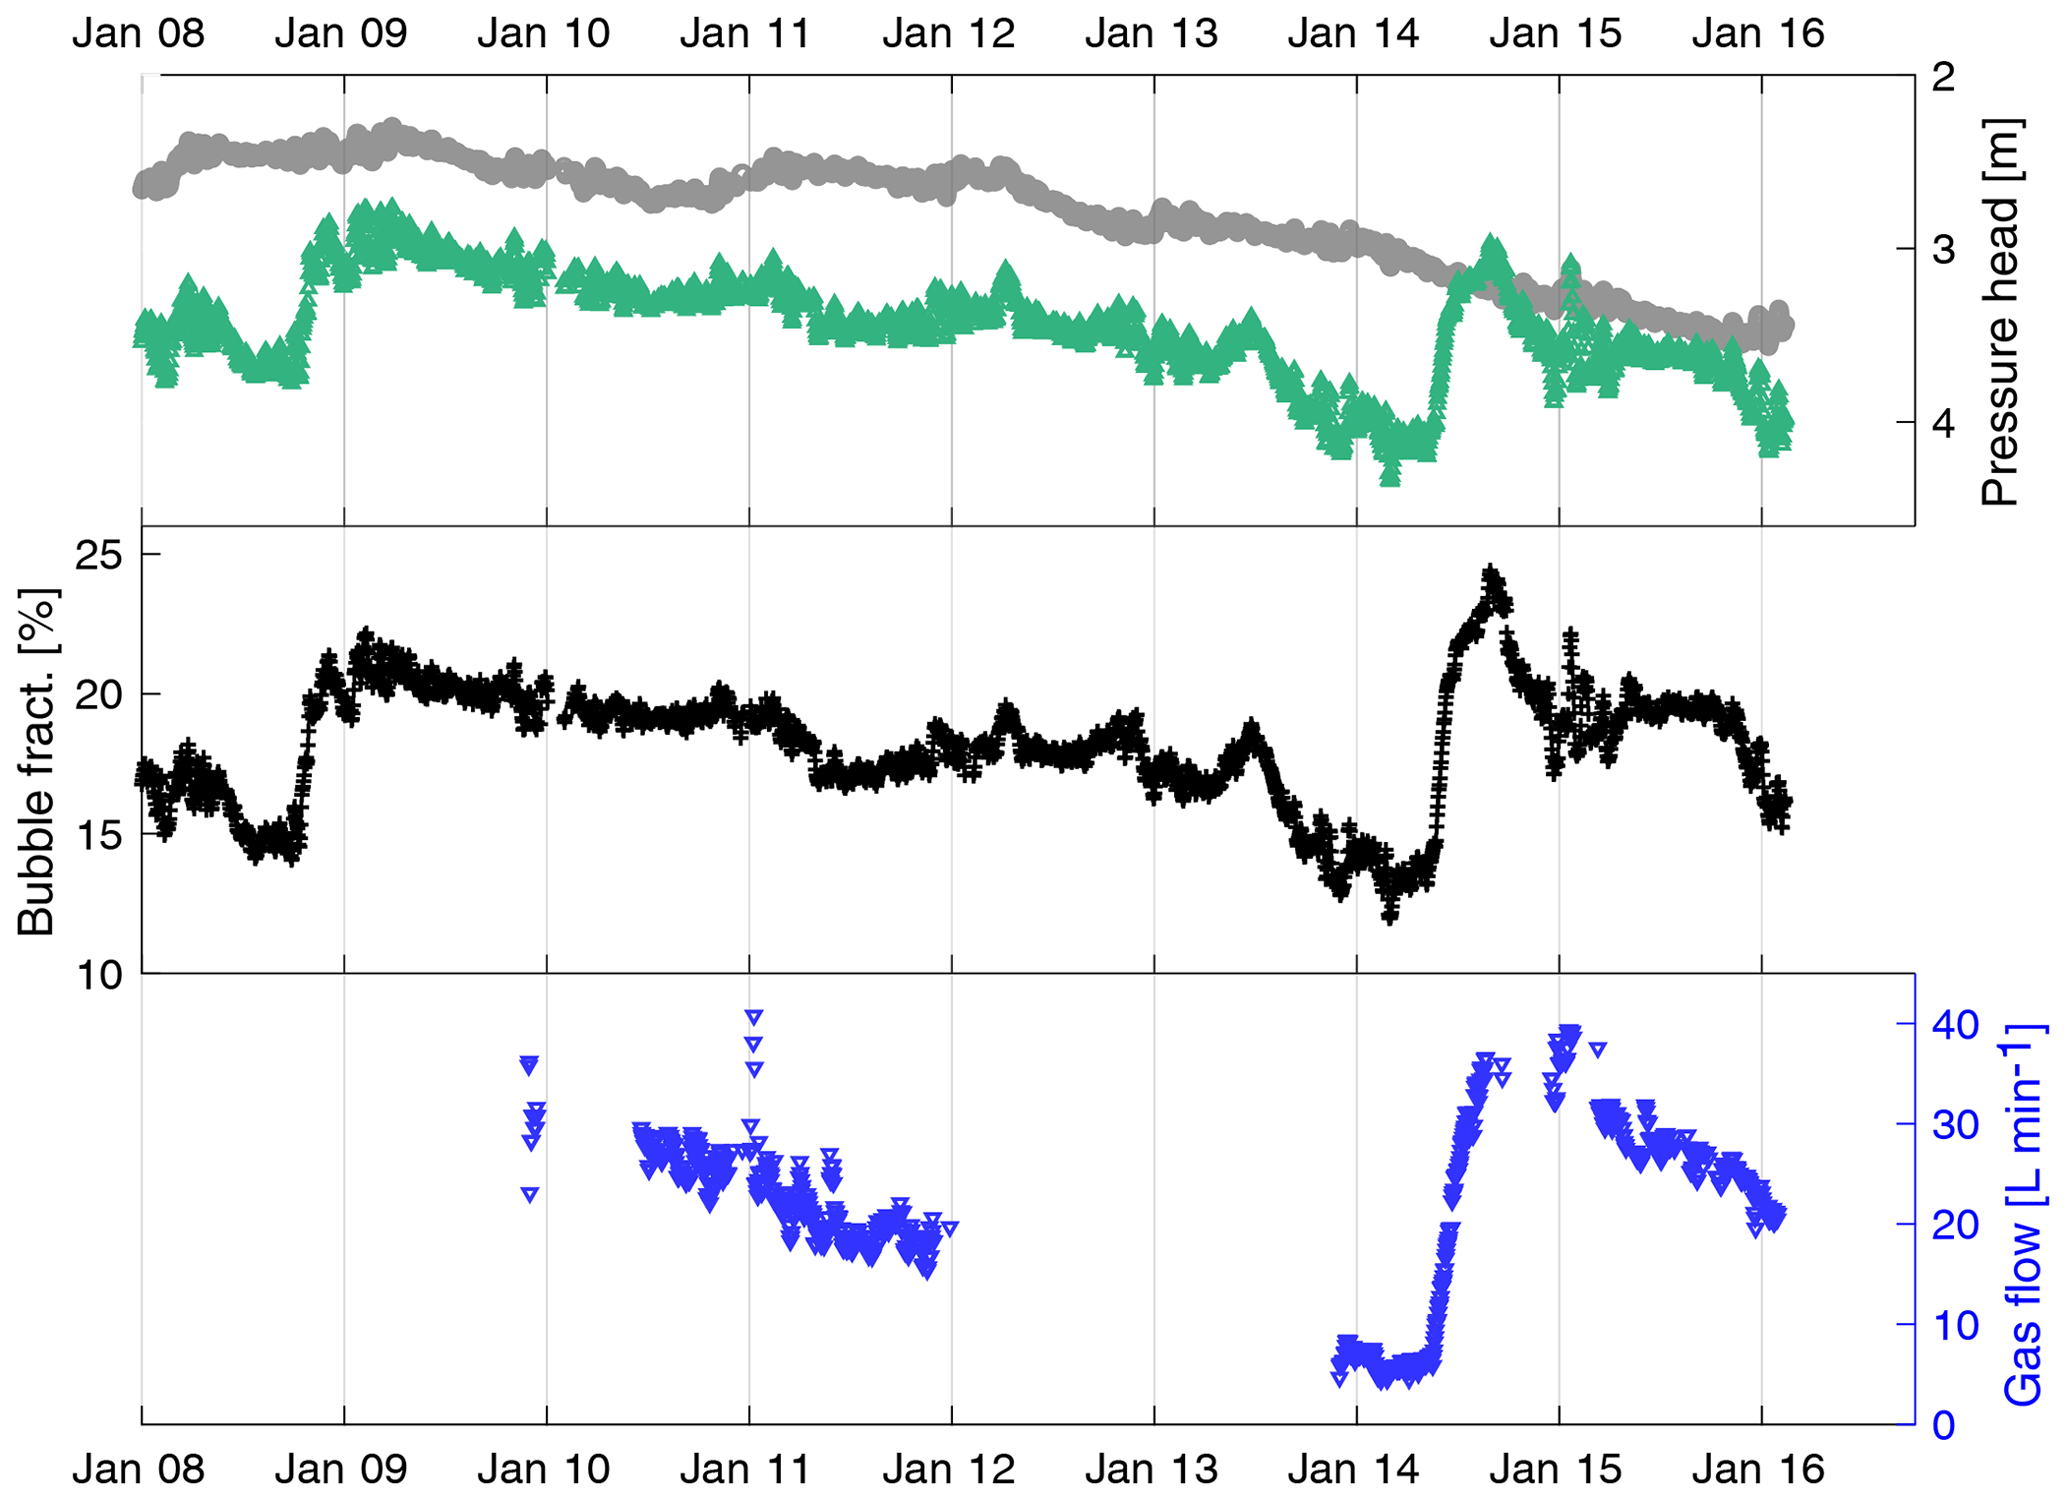
Figure 4Daily averages of the reference pressure head he (grey) unaffected by gas flow and in the monitored Hartoušov F1 well, hm (green); the volumetric fraction of bubbles (black) determined by Eq. (4) and CO2 flow (blue) in the Hartoušov F1 well for the period 2008–2016. Because no reference pressure measurement below the bubble entry point was available for the studied period, a pressure head in nearby Hrzín borehole, which was free of gas flow, was used as he.
The method presented above is applicable only in boreholes and narrow tube-like mofettes. The borehole should tap the underground water, and there should exist a continuous column of gas bubble flow from a certain depth to the surface. Also, independent measurement of the hydraulic head in the aquifer/reservoir beneath the bubble flow column should be possible, either in the same well or, at least, in a nearby well free of gas flow. These conditions are not fulfilled in natural mofettes, which are usually only less than 2 m deep and communicate with the surface water significantly. In such cases, the difference in pressure heads along a fixed depth interval within the bubble flow column can be measured and used to define the mean bubble fraction ϕ12(t) and the projected bubble fraction ϕ0(t).
This differential method has been tested in the Hartoušov F1 well and Bublák mofette stations since 2015 using two analog water-level sensors attached at a 1 m distance on a metal rod. The obvious disadvantage is that both measurements (instead of just one) are subject to fluctuation due to the bubbly flow and that the noise in the resulting bubble fraction data is inversely proportional to the distance between the probes. To suppress the noise, an RC circuit with a 100 s time constant is applied.
An alternative way of determining the bubble fraction is based on the electric resistivity measurement of the water–bubble mixture. Unlike the pressure difference method, this method does not need to be focused on the vertical chain of bubbles, but it can assess the fraction of bubbles in a 3D volume defined by the geometry of electrodes. For this purpose, two water resistivities are measured by a special probe in the mofette: the reference resistivity of the water free of bubbles RR and the resistivity of the water–bubble mixture RM. The bubble fraction is then derived as
where c is the geometric calibration constant. This type of measurement has been tested in the Soos mofette since 2015.
2.4 Depth of gas bubbles appearance
It is possible to speculate that the exsolution of the gas bubbles from the water with dissolved CO2 takes place at a certain depth in the borehole, while below that depth the pressure is sufficient to contain the CO2 in the dissolved phase. In this view, the exsolution depth de could vary in time, as considered by Fischer et al. (2017), following variations in he(t) and in the CO2 supply from the reservoir. Let us note, however, that such a scenario is only possible for gas fluxes much lower than those observed in the Hartoušov F1 borehole or in the presence of significant water discharge, such as in mineral springs.
Assuming a steady flow of the dissolved CO2 up through a borehole section with no penetration below de, two transport mechanisms can be considered, convection or molecular diffusion. As for convection, no driving force to induce a flow in a water column in a borehole, in particular no significant temperature variations, has been observed in the Hartoušov F1 borehole. The mass flux due to molecular diffusion, on the other hand, can be estimated as follows, and it appears to be very limited. Assuming that the concentration of the dissolved CO2 in the resting water column increases with increasing depth as much as allowed by the increasing hydrostatic pressure (with the Henry's law constant being on the order of 10−5 kg m−3 Pa−1; see Sander, 2015), then the corresponding diffusive flow rate (with the diffusivity being on the order of 10−9 m2 s−1) through the borehole of the given cross-section area (say, 10−2 m2) would be no more than on the order 10−12 kg s−1. This is 8 orders smaller than the flow rate directly observed in the borehole. We thus infer that the gas bubbles enter the Hartoušov F1 borehole in its penetrated part, as we assumed in the previous section, while they originate somewhere in the surrounding media.
2.5 Tests of bubble fraction method
The methodology for indirect gas flow measurement using pressure difference (the differential method) was first tested in the laboratory. The experimental setup consisted of an air pump connected with a valve for controlling the airflow, which was led to the bottom of a plastic tube with an inner diameter of 10.5 cm and a height of 2.5 m simulating the borehole. Two water pressure probes were installed at a fixed distance of 0.5 m on a vertical rod inside the tube, and all the air from this tube was led to the chamber gas flowmeter. The air inflow was increased stepwise, and at each level the data were recorded for a period of 15 min using a 1 Hz sampling rate. The gas flow ranged from 0 to 30 L min−1, which corresponds to the volumetric flux ranging from 0 to 0.06 m s−1. The observed mean bubble fraction appears to increase nonlinearly with the gas flow (Fig. 5). Note that the modification using Eq. (4) is insignificant here, due to the fact that both pressure probes are at a depth of less than 1 m. The bubble fraction values are more scattered than the gas flow rate measured by the flowmeter. The resulting noise was partially suppressed by low-pass filtering of the pressure data using an RC circuit with a time constant of 30 s and additionally by 1 min data sampling to smooth the water level values.
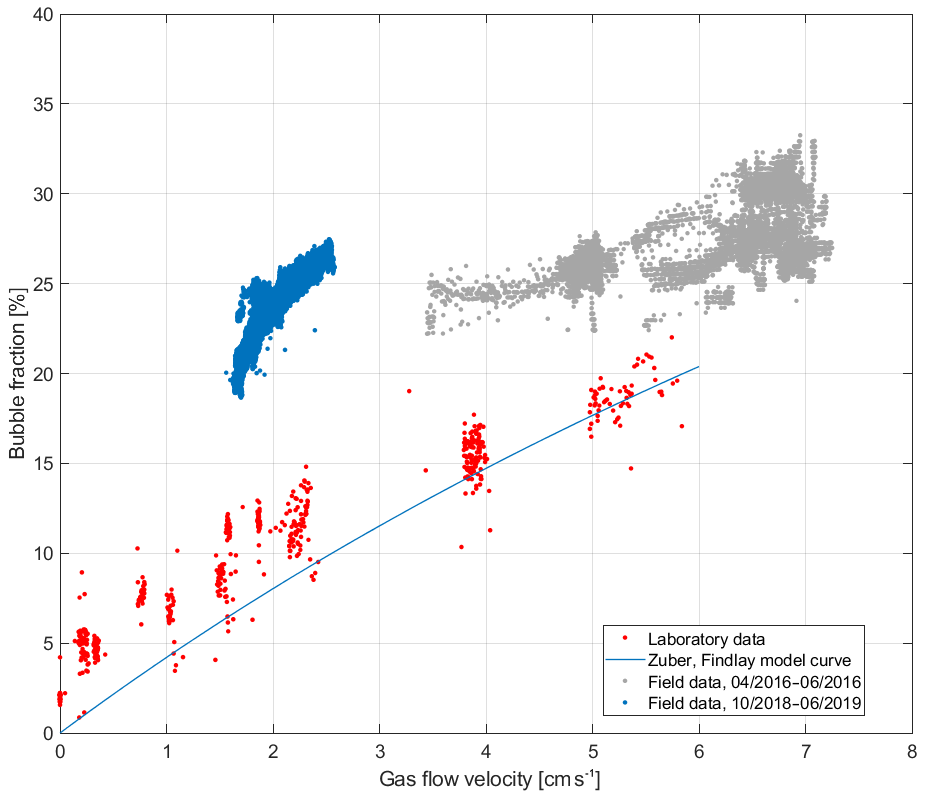
Figure 5Comparison of gas flow velocity and volumetric fraction of bubbles for the field (Hartoušov mofette) and laboratory measurement. Laboratory measurements are smoothed by RC circuit of 30 s time constant (red points) and additionally by running average of 1 min length; the field measurements from 2016 (grey points) are based on the differential method with sensor distance of 1.0 m; the field measurements from 2018 to 2019 (blue points) are based on the integral method. Blue line is the best fit based on Eq. (5).
It is worth noting that the dynamics of bubbly flow in a borehole is quite a complex issue, which, however, appears to have been studied rather intensively in the chemical and nuclear engineering literature (see, e.g., Ghiaasiaan, 2007; Montoya et al., 2016). The simple considerations introduced in the previous text (Eqs. 3 and 4) correspond to the drift-flux model for a vertical borehole, provided that the water flux through the borehole is negligible. In particular, any momentum exchange with the walls is ignored. While this approach is well justified for the bubbly flow regime observed with small gas fluxes, with increasing volumetric gas one observes different flow regimes of greater complexity, such as the slug flow and churn flow. As the bubbles ascend, they increase in volume, join each other merrily, or even sadly split apart, their brief life being eventually cut short by obstacles such as the pressure probes dangling in the well; these are, however, out of the scope of this paper. Even in the bubbly flow regime, the relation between the bubble fraction ϕ and the volumetric flux of the gas bubbles u (m s−1) has been described, e.g., by the following well-established empirical relation (Zuber and Findlay, 1965).
where C0=1.13 and, assuming that the density of the gas is negligible when compared to that of water,
The curve in Fig. 5 is obtained by taking the surface tension for water and air at the laboratory temperature as σ=0.07 N m−1. It appears that the mean bubble fractions derived from our pressure probe data overestimate the void fractions given by the Zuber–Findlay model, in particular for low flow rates.
For comparison, we also show in Fig. 5 the projected bubble fraction data ϕ0 plotted against the corresponding gas flow rates measured on the Hartoušov F1 borehole. The comparison to the laboratory data and to the Zuber–Findlay model reveals a discrepancy that indicates some need for further analysis, which is beyond the scope of the present study. Let us briefly note that the difference cannot be explained by the mere parametric differences from the laboratory setting such as the temperature, gas, and water composition.
In Fig. 6 we compare the bubble fractions obtained at the Hartoušov F1 borehole using integral and differential methods. While it appears that the projected bubble fraction data from the Hartoušov F1 site cannot be directly inverted to obtain a reasonable gas flow rate estimate, it is important that they provide a fair correlation (see also Fischer et al., 2017, and Fig. 4 in their paper) and can thus provide a valuable gas flow rate proxy. As expected, the integral method data seem to perform better than the differential data (see Sect. 2.3). Note particularly the high noise of the latter and its lower correlation to the gas flow rate measurement (Fig. 6). Accordingly, using the pressure sensors at a larger distance, and, if possible, placing one of them below the bubble entry depth, seem preferable for indirect gas flow measurement.
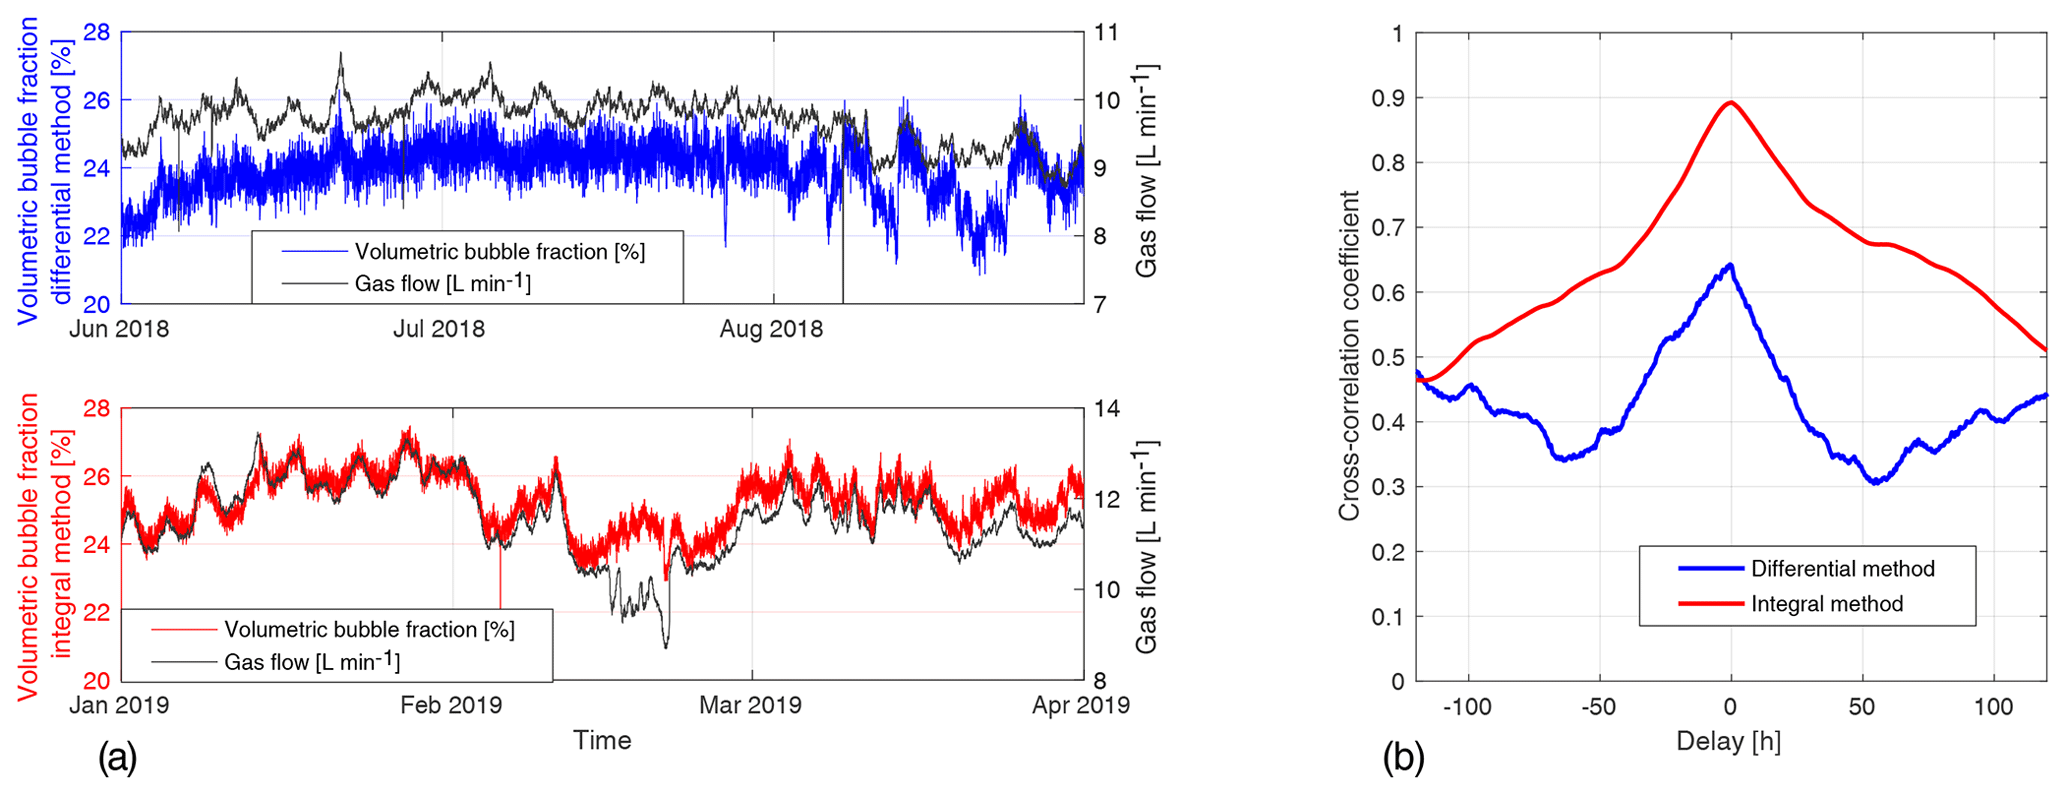
Figure 6(a) Comparison of volumetric bubble fraction derived using differential (top) and integral (bottom) methods with the gas flow at the Hartoušov F1 borehole. Depth of pressure probes for the differential method are 4.45 and 5.45 m below the surface. For the integral method it is 5.45 and 27.2 m. In (b) the cross-correlation functions between the bubble fraction and gas flow rate are shown.
2.6 Environmental effects
The measurements of CO2 flow, CO2 pressure, and pressure head are influenced by environmental effects – mainly variations in temperature (diurnal, seasonal), changes in barometric pressure, and tidal effects. Temperature and barometric changes are the most significant, since their influence can be local and can vary even among the stations of the network. Barometric and tidal loading of aquifers has been studied in detail (e.g., Jacob, 1939; Rojstaczer and Riley, 1990; Roeloffs, 1996). Here, we address the basic principles that are relevant to the pressure and production of the up-streaming gas. Both the confined and unconfined response of pressure head are characterized by the barometric efficiency EB, which expresses the ratio of the change in the hydraulic head Δh caused by the barometric pressure change Δb,
The net response is always a decrease in the hydraulic head with an increase in barometric pressure. The barometric pressure variations act directly on the open water level in the well and also on the formation composed of the mineral matrix and pore space filled by the water. As a result, the direct effect on the water level in the borehole is partially suppressed by the fraction of the external load borne by the formation water. Hence, the barometric efficiency can also be written as
where α and β are the compressibilities of the rock matrix and water, respectively, and θ represents porosity within the aquifer. Thus, barometric efficiency can be described as the fraction of specific storage derived from the compressibility of water or, equally, as the fraction of external load change borne by the formation either as compaction or expansion. Accounting for the range of fractured rock compressibilities, EB of confined aquifers usually ranges between 0.2 and 0.7 (Todd, 1980) and may reach 1.0 for granite with a very low compressibility of the rock matrix (Roeloffs, 1996; Acworth and Brain, 2008). Note, however, that large values of EB may also correspond to large values of β; this fact is not addressed in the literature for the simple reason that it is usually the rock that varies from site to site and not the water. In this concern, the possible effect of the presence of the compressible CO2 bubbles within the aquifer surrounding the borehole on the barometric efficiency is a question that has not been addressed in the literature, to the best of our knowledge.
Similarly, the barometric effect to the CO2 discharge from an aquifer through an open well has not been studied either. One can expect that an increase in the pore pressure due to an increase in the barometric pressure allows for larger amounts of CO2 to be dissolved in water, which in turn decreases the volume of CO2 leaking into the well. Similarly, a decrease in barometric pressure may induce increased degassing. Note that there exist many unknowns in this regard, such as the flow paths of the gas ascending through the aquifer, the amount of the mobile and immobile gas bubbles in the porous space, etc. In the Hartoušov F1 borehole, a strong anticorrelation between the gas flow rate and the barometric pressure has been observed.
We correct the measured quantity f (pressure head or gas flow) for demeaned barometric pressure variations b using the equation (b−〈b〉). Barometric efficiency EB is determined with the target of minimum cross-correlation of f and fc. To account for the possible time variation in EB a sliding window of 1 d is used; see Fig. 7a for original and corrected records of pressure head and gas flow in Hartoušov F1. Figure 7b shows the cross-correlation functions between barometric pressure and original and corrected records. The success of barometric correction is indicated both by removing the anticorrelation with air pressure and by minimizing short-period variations in the corrected records. The mean barometric efficiency was 0.76 for the pressure head and 0.46 L min−1 kPa−1 for the gas flow.
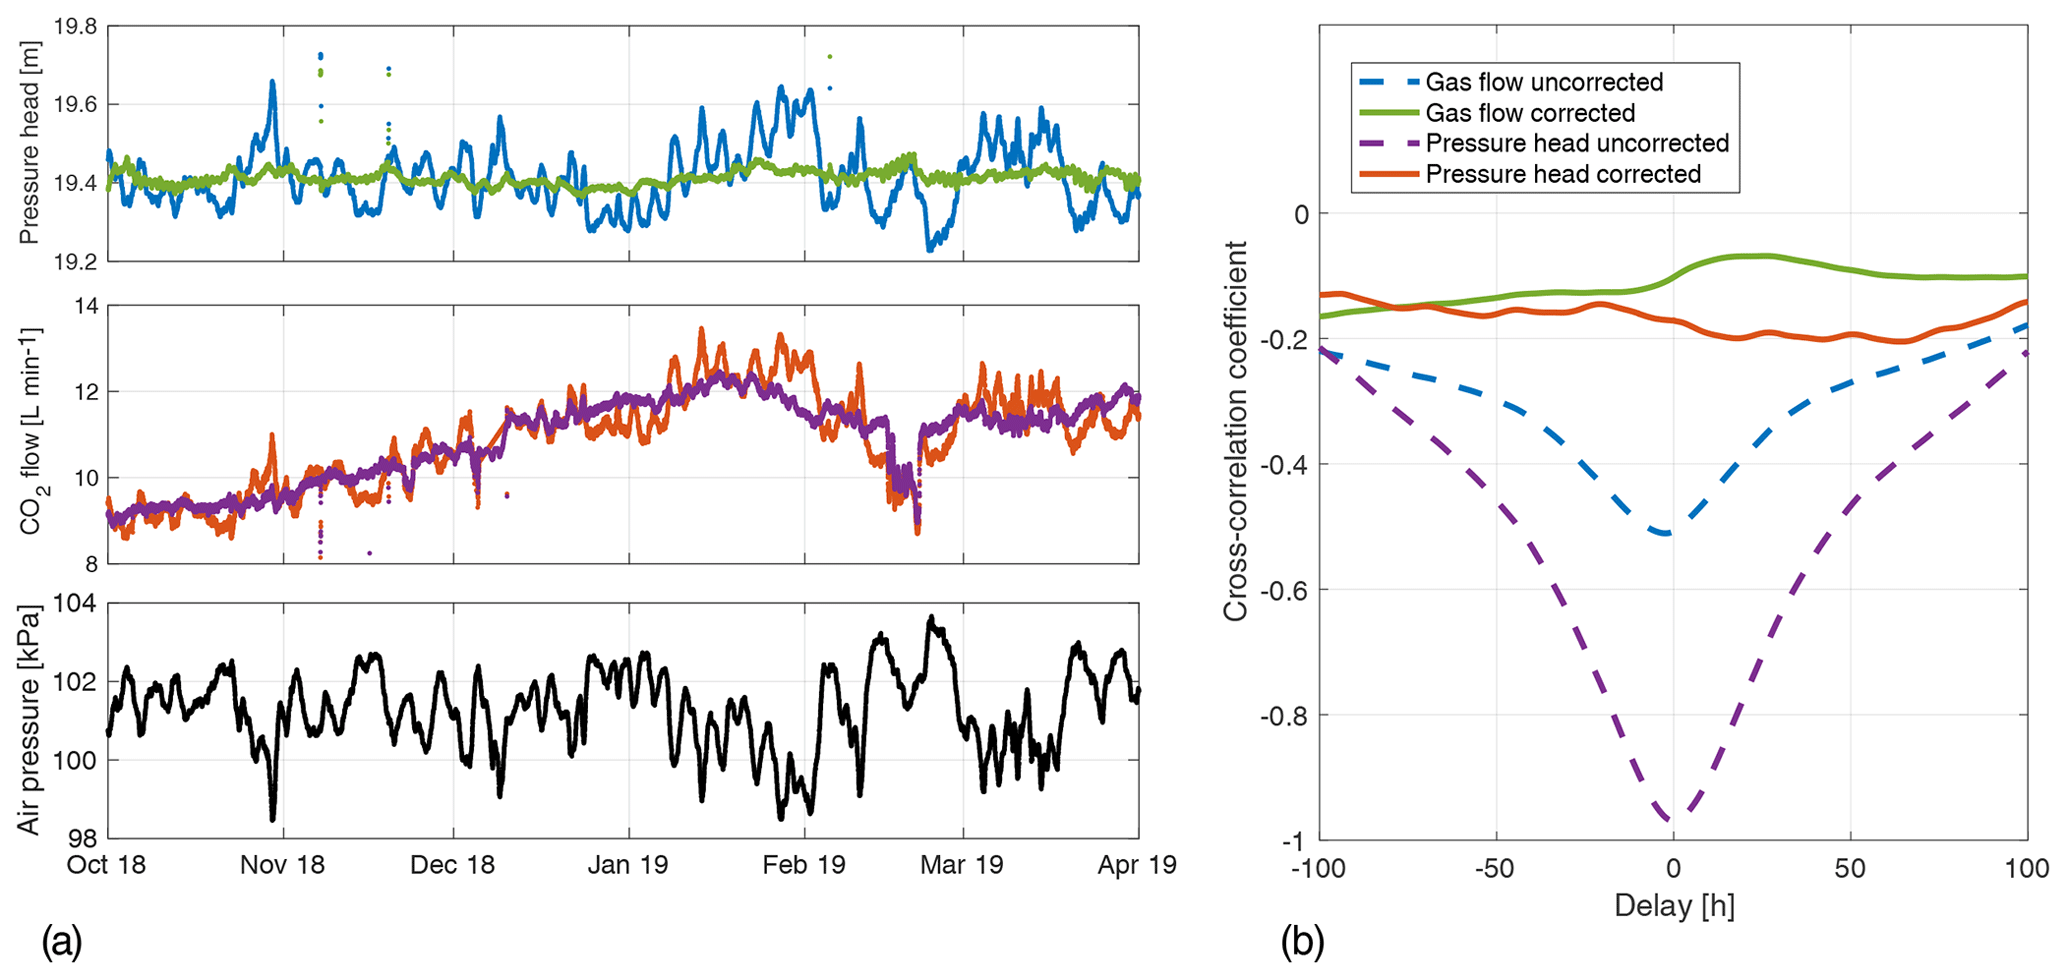
Figure 7The barometric effect to the pressure head and CO2 flow in the Hartoušov F1 borehole for the period from October 2018 to April 2019. (a) Original measurements are indicated in blue, and those corrected for barometric pressure are in red. The upper panel shows pressure head at the depth below the bubble formation, and the lower panel shows gas flow measured by flowmeter. The success of barometric correction is illustrated in (b) showing the decrease in barometric anticorrelation after correcting.
Other external effects like diurnal temperature variations and Earth tides were found to be much weaker than the influence of barometric pressure. The volumetric fraction of bubbles is not affected by air temperature, since the sensors are placed in groundwater with an almost constant temperature. In addition, the periods of diurnal temperature variations and significant Earth tide components are significantly shorter than the expected durations of anomalies of deep-generated gas flow. Accordingly, we do not apply corrections for temperature variations and Earth tides.
The time series of gas production at all monitored stations, along with seismicity plot, are shown in Fig. 8. The record at Hartoušov F1 for the period from late 2007 to 2019 shows a long-term decrease interrupted by several abrupt massive increases in gas discharge. The maximum flow, reaching 50 L min−1, followed the 2014 seismic sequence in late summer/autumn 2014; the minimum values, below 10 L min−1, were observed prior to the 2014 seismic sequence and at the present time. The fast coseismic increase and long-term, post-seismic decrease are visible both in the gas flow and integral bubble fraction data determined using Eqs. (3) and (4) and are consistent with Sibson's fault valve model (Fischer et al., 2017). Note particularly the abrupt rise in gas flow and CO2 bubble fraction during the ML 4.4 seismic sequence of May–August 2014 and in bubble fraction during the October 2008 ML 3.8 swarm. Next to these striking coincidences of seismic activity and CO2 release we also find cases of strong seismic activity, which was not accompanied by a significant gas flow anomaly (see the ML 3.4 swarm of 2011 and the most recent ML 3.8 swarm of 2018). On the other hand, the CO2 flow record shows a few positive pulses which are not related to significant seismic activity (Fig. 8b). The most striking one is the gas production increase in the period from the beginning of May till the end of July 2016, which is visible both in the gas flow and bubble fraction records. This is, however, undoubtedly of anthropogenic origin caused by drilling of the nearby 108.5 m deep F2 borehole at a distance of 40 m from the monitored F1 borehole; drilling started on 30 March (Bussert et al., 2017). The drilling reached the top of a CO2 pressured horizon at a depth of 80 m on 21 April and created a shortcut to the shallower aquifer, which was tapped by the monitored borehole. The 3-month-long gas increase thus represents a delayed response to a nearby drill. Another, less pronounced, positive pulse in the period from mid-September to late November 2016 is of unknown origin. A number of negative pulses and oscillations are found on the bubble fraction record alone, which lower the correspondence between the gas flow rate and the bubble fraction data and indicate a more complex relation between gas flow in a borehole and volume fraction of ascending bubbles, as already noted in Sect. 2.5.
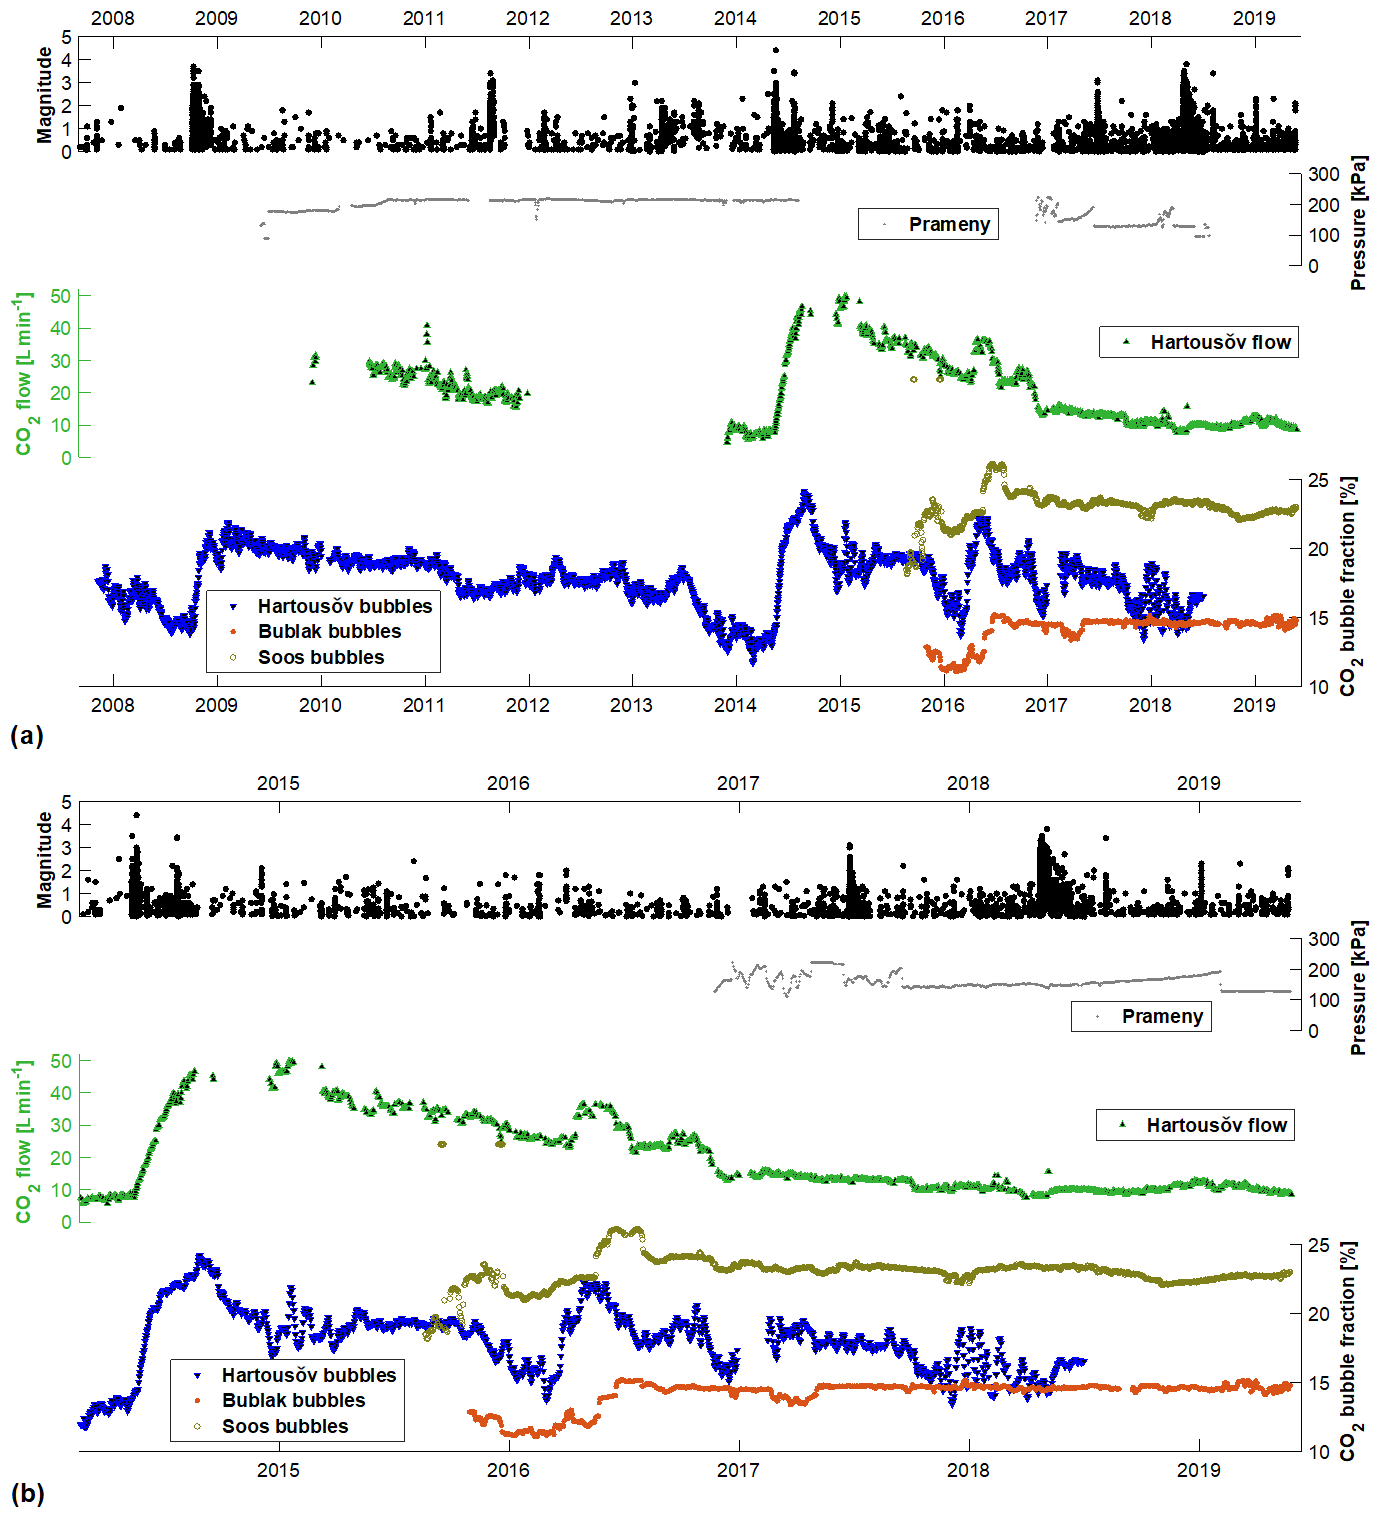
Figure 8Comparison of seismic activity and CO2 production at individual monitoring sites in West Bohemia. For Hartoušov F1 the CO2 flow and gas bubble fraction are shown; for Bublák and Soos the CO2 bubble fraction is shown, and for Prameny the gas pressure in a closed borehole is plotted; (a) period 2007–2019; (b) detail for the period 2014–2019. Gas bubble fraction was determined using the pressure difference method in the integral version for Hartoušov (blue), in differential version for Bublák (red), and by the resistivity method for Soos (light brown).
The records of gas differential bubble fraction data in Bublák and resistivity-based bubble fraction in Soos indicate in the monitored period since autumn 2015 a steady gas release with only a few bumps, which are most probably of local origin and related to the shallow character of the mofettes. Gas at these sites passes through approximately cylindrical vents of ∼0.5 m diameter and ∼1 m depth filled by surface water. The similarity of bubble fraction increase at Soos and gas flow increase at Hartoušov F1 in summer 2016 is most probably merely accidental, considering the anthropogenic origin of the rise at Hartoušov and the large mutual distance of about 5 km of these sites.
As mentioned in Sect. 2.3, the integral method of bubble fraction measurement provides better results than the differential method. The latter suffers particularly from high noise caused by the placement of both pressure probes in a water column with flowing bubbles as shown in Fig. 6. One can also notice a better correlation of the integral method compared to the differential one. Unfortunately, due to technical problems, we were not able to perform this comparison for the same time window – so time windows of the same length (3 months) free of any technical issues were selected.
The barometric efficiency EB of the groundwater pressure head of 0.76, which we obtained, is relatively high. The high values of EB are generally considered an indication of the small compressibility of the rock matrix that is typical for unweathered granite (Acworth and Brain, 2008). The target aquifer is formed by sedimentary formations of the Cheb Basin composed of sandstones and conglomerates with varying clay contents underlain by mica-schist basement (Bussert et al., 2017). The compressibility of these types of rocks is, however, 3 to 6 times greater than of granite (their bulk moduli range from 10 to 20 GPa compared to 50 GPa for granite). Using Eq. (4), porosity of 30 %, and bulk moduli ratio of matrix and pore fluid equal to 5, one gets EB=0.5. The level EB = 0.76 is reached for bulk moduli ratio of 15. Assuming the bulk modulus of aquifer rocks about 10 GPa, one obtains a bulk modulus of the fluid of only about 0.7 GPa, which corresponds to 3 times larger compressibility than for water. This could be explained by the presence of carbon dioxide in the groundwaters in gaseous phase and is worth further research.
The gas flow trend in Hartoušov after the 2014 seismic sequence shows signatures similar to those in the period before 2014, which followed the 2008 swarm. A similar, long-term overall decrease is followed by steady-state behavior with an almost constant flow rate of about 10 L min−1. In terms of the Sibson's fault valve model, this corresponds to the self-sealing phase of the fault due to mineral precipitation (Sibson, 1992) when pressure builds up and in combined action with tectonic loading results in increasing instability of the fault. This inevitably leads to later recurrence of fault failure in the form of seismic activity and regeneration of fault permeability. As indicated above, the coincidence of a massive rise in CO2 flow and seismic activity has not been observed since the 2014 seismic sequence. Indeed, none of the earthquake swarms since 2014 have been accompanied by a distinct CO2 degassing anomaly (Fig. 8b). All in all, in the whole period of CO2 flow monitoring in Hartoušov since 2007, five earthquake swarms with magnitude ML larger than 3.0 occurred (2008, 2011, 2014, 2017, 2018), and only two of them (2008 and 2014) were accompanied by a strong and long-lasting coseismic increase in CO2 degassing. This is not surprising in general, because the fault valve mechanism might act only under certain circumstances. And even if a fluid pulse is released during every stronger seismic sequence its volume might not be sufficient to reach the Earth's surface with a detectable amplitude. This is also directly related to the pressure buildup in the fluid reservoir beneath the sealed fault, which is a long-lasting process, and thus earthquakes that occur soon after releasing the accumulated fluid pressure are likely to not be accompanied by a significant fluid release.
In this context it is also of interest to consider the hypocenter cluster geometry in 3D and its relation to the presence of permeable channels in a shallow crust allowing crustal fluids to reach the surface. In Fig. 9 hypocenters of individual earthquake sequences are indicated in a vertically oriented cross section and show a hat-like structure in depths from 6.0 to 10.5 km extending about 10 km north–south. The Hartoušov mofette field is located about 10 km south from the center of the main cluster, which corresponds to 6 km distance from its southern tip. A pronounced segmentation of the fault plane is apparent with the 2008 and 2014 segments in the southern branch of the cluster and the 2011, 2017, and 2018 segments clusters in its northern branch. It is worth noting that the 2014 mainshocks showed unfavorable oriented focal mechanisms and occurred on a fault jog activated by stress concentration resulting from previous swarm activity (Hainzl et al., 2016; Jakoubková et al., 2018). This structural and possibly impermeable boundary within the fault zone was broken by the ML 3.5 mainshock of the 2014 sequence – the first earthquake of this sequence, which was followed by the massive CO2 flow rise in Hartoušov.
Recently, since the summer of 2019, the CO2 flow rate in Hartoušov F1 has decreased below 10 L min−1, which could be a sign of the approaching occurrence of a new seismic swarm, according to the Sibson's fault valve model. However, one should also take into account that the flow rate decrease in 2019 could have been caused by the drought period in the summer. The reduced groundwater pressure in the whole area would lead to the rise of the diffuse component of gas flow reducing the gas discharge in the borehole. Comparing the records of groundwater level in nearby mofettes with the gas flow rate in the F1 borehole, however, gives unequivocal results. While some correlation between gas flow and water level was found for 2018 and 2019, the gas flow rate in 2017 was found independent of the water level in mofettes.
The clear coseismic CO2 flow rate increase during the 2008 and 2014 seismic sequences indicates the presence of a permeable channel between the southern cluster and the Hartoušov mofette field (Fig. 9). The absence of CO2 flow anomalies coinciding with the seismic activity in northern clusters could be interpreted to show that the hydraulic connection between these fault patches and the Hartoušov mofette is missing, which could be related to the aforementioned fault jog. Besides, it is also of interest that epicenter distribution and CO2 degassing occurrence is typically separated in the area (Weinlich et al., 2006; Babuška and Plomerová, 2008); most earthquakes occur in the northern, CO2-free part of the Cheb Basin.
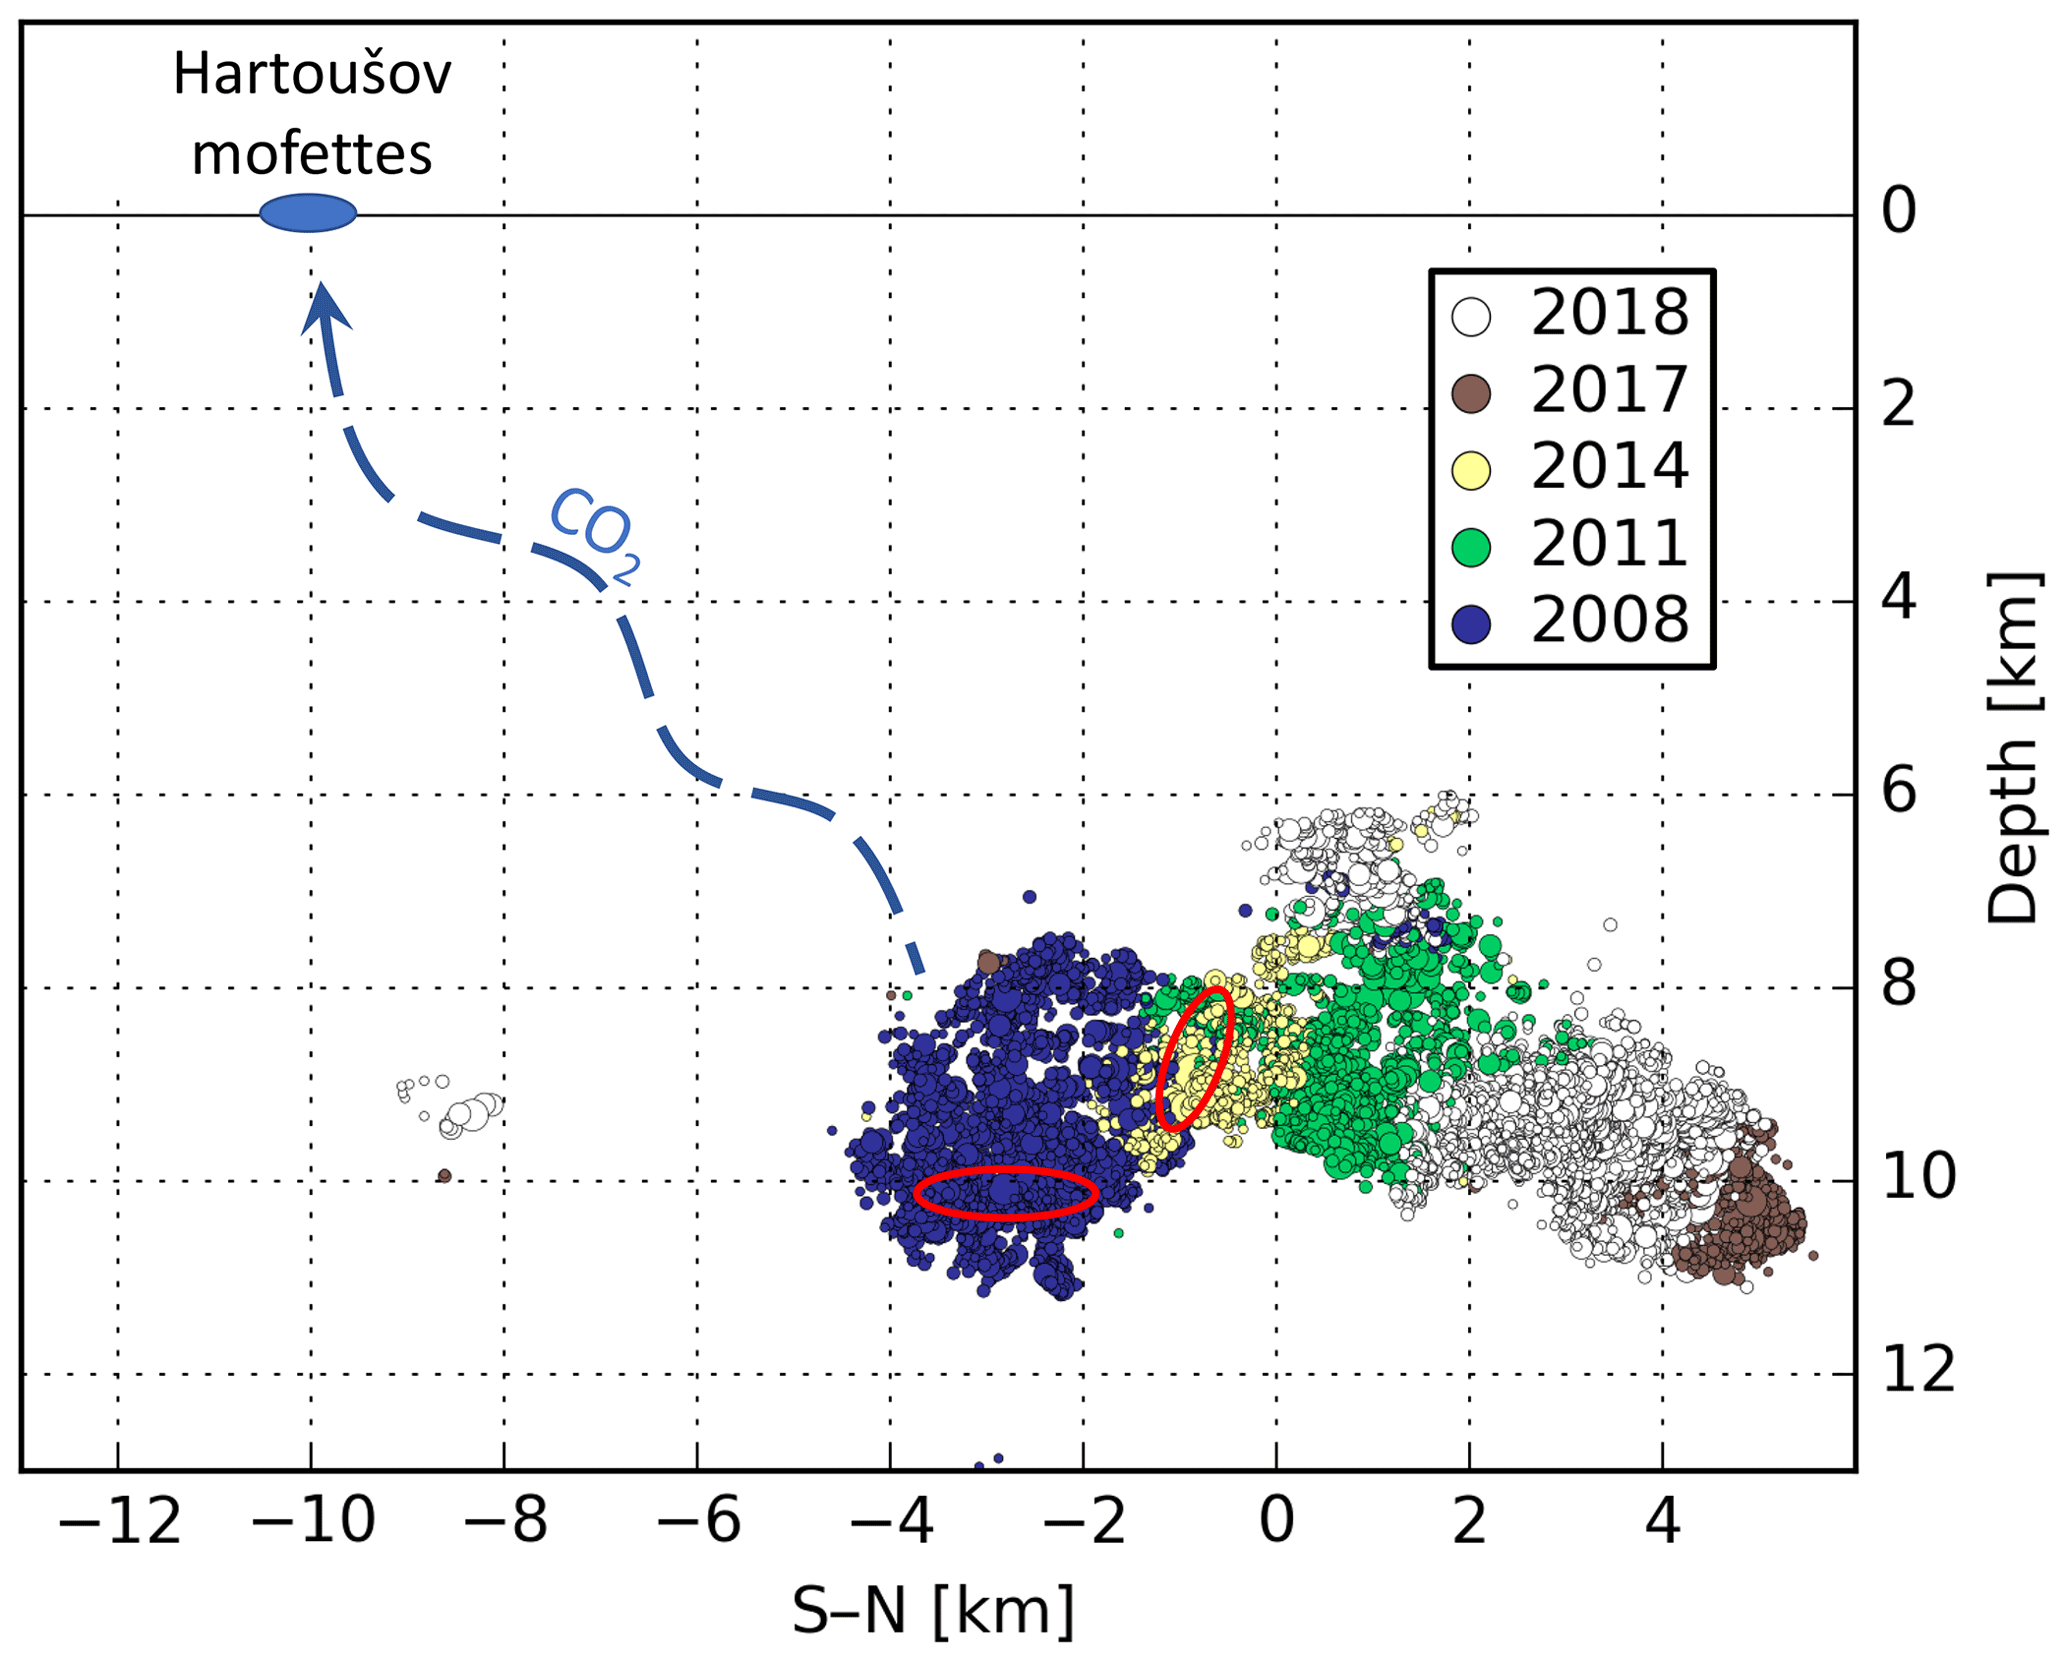
Figure 9Vertical, north–south-oriented section through the Nový Kostel fault zone with hypocenters of the earthquake swarms occurred between 2008 and 2018. The position of the Hartoušov mofette showing coseismic CO2 flow rate increase is indicated on the surface. Red ovals show the position of first events of the 2008 and 2014 seismic sequences.
Other monitored sites such as Bublák and Soos show, similar to Hartoušov, almost constant CO2 discharge since early 2017. As these stations were not in operation during the 2008 and 2014 seismic sequences showing coseismic CO2 increase in Hartoušov, no inferences about their correlation to the seismic activity can be drawn. Bubble fractions derived from resistivity measurements of the water–bubble system are found quite stable. For the measurement period of 4 years no maintenance of the probe was required, and, compared to the pressure difference method, the system is less sensitive to the depth of the probe below the water table. However, no seismogenic anomaly of as flow rate has occurred yet that could be used to calibrate the system. Continuous monitoring of CO2 degassing is required to determine whether future seismic activity in the southern cluster will generate an increase in degassing in either of the monitored sites and enable the verification of the hypothesis that only earthquakes in the southern cluster are capable of generating a CO2 pulse which reaches the surface.
The present study is focused on the long-term monitoring of CO2 degassing in the form of mofettes and gaseous mineral springs targeted on the West Bohemia/Vogtland region in central Europe, which is typified by the occurrence of earthquake swarms and discharge of carbon dioxide of magmatic origin. The gas flow measurement is applied to two types of sources: natural wet mofettes with gas outflow through surface water pools and boreholes tapping shallow CO2-saturated aquifers. The different local conditions of the five monitored sites call for different methods of gas capture and flow rate measurement. Besides the direct flow measurement using a drum chamber gas flowmeter, electronic MEMS flowmeters, and Venturi-based probes we introduce a novel, indirect method based on quantifying the gas bubble contents in a water column, which is capable of functioning in severe environmental conditions. The method is based on measuring the pressure difference along a fixed depth interval in a water column, which is proportional to the mean bubble fraction within the measured section. We analyze the dependence of the bubble fraction on depth and project it to the atmospheric pressure to make it directly comparable to the gas flow rate. Laboratory tests indicate the nonlinear dependence of the bubble fraction on the flow rate, which is confirmed by empirical models found in the chemical and nuclear engineering literature. Flow rates and bubble fractions observed in a pilot borehole F1 in the Hartoušov mofette show a high mutual correlation; however, some discrepancy is found between the measured flow rate and that predicted by the empirical models. This discrepancy calls for further analysis.
We also analyzed the long-term monitoring of gas flow and bubble fraction in the pilot borehole for the period 2008–2019. We found a quite strong barometric influence on the hydraulic head of the confined aquifer corresponding to a barometric efficiency of 0.76, which can be attributed to the compressibility of the pore fluids including the gaseous phase of carbon dioxide.
The record of gas flow rate and bubble fraction in Hartoušov F1 shows two high-amplitude coseismic rises coinciding with the occurrence of earthquake swarms in 2008 and 2014. The flow rate increased to a multitude of the preseismic level for several months and was followed by a long-term decay. However, another three seismic swarms occurring in the same fault zone were not associated with any significant CO2 flow anomaly. We surmise that this may be related to the slightly farther location of hypocenters of these swarms in comparison with the two which caused the coseismic CO2 flow rise. Further long-term CO2-flow monitoring is required to verify the mutual influence of CO2 degassing and seismic activity in the area.
Most of the data analyzed in the paper including email address for requesting additional data are available online at http://web.natur.cuni.cz/uhigug/carbonnet/en_index.html (Fischer and Vlček, 2020).
VB and TF designed and carried out the measurements, and ML formulated the theoretical part with support of TF. TF prepared the paper with contributions from all coauthors.
The authors declare that they have no conflict of interest.
The authors thank Jan Vilhelm for valuable ideas.
CO2 flow monitoring and the work of the authors was supported by the project CzechGeo/EPOS-Sci (CZ.02.1.01/0.0/0.0/16_013/0001800) and by the Czech Science Foundation (grant no. 20-26018S).
This paper was edited by CharLotte Krawczyk and reviewed by two anonymous referees.
Acworth, R. I. and Brain, T.: Calculation of barometric efficiency in shallow piezometers using water levels, atmospheric and earth tide data, Hydrogeol. J., 16, 1469–1481, 2008.
Babuška, V. and Plomerová, J.: Control of paths of quaternary volcanic products in Western Bohemian Massif by rejuvenated variscan triple junction of ancient microplates, Stud. Geophys. Geod., 52, 607–629, 2008.
Bachura, M. and Fischer T., Detailed velocity ratio mapping during the aftershock sequence as a tool to monitor the fluid activity within the fault plane, Earth Planet. Sc. Lett., 453, 215–222, https://doi.org/10.1016/j.epsl.2016.08.017, 2016.
Bankwitz, P., Schneider, G., Kämpf, H., and Bankwitz, E.: Structural characteristics of epicentral areas in Central Europe: study case Cheb Basin (Czech Republic), J. Geodyn., 35, 5–32, 2003.
Baubron, J. C., Allard, P., and Toutain, J. P.: Diffuse volcanic emissions of carbon dioxide from Vulcano island, Italy, Nature, 344, 51–53, 1990.
Bräuer, K., Kämpf, H., Strauch, G., and Weise, S. M.: Isotopic evidence (3He∕4He, ) of fluid-triggered intraplate seismicity, J. Geophys. Res., 108, 2070, https://doi.org/10.1029/2002JB002077, 2003.
Bräuer, K., Kämpf, H., Niedermann, S., Strauch, G., and Tesař, J.: Natural laboratory NW Bohemia: comprehensive fluid studies between 1992 and 2005 used to trace geodynamic processes. Geochem. Geophy. Geosy., 9, Q04018, https://doi.org/10.1029/2007GC001921, 2008.
Bussert, R., Kämpf, H., Flechsig, C., Hesse, K., Nickschick, T., Liu, Q., Umlauft, J., Vylita, T., Wagner, D., Wonik, T., Flores, H. E., and Alawi, M.: Drilling into an active mofette: pilot-hole study of the impact of CO2-rich mantle-derived fluids on the geo–bio interaction in the western Eger Rift (Czech Republic), Sci. Dril., 23, 13–27, https://doi.org/10.5194/sd-23-13-2017, 2017.
Camarda, M., Gurrieri, S., and Valenza, M.: CO2 flux measurements in volcanic areas using the dynamic concentration method: Influence of soil permeability, J. Geophys. Res., 111, B05202, https://doi.org/10.1029/2005JB003898, 2006.
Dahm, T. and Fischer, T.: Velocity ratio variations in the source region of earthquake swarms obtained from arrival time double-differences, Geophys. J. Int., 196, 957–970, https://doi.org/10.1093/gji/ggt410, 2014.
Dmytriw, A. M., Kilian, W. T., Speldrich, J. W., Beck, S. E., Morales, G., and Gehman, R. W.: U.S. Patent No. 7,278,309, U.S. Patent and Trademark Office, Washington, DC, 2007.
Faber, E., Horálek, J., Boušková, A., Teschner, M., Koch, U., and Poggenburg, J.: Continuous gas monitoring in the West Bohemian earthquake area, Czech Republic: First results, Stud. Geophys. Geod., 53, 315–328, 2009.
Fischer, T. and Horálek, J.: Slip-generated patterns of swarm microearthquakes from West Bohemia/Vogtland (central Europe): evidence of their triggering mechanism, J. Geophys. Res., 110, B05S21, https://doi.org/10.1029/2004JB003363, 2005.
Fischer, T. and Vlček, J.: CarbonNet, available at: http://web.natur.cuni.cz/uhigug/carbonnet/en_index.html, last access: 27 May 2020.
Fischer, T., Horálek, J., Hrubcová, P., Vavryčuk, V., Bräuer, K., and Kämpf, H.: Intra-continental earthquake swarms in West-Bohemia and Vogtland: a review, Tectonophysics, 611, 1–27, https://doi.org/10.1016/j.tecto.2013.11.001, 2014.
Fischer, T., Matyska, C., and Heinicke, J.: Earthquake-enhanced permeability–evidence from carbon dioxide release following the ML 3.5 earthquake in West Bohemia, Earth Planet. Sc. Lett., 460, 60–67, 2017.
Franke, W.: The mid-European segment of the Variscides: tectonostratigraphic units, terrane boundaries and plate tectonic evolution, in: Orogenic Processes: Quantification and Modelling in the Variscan Belt, edited by: Franke, W., Haak, V., Oncken, O., and Tanner, D., Vol. 179, Geol. Soc. Spec. Publ., London, 35–61, 2000.
Geissler, W. H., Kämpf, H., Kind, R., Klinge, K., Plenefisch, T., Horálek, J., Zedník, J., and Nehybka, V.: Seismic structure and location of a CO2 source in the upper mantle of the western Eger rift, Central Europe, Tectonics, 24, TC5001, https://doi.org/10.1029/2004TC001672, 2005.
Ghiaasiaan, M. S.: Two-phase flow, boiling and condensation in conventional and miniature systems, Cambridge University Press, Cambridge, 636 pp., 2007.
Gurrieri, S. and Valenza M.: Gas transport in natural porous medium: a method for measuring soil CO2 flows from the ground in volcanic and geothermal areas, Rend. Soc. Ital. Mineral. Petrol., 43, 1151–1158, 1988.
Hainzl, S. and Fischer, T.: Indications for a successively triggered rupture growth under – lying the 2000 earthquake swarm in Vogtland/NW-Bohemia, J. Geophys. Res., 107, 2338, https://doi.org/10.1029/2002JB001865, 2002.
Hainzl, S., Fischer, T., Čermáková, H., Bachura, M., and Vlček, J.: Aftershocks triggered by fluid-intrusion: evidence for the aftershock sequence occurred 2014 in West Bohemia/Vogtland, J. Geophys. Res.-Sol. Ea., 121, 2575–2590, https://doi.org/10.1002/2015JB012582, 2016.
Heinicke, J. and Koch, U.: Slug flow – a possible explanation for hydrogeochemical earthquake precursors at Bad Brambach, Germany, Pure Appl. Geophys., 157, 1621–1641, 2000.
Horálek, J., Šílený, J., and Fischer, T.: Moment tensors of the January 1997 earthquake swarm in NW Bohemia (Czech Republic): double-couple vs. non-double-couple events, Tectonophysics, 356, 65–85, 2002.
Hron, J. and Škuthan, B.: Continuing research into the pressure field of carbon-dioxide in the West-Bohemian spa region, Czech Ministry of Environment, Prague, 112 pp., 2006 (in Czech).
Hrubcová, P., Geissler, W. H., Bräuer, K., Vavryčuk, V., Tomek, Č., and Kämpf, H.: Active magmatic underplating in western Eger Rift, Central Europe, Tectonics, 36, 2846–2862, https://doi.org/10.1002/2017TC004710, 2017.
Jacob, C. E.: Fluctuations in artesian pressure produced by passing railroad-trains as shown in a well on Long Island, New York, Eos T. Am. Geophys. Un., 20, 666–674, https://doi.org/10.1029/TR020i004p00666, 1939.
Jakoubková, H., Horálek, J., and Fischer, T.: 2014 mainshock-aftershock activity versus earthquake swarms in West Bohemia, Czech Republic. Pure and Appl. Geophys., 175, 109–131, https://doi.org/10.1007/s00024-017-1679-7, 2018.
Kämpf, H., Geissler, W. H., and Bräuer, K.: Combined gas-geochemical and receiver func- tion studies, of the Vogtland/NW-Bohemia intraplate mantle degassing field Central Europe, in: Mantle Plumes – A Multidisciplinary Approach, edited by: Ritter, J. R. R. and Christiansen, U. R., Springer-Verlag, Berlin-Heidelberg-New York, 127–158, 2007.
Koch, U., Heinicke, J., and Voßberg, M.: Hydrogeological effects of the latest Vogtland-NW Bohemian swarmquake period (August to December 2000), J. Geodyn., 35, 107–123, 2003.
Montoya, G., Lucas, D., Baglietto, E., and Liao, Y.: A review on mechanisms and models for the churn-turbulent flow regime, Chem. Eng. Sci., 141, 86–103, https://doi.org/10.1016/j.ces.2015.09.011, 2016.
Nickschick, T., Kämpf, H., Flechsig, C., Mrlina, J., and Heinicke, J.: CO2 degassing in the Hartoušov mofette area, western Eger Rift, imaged by CO2 mapping and geoelectrical and gravity surveys, Int. J. Earth Sci., 104, 2107–2129, https://doi.org/10.1007/s00531-014-1140-4, 2015.
Roeloffs, E.: Poroelastic techniques in the study of earthquake = related hydrologic phenomena, Adv. Geophys., 37, 135–195, 1996.
Rojstaczer, S. and Riley, F. S.: Response of the water level in a well to Earth tides and atmospheric loading under unconfined conditions, Water Resour. Res., 26, 1803–1817, 1990.
Sander, R.: Compilation of Henry's law constants (version 4.0) for water as solvent, Atmos. Chem. Phys., 15, 4399–4981, https://doi.org/10.5194/acp-15-4399-2015, 2015.
Sibson, R. H.: Implications of fault-valve behavior for rupture nucleation and recurrence, Tectonophysics, 211, 283–293, 1992.
Škuthan, B., Hron, J., Pěček, J., and Keprta, M.: Carbon dioxide field in the West Bohemian Spring Region: Introductory results, Bull. Czech Geol. Surv., 76, 203–208, 2001.
Špičák, A. and Horálek, J.: Migration of events during the January 1997 earthquake swarm (The West Bohemia–Vogtland region), Stud. Geophys. Geod., 44, 227–232, 2000.
Špičáková, L., Uličný, D., and Koudelková, G.: Tectonosedimentary evolution of the Cheb Basin (NW Bohemia, Czech Republic) between Late Oligocene and Pliocene: a preliminary note, Stud. Geophys. Geod., 44, 556–580, 2000.
Todd, D. K.: Groundwater Hydrology, 2d Edn., John Wiley & Sons, New York, 1980.
Vavryčuk, V.: Non-double-couple earthquakes of January 1997 in West Bohemia, Czech Republic: evidence of tensile faulting, Geophys. J. Int., 149, 364–373, https://doi.org/10.1046/j.1365-246X.2002.01654.x, 2002.
Vavryčuk, V.: Principal earthquakes: theory and observations from the 2008 West Bohemia swarm, Earth Planet. Sc. Lett., 305, 290–296, https://doi.org/10.1016/j.epsl.2011.03.002, 2011.
Vavryčuk, V. and Hrubcová, P.: Seismological evidence of fault weakening due to erosion by fluids from observations of intraplate earthquake swarms, J. Geophys. Res.-Sol. Ea., 122, 3701–3718, https://doi.org/10.1002/2017JB013958, 2017.
Weinlich, F. H., Bräuer, K., Kämpf, H., Strauch, G., Tesar, J., and Weise, S. M.: An active sub – continental mantle volatile system in the western Eger rift, Central Europe: gas flux, isotopic (He, C, and N) and compositional fingerprints, Geochim. Cosmochim. Ac., 63, 3653–3671, https://doi.org/10.1016/S0016-7037(99)00187-8, 1999.
Weinlich, F. H., Faber, E., Boušková, A., Horálek, J., Teschner, M., and Poggenburg, J.: Seismically induced variations in Mariánské Lázně fault gas composition in the NW Bohemian swarm quake region, Czech Republic – A continuous gas monitoring, Tectonophysics, 421, 89–110, 2006.
Ziegler, P. A.: European Cenozoic rift system, Tectonophysics, 208, 91–111, 1992.
Zuber, N. and Findlay, J.: Average volumetric concentration in two-phase flow systems, J. Heat Transf., 87, 453–468, 1965.