the Creative Commons Attribution 4.0 License.
the Creative Commons Attribution 4.0 License.
 | 17 Jun 2020
Control of 3-D tectonic inheritance on fold-and-thrust belts: insights from 3-D numerical models and application to the Helvetic nappe system
Richard Spitz
Arthur Bauville
Jean-Luc Epard
Boris J. P. Kaus
Anton A. Popov
Stefan M. Schmalholz
We apply three-dimensional (3-D) thermo-mechanical numerical simulations of the shortening of the upper crustal region of a passive margin in order to investigate the control of 3-D laterally variable inherited structures on fold-and-thrust belt evolution and associated nappe formation. We consider tectonic inheritance by employing an initial model configuration with basement horst and graben structures having laterally variable geometry and with sedimentary layers having different mechanical strength. We use a visco-plastic rheology with a temperature-dependent flow law and a Drucker–Prager yield criterion. The models show the folding, detachment (shearing off) and horizontal transport of sedimentary units, which resemble structures of fold and thrust nappes. The models further show the stacking of nappes. The detachment of nappe-like structures is controlled by the initial basement and sedimentary layer geometry. Significant horizontal transport is facilitated by weak sedimentary units below these nappes. The initial half-graben geometry has a strong impact on the basement and sediment deformation. Generally, deeper half-grabens generate thicker nappes and stronger deformation of the neighbouring horst, while shallower half-grabens generate thinner nappes and less deformation in the horst. Horizontally continuous strong sediment layers, which are not restricted to initial graben structures, cause detachment (décollement) folding and not overthrusting. The amplitude of the detachment folds is controlled by the underlying graben geometry. A mechanically weaker basement favours the formation of fold nappes, while stronger basement favours thrust sheets. The model configuration is motivated by applying the 3-D model to the Helvetic nappe system of the Central Alps of France and Switzerland. Our model reproduces several first-order features of this nappe system, namely (1) closure of a half-graben and associated formation of the Morcles and Doldenhorn nappes, (2) overthrusting of a nappe resembling the Wildhorn and Glarus nappes, and (3) formation of a nappe pile resembling the Helvetic nappes resting above the Infrahelvetic complex. Furthermore, the finite strain pattern, temperature distribution and timing of the 3-D model is in broad agreement with data from the Helvetic nappe system. Our model, hence, provides a 3-D reconstruction of the first-order tectonic evolution of the Helvetic nappe system. Moreover, we do not apply any strain softening mechanisms. Strain localization, folding and nappe transport are controlled by initial geometrical and mechanical heterogeneities showing the fundamental importance of tectonic inheritance on fold-and-thrust belt evolution.
- Article
(12933 KB) - Full-text XML
- BibTeX
- EndNote


Fold-and-thrust belts are common in nature and typically associated with orogenic belts, such as the Himalayas or the European Alps. The structural interpretation of fold-and-thrust belts is based on the interaction between the crystalline basement and the overlying sedimentary cover. Two endmember deformation styles are commonly distinguished: thin-skinned deformation, without significant basement involvement, and thick-skinned deformation, with significant basement involvement (Rodgers, 1949; Pfiffner, 2006). Due to their importance for the fundamental understanding of mountain building processes and for natural resources exploration, the formation of fold-and-thrust belts has been studied since several decades with field and modelling studies (e.g. Davis et al., 1983; Dahlen, 1984; Dahlen and Suppe, 1988; Beutner, 1977; Price and McClay, 1981; Gillcrist et al., 1987; Butler, 1989; Ramsay, 1989; Buchanan and Buchanan, 1995; Dunn et al., 1995; Mitra, 1997; Lacombe and Mouthereau, 2002; Wissing and Pfiffner, 2003; Simpson, 2011; Yamato et al., 2011; Ruh et al., 2012; Fernandez and Kaus, 2014; Bellahsen et al., 2012; Bauville and Schmalholz, 2015; Lacombe and Bellahsen, 2016; Bauville and Schmalholz, 2017). However, the mechanical deformation processes controlling fold-and-thrust belt evolution are still incompletely understood. One challenge for understanding fold-and-thrust belt evolution is that the formation, spacing, orientation and time-sequence of thrusts, shear zones and folds are controlled by two different factors. First, the mechanical deformation behaviour of rocks, which can be dominated either by brittle frictional sliding or by ductile creep and can further be strongly affected by various mechanical softening mechanisms, such as frictional strain softening, reduction of effective friction by fluid overpressure, grain size reduction or thermal softening. Second, the geometrical configuration, such as half-graben structures or orientation of sedimentary layers, and variations in rock strength, e.g. between basement and cover or within the cover by alternation of strong, such as carbonates, and weak, such as shales, sediments. Therefore, a main challenge for understanding the thermo-mechanical evolution of fold-and-thrust belts is to determine whether the major thrusts and shear zones have been controlled by a particular rheological softening mechanism or by pre-existing geometrical and mechanical heterogeneities, referred to here as tectonic inheritance. In nature, there is most likely a continuous transition between these two controlling factors.
Many studies employing numerical models have been performed with a focus on the impact of different rheological models. Studies investigated the impact of brittle, brittle–ductile, visco-plastic and visco-elasto-plastic rheological models on fold-and-thrust belt evolution, and they also studied, for example, the impact of fluid pressure and associated reduction of the effective friction coefficient (e.g. Simpson, 2011; Ruh et al., 2014; Poulet et al., 2014; Bauville and Schmalholz, 2015; Granado and Ruh, 2019). Other numerical studies focused more on the impact of tectonic inheritance, in the form of mechanical heterogeneities, on fold-and-thrust belt evolution (Wissing and Pfiffner, 2003; Bauville and Schmalholz, 2017). To illustrate the two major control factors, namely, rheology and tectonic inheritance, in a simple way, let us consider the deformation of a linear viscous material under homogeneous pure shear. Adding a circular inclusion with a smaller viscosity to the viscous material will not generate a significant shear zone inside the linear viscous material for this deformation configuration. The only possibility to generate a shear zone in the viscous material is to add a softening mechanism, such as thermal softening (Jaquet et al., 2015; Kiss et al., 2019) or grain size reduction with grain-size-sensitive flow laws (Bercovici and Ricard, 2003; Austin et al., 2008). In contrast, if the linear viscous material is sheared over a non-planar interface, resembling a half-graben, then a shear zone can develop inside the linear viscous material even without any softening mechanism (Bauville and Schmalholz, 2017). Hence, strain localization can be caused by material softening and by mechanical heterogeneity.
The majority of numerical modelling studies use two-dimensional (2-D) models, which are often able to produce results that are to a first-order approximation comparable with geological reconstructions and cross sections. However, it is well known that the style of fold-and-thrust belts can vary considerably along the strike of the belt (e.g. Hamilton, 1988; Mitra and Fisher, 1992; Mitra, 1997; Mouthereau et al., 2002; Fitz Diaz et al., 2011; Nemčok et al., 2013). Inherited, laterally varying pre-existing structures are important, for example, in the Alps where pre-Alpine laterally varying passive margin structures presumably exert a strong control on the deformation style (Pfiffner, 1993, 2011). A recent study of the Iberian passive margin by Lymer et al. (2019) highlights the complex 3-D architecture of such margins. Their results imply that fault systems disappear laterally or link together in lateral direction along the margin, consequently creating discontinuities and geometrical asymmetries. Therefore, it is important to consider the 3-D inherited heterogeneities of passive margins when studying fold-and-thrust belts that resulted from the deformation of passive margins, as is the case for the Helvetic fault-and-thrust belt (Pfiffner, 2011).
Here, we apply a 3-D thermo-mechanical numerical model to investigate the fundamental impacts of mechanical heterogeneities, representing graben structures and sedimentary layering, on the deformation style during fold-and-thrust belt formation. A particular aim is to apply our model results to the Helvetic nappe system in the Central Alps of France and Switzerland (see next section). We employ an initial model configuration that mimics a simplified upper crustal region of a rifted margin and is composed of a basement and several sedimentary units. The passive margin contains a half-graben system that has a variable depth and width in the lateral direction. Moreover, we apply laboratory-derived temperature-dependent dislocation creep flow laws for all our model units and consider a brittle frictional Drucker–Prager yield stress. We use a typical velocity boundary condition to simulate the large-scale deformation conditions during tectonic wedge formation (Simpson, 2011; Ruh et al., 2014). In order to focus on the large-scale processes, we keep our model relatively simple and concentrate on the thermo-mechanical processes on the macroscale and the impact on kilometre-scale structures. Hence, we do not consider microscale processes such as grain size reduction involving secondary mineral phases and pinning. Furthermore, our model does not include hydro-chemical coupling. Hence, we do not model processes such as fluid release and decarbonatization (Poulet et al., 2014).
The aims of our study are to (1) understand the impact of lateral variations in half-graben geometry on the deformation style, (2) investigate the importance of the spatial distribution of a competent layer and half-graben geometry during fold-and-thrust belt formation, and (3) discuss the application of our numerical models to the formation of the Helvetic nappe system.
The Helvetic nappe system is a fold-and-thrust belt complex that was formed during the Alpine orogeny when the European passive margin collided with the Adriatic margin (e.g. Trümpy et al., 1980; Pfiffner, 2015). The system consists of a pile of tectonic nappes, which mainly comprise Mesozoic and Cenozoic sediments derived from the former European continental margin (Masson et al., 1980; Ramsay, 1981; Pfiffner, 1993; Escher et al., 1993; Steck, 1999; Pfiffner et al., 2011). Commonly, the nappe system is subdivided into the structurally upper Helvetic nappes, considered mainly as allochthonous thrust nappes, and the structurally lower Infrahelvetic complex, which can involve par-autochthonous fold nappes (Pfiffner, 1993; Pfiffner et al., 2011) (Fig. 1).
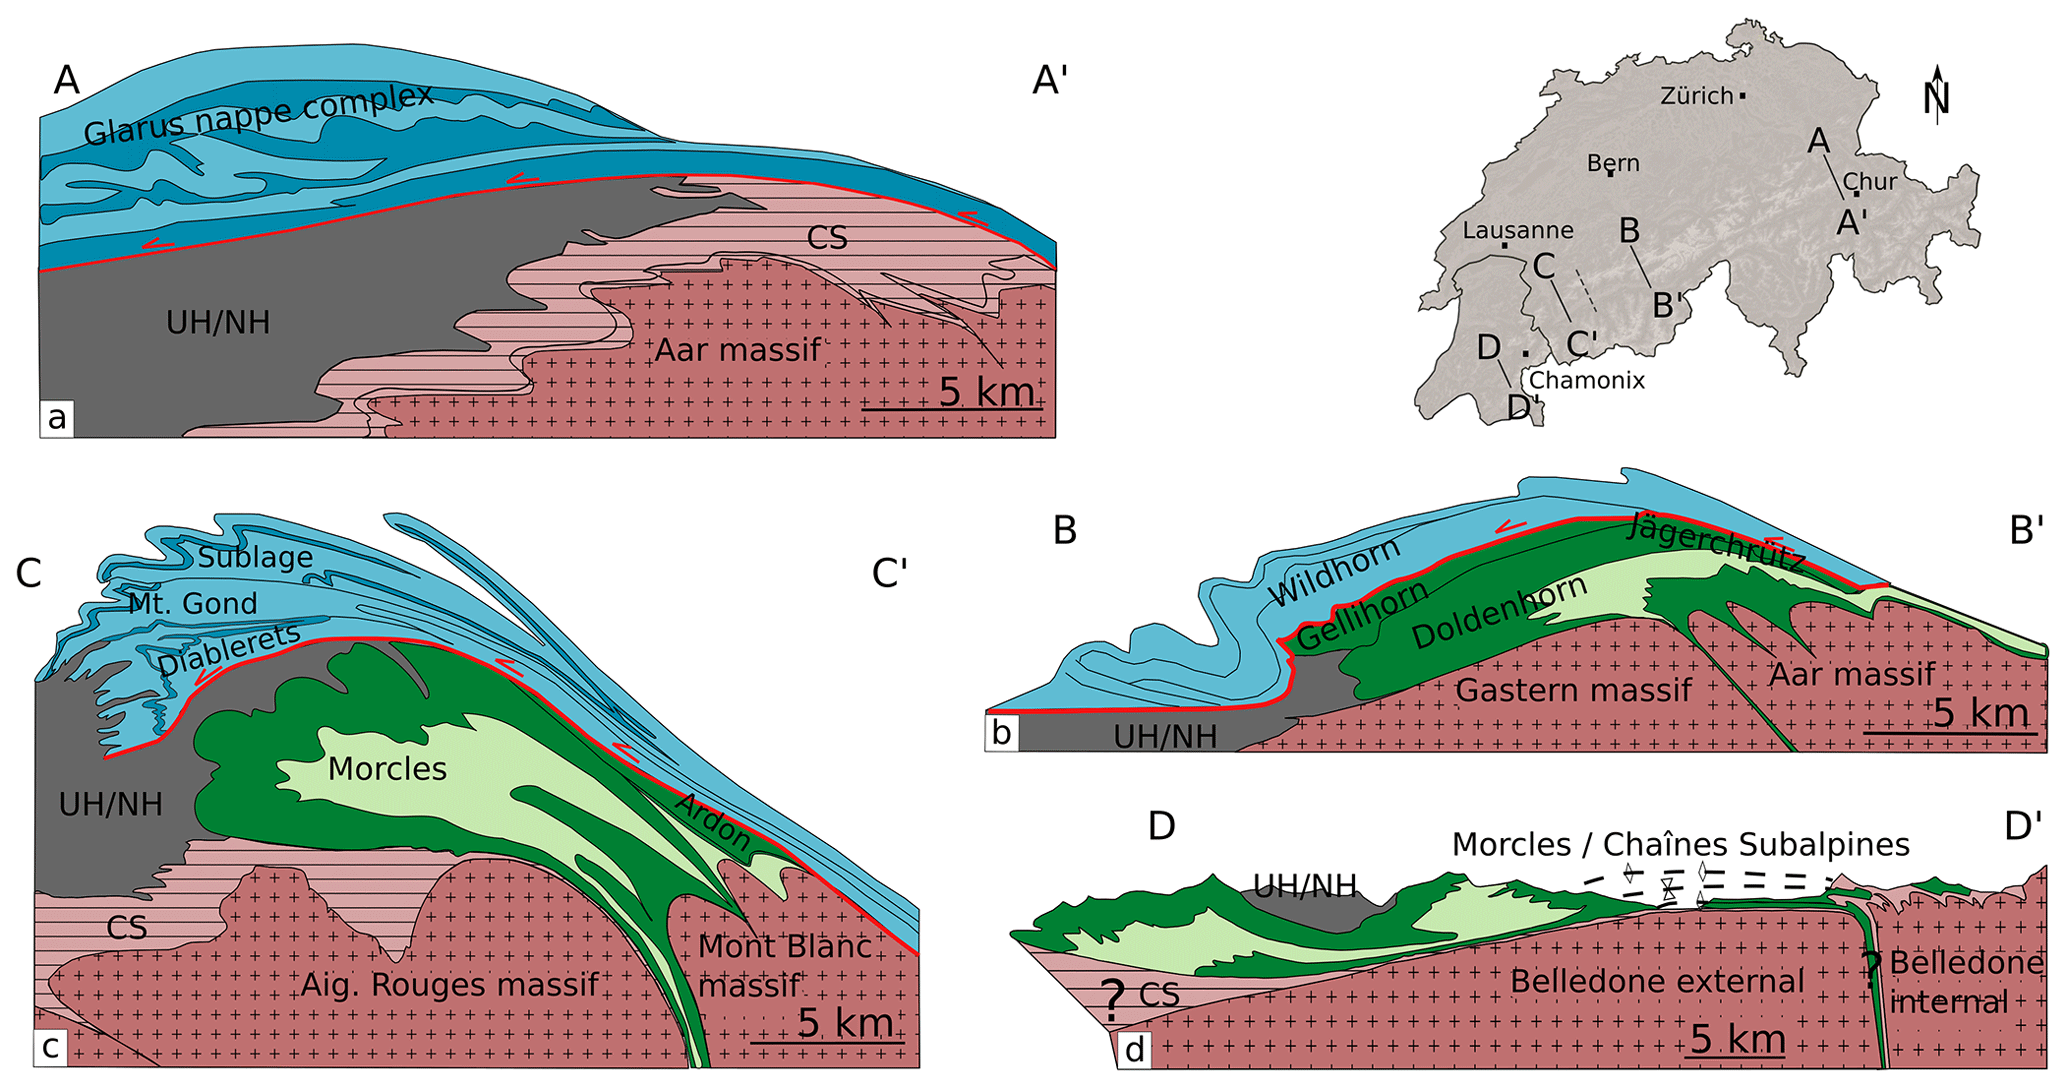
Figure 1Simplified geological cross sections along strike of the Helvetic nappe system. (a) Glarus nappe complex (modified after Pfiffner, 2015). (b) Doldenhorn nappe (modified after Kirschner et al., 1999). (c) Morcles nappe (modified after Escher et al., 1993). (d) Morcles nappe at the Belledonne massif (modified after Epard, 1990). UH/NH represents Ultrahelvetics/North Helvetics. CS represents cover sediments.
The onset of Alpine burial of the proto-nappe system is constrained by the last deposited sediments with ages of ca. 28 to 34 Ma (Kirschner et al., 1995; Nibourel et al., 2018). Peak metamorphic conditions in the Helvetic nappe system occurred between ca. 25 and 17 Ma, indicating the end of the main phase of nappe stacking (Kirschner et al., 1995; Nibourel et al., 2018). The main phase of nappe formation and stacking occurred presumably during a period of ca. 10 to 15 Ma (Masson et al., 1980; Milnes and Pfiffner, 1980; Burkhard, 1988; Kirschner et al., 1995; Nibourel et al., 2018). Uplift and exhumation of the Helvetic nappe system occurred between ca. 20 Ma and today (Kirschner et al., 1995; Nibourel et al., 2018). We focus here on the main phase of nappe formation and stacking, and we do not consider the subsequent uplift and exhumation of the Helvetic nappe system.
The Helvetic nappe system exhibits a wide range of nappe geometries, including two commonly considered endmember nappe styles, namely, fold nappes and thrust nappes or thrust sheets (Termier, 1906; Epard and Escher, 1996). Fold nappes are recumbent folds with fold amplitudes of several kilometres and with a stratigraphic inversion in a prominent overturned limb. Thrust nappes are coherent allochthonous rock sheets that are displaced along a basal shear zone and lack a prominent overturned limb.
We consider here four simplified geological sections across the Helvetic nappe system in the Central Alps of France and Switzerland, and we focus on several prominent nappes within these sections (Fig. 1). The first-order tectonic features of these four cross sections and the associated nappes will be compared with our 3-D modelling results.
The first section includes the Glarus nappe complex of eastern Switzerland (Fig. 1a). Geological reconstructions suggest a displacement of approximately 50 km from its original location along a thin basal thrust zone that is composed of Mesozoic sediments (e.g. Pfiffner, 2015). Studies suggest that the Glarus basal thrust originates inside Carboniferous strata, allowing for the transport of the Glarus nappe consisting of Permian Verrucano units at its base (e.g. Schmid, 1975; Pfiffner, 1993, 2015). Observations on the thrust zone suggest earlier viscous-dominated deformation followed by dominantly brittle deformation (Herwegh et al., 2008). A number of studies investigated the complex deformation behaviour of the thrust zone and suggest the involvement of pressurized fluids that resulted in hydro-fracture networks and the reduction of friction at the base (e.g. Burkhard et al., 1992; Badertscher and Burkhard, 2000; Badertscher et al., 2002; Herwegh et al., 2008; Hürzeler and Abart, 2008). Poulet et al. (2014) suggested a superposition of viscous and brittle deformation mechanisms due to ductile shear heating resulting in decarbonatization and the release of overpressurized fluids causing brittle fracturing.
The second section includes the Doldenhorn fold nappe, belonging to the Infrahelvetic complex, which has been overthrusted by the Wildhorn nappe, belonging to the Helvetic nappes (Fig. 1b). The Doldenhorn nappe consists of Mesozoic and Cenozoic par-autochthonous sediments that have been squeezed and sheared out of a pre-Alpine half-graben, referred to here as the North Helvetic basin (Fig. 2). The term North Helvetic basin refers here to a Jurassic extensional basin restricted to the western region of the Helvetic nappe system and should not be confused with the Tertiary North Helvetic Flysch basin that is part of the North Alpine foreland basin. The Doldenhorn nappe is derived from the inversion of the North Helvetic basin, which is restricted to the area west and south of the Aar massif. The Gellihorn and Jägerchrütz nappes are minor nappes and their sediments are considered deposits on a basement high, likely a horst, which separated the half-graben including the Doldenhorn sediments from the more distal marginal basin, referred to here as Helvetic basin, on which the Wildhorn sediments have been deposited (Masson et al., 1980) (Fig. 2). The Doldenhorn nappe roots in the Aar basement massif. Studies indicate metamorphic peak temperatures in the Doldenhorn nappe of up to 380 ∘C (Herwegh and Pfiffner, 2005; Ebert et al., 2007a; Girault et al., 2020). These temperatures allowed for ductile deformation and folding of the Doldenhorn nappe during nappe formation. Colder temperatures around ca. 250 ∘C in the structurally higher Wildhorn nappe were likely responsible for a deformation style resembling more a thrust nappe.
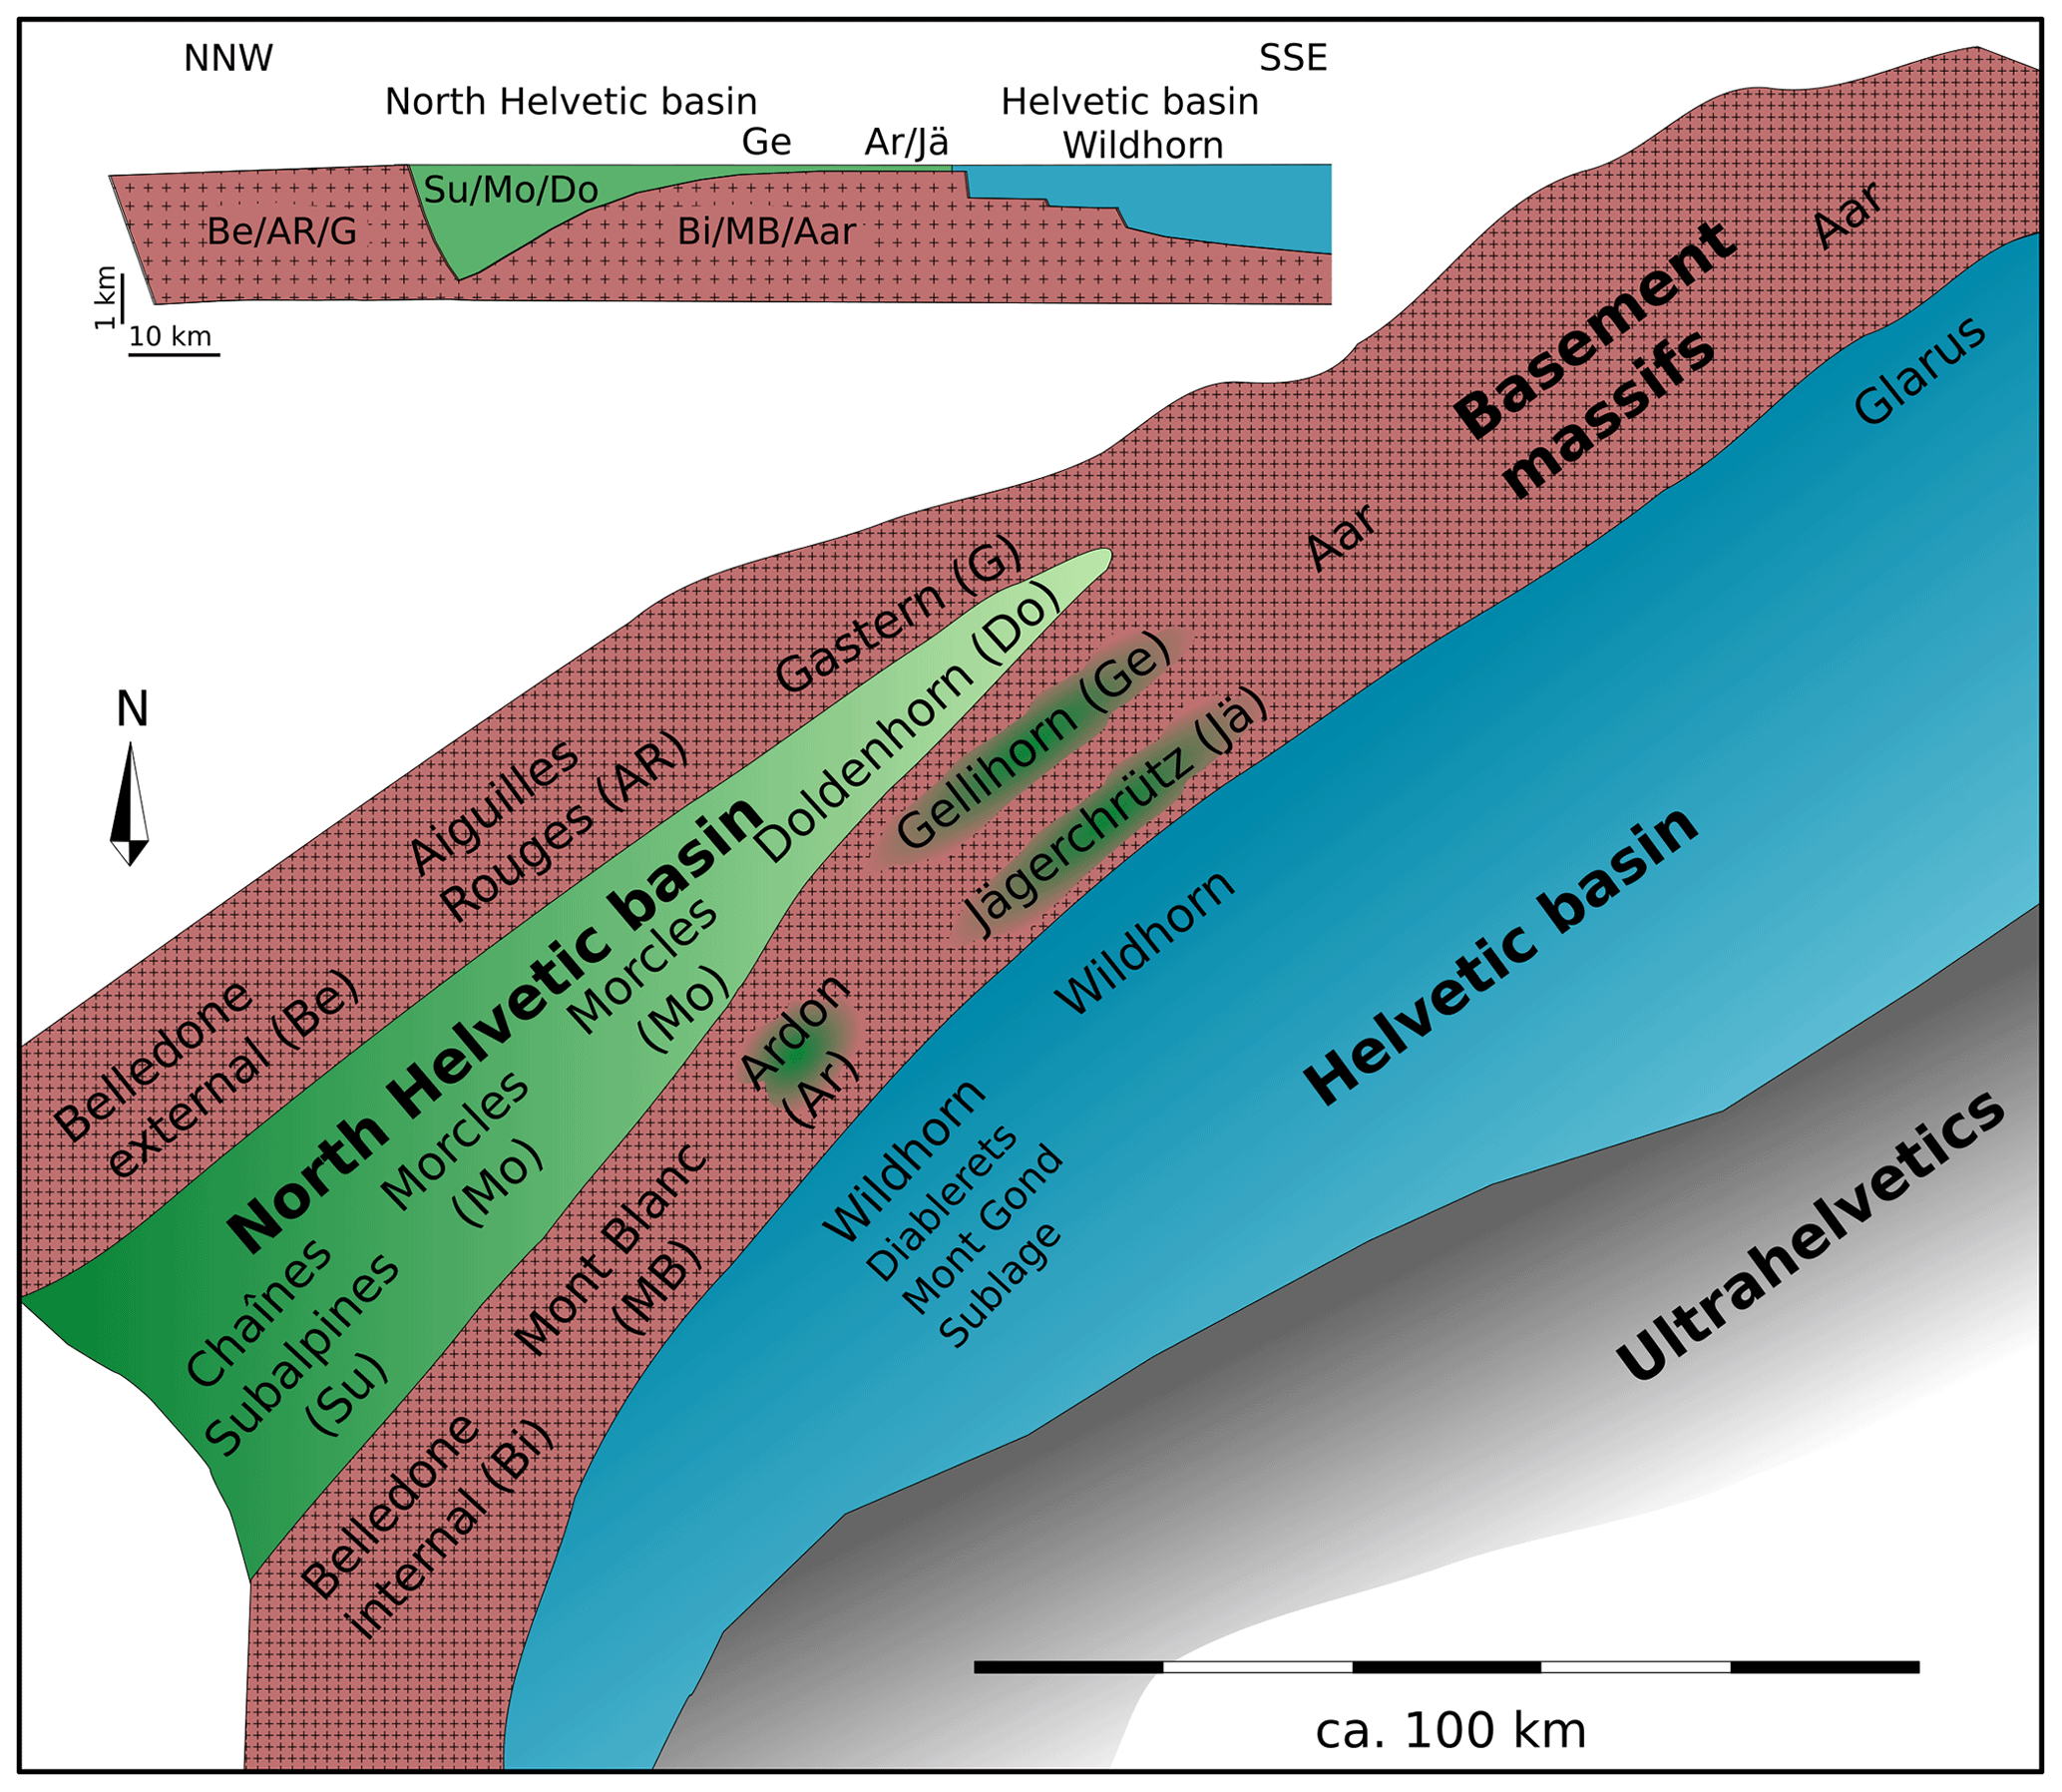
Figure 2Simplified palaeogeographic map of the Lower Cretaceous showing the assumed distribution of the basement massifs and sedimentary units forming the discussed tectonic nappes of the Helvetic nappe system (modified after Epard, 1990, and Pfiffner, 2015). The cross section on the top left shows a representative section across the Helvetic nappe system in the SW region of the nappe system (modified after Jaquet et al., 2018).
The third section includes the Morcles fold nappe (Fig. 1c), belonging to the Infrahelvetic complex. It is overlain by a major thrust nappe, which is termed in this region the Wildhorn super-nappe (Steck, 1999). The term super-nappe is used, because the nappe can be subdivided, from bottom to top, into the Diablerets, Mont Gond and Sublage nappes. Similarly to the Doldenhorn nappe, the Morcles nappe is considered to be the result of the closure of the North Helvetic basin and the subsequent extrusion of sediments during compressional Alpine tectonics (e.g. Ramsay, 1981; Pfiffner, 1993). This North Helvetic basin comprised kilometre-thick sequences of shale-rich units and competent carbonate units. The strongly thinned and overturned limb is in contact with the crystalline Aiguilles Rouges massif below and its autochthonous sediments. Between the Morcles and Wildhorn nappe is a minor sedimentary nappe, the Ardon nappe, which is considered to be originating from the horst region, from a similar palaeogeographic position as the Jägerchrütz nappe (Fig. 2). Estimates of metamorphic peak temperatures range between 250 and 380 ∘C (Leloup et al., 2005; Boutoux et al., 2016; Girault et al., 2020) and therefore support a dominantly ductile deformation regime. Furthermore, the deformation of the Morcles nappe is constrained by finite strain measurements. The data highlight a pattern of increasing strain from the front of the nappe towards the root zone and also from the top to the bottom. Strain ellipses show X∕Y ratios > 400 at the contact between the overturned limb and the basement-cover (Ramsay and Huber, 1987; Casey and Dietrich, 1997). Microstructural observations of the basal mylonitic shear zone in the overturned limb of the fold nappe indicate ductile creep in the calcite-rich lithologies (Austin et al., 2008). The Wildhorn super-nappe, as a whole, resembles more a thrust sheet but exhibits significant internal deformation. For example, the Diablerets nappe is separated from the Mont Gond nappe by an isoclinal fold indicating significant ductile deformation inside the super-nappe.
Due to the structural Rawil depression, there is no continuous outcrop from the Doldenhorn towards the Morcles nappe. However, several geological reconstructions suggest, that the Doldenhorn and Morcles nappes originate from the same laterally continuous North Helvetic basin and that the Wildhorn nappe and super-nappe originate from the same laterally continuous Helvetic basin of the Mesozoic passive European margin (Burkhard, 1988; Epard, 1990). The North Helvetic basin is considered absent in the eastern region of the Helvetic nappe system, which explains the absence of significant recumbent fold nappes in the Infrahelvetic complex below the Glarus thrust. To a first-order approximation, the Doldenhorn nappe is structurally similar to the Morcles nappe in that both nappes exhibit long inverted limbs, which are absent in the Glarus nappe complex.
The fourth section (Fig. 1d) includes the Morcles nappe and the Chaînes Subalpines and is located in the French Alps. There are different interpretations concerning the tectonic relationship between the Morcles nappe and the Chaînes Subalpines in this region (Epard, 1990; Pfiffner et al., 2011). Here, we follow the interpretations of Epard (1990) and Collet (1943), who consider this region of the Chaînes Subalpines as belonging to the same tectonic unit as the Morcles nappe. In other words, we assume that in the considered region the Chaînes Subalpines and Morcles nappe derived from the North Helvetic basin (Fig. 2). In this section, no Helvetic nappes are outcropping. In contrast to the Morcles fold nappe in the third section, the nappe is here not a fold nappe but rather a thrust nappe (compare Fig. 1c and d, respectively), because there is no prominent overturned limb.
Some studies suggested mechanical explanations for the variation in nappe style within the Helvetic nappe system. The formation of fold nappes in the southwestern part of Switzerland and the lack of such fold nappes in the northeastern part are explained by lateral variations of the mechanical stratigraphy, which is the alteration of mechanically strong, such as carbonates, and weak, such as shales, sedimentary units (Pfiffner, 1993, 2011). Different thickness ratios, n, of weak to strong sedimentary units cause a different mechanical response during shortening. Low ratios, n<0.5, favour imbricate thrusting and harmonic folding, while higher ratios of n favour fold nappes and detachment folding (Pfiffner, 1993). This impact of thickness ratios on deformation style, which was derived by field observations, is also supported by 2-D numerical simulations (Jaquet et al., 2014). Moreover, Von Tscharner et al. (2016) quantified, with 3-D numerical models of viscous deformation, the impact of laterally varying half-graben depth on the folding of sedimentary layers in the half-graben. Their 3-D model results also confirm that laterally varying sediment thickness has a strong impact on fold amplification and nappe formation. However, their models do not generate thrust nappes nor the stacking of nappes, as observed in the Helvetic nappe system. A comparison of observed finite strain gradients across the Morcles fold nappe with finite strain gradients, resulting from a theoretical thermo-mechanical shear zone model utilizing calcite flow laws, suggests that the Morcles fold nappe was generated by heterogeneous shearing during Alpine shortening (Bauville and Schmalholz, 2013), as was already suggested by kinematic models (Ramsay et al., 1983; Dietrich and Casey, 1989; Casey and Dietrich, 1997).
3.1 Numerical method
We apply the concept of continuum mechanics to describe the deformation of rocks with a system of partial differential equations (e.g. Mase, 1970). To solve the resulting system of equations numerically, we apply the 3-D thermo-mechanical parallel code LaMEM (Kaus et al., 2016; https://bitbucket.org/bkaus/lamem, last access: June 2020) for our simulations. The equations describing the conservation of mass, linear momentum and energy are the following:
where xi (i=1, 2, 3) refers to Cartesian coordinates in the three spatial directions (i=1 indicates x direction, i=2 y direction and i=3 z direction), vi represents the components of the velocity vector, P is pressure (negative mean stress), represents components of the deviatoric Cauchy stress tensor (with δij being the Kronecker delta), ρ is density, gi=[0 0 g] is the gravity acceleration vector with g being the gravitational acceleration, Cp is the specific heat, T the temperature and λ the thermal conductivity. The source term HR refers to the radiogenic heat production and for shear heating. The components of the deviatoric strain rate tensor are defined by the visco-plastic constitutive equations:
where is the viscous strain rate tensor, is the plastic strain rate tensor, ηeff is the effective viscosity, τij represents components of the deviatoric stress tensor and is the square root of the second invariant of the deviatoric stress tensor.
The temperature-dependent viscosity, ηeff, for the considered dislocation creep is
where n is the stress exponent, is the square root of the second invariant of the strain rate tensor, Bn the creep constant, En the activation energy and R the universal gas constant. The components of the plastic strain rate tensor are determined by enforcing the Drucker–Prager yield criterion given by
Here, τY is the yield stress, ϕ the friction angle and C the cohesion.
We do not model erosion and sedimentation in our model, mainly because the main phase of basement uplift and exhumation started during the end of the main nappe-forming phase, after ca. 20 Ma, and because our models do not generate significant lateral topographic variations (see Sect. 4).
The system of equations is discretized with a staggered grid finite difference approach and solved with LaMEM. Material properties are advected by employing a marker-and-cell method. In order to maintain computational stability for large time steps, we employ a stabilized free surface boundary condition. For detailed information on the LaMEM code, see Kaus et al. (2016) and the documentation on the official website (https://bitbucket.org/bkaus/lamem, last access: June 2020).
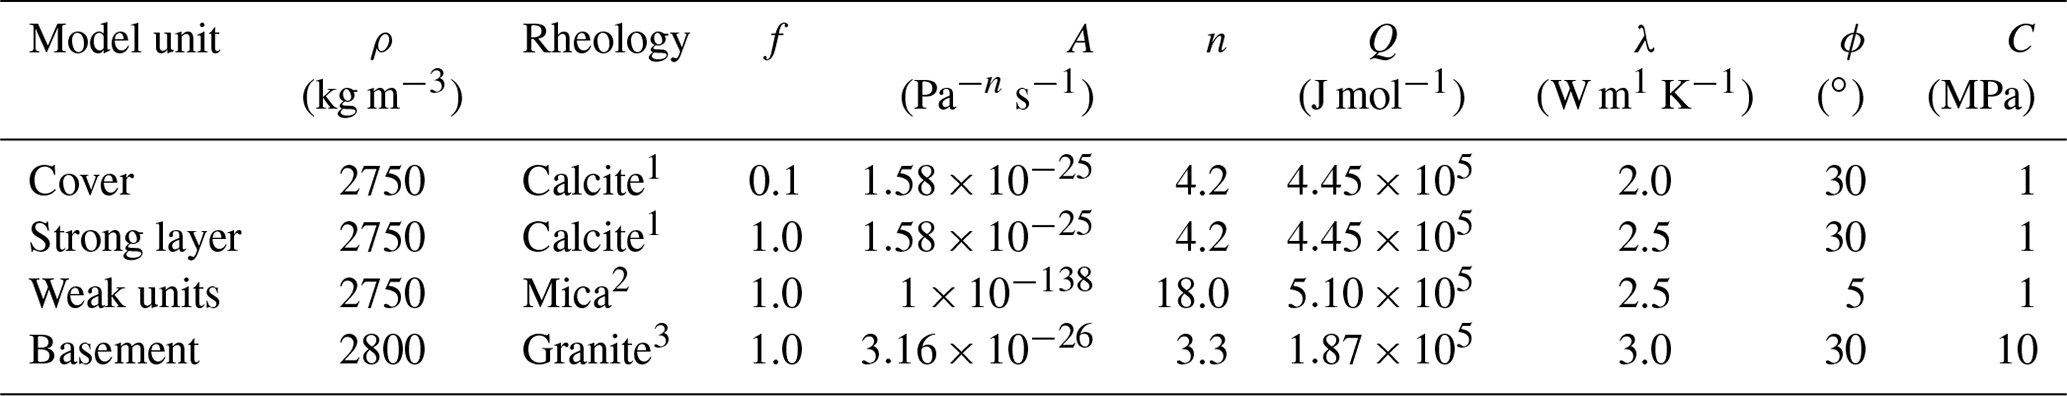
3.2 Model configuration
The model configuration (Fig. 3a) has a lateral width of X=70 km, a length of Y=210 km and a height of Z=40 km. Our numerical resolution for most simulations is () grid points with a mesh refinement in the Z direction using 96 grid points between Z=8 and 32 km and 16 grid points each for Z<8 and Z>32 km. Our model consists of five units which are, from top to bottom, a sticky air, a cover, a strong layer, a weak unit and a basement unit. Each unit has distinctive mechanical properties, such as, for example, a flow law, friction angle or cohesion that corresponds to natural materials. In addition to the standard parameters of the flow laws, we add a prefactor f to the creep constant Bn to facilitate a brittle–ductile transition zone at a depth of 8–10 km. The details of the mechanical properties for each unit are listed in Table 1. The initial model geometry is based on a simplified and idealized cross section of the European crustal continental passive margin. The basement constitutes the bottom of the model domain and has a maximum height of 15 km. It involves a half-graben (HG) that is separated by a horst from a larger distal basin (HB) to the right (Fig. 3b). HG represents the half-graben region in which the sediments of the Morcles and Doldenhorn nappes have been deposited, HB represents the Helvetic basin in which the sediments of the Wildhorn nappe have been deposited, and the horst between HG and HB represents the domain on which the sediments of the Ardon and Gellihorn nappes have been deposited (Fig. 2). In the reference configuration HG is becoming shallower and finally disappears towards the NE direction (positive X direction; Fig. 3a). The half-graben, between 110 km km, is subjected to different geometries in our different model configurations with respect to its lateral extent (X direction). The total dimensions of the graben system are fixed with a maximum depth of 7 km, a length of 25 km (Y direction) and a width of 50 km (X direction). In contrast, the geometry of the distal basin (Y<90 km) is constant and has no variations in the X direction for all model configurations. Both half-graben and basin are filled with a weak unit, mimicking shale-rich sediments, that is overlain by a strong layer with a thickness of 1.5 km, mimicking strong carbonates. Additionally, we apply a 10 km thick sediment cover, mimicking the North Helvetic Flysch and Ultrahelvetic units. We assume that these cover units have been thrust on top of the proto-Helvetic nappe system before the onset of nappe formation. Finally, we use a low-density low-viscosity sticky air layer (η=1019 Pa s, ρ=1 kg m−3) with a thickness of 15 km on top to simulate a free surface boundary condition. The chosen parameters for the sticky air layer follow the recommendations by Crameri et al. (2012) for our model height of 40 km and a characteristic effective viscosity around the brittle–ductile transition of ca. 2.5×10²² Pa s.
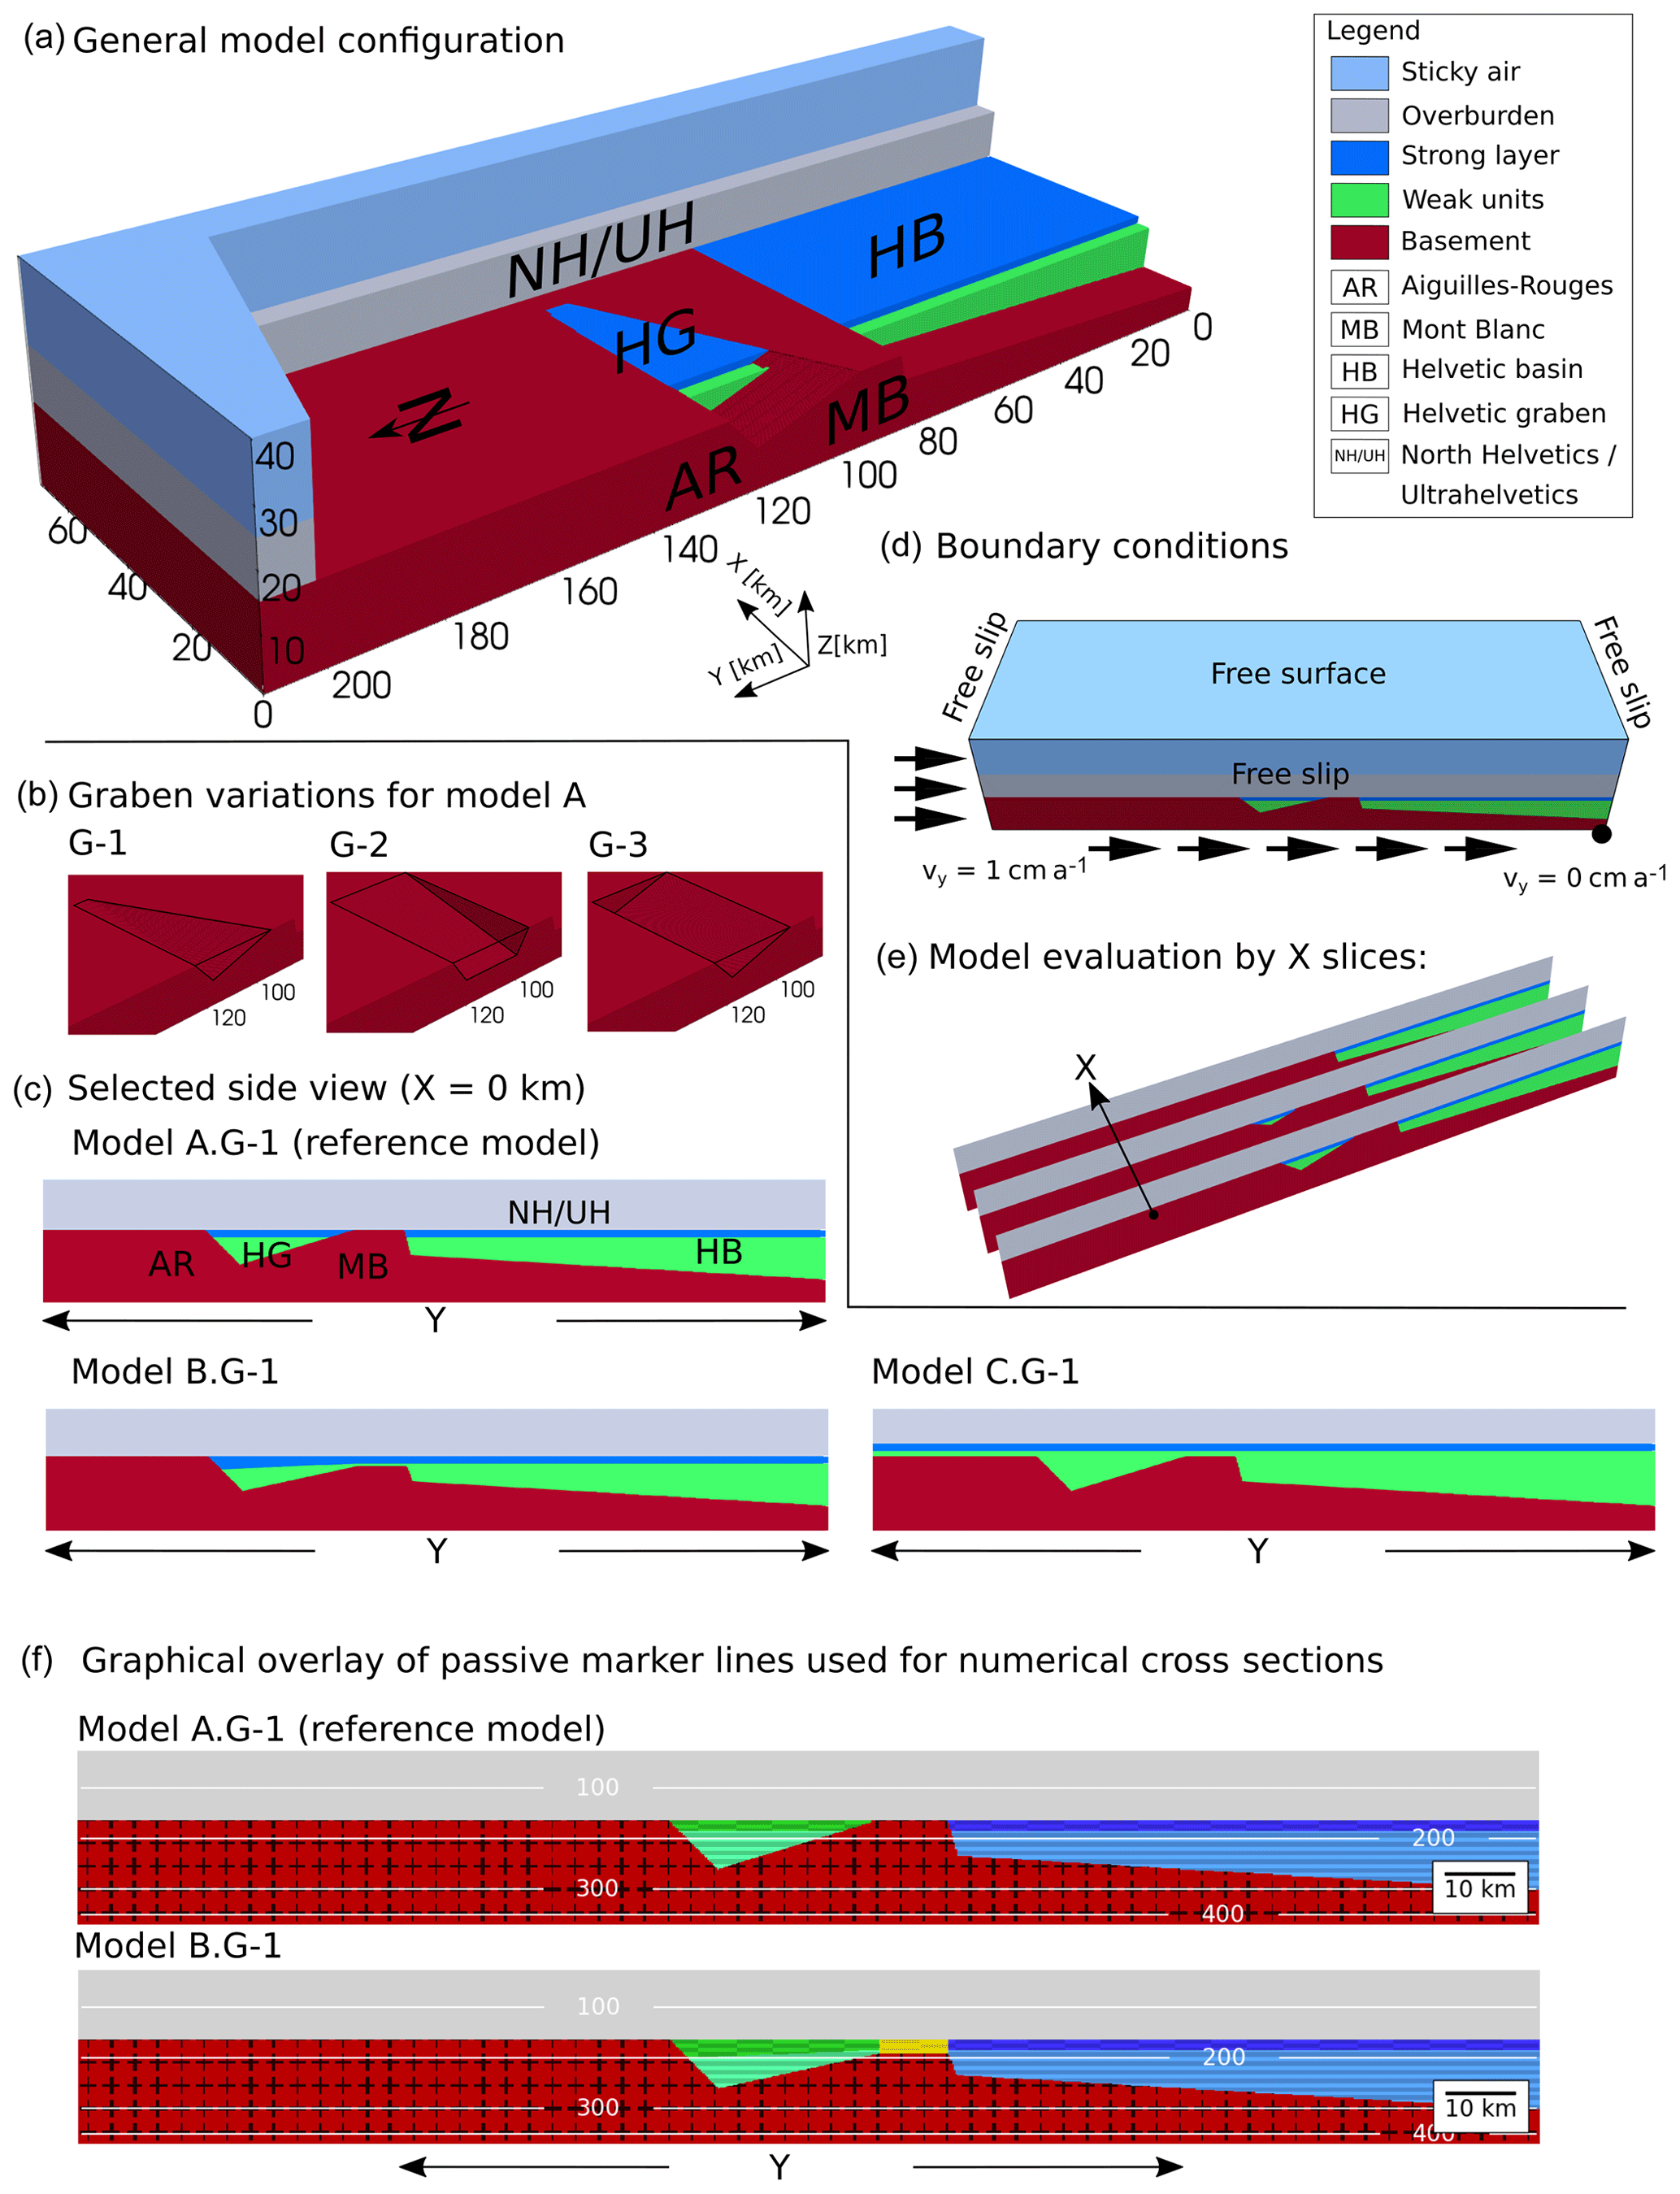
Figure 3(a) 3-D geometry of our reference model configuration using a laterally disappearing half-graben and highlighting the distribution of our numerical phases and their material properties. Here, the colour green refers to weak materials and dark blue to strong materials. The configuration is based on the palaeogeographic reconstructions as indicated by the abbreviations on the model: AR represents Aiguilles Rouges massif, MB represents Mont Blanc massif, HB represents Helvetic basin, NH/UH represents North Helvetic Flysch and Ultrahelvetic units, and HG represents North Helvetic graben. (b) Display of our three different half-graben systems used as initial setup. (c) Cross-sectional view at X=0 km for three models utilizing half-graben G-1 in combination with three different stratigraphic distributions. (d) Sketch displaying our boundary conditions. (e) Three cross-sectional slices along the X direction to explain our model evaluation. (f) Subfigure highlighting our passive marker overlay, which is used to distinguish the different structural units, HG (green) and HB (blue), from each other. Temperature isotherms are shown in degrees Celsius (∘C).
Table 1Table listing the material properties of our model units for most models, where ρ is the density, A is the pre-exponential factor, f is custom prefactor, n is the stress exponent, Q is the activation energy, λ is the thermal conductivity, ϕ is the friction angle, and C is the cohesion. Some additional parameters are constant: the thermal expansion coefficient K−1, the heat capacity Cp=1050 J K−1 and the radiogenic heat production W m−3. We use creep flow laws from Schmid et al. (1977),1 Hansen and Carter (1983)2 and Kronenberg et al. (1990).3
In order to investigate the impact of the geometry of HG on the structural evolution of our model, we use two different series of simulations. In the first one, we vary the geometry of HG in the lateral direction using three different geometries (Fig. 3b), namely, G-1 to G-3. Here, we also define our reference model A.G-1. Model A.G-1 comprises a geometry of HG, which linearly shallows and narrows out in the lateral X direction. The next configuration, G-2, is HG without lateral geometrical variations, which is bounded by a 90∘ wall to the adjacent basement. Our third configuration, G-3, is HG with a full graben that shallows out in lateral direction while the length in the Y direction is constant.
In the second series (Fig. 3c) we employ the same HG as in the reference configuration, G-1, but modify the spatial connection between the strong layer and the underlying basement. In model B.G-1 we decrease the height of the horst in such a way that the strong layer and a part of the weak unit rests on the top of the horst. Additionally, we also thicken the left part of the strong layer which is connected to the basement in a wedge-like shape (Fig. 3c). In the last model, C.G-1, we extend the strong layer to the left of the HG (Fig. 3c). For C.G-1, the layer is not connected with the basement but underlain by an additional 0.5 km thick layer of weak units (Fig. 3c).
To test the impact of the vertical strength distribution in the basement, we performed an additional simulation, D.G-1, with the same configuration as the reference model, A.G-1, but we cut off the deviatoric stresses in the basement at 40 MPa. Numerically, this is done by setting the cohesion in the basement to 40 MPa and setting the friction angle to zero. Such a yield criterion corresponds essentially to a pressure-insensitive von Mises yield strength and mimics a semi-brittle deformation or a low-temperature plasticity.
We apply free slip boundary conditions on all sides of the model except on the top where we model a free surface boundary condition with the sticky air method (Fig. 3d). In order to mimic the kinematic conditions during tectonic wedge formation, we apply a constant velocity boundary condition on the bottom face and the left XZ face of our model (Fig. 3d). We induce bulk shortening of the model by moving the left boundary and the bottom boundary in positive Y direction with a constant velocity of vy=1 cm yr−1. This boundary condition is similar to typical sandbox analogue models of accretionary wedge formation. The bulk shortening strain rate is recalculated from the velocity boundary condition for every time step. The shortening of the model in the Y direction is balanced by an elongation in the Z direction, with no changes of the width in the X direction.
Initially, we apply a linear, vertical temperature gradient of 16.6 ∘C km−1 with a fixed temperature of 20 ∘C at the surface and 435 ∘C at the bottom of the model.
Furthermore, we use passive marker lines and patterns to improve the visualization of 2-D cross sections of our 3-D model (Fig. 3f). Also, we slightly change the colour scheme to highlight the two major basement structures HG and HB, together with the sediments on top of the basement horst (yellow). The darker colours inside the HG and HB indicate the strong layer, while the lighter colours correspond to the weak units. The layering and patterns are passively advected with the numerical velocity field. Hence, they do not influence the material properties and deformation and are simply there for visualization purposes.
4.1 3-D model evolution
We first provide an overview of the general model evolution of all six performed 3-D simulations. Figure 4 shows the structural evolution for three different bulk shortenings for each model configuration. All models, except model C.G-1 (Fig. 3c), show the formation of nappe-type structures in the strong layers and stacking of the strong layer from HB on top of the strong layer of HG. Model C.G-1 does not generate any nappe-like structure or overthrusting but generates detachment folds.
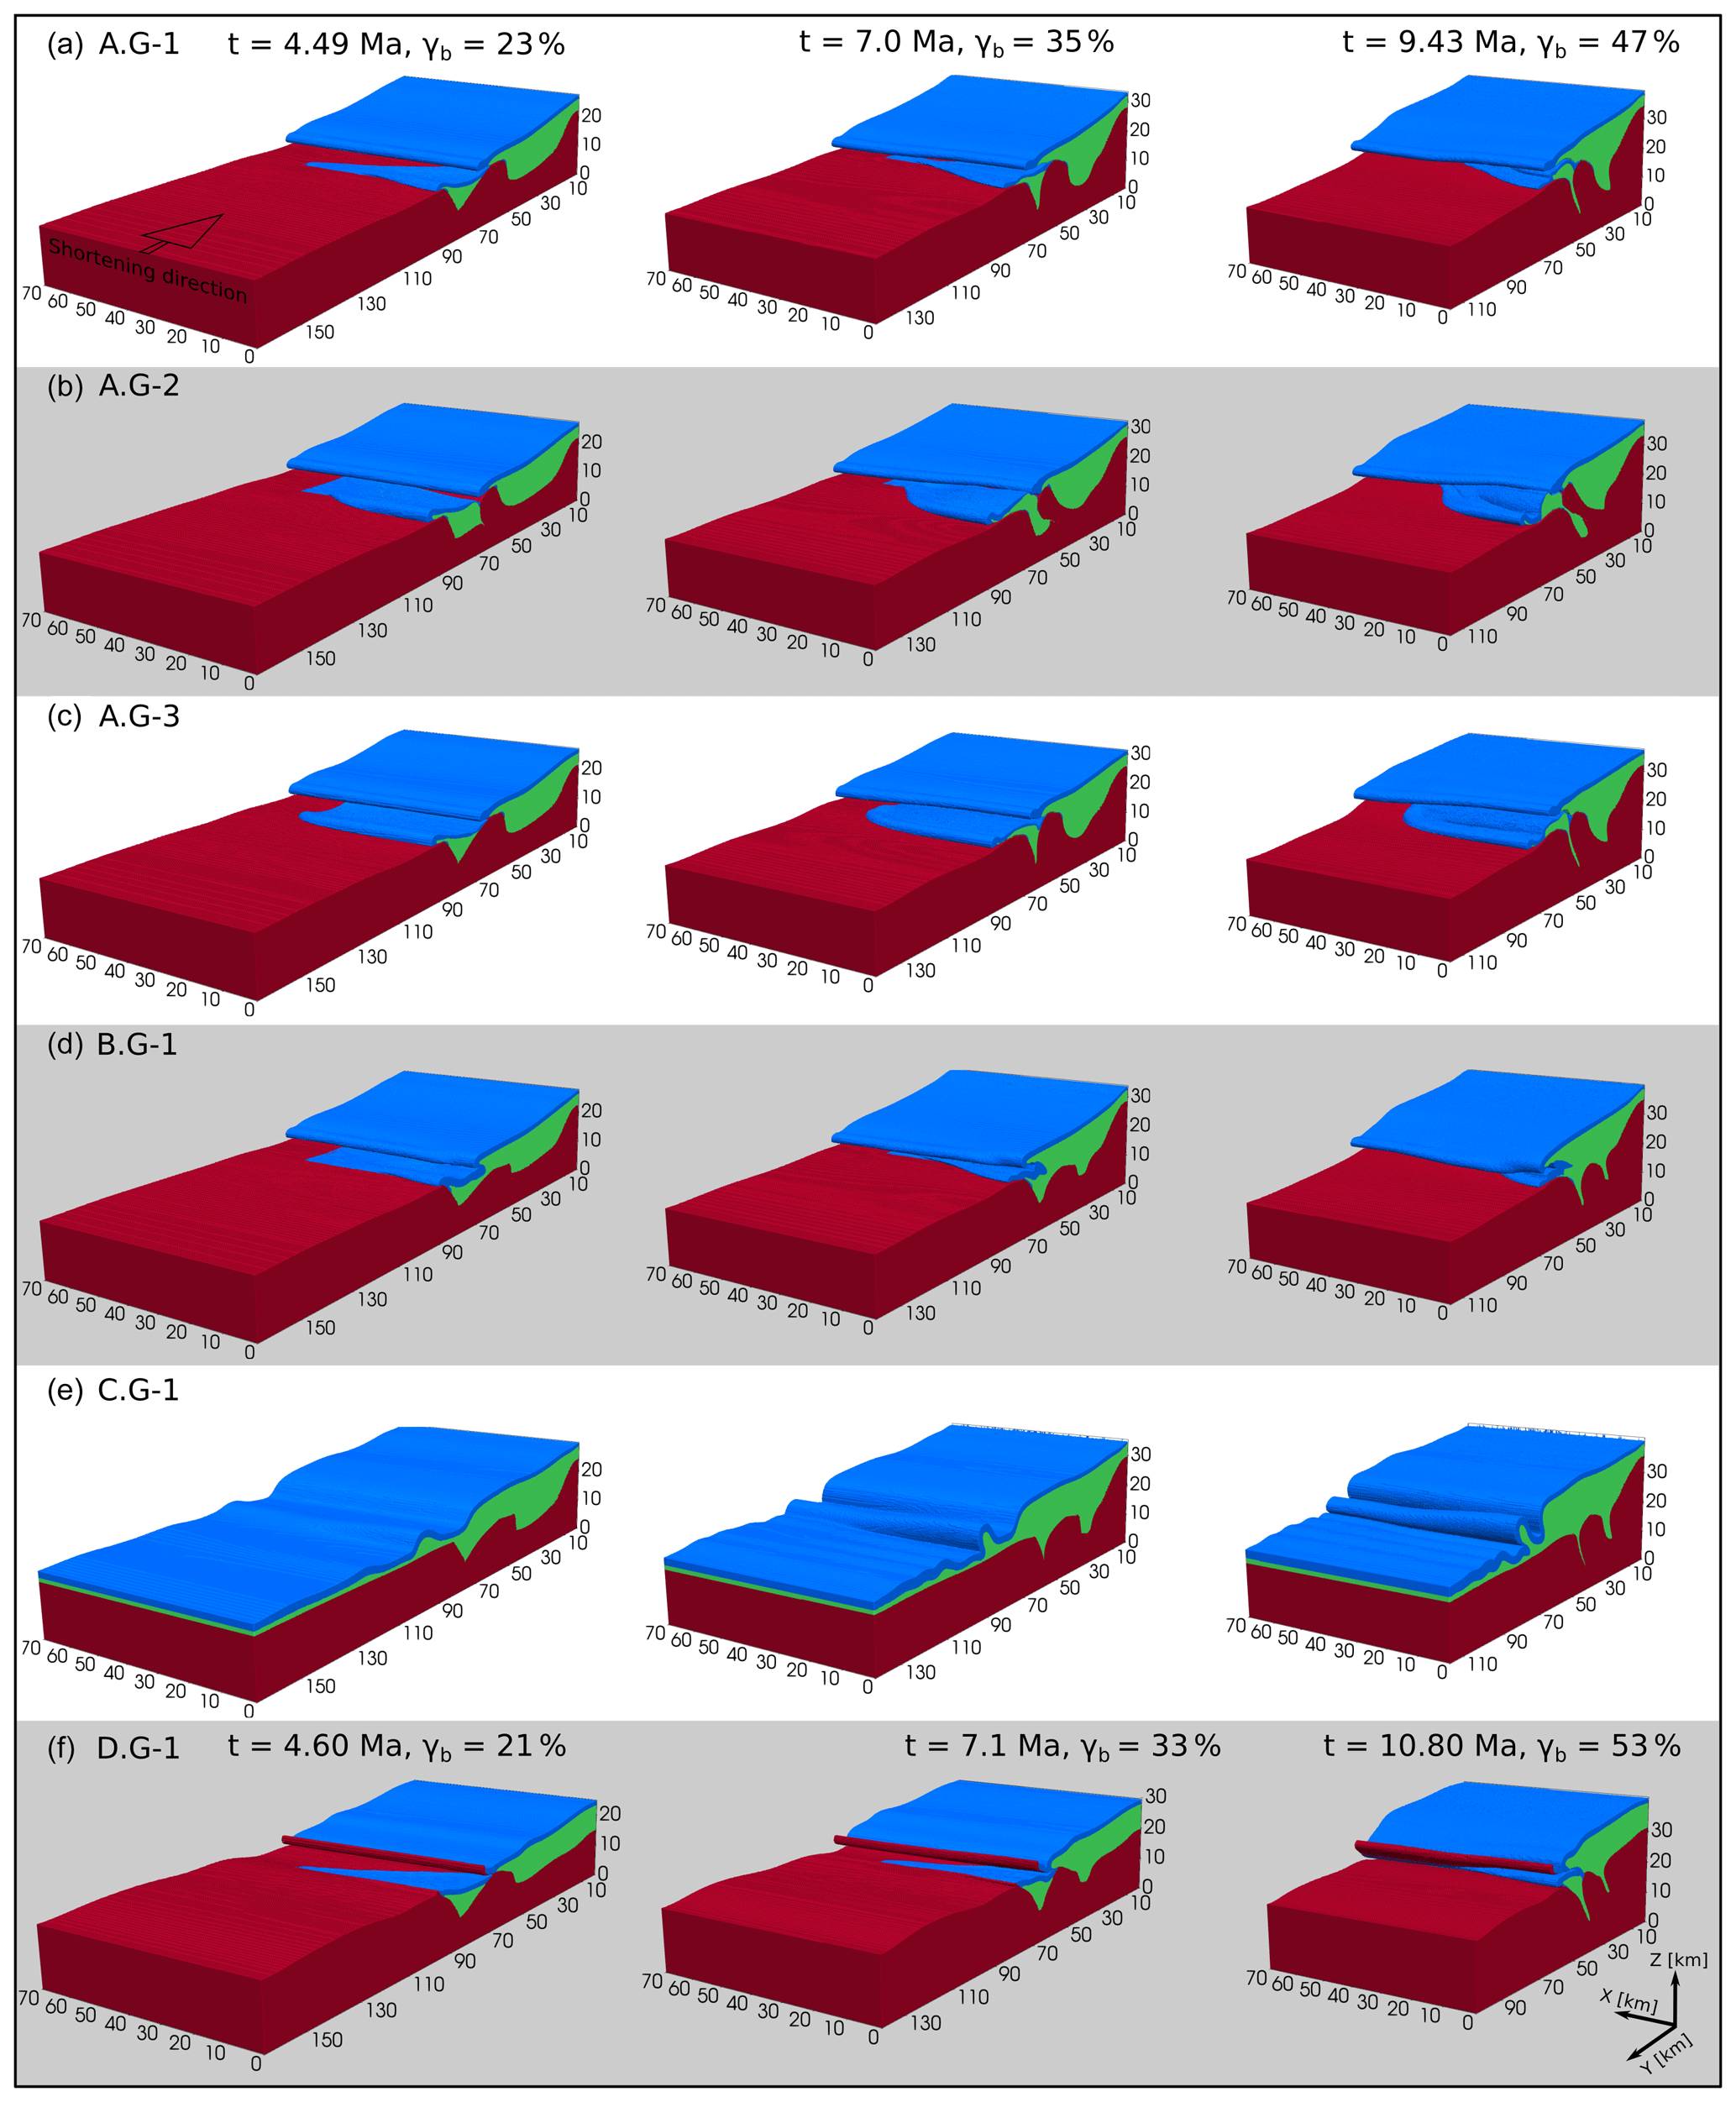
Figure 43-D model evolution for our six simulations, using a graphical threshold to highlight the deformation of the strong layer, weak units and the basement. Rows correspond to the configuration and columns to the total bulk shortening γb.
In the first stage of our reference model A.G-1 (Fig. 4a), the strong layer of HB is detached from the horst by the formation of a shear zone. Both the strong layer and the weak units below are thrusted on top of the horst, culminating in a horizontal displacement of about 10 km. Our model generated a structure resembling a thrust sheet or thrust nappe. The HB is progressively closed. In the region of HB, the weak sediments and the basement are thickened with ongoing bulk shortening. Initially, the basement experiences an uplift at the right boundary due to the imposed velocity discontinuity. The basement uplift increases the topography at the right boundary of the model (i.e. the backstop). The HG shows minor signs of deformation at 23 %. The strong layer is partially sheared and squeezed out in front of HG. Additionally, we observe a slight depression of the strong layer in the rear of HG. In the next shortening stage (Fig. 4b), the closure and inversion of HG is in progress. The strong layer has been squeezed out of HG. The horizontal displacement of the strong layer of HG decreases in positive X direction associated with a decreasing depth of HG. Furthermore, the thrust nappe from HB has advanced on top of HG and the horst exhibits a dome-like shape. At 47 % bulk shortening (Fig. 4c), HG is almost completely closed, resulting in the formation of a elongated cusp dipping towards the backstop. The infill of HG has been extruded and compromises a nappe that is overthrust by a nappe from HB. The front of the nappe from HB is essentially straight along the lateral X direction, indicating that the displacement of the nappe is essentially unaffected by the formation of the nappe below, whose front varies significantly along the X direction. We only observe a slightly higher topography above the nappe from HG, causing a slight tilting of the nappe from HB towards the positive X direction.
Model A.G-2 (Fig. 4b) deviates in the structural evolution from model A.G-1. At 23 % bulk shortening (Fig. 4b), the strong layer of HG is displaced more out of HG than for model A.G-1. The basement horst is slightly sheared towards the left, which is against the shortening direction. This shearing of the horst increases with progressive bulk shortening. At 47 % bulk shortening (Fig. 4b), the HG is nearly closed at its top, but the closure of the HG did not form a cusp, as for model A.G-1. In contrast, the sediments still in the HG become thicker with depth, because for the considered geometry of the HG it is more difficult to squeeze out all the sediments (Fig. 4b). The strong layer of HG has been completely detached from the horst, showing a higher slope in front of the extruded sediments. Overall, this model shows a significantly higher degree of basement involvement, with the updoming horst separating the nappe from HG from the thrust nappe from HB. Nevertheless, the front of the nappe from HB was displaced in the same uniform manner as in the reference model, A.G-1.
Model A.G-3 displays a similar evolution as model A.G-1 (Fig. 4c). The geometry of HG results in an almost straight front of the squeezed out strong layer. There is a slight curvature at the lateral boundary between the lateral end of HG and basement (Fig. 4c). The final stage (Fig. 4c) shows a nappe originating from HG that is almost homogeneous in the lateral X direction. However, even though the depth of the half-graben is constant up to X=50 km, there is a notable decrease of nappe height from X=30 to 50 km. This tilting of the nappe front towards the positive X direction can be explained by the adjacent basement, which might affect the degree of half-graben closure due to the strength contrast between the sediment and basement units. At 47 % bulk shortening (Fig. 4c), the nappe from HB did not fully thrust over the fold nappe.
Model B.G-1 (Fig. 4d) exhibits a continuous strong layer from HG to HB across the horst, but it has the same geometry of HG than reference model A.G-1. At 23 % bulk shortening (Fig. 4d), we observe a similar deformation of the strong layer at HG than in model A.G-1. However, a larger amount of weak sediments from HB is displaced across the horst against the shortening direction. At 35 % bulk shortening, the HG is less closed compared to the same bulk shortening of the reference model (Fig. 4d). Inside the initially continuous strong layer, a shear zone develops that forms a nappe of sediments from the region of the HB. At 47 % bulk shortening (Fig. 4d), two nappe structures have formed: one consisting of sediments from HG and a structurally higher one consisting of sediments from HB. The two nappes are also stacked. However, in this model the strong layer has no connection anymore to the horst.
Model C.G-1 (Fig. 4e), with a strong layer resting above the entire basement, shows detachment folding. The lateral variations in basement geometry are not significant enough to generate a shear zone in the strong layer, which eventually would form a nappe structure. The deformation of the basement and HG is similar to model B.G-1. The detachment fold with the largest amplitude originates from the region of HG (Fig. 4e). With progressive shortening, this detachment fold is displaced along the top of the basement against the direction of shortening (Fig. 4e).
In model D.G-1 (Fig. 4f), with a stress cut-off in the basement at 40 MPa, the shortening is more homogeneously distributed in the basement, so that during the initial stages of shortening (23 %; Fig. 4f) the basement at large distance from the backstop is already thickened. Consequently, the basement uplift around the backstop is significantly lower compared to all other models. Furthermore, during nappe formation some parts of the uppermost basement are also sheared off from the basement. The nappe forming from the strong layer of HG resembles a fold nappe.
4.2 2-D numerical cross sections
We discuss the deformation in the 3-D models by analysing six 2-D cross sections parallel to the shortening direction (Y direction) but at six different locations along the lateral X direction (Fig. 5). The six cross sections are located along the lateral direction from X=0 to X=50 km with 10 km spacing.
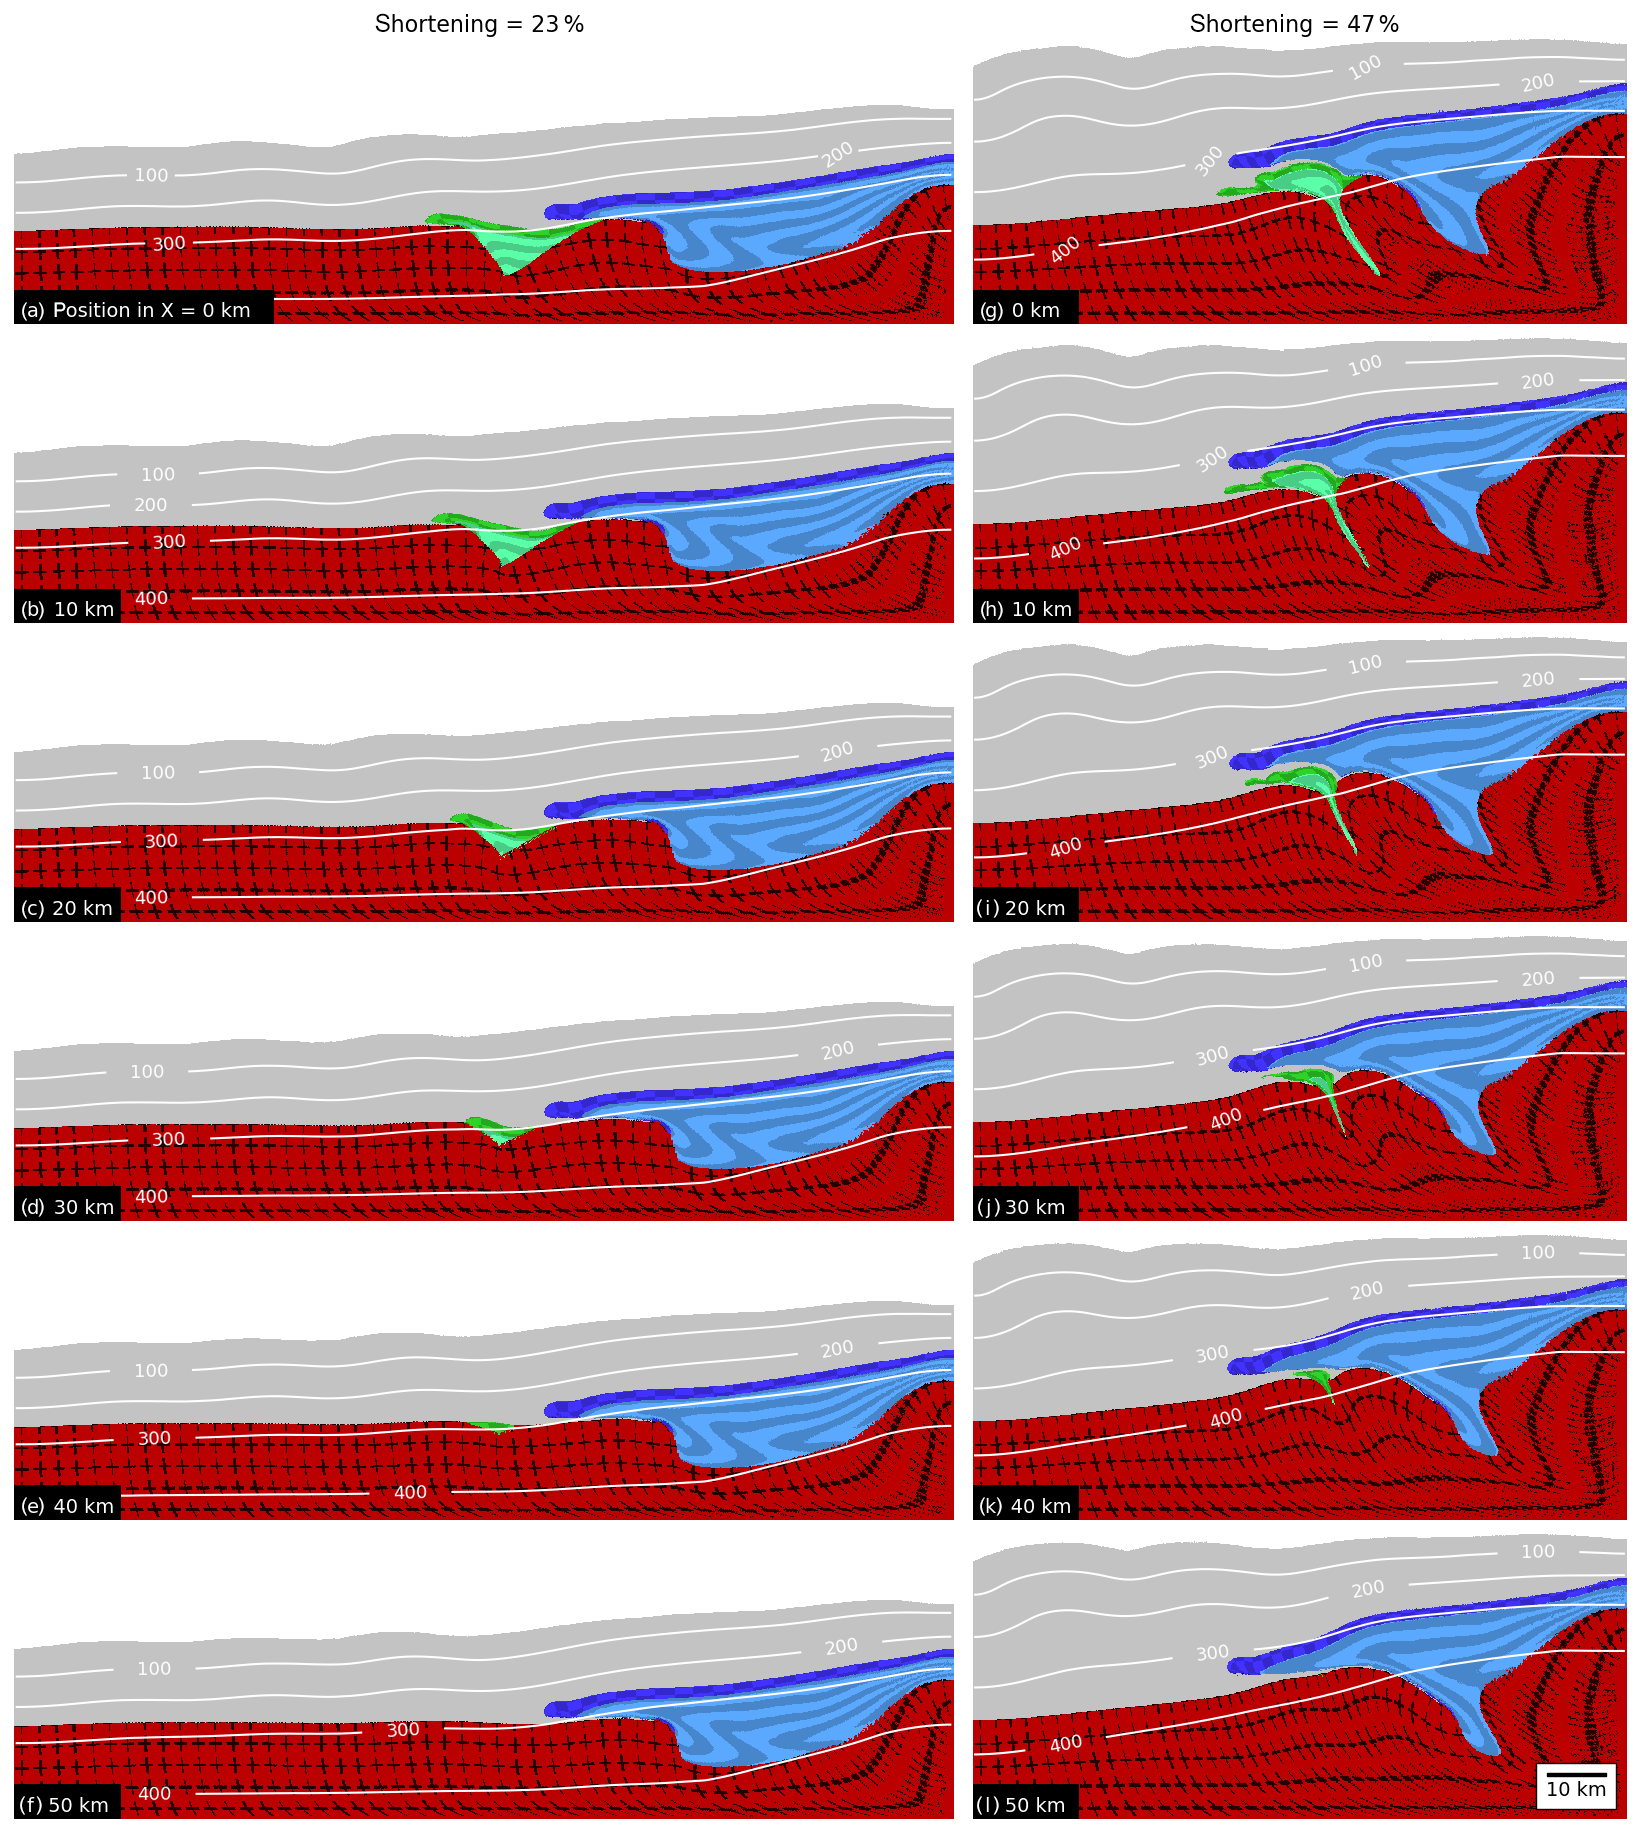
Figure 5Graph showing lateral cross sections for two different states of bulk shortening for the geometrical evolution of model A.G-1. Cross sections are taken in 10 km steps from X=0 to X=50 km. Additionally, we display the isothermal lines in degrees Celsius (∘C). Columns correspond to the bulk shortening state and rows to cross-section X position.
For the reference model A.G-1 (Fig. 5) at 23 % shortening (Fig. 5, left column), the sediments from HB have been detached from their original position and thrusted across the basement horst all along the lateral direction (everywhere in the left column of Fig. 5). The displaced sediments from HB resemble a thrust nappe. Around the backstop (right side) there is significant basement uplift. The cross sections show, from top to bottom, the shallowing and disappearance of HG. The strong layer is already sheared out of HG, whereby the horizontal displacement is larger for deeper HG. Both nappes originating from HB and HG are deforming at the same time. The temperature around the top of the horst is ca. 300 ∘C.
The passive marker lines in the weak sediments of HB indicate ductile flow generating passive shear folds. In the basement the passive marker symbols (crosses) indicate an increase in shear strain from the top to the bottom of the basement due to decrease in basement viscosity associated with a temperature increase. At 47 % bulk shortening (Fig. 5g–l, right column), the nappe from HB is thrust completely above the nappe from HG. The HG is almost closed with the weak sediments residing now inside a cusp between the neighbouring basement units, which dips towards the backstop. In the deeper region of HG the passive markers in the weak sediments indicate a fold nappe structure. The frontal part of the nappe from HG resembles a thrust nappe, formed exclusively by the strong layer, whereas the main part of the nappe, including also the weak sediments, resembles a fold nappe (Fig. 5g–i). Between the upper nappe from HB and the lower nappe from HG are cover sediments that have been dragged between the two nappes during overthrusting of the nappe from HB (Fig. 5g–k). The nappe from HG disappears in the lateral direction with the disappearance of HG. For the cross section without HG (Fig. 5l), there is only a nappe from HB resembling a thrust nappe. Despite the significant lateral variation of the depth of HG and the associated lower nappe, the horizontal displacement of the upper thrust nappe is essentially the same along the lateral direction. Consequently, nappe formation of sediments from HG does not affect the horizontal displacement of the overthrusting nappe from HB. The horst exhibits a significant internal deformation in the regions with a deep HG, indicated by the passive marker symbols. The temperature isotherms are affected by the deformation and thickening of the model. Generally, the sediments are getting hotter during the deformation. At 23 % bulk shortening the strong layer of HG has a temperature of ca. 300 ∘C, while the temperature of the strong layer of HB is less than 300 ∘C. At 47 % bulk shortening the isotherms indicate that both strong layers were heated by ca. 50 ∘C.
In addition to the cross sections showing the structural and thermal evolution of model A.G-1, we display the same cross sections but indicating the magnitude of the deviatoric stress invariant, τII, to quantify the state of stress (Fig. 6). The largest stress is ca. 140 MPa and occurs at the brittle–ductile transition in the cover, at a depth of ca. 5 km. At 23 % bulk shortening (Fig. 6a–f), the top of the basement exhibits τII values between 40 and 80 MPa. After 47 % bulk shortening, τII values in the basement are strongly decreased down to 10 to 20 MPa, due to the increase in basement temperature. Overall, there are no considerable lateral variations in τII.
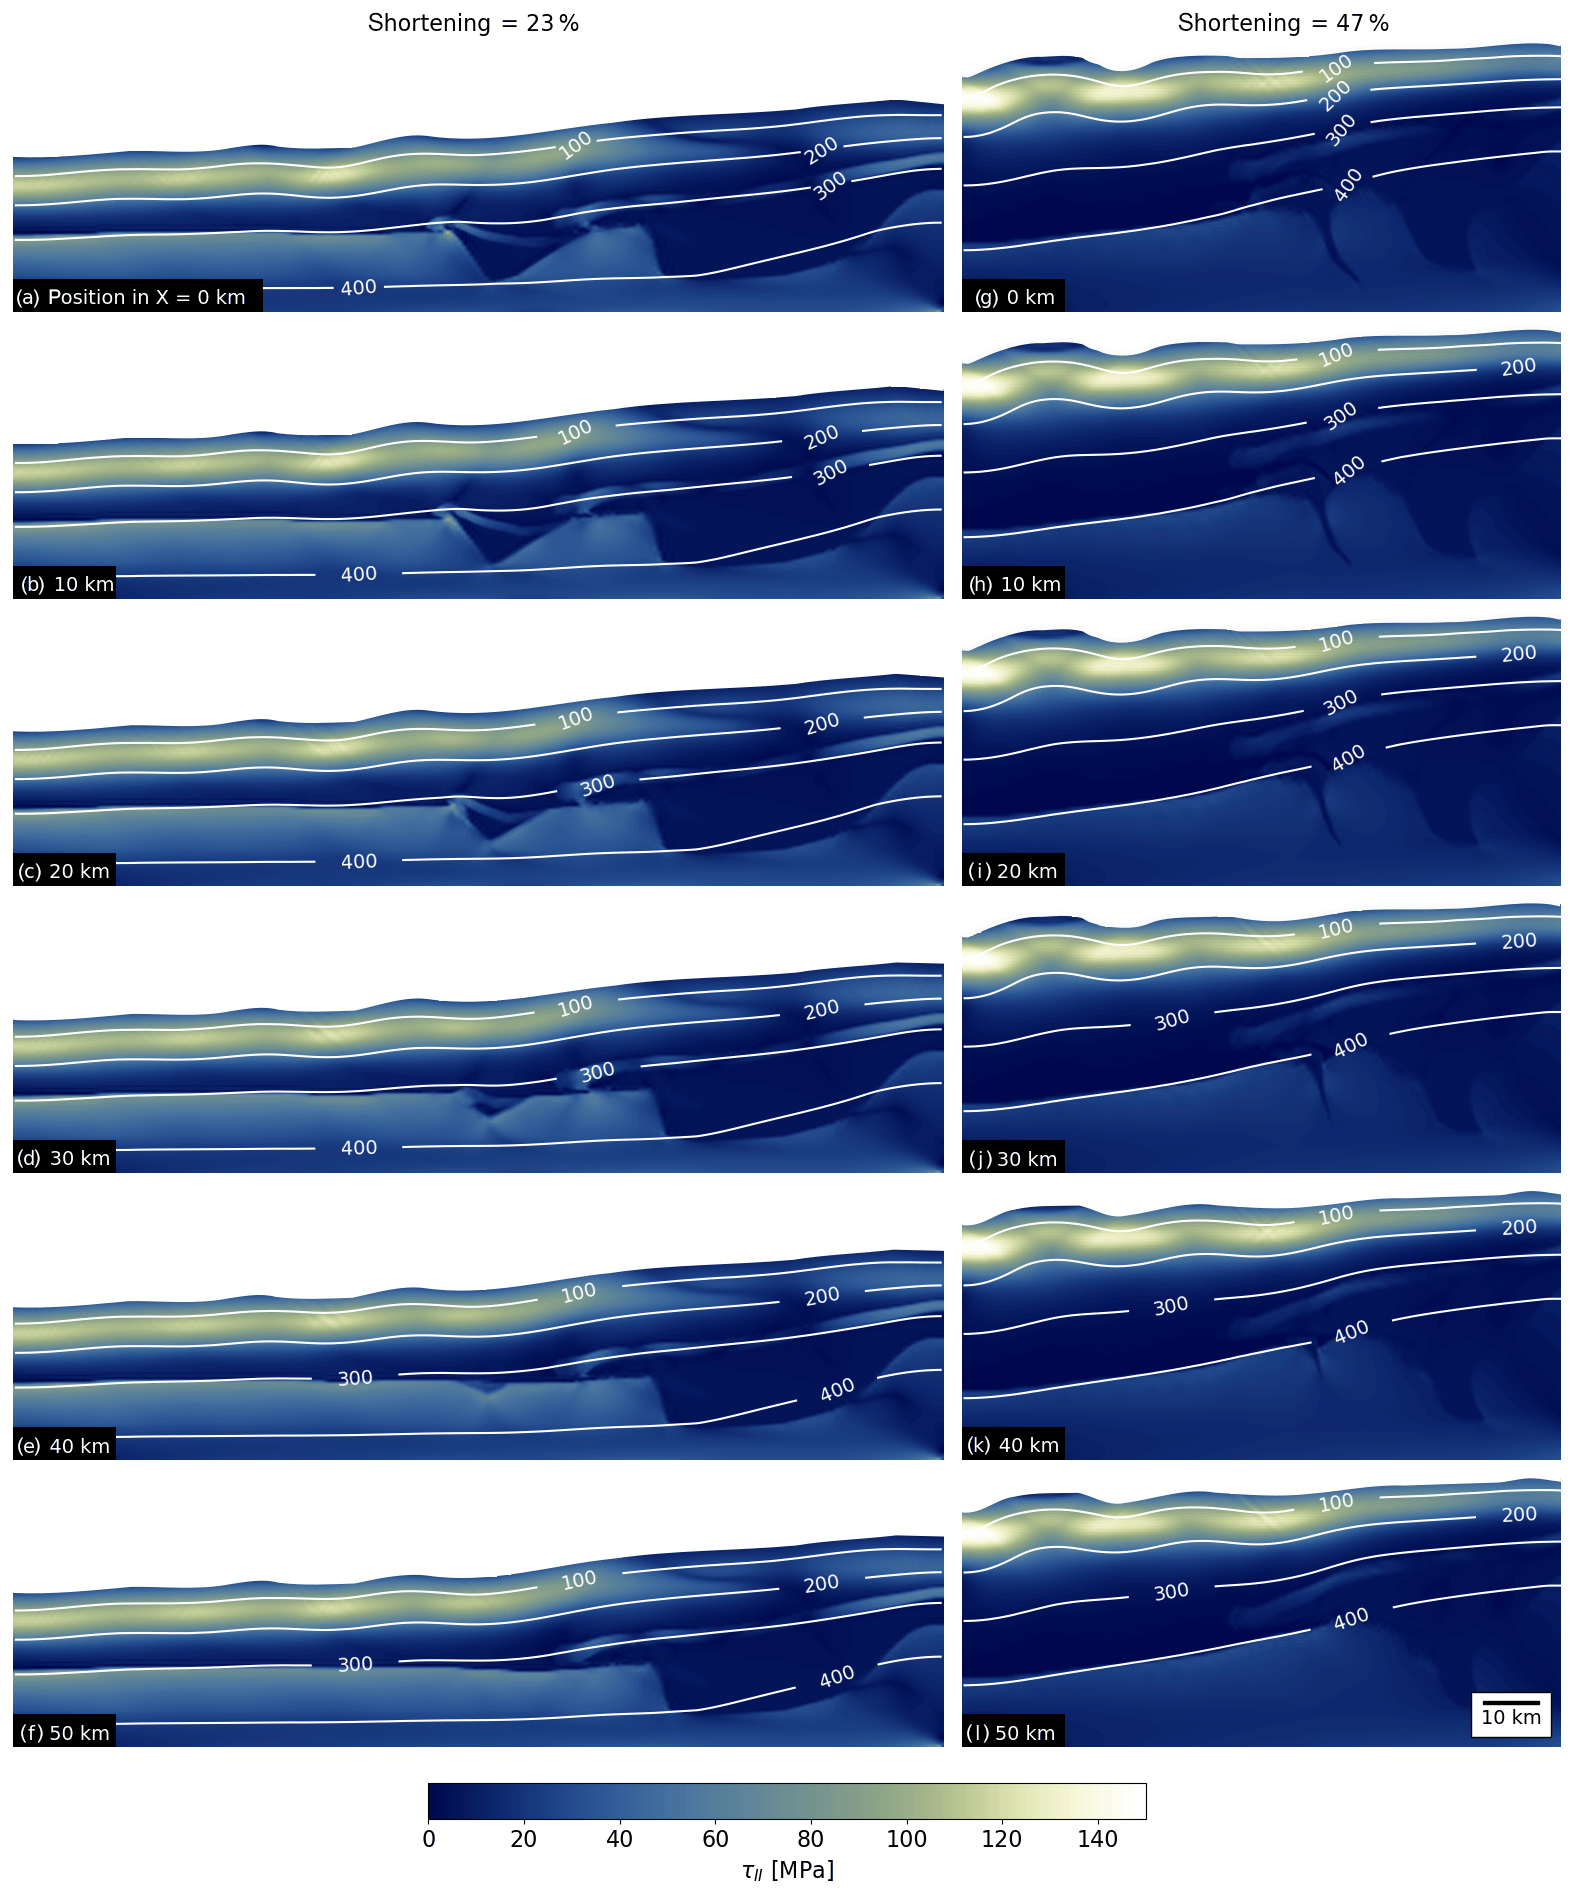
Figure 6Graph showing lateral cross sections for two different states of bulk shortening for the second invariant of the deviatoric stress τII of model A.G-1. Cross sections are taken in 10 km steps from X=0 to X=50 km. Additionally, we display the isothermal lines in degrees Celsius (∘C). Columns correspond to the bulk shortening state and rows to cross-section X position (colour map from Crameri (2019)).
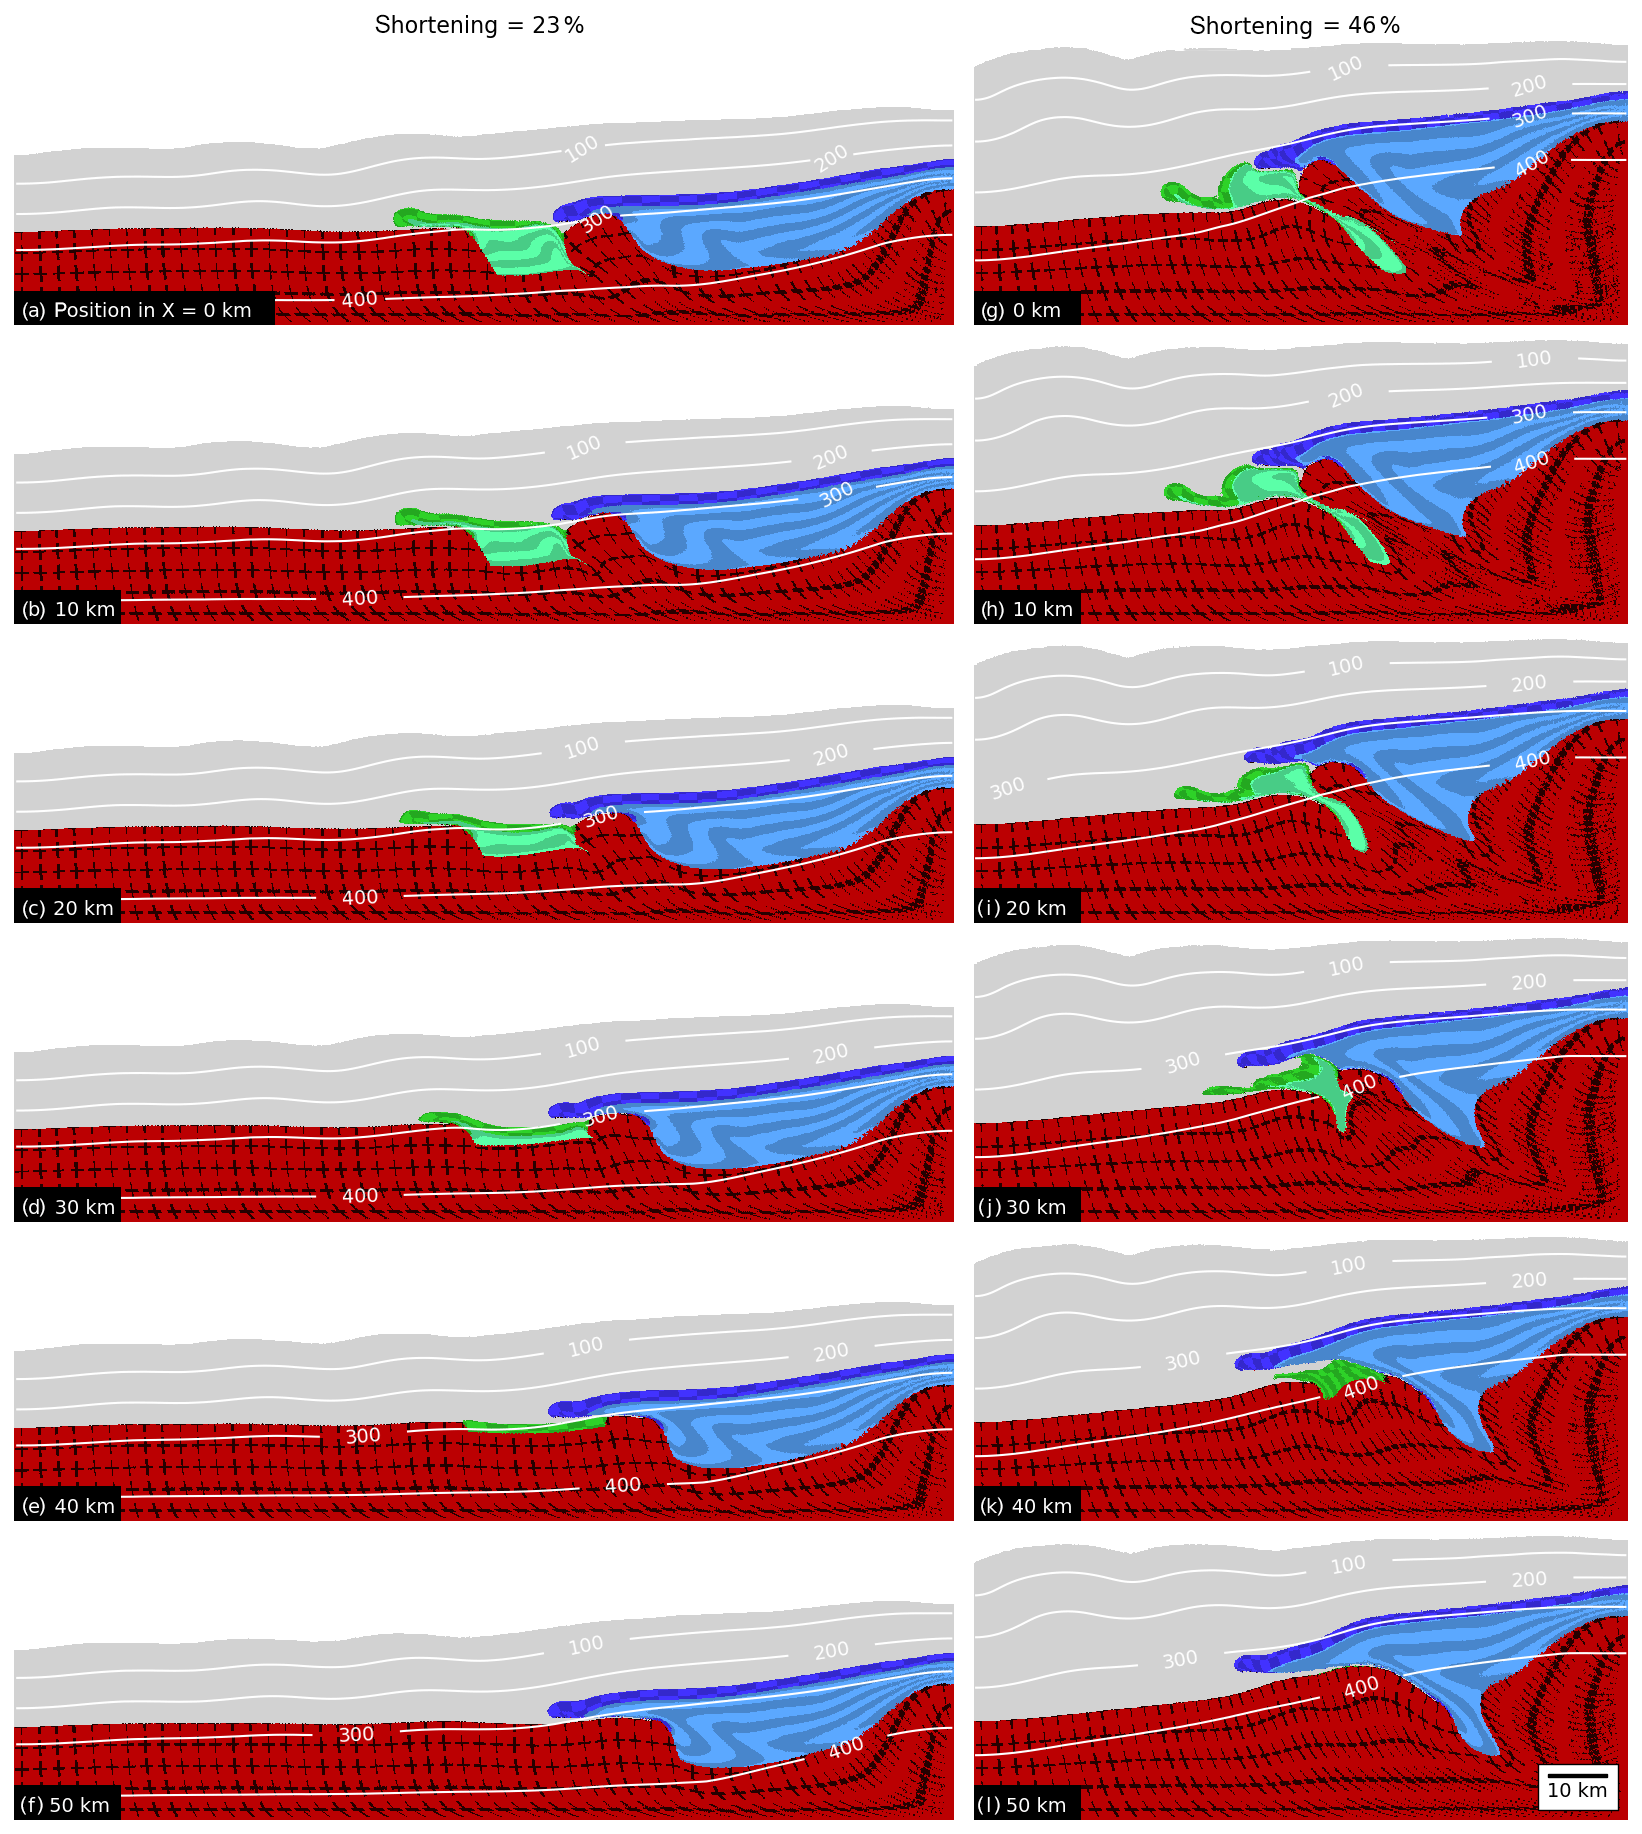
Figure 7Graph showing lateral cross sections for two different states of bulk shortening for the geometrical evolution of model A.G-2. Cross sections are taken in 10 km steps from X=0 to X=50 km. Additionally, we display the isothermal lines in degrees Celsius (∘C). Columns correspond to the bulk shortening state and rows to cross-section X position.
The cross sections for model A.G-2 indicate overall a similar structural evolution as our reference model (Fig. 7) in the sense that the sediments are sheared out of HG and HB, form nappe-like structures and are piled at 46 % bulk shortening. However, the different initial geometry of HG also generates differences in the structural evolution. At 23 % bulk shortening the nappe from HB is less displaced across the horst for a deeper HG. The reason is that, due to the different geometry of HG, the basement horst is also significantly sheared towards the left model side and represents, hence, a less stiff obstacle for a deep HG. Therefore, both the nappe from HB and the horst are sheared together towards the left model side. For a shallower HG, the horst represents a mechanically stiffer obstacle for the nappe from HB, and hence the nappe is overthrust more to the left. At 46 % bulk shortening (Fig. 7g–l), we also observe extrusion of sediments from HG, but for the deepest regions of HG a significant amount of the sediments remains trapped between the basement at depth. Around the region where HG is deepest, the horst is sheared significantly and even sheared slightly on top of the basement that was initially to the left of HG (Fig. 7g–i). The strong layer from HG is essentially disconnected from the horst and a significant part of this strong layer resembles more a thrust nappe. The temperature evolution of model A.G-2 is similar to the one of the reference model. The results indicate that the geometry of HG has a strong impact on the structural evolution of the nappes and the basement, although the first-order structural evolution is similar to the reference model.
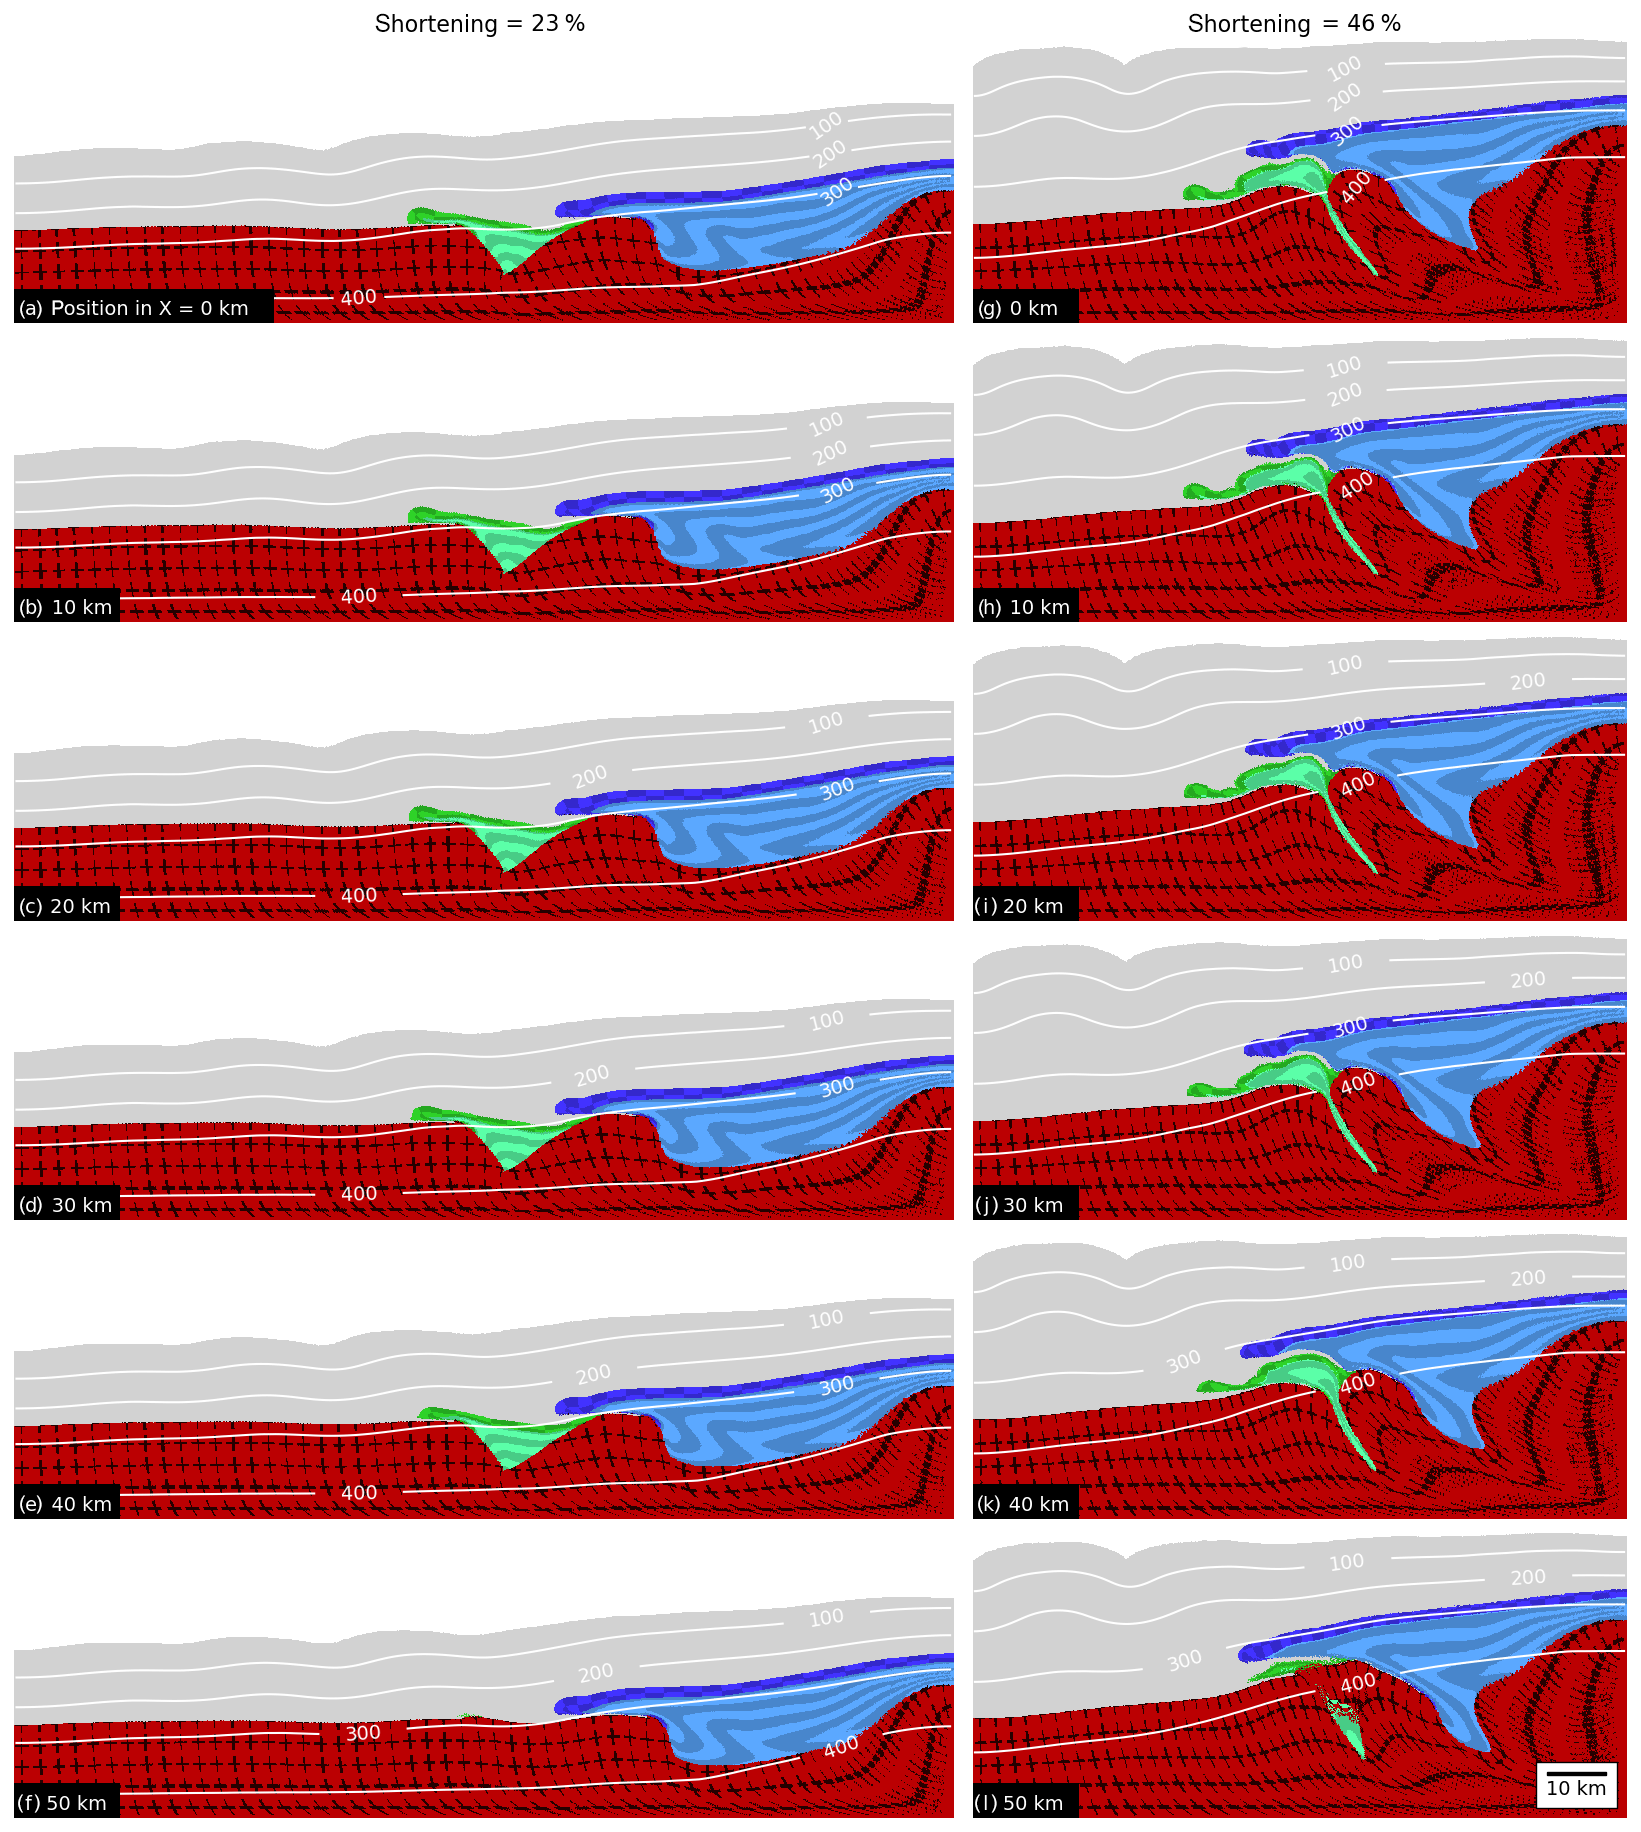
Figure 8Graph showing lateral cross sections for two different states of bulk shortening for the geometrical evolution of model A.G-3. Cross sections are taken in 10 km steps from X=0 to X=50 km. Additionally, we display the isothermal lines in degrees Celsius (∘C). Columns correspond to the bulk shortening state and rows to cross-section X position.
Model A.G-3 (Fig. 8) shows a similar structural evolution as the reference model. The main difference can be observed in the cross section located at the lateral boundary of HG at an X position of 50 km (Fig. 8l). There, sediments of HG have been extruded laterally out of HG, which can be seen by a pocket of sediments inside the basement.
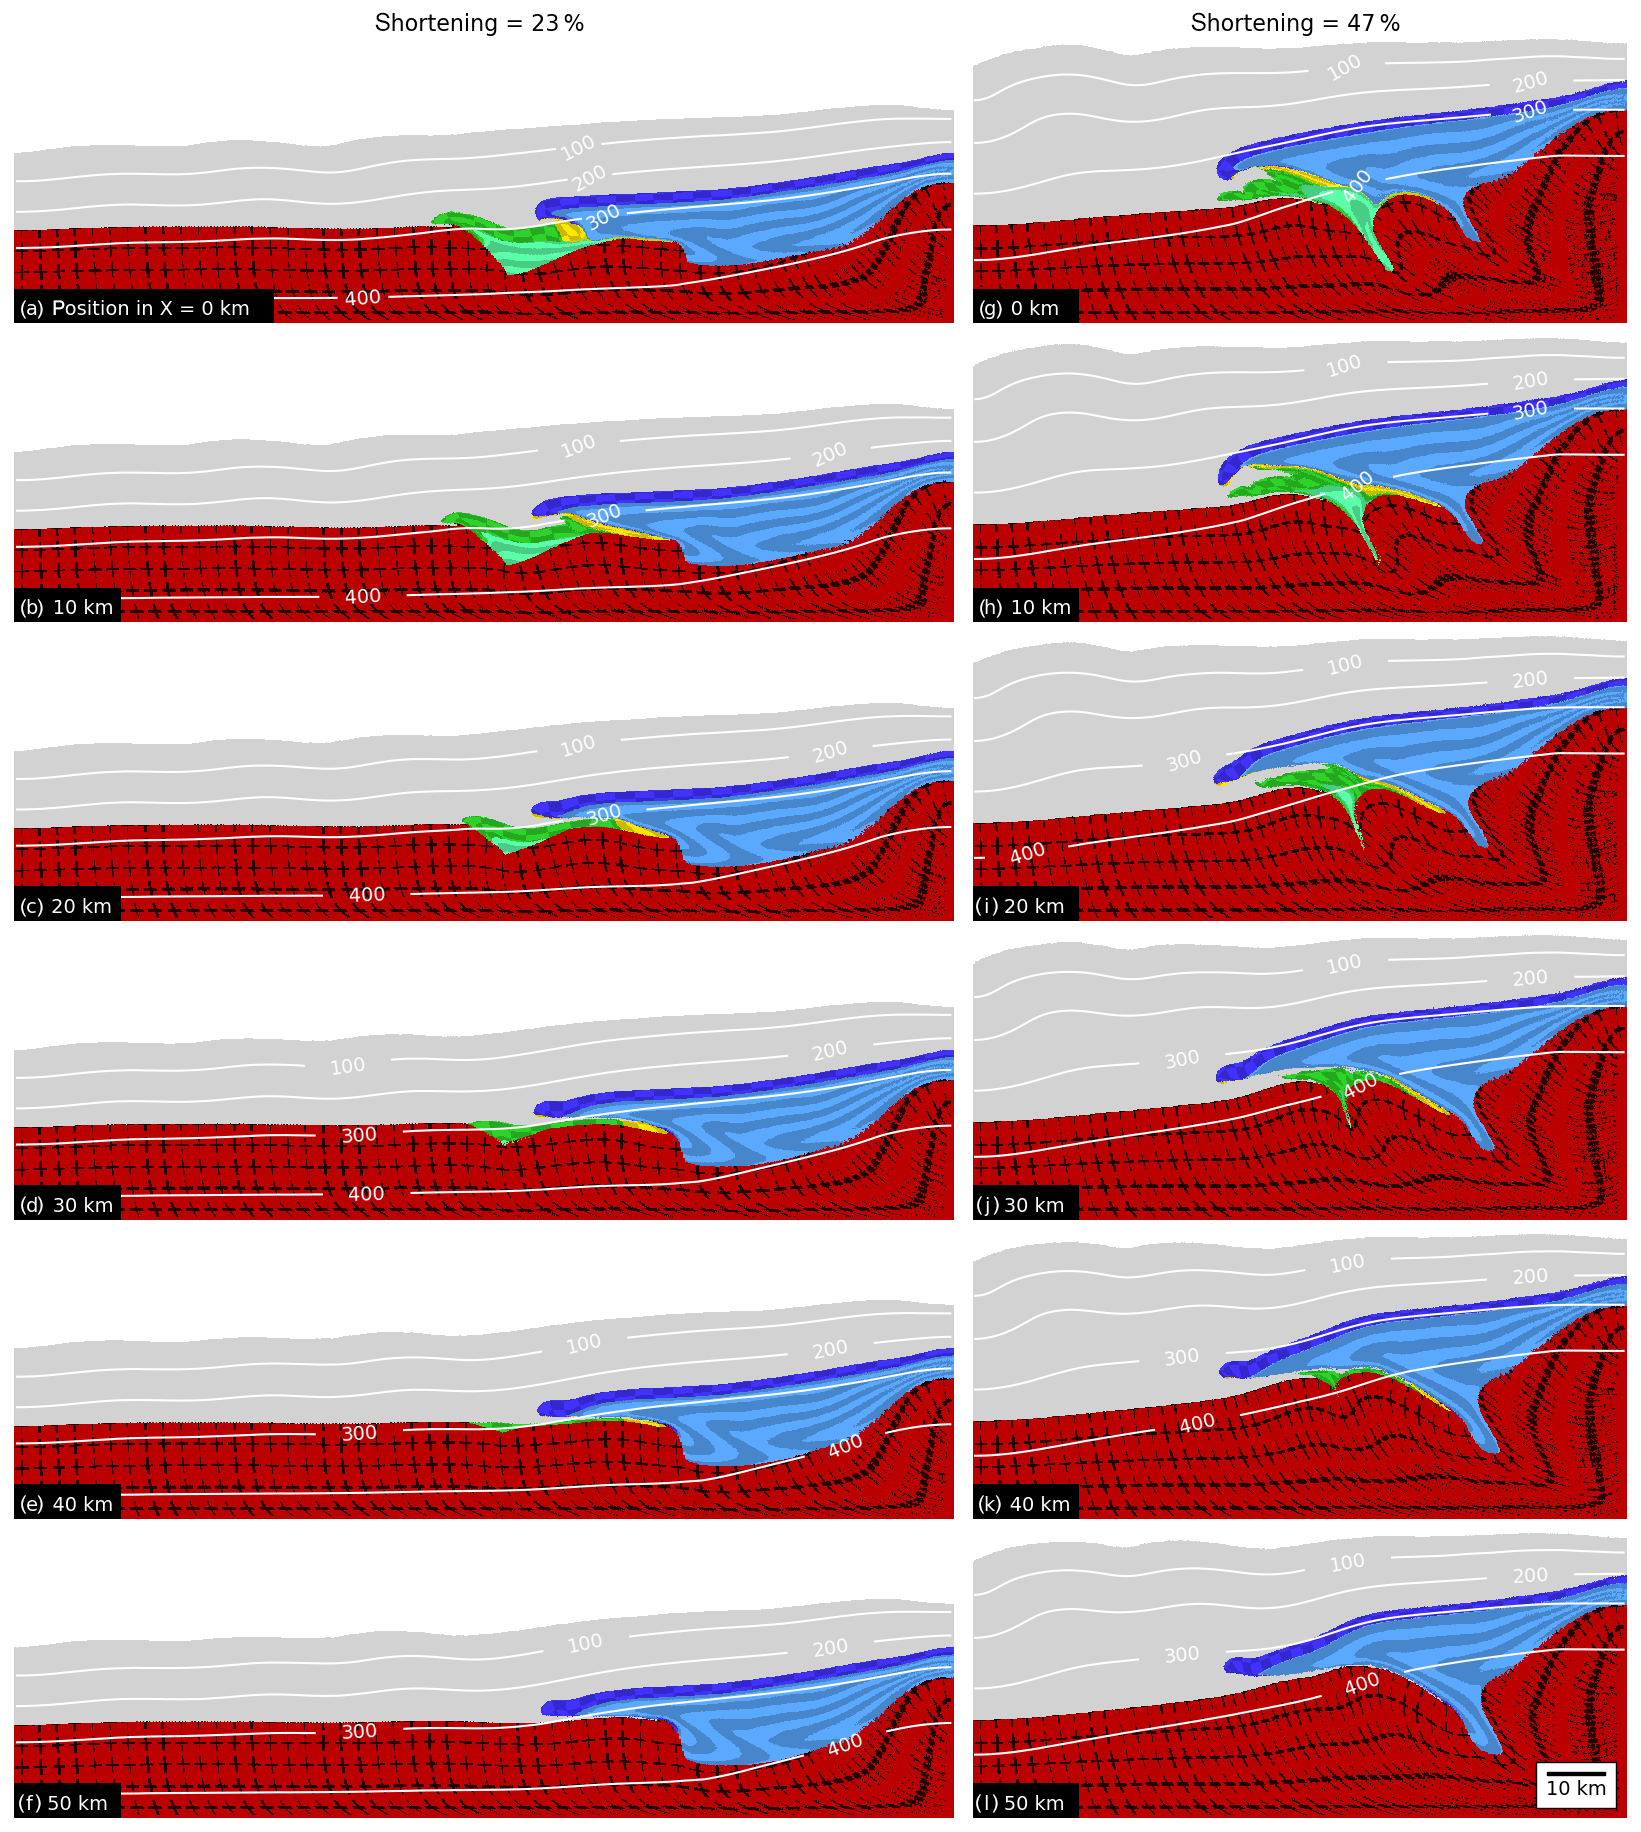
Figure 9Graph showing lateral cross sections for two different states of bulk shortening for the geometrical evolution of model B.G-1. Cross sections are taken in 10 km steps from X=0 to X=50 km. Additionally, we display the isothermal lines in degrees Celsius (∘C). Columns correspond to the bulk shortening state and rows to cross-section X position.
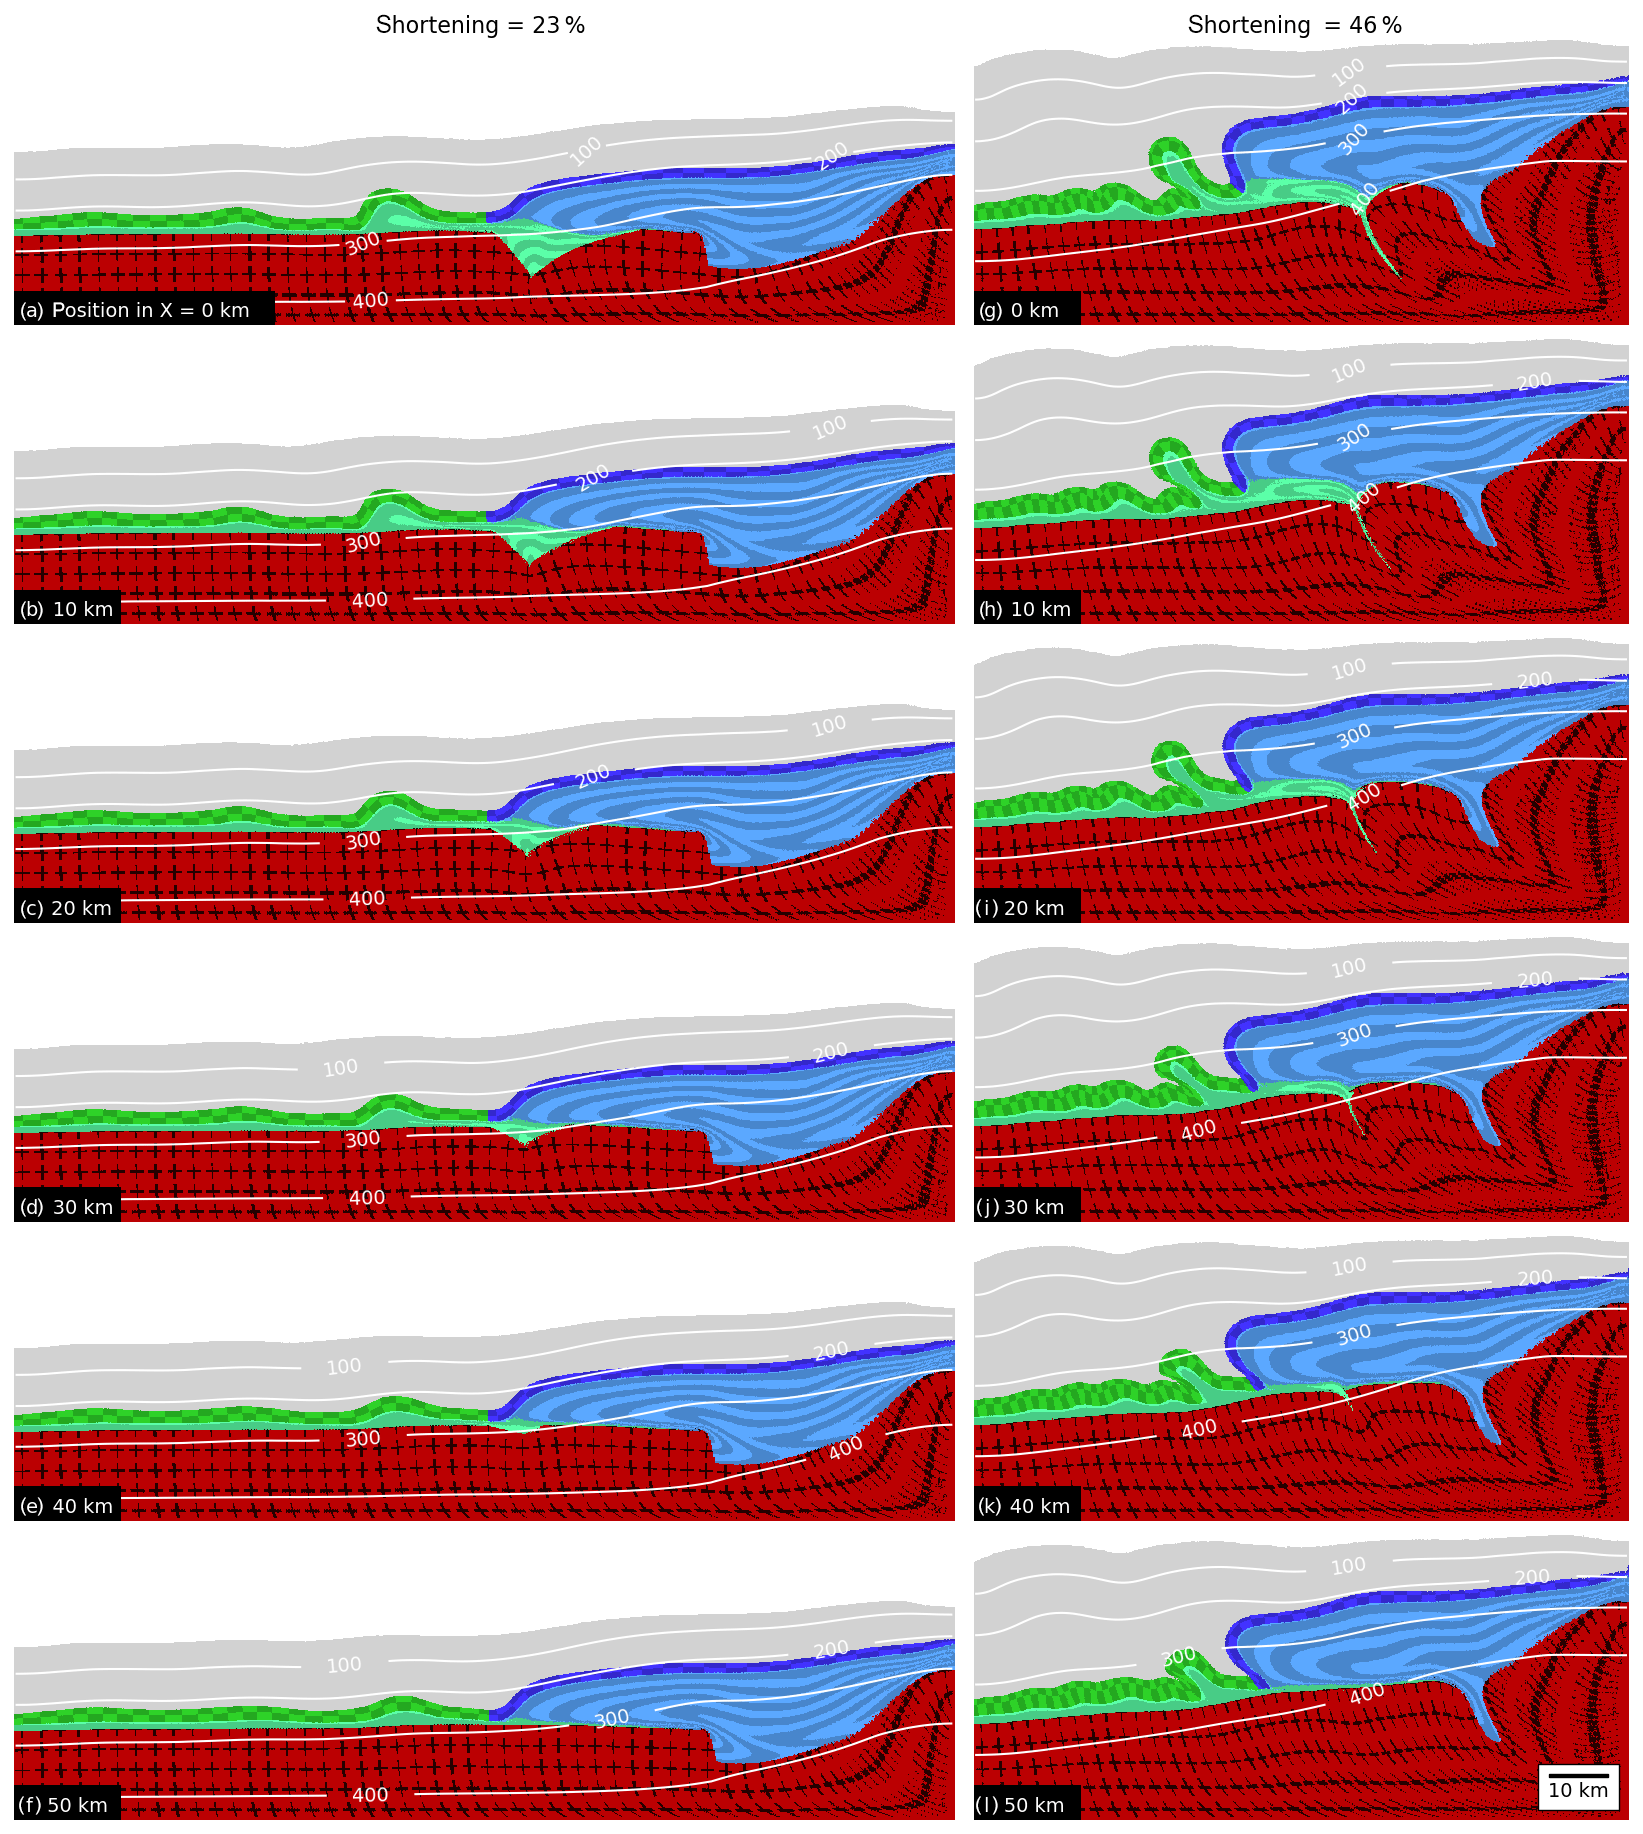
Figure 10Graph showing lateral cross sections for two different states of bulk shortening for the geometrical evolution of model C.G-1. Cross sections are taken in 10 km steps from X=0 to X=50 km. Additionally, we display the isothermal lines in degrees Celsius (∘C). Columns correspond to the bulk shortening state and rows to cross-section X position.
Model B.G-1 (Fig. 9) shows a different nappe evolution than model A.G-1. At 23 % bulk shortening (Fig. 9a–f) in the region where the horst is overlain by weak sediments and a strong layer (yellow), the strong layer is sheared off the horst and pushed across HG by the strong layer from HB (Fig. 9a). In the region where the horst is overlain only by the strong layer (yellow), the strong layer is continuously sheared and dragged by the sediments from HB (Fig. 9b). The degree of shearing decreases with decreasing thickness of the yellow layer (Fig. 9b–d). At 47 % bulk shortening, HG is also almost closed and nearly all sediments have been squeezed out (Fig. 9g–f). At X=0 km (Fig. 9f) the strong layer is completely detached from the basement. The layer initially resting on the horst has been sheared above the sediments from HG and is itself overthrust by the sediments from HB. This structure resembles the vertical stacking of three nappes whose sediments were originally horizontally next to each other. With decreasing thickness of the strong layer from the horst, its shearing across the sediments from HG is also decreasing (Fig. 9i–k). Despite a horizontally continuous strong layer from HG to HB, a major shear zone developed in the strong layer and caused the generation of a nappe-like structure. The shear zone development inside the strong layer is only due to the geometrical variation of the underlying basement, because the strong layer has homogeneous material properties.
Model C.G-1, with a continuous strong layer across the entire model domain (Fig. 10), shows a very different evolution compared to the reference model, because no prominent shear zones form in the strong layer, which could develop a nappe-like structure and significant overthrusting. The strong layer initially above HG develops a detachment fold. At 23 % bulk shortening (Fig. 10a–f), this detachment fold already shows a great variability in amplitude in lateral X direction of the model. During the initial stages of folding, the core of this fold was filled with half-graben sediments and progressively displaced towards the left where the basement top is horizontal (Fig. 10a–e). In the region without half-graben, only a small amount of weak sediments were available to fill the fold core so that considerable amplification was inhibited (e.g. compare Fig; 10f and a), as is the case for detachment, or décollement, folding (e.g. Epard and Groshong, 1993; Schmalholz et al., 2002; Butler et al., 2019. During bulk shortening, the detachment fold is displaced across the basement towards the left. The HG is also closed after 47 % bulk shortening (Fig. 10g–j). Similarly to the other models the weak half-graben sediments have been extruded and some of these sediments have filled the core of the detachment fold. The green marker lines in Fig. 10g indicate that the fold was continuously fed by the half-graben sediments during ongoing deformation. Hence, the amplitude of the largest individual fold decreases towards the model side without a half-graben (Fig. 10g and l). The strong layer initially from HB forms a thick nappe-like structure with a slightly overturned layer at the front. However, no overthrusting above the sediments from HG occurred.
Compared to the reference model, model D.G-1 (Fig. 11) shows only a minor basement uplift at the right boundary at 21% bulk shortening (Fig. 11a–f). Instead, the bulk shortening is distributed more homogeneously throughout the basement, resulting in significant thickening also in the basement on the left model side. Because the top of the basement is weaker, the strong layers can shear off and displace slices of the basement (e.g. Fig. 11a). Further bulk shortening results in the extrusion from sediments from HG, resulting in a structure resembling a fold nappe. This fold nappe is overthrust from the sediments from HB, resembling a thrust nappe (Fig. 11g–l). The last deformation stage is shown for 53 % bulk shortening, because 6 %–7 % more bulk shortening is required to overthrust the sediments from HB compared to the reference model. The strong layer from HG forming the fold nappe exhibits an overturned limb that is still in contact with the basement. Thus, this model does not form any structure similar to a thrust nappe for the sediments from HG. The passive marker symbols show gentle folding of the basement, also on the model side without half-graben (Fig. 11l). In contrast, the reference model (Fig. 5l) exhibits updoming of the basement without well-developed folding.

Figure 11Graph showing lateral cross sections for two different states of bulk shortening for the geometrical evolution of model D.G-1. Cross sections are taken in 10 km steps from X=0 to X=50 km. Additionally, we display the isothermal lines in degrees Celsius (∘C). Columns correspond to the bulk shortening state and rows to cross-section X position.
4.3 Nádai strain and Lode's ratio
We compute the Nádai strain εs (Nádai and Hodge, 1963) and Lode's ratio ν (Lode, 1926) for our simulations, which are two quantities to quantify 3-D finite strain. Both parameters are computed from the natural logarithm of the finite strain principal axes ϵ1, ϵ2 and ϵ3. The Nádai strain εs is the octahedral shear strain and provides a non-dimensional value for the strain magnitude:
The Lode's ratio provides information on the strain symmetry and strain regime, and it can exhibit values in the interval of [−1, 1]. In particular, ν<0 indicates a prolate strain ellipsoid (constrictional strain), ν=0 a prolate–oblate strain ellipsoid (plane strain), and ν>0 an oblate strain ellipsoid (flattening strain):
We display both quantities for model A.G-1 (Fig. 12) for three different cross sections, which provides a representative image of the finite strain distribution also for the other models. The first section is taken at the maximum depth of HG (X=0 km), the second at half of the depth (X=25 km) and the last at the section where the half-graben disappears (X=50 km). In general, εs values are highest on the right side on top of the basement horst, ranging between 3.5 to 4. The extent of this shear zone, for the same intensity, changes laterally with changing depth of HG. For example, the shear zone roots much deeper into the basin on the side without HG (compare Fig. 12a–c). Moreover, εs outlines the fold nappe structure, indicating that the fold nappe is surrounded by highly strained material. Here, maximal values of εs increase laterally with decreasing depth of HG. Another lateral difference is the intensity of the shear zone located on the left side of the model in front of the extruded sediments. This shear zone also gains intensity in lateral direction with decreasing half-graben depth. Similarly to εs, the Lode's ratios ν (Fig. 12d–f) pinpoint the shear zone on top of the horst and outline the fold nappe.

Overall, ν values are close to zero, which indicates a plane strain deformation. The largest deviations from plane strain are located in the cross section of maximum depth of HG (Fig. 12d). Furthermore, values around the fold nappe in the range of 0.5 imply a flattening regime. In contrast, the shear zone at the rear of the basement horst displays negative values that are of the order of −0.2 to −0.5, indicating a constrictional deformation.
5.1 Impact of lateral geometry variations and rheological layering
Our models show the detachment of sedimentary units and their subsequent horizontal transport. Depending on the model configuration, the sedimentary units resemble fold or thrust nappes. The strain localization necessary to detach the sedimentary units and to transport them horizontally without significant internal deformation occurred without any mechanical softening. In our models, the main cause of the strain localization is the initial geometrical configuration and the variations of mechanical strength between the model units. Strain localization and associated shear zone formation due to geometrical and strength variations has been shown with 2-D numerical simulations to occur even for linear viscous material (Bauville and Schmalholz, 2017). For such strain localization, no variation of effective material properties develops, and it is hence sometimes termed kinematic strain localization, which is fundamentally different to so-called dynamic softening mechanisms in which the effective material properties change, for example due to local heating, grain size reduction or fluid infiltration (Bauville and Schmalholz, 2017). Moreover, the formation of fold nappes by pushing ductile material against a rigid obstacle, without dynamic softening, was shown, for example, with laboratory deformation experiments (e.g. Bucher, 1956) and numerical simulations (e.g. Peña and Catalán, 2004). Dynamic softening mechanisms are most likely active in nature, but their intensity and the required deformation conditions are still contentious. Furthermore, dynamic softening mechanisms most likely intensify the strain localization shown in our models, but our models show that, in principle, such dynamic softening mechanism are not essential to generate nappe-like structures.
In cross-sectional view our results are similar to results by Kiss et al. (2020), who performed 2-D high-resolution numerical simulations for a model configuration close to the one of our reference model at the lateral side with the deep HG. The evolution, timing and final structures of the nappe stack are similar in both studies. The similarity of the 2-D and 3-D results, which were obtained by two different numerical algorithms, indicates that the modelled structural evolution of the nappe system is robust. Kiss et al. (2020) focused on the impact of (i) the viscosity ratio between model units, (ii) the yield stress in the basement, (iii) one versus two strong sedimentary layers and (iv) softening mechanisms on the evolution of the fold-and-thrust belt and associated nappes. They showed that all the above-mentioned points have a considerable impact on the structural evolution. In our study, we focus on the impact of the initial 3-D geometry on the 3-D spatial evolution of structures. Our simulations show, for example, the evolution of a curvature of the front of the underlying nappe (Fig. 4) and locally significant deviations from plane strain (Fig. 12), which can also be seen by the lateral indentation of the basement by sediments (Fig. 8l). These distinct 3-D effects are only due to the initial lateral variability of the geometry of HG since the applied lateral bulk deformation is zero. Ultimately, one goal of such 2-D and 3-D models is to reconstruct the tectonic evolution of fold-and-thrust belts and to assess the differences in bulk effective viscosity of major tectonic units, such as basement and sediments.
The emplacement of the sediments from HB in the style of a thrust nappe is observed in all models with exception of model C.G.-1. The thrust nappe exhibits a laterally uniform front despite the deformation and nappe formation in HG below (Fig. 4). Even in the case of model A.G-2, where the basement horst is strongly incorporated in the deformation, we do not observe large horizontal displacement gradients in the thrust nappe. Hence, deformation of such relatively small graben systems might play only a minor role on the displacement variations along strike of fold-and-thrust belts. In our models, the uniform thrust front is the result of the initially straight boundary between basement horst and HB. Consequently, we infer that the initial large-scale basin architecture plays a major role in the geometry of orogenic salients. Several studies (e.g. Thomas, 1977; Marshak et al., 1992; Boyer and Elliott, 1982) of different orogens also indicate that the sediment basin thickness is of particular importance in the expression of salients. In the context of thickness variation, Macedo and Marshak (1999) investigated the effect of variable basin geometries during bulk shortening using 3-D sandbox models. Their study implies that basin-controlled salients are strongly controlled by the basin topography, that is, variations of sedimentary thickness inside the basin. This observation is in accordance with our study, which shows that lateral changes in the lithology, such as thickness and rheology, produce different salients (Fig. 4). There are, however, additional conditions such as the indenter shape or the direction and orientation of convergence of the colliding plates that influence the overall shape of orogens (e.g. Laubscher, 1972; Ries, 1976; Mitra, 1997). Naturally, the investigation of such large-scale boundary effects would require a different model configuration than in our study.
Volume variations related to the lateral changes in the depth of HG are always expressed in the lateral variations of the thickness of the extruded nappe. The thinning out of the initial graben structure is reflected in a decrease of height and a decrease of length of the nappe. These lateral variations also affect the lateral amplitude variation of the major detachment fold of simulation C.G-1. The local geometry around the major detachment fold resembles a thin-skinned tectonic style where most deformation is concentrated in the cover sediment. However, much of the sediments filling the core of the detachment fold originate from HG, which is more than 10 km away from the detachment fold (Fig. 11g–l). Closure of HG resulted in movement of sediments from HG into the core of the detachment fold. This result shows that detachment fold initiation and progressive evolution can be controlled by the inherited basement structure. Additionally, this finding suggests that predominately thin-skinned tectonics can passively be influenced by underlying heterogeneities due to variations in the basement architecture. Nevertheless, the expression of such detachment folds in our models also depends largely on the thickness ratio between incompetent and competent units. Our findings are, therefore, in broad agreement with previous field observations and numerical studies (e.g. Pfiffner, 1993; Jaquet et al., 2014).
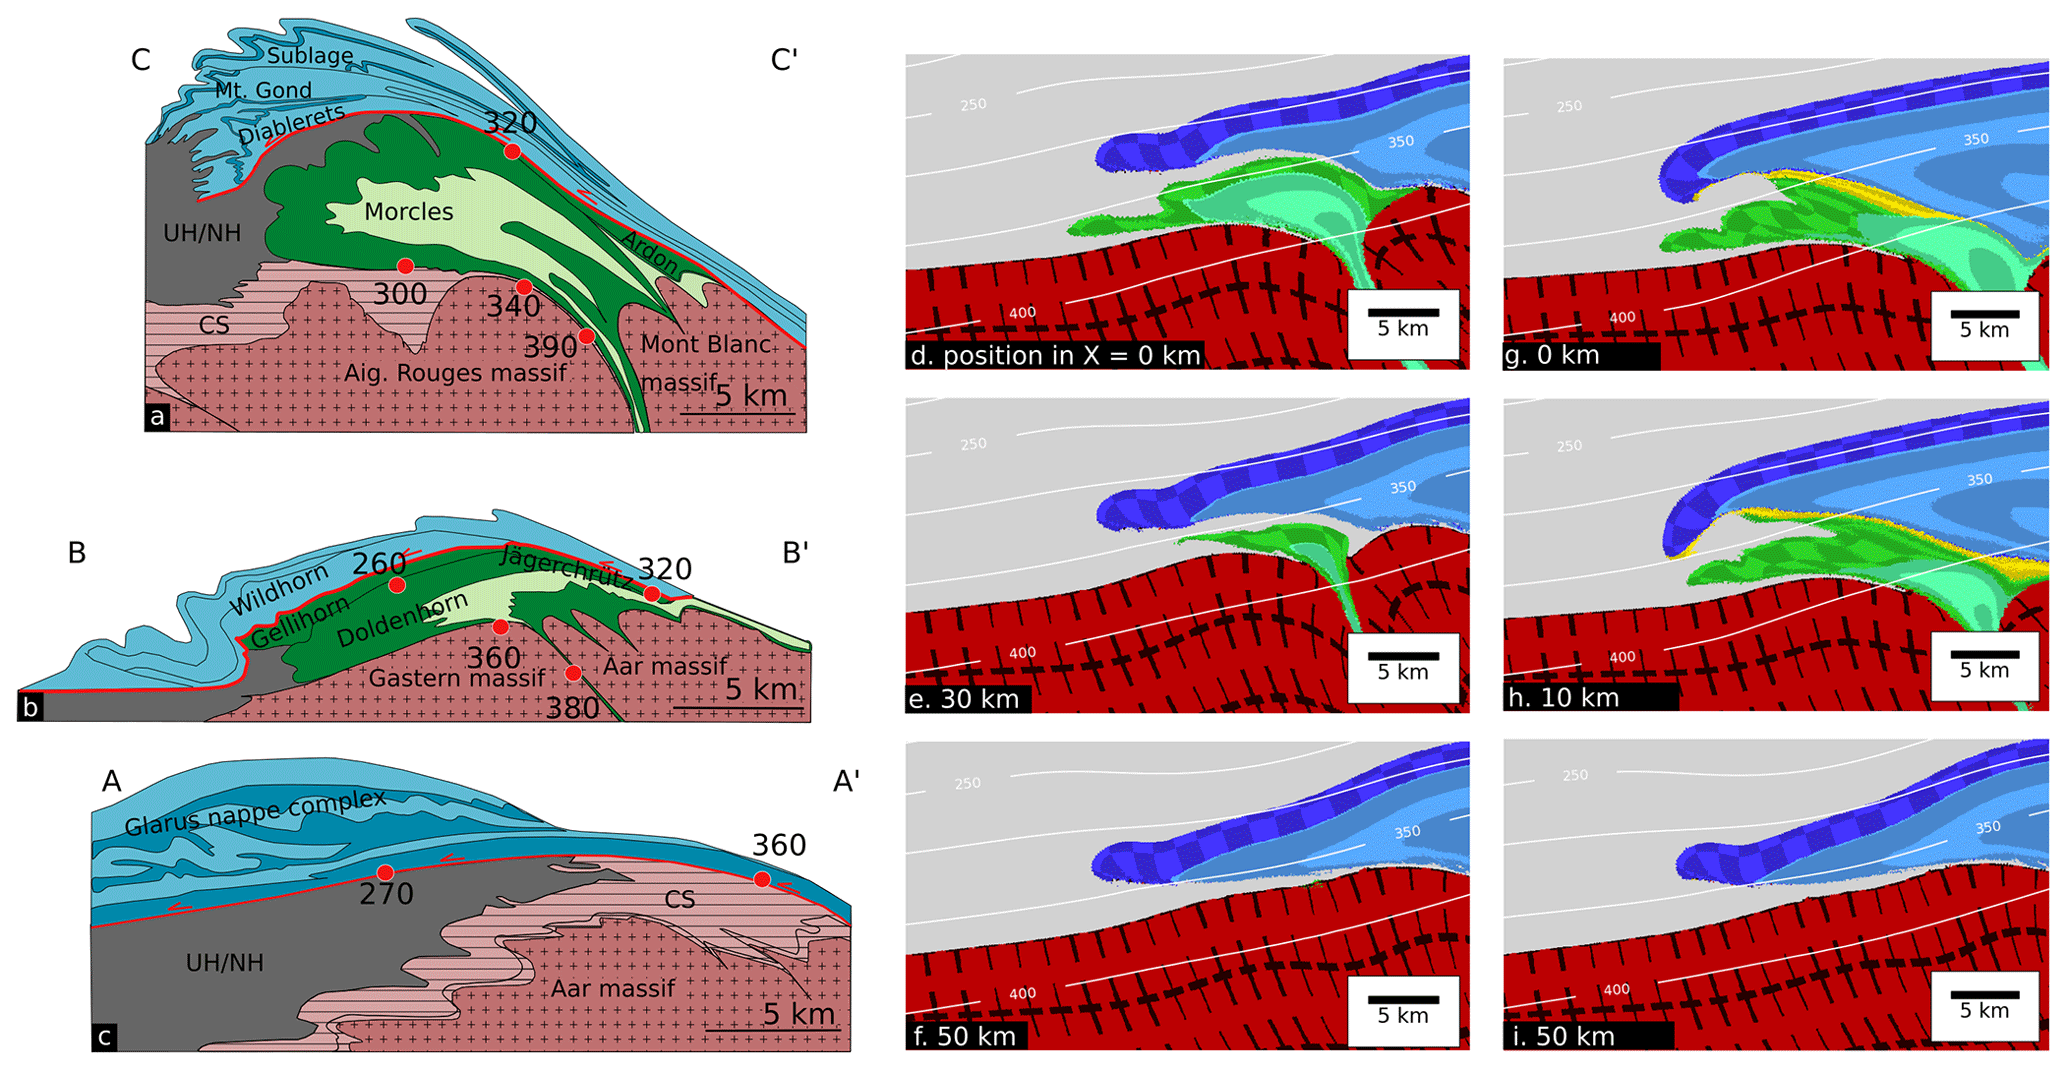
Figure 13Comparison between the geological cross sections of the Morcles nappe, Doldenhorn nappe and Glarus nappe complex with sections taken from our numerical simulations. Columnwise (left to right): (a–c) geological-cross sections, (d–f) sections from model A.G-1, and (g–i) sections from model D.G-1. Black numbers in sections of (a–c) are estimated peak temperatures in degrees Celsius taken from Ebert et al. (2008). UH/NH represents Ultrahelvetics/North Helvetics. CS represents cover sediments.
5.2 Comparison with the Helvetic nappe system
Models A.G-1 and B.G-1 are able to reproduce several first-order structural features of the Helvetic nappe system. In addition, we are also able to connect the two different main kinematic deformation phases of the western Helvetics and the eastern Helvetic nappes. The formation of the main basal thrust originates in weak sedimentary units, comparable to the Cretaceous Palfris shales, of our Helvetic basin equivalent. Similarly to the Prabé deformation phase in the west and the contemporaneous Calanda phase in the east (e.g. Pfiffner, 2015), this basal thrust aids in the transport of a laterally uniform thrust nappe in our simulations. Given the simplifications of our model, we attribute the resulting major thrust front to the formation of a basal thrust of the Wildhorn super-nappe in the west and the Glarus thrust in the east. Continuous bulk shortening leads to shear localization at the contact between the strong layer and the horst in the basin. Subsequently, the layer is detached and translated with the help of the weak sediments across the basement horst and onto the half-graben, resembling a thrust sheet or nappe. We record a first noticeable deformation of the half-graben approximately 2 Ma in our simulations. This timing is in agreement with a study by Jaquet et al. (2018), which proposes a similar time interval between the onset of the Helvetic nappes and the onset of the basal thrusting at the Morcles half-graben. Vertical extrusion and squeezing out of the half-graben sediments takes place simultaneously with stacking of the major thrust nappe on top at about 6 to 7 Ma. The resulting model nappe stack shows laterally major structural differences. The overall along-strike variation is comparable to the lateral structural variations in the Helvetic nappe system, where the prominent fold nappes are only located in the southwest (Pfiffner, 1993). At the end of our simulations we record approximately 10 Ma for the complete process of nappe stack formation. This timing is in broad agreement with studies of the Morcles nappe complex (e.g. Kirschner et al., 1996; Boutoux et al., 2016) that suggest an emplacement duration of 10 to 15 Ma.
Figure 13 shows a comparison between geological cross sections taken along strike of the Helvetic nappe systems with selected enlarged numerical cross sections in lateral direction of our model. The first cross-section (a) of model A.G-1 (Fig. 13d–f) shows our equivalent of the Morcles nappe at the maximum depth of the half-graben. The result here is similar to 2-D numerical studies by Bauville and Schmalholz (2015), who investigated fold nappe formation and nappe stack formation also in application to the Helvetic nappe system, respectively. To a first-order approximation, we reproduce an extruded fold nappe with a shape comparable to the Morcles nappe.
The strong layer is still connected to the adjacent basement horst and the deformed internal weak units, which is highlighted by the green passive marker lines resembles a recumbent fold. The inner part of the fold nappe roots into a steep cusp, which is analogous to the Chamonix zone between the Aiguilles Rouges and Mont Blanc massif (Fig. 13a). The Chamonix zone is characterized by subvertical to overturned sediments representing the cover of the Mont Blanc massif and locally by subvertical sediments representing the cover of the Aiguilles Rouges massif (Paréjas, 1922; Oulianoff, 1924; Ayrton, 1980; Ayrton et al., 1987; Epard, 1986; Pfiffner et al., 2011). The overturned cover sediments of the Mont Blanc massif suggest that the Mont Blanc massif did not behave as an effectively rigid basement block but was internally deformed (e.g. Epard, 1986). The subvertical cover sediments of both massifs, having opposite younging directions, support our numerical model, which shows an overall ductile closure of the half-graben. Consequently, we argue that the half-graben was not closed by dominantly brittle inversion tectonics during which the Mont Blanc massif was thrust as an effectively rigid block above an effectively rigid Aiguilles Rouges massif (e.g. Granado and Ruh, 2019).
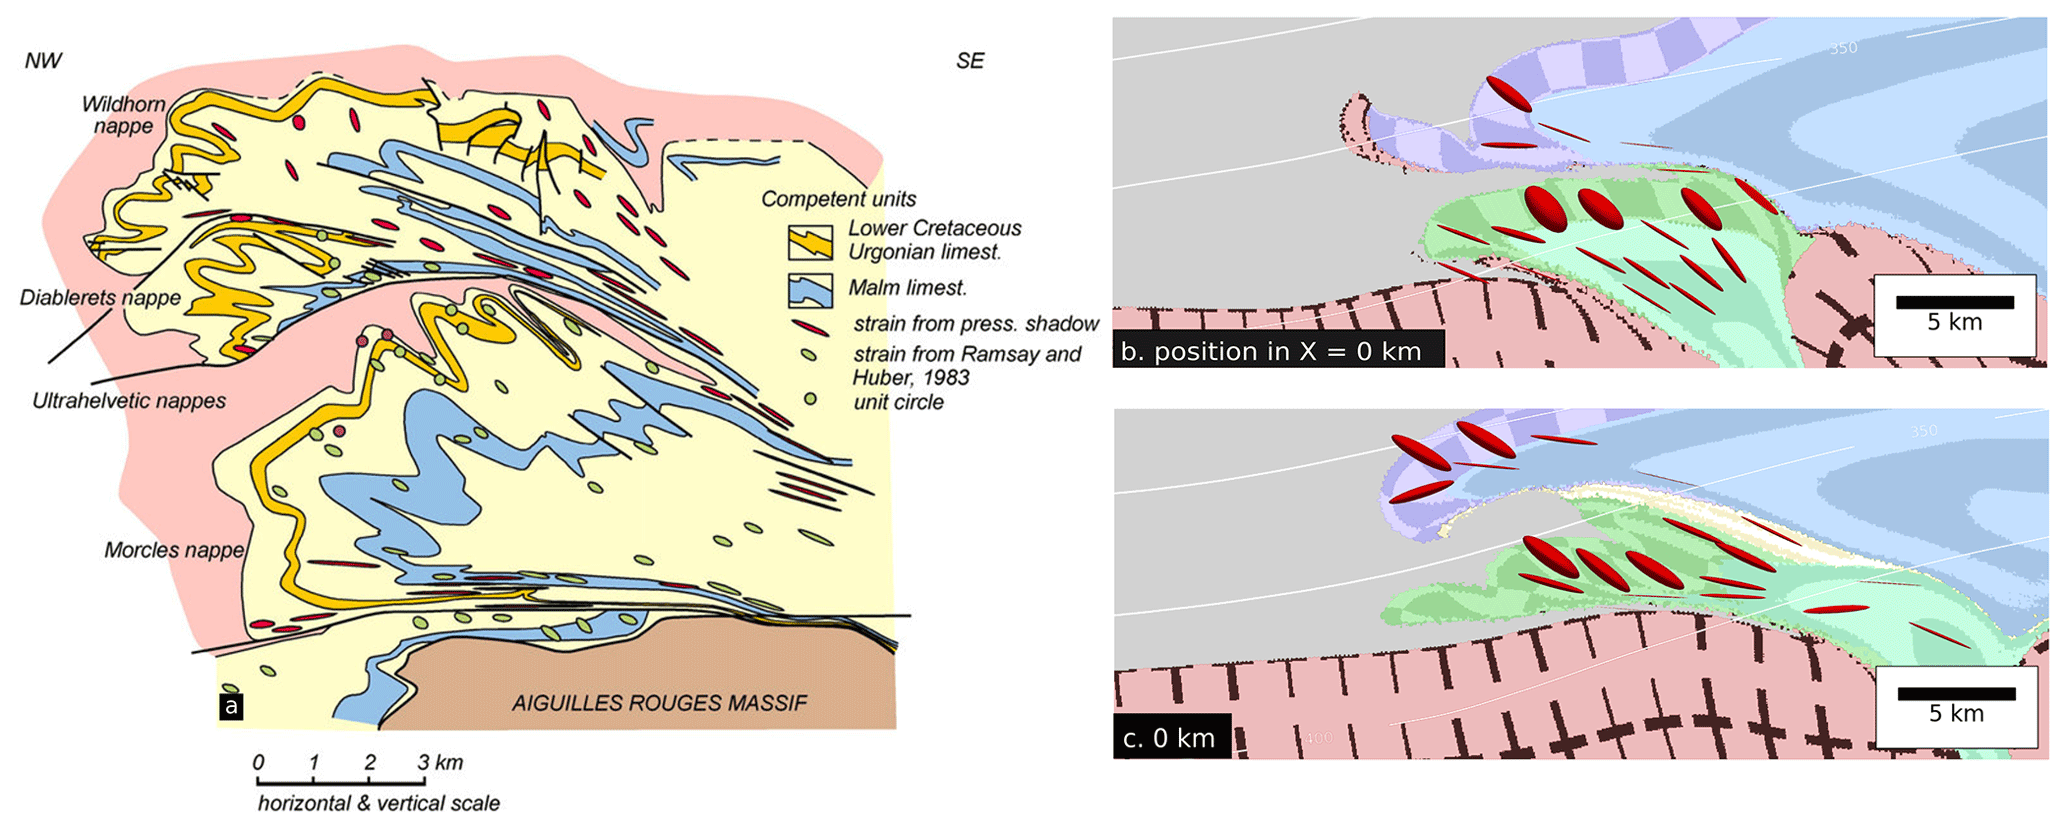
Figure 14Comparison between finite strain from the Morcles nappe (taken from Bastida et al., 2014 showing a recoloured version of the synthetic cross section with strain ellipses from pressure shadows after Casey and Dietrich, 1997, including green strain ellipses from Ramsay and Huber, 1987, the cross section is modified from Dietrich and Casey, 1989) and selected finite strain ellipses from model A.G-1 and model D.G-1.
Moreover, we find a significant amount of material from the overburden between the thrust nappe and the fold nappe but also below the fold nappe. The material between the two nappes resembles the Ultrahelvetics in the geological cross sections, whereas the material below the fold nappe corresponds to undeformed cover-sequences of the basement. Turning now to the Morcles equivalent of model B.G-1 (Fig. 13g), we find a significantly different structure of the extruded fold nappe. There are several major differences that are connected to the initial mechanical layering inside the half-graben. First, the fold nappe shows a far greater length-to-height aspect ratio than the natural analogue. Secondly, the strong normal limb is not in contact with the basement horst. Due to the continuous strong layer, the structure shows greater shearing at the contact between the fold and thrust nappe.
Proceeding with cross-section (e) of our numerical model A.G-1 (Fig. 13e), we find similarities with the geological cross section of the Doldenhorn nappe (Fig. 13b). The extruded nappe shows similar aspect ratio and shape like the Doldenhorn nappe with the length significantly exceeding the thickness. However, cross-section (h) of model B.G-1 (Fig. 13h) provides an even better match with the structure of the Doldenhorn nappe. The resulting fold nappe shows a comparable shape and size. Due to the initial rheological layering, this model forms a thin thrust sheet on top of the fold nappe. We interpret this thrust sheet as an analogue to the Gellihorn and Jägerchrütz nappes, which are essentially thin thrust sheets on top of the Doldenhorn nappe (Pfiffner, 2011).
Finally the numerical cross sections without half-graben (Fig. 13f and i) exhibit a similar displacement and shape for both of our models. The finding suggests that underlying nappe formation in HG and minor variations in the vertical rheological layering has a negligible effect on the horizontal displacement parallel to the shortening direction along strike of the major thrust sheet. To a first-order approximation, this structure is comparable to the Glarus nappe complex displayed in Fig. 13c.
Additionally, we also find a first-order agreement when comparing the finite strain pattern between field measurements from the Morcles nappe and our numerically calculated finite strain (Fig. 14). Generally, the aspect ratio of the strain ellipses increases towards the bottom and root zone of the nappe, indicating significant shearing. Furthermore, we observe less deformed ellipses in the top, normal limb of our Morcles equivalent with ellipses of higher aspect ratios (Fig. 14b and d) near the contact between the fold nappe and the thrust nappe. Figure 14b shows a better match for the finite strain pattern in the upper limb, whereas Fig. 14c displays a better fit for the contact zone. We also observe a subhorizontal orientation of the major finite strain axis towards the root zone of the nappe (Fig. 14c). Numerical finite strain computation is a useful tool to compare numerical models with natural observations. The comparison can efficiently be used to recognize where the numerical model requires adaptation to the real data.
However, we could not reproduce certain first-order features of the Helvetic nappe system with our models. The first shortcoming is the protrusion and shearing out of the strong layer of the half-graben. In 3-D view this process is expressed as a thin carpet in front of the fold nappe (e.g. Fig. 4c and f), resembling a nose-like feature in the 2-D cross sections. Shearing out of the layer inhibits the formation of an outer recumbent limb as observed in the Morcles nappe (Ramsay et al., 1983). Here, our results are in contrast with previous 2-D thermo-mechanical numerical modelling results by Bauville and Schmalholz (2015), who successfully simulated the formation of a recumbent fold limb during half-graben inversion. One of the main reasons for this deviation lies in the viscosity ratio (ηR) between overlying strong layer (ηL) and the half-graben infill (ηI). In the simulations of Bauville and Schmalholz (2015), both the layer and the infill have the same viscosity (ηR=1), whereas our simulations, using different creep flow laws for each units, show that the infill viscosity ηI can be up to 3 orders of magnitude smaller than the strong layer viscosity ηL (ηR=1000). Secondly, temperature estimates from several authors (e.g. Kirschner et al., 1999; Herwegh and Pfiffner, 2005; Ebert et al., 2007b) indicate lower peak temperature conditions along the different basal nappe contacts in comparison with our simulations. For example, Ebert et al. (2008) reported increasing temperatures of 270 to 390 ∘C from the frontal part of the Morcles nappe to its root. Here we find a close match with root zone temperatures, whereas our front part of the fold nappe exhibits temperatures in the range of 370 ∘C (e.g. Fig. 13d). Similar temperature comparisons between our Doldenhorn and Glarus nappe equivalents show the same trend (see Fig. 13). Moreover, the cross sections of model B.G-1 exhibit slightly higher temperatures inside the core of the fold nappe, as a consequence of the significantly thicker thrust nappe above. In summary our models show a good match for the root zone temperatures, but higher temperatures at the front of the nappe complexes compared to natural observations. Ebert et al. (2008) suggested a horizontal temperature gradient of approximately 6 ∘C km−1 along the nappe interface for all three cross sections. We only register a horizontal gradient of 2 ∘C km−1 along the basal thrust surfaces. Additional constraints are given by Leloup et al. (2005) and Boutoux et al. (2016), who indicate peak metamorphic temperatures of 320 ∘C for the Aiguilles Rouges massif and 400 ∘C for the Mont Blanc massif. Despite these discrepancies, our model conforms to the temperature trends of natural observations, showing increasing temperatures from the front to the root zones of the nappes. Further improvements could be made by adjusting the initial geothermal gradient or by modifying the initial geometrical configuration. For the latter case, primarily, Nibourel et al. (2018) demonstrated that the Aar massif experienced a 10–15∘ southwards dip in relation to the isotherms. Essentially, such a configuration would, for example, place the half-graben system further up in the isotherms. This adjustment would lead to cooler temperatures in the front of the nappe and greater horizontal temperature gradients during and after nappe emplacement.
In terms of large-scale structural components our simulations lack the formation of parasitic folds, smaller imbricate thrusts or the detachment between different levels inside the major thrust complex. Modelling of such smaller-scale features would require (i) a higher numerical resolution in combination with (ii) a drastically more complex rheologically layering. In addition, field observations indicate the existence of several large-scale shear zones in the Mont Blanc and Aar massif. Our models do not reproduce such features, mainly because of our mechanically homogeneous basement unit which represents a large simplification compared to the natural complexities. There are, for example, several studies regarding the Aar massif that correlate the formation of ductile and brittle shear zones to inherited pre-Alpine heterogeneities (e.g. Berger et al., 2017; Mair et al., 2018). In particular, structures such as foliations, mafic dykes or folds present mechanical anisotropies that can culminate in localized strain and shear zones (e.g. Bell, 1978; Carreras et al., 2010; Herwegh et al., 2017; Wehrens et al., 2017).
Finally, our model does not fully resolve the large-scale kinematics and intricate deformational history of the Helvetic nappe system. For example, reconstructions between the SW and the NE of the Helvetics show a differential horizontal displacement of the thrust nappes of up to 50 km (e.g. Pfiffner, 2015). Here, variations are likely due to the initial basement geometry and convergence of subducting plate, e.g. obliquity of the plate boundary which has not been taken into account in our model.
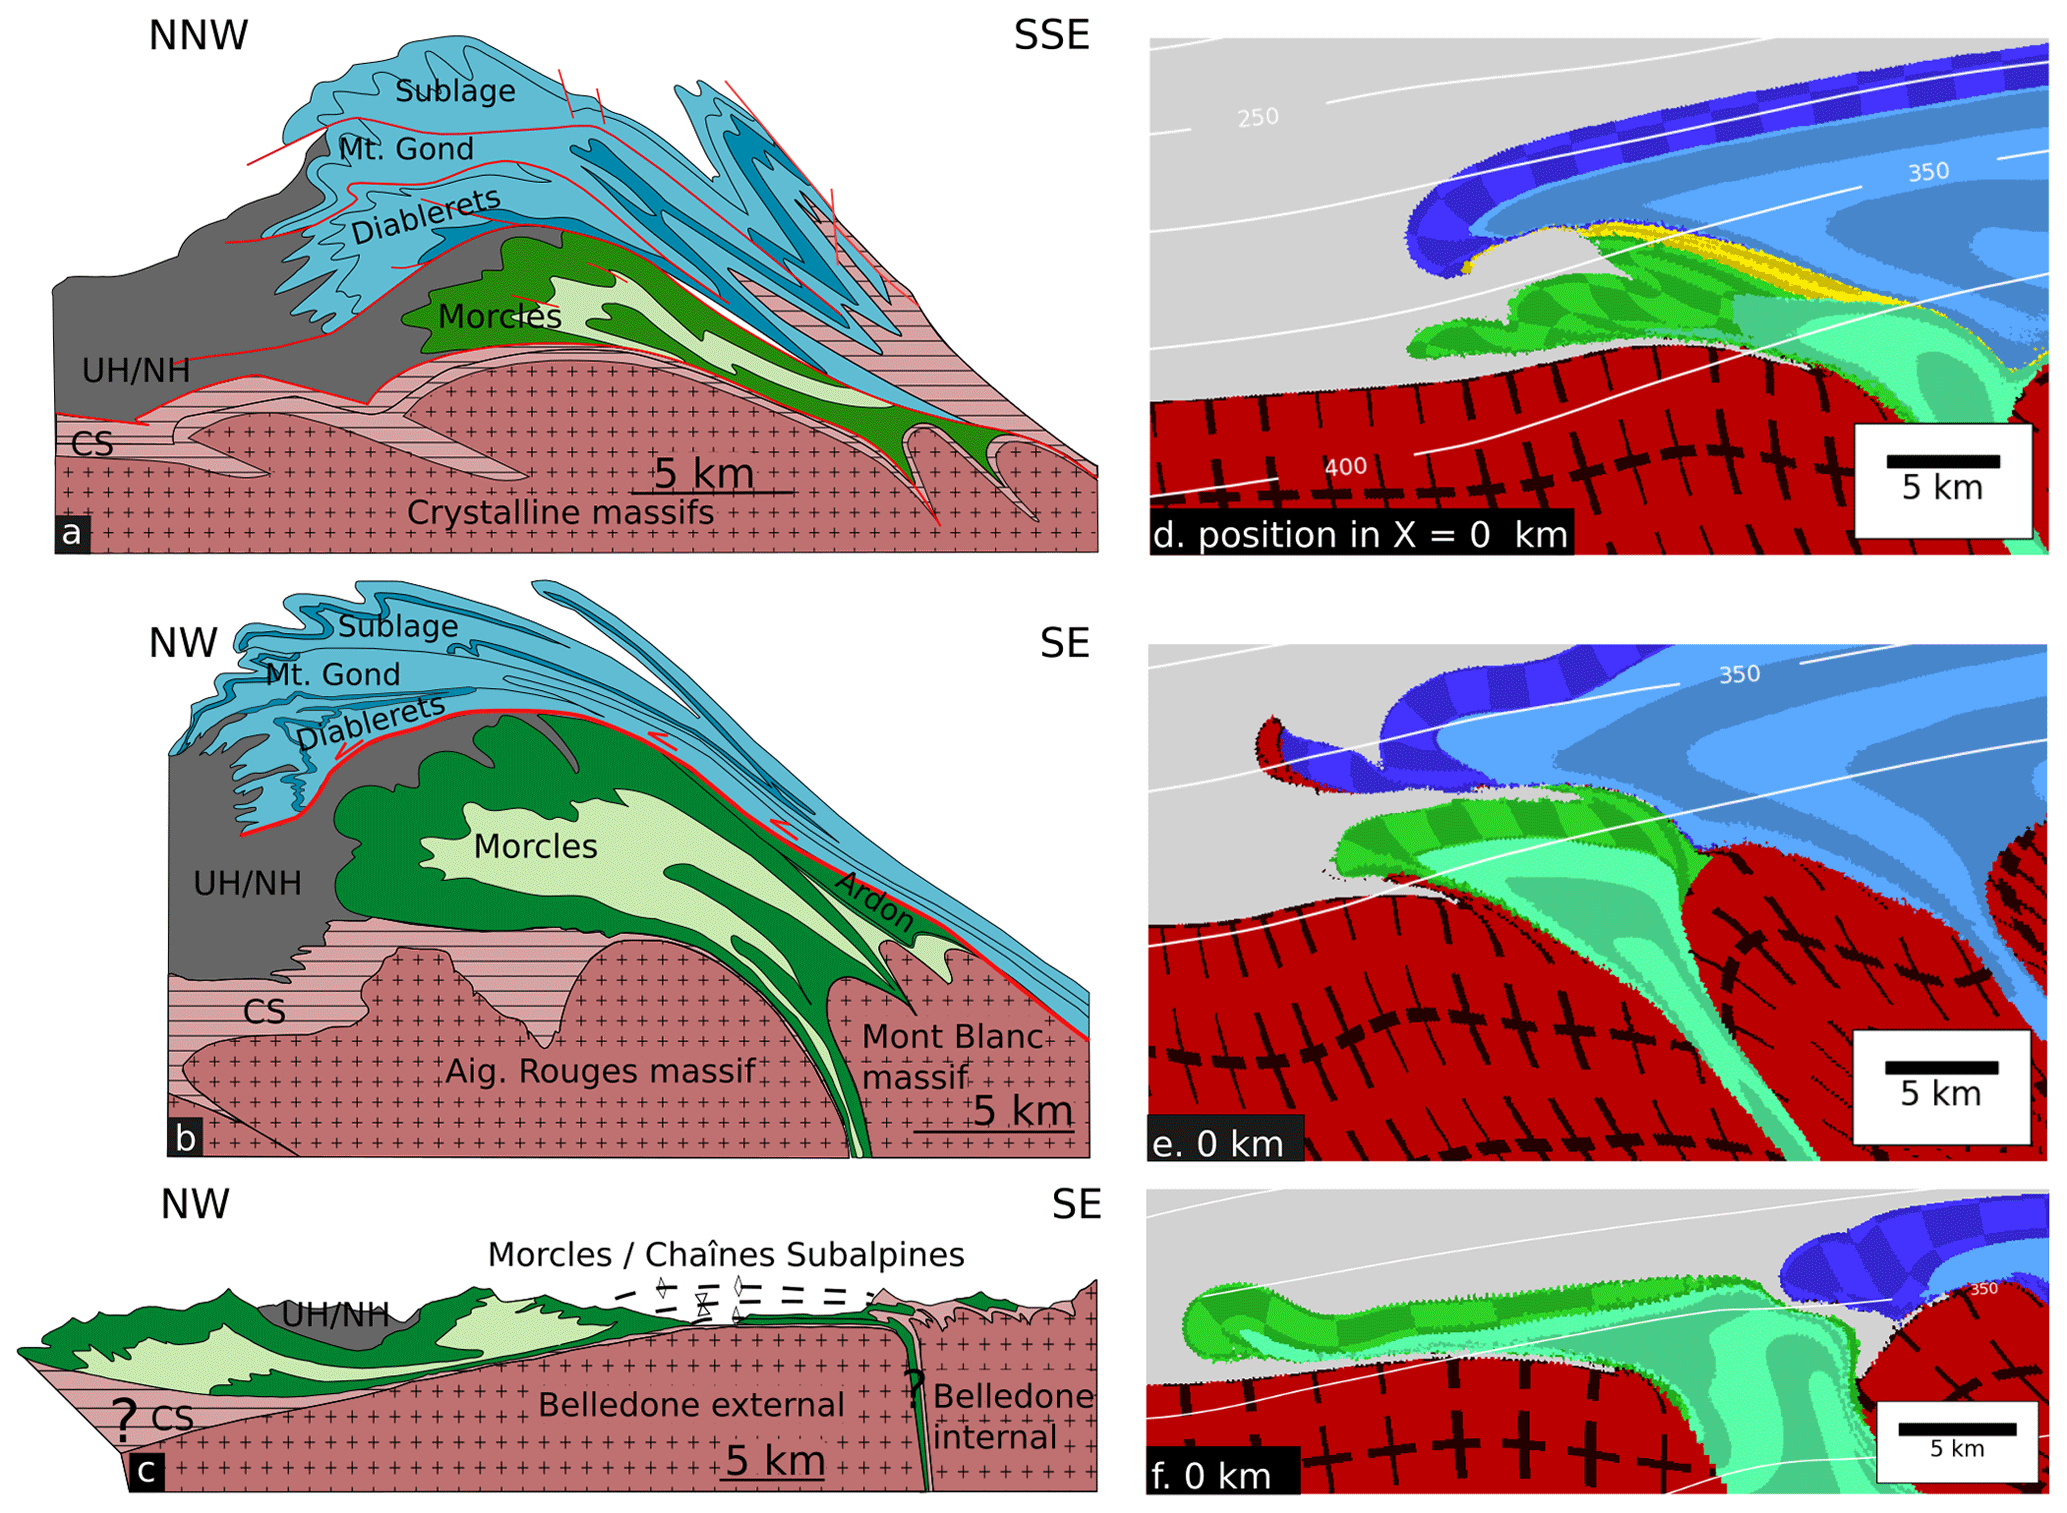
Figure 15Comparison between selected numerical cross sections and simplified geological cross sections. Row-wise (top to bottom) (a) Simplified Morcles section modified after Pfiffner (2015) (indicated in the map of Fig. 1 with the dashed profile line) and (d) section from model D.G-1. (b) Simplified Morcles section modified after Escher et al. (1993) and (e) cross-section model F.G-1. (c) Simplified section modified after Epard (1990) and (f) section from model A.G-2. UH/NH = Ultrahelvetics/North Helvetics. CS = Cover sediments.
5.3 Comparing geological with modelled cross sections: the Morcles nappe
We show and compare three different, simplified geological cross sections of the Morcles nappe with our numerical results (Fig. 15). The cross sections are from different locations along strike of the Morcles nappe and highlight, together with our numerical cross sections, the lateral variability of the Morcles nappe. Differences in the presented geological cross sections most likely do not exclusively indicate true lateral variations in the tectonic structures, but they may also result from different geometrical projection methods and different geological interpretations. Such potential apparent differences should be kept in mind when comparing numerical models with constructed geological cross sections, which can be considered geometrical models that are also based on assumptions like the numerical models. We start with a comparison of a geological cross section of the Morcles nappe near the Sanetsch Pass and a section of model B.G-1 (Fig. 15a and d). Here, the geological cross section shows a relatively thin Morcles nappe with a sheared lower and upper limb. This observation is similar to our cross section which exhibits an elongated sheared fold nappe with sheared lower and upper limbs. Moreover, in this model we observe a significant deformation of the basement at the contact of the cover sediments, which is in agreement with microstructural observations that suggest a brittle–ductile emplacement of the Morcles nappe (Ebert et al., 2007a; Austin et al., 2008). Figure 15b shows a Morcles cross section by Escher et al. (1993) from further southwest in the nappe system. In this case, model D.G-1 (Fig. 14e) provides a better first-order fit than B.G-1. Our fold nappe exhibits a strongly sheared recumbent limb that still reaches into the root zone of the nappe. Furthermore, the strong layer is still connected to the basement horst and is in contact with the thrust nappe where it is sheared, displaying a similar saw-tooth shape as observed in the geological cross section. Also, the overall aspect ratio is closer to the geological cross section than in model B.G-1. In contrast, both of the previous numerical sections do not match the observations for the nappe structure even further southwest in France near Megève (Fig. 15c). We assume that in this region the Morcles nappe and the Chaînes Subalpines constitute one large tectonic nappe that originated from the North Helvetic basin. Here, the sediments are rather squeezed out of the half-graben due to a greater thickness of shales instead of forming a recumbent limb (Epard, 1990). Therefore, we suggest that a cross section of model A.G-2C (Fig. 15f) shows a closer match to the geological structure in this region. In summary, different cross sections of the Morcles nappe can be compared to different numerical models with different initial conditions regarding the geometry or rheology. Hence, it is a challenge to capture the evolution of 3-D geological structures with a single 3-D model, because of the geometrical and rheological uncertainties and the likely significant natural variability. Furthermore, our results imply that one has to be even more cautious in the application of a single 2-D model to the formation of 3-D fold-and-thrust belts and geological structures in general.
The presented 3-D numerical simulations show the formation of a fold-and-thrust belt resulting from the wedge-type deformation of the upper crustal region of a passive margin. The formation of the sedimentary nappes results from the shearing off and detachment of sedimentary units form the half-graben, horst and basin. Nappe detachment, transport and stacking occur for standard visco-plastic rheological models without any applied material, or dynamic, softening mechanisms. Nappe formation mechanisms and their geometry are controlled by the initial basement geometry and the strength contrast between basement and cover sediments and the strength contrast within the sediments. The results indicate the fundamental importance of tectonically inherited structures on the evolution of fold-and-thrust belts and tectonic nappes. Consequently, the results emphasize the importance of the initial geological situation before fold-and-thrust belt formation.
Modelled nappe-like structures generated from sediments from the half-graben with laterally varying depth show that the nappe geometry strongly depends on the amount of sediments available for nappe formation. The calculation of 3-D finite strain shows that the deformation during the formation of nappes originating from the half-graben largely deviates from a 2-D plane strain deformation and is of a flattening type (Lode's ratio > 0). Nappes originating from the laterally homogeneous basin show a more or less laterally straight displacement front, indicating that the laterally heterogeneous deformation during nappe formation in the half-graben region does not considerably affect the overthrusting nappe.
The applied strength of the basement has a strong control on the resulting nappe geometry. A relatively stronger basement favours the formation of nappes resembling a thrust nappe, while reduced basement strength (modelled here by a stress cut-off at 40 MPa) favours the formation of fold nappes.
Nappe-like structures and a pile of nappes form only in the models when the strong sedimentary layer is limited laterally by a basement block, i.e. when the layer is buttressed by the basement. If the layer is horizontally continuous above the basement, then detachment folding is favoured and a nappe pile does not form.
The initial model configuration is based on geological reconstructions of the Helvetic nappe system. The modelled 3-D structures represent a thermo-mechanical model for the tectonic evolution of the Helvetic nappe system, which can explain several first-order observations of this system:
-
Formation of a nappe resulting from the closure of a half-graben is observed. Depending on the model configuration, this nappe can be more similar to a fold or a thrust nappe. The modelled nappes are applicable to the Morcles and Doldenhorn nappes of the Helvetic nappe system.
-
Formation of a laterally homogeneous thrust nappe is observed, which overthrusts and is stacked above the underlying nappe resulting from half-graben closure. This nappe is applicable to the Wildhorn and Glarus nappes.
-
The detachment of minor sediment units originally located on the horst and their emplacement between the upper thrust nappe and the underlying fold nappe from the half-graben is observed. These minor nappes are applicable to the Ardon, Jägerchrütz and Gellihorn nappes.
-
The entrapment of weak sediments is observed, which were originally situated structurally above the sediments eventually forming nappes between the two major nappes. These entrapped sediments are applicable to the Ultrahelvetic units.
-
The modelled temperatures, temperature gradients, finite strain gradients and duration of deformation are in overall agreement with data from the Helvetic nappe system.
All presented numerical results have been generated by the authors with the open-source software LaMEM (https://bitbucket.org/bkaus/lamem/src/master/, last access: June 2020) (Kaus et al., 2016). The model configuration, boundary conditions and the applied flow law parameters are specified in the text so that the numerical simulations can be reproduced. The numerically generated output files are available upon request to Richard Spitz.
RS carried out the numerical simulations, programmed the finite strain calculation, visualized and interpreted the results, and prepared the first manuscript draft. AB aided in the model configuration, visualization and manuscript preparation. JLE contributed to the geological summary, visualization and interpretation of the results. BJPK and AAP developed the numerical algorithm LaMEM and contributed to writing the manuscript. SMS designed the original research project; contributed to the visualization, interpretation, and presentation of the results; and contributed to writing the article.
The authors declare that they have no conflict of interest.
We thank Adrian Pfiffner and Frédéric Mouthereau for their helpful and constructive reviews. This work was supported by SNF grant No. 200020-149380 and the University of Lausanne. Moreover, this work was supported by a grant from the Swiss National Supercomputing Centre (CSCS) under project ID s785. Further, this work was supported by the Japanese Society for the Promotion of Science (JSPS), Grant-in-Aid for Scientific Research no. JP18K13643. In addition we thank Ludovic Räss and Philippe Logean for supporting us in the utilization of the Octopus Super Computing Cluster at the University of Lausanne.
This research has been supported by the Schweizerischer Nationalfonds zur Förderung der Wissenschaftlichen Forschung (grant no. 200020-149380), the Swiss National Supercomputing Centre (CSCS) (project ID s785) and the Japanese Society for the Promotion of Science (JSPS) – Grantin-Aid for Scientific Research (no. JP18K13643).
This paper was edited by Susanne Buiter and reviewed by O. Adrian Pfiffner and Frédéric Mouthereau.
Austin, N., Evans, B., Herwegh, M., and Ebert, A.: Strain localization in the Morcles nappe (Helvetic Alps, switzerland), Swiss J. Geosci., 101, 341–360, 2008. a, b, c
Ayrton, S.: La géologie de la zone Martigny-Chamonix (versant suisse) et l'origine de la nappe de Morcles (un exemple de subduction continentale), Eclogae Geological Helvetiae, 73/1, 137–172, 1980. a
Ayrton, S., Barféty, J., Bellière, J., Gubler, Y., and Jemelin, L.: Carte géologique de Chamonix (1/50 000), BRGM, Orléans, 1987. a
Badertscher, N. P. and Burkhard, M.: Brittle–ductile deformation in the Glarus thrust Lochseiten (LK) calc-mylonite, Terra Nova, 12, 281–288, 2000. a
Badertscher, N. P., Abart, R., Burkhard, M., and McCaig, A.: Fluid flow pathways along the Glarus overthrust derived from stable and Sr-isotope patterns, Am. J. Sci., 302, 517–547, 2002. a
Bastida, F., Aller, J., Fernandez, F. J., Lisle, R. J., Bobillo Ares, N. C., and Menendez, O.: Recumbent folds: key structural elements in orogenic belts, Earth-Sci. Rev., 135, 162–183, 2014. a
Bauville, A. and Schmalholz, S. M.: Thermo-mechanical model for the finite strain gradient in kilometer-scale shear zones, Geology, 41, 567–570, 2013. a
Bauville, A. and Schmalholz, S. M.: Transition from thin-to thick-skinned tectonics and consequences for nappe formation: Numerical simulations and applications to the Helvetic nappe system, Switzerland, Tectonophysics, 665, 101–117, 2015. a, b, c, d, e
Bauville, A. and Schmalholz, S. M.: Tectonic inheritance and kinematic strain localization as trigger for the formation of the Helvetic nappes, Switzerland, Swiss J. Geosci., 110, 523–534, 2017. a, b, c, d, e
Bell, T.: Progressive deformation and reorientation of fold axes in a ductile mylonite zone: the Woodroffe thrust, Tectonophysics, 44, 285–320, 1978. a
Bellahsen, N., Jolivet, L., Lacombe, O., Bellanger, M., Boutoux, A., Garcia, S., Mouthereau, F., Le Pourhiet, L., and Gumiaux, C.: Mechanisms of margin inversion in the external Western Alps: Implications for crustal rheology, Tectonophysics, 560, 62–83, 2012. a
Bercovici, D. and Ricard, Y.: Energetics of a two-phase model of lithospheric damage, shear localization and plate-boundary formation, Geophys. J. Int., 152, 581–596, 2003. a
Berger, A., Wehrens, P., Lanari, P., Zwingmann, H., and Herwegh, M.: Microstructures, mineral chemistry and geochronology of white micas along a retrograde evolution: An example from the Aar massif (Central Alps, Switzerland), Tectonophysics, 721, 179–195, 2017. a
Beutner, E. C.: Causes and consequences of curvature in the Sevier orogenic belt, Utah to Montana, edited by: Heisey, E. L., Lawson, D. E., Norwood, E. R., Wach, P. H., and Hale, L. A., Rocky Mountain Thrust Belt, Geology and Resources: Guidebook for the Wyoming Geological Association Annual Field Conference, 29, 153–165, 1977. a
Boutoux, A., Bellahsen, N., Nanni, U., Pik, R., Verlaguet, A., Rolland, Y., and Lacombe, O.: Thermal and structural evolution of the external Western Alps: Insights from (U–Th–Sm)/He thermochronology and RSCM thermometry in the Aiguilles Rouges/Mont Blanc massifs, Tectonophysics, 683, 109–123, 2016. a, b, c
Boyer, S. E. and Elliott, D.: Thrust systems, Aapg Bulletin, 66, 1196–1230, 1982. a
Buchanan, J. G. and Buchanan, P. G.: Basin inversion, in: vol. 88, Geological Society London, London, 1995. a
Bucher, W. H.: Role of gravity in orogenesis, Geol. Soc. Am. Bull., 67, 1295–1318, 1956. a
Burkhard, M.: L'Helvétique de la bordure occidentale du massif de l'Aar (évolution tectonique et métamorphique), Eclogae Geologicae Helvetiae, 81, 63–114, 1988. a, b
Burkhard, M., Kerrich, R., Maas, R., and Fyfe, W.: Stable and Sr-isotope evidence for fluid advection during thrusting of the Glarus nappe (Swiss Alps), Contrib,o Mineral. Petrol., 112, 293–311, 1992. a
Butler, R. W.: The influence of pre-existing basin structure on thrust system evolution in the Western Alps, Geol. Soc. Lond. Spec. Publ., 44, 105–122, 1989. a
Butler, R. W., Bond, C. E., Cooper, M. A., and Watkins, H.: Fold–thrust structures – where have all the buckles gone?, Geol. Soc. Lond. Spec. Publ., 487, 21–44, 2019. a
Carreras, J., Czeck, D. M., Druguet, E., and Hudleston, P. J.: Structure and development of an anastomosing network of ductile shear zones, J. Struct. Geol., 32, 656–666, 2010. a
Casey, M. and Dietrich, D.: Overthrust shear in mountain building, in: Evolution of Geological Structures in Micro-to Macro-scales, Springer, Dordrecht, 119–142, 1997. a, b, c
Collet, L. W.: La nappe de Morcles entre Arve et Rhône, Kuemmerly und Frey, in: Matériaux pour la carte géologique de la Suisse, 79, 1943. a
Crameri, F.: Scientific Colour Maps, version 5.0.0, zenodo, https://doi.org/10.5281/zenodo.3596401, 2019. a, b
Crameri, F., Schmeling, H., Golabek, G., Duretz, T., Orendt, R., Buiter, S., May, D., Kaus, B., Gerya, T., and Tackley, P.: A comparison of numerical surface topography calculations in geodynamic modelling: an evaluation of the `sticky air' method, Geophys. J. Int., 189, 38–54, 2012. a
Dahlen, F. A.: Noncohesive critical Coulomb wedges: An exact solution, J. Geophys. Res.-Solid, 89, 10125–10133, 1984. a
Dahlen, F. A. and Suppe, J.: Mechanics, growth, and erosion of mountain belts, Processes in continental lithospheric deformation, Geol. Soc. Am. Spec. Pap., 218, 161–178, 1988. a
Davis, D., Suppe, J., and Dahlen, F. A.: Mechanics of fold-and-thrust belts and accretionary wedges, J. Geophys. Res., 88, 1153, https://doi.org/10.1029/JB088iB02p01153, 1983. a
Dietrich, D. and Casey, M.: A new tectonic model for the Helvetic nappes, Geol. Soc. Lond. Spec. Publ., 45, 47–63, 1989. a, b
Dunn, J. F., Hartshorn, K. G., and Hartshorn, P. W.: Structural styles and hydrocarbon potential of the sub-Andean thrust belt of southern Bolivia, in: Petroleum basins of South America, edited by: Tankard, A. J., Suárez, R. S., and Welsink, H. J., AAPG Mem., 62, 523–543, 1995. a
Ebert, A., Herwegh, M., Evans, B., Pfiffner, A., Austin, N., and Vennemann, T.: Microfabrics in carbonate mylonites along a large-scale shear zone (Helvetic Alps), Tectonophysics, 444, 1–26, 2007a. a, b
Ebert, A., Herwegh, M., and Pfiffner, A.: Cooling induced strain localization in carbonate mylonites within a large-scale shear zone (Glarus thrust, Switzerland), J. Struct. Geol., 29, 1164–1184, 2007b. a
Ebert, A., Herwegh, M., Berger, A., and Pfiffner, A.: Grain coarsening maps for polymineralic carbonate mylonites: a calibration based on data from different Helvetic nappes (Switzerland), Tectonophysics, 457, 128–142, 2008. a, b, c
Epard, J. L.: Le contact entre le socle du Mont-Blanc et la zone de Chamonix: implications tectoniques, in: vol. 78, Société Vaudois des Sciences Naturelles, 225–245, 1986. a, b
Epard, J. L.: La nappe de Morcles au sud-ouest du Mont-Blanc, PhD thesis, Mém. Géol. Lausanne, 8, 1–158, 1990. a, b, c, d, e, f, g
Epard, J.-L. and Escher, A.: Transition from basement to cover: a geometric model, J. Struct. Geol., 18, 533–548, 1996. a
Epard, J.-L. and Groshong Jr., R. H.: Excess area and depth to detachment, AAPG Bull., 77, 1291–1302, 1993. a
Escher, A., Masson, H., and Steck, A.: Nappe geometry in the western Swiss Alps, J. Struct. Geol., 15, 501–509, 1993. a, b, c, d
Fernandez, N. and Kaus, B. J.: Fold interaction and wavelength selection in 3D models of multilayer detachment folding, Tectonophysics, 632, 199–217, 2014. a
Fitz Diaz, E., Hudleston, P., and Tolson, G.: Comparison of tectonic styles in the Mexican and Canadian Rocky Mountain fold-thrust belt, Geol. Soc. Lond. Spec. Publ., 349, 149–167, 2011. a
Gillcrist, R., Coward, M., and Mugnier, J.-L.: Structural inversion and its controls: examples from the Alpine foreland and the French Alps, Geodinamica Acta, 1, 5–34, 1987. a
Girault, J., Bellahsen, N., Boutoux, A., Rosenberg, C., Nanni, U., Verlaguet, A., and Beyssac, O.: The 3-D Thermal Structure of the Helvetic Nappes of the European Alps: Implications for Collisional Processes, Tectonics, 39, e2018TC005334, https://doi.org/10.1029/2018TC005334, 2020. a, b
Granado, P. and Ruh, J. B.: Numerical modelling of inversion tectonics in fold-and-thrust belts, Tectonophysics, 763, 14–29, 2019. a, b
Hamilton, W. B.: Laramide crustal shortening, Interaction of the Rocky Mountain foreland and the Cordilleran thrust belt, Geol. Soc. Am. Memo., 171, 27–39, 1988. a
Hansen, F. D. and Carter, N. L.: Semibrittle creep of dry and wet Westerly granite at 1000 MPa, in: The 24th US Symposium on Rock Mechanics (USRMS), American Rock Mechanics Association, Texas A & M University, College Station, Texas, 429–447, 1983. a
Herwegh, M. and Pfiffner, O.-A.: Tectono-metamorphic evolution of a nappe stack: A case study of the Swiss Alps, Tectonophysics, 404, 55–76, 2005. a, b
Herwegh, M., Hürzeler, J. P., Pfiffner, O. A., Schmid, S. M., Abart, R., and Ebert, A.: Excursion guide to the field trip of the Swiss Tectonic Studies Group (Swiss Geological Society) to the Glarus nappe complex (14.–16.09.2006), Swiss J. Geosci., 101, 323–340, 2008. a, b
Herwegh, M., Berger, A., Baumberger, R., Wehrens, P., and Kissling, E.: Large-scale crustal-block-extrusion during late Alpine collision, Scient. Rep., 7, 413, 2017. a
Hürzeler, J.-P. and Abart, R.: Fluid flow and rock alteration along the Glarus thrust, Swiss J. Geosci., 101, 251–268, 2008. a
Jaquet, Y., Bauville, A., and Schmalholz, S. M.: Viscous overthrusting versus folding: 2-D quantitative modeling and its application to the Helvetic and Jura fold and thrust belts, J. Struct. Geol., 62, 25–37, 2014. a, b
Jaquet, Y., Duretz, T., and Schmalholz, S. M.: Dramatic effect of elasticity on thermal softening and strain localization during lithospheric shortening, Geophys. J. Int., 204, 780–784, 2015. a
Jaquet, Y., Duretz, T., Grujic, D., Masson, H., and Schmalholz, S. M.: Formation of orogenic wedges and crustal shear zones by thermal softening, associated topographic evolution and application to natural orogens, Tectonophysics, 746, 512–529, 2018. a, b
Kaus, B., Popov, A. A., Baumann, T., Pusok, A., Bauville, A., Fernandez, N., and Collignon, M.: Forward and inverse modelling of lithospheric deformation on geological timescales, in: NIC Symposium 2016 – Proceedings, NIC Series, Jülich, Germany, 2016. a, b, c
Kirschner, D. L., Sharp, Z. D., and Masson, H.: Oxygen isotope thermometry of quartz-calcite veins: Unraveling the thermal-tectonic history of the subgreenschist facies Morcles nappe (Swiss Alps), Geol. Sco. Am. Bull., 107, 1145–1156, 1995. a, b, c, d
Kirschner, D. L., Cosca, M. A., Masson, H., and Hunziker, J. C.: Staircase 40/Ar39Ar spectra of fine-grained white mica: Timing and duration of deformation and empirical constraints on argon diffusion, Geology, 24, 747–750, 1996. a
Kirschner, D. L., Masson, H., and Sharp, Z.: Fluid migration through thrust faults in the Helvetic nappes (Western Swiss Alps), Contrib. Mineral. Petrol., 136, 169–183, 1999. a, b
Kiss, D., Podladchikov, Y., Duretz, T., and Schmalholz, S. M.: Spontaneous generation of ductile shear zones by thermal softening: Localization criterion, 1D to 3D modelling and application to the lithosphere, Earth Planet. Sc. Lett., 519, 284–296, 2019. a
Kiss, D., Duretz, T., and Schmalholz, S. M.: Tectonic inheritance controls nappe detachment, transport and stacking in the Helvetic nappe system, Switzerland: insights from thermomechanical simulations, Solid Earth, 11, 287–305, https://doi.org/10.5194/se-11-287-2020, 2020. a, b
Kronenberg, A. K., Kirby, S. H., and Pinkston, J.: Basal slip and mechanical anisotropy of biotite, J. Geophys. Res.-Solid, 95, 19257–19278, 1990. a
Lacombe, O. and Bellahsen, N.: Thick-skinned tectonics and basement-involved fold–thrust belts: insights from selected Cenozoic orogens, Geol. Mag., 153, 763–810, 2016. a
Lacombe, O. and Mouthereau, F.: Basement-involved shortening and deep detachment tectonics in forelands of orogens: Insights from recent collision belts (Taiwan, Western Alps, Pyrenees), Tectonics, 21, 12–21, 2002. a
Laubscher, H.: Some overall aspects of Jura dynamics, Am. J. Sci., 272, 293–304, 1972. a
Leloup, P.-H., Arnaud, N., Sobel, E. R., and Lacassin, R.: Alpine thermal and structural evolution of the highest external crystalline massif: The Mont Blanc, Tectonics, 24, TC4002, https://doi.org/10.1029/2004TC001676, 2005. a, b
Lode, W.: Versuche ”uber den Einfluß der mittleren Hauptspannung auf das Fließen der Metalle Eisen, Kupfer und Nickel, Z. Phys., 36, 913–939, 1926. a
Lymer, G., Cresswell, D. J., Reston, T. J., Bull, J. M., Sawyer, D. S., Morgan, J. K., Stevenson, C., Causer, A., Minshull, T. A., and Shillington, D. J.: 3D development of detachment faulting during continental breakup, Earth Planet. Sc. Lett., 515, 90–99, 2019. a
Macedo, J. and Marshak, S.: Controls on the geometry of fold-thrust belt salients, Geol. Soc. Am. Bull., 111, 1808–1822, 1999. a
Mair, D., Lechmann, A., Herwegh, M., Nibourel, L., and Schlunegger, F.: Linking Alpine deformation in the Aar Massif basement and its cover units – the case of the Jungfrau–Eiger mountains (Central Alps, Switzerland), Solid Earth, 9, 1099–1122, https://doi.org/10.5194/se-9-1099-2018, 2018. a
Marshak, S., Wilkerson, M., and Hsui, A.: Generation of curved fold-thrust belts: Insight from simple physical and analytical models, in: Thrust tectonics, Springer, Dordrecht, 83–92, 1992. a
Mase, G. E.: Continuum mechanics, in: vol. 970, McGraw-Hill, New York, 1970. a
Masson, H., Baud, A., Escher, A., Gabus, J., and Marthaler, M.: Paléokarsts crétacés et tertiaires dans la nappe de Morcles, Compte rendu de l'excursion de la Société géologique Suisse du, 1, 331–349, 1980. a, b, c
Milnes, A. G. and Pfiffner, O.-A.: Tectonic evolution of the Central Alps in the cross section St. Gallen-Como., Eclogae Geologicae Helvetiae, 73, 619–633, 1980. a
Mitra, G.: Evolution of salients in a fold-and-thrust belt: the effects of sedimentary basin geometry, strain distribution and critical taper, in: Evolution of geological structures in micro-to macro-scales, Springer, Dordrecht, 59–90, 1997. a, b, c
Mitra, S. and Fisher, G. W.: Structural geology of fold and thrust belts, Johns Hopkins University Press, Baltimore, 1992. a
Mouthereau, F., Deffontaines, B., Lacombe, O., Angelier, J., Byrne, T., and Liu, C.: Variations along the strike of the Taiwan thrust belt: Basement control on structural style, wedge geometry, and kinematics, Geol. Soc. Am Spec. Pap., 31–54, 2002. a
Nádai, A. and Hodge, P.: Theory of Flow and Fracture of Solids, vol. II, J. Appl. Mech., 30, 640, 1963. a
Nemčok, M., Mora, A., and Cosgrove, J.: Thick-skin-dominated orogens; from initial inversion to full accretion: an introduction, Geol. Soc. Lond. Spec. Publ., 377, 1–17, 2013. a
Nibourel, L., Berger, A., Egli, D., Luensdorf, N. K., and Herwegh, M.: Large vertical displacements of a crystalline massif recorded by Raman thermometry, Geology, 46, 879–882, 2018. a, b, c, d, e
Oulianoff, N.: Le massif de l'Arpille et ses abords: avec 11 figures dans le texte, 2 planches et une carte géologique au 1:25 000 (no. 103), Francke, 1924. a
Paréjas, E.: Géologie de la zone de Chamonix, comprise entre le Mont-Blanc et les Aiguilles Rouges, Mémoires de la Société de physique et d'histoire naturelle de Genève, 39, 373–442, 1922. a
Peña, J. M. V. and Catalán, J. R. M.: A computer program for the simulation of folds of different sizes under the influence of gravity, Comput. Geosci., 30, 33–43, 2004. a
Pfiffner, O. A.: The structure of the Helvetic nappes and its relation to the mechanical stratigraphy, J. Struct. Geol., 15, 511–521, 1993. a, b, c, d, e, f, g, h, i
Pfiffner, O. A.: Thick-skinned and thin-skinned styles of continental contraction, Geol. Soc. Am. Spec. Pap., 414, 153, 2006. a
Pfiffner, O.-A.: Explanatory Notes to Structural map of the Helvetic zone of the Swiss Alps, including Vorarlberg (Austria) and Haute Savoie (France), Explanatory notes, Bundesamt für Landestopografie swisstopo, Bern, 2011. a, b, c, d
Pfiffner, O. A.: Geologie der Alpen, in: vol. 8416, UTB, Bern, Stuttgart, Wien, 2015. a, b, c, d, e, f, g, h
Pfiffner, O.-A., Burkhard, M., Hänni, R., Kammer, A., Kligfield, R., Mancktelow, N., Menkveld, J., Ramsay, J., Schmid, S., and Zurbriggen, R.: Structural map of the Helvetic zone of the Swiss Alps, including Vorarlberg (Austria) and Haute Savoie (France), Bundesamt für Landestopografie swisstopo, Bern, 2011. a, b, c, d
Poulet, T., Veveakis, M., Herwegh, M., Buckingham, T., and Regenauer Lieb, K.: Modeling episodic fluid-release events in the ductile carbonates of the Glarus thrust, Geophys. Res. Lett., 41, 7121–7128, 2014. a, b, c
Price, N. J. and McClay, K. R.: Thrust and nappe tectonics, Geological Society of London, London, 1981. a
Ramsay, J. G.: Tectonics of the Helvetic nappes, Geol. Soc. Lond. Spec. Publ., 9, 293–309, 1981. a, b
Ramsay, J. G.: Fold and fault geometry in the western Helvetic nappes of Switzerland and France and its implication for the evolution of the arc of the western Alps, Geol. Soc. Lond. Spec. Publ., 45, 33–45, 1989. a
Ramsay, J. G. and Huber, M. I.: The techniques of modern structural geology: Folds and fractures, in: vol. 2, Academic Press, London, 1987. a, b
Ramsay, J. G., Casey, M., and Kligfield, R.: Role of shear in development of the Helvetic fold-thrust belt of Switzerland, Geology, 11, 439–442, 1983. a, b
Ries, A.: A Discussion on natural strain and geological structure – Patterns of strain variation in arcuate fold bets, Philos. T. Roy. Soc. Lond. A, 283, 281–288, 1976. a
Rodgers, J.: Evolution of thought on structure of middle and southern Appalachians, AAPG Bull., 33, 1643–1654, 1949. a
Ruh, J. B., Kaus, B. J., and Burg, J.-P.: Numerical investigation o deformation mechanics in fold-and-thrust belts: Influence of rheology of single and multiple décollements, Tectonics, 31, C3005, https://doi.org/10.1029/2011TC003047, 2012. a
Ruh, J. B., Gerya, T., and Burg, J.-P.: 3D effects of strain vs. velocity weakening on deformation patterns in accretionary wedges, Tectonophysics, 615, 122–141, 2014. a, b
Schmalholz, S., Podladchikov, Y., and Burg, J.-P.: Control of folding by gravity and matrix thickness: Implications for large-scale folding, J. of Geophys. Res.-Solid, 107, ETG1-1–ETG1–16, https://doi.org/10.1029/2001JB000355, 2002. a
Schmid, S. M.: The Glarus overthrust: Field evidence and mechanical model, Ecologae Geol. Helvetia, 68, 247–280, 1975. a
Schmid, S. M., Boland, J., and Paterson, M.: Superplastic flow in finegrained limestone, Tectonophysics, 43, 257–291, 1977. a
Simpson, G.: Mechanics of non-critical fold-thrust belts based on finite element models, Tectonophysics, 499, 142–155, 2011. a, b, c
Steck, A.: Carte tectonique des Alpes de Suisse occidentale et des régions avoisinantes, Office fédéral des eaux et de la géologie, Bern, 1999. a, b
Termier, P.: La synthèse géologique des Alpes, Imprim. Moderne, Liège, 1906. a
Thomas, W. A.: Evolution of Appalachian-Ouachita salients and recesses from reentrants and promontories in the continental margin, Am. J. Sci., 277, 1233–1278, 1977. a
Trümpy, R., Aubert, D., and Bernoulli, D.: Geology of Switzerland: Geological excursions, in: vol. 10, Wepf, Basel, 1980. a
Von Tscharner, M., Schmalholz, S., and Epard, J.-L.: 3-D numerical models of viscous flow applied to fold nappes and the Rawil depression in the Helvetic nappe system (western Switzerland), J. Struct. Geol., 86, 32–46, 2016. a
Wehrens, P., Baumberger, R., Berger, A., and Herwegh, M.: How is strain localized in a meta-granitoid, mid-crustal basement section? Spatial distribution of deformation in the central Aar massif (Switzerland), J. Struct. Geol., 94, 47–67, 2017. a
Wissing, S. and Pfiffner, O.-A.: Numerical models for the control of inherited basin geometries on structures and emplacement of the Klippen nappe (Swiss Prealps), J. Struct. Geol., 25, 1213–1227, 2003. a, b
Yamato, P., Kaus, B. J., Mouthereau, F., and Castelltort, S.: Dynamic constraints on the crustal-scale rheology of the Zagros fold belt, Iran, Geology, 39, 815–818, 2011. a