the Creative Commons Attribution 4.0 License.
the Creative Commons Attribution 4.0 License.
 | 13 Sep 2021
Deformation-enhanced diagenesis and bacterial proliferation in the Nankai accretionary prism
Vincent Famin
Hugues Raimbourg
Muriel Andreani
Anne-Marie Boullier
Understanding diagenetic reactions in accreted sediments is critical for establishing the balance of fluid sources and sinks in accretionary prisms, which is in turn important for assessing the fluid pressure field and the ability for faults to host seismic slip. For this reason, we studied diagenetic reactions in deformation bands (shear zones and veins) within deep mud sediments from the Nankai accretionary prism (SW Japan) drilled at site C0001 during IODP Expedition 315, by means of microscopic observation, X-ray diffraction, and major- and trace-element analyses. Deformation bands are not only more compacted than the host sediment but are also enriched in framboidal pyrite, as observed under microscopy and confirmed by chalcophile-element enrichments (Fe, S, Cu, As, Sb, Pb). In tandem, one shear zone sample displays a destabilization of smectite or illite–smectite mixed layers and a slight crystallization of illite relative to its sediment matrix, and another sample shows correlated increases in B and Li in shear zones and veins compared to the host sediment, both effects suggesting a transformation of smectite into illite in deformation bands.
The two diagenetic reactions of sulfide precipitation and smectite-to-illite transformation are explained by a combined action of sulfate-reducing and methanogen bacteria, which strongly suggests an increased activity of anaerobic microbial communities localized in deformation bands. This local bacterial proliferation was possibly enhanced by the liberation of hydrogen from strained phyllosilicates. We suggest that the proliferation of anoxic bacteria, boosted by deformation, may contribute to the pore water freshening observed at depth in accretionary prisms. Deformation-enhanced metabolic reactions may also explain the illitization observed in major faults of accretionary prisms. Care is therefore needed before interpreting illitization, and other diagenetic reactions as well, as evidence of shear heating, as these might be biogenic instead of thermogenic.
- Article
(21785 KB) - Full-text XML
- BibTeX
- EndNote


The shallow seismicity and the stress state of convergent margins is strongly influenced by the distribution of pore fluid pressure in the accretionary prism (e.g., Davis et al., 1983; Moore and Saffer, 1998). For this reason, a large amount of work has been devoted to understanding the processes of fluid production, consumption, or migration based on the composition of pore waters in accreted sediments (e.g., Brown et al., 2001; Henry and Bourlange, 2004; Kastner et al., 1991; Pohlmann et al., 2009; Raimbourg et al., 2017). On the one hand, this composition may be controlled by long-distance downward or upward flow, diffusing across the sediments or focused along major discontinuities such as the décollement or out-of-sequence thrusts (e.g., Saffer and Bekins, 1998). On the other hand, several processes of in situ fluid production or consumption can also affect the composition of pore fluids, including metabolic reactions, organic matter cracking, and mineral dehydration or alteration reactions (e.g., Carson and Screaton, 1998; Moore and Vrolijk, 1992; Raimbourg et al., 2017; Torres et al., 2015; Wallmann et al., 2006). Knowing which diagenetic reactions occur in sediments is critical for interpreting the chemistry of pore waters determined by drilling in accretionary prisms.
Diagenetic reactions are in the spotlight since the discovery of low-chlorinity (i.e., lower than sea water) anomalies in sediment pore waters from the Barbados (Gieskes et al., 1990; Moore and Vrolijk, 1992; Vrolijk et al., 1991) and Nankai accretionary prisms (Gieskes et al., 1993; Kastner et al., 1993; Underwood, 1993). Some modeling studies suggested that the transformation of smectite into illite (hereafter called illitization), assumed to be controlled essentially by temperature, might explain this pore water freshening (Brown et al., 2001; Henry and Bourlange, 2004). However, the interpretation of chlorinity is highly dependent on the porosity evolution chosen in the model, and other studies concluded that illitization alone could not account for the observed pore water freshening (Saffer and McKiernan, 2009). This conclusion calls for an additional source of fresh fluid, either as a long-distance fluid flow or as another yet unidentified dehydration reaction. Biogenic or thermogenic processes of organic matter degradation are other diagenetic reactions capable of dramatically influencing the fluid budget of the sediment undergoing subduction, by consuming or producing water, solutes, or hydrocarbons (Pohlman et al., 2009; Raimbourg et al., 2017; Torres et al., 2015). In this category of reactions, recent studies have shown that bacterial degradation of organic matter is able to produce large concentrations of free gas hydrocarbons (> 20 ), even at depths over 1000 m below the sea floor (Wiersberg et al., 2015). Diagenetic reactions are also intensively studied within major faults of accretionary prisms, not only because they represent potential sinks or sources of fluids, but also because they can be used to estimate the heat generated by friction, and hence the energy dissipated by seismic ruptures (e.g., Hirono et al., 2009; Yamaguchi et al., 2011).
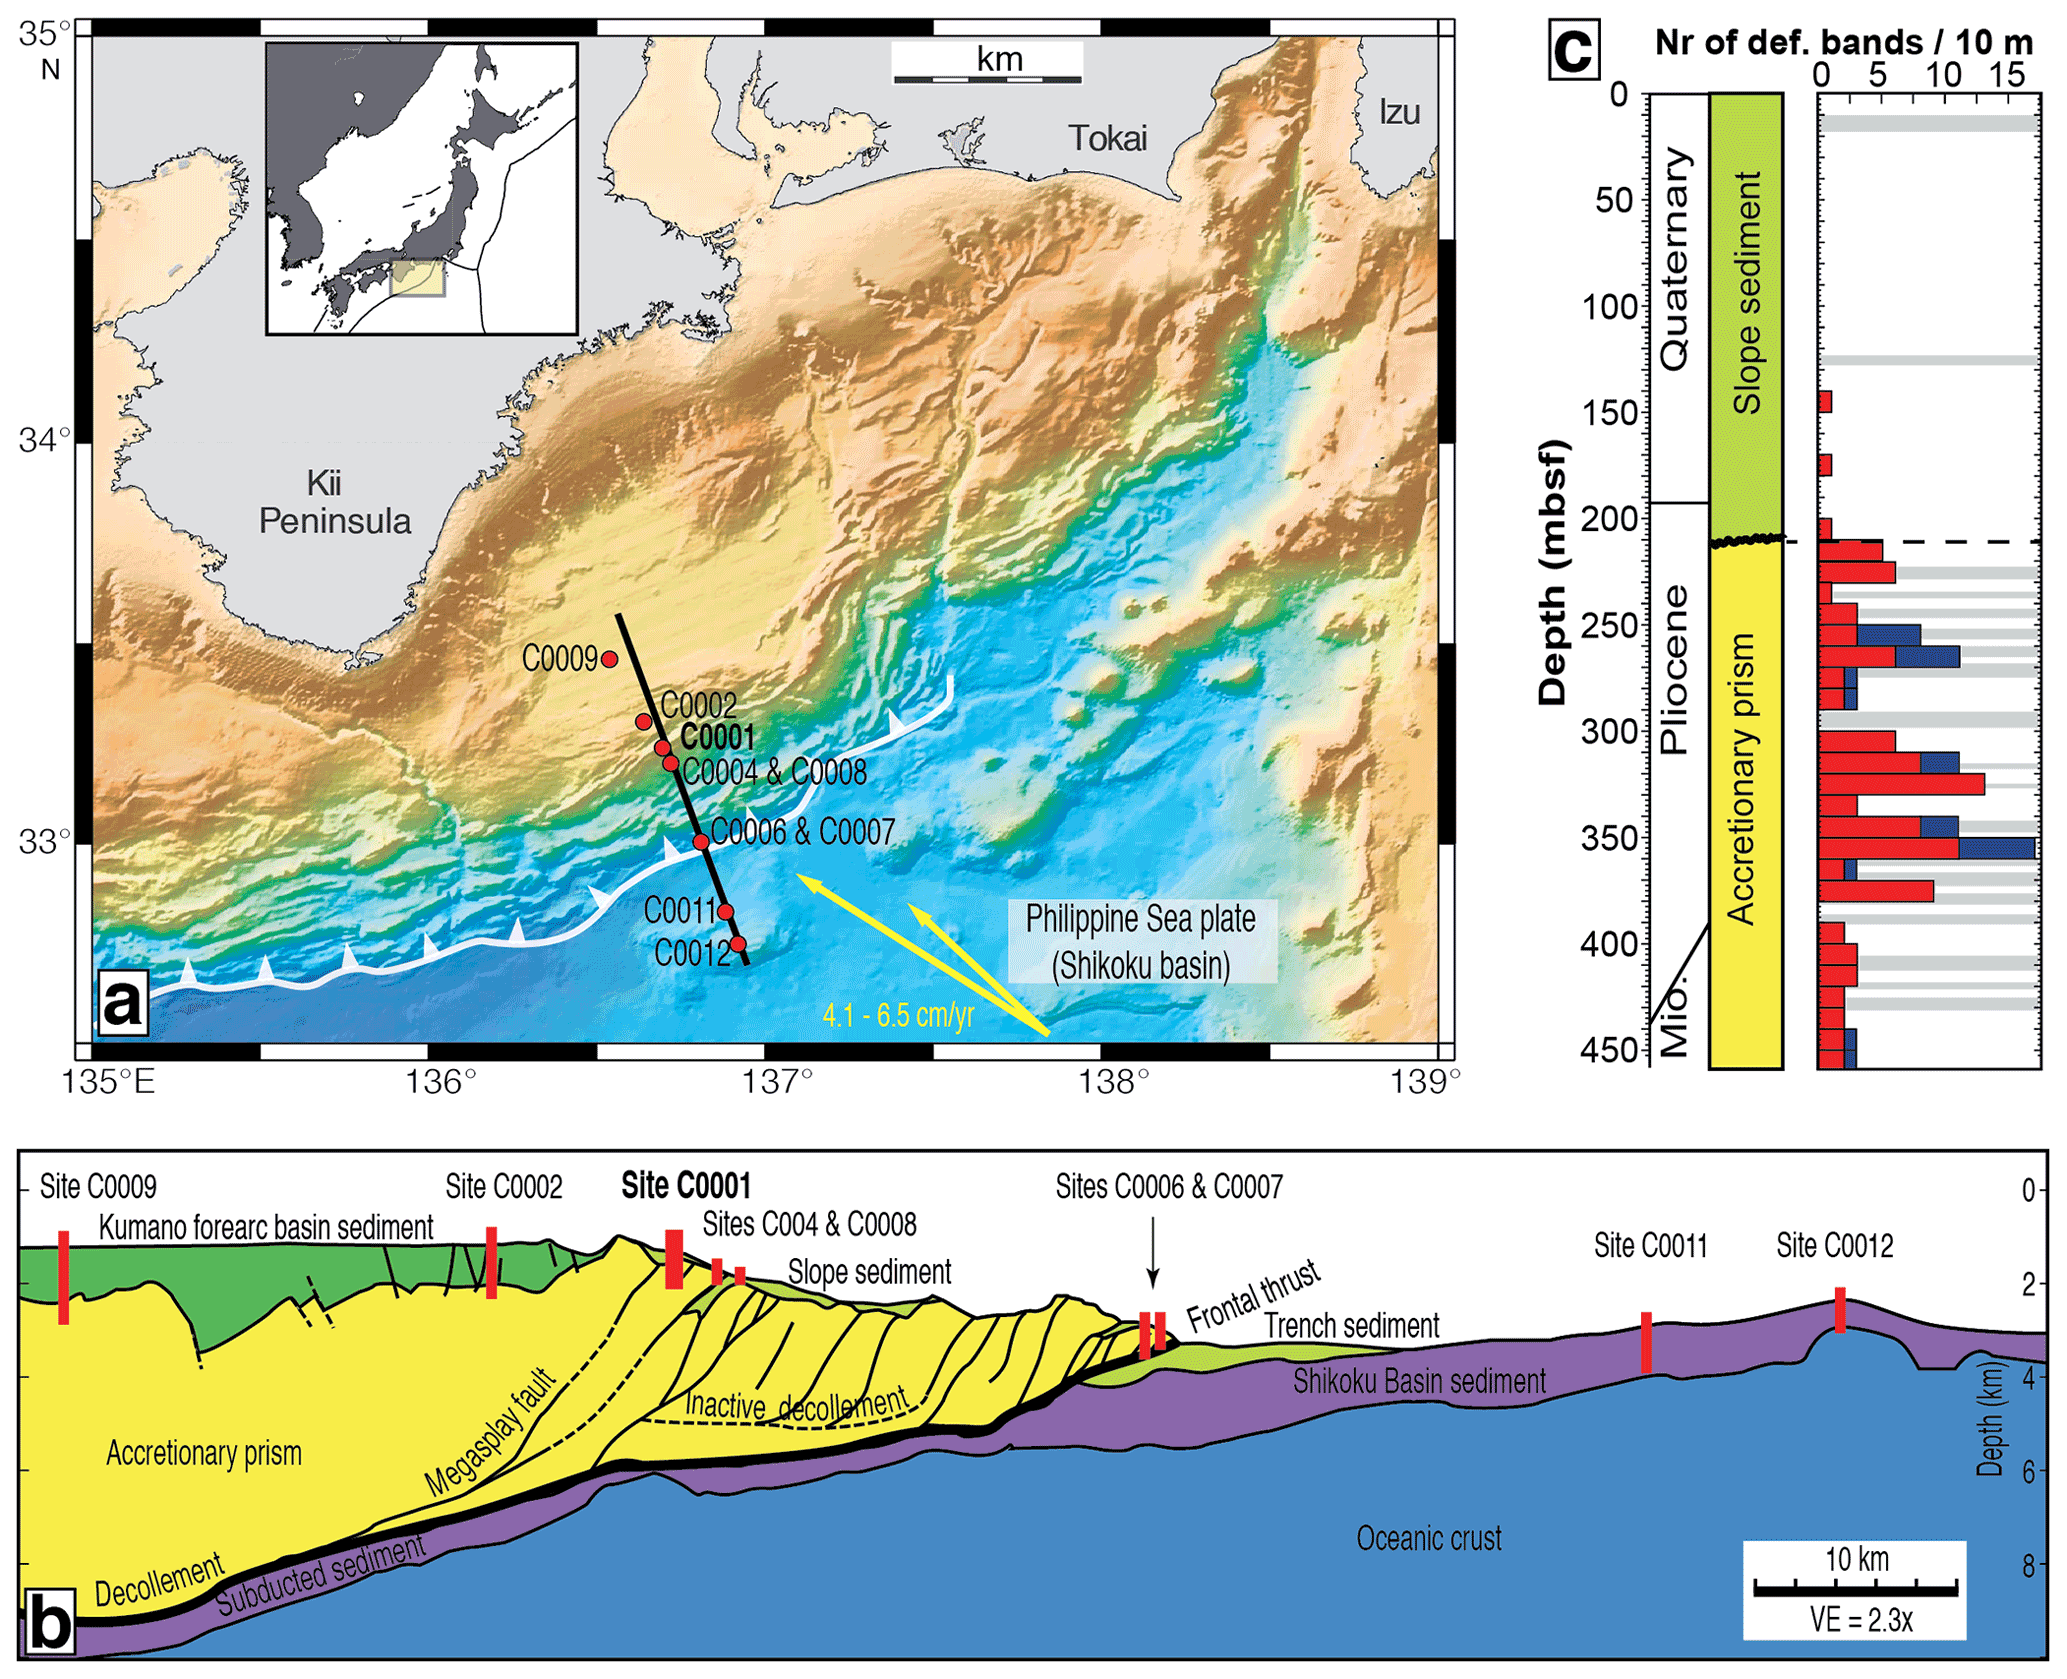
Figure 1(a) Bathymetric map of the Nankai accretionary prism offshore of the Kii peninsula, showing the location of the core logging sites of the NanTroSEIZE transect (IODP Exp. 315, 316, 319, 322, and 333). The yellow arrows represent the range of plate convergence directions (modified from Moore et al., 2009). (b) Schematic cross section of the Nankai accretionary prism along the NanTroSEIZE transect (modified from Moore et al., 2009). (c) Simplified stratigraphy and histogram of deformation bands (10 m spacing) found in cores from site C0001 (modified from Kinoshita et al., 2009a). The slope sediments (Unit I) and sediments from the accretionary prism (Unit II) are separated by an unconformity labeled by a thick black line. Red bars stand for shear zones, blue bars for veins, and gray bars correspond to zones of no core recovery.
To improve our knowledge of diagenetic reactions in accreted sediments, we studied core samples from the NanTroSEIZE transect drilled by IODP Expedition 315 across the Nankai accretionary prism in SW Japan (Fig. 1a). Our petrographic, mineralogical, and chemical (major- and trace-element) analyses show that small deformation bands, ubiquitously observed in sediments of the Nankai prism, host some diagenetic reactions. These diagenetic reactions may be of importance for the interpretation of pore fluid composition in deformed sediments, and for the understanding of coseismic mineral reactions in major thrust faults within accretionary prisms.
The NanTroSEIZE drilling transect in the Nankai accretionary prism is located offshore of the Kii peninsula (Fig. 1a). In this transect, the sedimentary pile of the prism may be subdivided into sediments of the Kumano forearc basin, slope or trench sediments, and accreted sediments underneath (Fig. 1b). Accreted sediments are cut by large, landward-dipping thrust faults called “megasplay faults”. Within this transect, core drilling at sites C0001, C0002 (both drilled during IODP Expedition 315), and C0009 (Exp. 319) penetrated the Kumano forearc basin and reached the sediments of the accretionary prism underneath. Site C0004 (Exp. 316) targeted the megasplay fault located at the extreme offshore end of the Kumano basin. Sites C0006 and C0007 (Exp. 316) targeted the main frontal thrust at the edge of the accretionary prism, which was only reached at site C0007. C0008 (Exp. 316) examined the slope basin ∼ 1 km seaward of the megasplay fault. C0011 (Exp. 319, 322, and 333) and C0012 (Exp. 322 and 333) drilled the Philippine Sea plate seaward of the deformation front.
The studied core samples come from site C0001 (Fig. 1c). At this site, sediments have been classified into two units separated by an unconformity at 207 m below sea floor (mbsf) and a ∼ 1 Myr hiatus. Unit I represents Quaternary (0–2.5 Ma) slope-apron sediments. Unit II represents Middle Pliocene to Late Miocene (3.5–5.5 Ma) sediments of the upper accretionary prism drilled down to 456.5 mbsf. The total clay relative abundance increases in slope sediments from ∼ 30 % at the sea floor to ∼ 60 % in the accretionary prism, in tandem with a decrease in the calcite content from ∼ 40 % to ∼ 0 % (Guo and Underwood, 2012; Kinoshita et al., 2009a). The relative abundances of quartz and plagioclase remain constant at ∼ 20 % each throughout the two units. In the clay-size fraction, smectite, illite, kaolinite, and chlorite represent ∼ 40 %, ∼ 35 %, ∼ 5 %, and ∼ 20 %, respectively. The chlorinity of pore water at C0001 decreases from 559 mM at the sea floor to 545 mM at 100 mbsf and then increases again downward. This profile indicates that a source of freshwater occurs in the first 100 mbsf of sediment. This source of freshwater progressively vanishes at greater depth.
Table 1Summary of studied samples from cores at site C0001, of structures observed, and of analyses carried out on them.
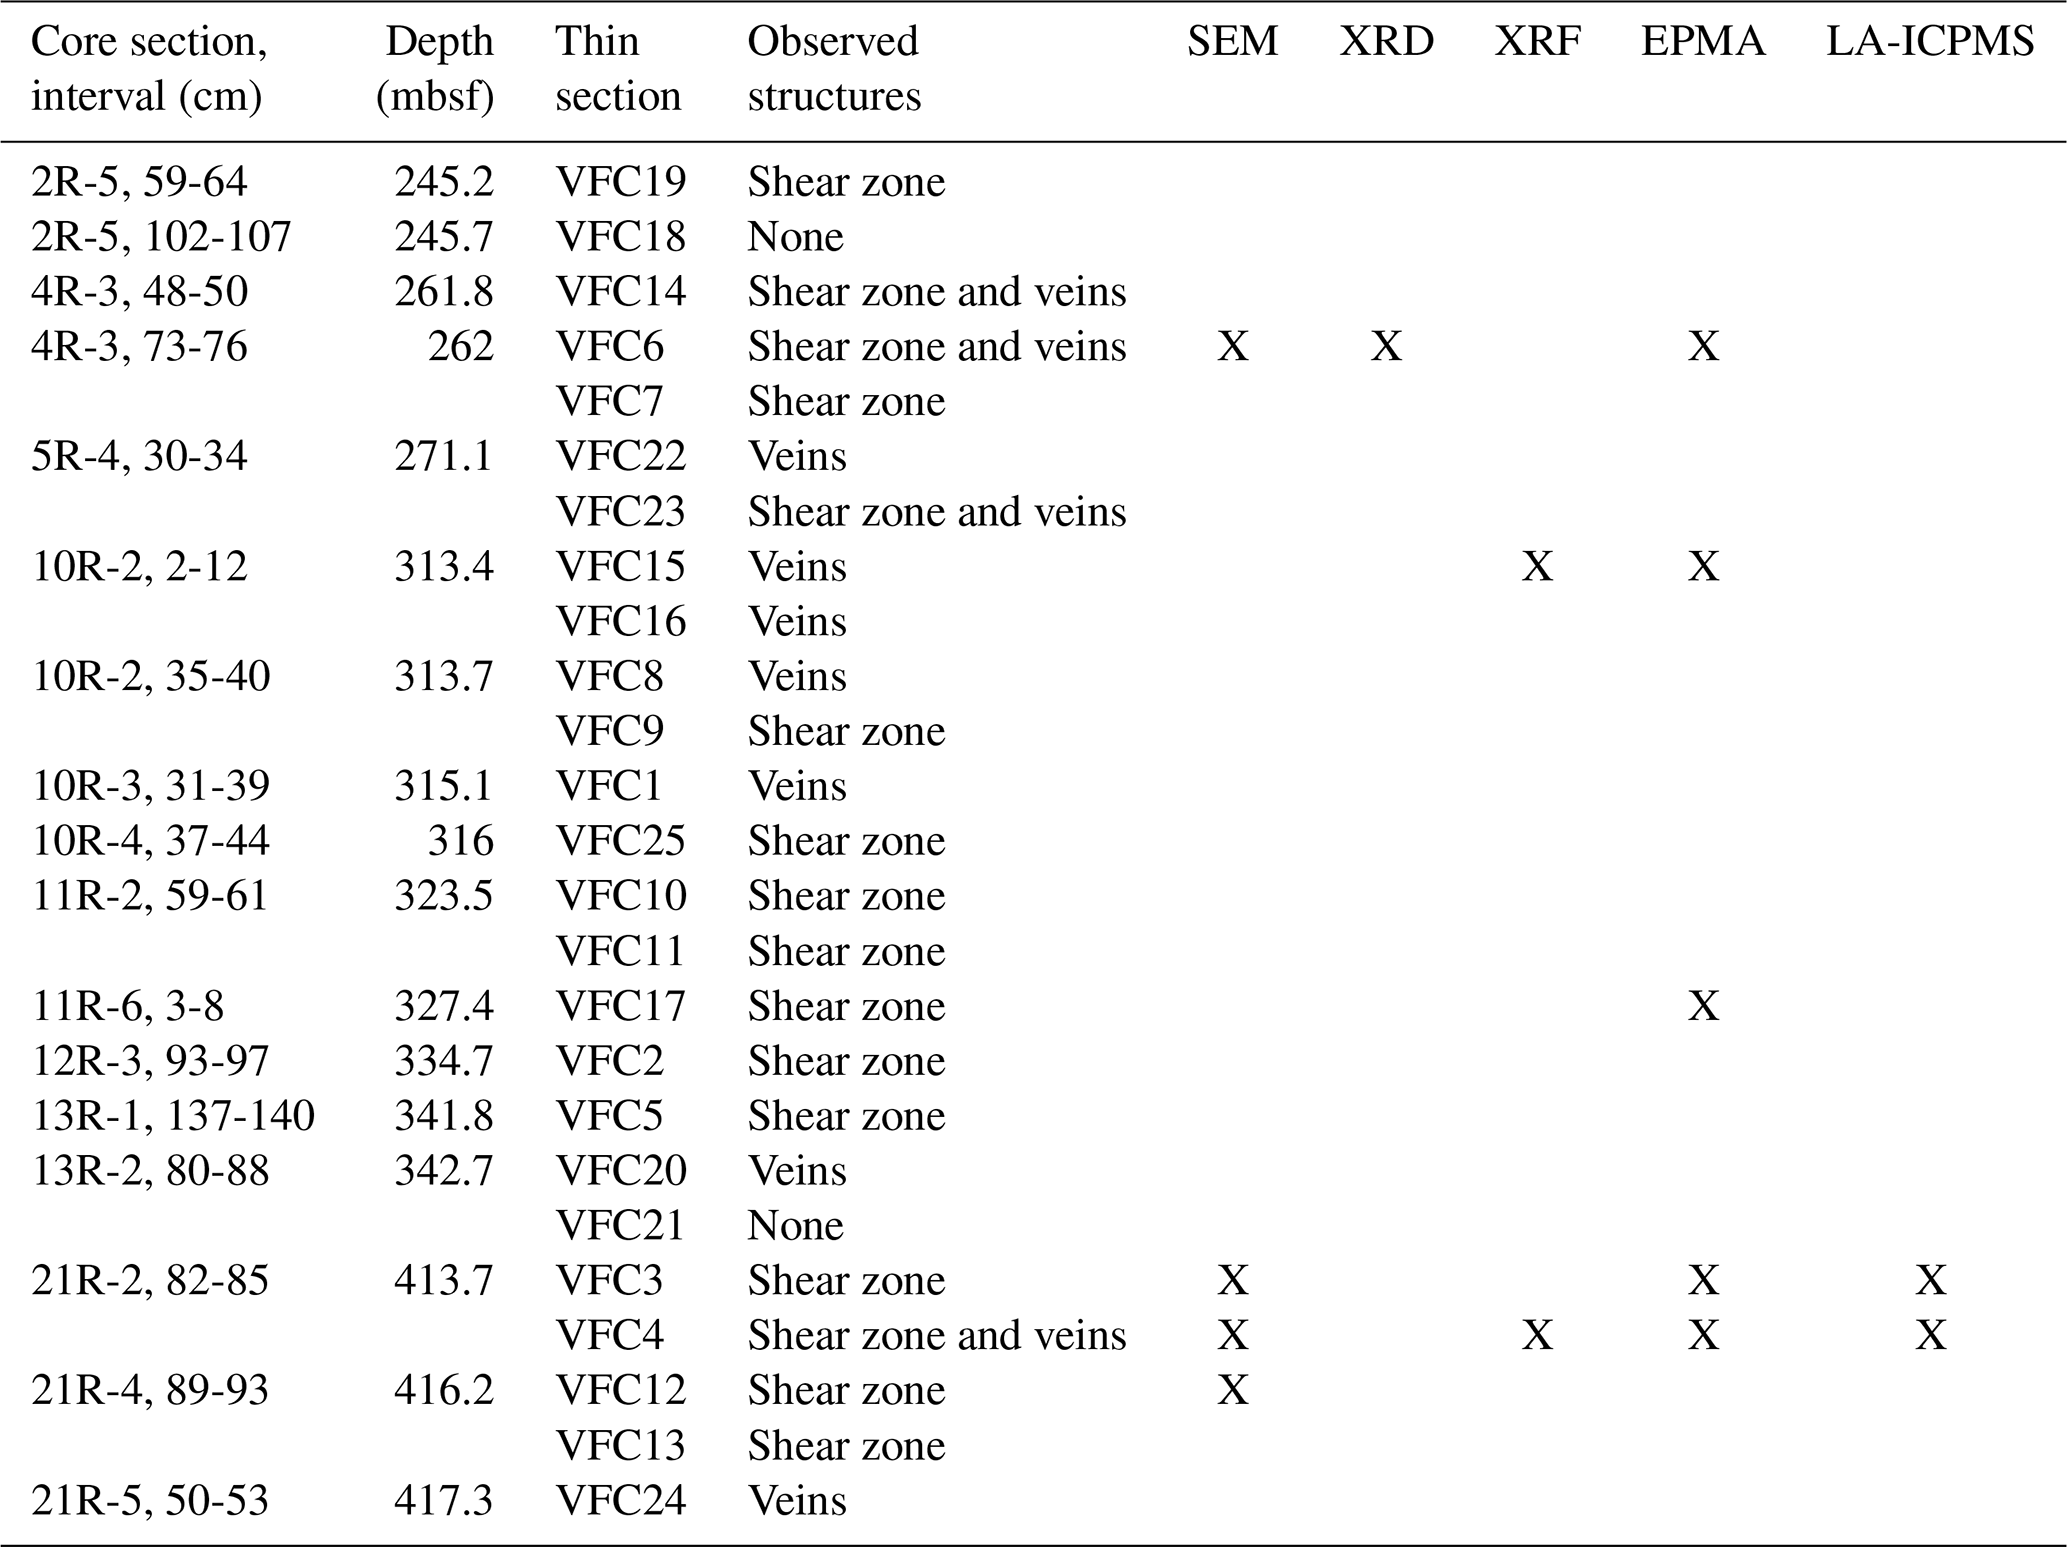
Table 2Modal proportions of pyrite in deformation bands (shear zones and veins) and in their host matrix deduced from the analysis of optical microscopic pictures.
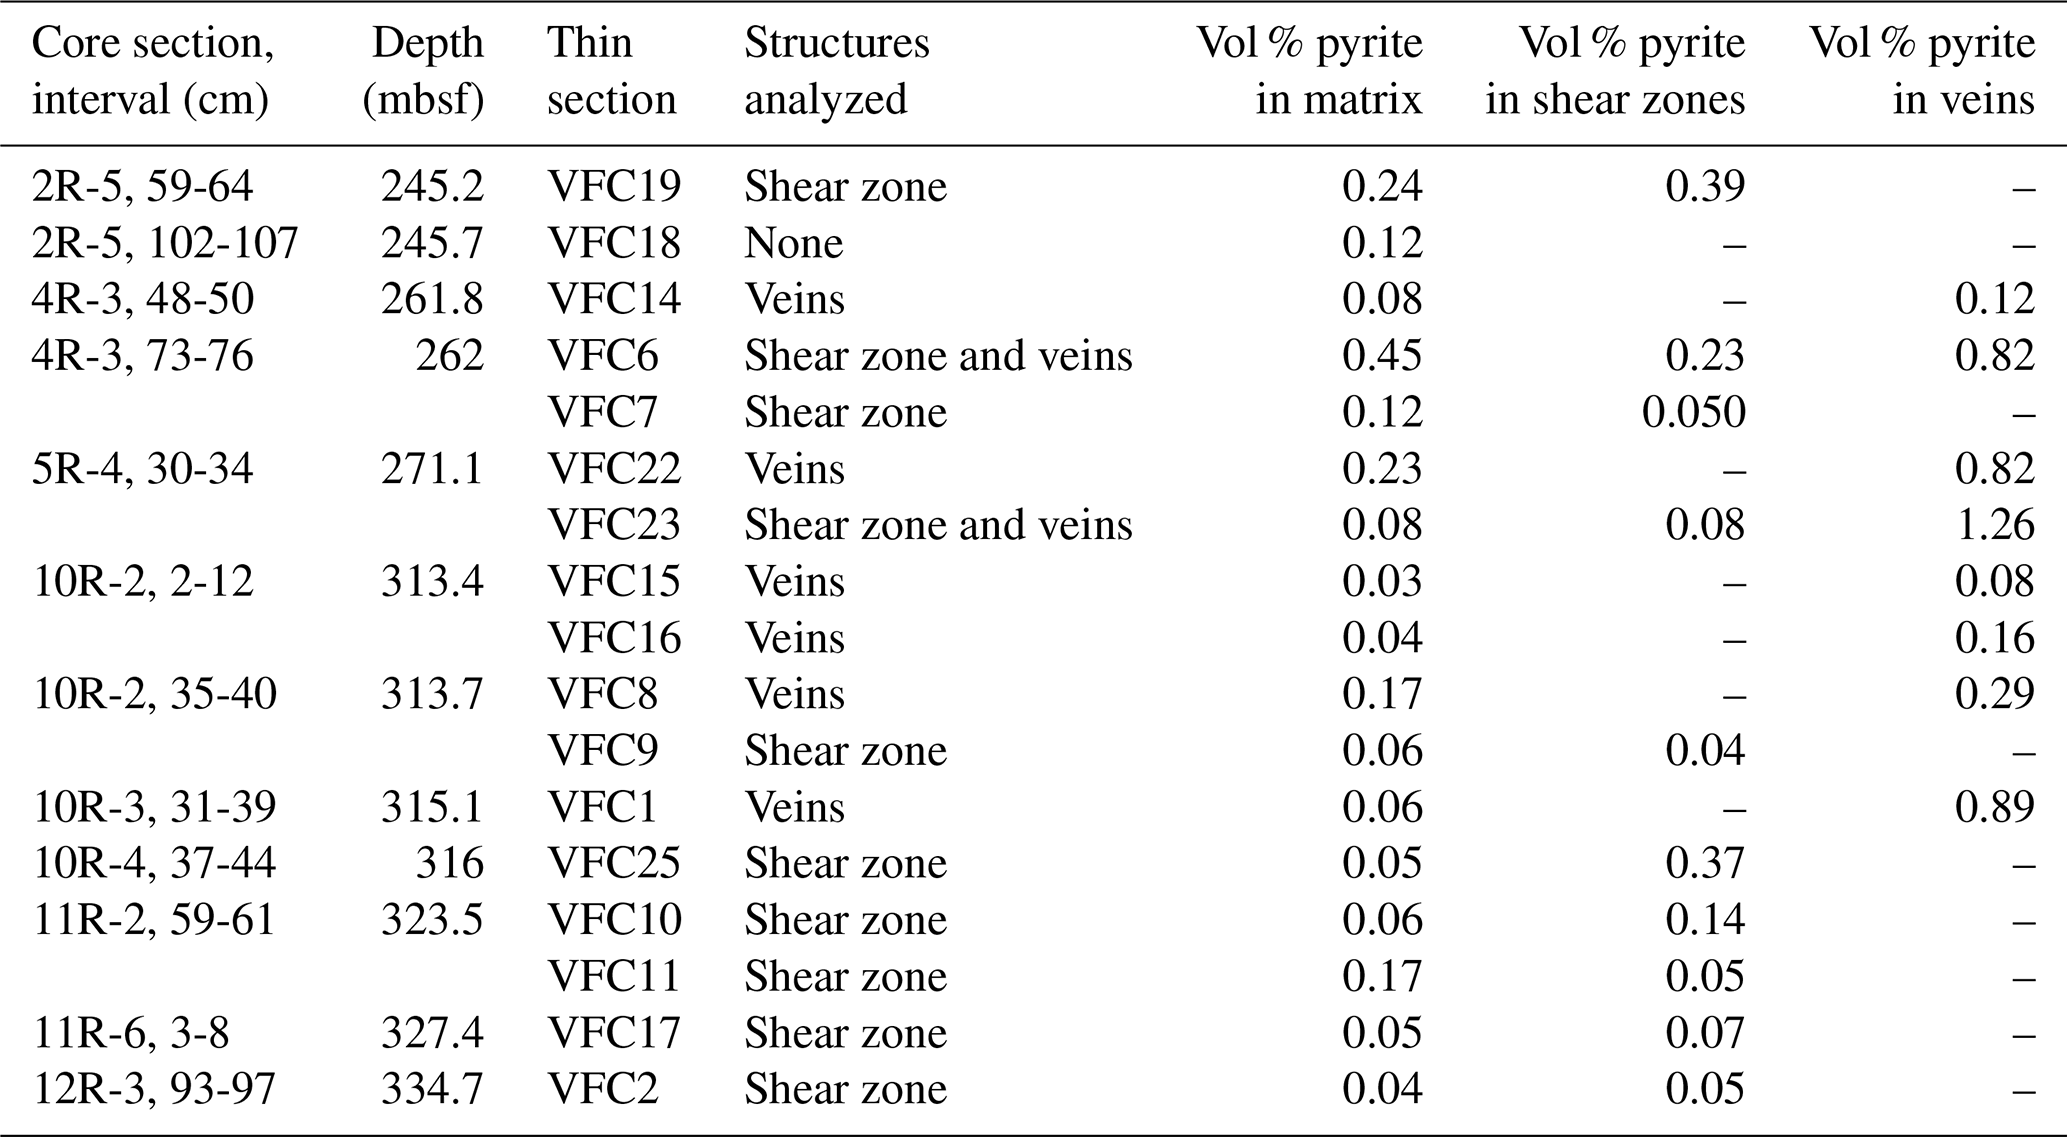
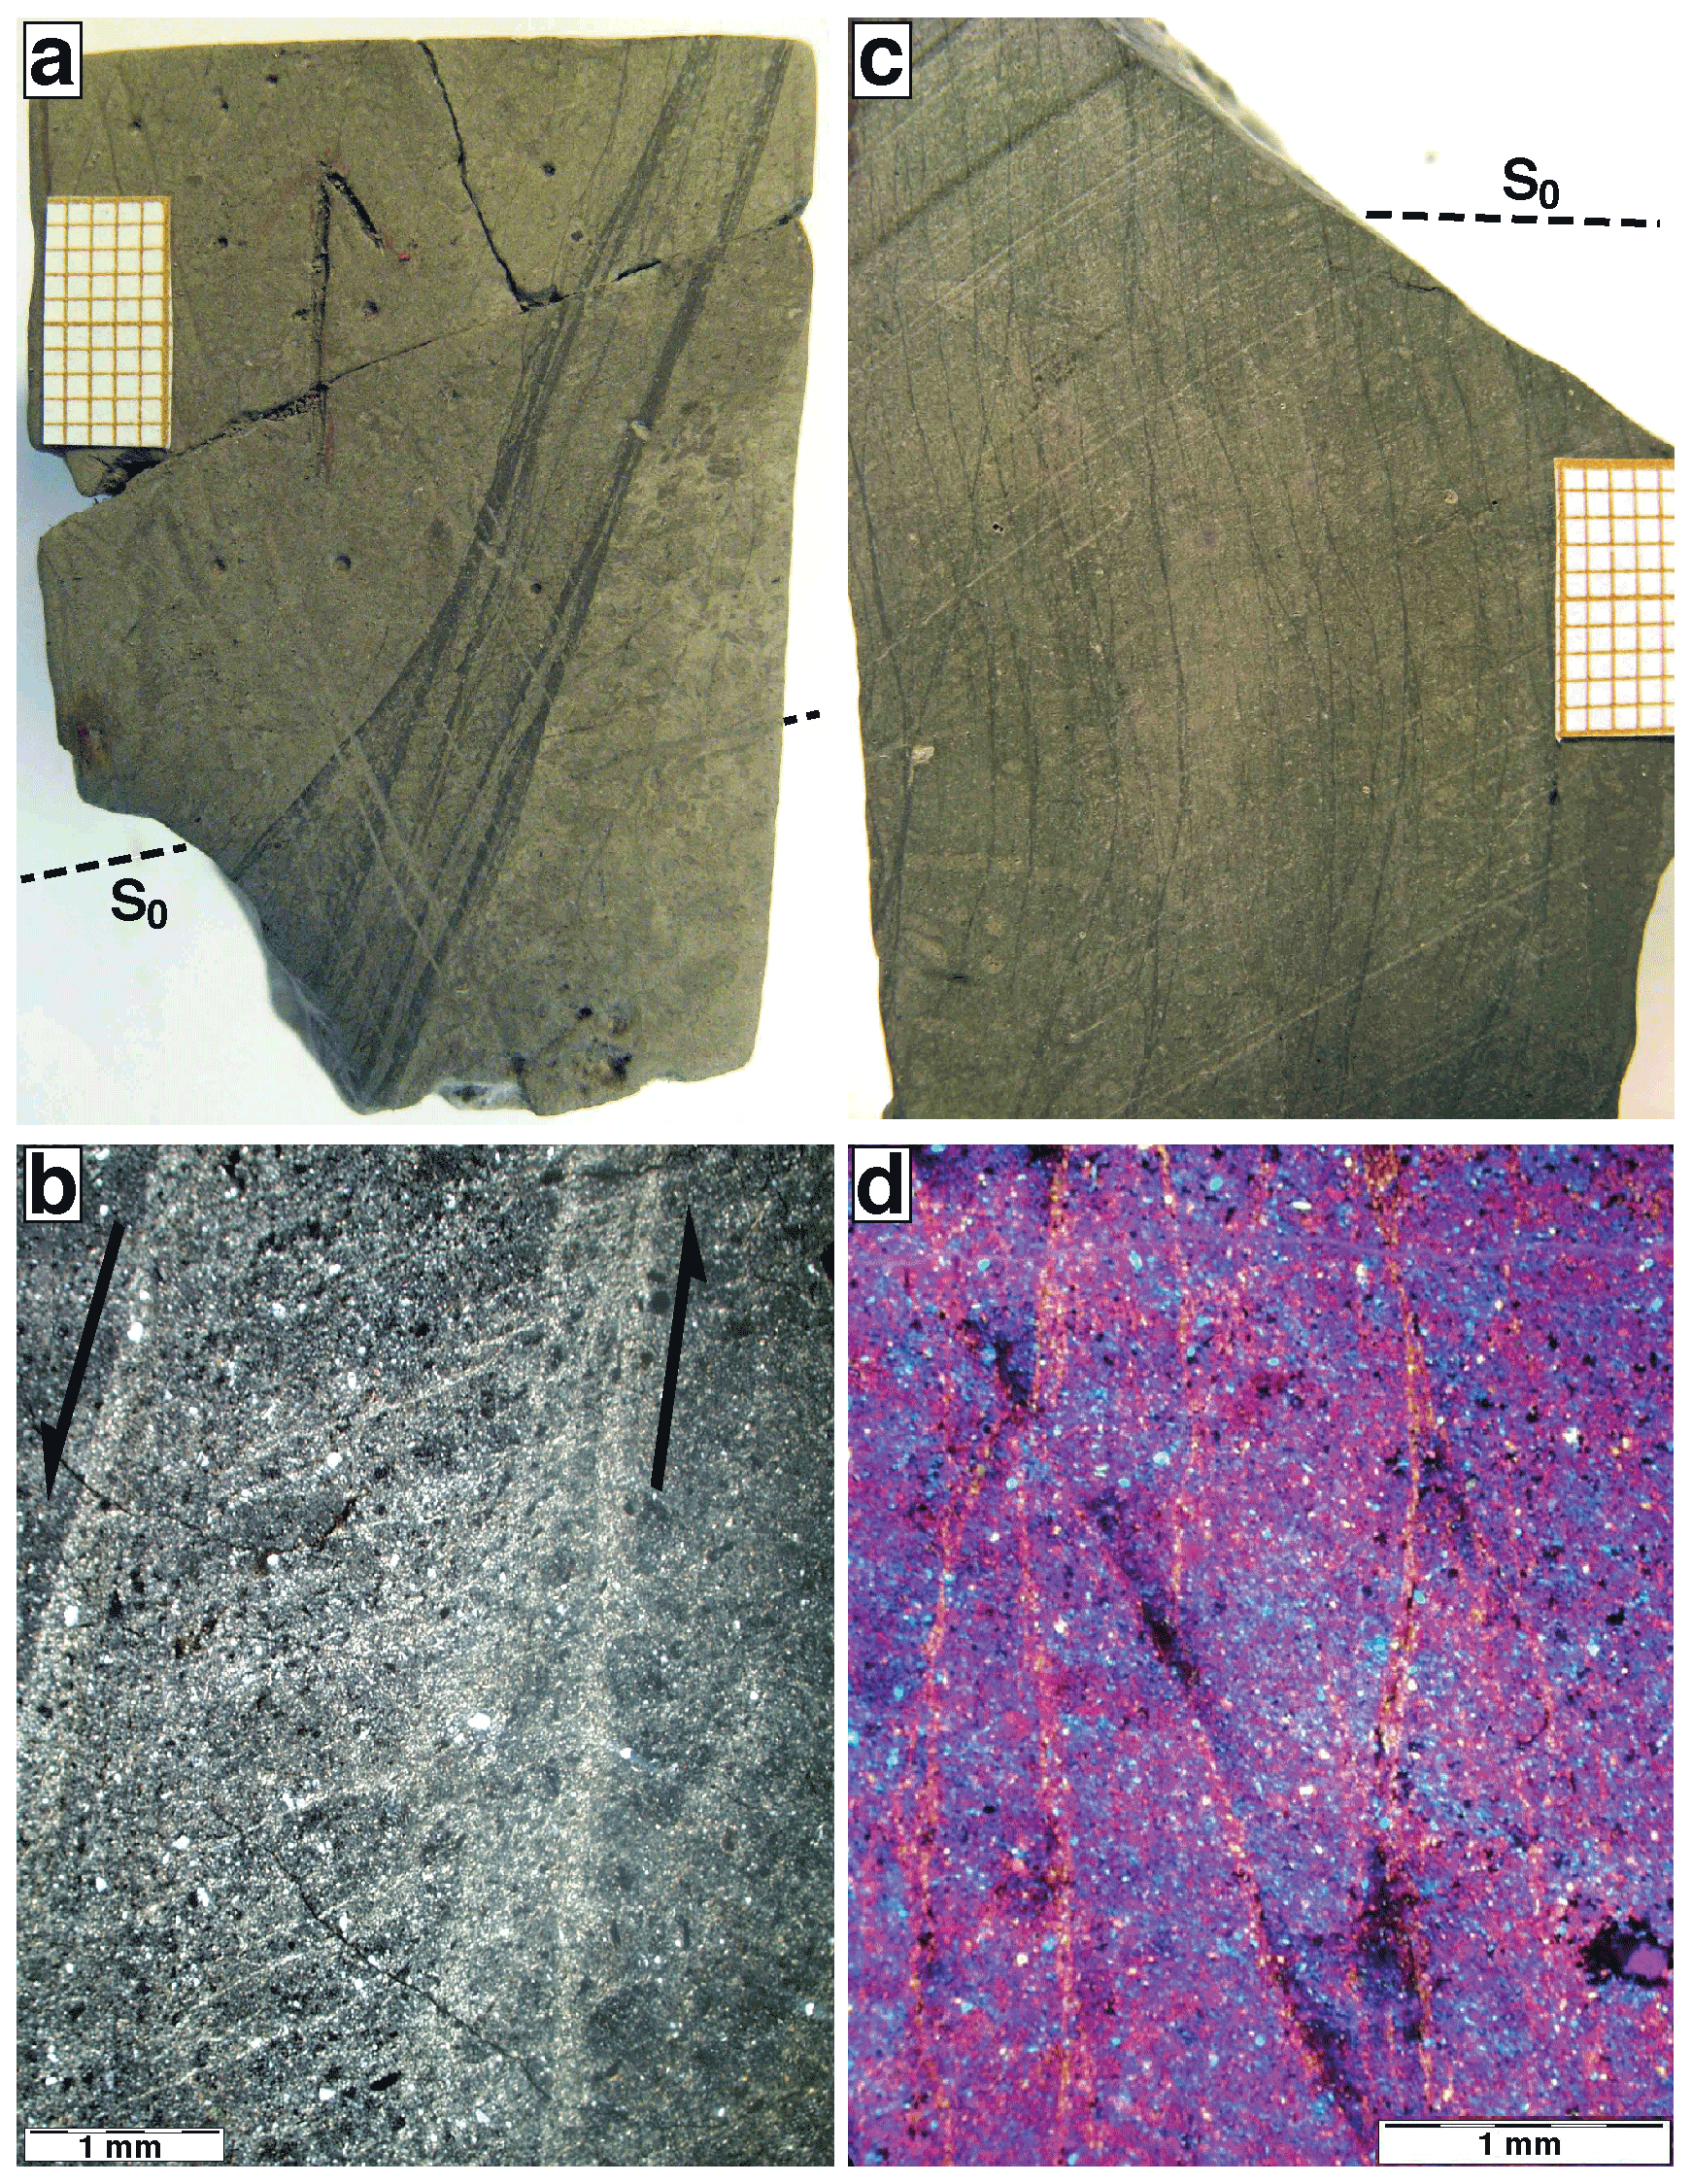
Figure 2Subvertical deformation bands observed in cores of the NanTroSEIZE transect, showing a darker color than the matrix and a crystal preferred orientation. S0 represents the stratification plane. (a, b) Macroscopic and microscopic (cross-polarized light) views of a shear zone with a normal component of slip (sample C0001 4R-3, 73-76). (c, d) Macroscopic and microscopic (cross-polarized light with a lambda plate) views of anastomosing veins (sample C0001 10R-2, 35-40). Core top is upward in all the pictures. Scale bar is 1 cm in macroscopic pictures.
The studied samples (listed in Table 1) all belong to the accretionary prism (Unit II) below the unconformity (Fig. 1c), which are thus essentially made of a clay-rich (∼ 60 %) mud containing deformation bands. These deformation bands are similar to those found at other sites along the NanTroSEIZE transect and have already been described in detail in the expedition reports of IODP legs 315, 316, 319, and 333 (Ashi et al., 2008; Henry et al., 2012; Kinoshita et al., 2009a, b, c, d, e, f; Saffer et al., 2010). For this reason, the characteristic features of these microstructures are only briefly recalled here. Deformation bands include shear fractures (Fig. 2a–b) and vein structures (Fig. 2c–d) observed in macroscopic samples from split cores. Lewis et al. (2013) separated the category of shear fractures into shear zones and faults on the basis of core sample observation. Shear zones are anastomosing, dark structures up to 1 cm thick, cutting the strata with a shear displacement of a few millimeters to centimeters (Fig. 2a). Under the microscope, shear zones appear as zones of crystallographic preferred orientations (CPOs) of phyllosilicates, which are demonstrated by their common extinction and from which the sense of shear can sometimes be reconstructed (Fig. 2b). Faults also display a millimeter-to-centimeter-scale shear displacement and phyllosilicate CPOs but are much thinner (less than 1 mm) and do not always show a visible darkening. Faults spatially evolve into shear zones or the reverse, or branch onto shear zones. This study hereafter focuses on shear zones due to their larger thickness than faults, and because Lewis et al. (2013) showed that many of the faults are in fact drilling-induced. Vein structures show the characteristic features of “ghost veins” described in soft mud sediments of continental margins worldwide (Brothers et al., 1996; Kemp, 1990; Lindsley-Griffin et al., 1990; Ohsumi and Ogawa, 2008). They appear as 1–10 cm long, ∼ 50 µm thick, dark curviplanar seams occurring in anastomosing clusters and cutting the bedding stratification at high angle (Fig. 2c). These anastomosing clusters form comb-like, 5–10 cm thick arrays subparallel to the bedding planes. In thin sections, veins also display a phyllosilicate CPO parallel to the vein walls, as do shear fractures, but no or little shear displacement (Fig. 2d). Such vein arrays have been interpreted as dewatering structures occurring during the passage of earthquake waves in the soft sediment (Brothers et al., 1996; Hanamura and Ogawa, 1993), or more recently as due to shear waves associated with density, debris flows, landslides, or faulting (Ohsumi and Ogawa, 2008).
Beside the phyllosilicate CPO, the main textural difference between deformation bands and their host mudrock matrix is a pore space reduction (evidenced by X-ray tomography scanning and field-emission secondary electron microscopy) indicating compaction, and sometimes a subtle grain size reduction (Milliken and Reed, 2010; Ujiie et al., 2004). Deformation bands are found in all the sedimentary units of the Nankai accretionary prism. They are, however, scarce in sediments of the Kumano forearc basin or in slope sediments (≤ 10 occurrences per 10 m of core, Fig. 1c), and much more abundant in accreted sediments (locally ≫ 30 occurrences per 10 m of core). This indicates that the majority of the deformation structures formed in the accretionary prism before the deposition of slope-apron sediments, i.e., before 2.5 Ma.
A summary of deformation bands sampled in cores from site C0001 is provided in Table 1, together with the analyses performed on them. In a first step, standard 30 µm thick polished thin sections were cut from core samples containing deformation bands. Petrological observations were carried out on all the samples with optical microscopy, and on four samples with a scanning electron microscope (SEM) at Paris VI University. The modal proportions of opaque minerals in deformation bands and host rocks were estimated from the analysis of optical microscopic images in reflected light using the ImageJ software.
3.1 X-ray diffraction
One shear zone sample (4R-3, 73-76) was found to be large enough to be analyzed by X-ray diffraction (XRD), in order to compare the nature of its clay fraction relative to that of the host matrix. To do so, powders of material were collected by scrapping the shear zone structure and the host matrix, in the rock slab previously used for the preparation of the thin section. The powders were decarbonated and aqueous suspensions were prepared in a solution of 0.5 M NaCl in order to saturate clay minerals with Na. Oriented slides were prepared by drying at room temperature aqueous suspensions on monocrystalline silicon slides to obtain an air-dried (AD) preparation. Ethylene-glycol (EG) solvation of the samples was achieved by exposing them to EG vapor at 70 ∘C for a minimum of 12 h. XRD patterns were recorded on the AD and EG preparations using a Bruker D8 diffractometer equipped with an MHG Messtechnik humidity controller coupled to an Anton Paar CHC+ chamber. Intensities were measured with a SolXE Si(Li) solid-state detector (Baltic Scientific Instruments) for 10 s per 0.04∘2θ step over the 2–50∘2θ Cu Kα angular range. Divergence slits, the two Soller slits, the antiscatter, and resolution slits were 0.3, 2.3, 0.3, and 0.1∘, respectively. Samples were kept at 23 ∘C and a constant 40 % relative humidity (RH) in the CHC+ chamber during the whole data collection. RH was continuously monitored with a hygrometer (uncertainty of ∼ 2 % RH) located close to the sample.
3.2 Major-element maps and quantitative analyses
Major- and minor-element analyses were carried out on some of the polished thin sections. Element maps were performed on two samples with an X-ray fluorescence (XRF) spectrometer at Joseph Fourier University in Grenoble (France) to map major elements on large sample surfaces, and with the SEM to map major and minor elements on smaller surfaces. On five shear zone and vein samples, quantitative analyses of eight elements were then performed using a CAMECA SX100 electron probe micro analyzer (EPMA) at Paris VI University. The EPMA was tuned at 15 kV and 10 nA, with a beam focused at 3 µm; a 5 s counting time for Na (measured first), Si, and K; and a 10 s counting time for other elements. The CAMECA set of standards (synthetic and natural minerals or oxides) was used for calibration. The correction methods of Bence and Albee (1968) were used to convert the raw intensity data to weight percent oxides. Analytical uncertainty is 1 %–2 % for Si, Al, Fe, and K; 5 %–15 % for Na, Mg, Ca, and Ti; and 50 %–100 % for Mn, P, and Cr. EPMA analyses were performed as profiles across planar deformation bands, at 3 to 14 µm intervals between each measurement depending on the thickness of the structure. To focus on the analysis of the clay-size fraction of the sediment, the locations of analyzed spots were then visually checked to exclude analyses in individual mineral grains. The remaining analyses were filtered to further exclude quartz or plagioclase (SiO2 + Al2O3 > 80 wt % and sum of volatile elements < 2 wt %), calcite (CaO > 40 wt %), sulfides or oxides (FeO or TiO2 > 30 wt %), and organic matter (sum of major elements < 30 wt %). This filtering resulted in the removal of 10 % to 21 % of the data depending on the profile.
3.3 Trace-element analyses
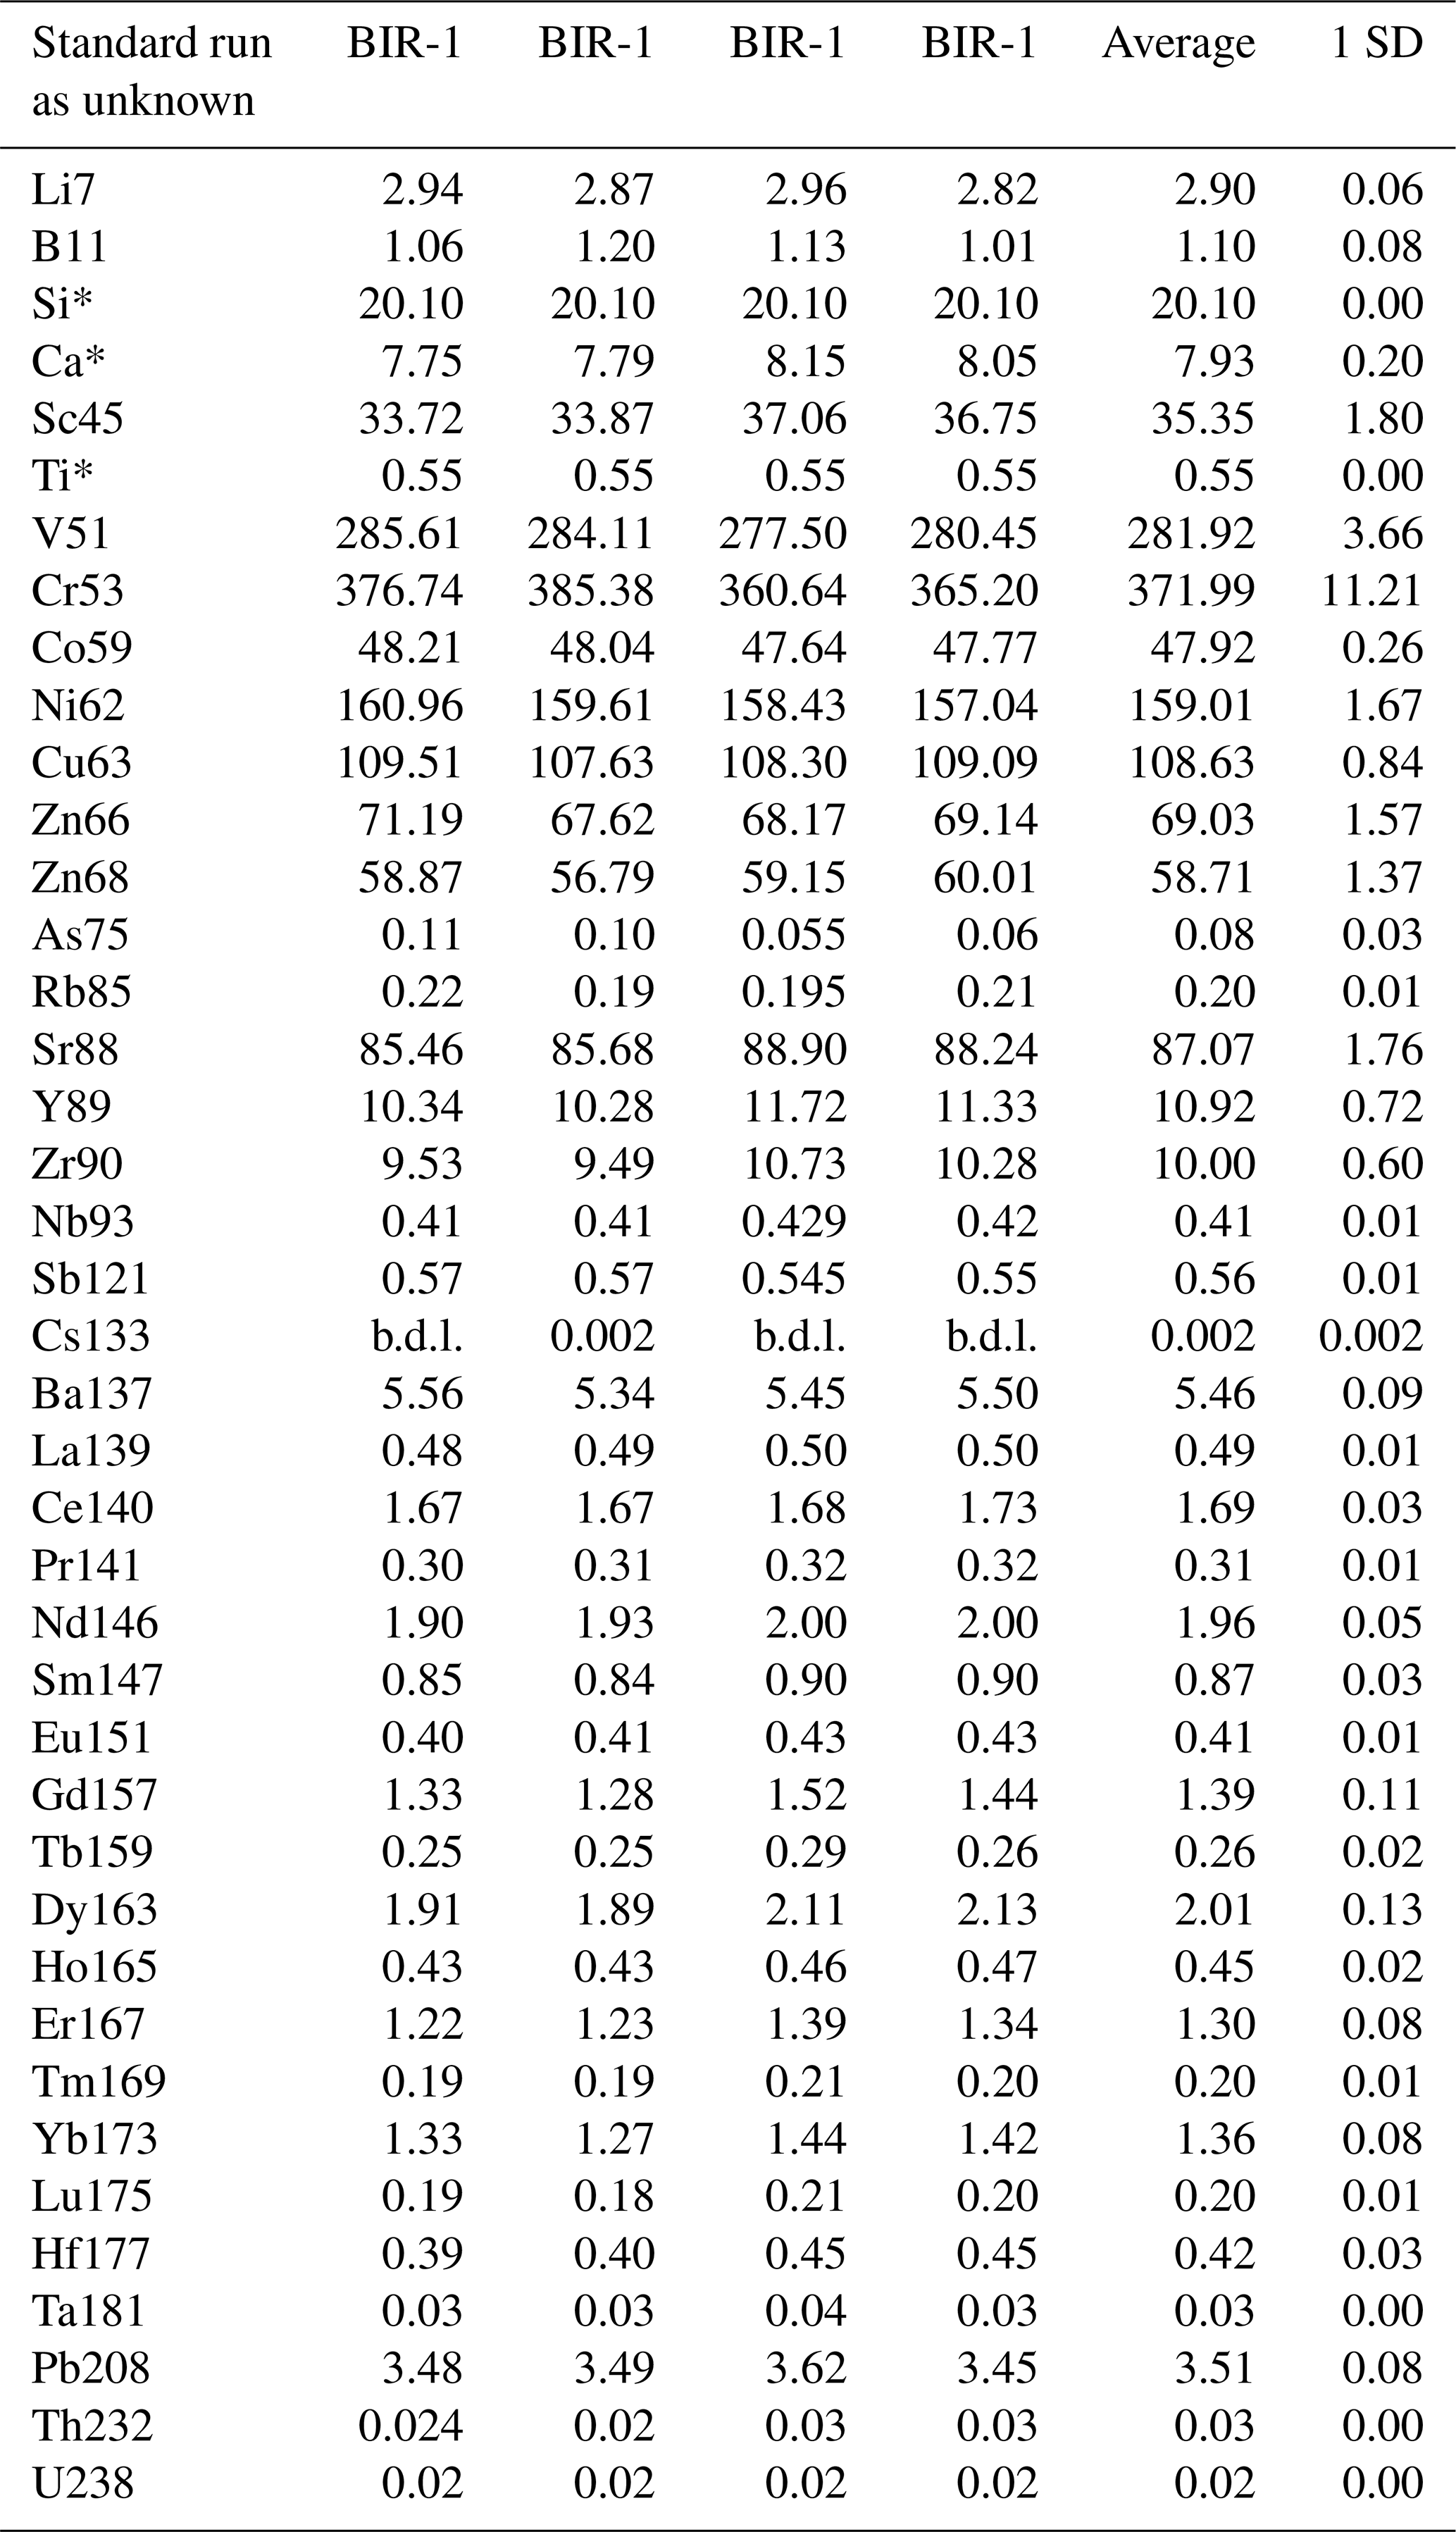
After major-element analyses, one of the samples (21R-2, 82-85) was further selected for in situ measurements of trace-element concentrations. Those measurements were conducted on the rock slabs used for thin section preparation (VFC3 and VFC4). In situ trace-element concentrations were determined at Montpellier 2 University on a Thermo Finnigan Element 2 high-resolution inductively coupled plasma mass spectrometer (HR-ICPMS) using a single-collector double-focusing sector field Element XR (eXtended Range) coupled with laser ablation (LA) system, a Geolas (Microlas) automated platform housing a 193 nm Compex 102 laser from LambdaPhysik. The spot size was set to 102 µm and therefore included multiple mineral grains. Oxide level, measured using the ThO Th ratio, was below 0.7 %. Silicium 29 was used as internal standard. For each zone (matrix, shear zones, and veins), 29Si was calibrated from the mean value of microprobe analyses in the same zone. Concentrations were calibrated against the NIST 612 rhyolitic glass using the values given in Pearce et al. (1997). Data were subsequently reduced using the GLITTER software using the linear-fit-to-ratio method (Van Achterberg et al., 2001). This typically resulted in a 1 % to 15 % precision (1sigma) for most analyses, evaluated by repeated analyses of USGS reference basalt BIR-1 run as an unknown before and after sample analysis (Table A1 in Appendix). Detection limits were between < 1 and 50 ppb for most trace elements; between 0.04 and 0.5 ppm for Li, B, Cr, Ti, Zn, and As; and between 1 and 15 ppm for Ni, Ca, and Si.
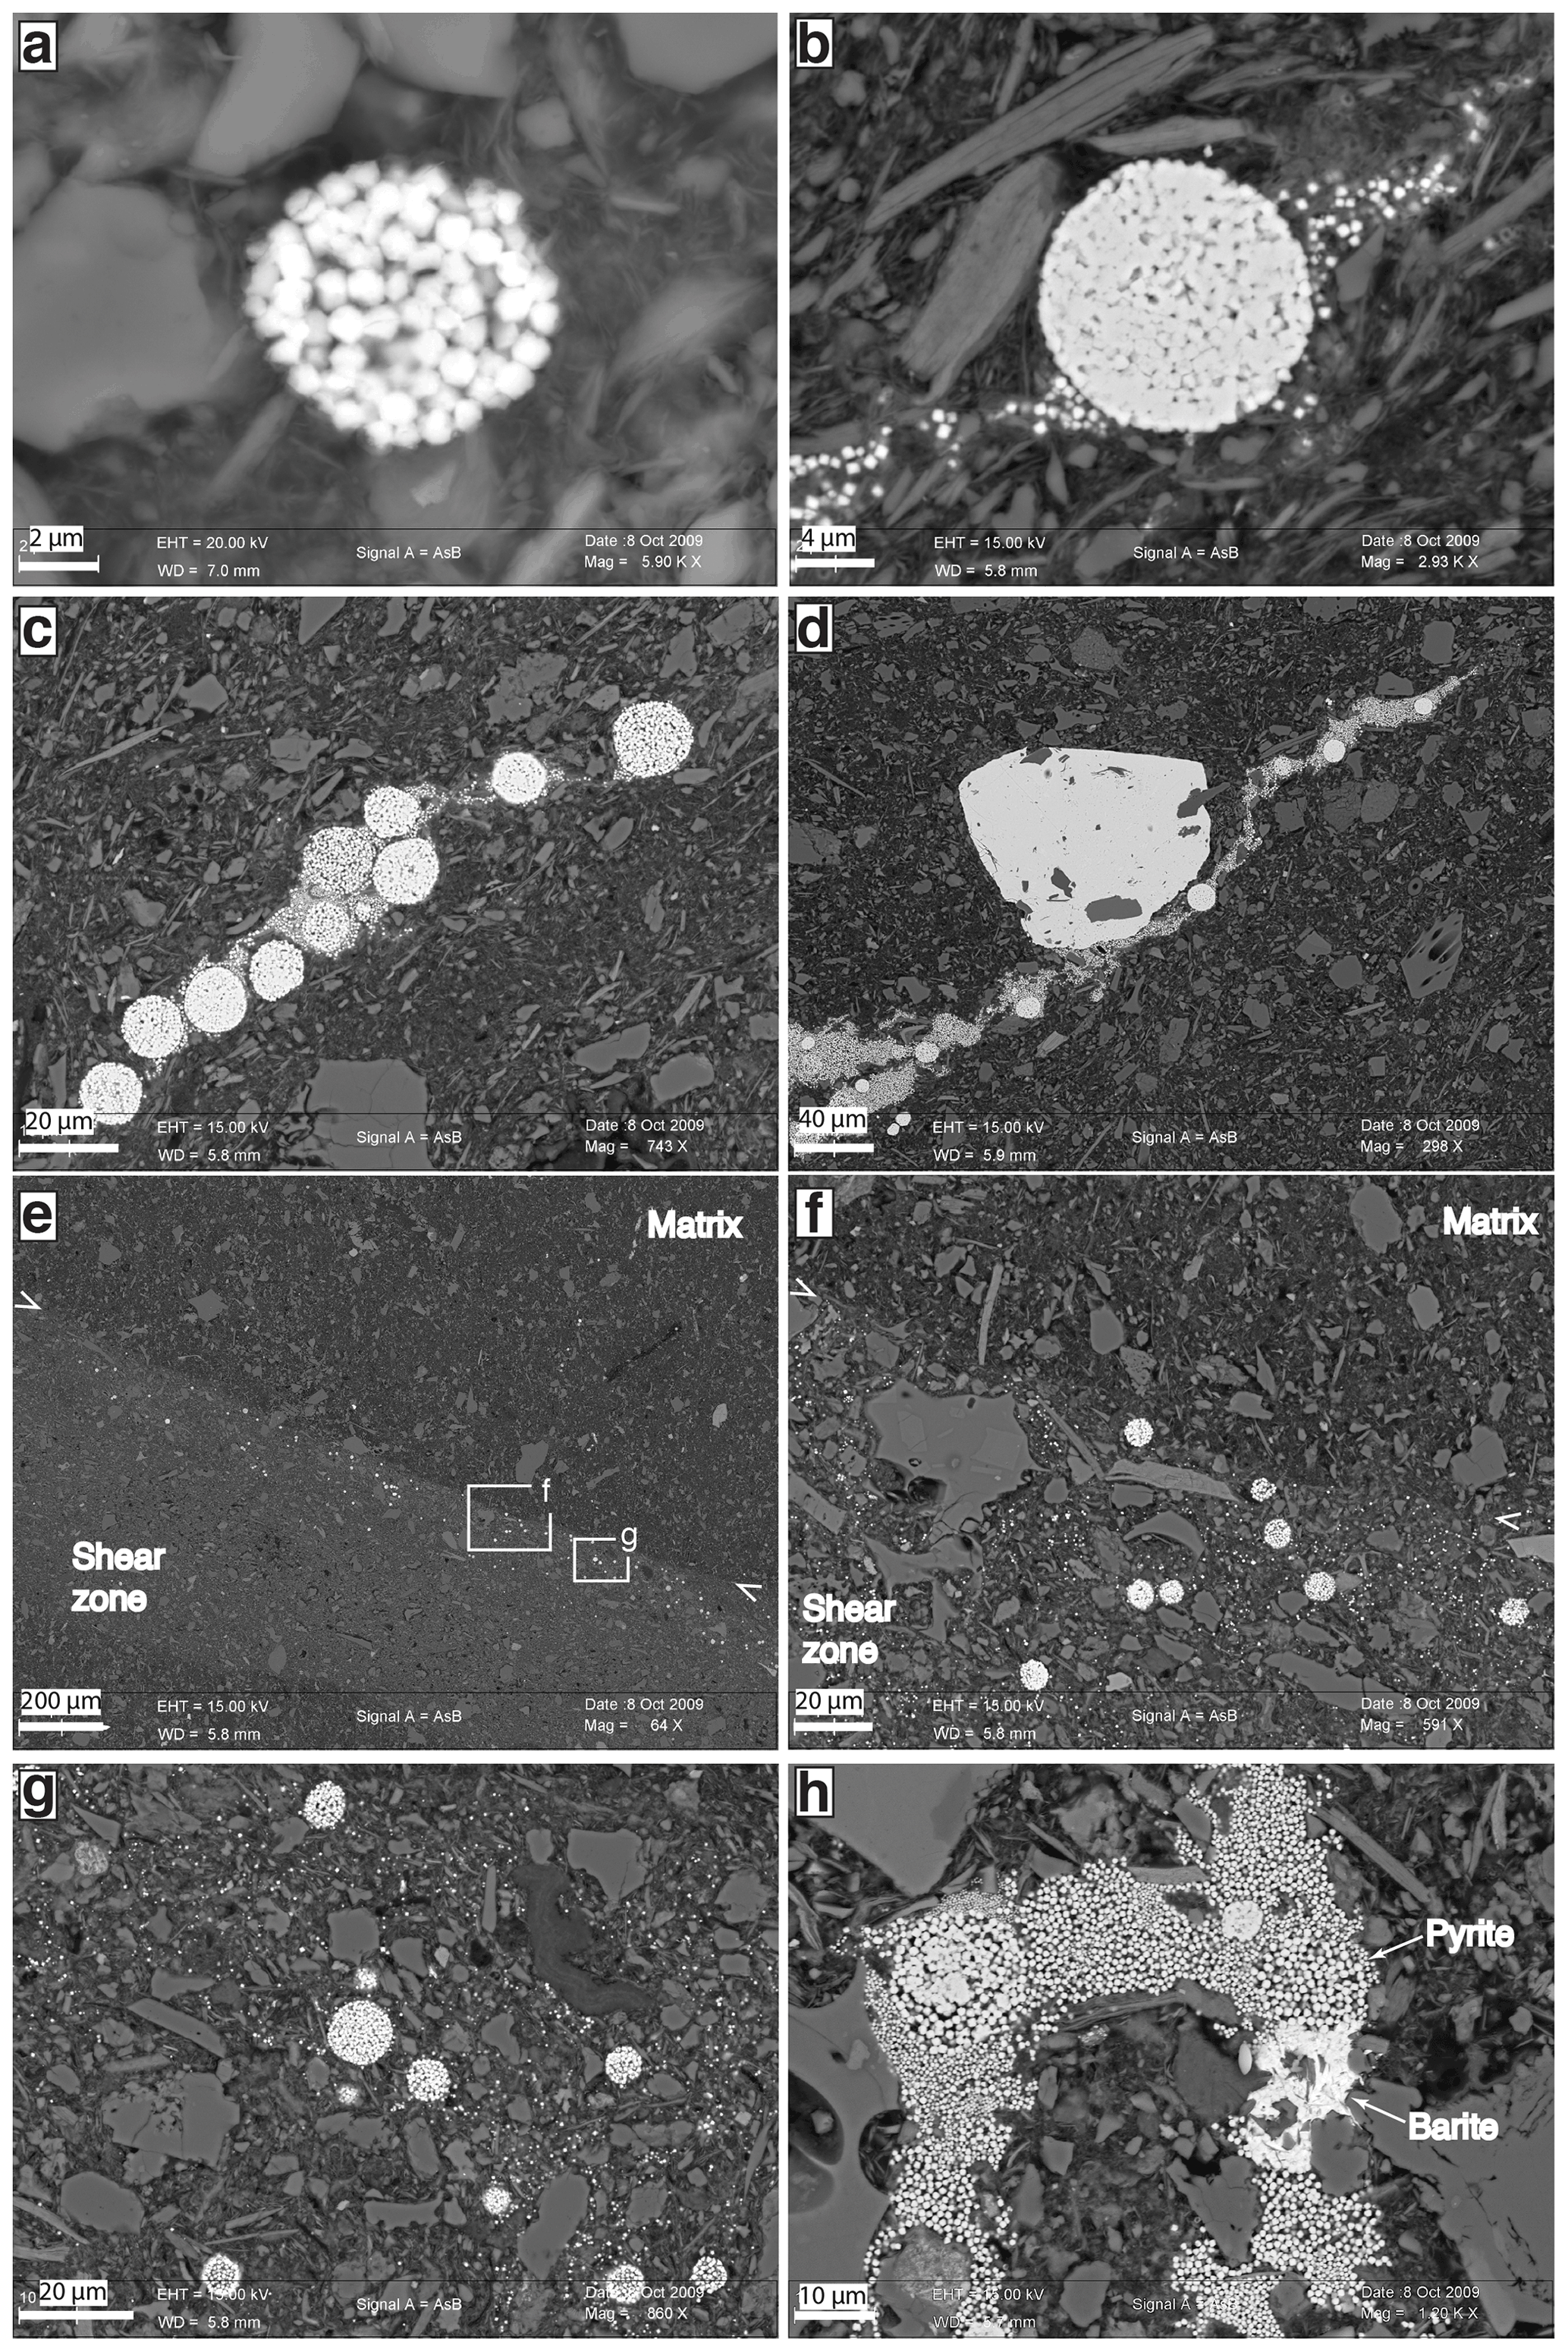
Figure 3SEM pictures of pyrite textures. (a) Pyrite framboid made of aggregated cubic pyrite microcrysts in a shear zone (sample 21R-2, 82-85). (b) Pyrite framboid in a shear zone, with pressure shadow-like tails of isolated microcrysts (4R-3, 73-76), showing that the microcryst morphology grew before and/or during deformation. (c) Same as (b) with a lower magnification. (d) Blocky euhedral pyrite macrocryst embedding particles oriented parallel to the crystallographic preferred orientation (CPO) in a shear zone, showing that blocky pyrite growth is posterior to the CPO (4R-3, 73-76). (e, f, g) Pyrite framboids and isolated cubic pyrite microcrysts in a shear zone (21R-4, 89-93). Arrows delimit the boundary between the shear zone (with a CPO of particles) and the matrix (with randomly oriented particles). Note the greater abundance of pyrite crystals in the shear zone compared to the matrix. (h) Barite flakes surrounded by pyrite microcrysts and framboids in a vein. A wider view of the structure is provided in Fig. 5 (21R-2, 82-85).
4.1 Petrographic observation
The petrographic inspection of samples revealed the presence of authigenic pyrite and barite in the sediment. Pyrite is by far the dominant authigenic mineral in all the samples. Pyrite displays two crystal morphologies, cubic microcrysts, and blocky macrocrysts. Pyrite microcrysts (≤ 0.5 µm in diameter) occur as isolated crystals or as “framboids”, i.e., circular aggregates, 2–20 µm in diameter (Fig. 3a–b). Framboids in deformation bands sometimes develop tails filled with pyrite microcrysts and resembling pressure shadows (Fig. 3b–d), which may therefore be assimilated to porphyroclastic (grown before the deformation) or porphyroblastic (grown during the deformation) microstructures (Passchier and Trouw, 1998). Blocky pyrite occurs as macrocrysts (> 50 µm in diameter) with euhedral (but never cubic) or anhedral shapes (Fig. 3d). This blocky morphology is scarce compared to the microcrystic and framboidal morphology and occurs both in the matrix and in deformation bands without a particular spatial distribution. Some blocky macrocrysts cut or seal the alignment of phyllosilicates in deformation bands (Fig. 3d) or grow at the expense of framboidal aggregates of microcrysts, which indicates a crystallization stage posterior to the deformation and also posterior to the microcrystic or framboidal morphology. As a general rule, pyrite is more abundant in deformation bands (up to 1.4 % in volume) than in their host matrix (< 0.5 vol %), the largest modal proportions being found in veins (Table 2; Fig. 4). This pyrite enrichment is in fact caused by a greater abundance of microcrysts and framboids in the deformation bands than in the sediment matrix (Figs. 3e–g, 5).
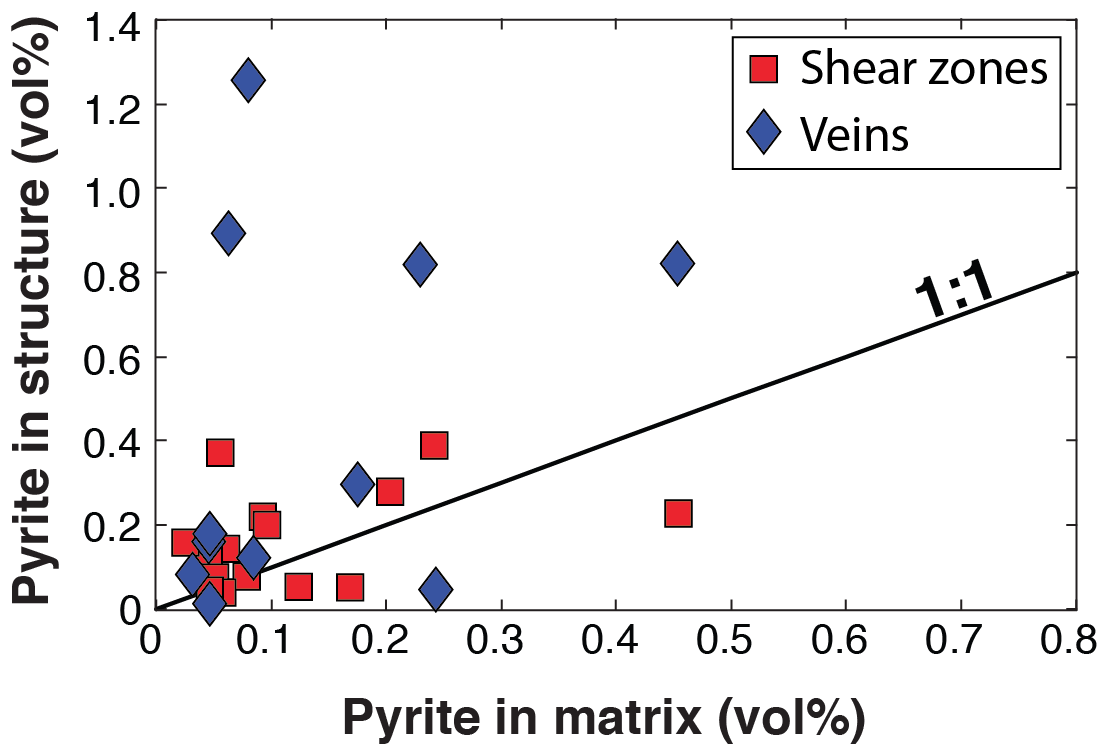
Figure 4Modal proportions of pyrite in deformation bands (shear zones and veins) relative to their host matrix (data provided in Table 2).
Barite has been observed only in one sample (21R-2, 82-85), as patches of ∼ 5 µm long flakes filling a vein, with pyrite microcrysts and framboids growing on their faces (Fig. 3h).

Figure 5Example of SEM map in a shear zone and a vein (sample 21R-2, 82-85), showing the greater modal abundance of pyrite crystals in deformation bands (represented by arrows) relative to the host sediment matrix. (a) Back-scattered electron picture. (b, c) Fe and S maps, respectively.
4.2 X-ray diffraction
Ethylene-glycol-solvated XRD spectra of the shear zone and its host matrix (sample 4R-3, 73-76) are presented in Fig. 6. The different peaks reveal the presence of chlorite, kaolinite, quartz, feldspar, and possibly vermiculite in both the shear zone and the matrix. A broad peak at 17 Å (5∘2θ) indicates the presence of smectite or illite–smectite (I/S) mixed layers in the matrix, whereas this peak is absent in the shear zone. Illite is also present in both spectra as evidenced by the sharp peak at 10 Å (9∘2θ). However, the width at half-height of the 10 Å peak is smaller in the shear zone (0.14∘2θ) than in the matrix (0.12∘2θ), indicating a greater crystallinity of illite in the shear zone than in its host sediment (Kübler, 1968).
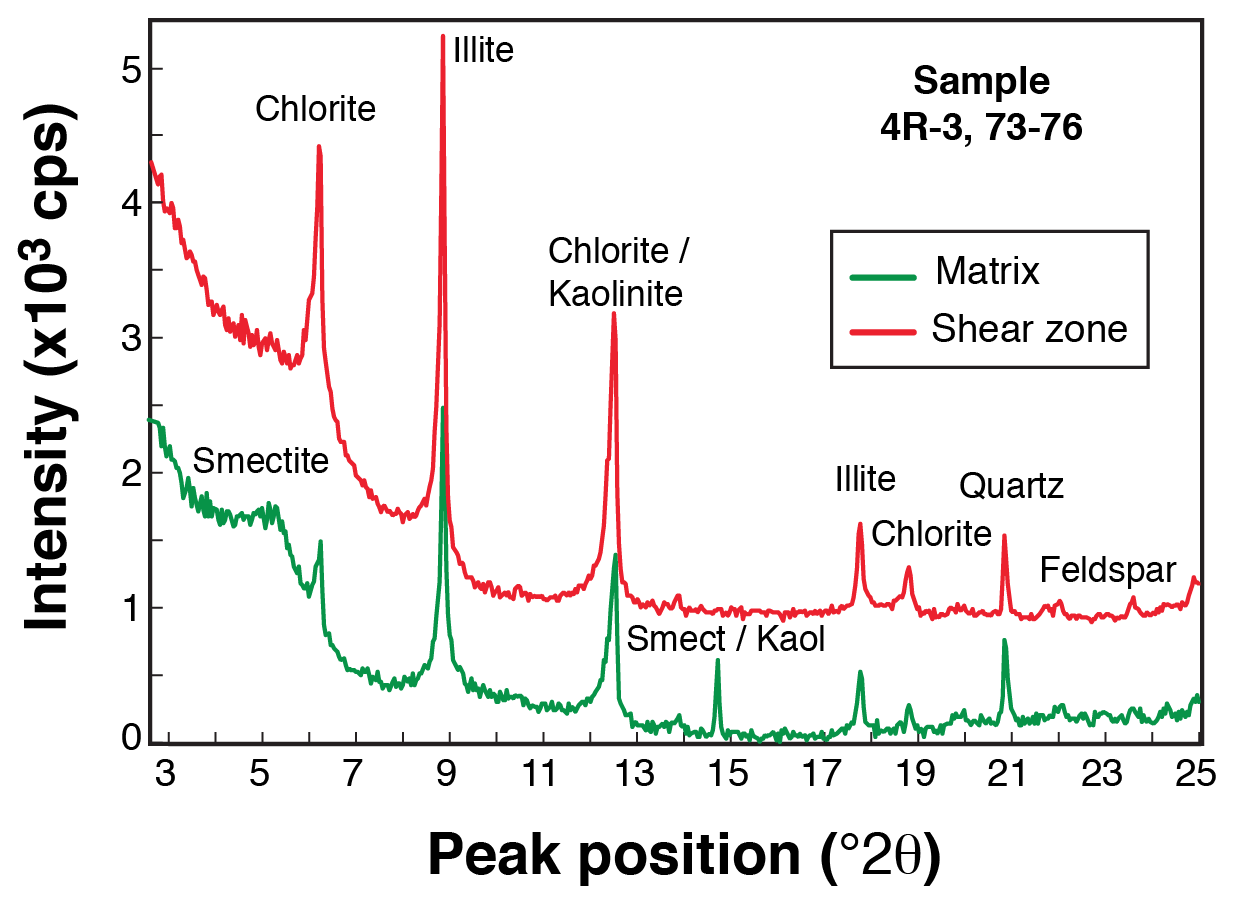
Figure 6Powder X-ray diffraction spectra of the ethylene-glycol saturated clay-size fraction extracted from a shear zone (in red) and its host matrix (in green) in sample 4R-3, 73-76.
4.3 Element repartitions
Two examples of XRF element maps, one in a shear zone and one in a vein, are provided in Fig. 7. An example of SEM element maps, displaying a shear zone cutting a vein, is also provided in Fig. 5. In addition, two examples of EPMA profiles, one in a shear zone and one in a vein, are presented in Fig. 8. Averaged values of major-element analyses are reported in Table 3 and presented in Fig. 9.
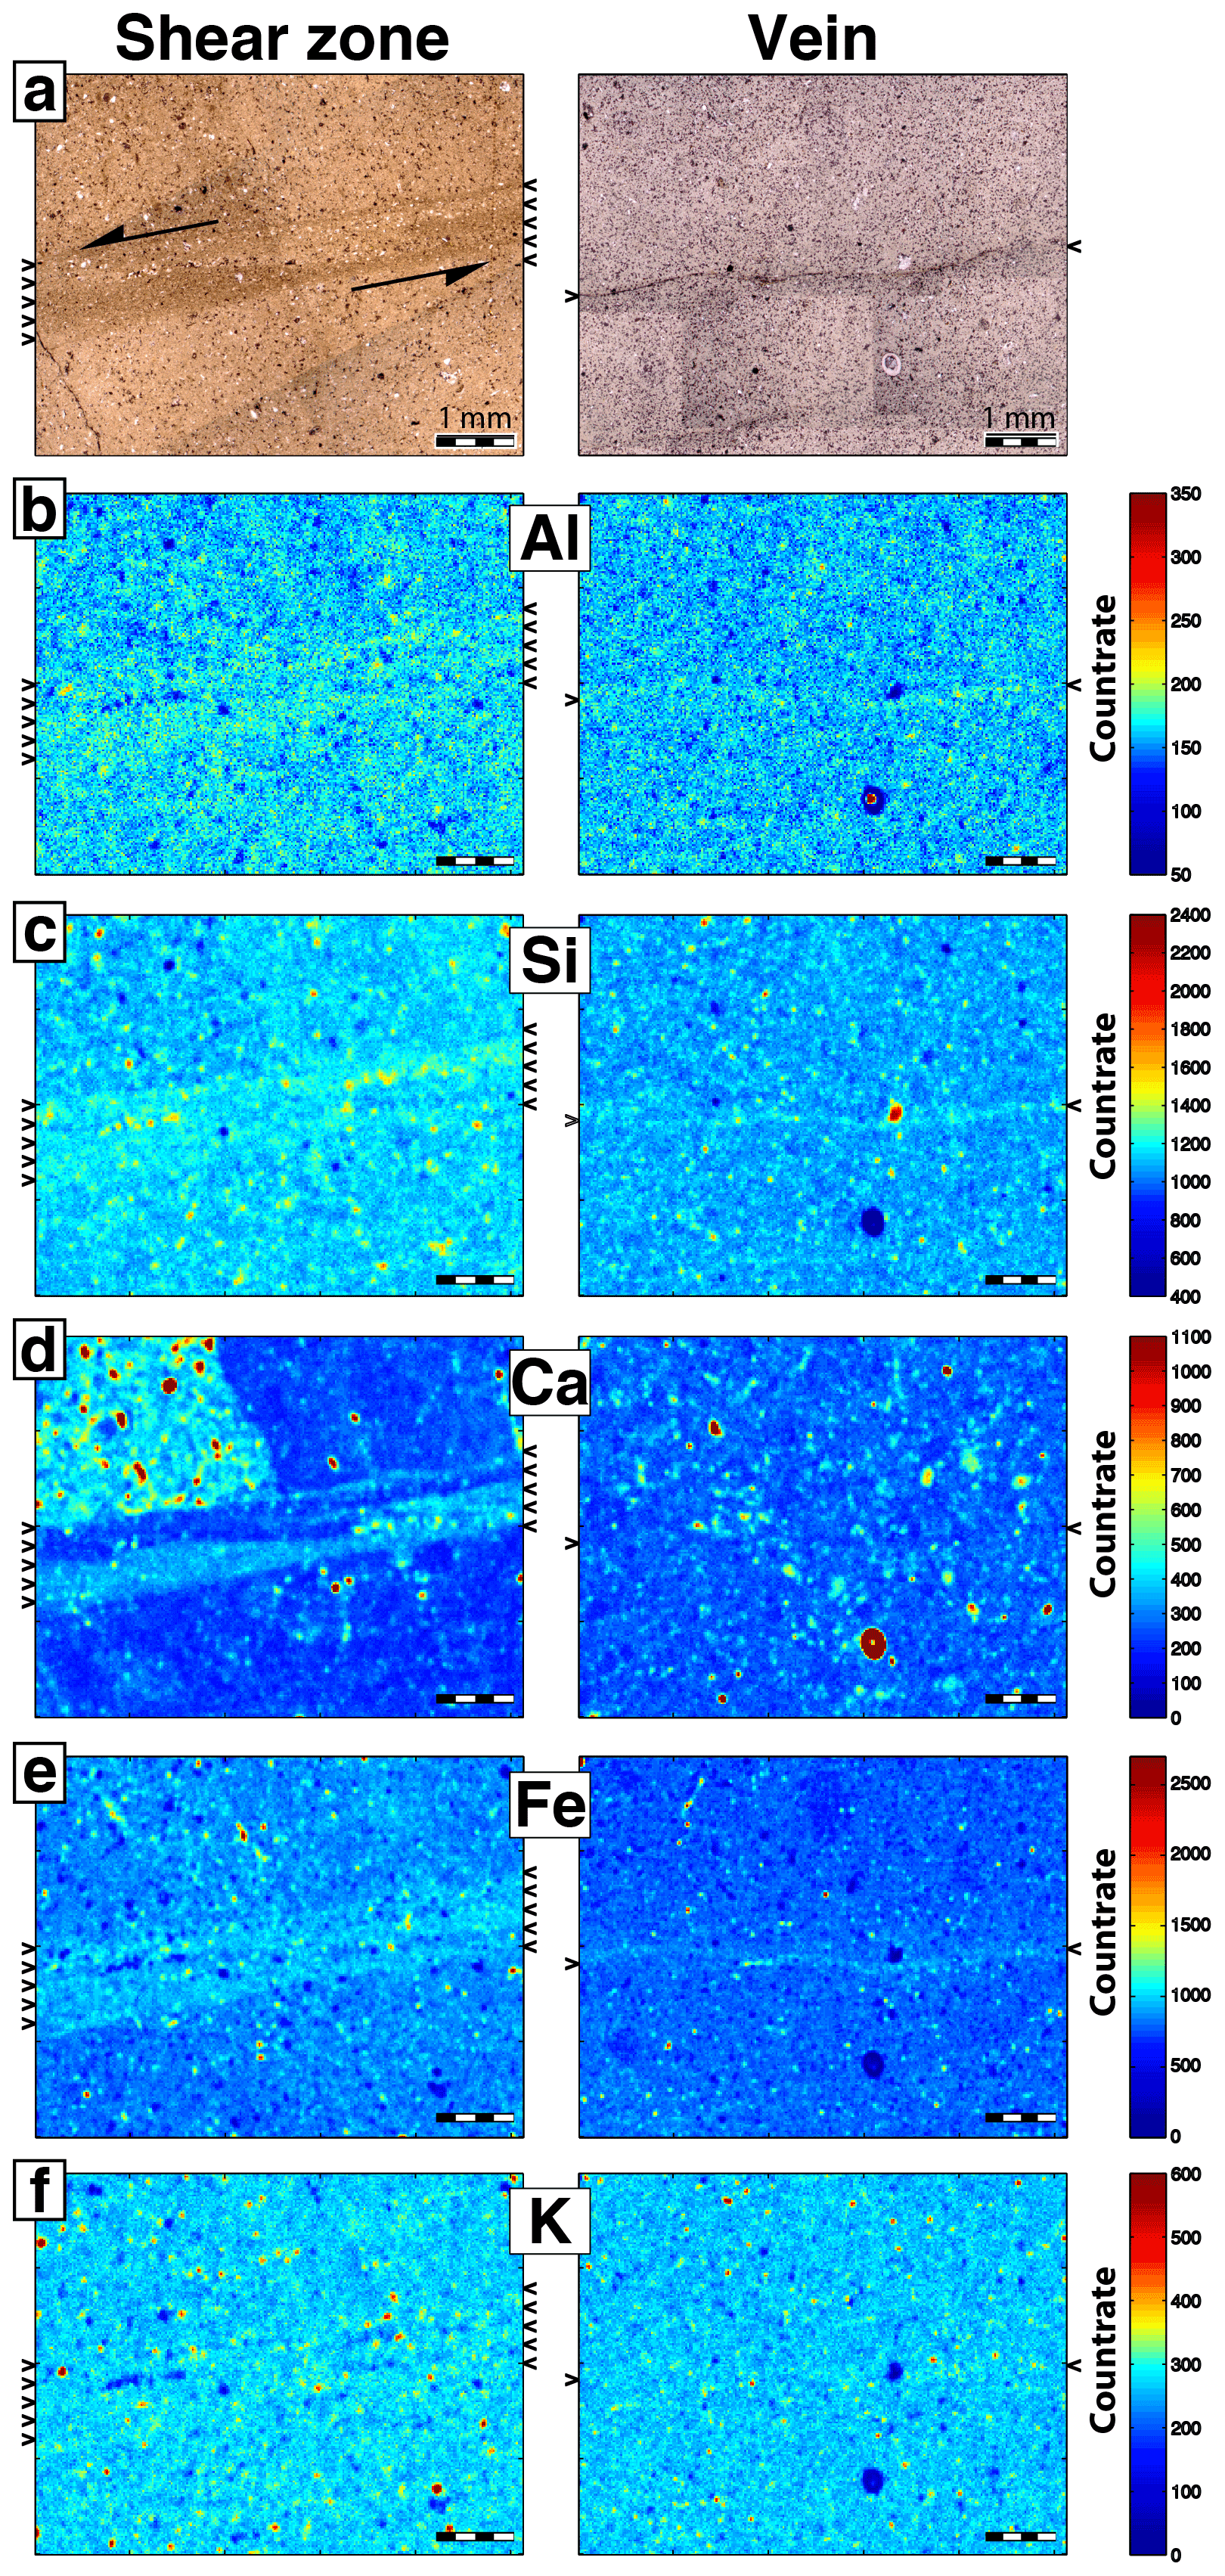
Figure 7Examples of XRF maps in a shear zone (sample 21R-2, 82-85) and a vein (10R-2, 2-12). (a) Optical microphotographs (plain light). (b–f) Al, Si, Ca, Fe, and K maps, respectively. Note the enrichment in all the analyzed elements relative to the matrix, except for Ca that is heterogeneously distributed in the shear zone and in the matrix (due to the drag of Ca-rich and Ca-poor beddings) and not enriched in the vein.
Table 3Averaged EPMA analyses of major-element concentrations of the clay-size fraction within shear zones, veins, and the host sediment matrix.
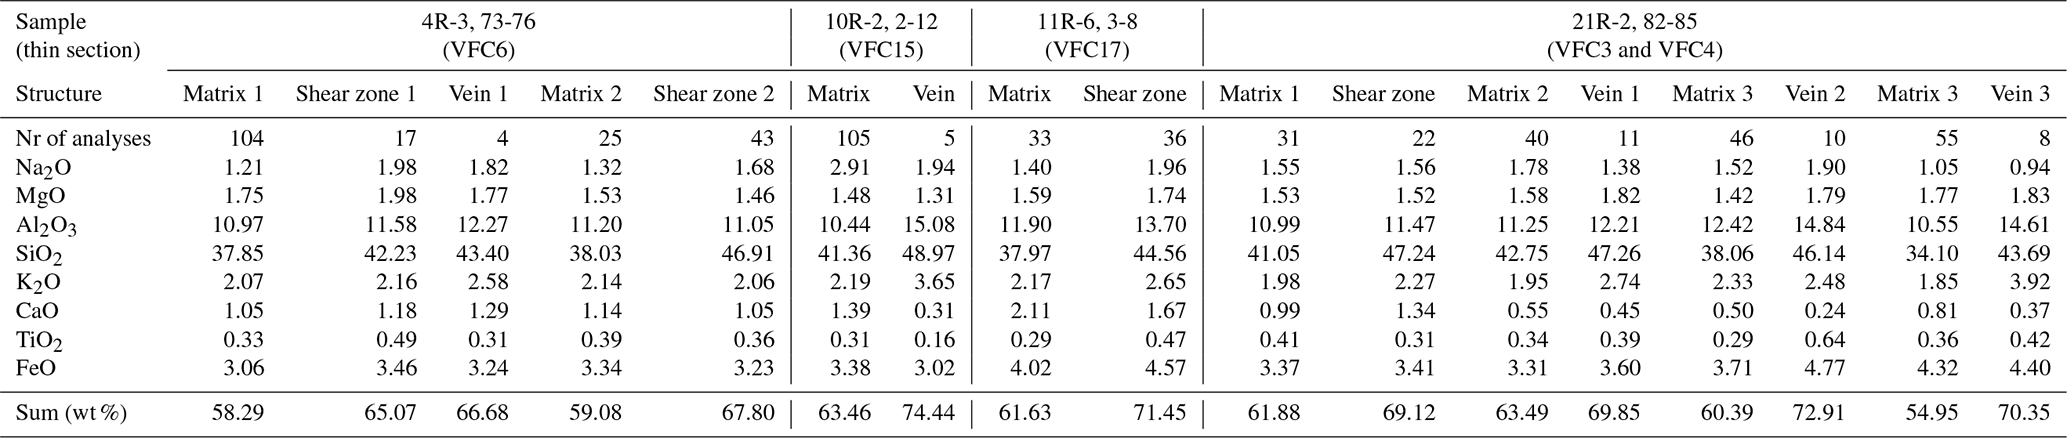
A common feature of all the maps and analyses is that major-element concentrations are generally higher in the deformation bands than in the host matrix, indicating a higher density of the material in them. This is in particular true for Al, Si, Fe, K, and S (Figs. 5, 7, 9). Within a given sample, the sum of elements is 11 %–16 % higher in shear zones and 10 %–28 % higher in veins than in the matrix, the highest values being reached in veins (Fig. 8, Table 3). The averaged sum of major elements is in the range 54.95 wt %–63.49 wt % for the clay-size fraction in the sediment matrix, whereas it is in the range 65.07 wt %–71.45 wt % for the clay-size fraction in shear zones and 66.68 wt %–72.91 wt % for the clay-size fraction in veins (Table 3). The comparison of XRF maps (Fig. 7) and EPMA analyses (Fig. 9) shows that the enrichment of Al, Si, and K observed in deformation bands is matched by an enrichment of these elements in the clay-size fraction of deformation bands. There are, however, noticeable exceptions to this general increase in major-element concentrations: the Fe enrichment of deformation bands observed in element maps (Figs. 5, 7) is not observed in the clay-size fraction (Fig. 9). This, and the correlation between Fe and S SEM maps (Fig. 5), shows that the Fe enrichment is due to the preferential growth of authigenic pyrite in deformation bands and does not occur in the clay-size fraction. Calcium is heterogeneously distributed in shear zones and is depleted in veins relative to the matrix (Figs. 7, 9). Sodium, Ti, and Mg do not show any obvious variation between the matrix and deformation bands (Fig. 9).
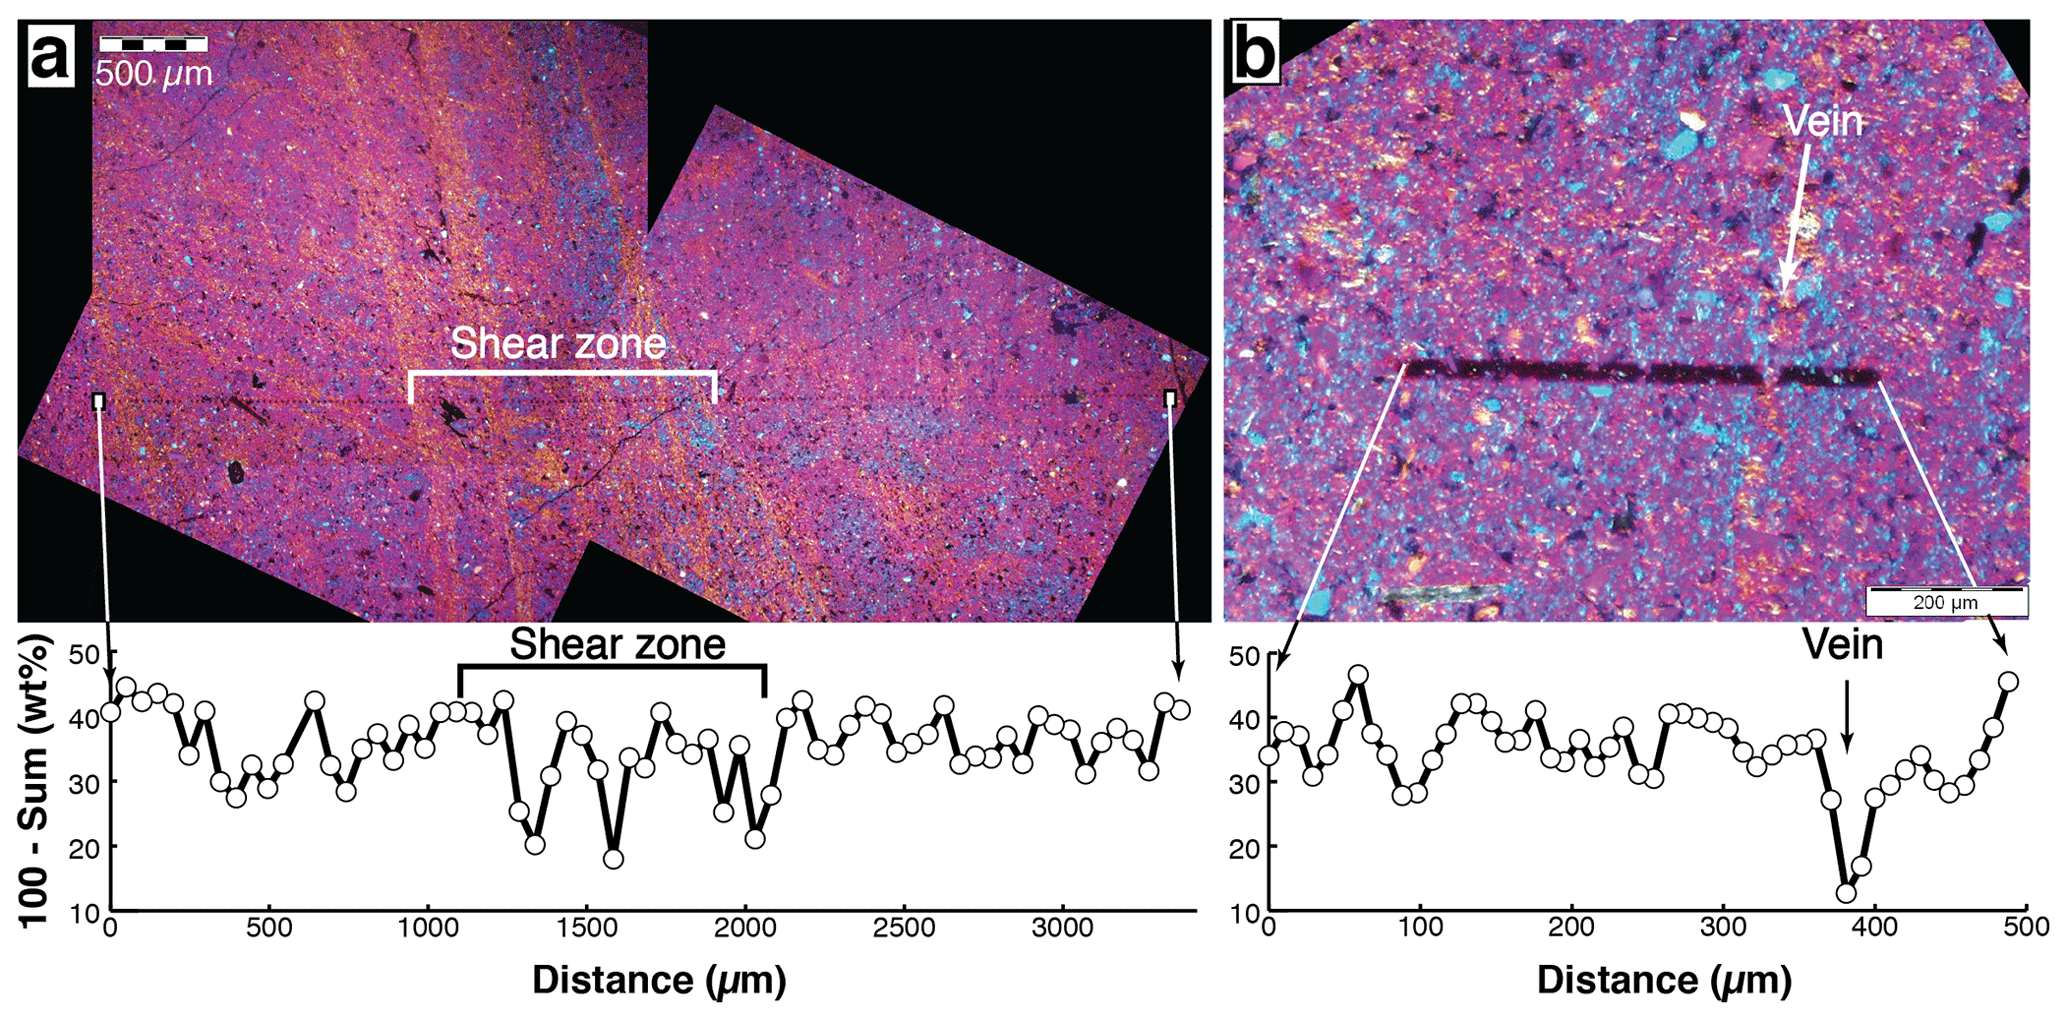
Figure 8Examples of EPMA profiles of major-element analyses in the clay-size fraction of deformation bands, reported onto optical microphotographs (cross-polarized light with a lambda plate). The quantity displayed in the profiles (100 minus the sum of analyzed major elements) is assumed to represent the concentration of volatile (i.e., not analyzed) elements. (a) Shear zone (sample 4R-3, 73-76). (b) Vein (21R-2, 82-85).
Table 4Trace-element concentrations in the sediment matrix, in shear zones, and in veins measured by HC-LA-ICPMS (sample 21R-2, 82-85, slabs VFC3 and VFC4). All the element concentrations are expressed in ppm except Si*, Ca* and Ti* that are expressed in wt %.
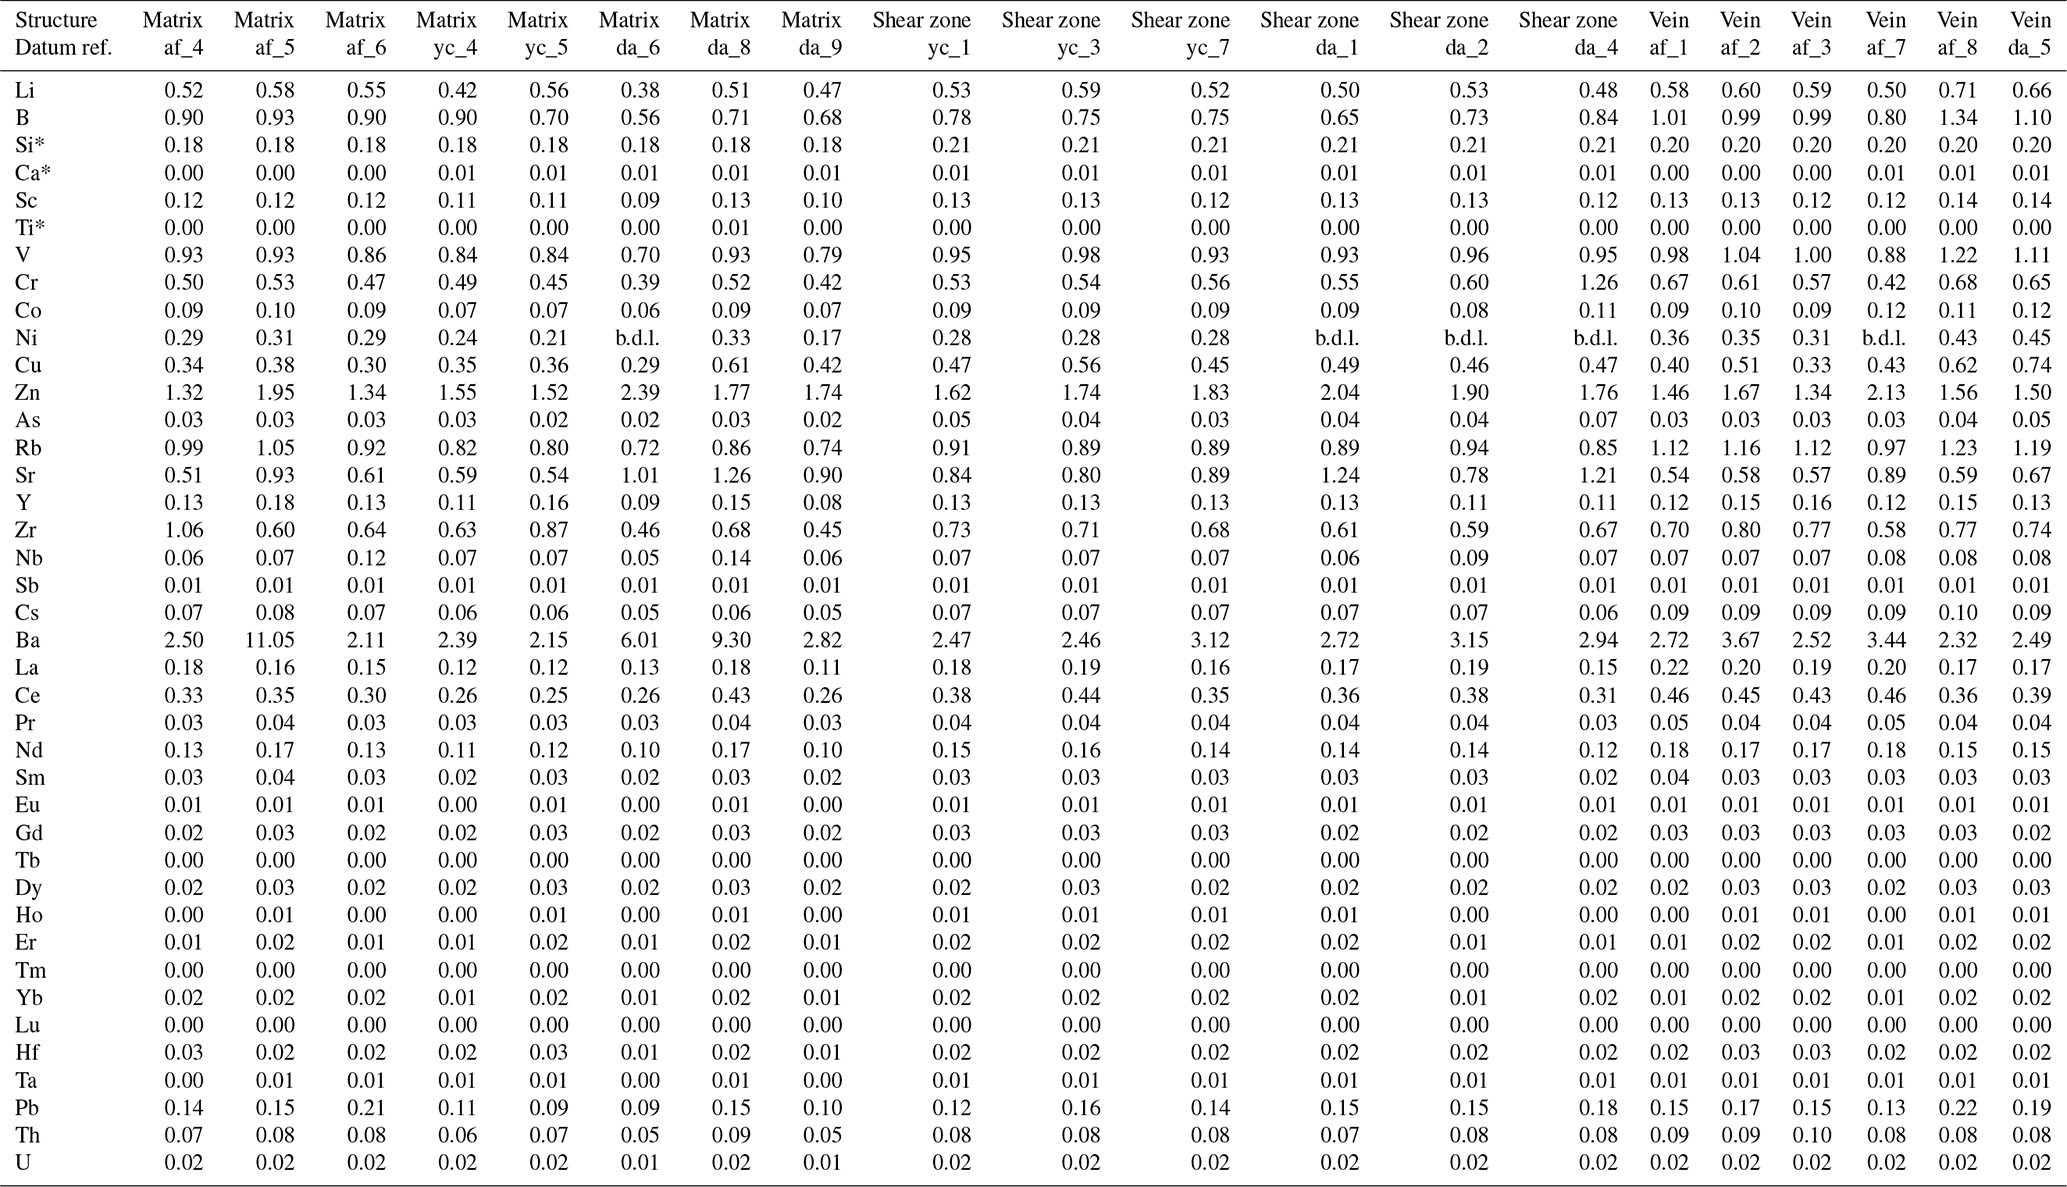
Trace-element analyses are reported in Table 4 and represented as averaged values in Fig. 10. As for the major elements, a general increase in trace-element concentrations is observed in shear zones and in veins relative to the sediment matrix. For some elements, this enrichment is due to the use of Si as an internal standard, hence with an increased concentration in deformation bands as measured by EPMA (Table 3). Again, however, there are significant anomalies, among which are a strong As enrichment in shear zones (+90 %) and to a lesser extent in veins (+40 %), a depletion of Ba in all the deformation bands (−31 % to −33 %), and an enrichment of Li and B in veins (+25 % to +38 %).

Figure 9Averaged major-element concentrations of EPMA analyses in the clay-size fraction of shear zones, of veins, and of their host sediment matrix. Data provided in Table 3.
5.1 Compaction
The first result of our study is that deformation bands are more compacted than the host sediment. This greater compaction is indicated by the general increases in element concentrations observed in SEM and XRF maps. It is also apparent in the EPMA data, as the concentration of volatile elements (approximated by 100 minus the sum of elements) is 36.51 wt %–45.05 wt % in the matrix whereas it is only 28.55 wt %–34.93 wt % in shear zones and 27.09 wt %–33.32 wt % in veins (Table 3), suggesting smaller interfoliar spaces in clays from deformation bands than from the matrix, and thus a smaller porosity. Shear zones and veins have therefore resulted in a greater volatile loss than the matrix, which may be interpreted as a greater fluid expulsion (Fig. 8). This result supports the conclusion of Milliken and Reed (2010) that deformation microstructures in mud core samples from Site C0008 (IODP Exp. 316) formed primarily by mechanical compaction of the unconsolidated mud and thus are indeed “dewatering structures”. This strain-induced reduction of pore spaces and density increase is likely responsible for the observed enrichment of many major and trace elements in deformation bands compared to those of the matrix. However, mechanical compaction should raise all the analyzed elements by the same proportion. This hypothesis may be tested using a correction for compaction by normalizing the sum of element concentrations to 100 %. Even after such correction, some elements like As and to a lesser extent Cu, Sb, and Pb remain enriched in deformation bands relative to the matrix and positively correlated to each other, while some like Ba are depleted in deformation bands (Figs. 10, 11). Veins also appear enriched in B, Li, and perhaps K2O but slightly depleted in CaO and perhaps Na2O relative to the matrix. This indicates that some chemical reactions occurred in the deformation bands, in addition to mechanical compaction. In the following, we explore the processes that may be responsible for the chemical differences observed in shear zones and veins relative to their host sediment matrix.
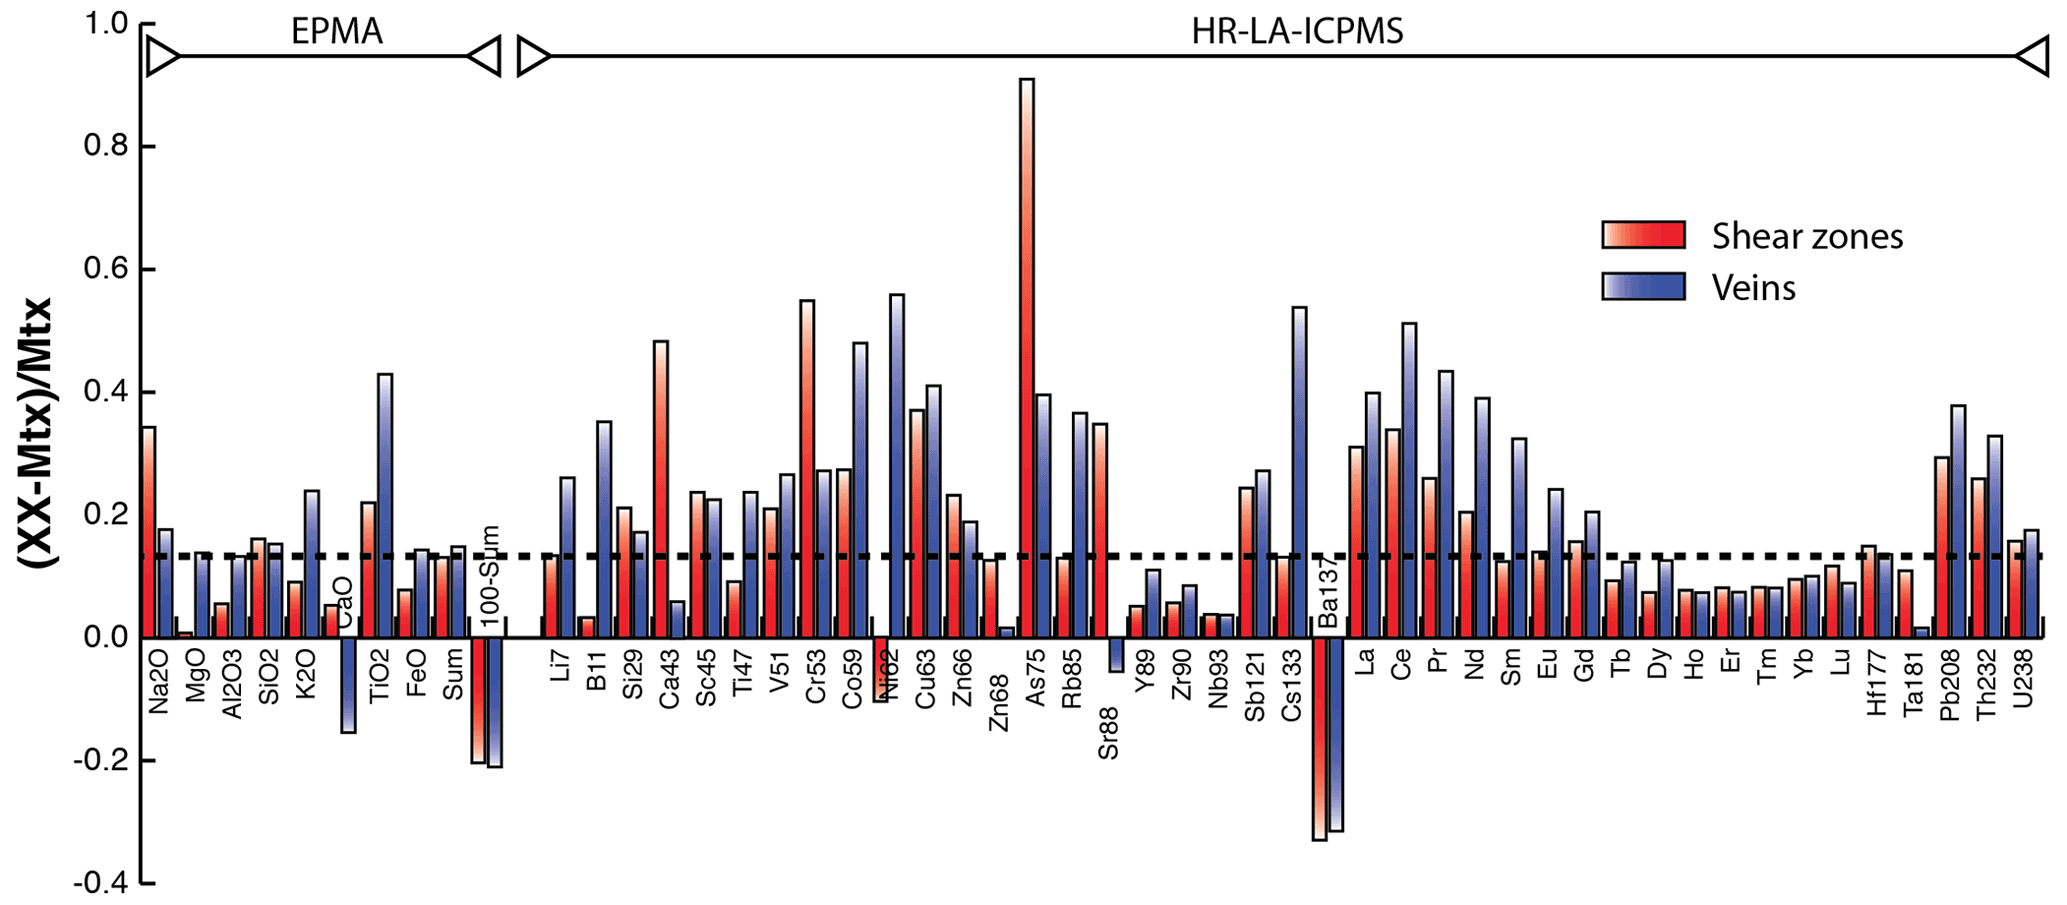
Figure 10Average relative proportions of major-element concentrations (measured by EPMA on samples 4R-3, 73-76; 11R-6, 3-8; and 21R-2, 82-85) and trace-element concentrations (measured by HC-LA-ICPMS on sample 21R-2, 82-85) in shear zones (red bars) and in veins (blue bars) with respect to their host sediment matrix. The dashed horizontal line corresponds to the averaged enrichment of major elements from the matrix (Mtx) to the deformation bands (XX), assumed to represent mechanical compaction.
5.2 Deformation and pyrite diagenesis
The dark color of deformation bands (Fig. 2), their increased content in authigenic pyrite microcrysts (Figs. 3e–g, 4, 5), their enrichment in chalcophile elements (Cu; As; Sn; Pb, Figs. 10, 11), and the positive correlations among these elements (Fig. 11) all concur to indicate that sulfide precipitation was enhanced in deformation bands compared to the matrix. Sulfide mineralization in low-temperature (< 60 ∘C) sediments is essentially a byproduct of the anaerobic degradation of organic matter by microorganisms (see the review by Megonigal et al., 2004). For this reason, authigenic pyrite is generally observed in anoxic, organic matter-rich sediments such as shales. The framboidal morphology of pyrite itself is generally, though not exclusively, taken as an indicator of microbial proliferation (Barbieri and Cavalazzi, 2005; Cavalazzi et al., 2012; Chen et al., 2006; Merinero et al., 2009; Peckmann et al., 2001). Organic carbon decomposition by heterotrophic microorganisms has the effect of releasing reduced dissolved iron and hydrogen sulfide, through Fe3+ and sulfate reduction reactions such as the following:
where CH2O represents organic matter. CO2 in Reaction (R1) may be supplied by methanogenesis:
The products of these reactions are then involved in a suite of secondary redox reactions, among which pyrite (FeS2) precipitates via the formation of temporary sulfide phases (Hunger and Benning, 2007; Wilkin and Barnes, 1997):
The precipitation of multiple pyrite microcrysts forming framboids requires a nucleation rate significantly greater than the crystal growth rate (i.e., surface-controlled growth), a condition achieved as long as the supply of reactants is not limited and the thermodynamic conditions are far from equilibrium (Ohfuji and Rickard, 2005; Wilkin and Barnes, 1997). This suggests that sulfate and reduced iron supplies were not limited at the time of deformation, and thus that the deformation bands occurred within the sulfate reduction zone. The Ba depletion in deformation bands (Figs. 10, 11) and the growth of pyrite microcrysts and framboids on barite needles in a vein (Fig. 3h) also support sulfate bio-reduction via metabolic Reactions (R1) and (R2). All these lines of evidence lead to the conclusion that the preferential crystallization of microcrystic and framboidal pyrite in deformation bands is a result of enhanced bacterial activity. According to syn-deformation microstructures of pyrite growth (Fig. 3b, c), this enhanced bacterial activity was coeval with the development of deformation bands and the associated reduction of porosity.
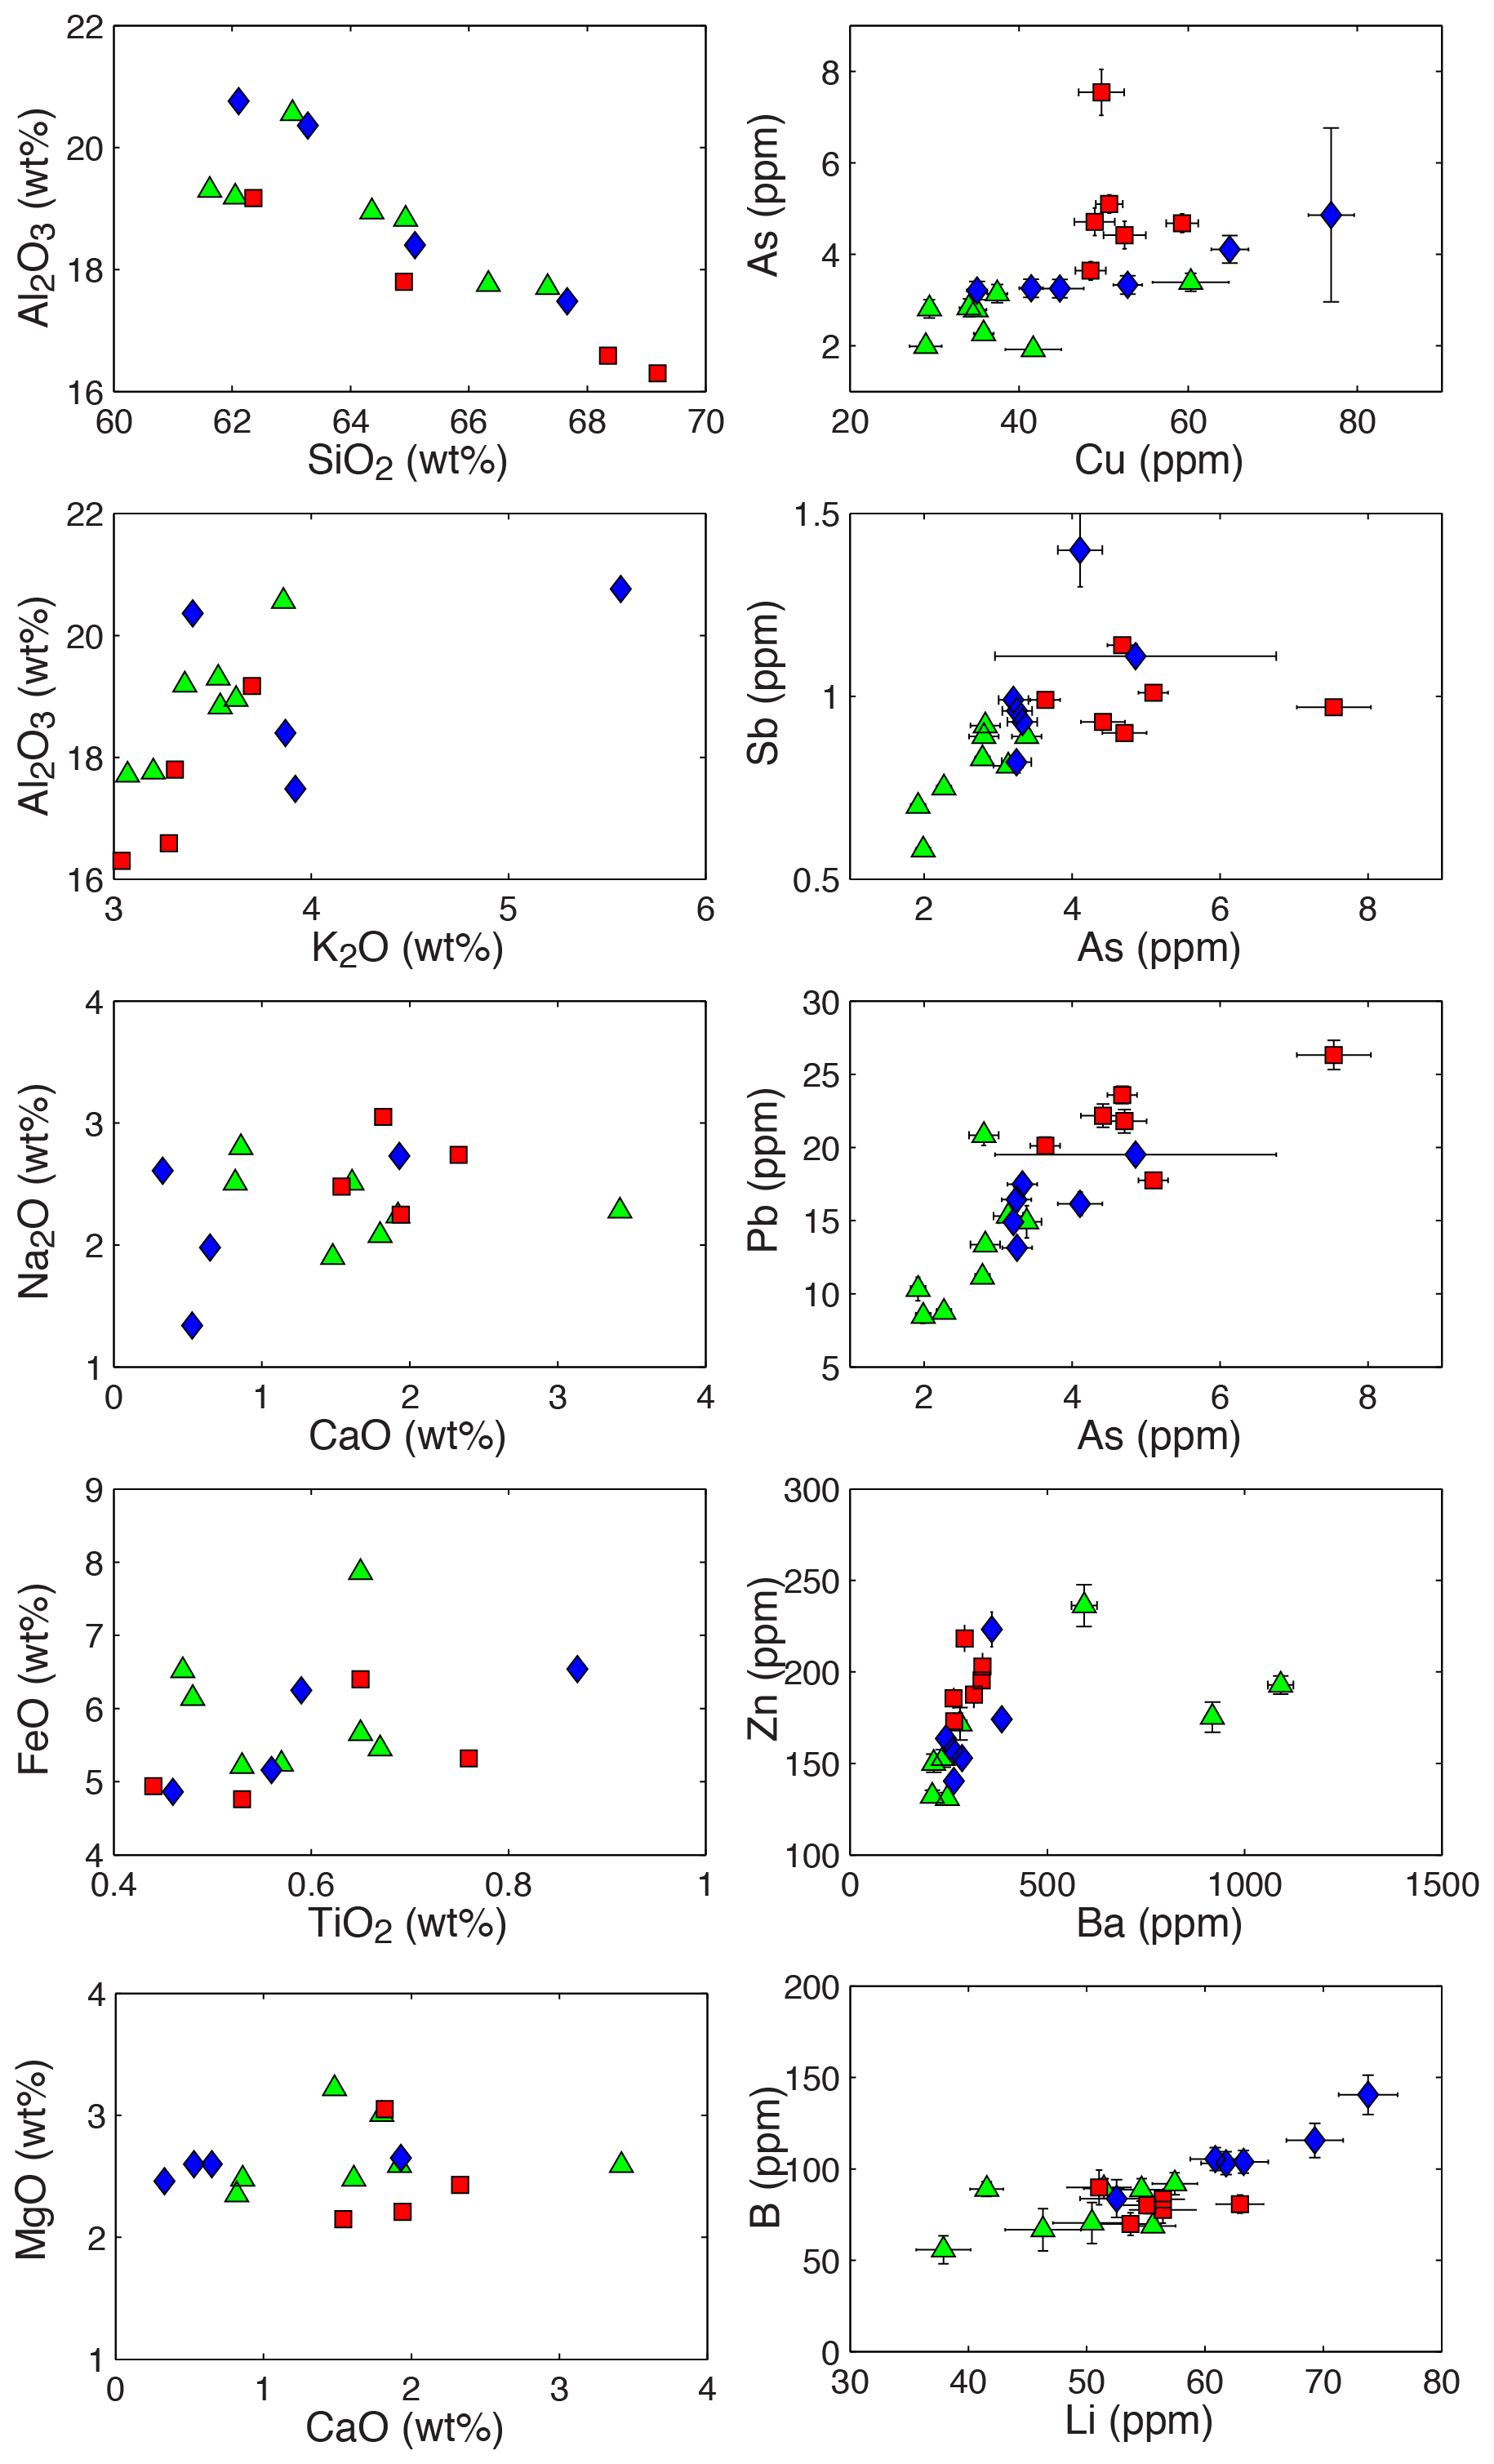
Figure 11Averaged major-element concentrations represented as oxides (samples 4R-3, 73-76; 11R-6, 3-8; and 21R-2, 82-85) and trace-element concentrations (21R-2, 82-85) in the matrix (green triangles), in shear zones (red squares), and in veins (blue diamonds) after normalization of the sum of major oxides to 100 %.
On the contrary, the blocky morphology of large and rare pyrite crystals indicates a transport-controlled crystal growth (Ohfuji and Rickard, 2005; Wilkin and Barnes, 1997), meaning that the demand of sulfate and iron exceeded their supply. These large blocky pyrite crystals grow at the expense of framboids and seal the CPO of deformation bands (Fig. 3d). This suggests that blocky pyrite is a recrystallization form of the framboid morphology, occurring without deformation, below the sulfate–methane transition zone, and hence not necessarily via metabolic reactions.
5.3 Clay transformation
In tandem with pyrite diagenesis, XRD spectra and chemical analyses suggest that the development of deformation bands is accompanied by modifications of the clay mineralogy. In the only sample studied by XRD (4R-3, 73-76), the shear zone displays a disappearance of smectite or I/S mixed layers, and an increased crystallinity of illite, relative to its host matrix. In the other sample studied for trace elements (21R-2, 82-85), the correlated B and Li enrichments of the 12 shear zone and vein analyses relative to the matrix, particularly noticeable in veins (Fig. 11), are two additional arguments suggesting that deformation bands localize smectite transformation into illite. Indeed, illitization is known to result in an uptake of B and Li, as the former element substitutes in tetrahedral sites of illite and the later in octahedral sites (Williams et al., 2013).
Because of its importance as a reaction releasing freshwater, the destabilization of smectite and its transformation into illite has received much attention for the fluid budget of accretionary prisms. Heat and the availability of K+ are considered as the primary factors governing illitization, and time, pressure, or shear stress as secondary factors (Casciello et al., 2011; Ransom and Helgeson, 1995). Given the small size of the microstructures studied here, however, it is quite unlikely that any of these factors varied much between deformation bands and their matrix just a few millimeters apart. Biotic alteration may offer an alternative, more plausible explanation for the observed changes in the mineralogy of clays. Indeed, smectite and I/S mixed layers are mineral structures that are very sensitive to biotic alteration, because they are needed for anaerobic bacteria to reach structural Fe3+ (Dong et al., 2009; Esnault et al., 2013; Zhang et al., 2012). There are strong suspicions that microbial reduction of smectite and I/S mixed layers can trigger illitization (Esnault et al., 2013; Koo et al., 2014, 2016). Accordingly, we propose that enhanced anaerobic bacterial proliferation in deformation bands, a process already suggested by the localized crystallization of framboidal pyrite, is also the cause of the disappearance of smectite or I/S mixed layers, and the increased crystallinity of illite. This conclusion is speculative for the time being given the small corpus of data presented here (one shear zone sample analyzed for XRD and 12 trace-element analyses of shear zones and veins in another sample). Future work will have to test the reproducibility of these findings and their applicability at larger scale in accretionary prisms.
5.4 Causes and timing of deformation-enhanced bacterial proliferation
A first question that arises from the above discussion is why did the deforming sediment provide a more favorable ground to the development of anaerobic microorganisms than the undeformed matrix? A first possible explanation is that the greater compaction of deformation bands increased the availability of compounds necessary for metabolic Reactions (R1) and (R2) by increasing the concentration of these compounds compared to the matrix. As shown above, the majority of element concentrations are raised by ∼ 20 % due to the increased compaction of deformation bands (Figs. 8, 10), and thus the same enrichment is expected for organic matter, sulfate, and Fe3+. This concentration increase may have favored the proliferation of anaerobic microorganisms. Alternatively or additionally, it has been shown that the deformation of silicate minerals and the delamination of clay layers in particular generate H2 by chemical reactions between water and mechanoradicals created by the rupture of Si–O–Si or Al–O–Si bonds (Hirose et al., 2011; Kameda et al., 2004; Kita et al., 1982; Wakita et al., 1980). This H2 may have served as a terminal electron donor in heterotrophic metabolic reactions, acting in conjunction with mechanical compaction to favor anaerobic microbial proliferation during deformation of the unconsolidated sediment.
Another important question concerns the timing of deformation bands and their bacterial proliferation. Given the need of nutrients for metabolic reactions, it is tempting to interpret these structures as formed at shallow depth below the sea floor, in proximity of seawater sulfate supply. However, shear zones as well as veins were almost exclusively found in the accretionary prism (Unit II) and not in the slope sediment (Unit I) above the unconformity (Fig. 1c). This fact implies that most of the deformation bands studied here are not burial-related but are rather associated with the tectonics of the accretionary prism. A way to reconcile the two inferences is to suggest that deformation bands, and biological diagenesis in them, developed in the upper portion of the accretionary prism during thrusting, and before the deposition of slope sediments. Whether deformation bands are mechanically compatible with thrusting is unfortunately unknown because no kinematics could be assigned to the majority of them. Nevertheless, we note that this proposed timing coincides with the activity of the megasplay fault thrust uphill of C0001 (Fig. 1b). It is thus possible that deformation bands may represent early stages of strain localization, and fluid expulsion, in the context of megasplay fault development.
5.5 Implications for the deformation of mudstones in accretionary prisms
Reports of all the drilling expeditions across the Nankai accretionary prism are consistent in describing the ubiquitous existence of dark shear zones and veins in mud sediments (Ashi et al., 2008; Henry et al., 2012; Kinoshita et al., 2009a, b, c, d, e, f; Saffer et al., 2010; Ujiie et al., 2004). Dark deformation bands have also been described on land in mudstones of the Boso peninsula paleo-accretionary prism (Ohsumi and Ogawa, 2008), and worldwide in active continental margins (e.g., Behrmann et al., 1988), sometimes in conjunction with an enrichment in authigenic iron sulfides (Lindsley-Griffin et al., 1990). Dark deformation bands may thus be considered as an intrinsic feature of mudstone sediments in accretionary prisms. Our results suggest that these small structures localize pyrite crystallization and smectite–illite transformations, two diagenetic reactions probably mediated by the proliferation of anaerobic microorganisms, and both boosted by deformation. A possible implication of our study is that such increased diagenesis in deformation bands may be a source of freshwater, firstly because H2O is a product of metabolic reactions leading to pyritization (see Eq. 1 for instance), and secondly because H2O is also released by the illitization of smectite. In pervasively deformed mudstones with abundant deformation bands, these two effects may combine to potentially explain the local deficits of modeled versus observed pore water freshening found in previous studies (e.g., Saffer and McKiernan, 2009). Given the temporal consistency between megasplay faulting and deformation bands, the dewatering of these many microstructures could be supplied to major faults, which might explain some freshwater fluxes observed in accretionary prisms (e.g., Kastner et al., 1993; Vrolijk et al., 1991). More work is obviously necessary to quantify the contribution of microbial diagenesis to the pore water freshening of deformed sediments.
Another important implication of our study is that the microbial diagenesis might be a general feature of deformation structures whatever their size, from the small deformation bands described here to major thrust faults. This is particularly the case of the megasplay fault of the Nankai prism drilled at 270 mbsf at site C0004 during the NanTroSEIZE expedition 316 (Kinoshita et al., 2009c). The analysis of the core zone of this megasplay revealed a 2 cm thick dark gouge, interpreted as the principal slip zone and the subject of a vigorous scientific debate. Indeed, this dark gouge was found to combine an increased vitrinite reflectance, a smectite depletion, and an increased illite crystallinity compared to the surrounding breccia (Sakaguchi et al., 2011; Yamaguchi et al., 2011). These differences were interpreted as thermal maturation of organic matter and illitization in the dark gouge, both due to coseismic shear heating above 380 ∘C in the principal slip zone of the megasplay, and thus as evidence of seismic rupture propagation to the sea floor. However, other studies using trace-element analyses as well as thermal modeling contradicted this interpretation, by concluding that the coseismic temperature rise in the megasplay did not exceed 300 ∘C and could not be sufficient to activate the kinetics of illitization (Hirono et al., 2009, 2014). How can these two divergent views of the fault zone chemistry and mineralogy be reconciled?
The paradox might be solved by considering bacterial activity as a diagenetic process boosted by deformation. It is important to note that a peak bacterial concentration of 3.6×10⁹ cells/cm3 was found in the damaged zone of the megasplay drilled at site C0004 (Kinoshita et al., 2009c). This cell abundance, noticeably in the upper range of sediments worldwide (typically of 106–109 cells/cm3), was also nearly as high as that of the sea floor at this site. Moreover, the lower part of the dark gouge in the megasplay fault drilled at site C0004 was also enriched in authigenic pyrite (Destrigneville et al., 2013), which makes diagenetic reactions in the megasplay very similar to those found in the tiny deformation bands studied here. Such an analogy strongly suggests that temperature rise is not the only factor capable of explaining the observed anomalies in the megasplay, and that many mineral reactions in the principal slip zone might be biologically mediated rather than thermally activated. Recent studies have shown that anaerobic microbial activity associated with framboidal pyrite crystallization could locally yield anomalously high reflectance values of amorphous organic matter compared to thermal maturation (e.g., Synnott et al., 2016). Microbial activity could thus explain the elevated vitrinite reflectance temperature obtained for the principal slip zone (Sakaguchi et al., 2011), as it does explain pyrite crystallization, smectite or I/S mixed layer destabilization, and illitization in deformation structures whatever their size. Anaerobic bacterial bloom, boosted by deformation, would thus solve the paradox of mineralogical and chemical anomalies in the principal slip zone of the Nankai megasplay. We therefore come to the conclusion that more caution is required before interpreting illitization in fault gouges as an evidence of coseismic slip, or more generally as a temperature rise, because this mineral reaction, like others, might be triggered or enhanced by microbial activity.
Microscopic observation, X-ray diffraction, and major- and trace-element analyses reveal that deformation bands in mud sediments of the Nankai accretionary prism, which are similar to microstructures found worldwide in active and passive margin sediments, have localized some diagenetic reactions in addition to mechanical compaction. The first diagenetic reaction is an increased precipitation of microcrystic and framboidal pyrite. The second diagenetic reaction found in deformation bands is a possible change in the mineralogy of clays compared with the surrounding sediment, consisting of the destabilization of smectite or I/S mixed layers and the crystallization of illite. Both diagenetic reactions occurred during the development of deformation bands and vanished afterwards. This biogenic diagenesis may be explained by a locally enhanced activity of anaerobic microorganism in deformation bands, which may be related to the generation of H2 by intracrystalline deformation of silicate minerals.
Biologically induced diagenetic reactions detected in deformations bands may have consequences for the fluid budget of deforming sediments, because biogenic pyrite crystallization and illitization produce freshwater, which may participate in reducing the chlorinity of pore waters from accretionary prisms. These findings might also affect our understanding of coseismic reactions in fault zones, because illitization, usually taken as an indicator of temperature rise, might be mediated by metabolic processes rather than by shear heating.
Table A1Trace-element composition of USGS reference basalt BIR-1 repeatedly measured by HR-LA-ICPMS at the beginning and the end of the analytical session (all elements are in ppm, except Si*, Ca*, and Ti* in wt %).
All the data are provided in the tables of the paper.
VF chose the samples during IODP Exp. 315. AMB and VF did the petrological inspection of samples. HR, MA and VF carried out the mineralogical and chemical analyses. VF prepared the paper with contributions from all co-authors.
The authors declare that they have no conflict of interest.
Publisher's note: Copernicus Publications remains neutral with regard to jurisdictional claims in published maps and institutional affiliations.
We thank the D/V Chikyu staff for their support during IODP Expedition 315. We also thank our colleagues Timothy. B. Byrne, Jonathan C. Lewis, Kyuichi Kanagawa, and Jan Behrmann for our onboard discussions about the nature of deformation bands. This research used samples and data provided by the Integrated Ocean Drilling Program. Funding was provided by INSU-CNRS “Sismofluids” and “3F” grants.
This paper was edited by Virginia Toy and reviewed by two anonymous referees.
Ashi, J., Lallemant, S., Masago, H., Behrmann, J. H. et al.: NanTroSEIZE stage 1A: NanTroSEIZE megasplay riser pilot, Integr. Ocean Drill. Progr. Prelim. Reports, https://doi.org/10.2204/iodp.pr.315.2008, 2008.
Barbieri, R. and Cavalazzi., B.: Microbial fabrics from Neogene cold seep carbonates, Northern Apennine, Italy, Palaeogeogr. Palaeocl., 227, 143–155, https://doi.org/10.1016/j.palaeo.2005.04.026, 2005.
Behrmann, J.H., Brown, K., Moore, J.C., Mascle, A., Taylor, E., Alvarez, F., Andreieff, P., Barnes, R., Beck, C., Blanc, G., Clark, M., Dolan, J., Fisher, A., Gieskes, J., Hounslow, M., McLellan, P., Moran, K., Ogawa, Y., Sakai, T., Schoonmaker, J., Vroluk, P., Wilkens, R., and Williams, C., Evolution of structures and fabrics in the Barbados Accretionary Prism. Insights from leg 110 of the Ocean Drilling Program, J. Struct. Geol., 10, 577–591, https://doi.org/https://doi.org/10.1016/0191-8141(88)90025-9, 1988.
Bence, A. E. and and Albee, A. L.: Empirical correction factors for the electron microanalysis of silicates and oxides, J. Geol., 76, 382–403, 1968.
Brothers, R. J., Kemp, A. E. S., and Maltman, A. J.: Mechanical development of vein structures due to the passage of earthquake waves through poorly-consolidated sediments, Tectonophysics, 260, 227–244, https://doi.org/10.1016/0040-1951(96)00088-1, 1996.
Brown, K. M., Saffer, D. M., and Bekins, B. A.: Smectite diagenesis, pore-water freshening, and fluid flow at the toe of the Nankai wedge, Earth Planet. Sc. Lett., 194, 97–109, 2001.
Carson, B. and Screaton, E. J.: Fluid flow in accretionary prisms: Evidence for focused, time-variable discharge, Rev. Geophys., 36, 329–351, https://doi.org/10.1029/97RG03633, 1998.
Casciello, E., Cosgrove, J. W., Cesarano, M., Romero, E., Queralt, I., and Vergés, J.: Illite-smectite patterns in sheared Pleistocene mudstones of the Southern Apennines and their implications regarding the process of illitization: A multiscale analysis, J. Struct. Geol., 33, 1699–1711, https://doi.org/10.1016/j.jsg.2011.08.002, 2011.
Cavalazzi, B., Barbieri, R., Cady, S. L., George, A. D., Gennaro, S., Westall, F., Lui, A., Canteri, R., Rossi, A. P., Ori, G. G., and Taj-Eddine, K.: Iron-framboids in the hydrocarbon-related Middle Devonian Hollard Mound of the Anti-Atlas mountain range in Morocco: Evidence of potential microbial biosignatures, Sediment. Geol., 263, 183–193, https://doi.org/https://doi.org/10.1016/j.sedgeo.2011.09.007, 2012.
Chen, D. F., Feng, D., Su, Z., Song, Z. G., Chen, G. Q., and Cathles, L. M.: Pyrite crystallization in seep carbonates at gas vent and hydrate site, Material. Sci. Eng., 26, 602–605, https://doi.org/10.1016/j.msec.2005.08.037, 2006.
Davis, D., Suppe, J., and Dahlen, F. A.: Mechanics of fold-and-thrust belts and accretionary wedges, J. Geophys. Res., 88, 1153–1172, 1983.
Destrigneville, C., Fabbri, O., Henry, P., Agrinier, P., and Karpoff, A. M.: Fluid-Sediment Interactions in the Nankai Subduction Zone (NanTroSEIZE): Pore Fluid and Mineralogical Records, Proc. Earth Planet. Sci., 7, 207–210, https://doi.org/10.1016/j.proeps.2013.03.045, 2013.
Dong, H., Jaisi, D. P., Kim, J., and Zhang, G.: 1505-1519 Microbe-clay mineral interactions, Am. Mineral., 94, 1505–1519, https://doi.org/10.2138/am.2009.3246, 2009.
Esnault, L., Libert, M., Bildstein, O., Mustin, C., Marsal, F., and Jullien M.: Impact of iron-reducing bacteria on the properties of argillites in the context of radioactive waste geological disposal, Appl. Clay Sci., 83, 42–49, https://doi.org/10.1016/j.clay.2013.08.018, 2013.
Gieskes, J. M., Vrolijk, P., and Blanc, G.: Hydrogeochemistry of the Northern Barbados Acretionary Complex Transect: Ocean Drilling Project Leg 110, J. Geophys. Res.-Sol. Ea., 95, 8809–8818, 1990.
Gieskes, J. M., Gamo, T., and Kastner, M.: Major and minor element geochemistry of interstitial waters of site 808, Nankai trough: an overview, in: Proceedings of the Ocean Drilling Program, Sci. Res., 131, 387–396, 1993.
Guo, J. and Underwood, M. B.: Data report: clay mineral assemblages from the Nankai Trough accretionary prism and the Kumano Basin, IODP Expeditions 315 and 316, NanTroSEIZE Stage 1, Proceedings of the Integrated Ocean Drilling Program, 314/315/31, 1–45, https://doi.org/10.2204/iodp.proc.314315316.202.2012, 2012.
Hanamura, Y. and Ogawa, Y: Layer-parallel faults, duplexes, imbricate thrusts and vein structures of the Miura Group: Keys to understanding the Izu fore-arc sediment accretion to the Hoshu fore-arc, Island Arc., 2, 126–141, 1993.
Henry, P. and Bourlange, S.: Smectite and fluid budget at Nankai ODP sites derived from cation exchange capacity, Earth Planet. Sc. Lett., 219, 129–145, https://doi.org/10.1016/S0012-821X(03)00694-0, 2004.
Henry, P., Kanamatsu, T., Moe, K. T., and Expedition 333 Scientists: Expedition 333 Site C0011, Proceedings of the Integrated Ocean Drilling Program, 333, 2012.
Hirono, T., Ujiie, K., Ishikawa, T., Mishima, T., Hamada, Y., Tanimizu, M., Soh, W., and Kinoshita, M.: Estimation of temperature rise in a shallow slip zone of the megasplay fault in the Nankai Trough, Tectonophysics, 478, 215–220, https://doi.org/10.1016/j.tecto.2009.08.001, 2009.
Hirono, T., Ishikawa, T., Masumoto, H., Kameda, J., Yabuta, H., and Mukoyoshi, H.: Re-evaluation of frictional heat recorded in the dark gouge of the shallow part of a megasplay fault at the Nankai Trough, Tectonophysics, 626, 157–169, https://doi.org/10.1016/j.tecto.2014.04.020, 2014.
Hirose, T., Kawagucci, S., and Suzuki, K.: Mechanoradical H2 generation during simulated faulting: Implications for an earthquake-driven subsurface biosphere, Geophys. Res. Lett., 38, 1–5, https://doi.org/10.1029/2011GL048850, 2011.
Hunger, S. and Benning, L. G.: Greigite: a true intermediate on the polysulfide pathway to pyrite, Geochem. Trans., 8, 1, https://doi.org/10.1186/1467-4866-8-1, 2007.
Kameda, J., Saruwatari, K., and Tanaka, H.: H2 generation during dry grinding of kaolinite, J. Coll. Int. Sci., 275, 225–228, https://doi.org/10.1016/j.jcis.2004.02.014, 2004.
Kastner, M., Elderfield, H., Jenkins, W. J., Gieskes, J. M., and Gamo, T.: Geochemical and isotopic evidence for fluid flow in the western Nankai subduction zone, Japan. Proc. Oc. Drill. Prog. Sci. Res, 131, 397–413, https://doi.org/10.2973/odp.proc.sr.131.143.1993, 1993.
Kastner, M., Elderfield, H., and Martin, J. B.: Fluids in convergent margins: What do we know about their composition, origin, role in diagenesis and importance for oceanic chemical fluxes?, Philos. T. Roy. Soc. A, 335, 243–259, https://doi.org/10.1098/rsta.1991.0045, 1991.
Kemp, A. E. S.: Fluid flow in “vein structures” in Peru Forearc basins: evidence from basck-scattered electron microscope studies. Proceedings of the Ocean Drilling Program, Sci. Res., 112, 33–41, 1990.
Kinoshita, M., Tobin, H., Ashi, J., Kimura, G., Lallemant, S., Screaton, E. J., Curewitz, D., Masago, H., Moe, K. T., and the Expedition 314/315/316 Scientists: Proceedings of the Integrated Ocean Drilling Program, 314/315/316, 1–103, https://doi.org/10.2204/iodp.proc.314315316.123.2009, 2009a.
Kinoshita, M., Tobin, H., Ashi, J., Kimura, G., Lallemant, S., Screaton, E. J., Curewitz, D., Masago, H., Moe, K. T., and the Expedition 314/315/316 Scientists: Proceedings of the Integrated Ocean Drilling Program, 314/315/316, 1–104, https://doi.org/10.2204/iodp.proc.314315316.124.2009, 2009b.
Kinoshita, M., Tobin, H., Ashi, J., Kimura, G., Lallemant, S., Screaton, E. J., Curewitz, D., Masago, H., Moe, K. T., and the Expedition 314/315/316 Scientists: Proceedings of the Integrated Ocean Drilling Program, 314/315/316, https://doi.org/10.2204/iodp.proc.314315316.123.2009, 2009c.
Kinoshita, M., Tobin, H., Ashi, J., Kimura, G., Lallemant, S., Screaton, E. J., Curewitz, D., Masago, H., Moe, K. T., and the Expedition 314/315/316 Scientists: Proceedings of the Integrated Ocean Drilling Program, 314/315/316, https://doi.org/10.2204/iodp.proc.314315316.123.2009, 2009d.
Kinoshita, M., Tobin, H., Ashi, J., Kimura, G., Lallemant, S., Screaton, E. J., Curewitz, D., Masago, H., Moe, K. T., and the Expedition 314/315/316 Scientists: Proceedings of the Integrated Ocean Drilling Program, 314/315/316, https://doi.org/10.2204/iodp.proc.314315316.123.2009, 2009e.
Kinoshita, M., Tobin, H., Ashi, J., Kimura, G., Lallemant, S., Screaton, E. J., Curewitz, D., Masago, H., Moe, K. T., and the Expedition 314/315/316 Scientists: Proceedings of the Integrated Ocean Drilling Program, 314/315/316, https://doi.org/10.2204/iodp.proc.314315316.123.2009, 2009f.
Kita, I., Matsuo, S., and Wakita, H.: H2 generation by reaction between H2O and crushed rock: an experimental study on H2 degassing from the active fault zone. J. Geophys. Res.-Sol. Ea., 87, 10789–10795, https://doi.org/10.1029/JB087iB13p10789, 1982.
Koo, T., Jang, Y., Kogure, T., Kim, J. H., Park, B. C., Sunwoo, D., and Kim., J.: Structural and chemical modification of nontronite associated with microbial Fe(III) reduction: Indicators of “illitization”, Chem. Geol., 377, 87–95, https://doi.org/10.1016/j.chemgeo.2014.04.005, 2014.
Koo, T., Lee, G., and Kim., J.: Biogeochemical dissolution of nontronite by Shewanella oneidensis MR-1: Evidence of biotic illite formation, Appl. Clay Sci., 134, 13–18, https://doi.org/10.1016/j.clay.2016.03.030, 2016.
Kübler, B.: Evaluation quantitative du métamorphisme par la cristallinité de l'illite, Bulletin Du Centre Recherche de Pau-SNPA 2, 385–397, 1968.
Lewis, J. C., Byrne, T., and Kanagawa, K.: Evidence for mechanical decoupling of the upper plate at the Nankai subduction zone: Constraints from core-scale faults at NantroSEIZE Sites C0001 and C0002, Geochem. Geophy. Geosy., 14, 620–633, https://doi.org/10.1029/2012GC004406, 2013.
Lindsley-Griffin, N., Kemp, A. E. S., and Swartz, J. F.: Vein structures of the Peru margin, Leg 112, edited by: Suess, E., von Huene, R., Emeis, K. C., Bourgeois, J., Castaneda, J., De Wever, P. et al., Proceedings of the Ocean Drilling Project, Sci. Res., Vol. 112, College Station, TX, 1990.
Megonigal, J. P., Hines, M. E., and Visscher, P. T.: Anaerobic Metabolism:Linkages to Trace Gases and Aerobic Processes, Biogeochemistry, 317–424, https://doi.org/10.1016/B0-08-043751-6/08132-9, 2004.
Merinero, R., Lunar, R., and Somoza, L. D.-D.-R.: Nucleation, growth and oxidation of framboidal pyrite associated with hydrocarbon-derived submarine chimneys: lessons learned from the Gulf of Cadiz, Eur. J. Mineral., 21, 947–961, https://doi.org/10.1127/0935-1221/2009/0021-1956, 2009.
Milliken, K. L. and Reed, R. M.: Multiple causes of diagenetic fabric anisotropy in weakly consolidated mud, Nankai accretionary prism, IODP Expedition 316, J. Struct. Geol., 32, 1887–1898, https://doi.org/10.1016/j.jsg.2010.03.008, 2010.
Moore, G.F., Park, J.-O., Bangs, N.L., Gulick, S.P., Tobin, H.J., Nakamura, Y., Sato, S., Tsuji, T., Yoro, T., Tanaka, H., Uraki, S., Kido, Y., Sanada, Y., Kuramoto, S., and Taira, A.: Structural and seismic stratigraphic framework of the NanTroSEIZE Stage 1 transect, edited by: Kinoshita, M., Tobin, H., Ashi, J., Kimura, G., Lallemant, S., Screaton, E. J., Curewitz, D., Masago, H., Moe, K. T., and the Expedition 314/315/316 Scientists, Proc. IODP, 314/315/316: Washington, DC (Integrated Ocean Drilling Program Management International, Inc.), doi:10.2204/iodp.proc.314315316.102.2009, 2009.
Moore, J. C. and Saffer, D. M.: Updip limit of the seismogenic zone beneath the accretionary prism of southwest Japan: An effect of diagenetic to low-grade metamorphic processes and increasing effective stress, Geology, 29, 183–186, 2001.
Moore, J. C. and Vrolijk, P.: Fluids in accretionary prisms, Rev. Geophys., 30, 113–135, https://doi.org/10.1029/90EO00031, 1992.
Ohfuji, H. and Rickard, D.: Experimental syntheses of framboids – A review, Earth Sci. Rev., 71, 147–170, https://doi.org/10.1016/j.earscirev.2005.02.001, 2005.
Ohsumi, T. and Ogawa, Y.: Vein structures, like ripple marks, are formed by short-wavelength shear waves, J. Struct. Geol., 30, 719–724, https://doi.org/10.1016/j.jsg.2008.02.002, 2008.
Passchier, C. W. and Trouw, R. A. J.: Microtectonics, Berlin, Springer Verläg, 298 pp., 1998.
Pearce, N. G. J., Perkins, W. T., Westgate, A., Gorton, M. P., Jackson, S. E., Neal, C. R., and Chenery, S. P.: A Compilation of New and Published Major and Trace Element Data for NIST SRM 610 and NIST SRM 612 Glass Reference Materials, Geostandard. Newslett., 21, 115–144, 1997.
Peckmann, J., Reimer, A., Luth, U., Luth, C., Hansen, B. T., Heinicke, C., Hoefs, J., and Reitner, J.: Methane-derived carbonates and authigenic pyrite from the northwestern Black Sea, Mar. Geol. 177, 129–150. https://doi.org/https://doi.org/10.1016/S0025-3227(01)00128-1, 2001.
Pohlman, J. W., Kaneko, M., Heuer, V. B., Coffin, R. B., and Whiticar, M.: Methane sources and production in the northern Cascadia margin gas hydrate system, Earth Planet. Sc. Lett., 287, 504–512, https://doi.org/10.1016/j.epsl.2009.08.037, 2009.
Raimbourg, H., Thiéry, R., Vacelet, M., Famin, V., Ramboz, C., Boussafir, M., Disnar, J.-R., and Yamaguchi, A.: Organic matter cracking: A source of fluid overpressure in subducting sediments, Tectonophysics, 721, 254–274, https://doi.org/10.1016/j.tecto.2017.08.005, 2017.
Ransom, B. and Helgeson, H. C.: A chemical and thermodynamic model of dioctahedral 2:1 layer clay minerals in diagenetic processes; dehydration of dioctahedral aluminous smectite as a function of temperature and depth in sedimentary basins, Am. J. Sci., 295, 245–281, 1995.
Saffer, D. M. and Bekins, B. A.: Episodic fluid flow in the Nankai accretionary complex: Timescale, geochemistry, flow rates, and fluid budget, J. Geophys. Res., 103, 30351, https://doi.org/10.1029/98JB01983, 1998.
Saffer, D. M. and McKiernan, A. W.: Evaluation of in situ smectite dehydration as a pore water freshening mechanism in the Nankai trough, offshore southwest Japan, Geochem. Geophy. Geosy., 10, 1–24, https://doi.org/10.1029/2008GC002226, 2009.
Raimbourg, H., Thiéry, R., Vacelet, M., Famin, V., Ramboz, C., Boussafir, M., Disnar, J.-R., and Yamaguchi, A.: Proceedings of the Integrated Ocean Drilling Program, 319, 2010.
Sakaguchi, A., Chester, F., Curewitz, D., Fabbri, O., Goldsby, D., Kimura, G., Li, C.-F., Masaki, Y., Screaton, E.J., Tsutsumi, A., Ujiie, K., Yamaguchi, A.: Seismic slip propagation to the updip end of plate boundary subduction interface faults: Vitrinite reflectance geothermometry on integrated ocean drilling program nantro SEIZE cores, Geology, 39, 395–398, https://doi.org/10.1130/G31642.1, 2011.
Synnott, D. P., Sanei, H., Pedersen, P. K., Dewing, K., and Ardakani, O. H.: The effect of bacterial degradation on bituminite reflectance. Int. J. Coal Geol., 162, 34–38, https://doi.org/10.1016/j.coal.2016.05.016, 2016.
Torres, M. E., Cox, T., Hong, W.-L., McManus, J., Sample, J. C., Destrigneville, C., Gan, H. M., Gan, H. Y., and Moreau, J. W.: Crustal fluid and ash alteration impacts on the biosphere of Shikoku Basin sediments, Nankai Trough, Japan, Geobiology, 13, 562–580, https://doi.org/10.1111/gbi.12146, 2015.
Ujiie, K., Maltman, A. J., and Sánchez-Gómez, M.: Origin of deformation bands in argillaceous sediments at the toe of the Nankai accretionary prism, southwest Japan, J. Struct. Geol., 26, 221–231, https://doi.org/10.1016/j.jsg.2003.06.001, 2004.
Underwood, M. B.: Sedimentary geochemistry, clay mineralogy, and diagenesis: a synthesis of data from leg 131, nankai trough, Proceeding of the Ocean Drilling Program, 131, 343–363, https://doi.org/10.2973/odp.proc.sr.131.137.1993, 1993.
Van Achterberg, E., Ryan, C., Jackson, S., and Griffin, W.: Data Reduction Software for LA-ICP-MS, in: Laser ablation ICP-MS in the Earth Science, edited by: Sylvester, P., Mineralogical Association of Canada, 348 pp., 2001.
Vrolijk, P., Fisher, A., and Gieskes, J. M.: Geochemical and geothermal evidence for fluid migration in the Barbados Accretionary Prism (ODP leg 110), Geophys. Res. Lett., 18, 947–950, https://doi.org/10.1029/91GL00913, 1991.
Wakita, H., Nakamura, Y., Kita, I., Fujii, N., and Notsu, K.: Hydrogen release: New Indicator of Fault Activity, Science, 210, 188–189, 1980.
Wallmann, K., Aloisi, G., Haeckel, M., Obzhirov, A., Pavlova, G., and Tishchenko, P.: Kinetics of organic matter degradation, microbial methane generation, and gas hydrate formation in anoxic marine sediments, Geochim. Cosmochim. Ac., 70, 3905–3927, https://doi.org/10.1016/j.gca.2006.06.003, 2006.
Wilkin, R. T. and Barnes, H. L.: Formation processes of framboidal pyrite, Geochim. Cosmochim. Ac., 61, 323–339, https://doi.org/10.1016/S0016-7037(96)00320-1, 1997.
Wiersberg, T., Schleicher, A. M., Horiguchi, K., Doan, M.-L., Eguchi, N., and Erzinger, J.: Origin and in situ concentrations of hydrocarbons in the Kumano forearc basin from drilling mud gas monitoring during IODP NanTroSEIZE Exp. 319, 61, 206–216, https://doi.org/10.1016/j.apgeochem.2015.06.002, 2015.
Williams, L. B., Srodon, J., Huff, W. D., Clauer, N., and Hervig, R. L.: Light element distributions (N, B, Li) in Baltic Basin bentonites record organic sources, Geochim. Cosmochim. Ac., 120, 582–599, https://doi.org/10.1016/j.gca.2013.07.004, 2013.
Yamaguchi, A., Sakaguchi, A., Sakamoto, T., Iijima, K., Kameda, J., Kimura, G., Ujiie, K., Chester, F. M., Fabbri, O., Goldsby, D., Tsutsumi, A., Li, C.-F., and Curewitz, D.: Progressive illitization in fault gouge caused by seismic slip propagation along a megasplay fault in the Nankai Trough, Geology, 39, 995–998, https://doi.org/10.1130/G32038.1, 2011.
Zhang, J., Dong, H., Liu, D., Fischer, T. B., Wang, S., and Huang, L.: Microbial reduction of Fe(III) in illite-smectite minerals by methanogen Methanosarcina mazei, Chem. Geol., 292, 35–44, https://doi.org/10.1016/j.chemgeo.2011.11.003, 2012.