the Creative Commons Attribution 4.0 License.
the Creative Commons Attribution 4.0 License.
 | 15 Oct 2021
The effect of 2020 COVID-19 lockdown measures on seismic noise recorded in Romania
Felix Borleanu
Alexandru Tiganescu
Natalia Poiata
Raluca Dinescu
Dragos Tataru
After the World Health Organization declared COVID-19 a pandemic in March 2020, Romania followed the example of many other countries and imposed a series of restrictive measures, including restricting people's mobility and closing social, cultural, and industrial activities to prevent the spread of the disease. In this study, we analyze continuous vertical component recordings from the stations of the Romanian Seismic Network – one of the largest networks in Europe, consisting of 148 stations – to explore the seismic noise variation associated with the reduced human mobility and activity due to the Romanian measures against COVID-19 in detail. We focused our investigation on four frequency bands – 2–8, 4–14, 15–25 and 25–40 Hz – and found that the largest reductions in seismic noise associated with the lockdown correspond to the high-frequency range of 15–40 Hz. We found that all the stations with large reductions in seismic noise ( 40 %) are located inside and near schools or in buildings, indicating that at these frequencies the drop is related to the drastic reduction of human activity in these edifices. In the lower-frequency range (2–8 and 4–14 Hz) the variability of the noise reduction among the stations is lower than in the high-frequency range, corresponding to about 35 % on average. This drop is due to reduced traffic during the lockdown, as most of the stations showing such changes in seismic noise in these bands are located within cities and near main or side streets. In addition to the noise reduction observed at stations located in populated areas, we also found seismic noise lockdown-related changes at several stations located far from urban areas, with movement of people in the vicinity of the station explaining the noise reductions.
- Article
(19745 KB) - Full-text XML
-
Supplement
(1183 KB) - BibTeX
- EndNote


Seismic stations record various types of signals, from transients, like earthquakes, to the continuous small-amplitude ground vibrations of the Earth, often referred to as seismic noise. The latter has different origins and specific characteristics, depending on the frequency band in which it is recorded. At low frequencies (0.05–0.5 Hz), seismic noise has a natural origin linked to oceanic activities (Longuet-Higgins, 1950; Hasselmann, 1963) and exhibits strong seasonal variations (McNamara and Buland, 2004; Marzorati and Bindi, 2006; Diaz et al., 2010; Evangelidis and Melis, 2012; Grecu et al., 2012). Above 1 Hz, the seismic noise is mainly generated by different human and industrial activities presenting a pronounced variability between daytime and nighttime, as well as between weekdays and weekends. This signature of anthropogenic origin on seismic noise at high frequencies has been investigated and recognized in many studies around the world (McNamara and Buland, 2004; Groos and Ritter, 2009; Diaz et al., 2010, 2017; Nakata et al., 2011; Grecu et al., 2018).
The year 2020 has witnessed an unprecedented disruption in anthropic activities around the globe caused by the 2019 coronavirus disease (COVID-19), having a direct effect on seismic noise recorded by seismic stations. Recent studies have shown a significant reduction of the noise level due to the restrictions imposed by authorities at local, regional, and national scales to prevent the spread of COVID-19. The noise reduction was noticed at stations located inside cities (e.g., Tokyo, Barcelona, Milano, Verona, Florence, Catania, Auckland, Querétaro; see Yabe et al., 2020; Diaz et al., 2021; Poli et al., 2020; Cannata et al., 2021; van Wijk et al., 2021; De Plaen et al., 2021), but it has also been reported at stations far from populated areas (e.g., the Black Forest; see Lecocq et al., 2020a). The observed drop in the seismic noise is not uniform, it varies from one place to another depending on the characteristics of the noise sources in the area and the way they were affected by the different societal responses to activity restrictions (Xiao et al., 2020). The most comprehensive overview of the variations in seismic noise induced by anthropogenic activities during the COVID-19 pandemic is presented by Lecocq et al. (2020a). In this study, seismic noise data from more than 300 stations distributed worldwide were analyzed, and the results pointed out that disruptions in human activities such as traffic reduction, school closures, or reduction of tourist activities were responsible for the drop in the high-frequency (4–14 Hz) seismic noise levels of up to 50 %.
Similar to other countries, Romania has been significantly affected by COVID-19, with the first official case being reported on 26 February 2020. After the spread of the virus became an undisputed reality, the government started imposing mobility restrictions to limit the transmission of the virus and the number of infections. These restrictive measures were imposed gradually, with the first steps taken on 11 March 2020 when all schools in Romania were closed. On 16 March 2020, a state of emergency was declared, and the next day the first military order was issued. This order led to banning of all outdoor activities, the closure of cafes, and the restriction of the number of people involved in outdoor activities to a maximum of 100 persons. On 21 March 2020, the second military order was issued. It led to closure of all shopping centers, banning of groups of more than three people in the streets during daytime, and a curfew from 22:00 to 06:00. The Romanian government instituted the national lockdown on 24 March 2020 wherein all movements were restricted, except for those for work purposes, health needs, and essential activities. The lockdown ended on 14 May 2020, and from 15 May 2020 gradually some activities (opening of some shops, museums, etc.) were resumed. Since then, no other lockdown has been imposed in Romania. On 18 July 2020 the quarantine law came into force. An overview of these measures is also given in Table S1 (from the Supplement). This law regulated some necessary measures that ceased with the lifting of the state of emergency but that are still needed for limiting the spread of COVID-19.
The emergency measures taken to prevent the spread of COVID-19 in Romania provided a good opportunity to investigate the changes in seismic noise levels in relation to human activities during the restriction period (11 March–15 May 2020). In this study, we analyze the continuous data recorded at seismic stations of the Romanian Seismic Network (RSN) to reveal seismic noise variations before, during, and after the Romanian lockdown.
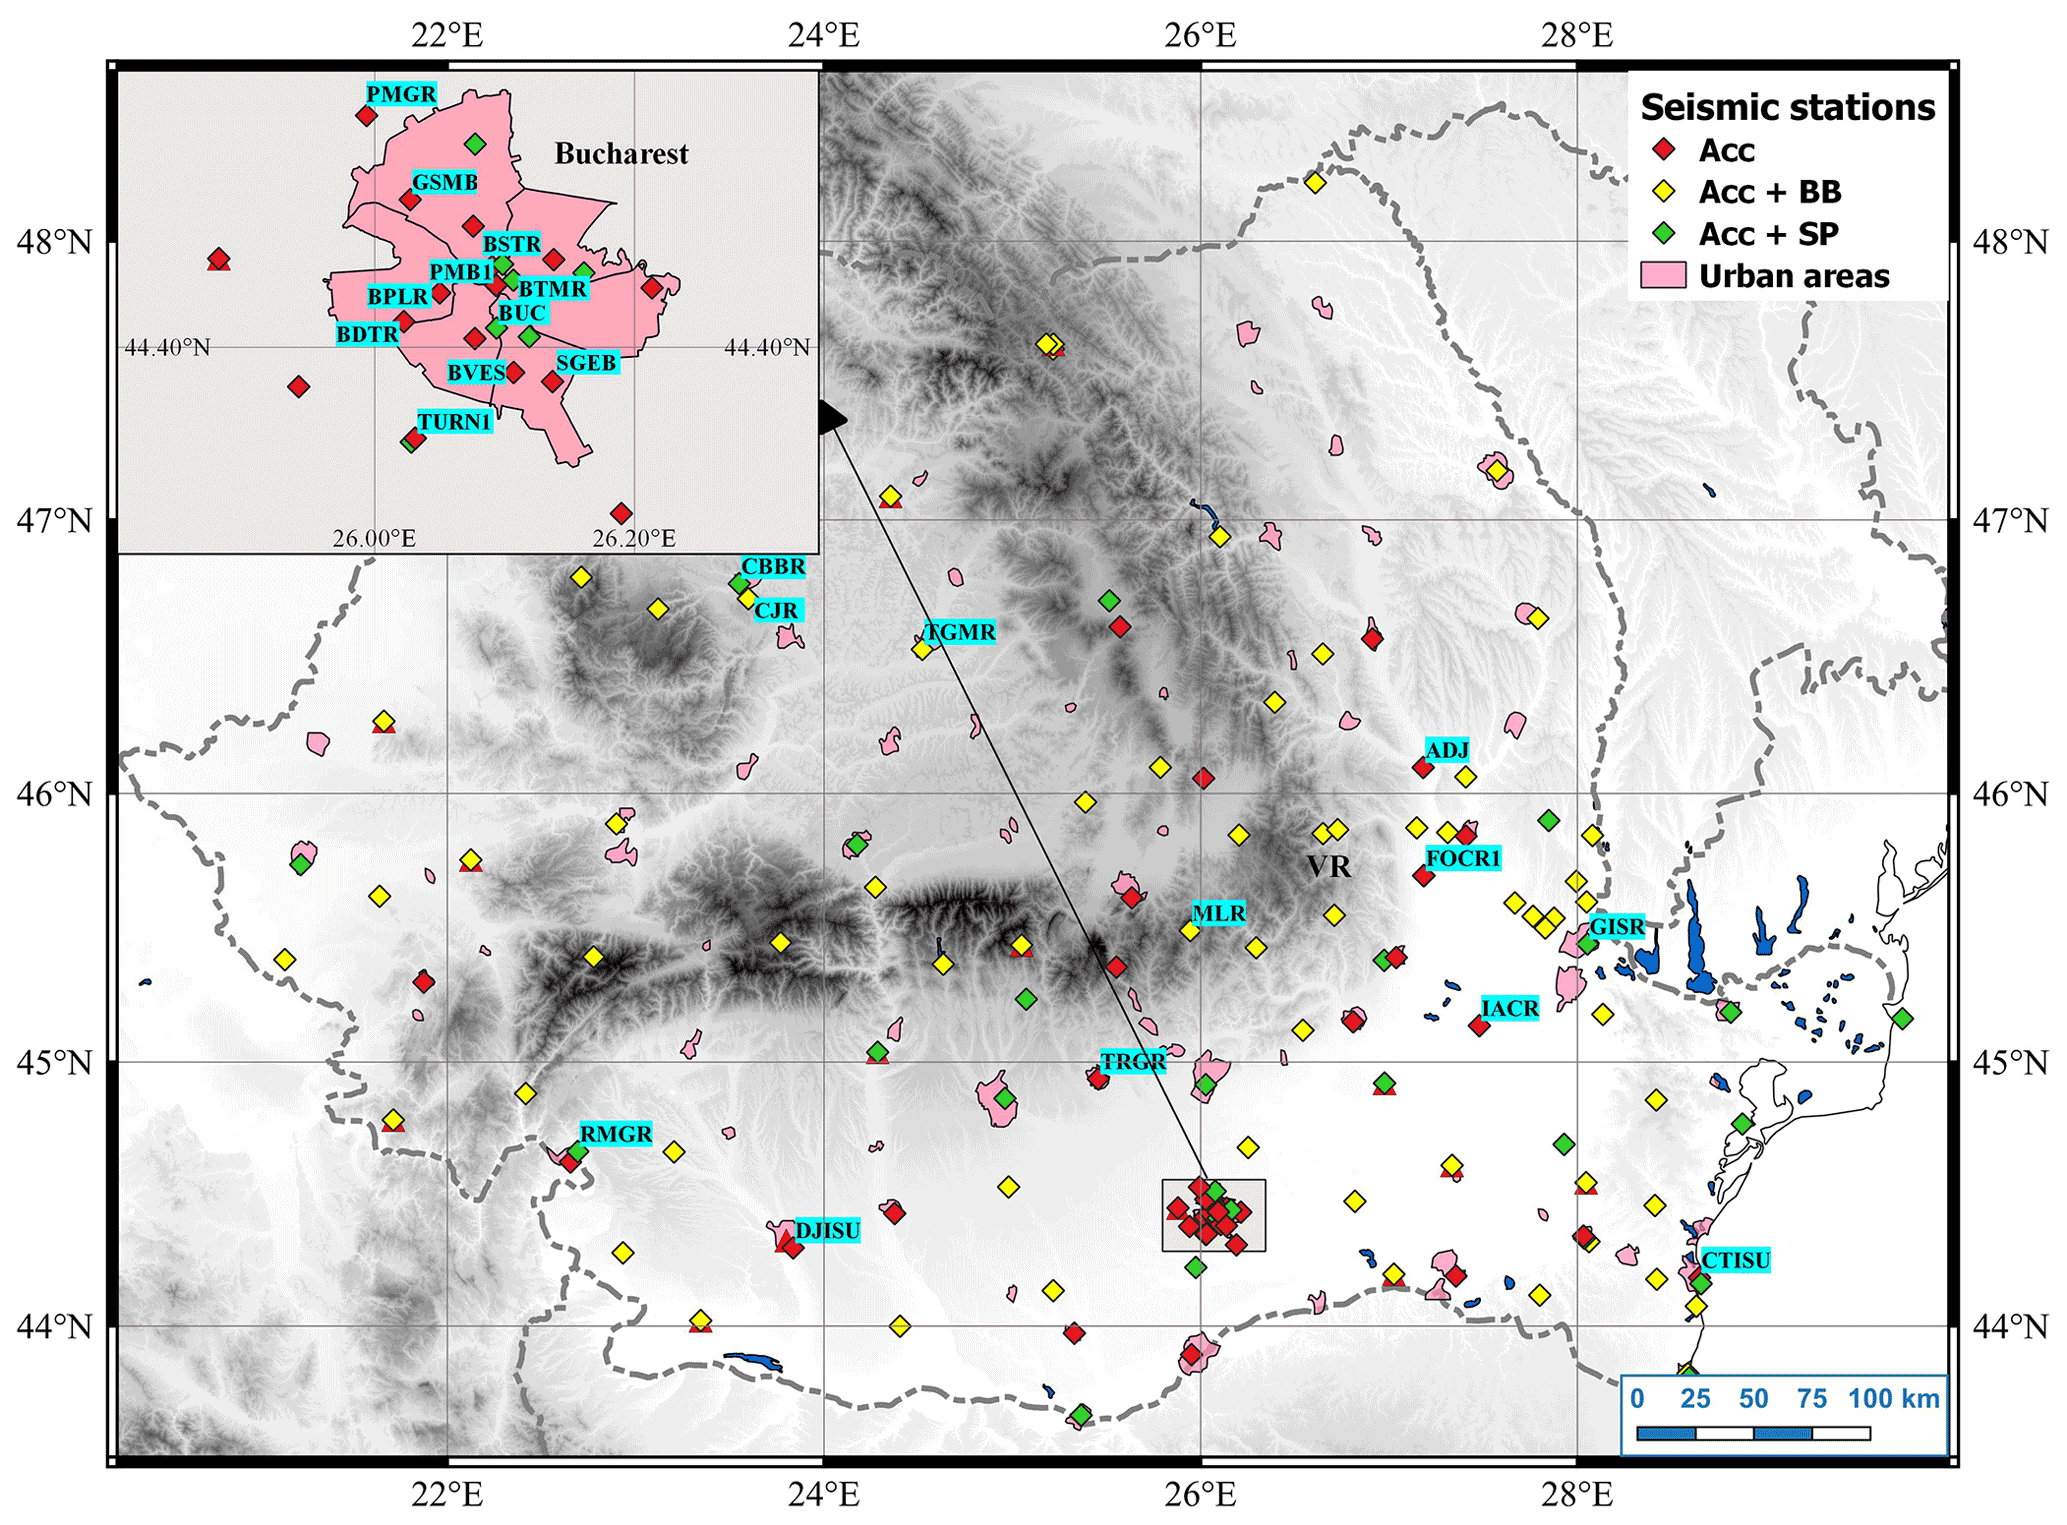
Figure 1Map showing the distribution of seismic stations in Romania. The inset map shows the sensors distribution in Bucharest city. The station codes are given only for the stations mentioned within the study. VR denotes the Vrancea seismic zone.
The RSN has been permanently enhanced and enlarged over the last 2 decades, becoming one of the largest real-time seismic networks in Europe (Marmureanu et al., 2021). RSN is operated by the National Institute for Earth Physics (NIEP) and consists of 148 stations (as of September 2020) equipped with strong and weak motion instruments. Of these, 43 stations have accelerometer sensors, 76 stations include both accelerometers and broadband velocity sensors, and 29 stations have accelerometers collocated with short-period velocity sensors (Fig. 1). All stations continuously record the ground motion at 100 Hz sampling rate, and the data are transmitted in real-time to the NIEP's Data Center. The RSN stations are deployed all over Romania in different environments. Of the 148 stations, 32 are installed in remote areas; 31 in sparsely populated places (population less than 2000 inhabitants); 24 in villages, communes, or small cities with a population between 2000 and 10 000 inhabitants; and 61 stations are installed within medium to large urban areas (Fig. 1).
To study the seismic noise variations, we analyze the continuous recordings from the vertical component of velocity and accelerometer sensors of the RSN stations that cover the time period from 4 March 2019 to 27 September 2020. The data processing was performed following the approach described by Lecocq et al. (2020a) and using the publicly available SeismoRMS software package (Lecocq et al., 2020b). The probabilistic power spectral density (PPSD) acceleration amplitudes (McNamara and Buland, 2004) are computed for each day using 1800 s time windows with 50 % overlap. The PPSDs are then converted to displacement spectral powers and finally, using Parseval's identity, to the displacement root mean square (DRMS) in the frequency domain of interest.
We investigate the changes in the DRMS in four frequency bands: 2–8, 4–14, 15–25 and 25–40 Hz (hereinafter referred to as Band 1, Band 2, Band 3, and Band 4, respectively).
We choose the above frequency intervals to take into account different contributions from anthropogenic noise sources in a wide frequency range, starting from 0.02 Hz up to 40 Hz (Sheen et al., 2009; Boese et al., 2015; Diaz et al., 2017 – for more details, see the Discussions section below). In addition, in order to avoid the seasonal variations of seismic noise at low frequencies (0.1–1 Hz), we chose to perform our analyses starting from 2 Hz. The upper limit of 40 Hz was adopted following the numerous examples of previous studies (e.g., Groos and Ritter, 2009; Diaz et al., 2017).
We present the results obtained mainly from the analysis of the accelerometer recordings because many stations in urban areas have only strong motion instruments. In addition, the DRMS computed from either accelerometers or velocity sensors show similar shapes for all the investigated frequency bands (see Fig. S1). However, for one particular station (MLR), the noise reduction was investigated on the broadband velocity sensor.
With the crisis caused by the COVID-19 pandemic, Google and Apple have made the mobility data they have used in their map products available to authorities and the general public to mitigate the effect of the emergency situation. To analyze the potential connections between seismic noise variation and mobility data across Romania, we used both data sets (Google and Apple mobility data) for two time intervals, 15 February–27 September 2020 and 13 January–27 September 2020.
3.1 General overview
Given the significant differences in terms of the locations of the seismic stations, we first quantitatively assessed the level of noise reduction across all the RSN stations during the national lockdown. For each station and defined frequency band, we computed the median of the noise DRMS during working hours (6–16 h) for 30 d intervals, one ending just before the school closure in Romania (from 10 February to 10 March 2020) and one during the lockdown (from 25 March to 23 April 2020). We computed the percentage of noise reduction between the two intervals and displayed it on the map in Fig. 2.
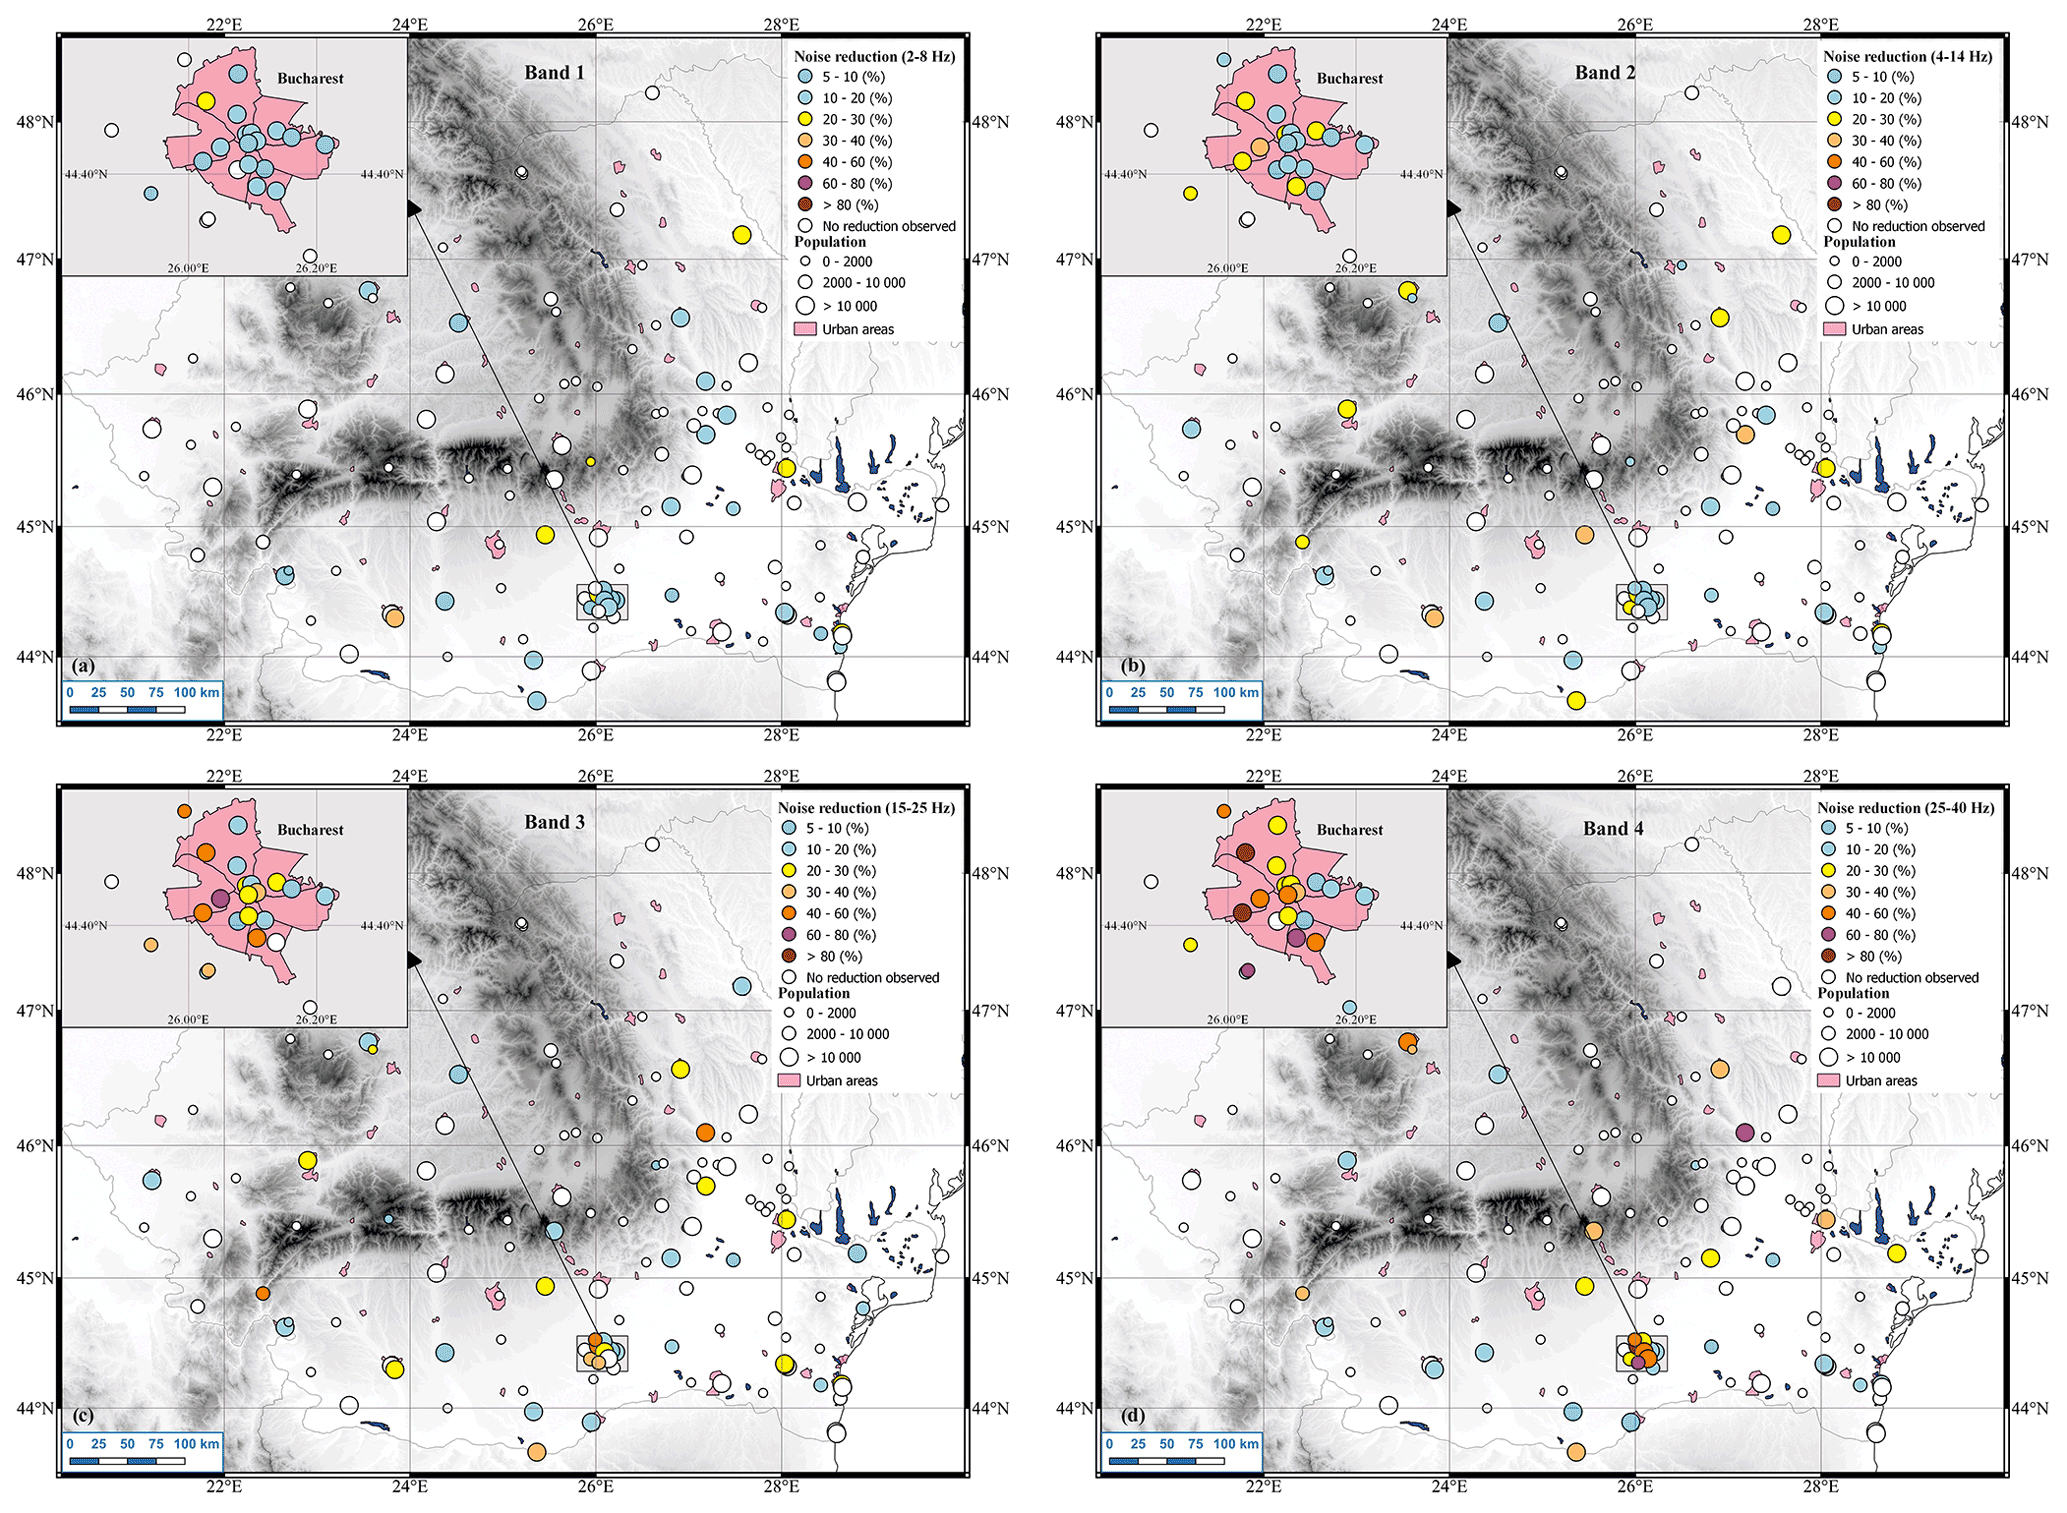
Figure 2Percent change in DRMS during the period 25 March–23 April 2020 (right after the stay-at-home order entered into force) with respect to the interval 10 February–10 March 2020 in the frequency bands (a) 2–8 Hz (Band 1), (b) 4–14 Hz (Band 2), (c) 15–25 Hz (Band 3), and (d) 25–40 Hz (Band 4). For each site, we show a circle colored according to the maximum percentage of the noise reduction in each band and sized as a function of the number of inhabitants in the area.
We observe noise reduction for all frequency bands. Band 1 shows the most homogeneous distribution of the noise reductions and the smallest variability of their values. A large number of stations (46) show noise reduction, ranging from 9 % at station RMGR to 35 % at station DJISU, most of these stations being located in urban areas (population over 10 000 inhabitants). However, for most of the stations, the drops in seismic noise vary in the 10 %–20 % interval. As the frequency increases, so does the noise level variation. In Band 2, 51 stations show noise reduction varying from 5 % at station IACR, located in a small commune, to 35 % at the stations sited in the Unirea Hotel in Focsani (Vrancea area). However, most of the stations located in larger urban areas reveal noise reductions in two intervals, 10 %–20 % and 20 %–30 %, respectively. In Band 3, the number of stations showing the noise reduction increases to 57, and the drops in seismic noise vary from 6 % at the station TGMR in Targu Mures to 66 % at the station BPLR in Bucharest. We observe the largest drops in noise levels in Band 4. For the stations GSMB and BDTR located in Bucharest, the noise decreased over 80 %. Large seismic noise drops were also observed at other stations in Bucharest or near the city as well as at the station ADJ located in the Adjud city. In total, 54 stations show noise reduction in Band 4. From Fig. 2 we also observe that the reduction of noise is weaker for the stations in less populated and remote areas. At these stations, the drop in seismic noise varies between 10 % and 20 %, except for the station CJR where the noise decreased by 34 % in Band 4 during the lockdown.
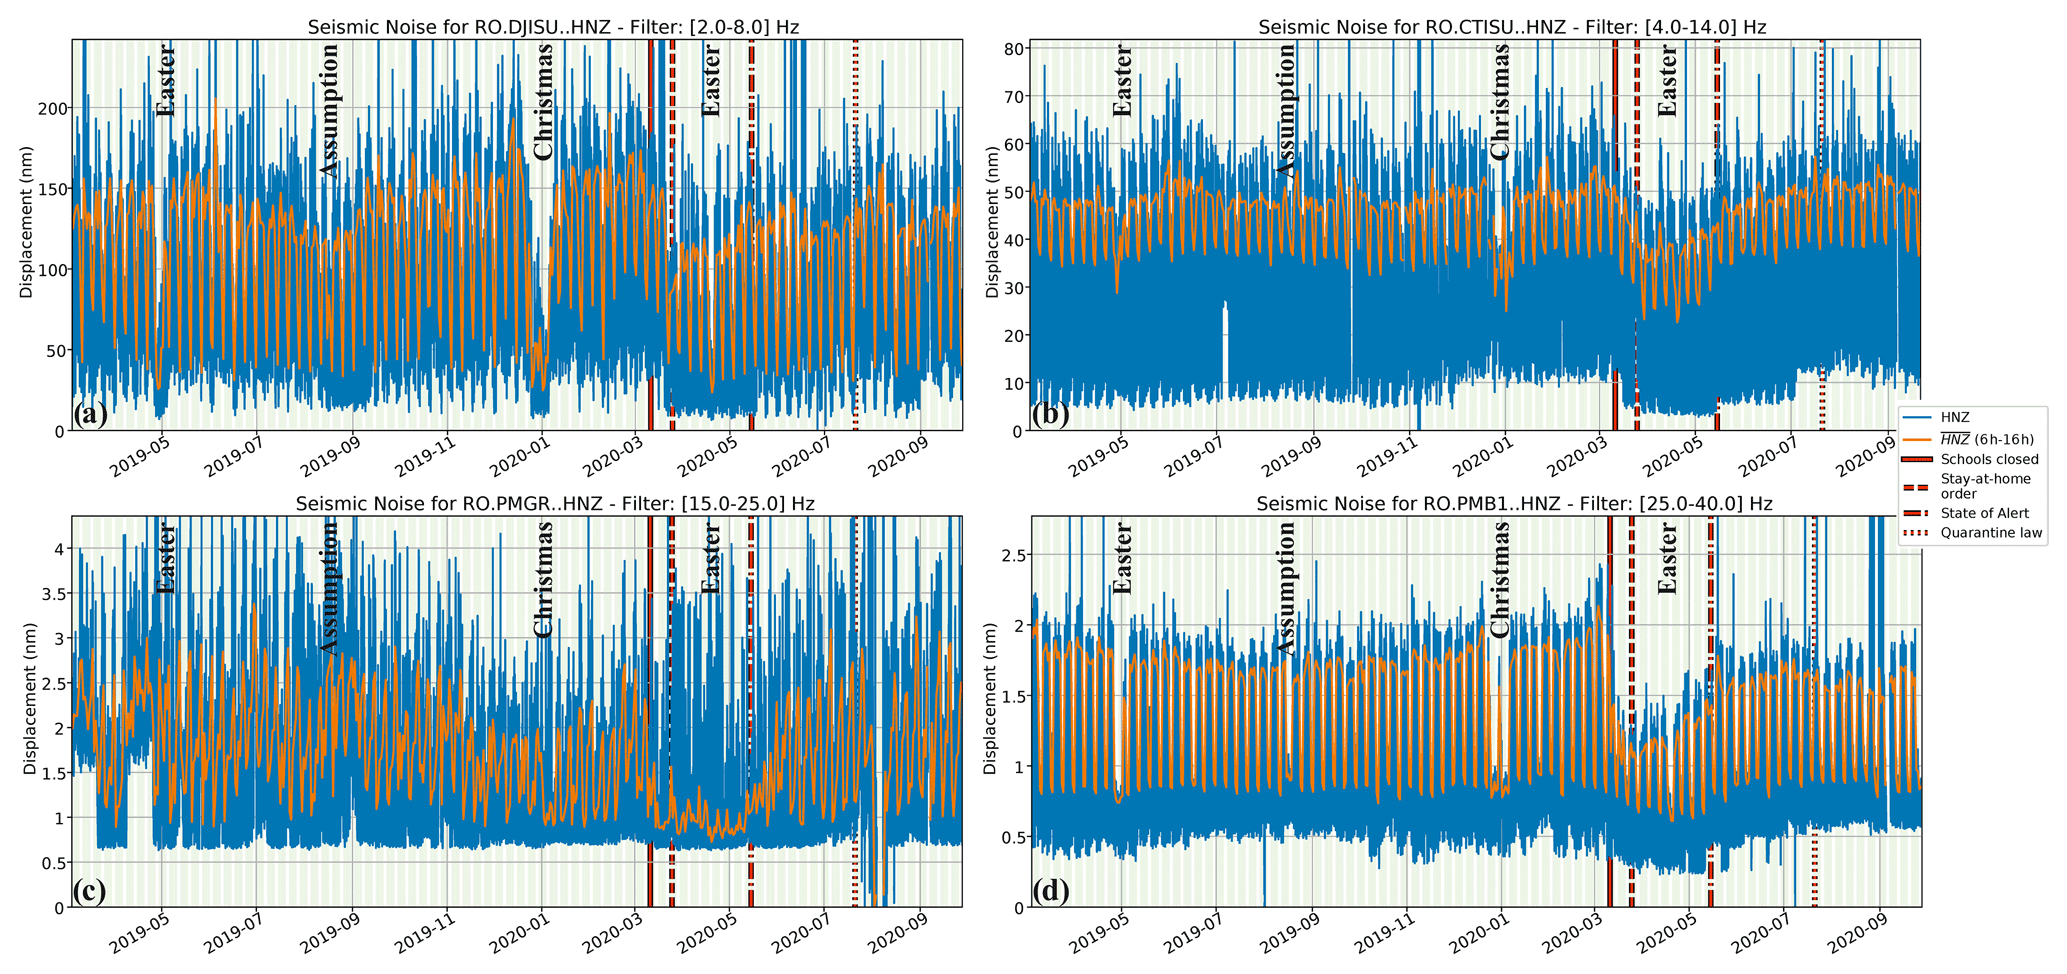
Figure 3Long-term evolution of DRMS in four different frequency bands observed at the stations: (a) DJISU (2–8 Hz), (b) CTISU (4–14 Hz), (c) PMGR (15–25 Hz), and (d) PMB1 (25–40 Hz). The locations of the stations are displayed in Fig. 1.
Analysis of the data over a longer time period allowed us to compare COVID-19 related noise changes with those observed during Orthodox celebrations (Easter and Christmas), as well as the summer and winter holidays. During these periods, human mobility and activities decrease considerably compared to normal weekdays. In Fig. 3, we show the evolution of the DRMS at four stations during the March 2019–September 2020 period for different frequency bands. The stations are installed in different locations: DJISU (Fig. 3a) is sited in the yard of the Inspectorate for Emergency Situations (IES) in Craiova city (population > 250 000) close to the main national road and railway, CTISU (Fig. 3b) is installed at the basement of the IES building in Constanta city (population > 270 000) close to the main and secondary streets, PMGR (Fig. 3c) is located close to Bucharest in the park of Mogosoaia town (population ∼ 8000) near important tourist attractions (the Palace of Mogosoaia and the church), and PMB1 (Fig. 3d) is a station located downtown Bucharest (population > 1 800 000) in the City Hall building near a very busy boulevard.
All stations located in large urban areas (CTISU, DJISU, PMB1) show clear drops in seismic noise between weekdays and weekends and during the religious and winter holidays (Orthodox Easter 2019, Christmas 2019, and New Year 2020). The seismic noise at stations CTISU and DJISU is mainly affected at lower frequencies (Bands 1 and 2) by noise sources generated by light and heavy traffic as these stations are close to important roads and streets. The lowest noise level is observed during the Easter and winter holidays. For station CTISU, the drop in DRMS during the lockdown is comparable to the drop observed during the holidays and reaches its minimum during the 2020 Easter weekend (17–20 April 2020). The reduction of noise at station DJISU due to quarantine measures was not significant since it did not reach a level similar to the one observed during the Orthodox Easter and Christmas holidays in 2019. A similar level of noise drop was noticed only during the Orthodox Easter in 2020. At the station PMB1, noise changes in Band 4 are regular, with relatively constant large drops between weekdays and weekends and during the holidays. At this station, in comparison to others, another seismic noise reduction related to a religious celebration is observed. On 15 August 2019, the Assumption was celebrated and people working for the public institutions had a day off. In 2019, this holiday fell on a Thursday, and the Romanian authorities, to help the tourism, established that Friday would also be a day off. Therefore, the noise reduction is observed over a period of several days, which includes the weekend. During lockdown the noise level at PMB1 drops significantly, reaching the level observed during Orthodox holidays and even exceeding it at the time of Easter in 2020. Station PMGR, on the other hand, shows a different trend. First, the seismic noise increases during the weekends, when more people go out in the park for recreational activities and for visiting the palace and church, and decreases on weekdays, when there are fewer people walking in the park. Second, the noise reduction is evident only for the Christmas 2019 and New Year 2020 holidays, when temperatures in Romania are around 0 ∘C and not many people go for a walk in the park. During the warmer holidays (Orthodox Easter and Assumption 2019), the noise level increases and reaches its maximum level. The lowest noise level at this station is, however, reached during the lockdown.
3.2 Stations in cities
In this section, we present the results for several stations located in urban environments in different contexts: free field, in schools, and in buildings at different floors.
3.2.1 Free-field stations
In urban areas, road traffic, the underground and surface transportation system (tram, train), and industry represent the most important noise sources responsible for generating high-frequency anthropogenic vibrations (Long, 1971; Green et al., 2017). These sources are different from one city to another and even can vary within cities. The preventive measures taken to limit the spread of COVID-19 within the communities have affected all the above-mentioned noise sources in urban areas. Even though the lockdown was uniformly imposed at a national level, the reduction in seismic noise shows significant variability among the stations located in the same cities (Fig. 2). The largest reductions in seismic noise were observed in Band 3 and Band 4 for the stations located in urban areas as follows: values up to 75 % at ADJ (Adjud city), 66 % at BPLR (Bucharest city). and 52 % at PMGR (Mogosoaia city). In Band 1 and Band 2, the largest drops of 35 % and 31 % were noticed at stations DJISU (Craiova city) and TRGR (Targoviste city), respectively.
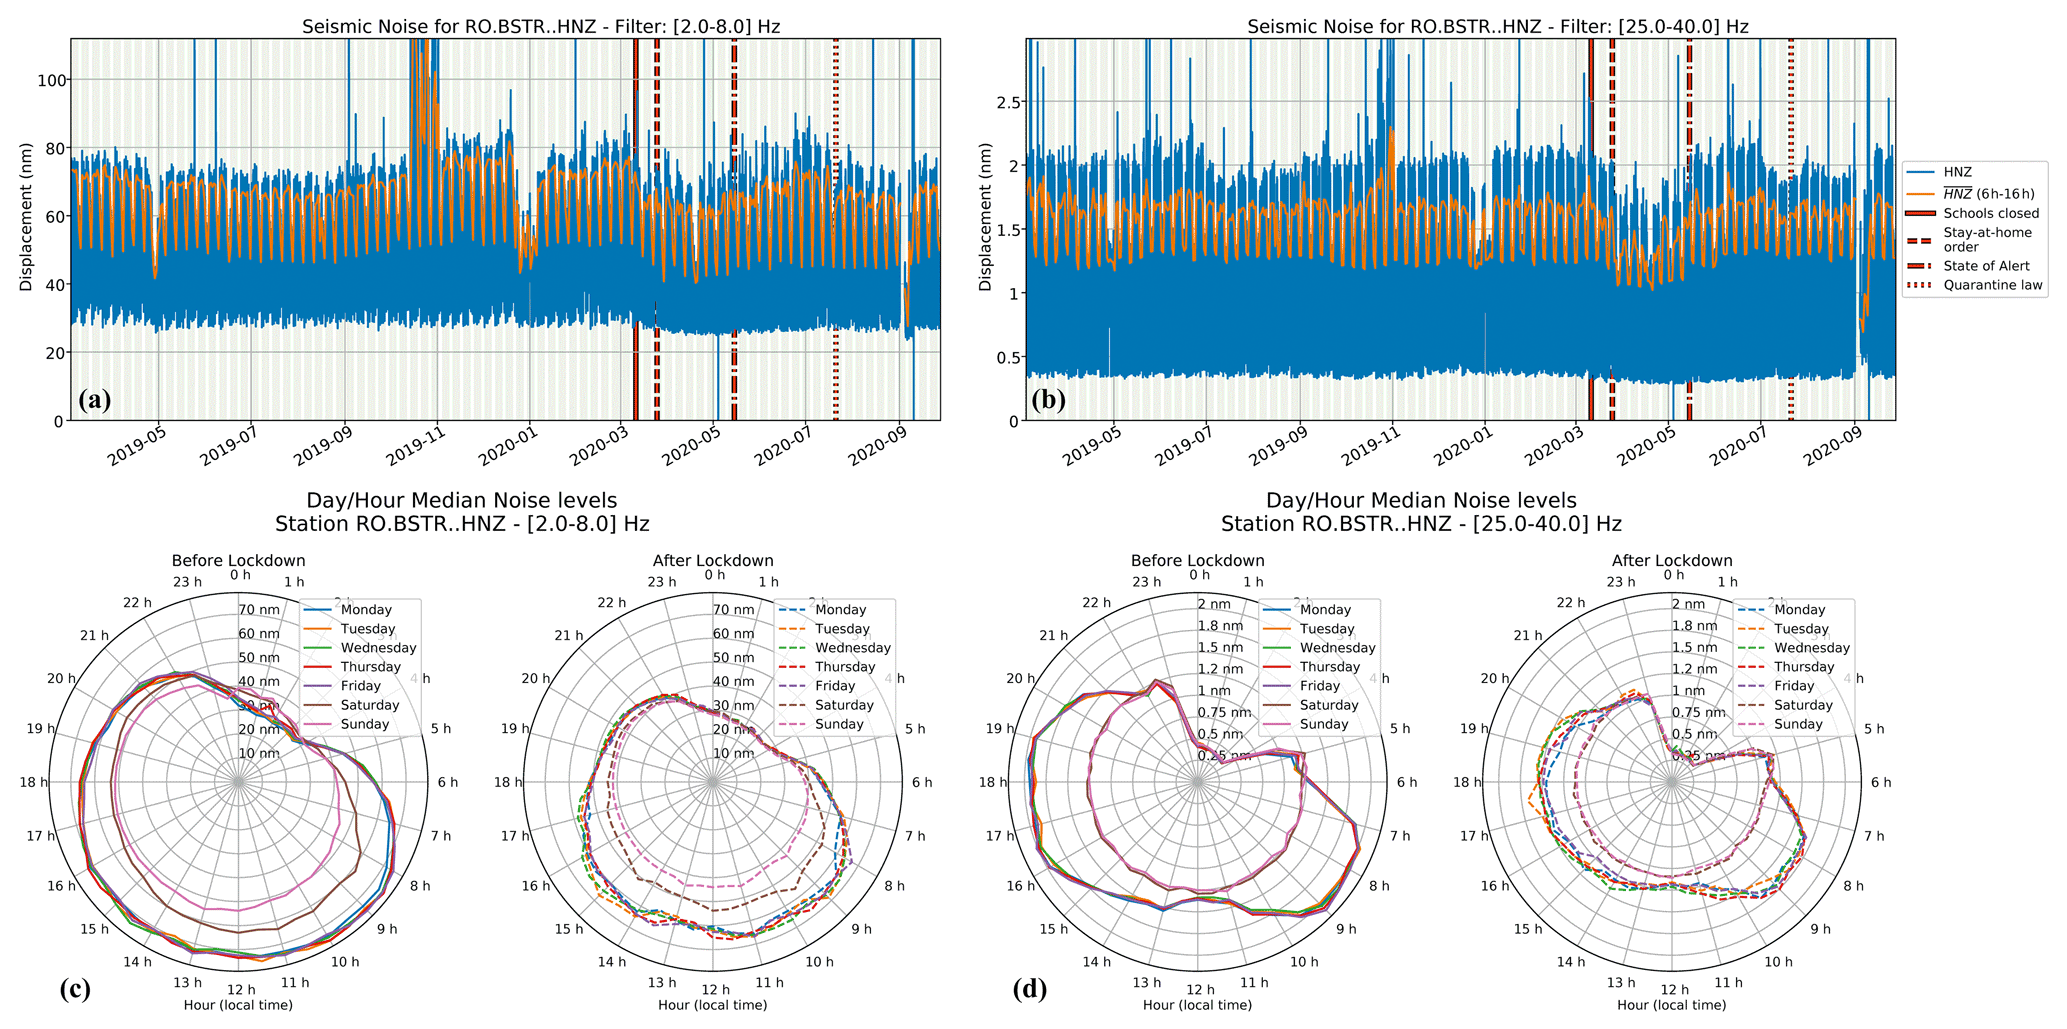
Figure 4Lockdown effects on seismic noise in downtown Bucharest (BSTR). (a, b) Evolution of DRMS for the March 2019–September 2020 period based on displacement data in the bands 2–8 Hz (a) and 25–40 Hz (b). Panels (c, d) display 24 h clock plots showing average displacement variation for each day of the week and for the period before lockdown (27 January–24 March 2020) and during lockdown (25 March–17 May 2020) for the bands 2–8 Hz (c) and 25–40 Hz (d). The location of the station is displayed in Fig. 1.
We show the results for several stations deployed in different urban conditions. We first display the noise changes at the station BSTR, sited in downtown Bucharest in one of the busiest areas of the city. The station is close to two main boulevards and roundabouts, with heavy traffic generated by cars and buses, and also located about 100 m away from the metro stations. Figure 4 shows the lockdown effects on seismic noise at station BSTR. At this station, we found a reduction in seismic noise after the lockdown in all frequency bands, with a maximum of 27 % observed in Band 4 (Fig. 4b). The noise level starts to decrease after the school closure on 11 March 2020 and reaches its minimum after the stay-at-home order (Fig. 4a). In the same frequency range, the noise reduction is comparable with the one seen during the Orthodox celebrations. However, the reduction in noise in Band 1 is similar for the Orthodox Easter in 2019 and 2020. The 24 h clock plots in Fig. 4c, d show similar patterns before and after lockdown started, denoting constant noise sources in both periods that are less intense during the lockdown. In Band 1, the noise variation is uniform with no variation between weekdays and weekends. The lockdown resulted in the restriction of the nighttime activities, which led to a reduction in seismic noise compared to that observed before. In Band 4, the noise variations show signatures related to signals generated by the subway transportation system (Diaz et al., 2017). The subway train running schedule is between 05:00 and 23:00 LT (local time) – the last train leaving from any terminal station – for both weekdays and weekends. The frequency of the trains increases during morning hours, decreases slowly at noon, and then increases again until 19:00 LT, when the number of trains in use starts to decrease again (see the following link for the train schedule, http://www.metrorex.ro/program_circulatie_in_zile_lucratoare_p1379-1, last access: 22 March 2021). On the weekends the frequency of trains remains constant throughout the work program. We noticed a good correlation between the noise variation and the schedule of the subway trains. For weekdays, we identify two lobes of maximum amplitude, in the morning and in the afternoon, respectively. In between, we observe a decrease in the noise level, which is more pronounced between 11:00 and 13:00 LT and is related to the longer inter-train intervals. In contrast, there is no variation in seismic noise during the weekend. After the lockdown starts, the pattern remains almost the same as before, but the noise level is reduced.
The station BPLR is also located in Bucharest close to one of the largest shopping centers in the city. Other significant noise sources affecting the site are three main boulevards with intense traffic, one near the college and possibly, the subway station, which is about 500 m away. The observed reduction in seismic noise is up to 66 % in Band 3 and up to ∼ 42 % in Band 4. We link the decrease in the noise amplitude in these frequency bands more to the reduction of school activities and less to those of the shopping center. The seismic noise level dropped (by up to 66 %) following the school closure on 11 March 2020 and stayed low, at the level observed during religious and winter holidays in 2019, until the end of lockdown (Fig. 5). The increase in seismic noise observed in July 2020 is linked to the reopening of the shopping centers starting from mid-June 2020. After the quarantine law came into place, a slight decrease in seismic noise is observed. The noise level grew again, reaching its maximum after the lockdown when the schools were reopened in September 2020.

Figure 5Lockdown effects on the seismic noise at station BPLR in Bucharest. The large drop in seismic noise of up to 66 % is observed right after the school closure on 11 March 2020 (see Fig. 1 for the station locations).
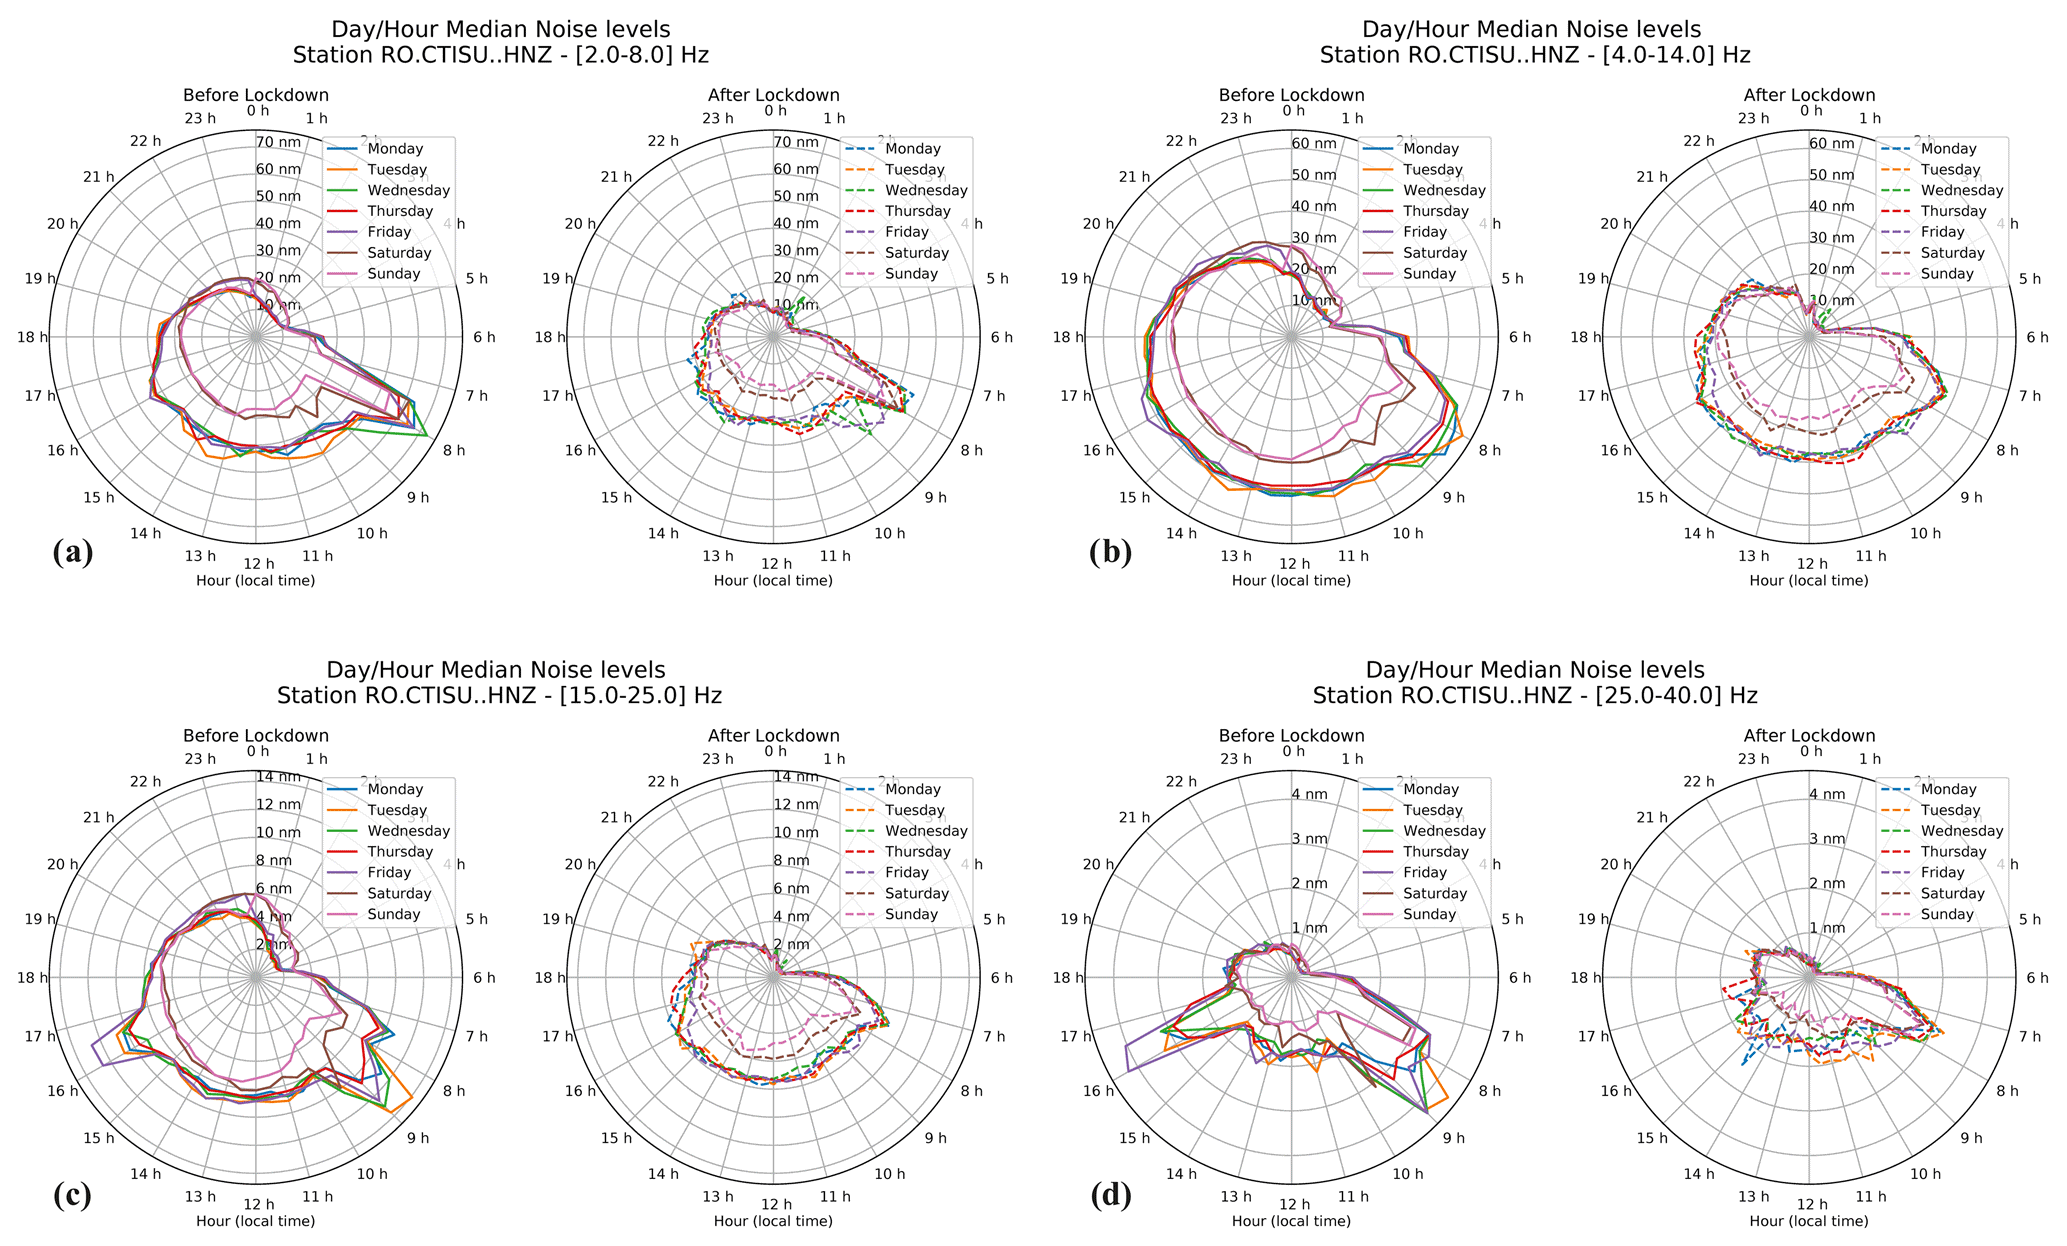
Figure 6Lockdown effects shown on 24 h clock plots at station CTISU in Constanta city for the frequency bands 2–8 Hz (a), 4–14 Hz (b), 15–25 Hz(c), and 25–40 Hz (d) (see Fig. 1 for the station locations).
Another relevant example is shown by the CTISU station, located in Constanta city, in the basement of the IES building. In the station area, there are also other public institutions, such as the General Inspectorate of Gendarmerie of Constanta County, the General Directorate of Social Assistance and Child Protection, and two educational units, a secondary school and a college. The reduction in seismic noise following the lockdown is visible in all frequency bands (Fig. 6). In Band 1 and Band 2, we see a very homogeneous variation in seismic noise before and after lockdown. We observe an increase in the noise level in the morning hours and a relatively constant level between 09:00 and 16:00–17:00 LT. The noise level decays in the evening hours. Before the lockdown, we see an increase in the noise levels during weekend night hours, which is no longer observable after the lockdown. We assume that the pattern of the noise variation in Band 2 is related to the overall traffic in the area, while Band 1 shows a combination between the overall traffic and the specific activities at the IES. In Band 3 and Band 4, we observe two peaks in the noise levels before lockdown related to the arrival and departure times of employees to and from work. The lockdown significantly reduced the number of employees working in the office, and this reduction translates into the disappearance of the two peaks. In Band 3, we continue to observe an increasing trend in the noise levels during nighttime hours, and we assume that the traffic still has a contribution in this frequency domain.
3.2.2 Stations in schools
The pandemic has strongly impacted the education process in many countries around the world, including Romania. The first measures taken by the Romanian authorities were to close all schools (from kindergarten to high schools) in the country starting on 11 March 2020. The universities were closed on 24 March 2020, when the stay-at-home order was given. These moments were captured very well by five stations of RSN installed in educational units (BDTR, BVES, CBBR, GSMB, SGEB) and two stations sited in the proximity of schools (ADJ and BPLR). All of them show the largest drops in seismic noise of up to 80 % in Band 4, except for station BPLR (see aforementioned discussion). In Fig. 7a, b, we show the long-term evolution of the noise DRMS for a station located in a kindergarten in Bucharest (BDTR) and one sited in University Babes-Bolyai of Cluj-Napoca city (CBBR). In both cases, the noise reduction is recognized immediately after the school's closure. For station BDTR, the drop in seismic noise is steep and up to 80 %. The noise level reaches the level observed during the 2019 religious (Easter and Christmas), summer, and winter holidays. The noise level remains low until the middle of September 2020, when students and teachers returned to school. Station CBBR shows a slightly different behavior with a drop of 46 % during the lockdown. The noise level gradually decreases after the school closure and reaches the level observed during holidays at the time of the lockdown. The minimum is reached during the 2020 Orthodox Easter, after which the noise level begins to increase and reaches a maximum for 2 weeks at the end of July 2020. The noise level drops again to the lockdown level and increases at the end of September 2020 when students start returning to face-to-face learning. At these stations, the noise is predominantly generated in Band 4 by human mobility and activity inside the buildings where the stations are located. Figure 7c highlights this observation and shows the noise variation for each day of the week for the period before and after lockdown in a 24 h clock representation. The noise level at the BDTR station is influenced by the time marks specific to the teaching activities conducted in a preschool education unit. It increases with the arrival of children to the kindergarten (at 08:00 LT), reaches a maximum around 10:00–11:00 LT when the educational process occurs, decreases during the rest period (between 13:00 and 15:00 LT) and increases slightly again when children are picked up by their parents between 15:30 and 16:30 LT. This pattern fully disappears during the lockdown. At the CBBR station (Fig. 7d), the educational activities within the university are much more uniform throughout the day, and it translates into noise variation without significant fluctuations. After the lockdown started, the noise shows a similar pattern as before but with a clear and significant reduction in amplitude.

Figure 7Temporal changes in seismic noise at a kindergarten in Bucharest (BDTR) (a) and the university in Cluj-Napoca (CBBR) (b). The lower row shows 24 h clock plots that give the average displacement variation for each day of the week and for the period before and during lockdown at (c) BDTR and (d) CBBR stations. The locations of the stations are displayed in Fig. 1.
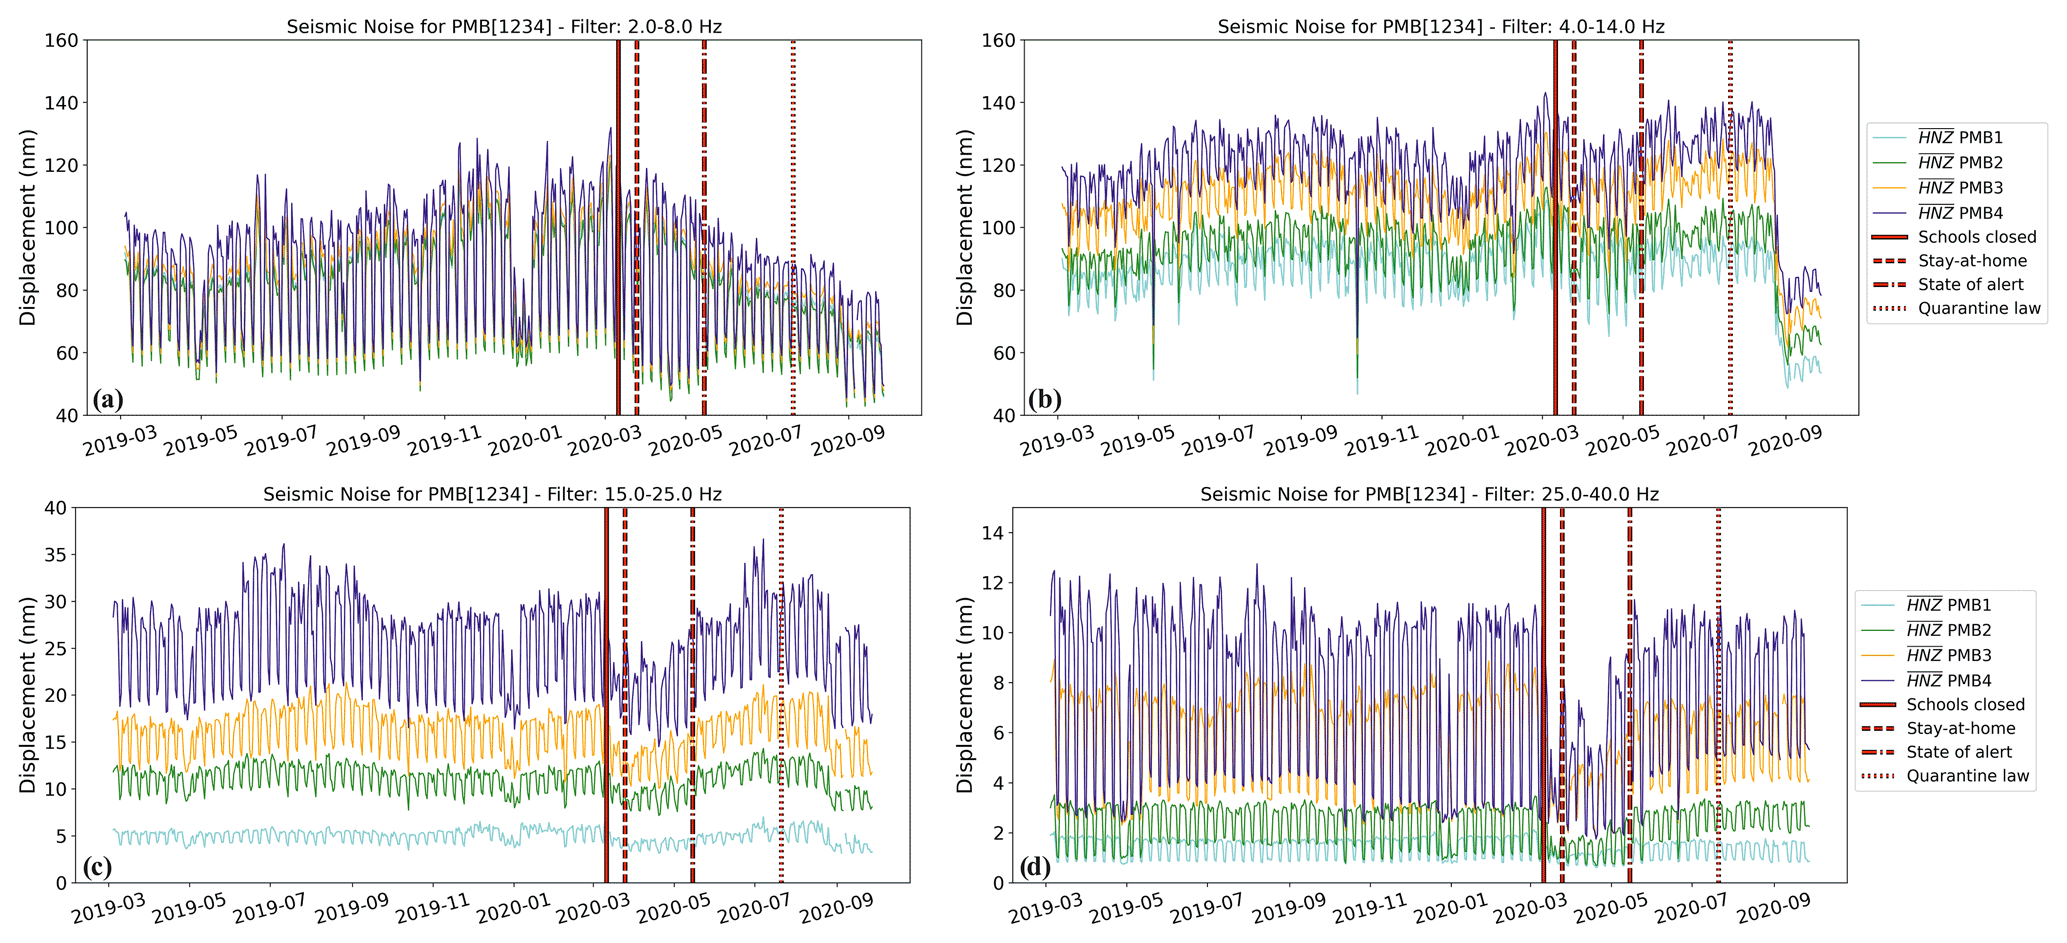
Figure 8Long-term DRMS variations at the stations located in the Bucharest City Hall building observed in the frequency bands 2–8 Hz (a), 4–14 Hz (b), 15–25 Hz (c), and 25–40 Hz (d). Note the higher noise levels in the lower-frequency bands and the significant increase in the noise levels at the stations deployed from the ground floor to the top of the building (see Fig. 1 for the station locations).
3.2.3 Stations in buildings used for structural monitoring
In this section, we present the results of the changes in the seismic noise observed at three seismically instrumented buildings. One is located downtown Bucharest, one in Magurele (a town located ∼ 15 km south of Bucharest), and one in the city center of Focsani (Vrancea area). The Bucharest City Hall building (PMB) was retrofitted in 2016 and equipped with earthquake-protection system (base-isolators and viscous dampers) and the monitoring system consisting of four accelerometers inside the structure at the ground floor (PMB1), second floor (PMB2), third floor (PMB3), and attic (PMB4). The second building, located in Magurele city, is the headquarters of the Institute of Atomic Physics (IAP). It is an office building retrofitted after the Vrancea 1977 earthquake and instrumented with three accelerometers installed in the basement (TURN1), sixth floor (TURN2), and 10th floor (TURN3; see Tiganescu et al., 2019, 2020). The third instrumented building is Unirea Hotel in Focsani, where stations are deployed in the basement of the structure (FOCR1), the fourth floor (FOCR2), and the eighth floor (FOCR3).
Stations located in the Bucharest City Hall building show similar behavior in terms of DRMS changes, depending on the frequency band in which they were analyzed, regardless of the floor on which the stations are installed (Fig. 8). The lockdown effect is observed in all frequency domains but is more pronounced in Band 4, with noise reductions between 41 % and 49 %, and in Band 3, with noise reductions between 23 % and 27 %. In both frequency domains, the noise starts to decrease after the school closure on 11 March 2020. Variations of the noise, with maxima during weekdays and minima during weekends, are visible in the lockdown period. The lower noise levels are comparable with those observed during the religious and winter holidays in 2019. The noise level started to increase again before the end of lockdown. After the Romanian authorities lifted the lockdown restrictions and declared the state of alert, noise levels reached the level of the pre-lockdown period. In Band 3, the seismic noise drops again starting at the end of August 2020 to the noise level observed during the lockdown. This drop is associated with the start of the campaign for the local elections in Bucharest. We assume that the start of the political campaign for the local election led to numerous meetings with the community. Such meetings are typically held outside of the City Hall and involve many employees. This diminishes the number of people and the working hours within the City Hall building. It is worth mentioning the increase in the noise level between floors and the differences in the noise level between frequency bands. The noise levels increase by a factor of 5 at the station at the top of the building compared to the station at the ground level in Band 3 and by about a factor of 10 in Band 4. However, the noise level for the stations on the same floor is 2–3 times larger in Band 3 than in Band 4. This behavior could also be attributed to the structural peculiarities of the building and the sensor position. The E-shaped masonry structure is a rigid construction, with thick walls (ranging from 42 cm for the interior walls of upper stories up to 112 cm exterior walls at the basement) and reinforced concrete slabs. We should mention that all the sensors are located above the seismic protection system, thus the high-frequency content of the exterior vibration sources is reduced, as indicated in Fig. 8 for Band 3 and Band 4. However, for the upper floors, the high-frequency vibrations are transmitted and amplified by the structure itself.
In Band 1 and Band 2 the lockdown effects are not as visible as in the higher-frequency bands. In Band 1, the noise level decreases gradually starting with 11 March 2020, until the end of September 2020 when it becomes comparable with the level observed during the Orthodox Easter, Christmas, and New Year 2019. In Band 2, the variation of the noise is reduced and relatively constant over the entire analyzed period of 19 months. Starting with the end of August 2020, a significant drop is observed. This decrease in the noise level is associated with the start of the campaign for the local elections. In these two frequency domains, the variations of the noise level between stations at different floors and between the Band 1 and Band 2 are not as pronounced as for the higher-frequency bands.
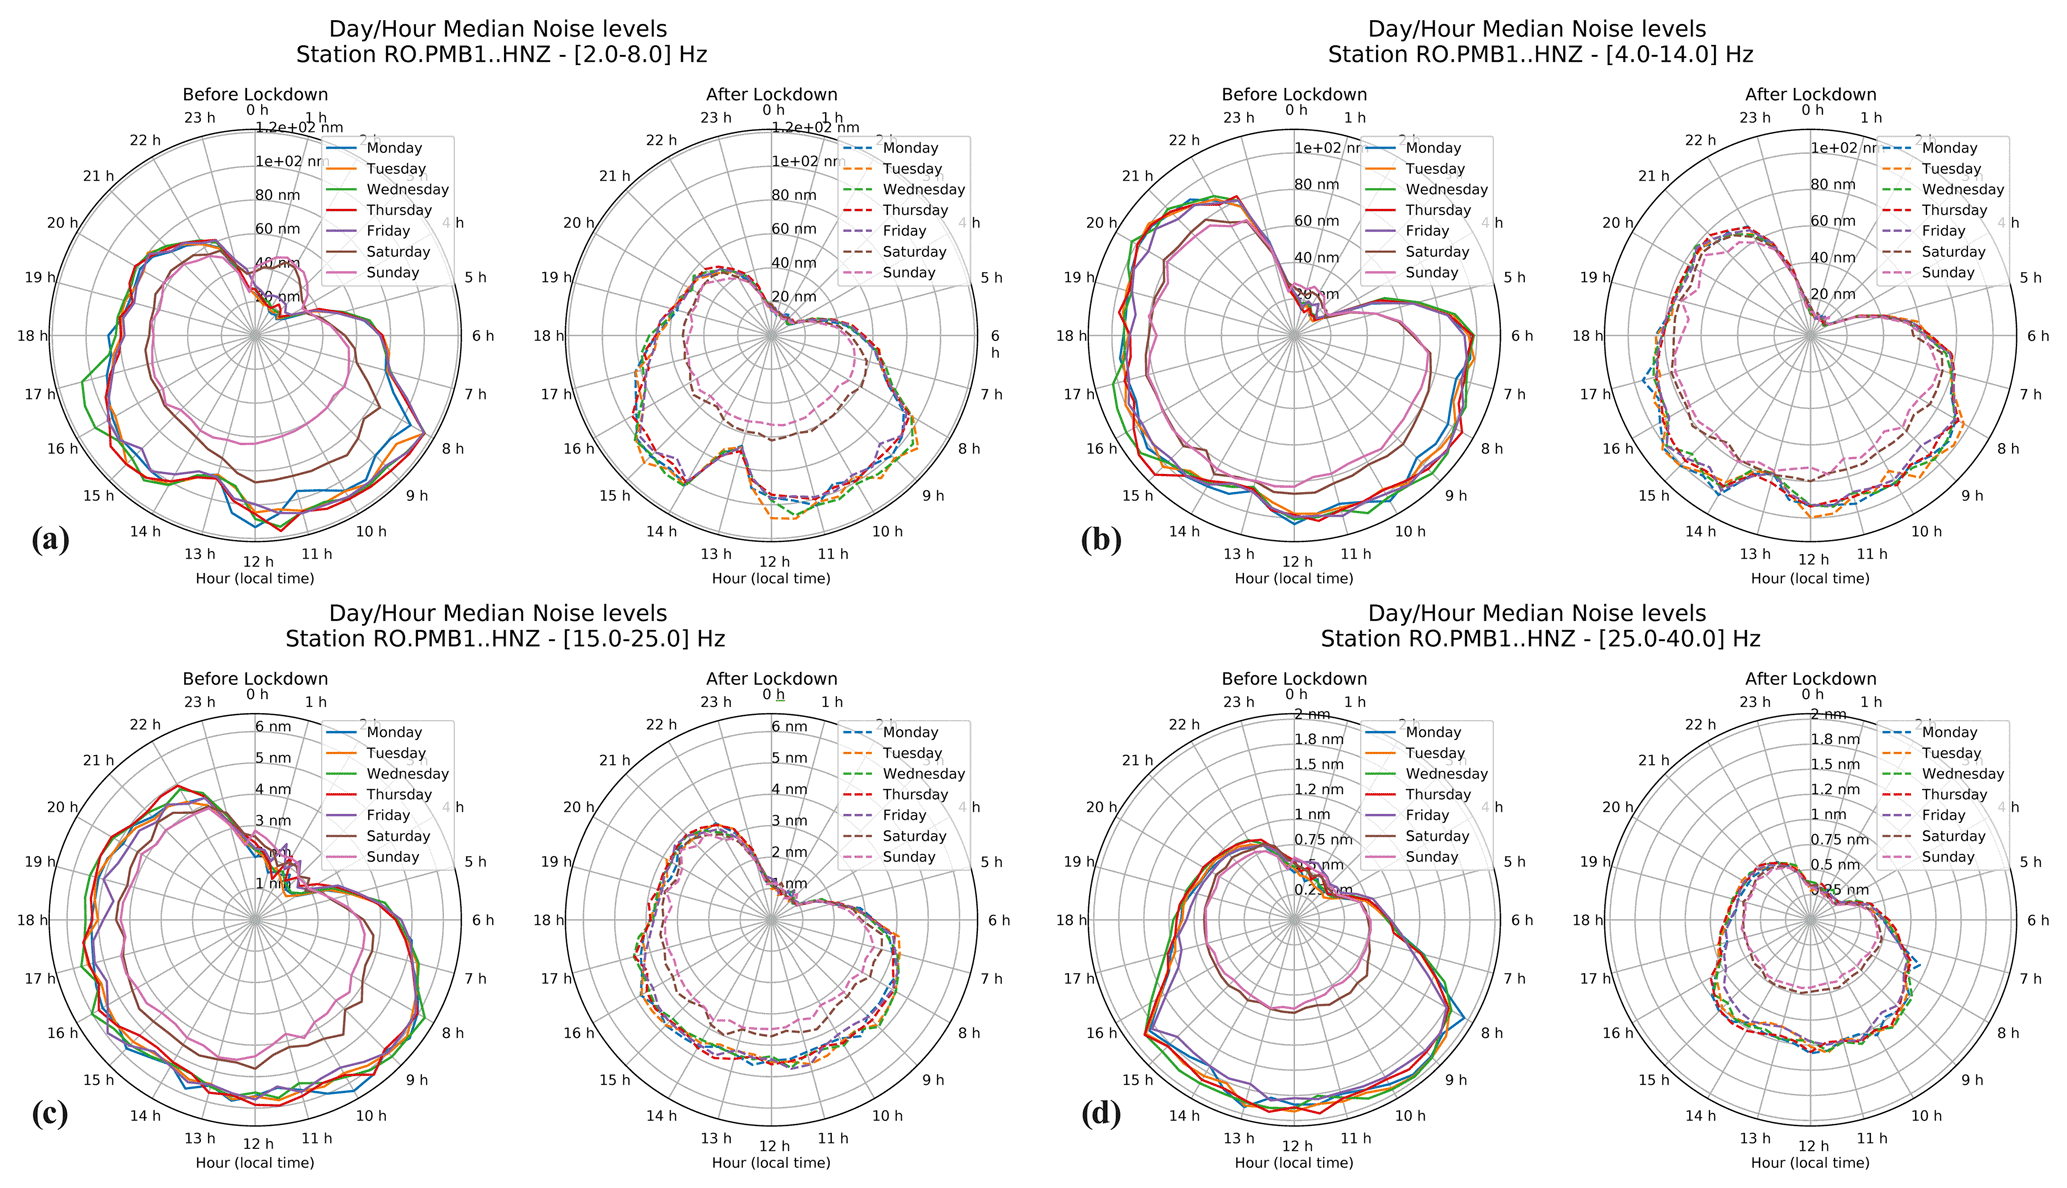
Figure 9Lockdown effects shown on 24 h clock plots at the station PMB1 located in the Bucharest City Hall building (ground floor) for the frequency bands 2–8 Hz (a), 4–14 Hz (b), 15–25 Hz (c), and 25–40 Hz (d)(see Fig. 1 for the station locations).
In Fig. 9, we show in a 24 h clock representation the noise variation at station PMB1 in Band 1 to Band 4 for each day of the week for the period before lockdown and after lockdown started. In Band 1, and to some extent in Band 2, the lockdown has filtered out the contribution of different sources on the noise variation. Before the lockdown, the noise behavior is similar between weekdays, with the noise level starting to increase around 05:00 until 08:00 LT. Between 08:00 and 16:00 LT, the noise level is relatively constant, and afterwards it starts slowly to decrease until 22:00 LT when the reduction accelerates. During nighttime hours, the noise level is at its minimum, except on the weekend when we observe an intensification of the noise level between 00:00 and 03:00 LT. We also see an increase in the noise during Saturdays between 08:00 and 12:00 LT compared to Sundays. During the lockdown, the noise increases more steeply to its maximum around 08:00 LT and then decreases more rapidly after 16:00 LT. The decrease in the noise level between 12:00 and 14:00 LT is more pronounced than before lockdown. Furthermore, the noise attains the same level during the Saturdays and Sundays after the lockdown and no increase in the noise level is observed during the night. Band 1 seems to be the most suitable to observe people's activities within City Hall before the lockdown because it better reflects their daily schedule. We could notice (before the lockdown) a sharp increase in the noise during Saturdays between 08:00 and 12:00 LT compared to Sundays. During the lockdown the noise significantly decreases on Saturdays in the same time interval. Moreover, noise variation before and after lockdown between working hours (07:00–16:00 LT) and evening (16:00–22:00 LT) are also better highlighted in Band 1 compared with Bands 2 and 3. In Band 2, the pattern variation is similar before and after the lockdown. Before the lockdown, we notice a sharper increase in the noise level starting around 04:30 LT after which it reaches its maximum around 06:00 LT. During the lockdown, the noise starts to increase at the same hour as before lockdown, but its amplitude reaches a maximum only after 08:00 LT. In Band 3 and Band 4, we again observe the same pattern in noise changes before lockdown and after the lockdown started. It is worth mentioning the sharp increase in the noise level to its maximum in the morning, between 05:00 and 08:00 LT, as well as its decay starting at 15:30 LT during weekdays. This noise variation is associated with the people coming and going from work at City Hall.
The reduction in noise is observed for the IAP building only at the stations deployed on the sixth (TURN 2) and 10th floor (TURN 3) and is stronger in Band 4. The seismic noise level dropped after the lockdown 59 % at the station on the sixth floor and 62 % at the station at the top of the building (Fig. 10a). The noise reduction started a few days after the school closure and extended even after the lockdown was lifted and the state of alert was imposed. The noise started to increase in June 2020, but the level before the lockdown was not reached by the end of September 2020. Fig. 10a also shows that the Orthodox Easter 2019 and the Christmas/New Year 2019 holidays are quieter than the lockdown period, except at the time of Orthodox Easter 2020 when the noise levels are similar. From the 24 h clock representation of the noise variation (Fig. 10c, d), we noticed similar behavior for the two stations before and during the lockdown associated with the work schedule of the people working inside the building. It is interesting to note here that the activity in the building lasts longer on Wednesdays and reduces sooner on Fridays, being a 6 h workday, before the lockdown. After the lockdown, this pattern is no longer recognized.
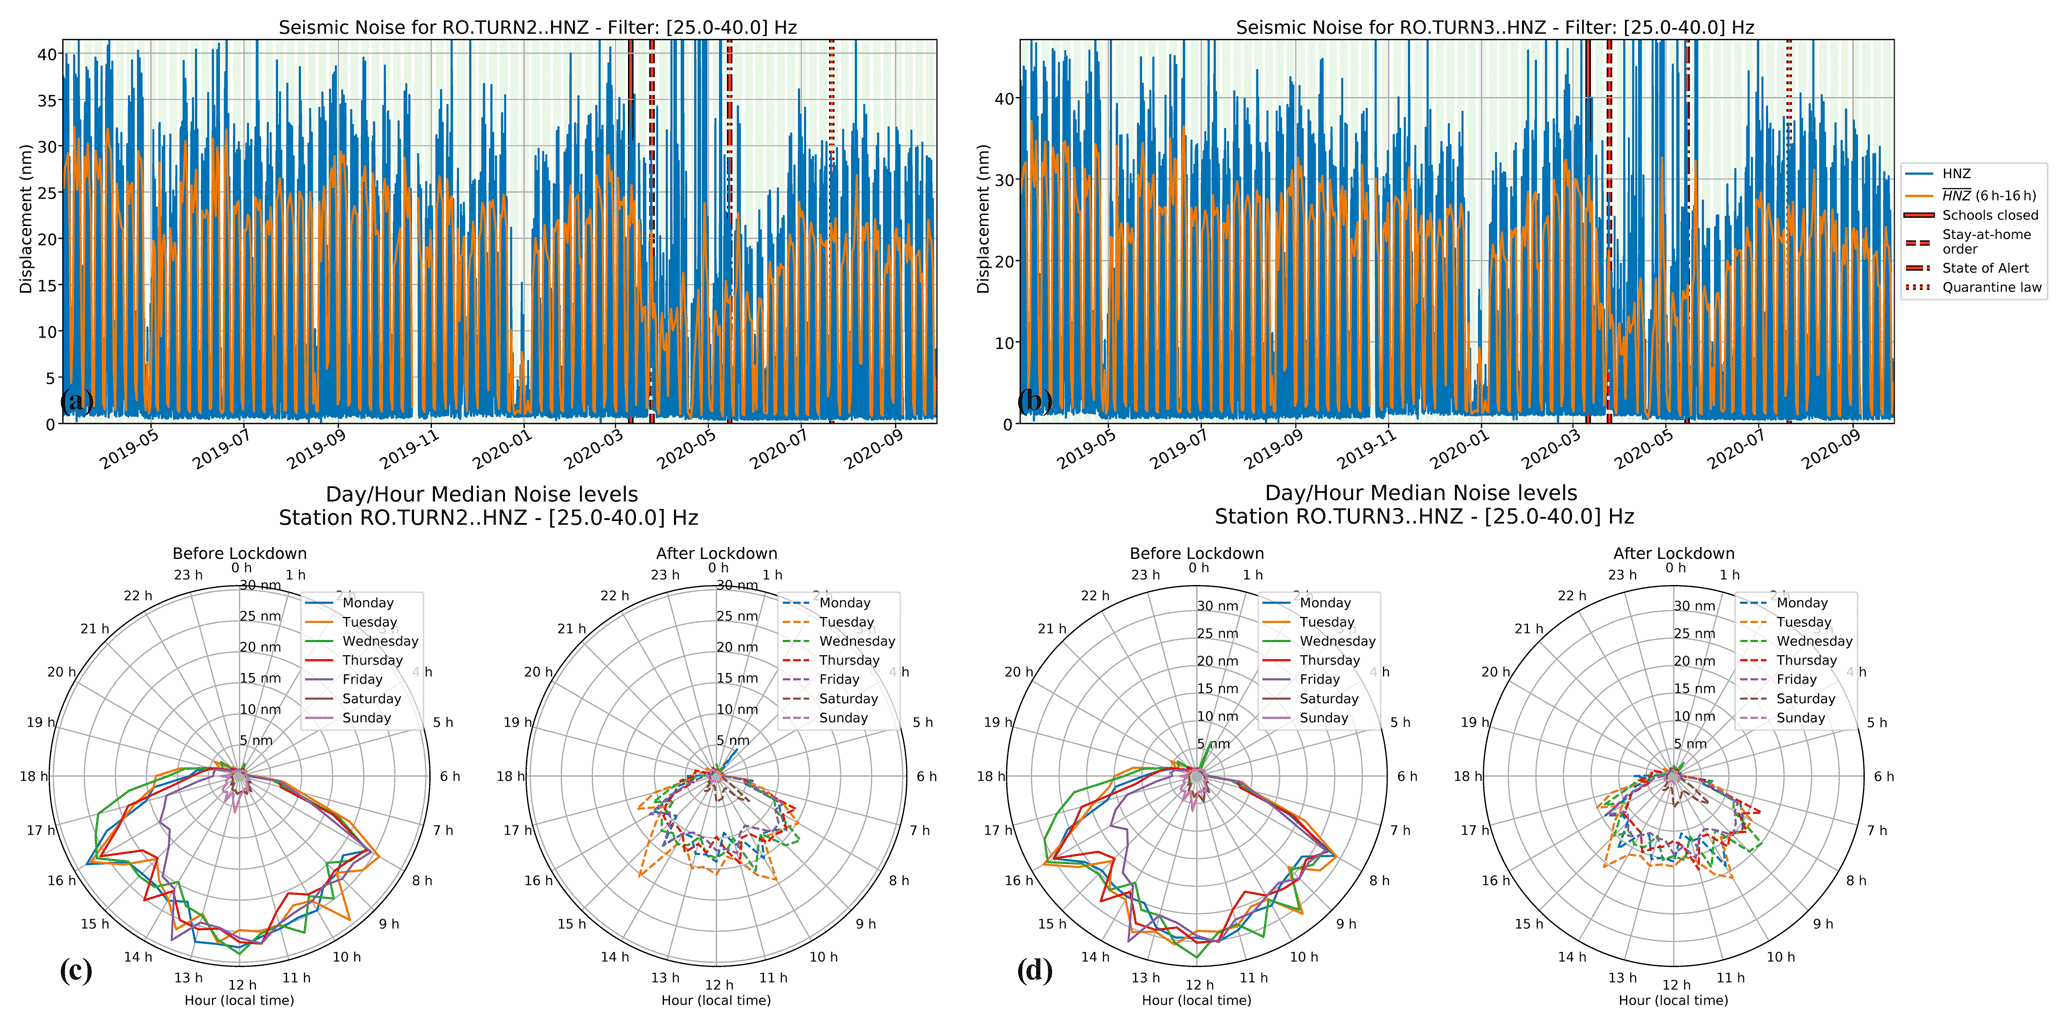
Figure 10Temporal changes in seismic noise observed at the station located on the sixth (a) and 10th (b) floors of the IAP building. Lockdown effects are shown on 24 h clock plots for both stations in (c) and (d) (see Fig. 1 for the station locations).
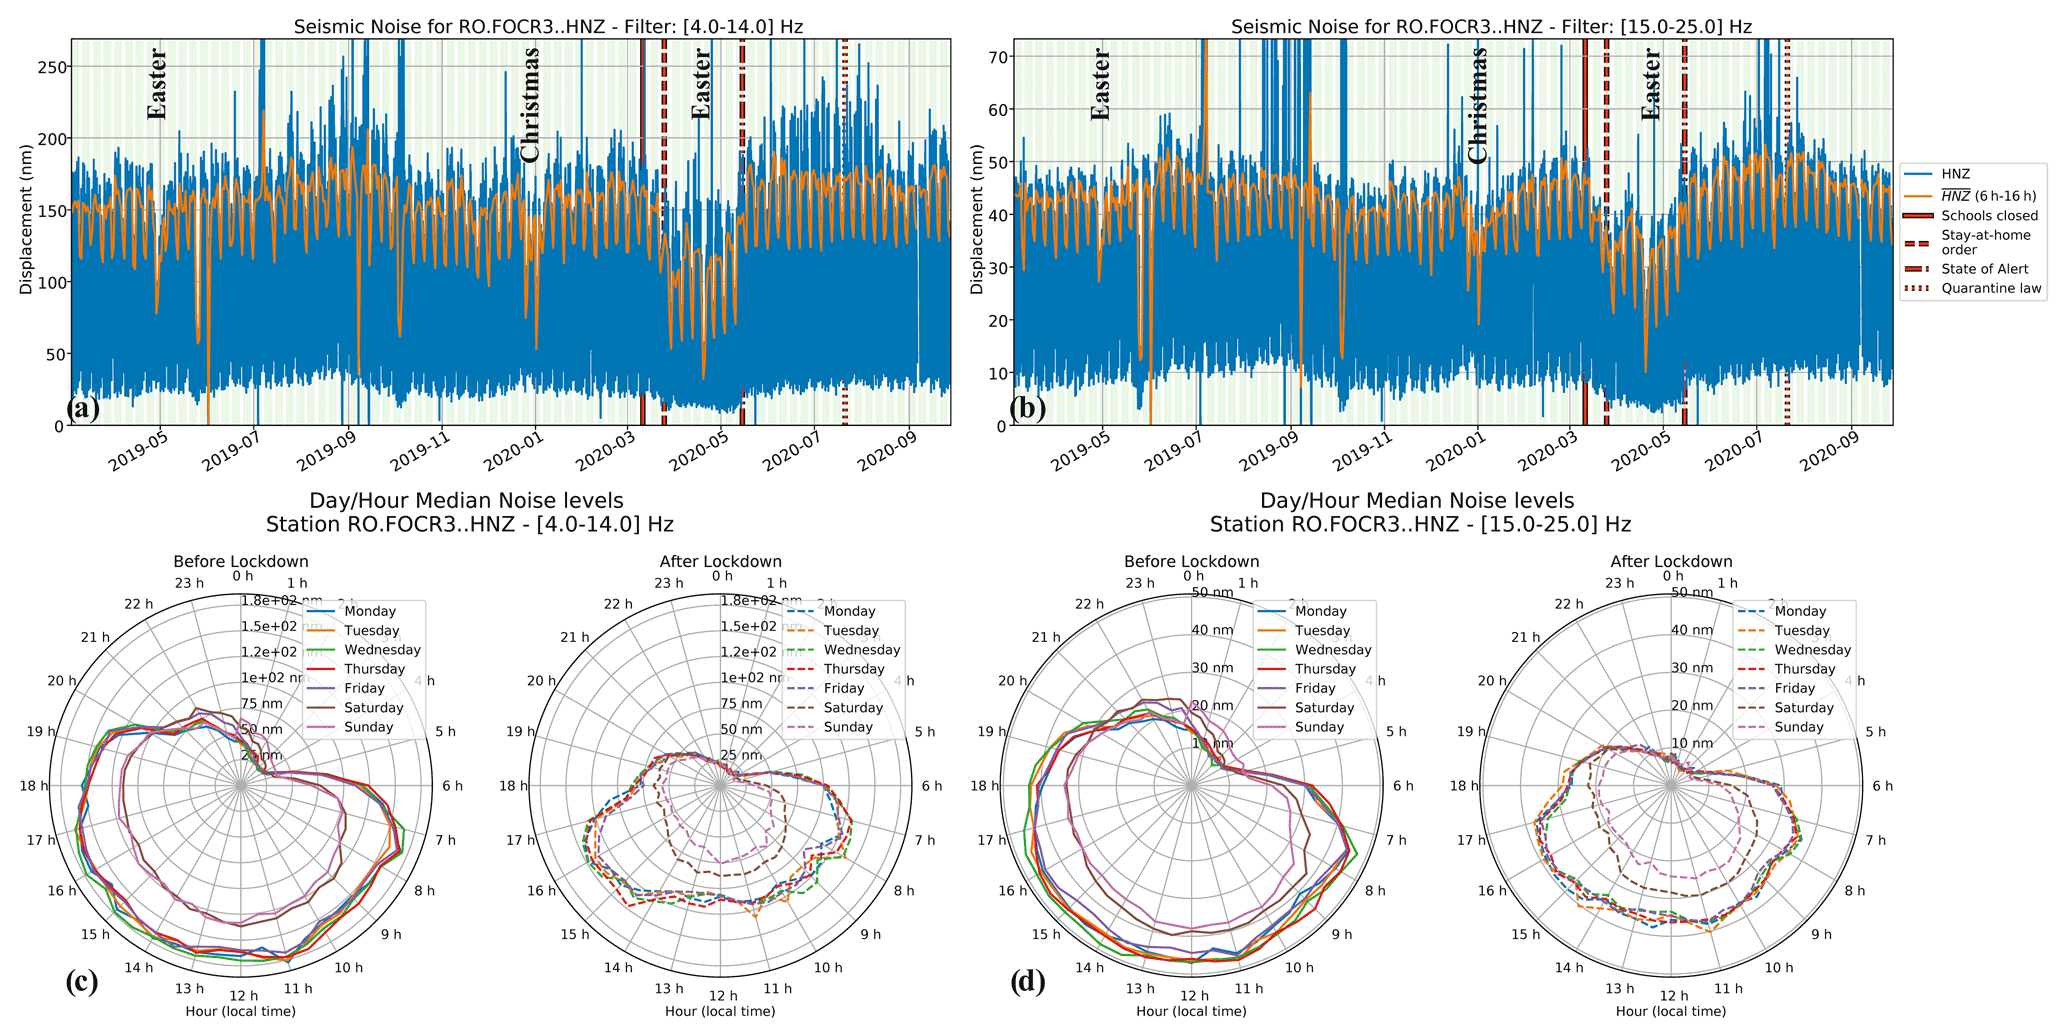
Figure 11Temporal changes in seismic noise observed at the station located on the eighth floor of the Unirea Hotel in Focsani in the frequency bands 4–14 Hz (a) and 15–25 Hz (b). Lockdown effects are shown on 24 h clock plots in the frequency bands 4–14 Hz (c) and 15–25 Hz (d) (see Fig. 1 for the station locations).
The pandemic has also impacted human activities within hotels. The seismic noise decreased at the stations deployed in the building of Unirea Hotel located in Focsani city by ∼ 35 % in Band 2 and ∼ 23 %–29 % in Band 3 following the lockdown. In Band 1 and Band 4 noise reductions were also observed, but they were much weaker. In Fig. 11, we choose to present the results only for the station deployed on the last floor of the hotel (FOCR3), and for the other two stations the results are similar. The seismic noise started to decrease with the closing of the schools on 11 March 2020 and remained at the lowest level between the stay-at-home and the state-of-alert orders. After that, the noise level quickly returned to the pre-pandemic level. The 24 h clock representation (Fig. 11) shows changes in the noise variation pattern before and after lockdown. In the first case, the noise level remains high during weekdays until 20:00 LT, after which it starts to decrease. A slight increase in the noise level can be observed starting at 21:00 LT for Fridays and Saturdays, which can be associated with a prolongation of human activity during the weekend nights. After the lockdown, the noise level drops after 17:00 LT for weekdays and after 14:00 LT for Saturdays and Sundays, and the weekend nights remain as quiet as during the week nights.
3.3 Stations in less populated areas
We observed a weaker noise reduction at six sites with populations less than 2000 inhabitants (Fig. 2). The long-term evolution of the DRMS is shown in Fig. 12 for two selected remote stations. The first one, station Cheia-Muntele Rosu (MLR), is part of the auxiliary seismic network of the International Monitoring System (IMS) installed in a vault in a remote setting and is one of the quietest seismic stations of RSN (Grecu et al., 2012). The noise reduction due to the lockdown is up to 24 % in Band 1 and 18 % in Band 2, respectively. The noise level reaches a minimum during the Orthodox Easter 2020 and increases afterwards toward a slightly higher level than the one observed during summer and beginning of autumn 2020. We also observe a seasonal variation in seismic noise, showing a gentle increase during warmer months followed by a decrease over the colder months. There are two cottages in the area where tourists used to come for recreation. The larger cottage is about 400 m away from the vault, while the smaller one is about 200 m away from it. We would have expected to detect increases in seismic noise during holidays or weekends when the area is much more crowded than on weekdays, but it was not observed in the variation of the noise. Instead, the noise level decreases during the weekend and increases on weekdays. Therefore, we assume that the noise variation is mainly related to the human activity around the seismological observatory at Muntele Rosu, which is about 70 m away from the vault. The noise peaks observed in the long-term evolution of the DRMS are also related to increased winds in the area (Mihai et al., 2019, see Fig. S2 from Supplement).
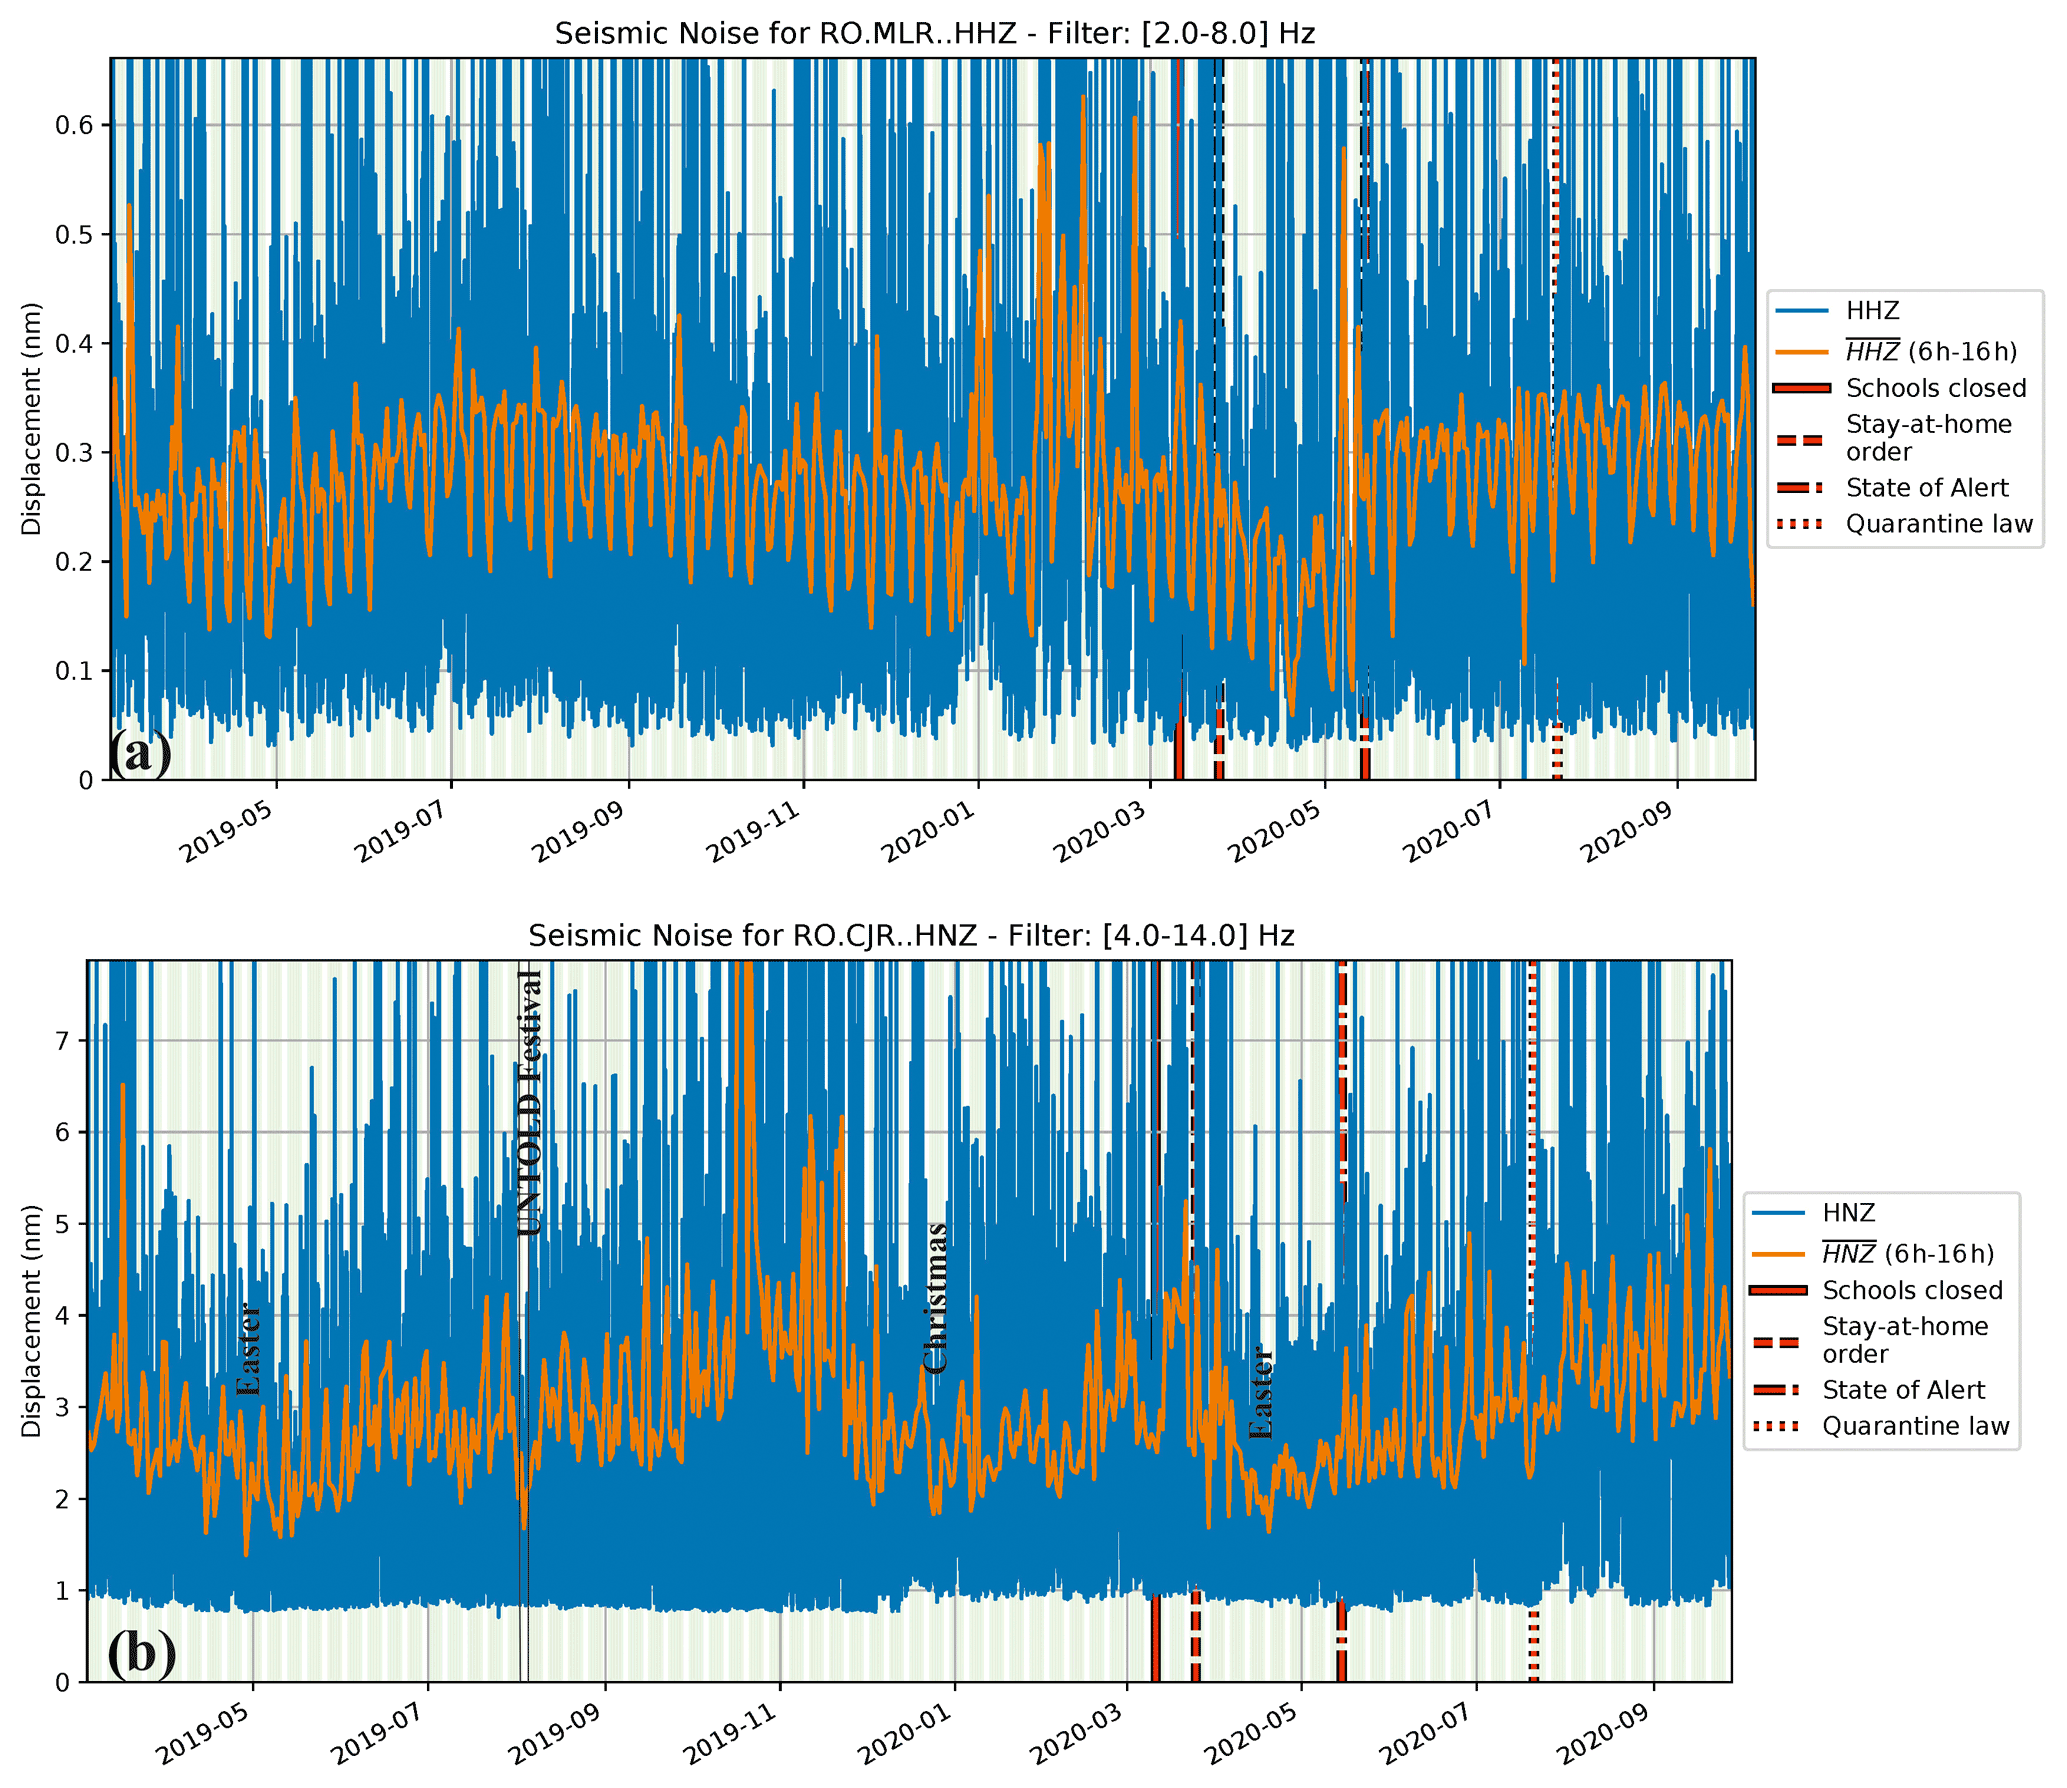
Figure 12Long-term changes in seismic noise at MLR (a) and CJR (b) stations located in remote places that are less populated. Note the comparable minimum noise level during the UNTOLD Festival and Orthodox Easter and Christmas holidays at CJR station. The locations of the stations are displayed in Fig. 1.
The second station is located on a plateau on the Feleacului Hill, far from the city of Cluj-Napoca, in the courtyard of the Astronomical Observatory of the Romanian Academy, Cluj-Napoca Branch, about 1.5 km away from the national road DN1 and almost 1 km from the nearest residential houses. The observatory is not open to the public and the building is mainly used by the staff working there. The area is a well-known place for walks and hikes for many residents of Cluj-Napoca city, with several mountain bike trails also existing in the area. As a consequence, we assume that the noise sources responsible for the long-term noise level at station CJR are a combination of the noise generated by people going to work at the observatory and people doing outdoor activities in the area. We observed that the peaks of the long-term noise changes are associated with either the weekends or the weekdays, which suggests that the weather conditions also play a role in the variations in the seismic noise. It is likely that when there is good weather more people come in the area for outdoor activities and the noise level during weekends exceeds the noise level generated by the staff working at the observatory. An interesting aspect worth mentioning here is the low level of the seismic noise observed in the first weekend of August 2019. We assume that this particular noise drop is associated with the largest international music festival in Romania (UNTOLD), hosted in Cluj-Napoca. During the festival many residents of the city preferred to attend the festival rather than going for outdoor activities in the area of CJR station. The noise drop associated with the lockdown is observed a few days after the stay-at-home order and reaches a minimum during Orthodox Easter 2020. The noise level is comparable with the noise level observed during the UNTOLD festival or Christmas 2019 and remains relatively low until the lockdown is lifted, after which it starts to increase constantly until the end of September 2020.
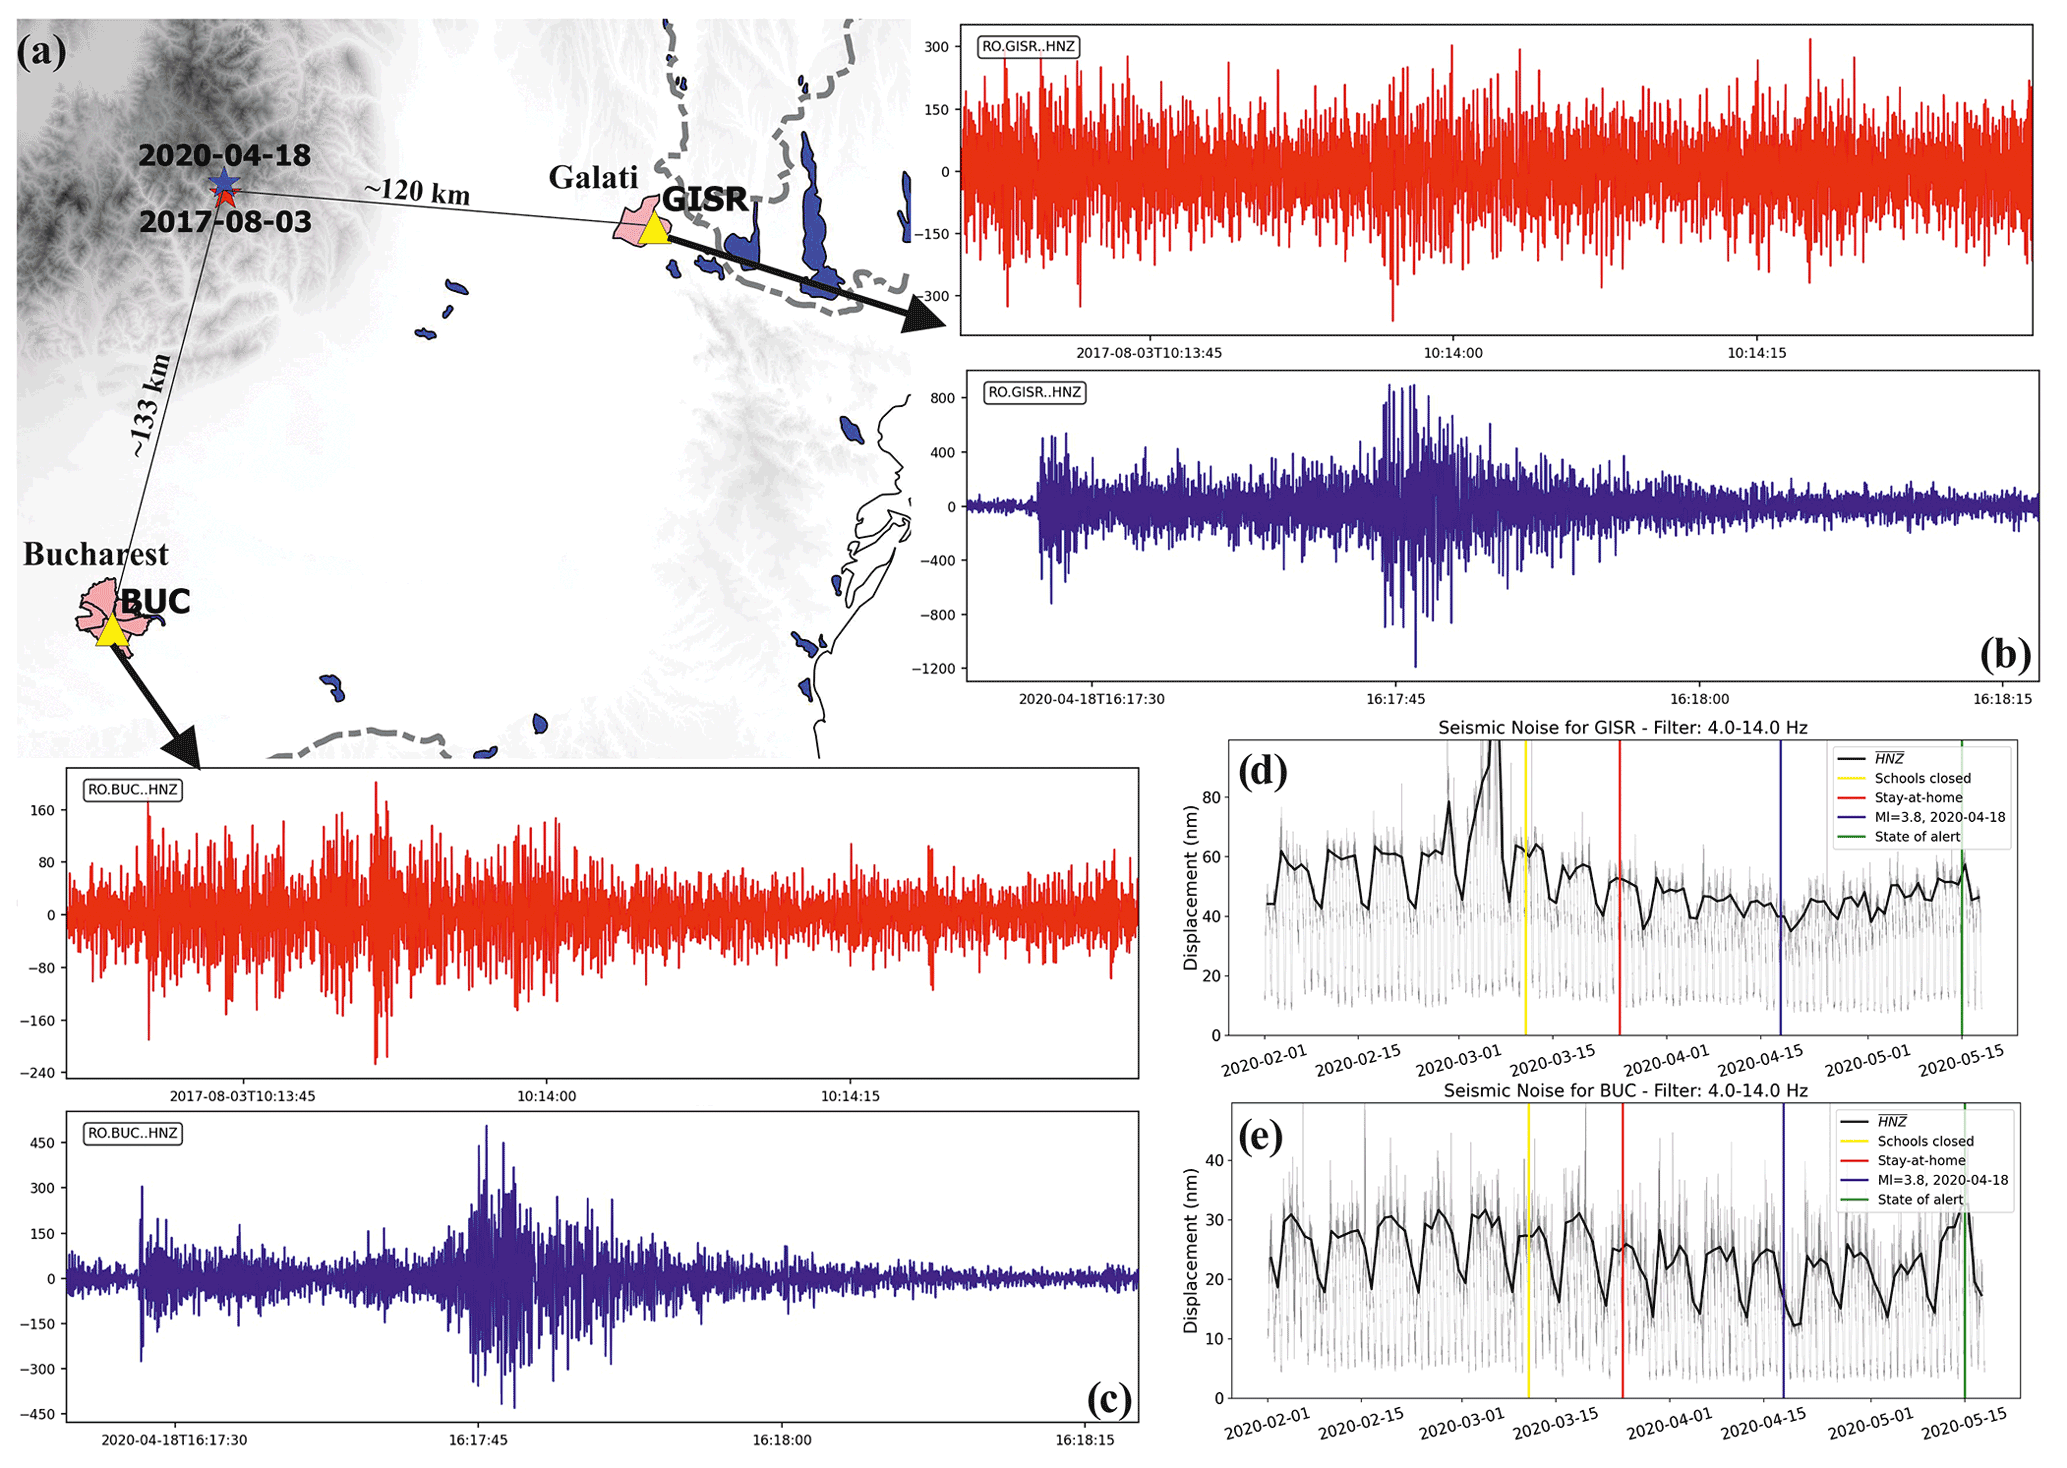
Figure 13Illustration of the increased earthquake detection capability at two stations of RSN: (a) map showing the epicenter locations of two intermediate-depth Vrancea earthquakes (3 August 2017, 13:13:16 local time, ML = 3.8, H = 117 km, shown as a red star; 18 April 2020, 19:17:03 local time, ML = 3.8, H = 118 km, shown as a blue star) and the location of the two accelerometers in Bucharest (BUC) and Galati (GISR). (b, c) Waveforms recorded by the two stations (red trace for the event before the lockdown and blue trace for the event within the lockdown); (d, e) Temporal changes in seismic noise at the stations GISR and BUC.
In densely populated and industrialized areas, the high-frequency seismic noise wave field is characterized by the superposition of signals of many different anthropogenic origins (Denolle and Nissen-Meyer, 2020). These sources generate elastic waves in a wide range of frequency bands and also vary in time and space, making it often difficult to discriminate between different noise sources at stations in cities. However, recent studies that have focused on the analysis of urban seismic noise variations provided insights into the sources responsible for generating seismic noise in different frequency bands. Road traffic has an important contribution to the seismic noise wave field in various frequency bands, such as 2–9 and 10–20 Hz (Dias et al., 2020), 2.5–10 Hz (Green et al., 2017), 8–35 Hz (Boese et al., 2015), and 8–12 Hz (Diaz et al., 2017). Overground and subway trains generate seismic noise at very low frequencies (∼ 0.01–0.05 Hz) (Sheen et al., 2009; Diaz et al., 2017; Green et al., 2017) and at high frequencies (20–40 Hz) (Diaz et al., 2017). Furthermore, industrial activities can also contribute to the seismic noise spectra in the 1–25 and 25–40 Hz bands (Groos and Ritter, 2009).
The measures taken to prevent and combat the spread of COVID-19 have impacted many human and industrial activities across Romania, and their effects are clearly observed in the recordings of many stations of RSN. It is very difficult to quantify the level of disruption of anthropogenic activities, and (in addition) society's response differs from one area to another, thus making it difficult to achieve a generally unerring interpretation of the results. However, our analysis of lockdown-related seismic noise reduction performed in four frequency bands highlights a number of common features. Clear homogeneous patterns in noise reductions have been observed in Band 1 (Fig. 2a). Most of the stations showing noise reduction in this frequency band are sited within larger urban areas (with more than 10 000 inhabitants) and are close to streets. The stations in Bucharest provide a suggestive example of recordings where the seismic noise is sensitive to the traffic. The variation in noise reduction is the smallest at these stations, closely reflecting their proximity to heavily trafficked main streets. An additional argument for the connection between the seismic noise (in Band 1) and traffic is given by the decrease in the noise level during the summer vacation when this is considerably reduced in Bucharest (Fig. 4a). The noise reduction during the lockdown period is smaller than that observed during Orthodox Easter and Christmas 2019, suggesting that the traffic during the lockdown did not decrease as much as during the two major holidays. The reduction in traffic during the pandemic allowed us to highlight the contribution of other sources to the noise spectrum in Band 1. For example, during the lockdown period at the PMB stations (within Bucharest City Hall) we could observe a sharp variation of the noise level associated with the working schedule of the people coming and going from work, i.e., a sharp increase in the noise level starting with 08:00 LT and a decrease starting with 16:00 LT (Fig. 9b).
Groos and Ritter (2009) suggested that industrial noise is important in the 25–40 Hz frequency band for the stations in Bucharest. However, we found that the noise reduction in Band 4 due to the lockdown measures is mainly related to the restrictions on human mobility and activities close to the area of the station site. We observed the largest drops in seismic noise levels at stations in schools. These drops are of the same level as those observed during the school's vacations, (including summer and winter holidays, Orthodox Easter, and Christmas). In addition, the analysis of the noise variation according to the time and day of the week shows different patterns before and during the lockdown (Fig. 7c). If in the first situation the pattern is clearly given by the activity carried out inside and near the school, in the second one it disappears completely, suggesting the complete interruption of the activity in and around the school. Similar behavior is also found for stations installed from tens to hundreds of meters away from schools. Another category of stations that show significant noise reductions in Band 4 are those located in office buildings. For these stations the noise reduction during the lockdown is associated with the mobility restrictions of the people working inside the building.
For the stations in Bucharest close to metro stations (e.g., BSTR), we associated the noise reduction with changes in the schedule of underground trains during lockdown.
The contribution of noise sources such as traffic and human movement to the noise spectra in Band 2 and Band 3 depends on the type of the dominant sources and the distances from these sources. Figures 6a and 12b clearly show two different cases. For the station CTISU (Fig. 6a), located within an area with many streets with intense traffic, the noise reduction in Band 2 during the lockdown period is associated with a reduction in the traffic around the station location. On the other hand, for the station CJR (Fig. 12b), located in a remote area known for walks and outdoor activities and far from the city traffic, the noise reduction during the lockdown is mainly due to the human movement in the vicinity of the station site. At this station a minimum level of seismic noise was also observed during an important music festival taking place in Cluj-Napoca. We assume that the noise was reduced due to the fact that many inhabitants of Cluj-Napoca chose to go to the festival and fewer chose to go for a walk and engage in outdoor activities in the area of the CJR seismic station. Another good example for the influence of the movement of people in the vicinity of the station on seismic noise is shown by the PMGR station (15–25 Hz, see Fig. S3). The station PMGR, located in a park, shows the clear dependency of the noise level in Band 3 on the human movement within the park. The park is a promenade place preferred by the inhabitants of Bucharest, which gets very crowded at the end of the week. As a consequence, the noise level increases during the weekends in comparison with weekdays. During the lockdown, when outdoor social activities were restricted, the noise dropped significantly for all the days of the week. However, people were allowed to go to the park for sports activities (e.g., running) during the lockdown, and the noise peaks observed on Saturday and Sunday mornings during the lockdown are related to such outdoor sports activities.
To provide some insights into the causes of the noise changes during the lockdown, correlation between noise time series and community mobility data provided by Google and Apple was performed globally (Lecocq et al., 2020a) and at local scale (Cannata et al., 2021; De Plaen et al., 2021; Diaz et al., 2021). The results showed rather good similarities between the noise and mobility data, indicating that the changes in seismic noise can be used to track human activity in urban areas. We also observed a good match between the variation in seismic noise and data mobility's trends (Fig. S4), thus confirming the previous results (Cannata et al., 2021; De Plaen et al., 2021; Diaz et al., 2021).
The high level of seismic noise in cities affects the earthquake detection capability at seismic stations installed in these areas, and as a consequence fewer small earthquakes are recorded by these stations in comparison with those deployed at similar epicentral distances but in quieter environments. Therefore, any reduction in anthropogenic seismic noise improves the detection capability of urban stations (Lecocq et al., 2020a), and such an increase in detectability would translate into more data for research on seismic risk reduction in earthquake-prone cities.
The reduction of seismic noise during the Romanian lockdown could also favor an increase in the earthquake detection capability. Figure 13 shows examples of unfiltered accelerograms (from two sensors sited in urban areas) of two moderate (ML = 3.8) intermediate-depth (∼ 116 km) earthquakes from Vrancea. One of the earthquakes occurred before the lockdown, on 3 August 2017 (Thursday) at 13:13:16 local time, and the other during the lockdown on 18 April 2020 (Saturday) at 19:17:03 local time. It is worth noting that seismic signals are clearly recorded for the earthquake generated during the lockdown despite anthropogenic noise usually masking earthquake signals from a local event of this size. Although the noise difference between weekdays and weekends is considerable, the noise drop due to the lockdown measures contributes as well, further increasing the signal-to-noise ratio. In this context, the reduction of seismic noise during the lockdown may lead to an improvement in earthquake detection for RSN accelerometers located in urban areas as was also reported by other studies (Lecocq et al., 2020a). This topic, however, requires further more in-depth investigation that is out of scope of the present study.
The permanent seismic stations operated by the RSN provided a very valuable data set for investigating the variation of seismic noise during the period associated with the reduction of human activities caused by the COVID-19 pandemic. Our analysis for stations located in different regions of the country and in various contexts shows that noise reduction is more significant at stations located in urban areas where the contribution of anthropogenic noise sources is dominant in the noise spectrum. However, we found drops in lockdown-related seismic noise even at stations located in remote areas where anthropogenic activity is much reduced.
Even though the lockdown has been imposed uniformly nationwide, our investigation in four different frequency bands reveals substantial variability in seismic noise reduction both among the stations, even for those located in the same city, and frequency bands. The results show the greatest reductions in seismic noise in places where people's movement has been severely affected by the restrictive measures taken because of COVID-19. We found such large drops – over 40 % and up to 80 % – in and near educational units and in buildings in the 15–40 Hz frequency range. The seismic noise level in these situations is similar to that observed during other periods when human mobility and social activities reach a minimum, such as religious celebrations or school vacations.
We found that the contribution of other noise sources, such as traffic, is important in the 2–14 Hz frequency range. However, the noise reduction during the lockdown period due to traffic is more uniform among urban stations (Fig. 2a) and is less pronounced than in the higher frequencies, up to 35 %. In these cases, the seismic noise level was reduced less than during the religious celebrations, suggesting that the traffic during the lockdown period was not as diminished in comparison with the days off associated with Easter and Christmas 2019.
Our results finally reveal that noise reduction caused by the measures taken to mitigate the COVID-19 pandemic may indicate a potential improvement in the earthquake detection capability of the accelerometers located in noisy urban environments. Therefore, we consider it as essential to continue the efforts to reduce the seismic noise in the seismological data acquired by urban stations, as these efforts would lead to the improvement of seismological databases used for seismic risk reduction in earthquake-prone cities.
This work has benefited from open-source initiatives such as Obspy (https://doi.org/10.1088/1749-4699/8/1/014003, Krischer et al., 2015) and QGIS-A Free and Open Source Geographic Information System (https://qgis.org/en/site/, QGIS.org, 2021). Data analysis has been done using the publicly available SeismoRMS code kindly distributed by Lecocq et al. (2020b) (https://doi.org/10.5281/zenodo.3820046).
Part of the seismic data used in this study are available from the FDSN service, provided by the Romanian Seismic Network of the National Institute for Earth Physics: https://doi.org/10.7914/SN/RO (National Institute for Earth Physics (NIEP Romania), 1994). For the stations that are not available through FDSN, the authors have used data provided by the NIEP's Data Center, which are available upon request. The mobility data for Bucharest were provided by Apple (https://covid19.apple.com/mobility, last access: 29 September 2021), and for all the large cities in Romania data was provided by Google (https://www.google.com/covid19/mobility, last access: 29 September 2021). The authors are very grateful to Iren Adelina Moldovan from NIEP for providing the meteorological data recorded at Muntele Rosu.
The supplement related to this article is available online at: https://doi.org/10.5194/se-12-2351-2021-supplement.
BG designed the study, and all the authors contributed to the manuscript. The data processing was performed by all authors with the following division of responsibilities: BG and DT processed the local accelerometric data from urban areas, NP processed the data available through FDSN, AT processed the data in schools and buildings, and RD and FB processed the local free-field seismic data. BG, FB, AT and NP interpreted the results and drew the conclusions.
The authors declare that they have no conflict of interest.
Publisher’s note: Copernicus Publications remains neutral with regard to jurisdictional claims in published maps and institutional affiliations.
This article is part of the special issue “Social seismology – the effect of COVID-19 lockdown measures on seismology”. It is not associated with a conference.
Part of the work has been supported by the following national funded projects: Open system for integrated monitoring of civil structures (PREVENT), supported by a grant of the Romanian Ministry of Research and Innovation, UEFISCDI, project no. PN-III-P2-2.1-PED-2019-0832, within PNCDI III; National Core Funding Program (NUCLEU) program Multidisciplinary Program research on the seismic phenomenon in order to increase resilience (MULTIRISC), supported by Ministry of Education (MEC), project no. PN1908020. Another part of the work has been supported by the SETTING project (Integrated thematic services in the field of Earth System Observation – a national platform for innovation), cofunded from the Regional Development European Fund (FEDR) through the Operational Competitivity Programme 2014-2020, contract no. 336/390012. We thank the people involved in the development of the ObsPy package and the SeismoRMS code for sharing their work. The authors thank Paula Koelemeijer and two anonymous reviewers for their helpful and constructive reviews, which helped to improve and clarify parts of the paper.
This research has been supported by the Unitatea Executivă pentru Finanțarea Învățământului Superior, a Cercetării, Dezvoltarii și Inovării (grant no. PN-III-P2-2.1-PED-2019-0832), the Ministerul Cercetării, Inovării și Digitalizării (grant no. 31N/PN19080201) and the Programul Operațional Competitivitate (contract no. 336/390012).
This paper was edited by Paula Koelemeijer and reviewed by two anonymous referees.
Apple: COVID-19 Mobility Trend Reports, COVID-19 Mobility Trend Reports, Apple [dataset], available at: https://covid19.apple.com/mobility, last access: 29 September 2021.
Boese, C. M., Wotherspoon, L., Alvarez, M., and Malin, P.: Analysis of anthropogenic and natural noise from multilevel borehole seismometers in an urban environment, Auckland, New Zealand, B. Seismol. Soc. Am., 105, 285–299, https://doi.org/10.1785/0120130288, 2015.
Cannata, A., Cannavò, F., Di Grazia, G., Aliotta, M., Cassisi, C., De Plaen, R. S. M., Gresta, S., Lecocq, T., Montalto, P., and Sciotto, M.: Seismic evidence of the COVID-19 lockdown measures: a case study from eastern Sicily (Italy), Solid Earth, 12, 299–317, https://doi.org/10.5194/se-12-299-2021, 2021.
Denolle, M. A. and Nissen-Meyer, T.: Quiet Anthropocene, quiet Earth, Science, 369, 1299–1300, https://doi.org/10.1126/science.abd8358, 2020.
De Plaen, R. S. M., Márquez-Ramírez, V. H., Pérez-Campos, X., Zuñiga, F. R., Rodríguez-Pérez, Q., Gómez González, J. M., and Capra, L.: Seismic signature of the COVID-19 lockdown at the city scale: a case study with low-cost seismometers in the city of Querétaro, Mexico, Solid Earth, 12, 713–724, https://doi.org/10.5194/se-12-713-2021, 2021.
Dias, F. L., Assumpcao, M., Peixoto, P. S., Bianchi, M. B., Collaco, B., and Calhau, J.: Using Seismic Noise Levels to Monitor Social Isolation: An Example From Rio de Janeiro, Brazil, Geophys. Res. Lett., 47, 1–9, https://doi.org/10.1029/2020GL088748, 2020.
Diaz, J., Villaseñor, A., Morales, J., Pazos, A., Córdoba, D., Pulgar, J., García-Lobón, J. L., Harnafi, M., Carbonell, R., and Gallart, J.: TopoIberia Seismic Working Group: Background noise characteristics at the IberArray broadband seismic network, B. Seismol. Soc. Am., 100, 618–628, https://doi.org/10.1785/0120090085, 2010.
Diaz, J., Ruiz, M., Sánchez-Pastor, P. S., and Romero, P.: Urban Seismology: On the origin of earth vibrations within a city, Sci. Rep., 7, 15296, https://doi.org/10.1038/s41598-017-15499-y, 2017.
Diaz, J., Ruiz, M., and Jara, J.-A.: Seismic monitoring of urban activity in Barcelona during the COVID-19 lockdown, Solid Earth, 12, 725–739, https://doi.org/10.5194/se-12-725-2021, 2021.
Evangelidis, C. P. and Melis, N. S.: Ambient noise levels in Greece as recorded at the Hellenic Unified Seismic Network, B. Seismol. Soc. Am., 102, 2507–2517, https://doi.org/10.1785/0120110319, 2012.
Google: COVID-19 Community Mobility Report, COVID-19 Community Mobility Report, Google [dataset], available at: https://www.google.com/covid19/mobility?hl=en, last access: 29 September 2021.
Grecu, B., Neagoe, C., and Tataru, D.: Seismic noise characteristics at the Romanian broadband seismic network, J. Earthq. Eng., 16, 644–661, https://doi.org/10.1080/13632469.2011.642931, 2012.
Grecu, B., Neagoe, C., Tataru, D., Borleanu, F., and Zaharia, B.: Analysis of seismic noise in the Romanian-Bulgarian cross-border region, J. Seismol., 22, 1275–1292, https://doi.org/10.1007/s10950-018-9767-4, 2018.
Green, D. N., Bastow, I. D., Dashwood, B., and Nippress, S. E. J.: Characterizing Broadband Seismic Noise in Central London, Seismol. Res. Lett., 88, 113–124, https://doi.org/10.1785/0220160128, 2017.
Groos, J. C. and Ritter, J. R. R.: Time domain classification and quantification of seismic noise in an urban environment, Geophys. J. Int., 179, 1213–1231, https://doi.org/10.1111/j.1365-246X.2009.04343.x, 2009.
Hasselmann, K.: A statistical analysis of the generation of microseisms, Rev. Geophys., 1, 177–210, https://doi.org/10.1029/RG001i002p00177, 1963.
Krischer, L., Megies, T., Barsch, R., Beyreuther, M., Lecocq, T., Caudron, C., and Wassermann, J.: ObsPy: A bridge for seismology into the scientific Python ecosystem, [code], Comput. Sci. Discov., 8, 1–17, https://doi.org/10.1088/1749-4699/8/1/014003, 2015.
Lecocq, T., Hicks, S. P., Van Noten, K., van Wijk, K., Koelemeijer, P., De Plaen, R. S. M., Massin, F., Hillers, G., Anthony, R. E., Apoloner, M.-T., Arroyo-Solórzano, M., Assink, J. D., Buyukakpınar, P., Cannata, A., Cannavo, F., Carrasco, S., Caudron, C., Chaves, E. J., Cornwell, D. G., Craig, D., den Ouden, O. F. C., Diaz, J., Donner, S., Evangelidis, C. P., Evers, L., Fauville, B., Fernandez, G. A., Giannopoulos, D., Gibbons, S. J., Girona, T., Grecu, B., Grunberg, M., Hetényi, G., Horleston, A., Inza, A., Irving, J. C. E., Jamalreyhani, M., Kafka, A., Koymans, M. R., Labedz, C. R., Larose, E., Lindsey, N. J., McKinnon, M., Megies, T., Miller, M. S., Minarik, W., Moresi, L., Marquez-Ramirez, V. H., Mollhoff, M., Nesbitt, I. M., Niyogi, S., Ojeda, J., Oth, A., Proud, S., Pulli, J., Retailleau, L., Rintamaki, A. E., Satriano, C., Savage, M. K., Shani-Kadmiel, S., Sleeman, R., Sokos, E., Stammler, K., Stott, A. E., Subedi, S., Sørensen, M. B., Taira, T., Tapia, M., Turhan, F., van der Pluijm, B., Vanstone, M., Vergne, J., Vuorinen, T. A. T., Warren, T., Wassermann, J., and Xiao, H.: Global quieting of high-frequency seismic noise due to COVID-19 pandemic lockdown measures, Science, 369, 1338–1343, https://doi.org/10.1126/science.abd2438, 2020a.
Lecocq, T., Massin, F., Satriano, C., Vanstone, M., and Megies, T.: SeismoRMS – A simple Python/Jupyter Notebook package for studying seismic noise changes Version 1.0, Zenodo [code], https://doi.org/10.5281/zenodo.3820046, 2020b.
Long, L. T.: Investigation of Seismic Road Noise, Georgia Institute of Technology, Atlanta, Georgia, 35 pp., 1971.
Longuet-Higgins, M. S.: A theory of the origin of microseisms, Philos. T. Roy. Soc. A, 243, 1–35, https://doi.org/10.1098/rsta.1950.0012, 1950.
Marmureanu, A., Ionescu, C., Grecu, B., Toma-Danila, D., Tiganescu, A., Neagoe, C., Toader, V., Craifaleanu, I. G., Dragomir, C. S., Meita, V., Liashchuk, O. I., Dimitrova, L., and Ilies, I.: From National to Transnational Seismic Monitoring Products and Services in the Republic of Bulgaria, Republic of Moldova, Romania, and Ukraine, Seismol. Res. Lett., 92, 1685–1703, https://doi.org/10.1785/0220200393, 2021.
Marzorati, S. and Bindi, D.: Ambient noise levels in north central Italy, Geochem. Geophy. Geosy., 7, Q09010, doi:10.1029/2006GC001256, 2006.
McNamara, D. E., and Buland, R. P.: Ambient noise levels in the continental United States, B. Seismol. Soc. Am., 94, 1517–1527, https://doi.org/10.1785/012003001, 2004.
Mihai, A., Moldovan, I. A., Toader, V. E., Radulian, M., and Placinta, A. O.: Correlations between geomagnetic anomalies recorded at Muntele Rosu seismic Observatory (Romania) and seismicity of Vrancea zone, Rom. Rep. Phys., 71, 1–12, 2019.
Nakata, N., Snieder, R., Tsuji, T., Larner, K., and Matsuoka, T.: Shear wave imaging from traffic noise using seismic interferometry by cross-coherence, Geophysics, 76, 97–106, https://doi.org/10.1190/geo2010-0188.1, 2011.
Poli, P., Boaga, J., Molinari, I., Cascone, V., and Boschi, L.: The 2020 coronavirus lockdown and seismic monitoring of anthropic activities in Northern Italy, Sci. Rep., 10, 1–8, https://doi.org/10.1038/s41598-020-66368-0, 2020.
QGIS.org: QGIS Geographic Information System, QGIS Association, QGIS.org [code], available at: http://www.qgis.org, last access: 29 September 2021.
Sheen, D. H., Shin, J. S., Kang, T. S., and Baag, C. E.: Low frequency cultural noise, Geophys. Res. Lett., 36, L17314, https://doi.org/10.1029/2009GL039625, 2009.
Tiganescu, A., Balan, E. S. F., Toma-Danila, D., and Apostol, B. F.: Preliminary analysis of data recorded on instrumented buildings from Bucharest area during the 28th October 2018 Vrancea earthquake, in: Proceedings of the 19th International Multidisciplinary Scientific GeoConference SGEM, Albena, Bulgaria, 30 June–6 July 2019, 19, 897–904, https://doi.org/10.5593/sgem2019/1.1/S05.111, 2019.
Tiganescu, A., Grecu, B., and Craifaleanu, I. G.: Dynamic Identification for Representative Building Typologies: Three Case Studies from Bucharest Area, Civil Eng. J., 6, 418–430, https://doi.org/10.28991/cej-2020-03091480, 2020.
van Wijk, K., Chamberlain, C. J., Lecocq, T., and Van Noten, K.: Seismic monitoring of the Auckland Volcanic Field during New Zealand's COVID-19 lockdown, Solid Earth, 12, 363–373, https://doi.org/10.5194/se-12-363-2021, 2021.
Xiao, H., Eilon, Z. C., Ji, C., and Tanimoto, T.: COVID-19 Societal Response Captured by Seismic Noise in China and Italy, Seismol. Res. Lett., 91, 2757–2768, https://doi.org/10.1785/0220200147, 2020.
Yabe, S., Imanishi, K., and Nishida, K.: Two-step seismic noise reduction caused by COVID-19 induced reduction in social activity in metropolitan Tokyo, Japan, Earth Planets Space, 72, 167, https://doi.org/10.1186/s40623-020-01298-9, 2020.