the Creative Commons Attribution 4.0 License.
the Creative Commons Attribution 4.0 License.
 | 20 Oct 2021
A new finite element approach to model microscale strain localization within olivine aggregates
Jean Furstoss
Carole Petit
Clément Ganino
Marc Bernacki
Daniel Pino-Muñoz
This paper presents a new mesoscopic full field approach for the modeling of microstructural evolutions and mechanical behavior of olivine aggregates. The mechanical framework is based on a reduced crystal plasticity (CP) formulation which is adapted to account for non-dislocation glide strain-accommodating mechanisms in olivine polycrystals. This mechanical description is coupled with a mixed velocity–pressure finite element (FE) formulation through a classical crystal plasticity finite element method (CPFEM) approach. The microstructural evolutions, such as grain boundary migration and dynamic recrystallization, are also computed within a FE framework using an implicit description of the polycrystal through the level-set approach.
This numerical framework is used to study the strain localization, at the polycrystal scale, on different types of pre-existing shear zones for thermomechanical conditions relevant to laboratory experiments. We show that both fine-grained and crystallographic textured pre-existing bands favor strain localization at the sample scale. The combination of both processes has a large effect on strain localization, which emphasizes the importance of these two microstructural characteristics (texture and grain size) on the mechanical behavior of the aggregate.
Table 1 summarizes the list of the acronyms used in the following.
- Article
(4869 KB) - Full-text XML
- BibTeX
- EndNote


Strain localization is of first importance in the development and evolution of a tectonic plate regime (Tommasi et al., 2009). Indeed, plate boundaries are rheological weak zones, localizing strain and allowing for tectonic plates to move with respect to each other as almost rigid blocs.
At the plate scale, the rheological behavior is mainly controlled by the upper mantle (Heron et al., 2016) which is the strongest layer composing the lithosphere. The strain localizing mechanisms are thus often studied considering upper mantle rocks, which are mainly composed of olivine. The initiation of this localization takes place at different scales and is the result of different physical processes. At large (km) scales, the thermal history, the presence of melt or the heterogeneity in rock compositions are factors promoting strain localization (Tajčmanová et al., 2014). At smaller (µm) scales, microstructural mechanisms or chemo-mechanical coupling between phase transformation and stress field can also initiate strain localization (Watremez et al., 2013). Once localization is initiated, the positive feedback between deformation, grain size reduction and shear heating leads to strong rheological weakening (Duretz et al., 2019; Précigout and Gueydan, 2009). However, the microscale processes which are able to initiate this localization are still debated. Two main mechanisms are often invoked: the plastic anisotropy of olivine (Tommasi et al., 2009) and the relatively weaker behavior of fine grained olivine polycrystals compared to coarse grained aggregates when deformed under grain-size-sensitive (GSS) creep (Braun et al., 1999). Those two weakening processes are supported by several experimental works on olivine aggregate deformation showing that both the development of strong olivine lattice preferred orientation (LPO) (Hansen et al., 2012) and grain size reduction (Drury, 2005) severely reduce the rheological behavior of the aggregate and may cause strain localization. Shape preferred orientation (SPO) has also been proposed as a factor involving viscous anisotropy during olivine aggregate diffusion creep (Wheeler, 2010), which potentially implies strain localization. However, the weakening intensity due to each of these processes is not straightforward to quantify experimentally.
Regarding micromechanical models, different approaches can be found in the state of the art, from 2D finite element (FE) viscous models accounting for grain size reduction and growth via front tracking methods (Jessell et al., 2005), to 3D fast Fourier transform (FFT) methods accounting for crystallographic orientations through a crystal plasticity (CP) – like framework without modeling explicitly microstructural evolutions (Castelnau et al., 2008) or phase-field models which are ideally suited for the modeling of the chemo-mechanical coupling (Clavijo et al., 2021).
Here we present a global FE framework describing the mechanical behavior of deforming olivine aggregates by a CP model in which we incorporate a relaxation mechanism representing non-dislocation glide strain-accommodating mechanisms. The microstructural evolutions, including grain boundary migration (GBM) driven by capillarity and stored energy, solute drag, and nucleation, are computed within the FE framework through the level-set (LS) approach (Scholtes et al., 2016, 2015; Furstoss et al., 2018). This whole numerical framework constitutes a global tool for the modeling of olivine polycrystal deformation and also allows discrimination between creep regimes controlled by grain interiors or by grain boundaries. This approach is then used to quantify the intensity of strain localization on a pre-existing shear zone. Different types of pre-existing shear zones are tested and compared to each other, which brings new insights into the relative importance of microscale localizing features on the large-scale mechanical behavior of a grain aggregate.
In this section, we present the numerical framework used to model the olivine aggregate creep and the subsequent microstructural evolutions. First we present the CP model used to model dislocation creep of olivine. Then we show that a reduced crystal plasticity formulation could be suitable to account for other strain-accommodating mechanisms in olivine aggregates. Finally we introduce the LS approach used to model microstructural evolutions such as grain boundary migration (GBM) and nucleation.
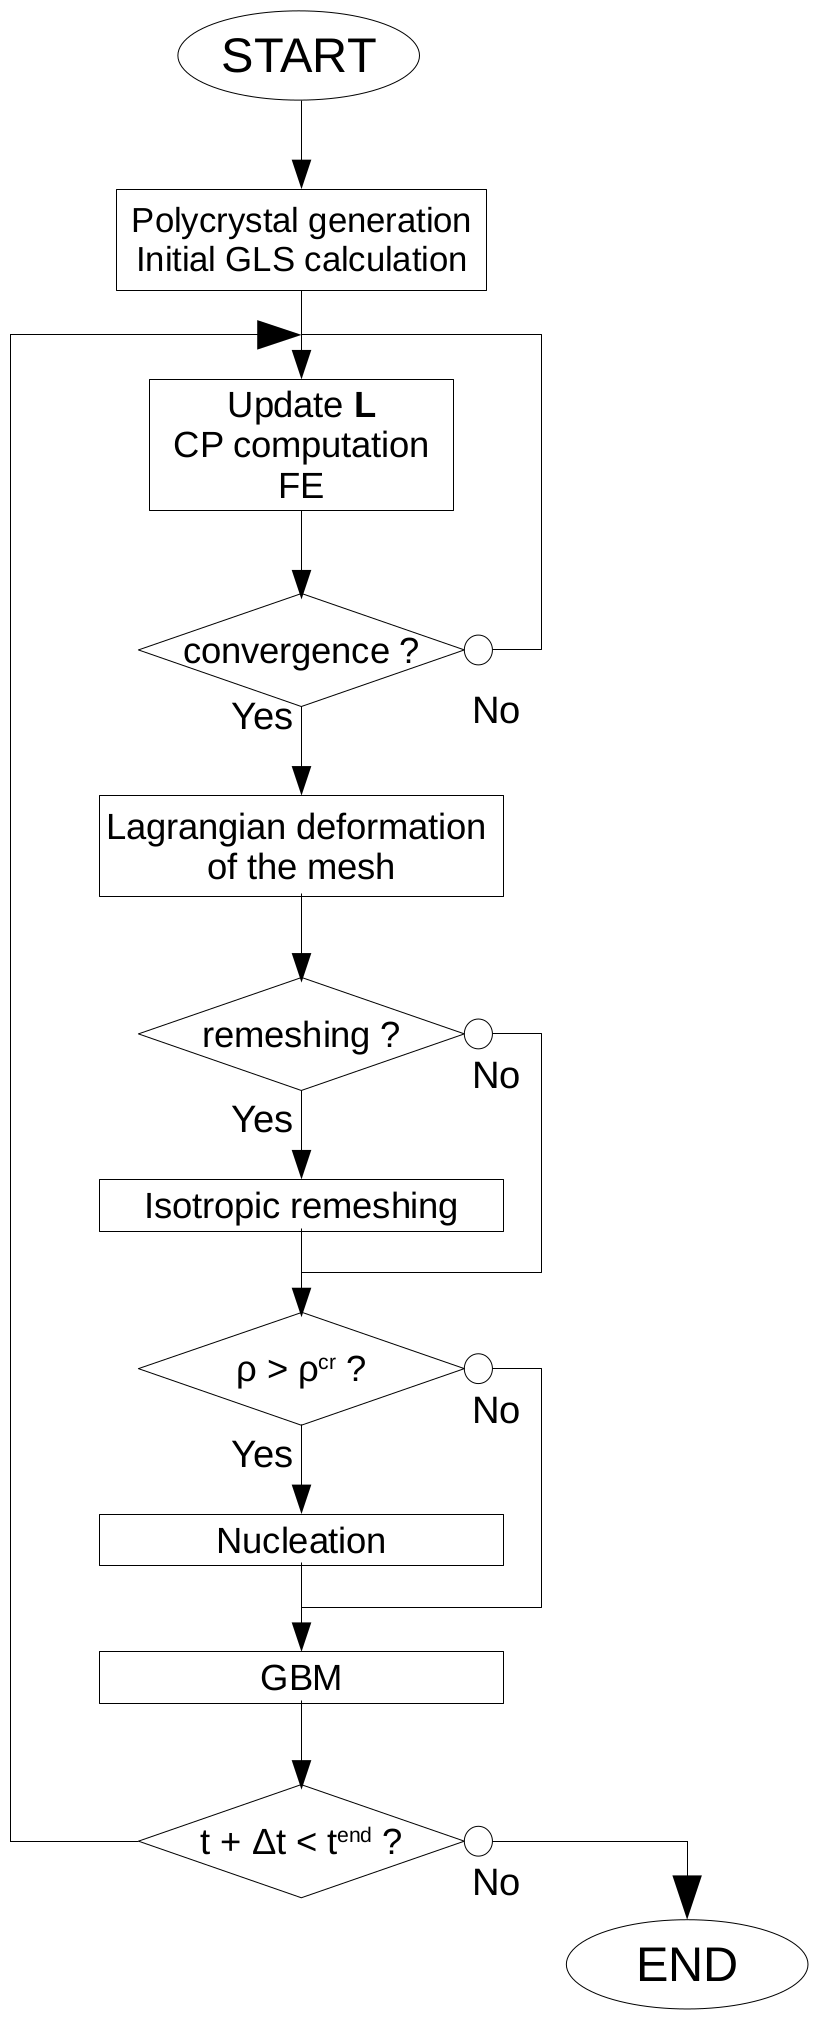
The succession of the different numerical operations described in the following is summarized by a flow chart presented in Fig. 1.
2.1 Crystal plasticity
CP models generally propose to decompose the plastic deformation into a combination of contributions coming from the crystal slip systems. CP calculations allow a mechanical behavior to be computed at a scale smaller than the grain scale and larger than the dislocation scale. Thus, in order to describe the mechanical behavior of a polycrystal, a homogenization scheme has to be used in combination with the CP computations. The homogenization technique used in this work is the crystal plasticity finite element method (CPFEM) in which each element of the FE mesh is considered as a crystallite (Sarrazola Ruiz et al., 2020). The CP equations are then solved on each element of the mesh between each FE resolution. The P1+ P1 mixed velocity–pressure finite element (FE) formulation used for the CPFEM homogenization permits elastic anisotropy to be dealt with and is presented in detail in Furstoss et al. (2021b).
2.1.1 Numerical framework
The single CP model used here describes the stress–strain behavior of a material point within the crystal (material point crystal plasticity – MPCP) (Marin, 2006) through an incompressible plastic strain formulation. The linear elastic behavior of the material is described by the Hooke's law relating the elastic strain εe (Green–Lagrange strain tensor) to the stress σ (second Piola–Kirchhoff stress tensor) using the fourth-order elastic constants matrix Ce:
The plastic velocity gradient Lp is expressed by a summation over the slip systems α through the following:
where mα and nα represent the slip direction and normal to glide plane, respectively, ⊗ represent the dyadic product such as where Pα is the Schmidt tensor. The slip rate is determined using the following constitutive model composed by a flow rule and a hardening law. The classical power-law flow rule is used here:
where m is a material parameter, is the reference slip rate, τα is the resolved stress computed using where : represents the double contraction and S the deviatoric stress. The critical resolved shear stresses (CRSSs) evolve during the deformation according to the hardening constitutive model. The dislocation-based hardening model considered here first relates the total dislocation density () to the CRSS through the Taylor equation (Taylor, 1934):
where is the CRSS within the (almost) undeformed material, μ is the shear modulus, bα is the Burgers vector norm and ψ is the Taylor coefficient.
Then the hardening or softening of the material through the increase or decrease in the CRSS, respectively, is computed by changing the dislocation density according to the slip rate of the considered slip system:
This expression is a variation of the Yoshie–Laasraoui–Jonas law (Laasraoui and Jonas, 1991) driving changes in dislocation density by a hardening parameter K1 (mm−2) representing the multiplication of dislocations during deformation, and a softening parameter K2 representing the recovery capability of the material through dislocation annihilation for instance.
2.1.2 Application to olivine
The constitutive model presented above is used in this work within a CPFEM context, to model the mechanical behavior of olivine aggregate dislocation creep at 1573 K.
The linear elastic behavior accounts for the orthorhombic symmetry of the olivine crystal using the following elastic constants (in Voigt notation) (Isaak et al., 1989):
The slip systems used in this work are the ones used in the literature for modeling olivine deformation (Castelnau et al., 2010). Indeed, only dislocations with [100] and [001] Burgers vectors are considered and gliding within (100), (010), {110} and (001), (010), (011), , (021) planes, respectively. It is worth mentioning that this list of slip systems gives only three linearly independent slip systems, which is not sufficient to respect the von Mises criterion requiring five independent slip systems to accommodate plastic deformation in any direction relative to the stress tensor.
The initial CRSSs () are only discriminated for the slip systems with different Burgers vectors and are computed using the dislocation dynamics computations of Durinck et al. (2007), which gives, at 1573 K, = 22.7 MPa and = 46.6 MPa. The power law flow rule (Eq. 3) and m parameters are taken equal for all slip systems and worth 5 × 10⁻³ s−1 and 0.1, respectively.
For the Taylor relationship (Eq. 4) parameters, the shear modulus is taken equal to 80 GPa and the Burgers vector norms to b[100] = 4.76 Å and b[001] = 5.99 Å. The Taylor parameter ψ for olivine aggregate ranges between 0.5 and 2.8 (review in Durinck, 2005) and we choose here to take an intermediate value of 1.1.
Finally, the softening and hardening parameters K1 and K2 are calibrated to best reproduce experimental data, as explained here below.
2.2 Reduced crystal plasticity
As mentioned above, the olivine slip systems do not allow the von Mises criterion to be respected. In nature, this lack of linearly independent slip systems is compensated by other strain-accommodating mechanisms such as dislocation climb (Gouriet et al., 2019b), diffusion creep (Hirth and Kohlstedt, 2003) or grain boundary sliding (GBS) (Hansen et al., 2011). Numerically, the lack of slip systems may cause issues in the problem resolution. For instance, using a CPFEM homogenization scheme with an unclosed flow surface implies that the elements in which no slip system can be activated will deform elastically. The stress gradients between these elements and neighboring elements where plasticity is active are considerable and unrealistic and the FE resolution becomes cumbersome or even impossible. This issue is generally bypassed in some models of olivine plastic deformation by adding some artificial slip systems permitting the von Mises criterion to be satisfied (Tommasi et al., 2009). These dummy slip systems are added with very high CRSS and do not participate in the lattice rotation, which permits the lattice preferred orientation (LPO) induced by dislocation glide only to be modeled. Another alternative is to introduce a relaxation mechanism accommodating strain within the deformation space not covered by the slip systems. This has been made for the modeling of olivine deformation within a visco-plastic self-consistent (VPSC) framework (Detrez et al., 2015) and could be done within a CPFEM context by using a reduced crystal plasticity approach (Maresca et al., 2016).
2.2.1 Numerical framework
The main idea of the reduced CP is to decompose the plastic velocity gradient into a part coming from dislocation glide on the defined slip systems (as in Eq. 2) and a part representing the strain accommodated by a relaxation mechanism Lrel (Maresca et al., 2016):
The computation of Lrel requires the definition of the part of the deformation space not covered by the slip systems. For this, the list of the different Schmidt tensors has to be expressed as a base composed by a set of linearly independent and orthonormal tensors Mβ such as the following (Maresca et al., 2016):
where λα and μβ are non-null real. It could be noted that if all the slip systems are linearly independent N=ns (in a general case N>ns). In fact, the base formed by these tensors represents the part of the deformation space in which the strain can be accommodated by dislocation glide. Thus, one can define a fourth-order projector ℙ allowing any stress tensor to be projected within the deformation space not spanned by the slip systems as follows (Maresca et al., 2016):
where 𝟙 is the fourth-order identity tensor. It only remains to define the strain accommodated by the relaxation mechanism Lrel in response to the projected deviatoric stress (Maresca et al., 2016):
where is the plastic strain rate of the relaxation mechanism and
The simplest way to express the relaxation plastic strain rate is to take, similarly to the power law flow rule (Eq. 3), a von Mises type isotropic expression such as the following (Maresca et al., 2016):
where and n are two parameters and is a critical stress for the activation of the relaxation mechanism (similarly to the CRSS).
As for the hardening or softening of the dislocation glide presented above, the strength of the relaxation mechanism could also evolve during the deformation. However, this aspect will not be taken into account in this work (i.e., ).
It is worth mentioning that the relaxation mechanism, as formulated and introduced above, is not involved in the lattice rotation computation. Thus, the introduction of this mechanism should not impact directly the development of LPO. The only influence on the lattice rotation may be indirect, by minimizing the elastic rotation through the slightest activation of the elastic deformation regime.
2.2.2 Application to olivine
In this work, the relaxation mechanism introduced by the reduced CP presented above is used to model the strain-accommodating processes taking place in olivine aggregates, excluding dislocation glide which is accounted for in the classical CP (Sect. 2.1). Two main families of strain-accommodating mechanisms are distinguished here, the ones taking place at grain interiors and the ones occurring at grain boundaries (GBse). The first ones combine the effect of dislocation climb (Gouriet et al., 2019b) and diffusion creep at grain interiors (i.e., Nabarro–Herring creep; Nabarro, 1948; Herring, 1950) while the latter should represent mechanisms such as GB sliding (GBS) (Hansen et al., 2011) and its variations (dislocation accommodated GBS; Wang et al., 2010, superplasticity; Hiraga et al., 2010) and diffusion creep within grain boundaries (i.e., Coble creep; Coble, 1963). Even if numerical solutions exist for the modeling of dislocation climb (Geers et al., 2014) and GBS (Wheeler, 2010), the use of a unique CPFEM framework is more suitable and numerically efficient (as CPFEM is already numerically expensive). Thus, the parameters of the relaxation mechanism in its isotropic formulation (Eq. 12) should reflect the relative importance on the aggregate deformation between the strain-accommodating mechanisms and dislocation glide. As we choose to take the ε0 and n parameters constant and equal to the parameters of the dislocation glide power law (Eq. 3) and m, the only parameter we can use to discriminate between grain boundaries and interiors is the relaxation strength .
For grain interiors, we choose as small as possible to keep unchanged the mechanical behavior of monocrystals (see Sect. 3.1.1), we get .
Recent laboratory observations report an amorphization of olivine around grain boundaries due to the application of stress (Samae et al., 2021). A hypothesis on the origin of strain-accommodating mechanisms at grain boundaries in olivine may be related to this amorphization. The stress needed to amorphize a crystal can be seen, at first order, as the stress above which the lattice is no longer stable. Ab initio calculations make it possible to compute an ideal shear/tensile stress (ISS/ITS) representing a critical stress, at 0 K, above which the structure of a perfect crystal is no longer stable and could change to another phase, which could be amorphous. The ITS/ISS computed for olivine (Gouriet et al., 2019a) show relatively low magnitudes similar to the ones of Peierls stresses (Durinck, 2005) almost corresponding to the CRSS at 0 K. Thus, in this work we consider the strength of the relaxation mechanism at grain boundaries .
The width around interfaces in which the relaxation mechanism is considered as the one representing GBS (or other strain-accommodating mechanisms at GB) will be called the mechanical GB width in the following. It could be noted that this width does not correspond to the chemical or physical GB width. In fact, this width should represent the zone around GB in which the mechanical behavior of the crystal is impacted by the presence of the boundary. Such a width has never been described before in olivine but its value can be taken close to the grain size below which the creep regime of the aggregate is controlled by GB. In the thermomechanical conditions considered in this work (1573 K and strain rate of 10−5 s−1) this value is close to 10 µm (Skemer et al., 2011). Thus the mechanical GB width will be taken to 4 elements with a mean mesh size of 3 µm.
Using the slip systems presented in Sect. 2.1.2, the linearly independent and orthonormal tensors Mβ used to compute the projector ℙ (see Eq. 9) are as follows:
2.3 Microstructural evolutions
The microstructural evolutions of the olivine aggregate during deformation are modeled using the level-set (LS) framework (Merriman et al., 1994; Bernacki et al., 2011; Furstoss et al., 2020). This formalism allows the polycrystal to be described using signed distance functions (LS functions) representing the distance to the GB and are defined as positive inside the grain they represent and negative elsewhere. In order to reduce the number of LS functions needed to describe the aggregate, we use global LS (GLS) functions representing several non-neighboring grains (Scholtes et al., 2015). The displacement of the GLS is computed within a 3D FE framework using an isotropic mesh composed of P1 (associated with linear interpolation functions) tetrahedral elements with a typical mean size of 3 µm. After 10 % of macroscopic deformation we use isotropic homogeneous remeshing in order to get elements with good quality. The initial polycrystals are generated using an optimized dropping and rolling method and a Laguerre–Voronoï tessellation algorithm allowing us to respect a precise grain size distribution (Hitti et al., 2012).
2.3.1 Grain boundary migration
Modeling GBM within a LS framework is equivalent to advecting the GLS functions according to the equations of GBM. In this work we use a capillarity- and stored-energy-driven GBM accounting for solute drag such that the grain boundary velocity v can be expressed as follows:
where n and κ are the grain boundary outward unit normal and sum of main curvatures, respectively, and M and γ are the olivine olivine GB mobility and interfacial energy, respectively. The latter are considered as constant and are taken as 2.9 × 10⁻² and 1 × 10⁻⁶ J mm−2, respectively according to Furstoss et al. (2018). τ = 1.3 × 10⁻¹¹ J mm−1 (Durinck, 2005) and ρ are the dislocation line energy and density, respectively. Pd is the solute drag pressure which can be approximated as follows:
where c0 is the impurity concentration taken as 200 ppm, and α and β are the solute drag parameters and are taken as 3 × 10⁸ J s mm−4 and 4.8 × 10⁸ s mm−1, respectively, according to Furstoss et al. (2021a).
The FE strong formulation for the displacement of the GLS functions Φi is obtained using the same semi-explicit first-order time discretization presented in Furstoss et al. (2021a) in addition to the accounting of stored energy:
where Δt is the time step and ℳ is a term (equivalent to a mass term by analogy with the heat equation) permitting the solute drag effect to be accounted for (Furstoss et al., 2021a). The difference of dislocation density across GB Δρ is computed by averaging the dislocation density per interface following the methodology presented in Ilin et al. (2018). The boundary conditions applied to GLS functions are null Neumann ones (i.e., with nΓ the unit normal to domain) which imposes to GLS functions to evolve towards a direction normal to the calculation domain boundaries.
After each GLS transport step, a reinitialization procedure is applied to the GLS functions in order to restore their metric properties (i.e., ) at least in a thin layer around interfaces. This reinitialization step is performed using the direct approach proposed by Shakoor et al. (2015).
The volume swapped during GBM is tracked and we assign to it a low dislocation density ρ0 = 105 mm−2 corresponding to the non-hardened material. The lattice orientation in the elements swapped during GBM is defined as the orientation of the neighboring element belonging to the same grain and having the minimal dislocation density (i.e., the less deformed one).
2.3.2 Dynamic recrystallization
Olivine aggregates evidence mainly continuous dynamic recrystallization (DRX) (Poirier and Nicolas, 1975) through a sub-grain rotation (SGR) mechanism. In the LS framework used here, only the discontinuous nucleation (DDRX) can be considered by inserting nuclei and making them grow. The nucleation is accounted for within the numerical framework by simply modifying some well-chosen GLS functions, or if no GLS function can receive the nucleus, by adding a new GLS function (Scholtes et al., 2016). Potential nucleation sites are not restricted at zones around GB but can be anywhere in the whole aggregate. In order to account for the continuous nature of the DRX in olivine, we propose to model the SGR process by considering each nucleus as a sub-grain surrounded by low-angle GB (LAGB). As LAGBs generally have a much lower mobility than high-angle grain boundaries (HAGBs) (Humphreys and Hatherly, 2012) we initially ascribe them MLAGB<MHAGB. In nature, as the sub-grain deforms it will progressively rotate from the parent grain and the mobility of the surrounded GB will reach the one of LAGB (Humphreys and Hatherly, 2012). This mechanism is accounted for in our numerical framework by defining the mobility for the GB surrounding a nucleus as a function of the strain accumulated within the nucleus such as the following:
where is the average strain accumulated within the nucleus and is the maximal accumulated strain before the sub-grain becomes a new grain.
Nucleation criteria are generally defined as either large orientation or dislocation density gradients or high dissipated energy or dislocation density. In the present work the nucleation criterion is only based on a critical dislocation density ρcr above which the nucleation probability is non-null. This critical dislocation density is computed in a way that respects the Bailey–Hirsch criterion which relates the critical radius for a spherical nuclei RNucl to balance out the capillarity force by the force due to the difference of stored energy:
where ω is a security factor taken as 2.
The nucleus radius is computed following the piezometric relationship defined by Van der Wal et al. (1993):
in combination with the diffusion creep law (Hirth and Kohlstedt, 2003) in which the grain size is replaced by the nucleus size:
where R is the perfect gas constant, T is the temperature, is the strain rate, A = 1.5 and E = 375 kJ mol−1. Combining Eqs. (19) and (20) gives the nucleus radius as a function of the strain rate (that is imposed in our simulation) and Eq. (18) gives the critical dislocation density.
The nucleation rate , representing a nuclei volume per time unit, is computed using the following expression (Maire et al., 2017):
where ϕ represents the total boundary area surrounding the aggregate volume verifying ρ>ρcr and Kg (m s−1) is a probability coefficient which has to be calibrated with experimental data (see Sect. 3.1.2).
As for the volume swapped during GBM, a low dislocation density ρ0 is ascribed to the zones where nuclei have appeared while the nuclei orientations are defined as the initial orientations of the parent grains.
In this section, we present the calibration of the different material parameters used in this framework on experimental data. First, the hardening and recovery parameters K1 and K2 (Eq. 5) are identified using a monocrystal compression test. Then we calibrate the recrystallization rate Kg using experimental results on a simple shear experiment on olivine aggregates. Finally we show that our numerical framework is able to capture two different creep regimes, one in which the deformation is accommodated by the bulk material (which could be the dislocation creep) and one dominantly controlled by grain boundary strain-accommodating mechanism.
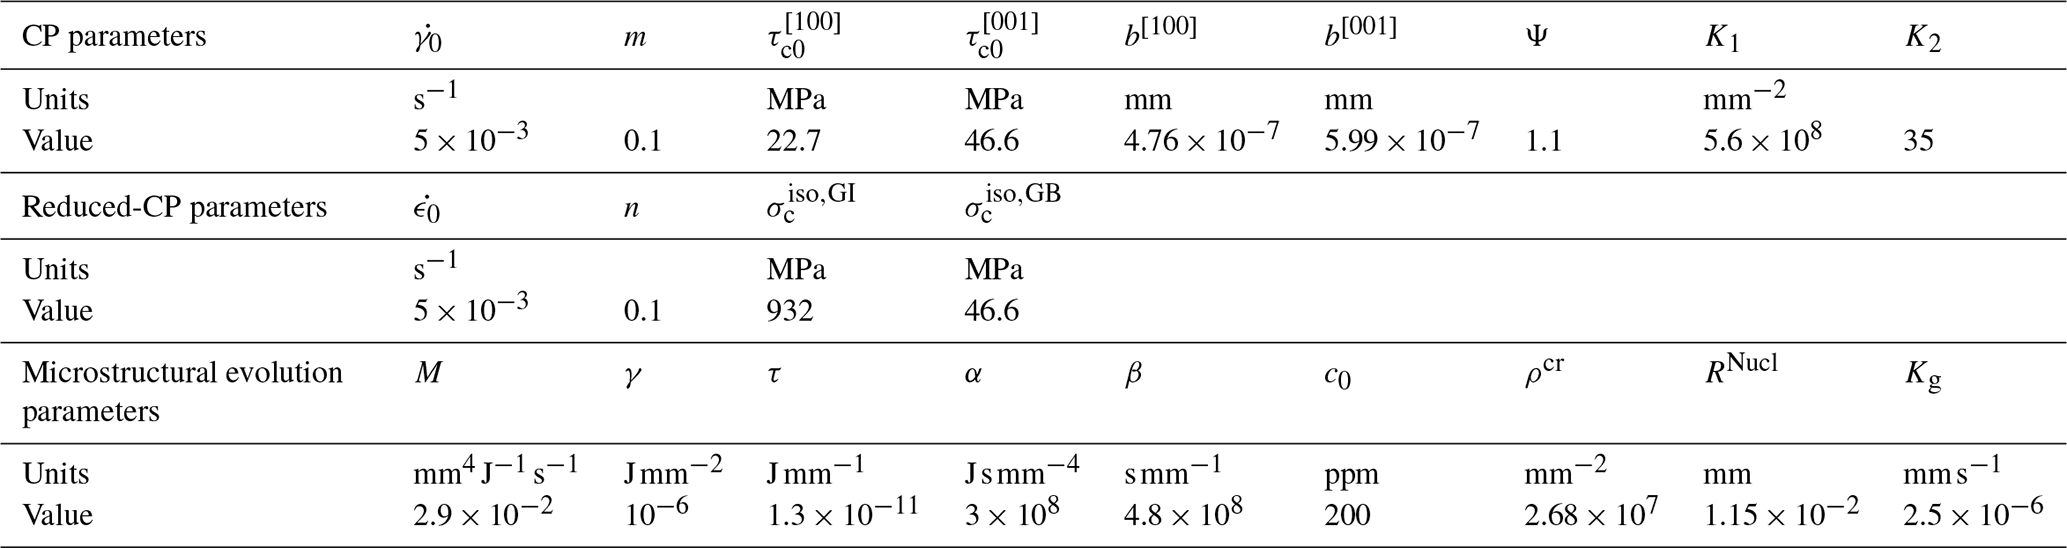
Table 2Values of the different material parameters used in this work (temperature of 1573 K and strain rate of 10−5 s−1).
3.1 Material parameters calibration
The different material parameters presented above and adjusted below are summarized in Table 2.
3.1.1 Recovery and hardening
Monocrystal deformation experiments seem the most appropriate mechanical tests to calibrate the hardening and recovery parameters K1 and K2 because these tests do not involve GB and thus permit only the deformation accommodated by dislocation creation and motion to be considered. The experimental data selected for this calibration are the ones of Phakey et al. (1972) in which three different monocrystal orientations are used with respect to the compression axis. The compression tests are performed for these three orientations at 1073 and 1273 K. In order to compare the strain–stress curves between experiments and simulations, we use the macroscopic strain and we compute the equivalent stress σeq as follows:
where y is the compression direction, Ω2D represents the cross section (normal to y) of the sample in its middle and S represents the surface of this cross section. As in experiments, we use a cylinder sample with a diameter of 3 mm and a length of 4 mm and a strain rate of 10−5 s−1. The upper face of the cylinder is moved at a constant velocity in the compression direction and the displacements in the other directions are imposed as null on this face. The movements of the lower face in the compression direction are imposed to zero while the displacements in the other directions are left free. Finally the displacements of the other face are left free in all directions.
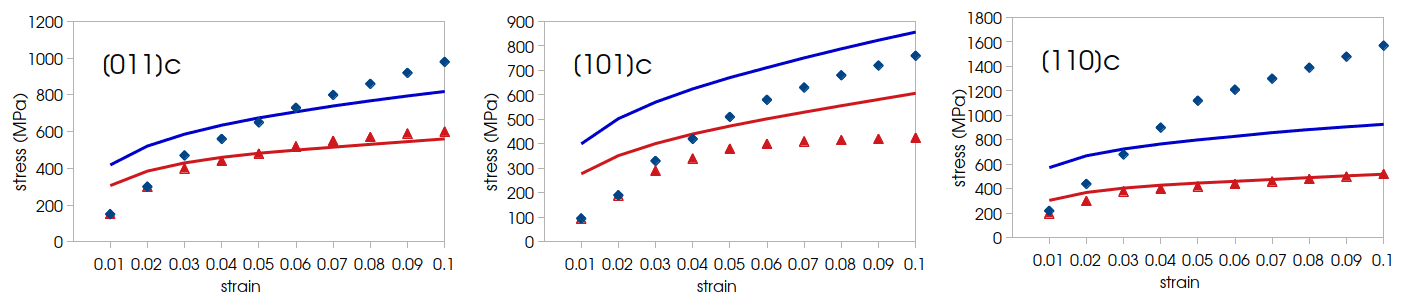
Figure 2Best fitting strain–stress curves for hardening and recovery parameters calibration. Solid lines represent the simulated mechanical behavior while dots represent experiments of Phakey et al. (1972). For the three different orientations the colors represent the temperature of the compression test, 1073 K (blue) and 1273 K (red).
The K1 and K2 parameters are considered only dependent on temperature and are calibrated by selecting the values permitting the best reproduction the experimental strain–stress curves for the three orientations at a given temperature. The identification of the best fitting K1 and K2 is performed by using an optimization software, called MOOPI (Chenot et al., 2011), based on a genetic algorithm permitting exploration of the parameter space by achieving random mutations in order to ensure that the proposed parameters do not represent a local minimum of the cost function (which represents the quality of the parameters with respect to the expected results). Crystal plasticity models are physically consistent in the sense that they account for the crystallography of the phases when computing crystal plastic deformation. However, these models work at a scale at which it is not possible to resolve either dislocation types or interactions between dislocations. For this reason, these interactions are replaced in crystal plasticity models by phenomenological laws that try to emulate the impact of dislocations (and their interactions) on the mechanical response of the material. Obviously, the real complexity of the behavior of dislocations is hardly captured by such phenomenological models. Although one can argue that it is possible to enrich these dislocation-based models in order to improve the prediction of crystal plasticity approaches, these enriched models would require a large number of numerical parameters that are difficult to calibrate or constrain using experiments. Considering the amount of experimental data available, in this work we decided to stick to a simple dislocation-based crystal plasticity model with a low number of parameters. This choice allows us to properly calibrate the parameters of the model, but as a consequence it is not possible to accurately reproduce experimental results. The strain–stress curves of the best fitting hardening and recovery parameters are presented in Fig. 2.
All simulated strain–stress curves deviate from experimental ones at low strains, which reflects an overestimation of the initial CRSS (i.e., ) by the model. However, we choose to consider these parameters as fixed, as the expressions we use are derived from dynamic dislocation simulations (see Sect. 2.1.2) allowing both a large experimental dataset and a temperature dependence on these values to be obtained. The discrepancies between numerical models and experimental data could be due to the observed brittle behavior of samples at low stresses (Phakey et al., 1972). Indeed the presence of fractures may cause the decrease in the elastic limit which would result in a lower stress at low strain. Above this low strain regime, for the 1273 K tests (see curves in red in Fig. 2) the simulated strain–stress curves show perfect agreement with the experimental ones except for the [101]c where the stress is overestimated by the model. For the low-temperature cases, the simulated stresses differ more from the experimental ones but still give reasonable agreement at least for the [011]c and [101]c cases. For the [110]c at 1073 K, the model strongly underestimates the stress; however, this strong discrepancy is consistent with the fact that Phakey et al. (1972) have reported that this sample was highly stressed. Besides this reason, misfits between experimental and numerical strain–stress curves can also arise from uncertainties in experimental stress measurements, varying loading conditions with respect to crystallographic axes (up to 10∘), or sample fracturation before loading (Phakey et al., 1972).
The values of the hardening and recovery parameters are linearly extrapolated in order to get their values at 1573 K which is the temperature used in the following. At 1073 K the best fitting K1 and K2 are 9.6 × 108 mm−2 and 10, respectively; at 1273 K they are worth 8 × 108 mm−2 and 20, respectively, and thus at 1573 K, K1 = 5.6 × 108 mm−2 and K2=35.
3.1.2 Dynamic recrystallization parameters
The numerical values for the LAGB mobility MLAGB and the average strain accumulated above which the sub-grain (nucleus) can be considered as a grain (see Sect. 2.3.2) are chosen in order for a majority of sub-grains to not disappear in the increments following nucleation. After performing several simulations we choose and , which permits the largest part of the sub-grains to persist at least few increments after their nucleation. Further numerical or experimental studies should be done to evaluate these parameters, which are, in the current model, more numerical than physical parameters.

Figure 3Full field simulation of olivine aggregate deformed in simple shear for the best fitting Kg value and for different shear strain. Within the slice (left picture) the maximum of GLS functions is represented, which permits grain boundaries to be visualized. The yellow volumes represent the dynamically recrystallized grains while the color scale represents the total dislocation density within the polycrystal.
For the adjustment of the dynamic recrystallization rate Kg, we aim at reproducing a simple shear experiment of a polycrystalline olivine performed by Zhang et al. (2000). For this purpose, we use a computational domain of 0.15 mm × 0.15 mm × 0.1 mm initially composed by 17 grains having a mean radius size of 31.6 µm (Fig. 3).
To deform the sample in simple shear we impose null displacement in the shear direction and normal to shear plane on the lower face of the sample while the other direction is left free. The upper face is displaced at constant velocity in the shear direction, no movements are allowed in the direction normal to the shear plane and the third direction is left free. The left and right faces are displaced in the shear direction at a constant velocity corresponding to the linear interpolation between the upper and lower face velocities in the shear direction. As for the other faces, the movements in the direction normal to shear plane are set to zero while in the other direction nothing is imposed. Finally, the movements of the front and back faces are left free in all directions.
As in experiments (Zhang et al., 2000), the sample is deformed at 1573 K and 10−5 s−1. Multiple simulations with different Kg values are performed in order to obtain the 20 % of dynamically recrystallized grain fraction after 60 % of shear strain measured within experiments. Using a Kg value of 2.5 × 10⁻⁹ mm s−1 allows for having 25 % of dynamically recrystallized grain fraction after 60 % of shear strain, which is the best fit obtained (Fig. 3).
3.2 Full field modeling of olivine creep regime
In the full field framework presented above, the grain boundaries and interior contributions to the whole deformation of the polycrystal can be followed during the mechanical test. To do this, the local equivalent strain (ε) can be computed from the velocity gradient using , and once integrated upon the whole domain Ω separated into two components such as
where ΩGB and ΩGI represent the part of the microstructure in which the relaxation mechanism represents the GB and grain interior strain-accommodating mechanisms, respectively (see Sect. 2.2.2).

Figure 4(a) Equivalent strain integrated (see Eq. 23) over the whole polycrystal (purple), grain boundaries (blue) and grain interiors (orange), and integrated over time. Mean grain size evolution during deformation (brown) and the corresponding thermomechanical conditions and mean grain size in an olivine deformation map (b) from Skemer et al. (2011); the two stars have been positioned according to the imposed strain rate and they correspond to a simulated stresses of 190 MPa (red) and 130 MPa (green).
During the deformation, DRX occurs and results in a mean grain size reduction through nucleation of new small grains. Equation (23) shows that, for mean grain size superior to ≈ 20 µm the deformation is mainly accommodated in grain interiors (Fig. 4).
As strain increases, mean grain size decreases under 20 µm and deformation of the aggregate becomes dominated by deformation mechanisms occurring at GB (Fig. 4). The transitional grain size between GB and grain-interior-controlled creep determined from this analysis is in accordance with deformation maps of olivine (Skemer et al., 2011) obtained from laboratory experiments (Fig. 4).
Considering the simulated stress, up to 5 % of macroscopic strain the sample hardens to reach a deviatoric stress of 190MPa while after the initiation of grain size reduction the material softens until the deviatoric stress reaches a steady value of 130 MPa. It is worth noting that these deviatoric stress values are in good agreement with experimental data (Fig. 4).
These observations allow us to propose that this framework is capable of discriminating two different creep regimes, one monitored by a GB strain-accommodating mechanism and one mainly controlled by grain interiors.
It is worth noting that the transition between these mechanisms is mainly due to the increase in the volumetric fraction of GB with the decrease in mean grain size due to DRX. Indeed, the mechanical grain boundary width chosen for this study (see Sect. 2.2.2) implies that for an aggregate with grain radii inferior to ≈ 10 µm, the majority of the aggregate behaves as GB.
In the following section, the presented numerical framework is used to study the strain localization on different sorts of pre-existing microscale shear zones. For this we use computational domains of 0.69 mm × 0.25 mm × 0.35 mm deformed in traction and we adopt a pre-existing shear band geometry similar to one used in Tommasi et al. (2009), i.e., a shear band oriented at 45∘ with respect to the extension direction (Fig. 5).
The left face of the domain is displaced at a constant velocity in the traction direction imposing a macroscopic strain rate of 10−5 s−1 while the displacements in the other directions are imposed to be null. The right face cannot move in the traction direction but is free in the other ones. The movements of the other faces are left free in all directions.
The simulations are performed at a temperature of 1573 K and using the parameters described before (see Table 2).
4.1 Initial setups
Five different models are tested here, one with no pre-existing shear zone which will serve as a reference case and four others with different types of pre-existing shear bands.
The first considered shear zone consists of a strongly textured (with large lattice preferred orientation) zone in which grains have orientations maximizing the dislocation plastic strain rate (Eq. 2), while outside of the shear zone grains have random orientations (Fig. 5).
The second shear zone corresponds to an ultrafine grained zone in which the mean grain size is ≈ 10 µm, while elsewhere the mean grain size is ≈ 30 µm. In the rest of the polycrystal, grain orientations are picked randomly (Fig. 5).
The third one is composed of strongly elongated grains where the maximal elongation direction is the shear zone direction (45∘ to the extension direction). In this setup, called SPO (shape preferred orientation) shear zone in the following, the grain orientations are randomly selected (Fig. 5).
The last shear zone consists of a combination of the two first ones such as the zone is composed of ultrafine grain with orientations maximizing the dislocation plastic strain rate. Elsewhere, the grain sizes are ≈ 30 µm and their orientations are randomly selected (Fig. 5).
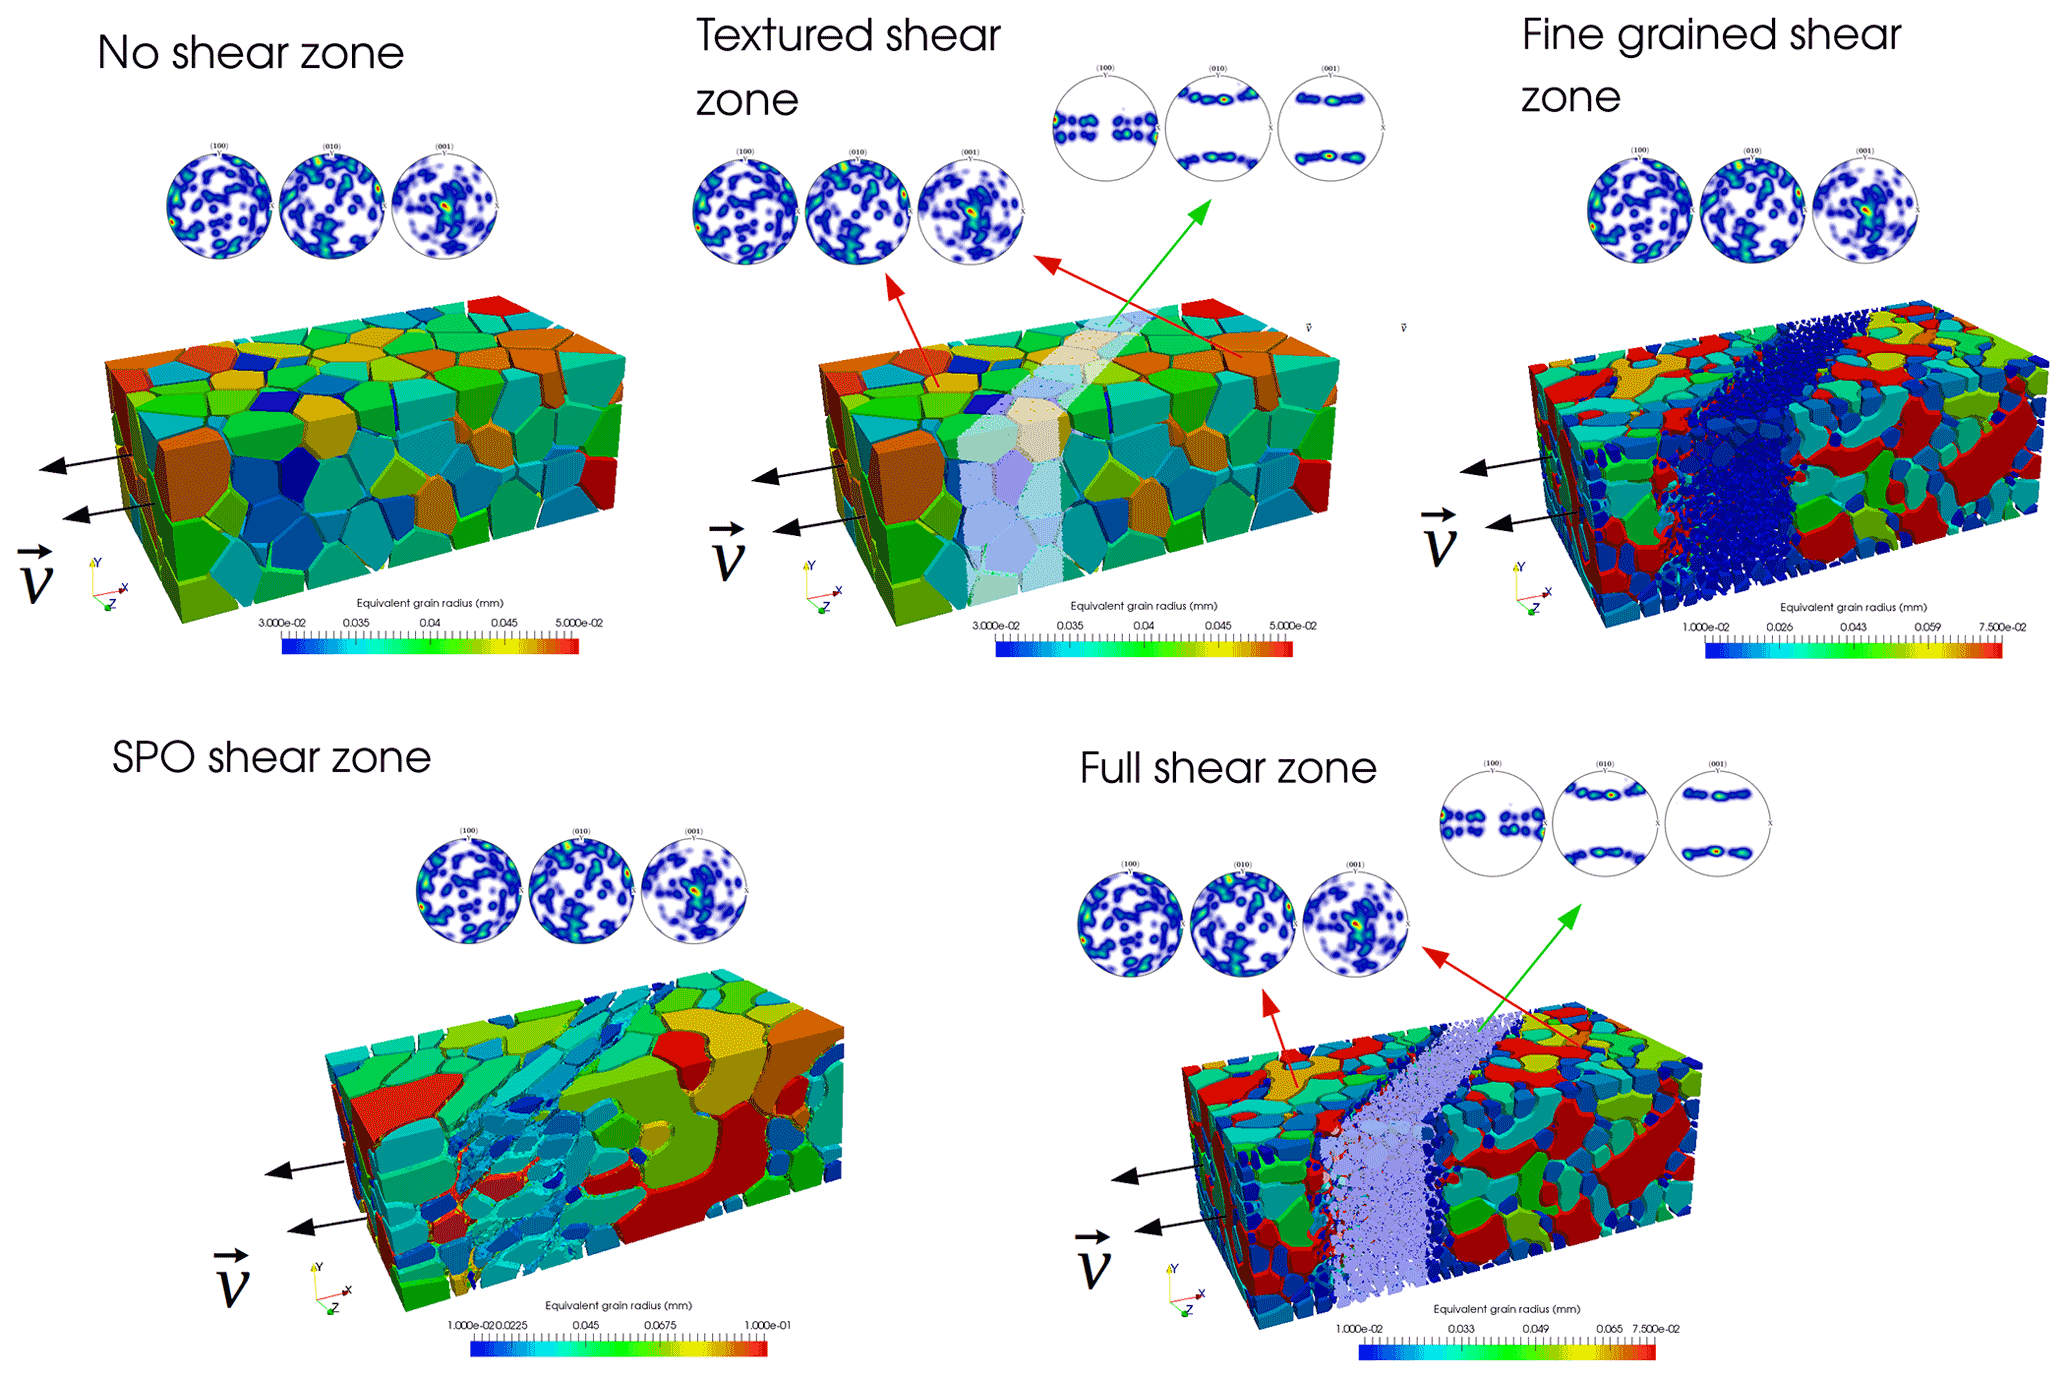
Figure 5Initial setups of the performed simulations; color scale represents equivalent grain radius. Orientations within the different zones are represented through pole figures computed using MTEX (Mainprice et al., 2015).

Figure 6Ratio of the cumulated average strain for the inner part over the one for the outer parts of the sample for the different type of pre-existing shear zone.
4.2 Full field results
The efficiency of strain localization in the numerical sample can be examined by computing the ratio between the amount of strain accumulated inside and outside of the shear band between the different pre-textured models and the reference model (Fig. 6).
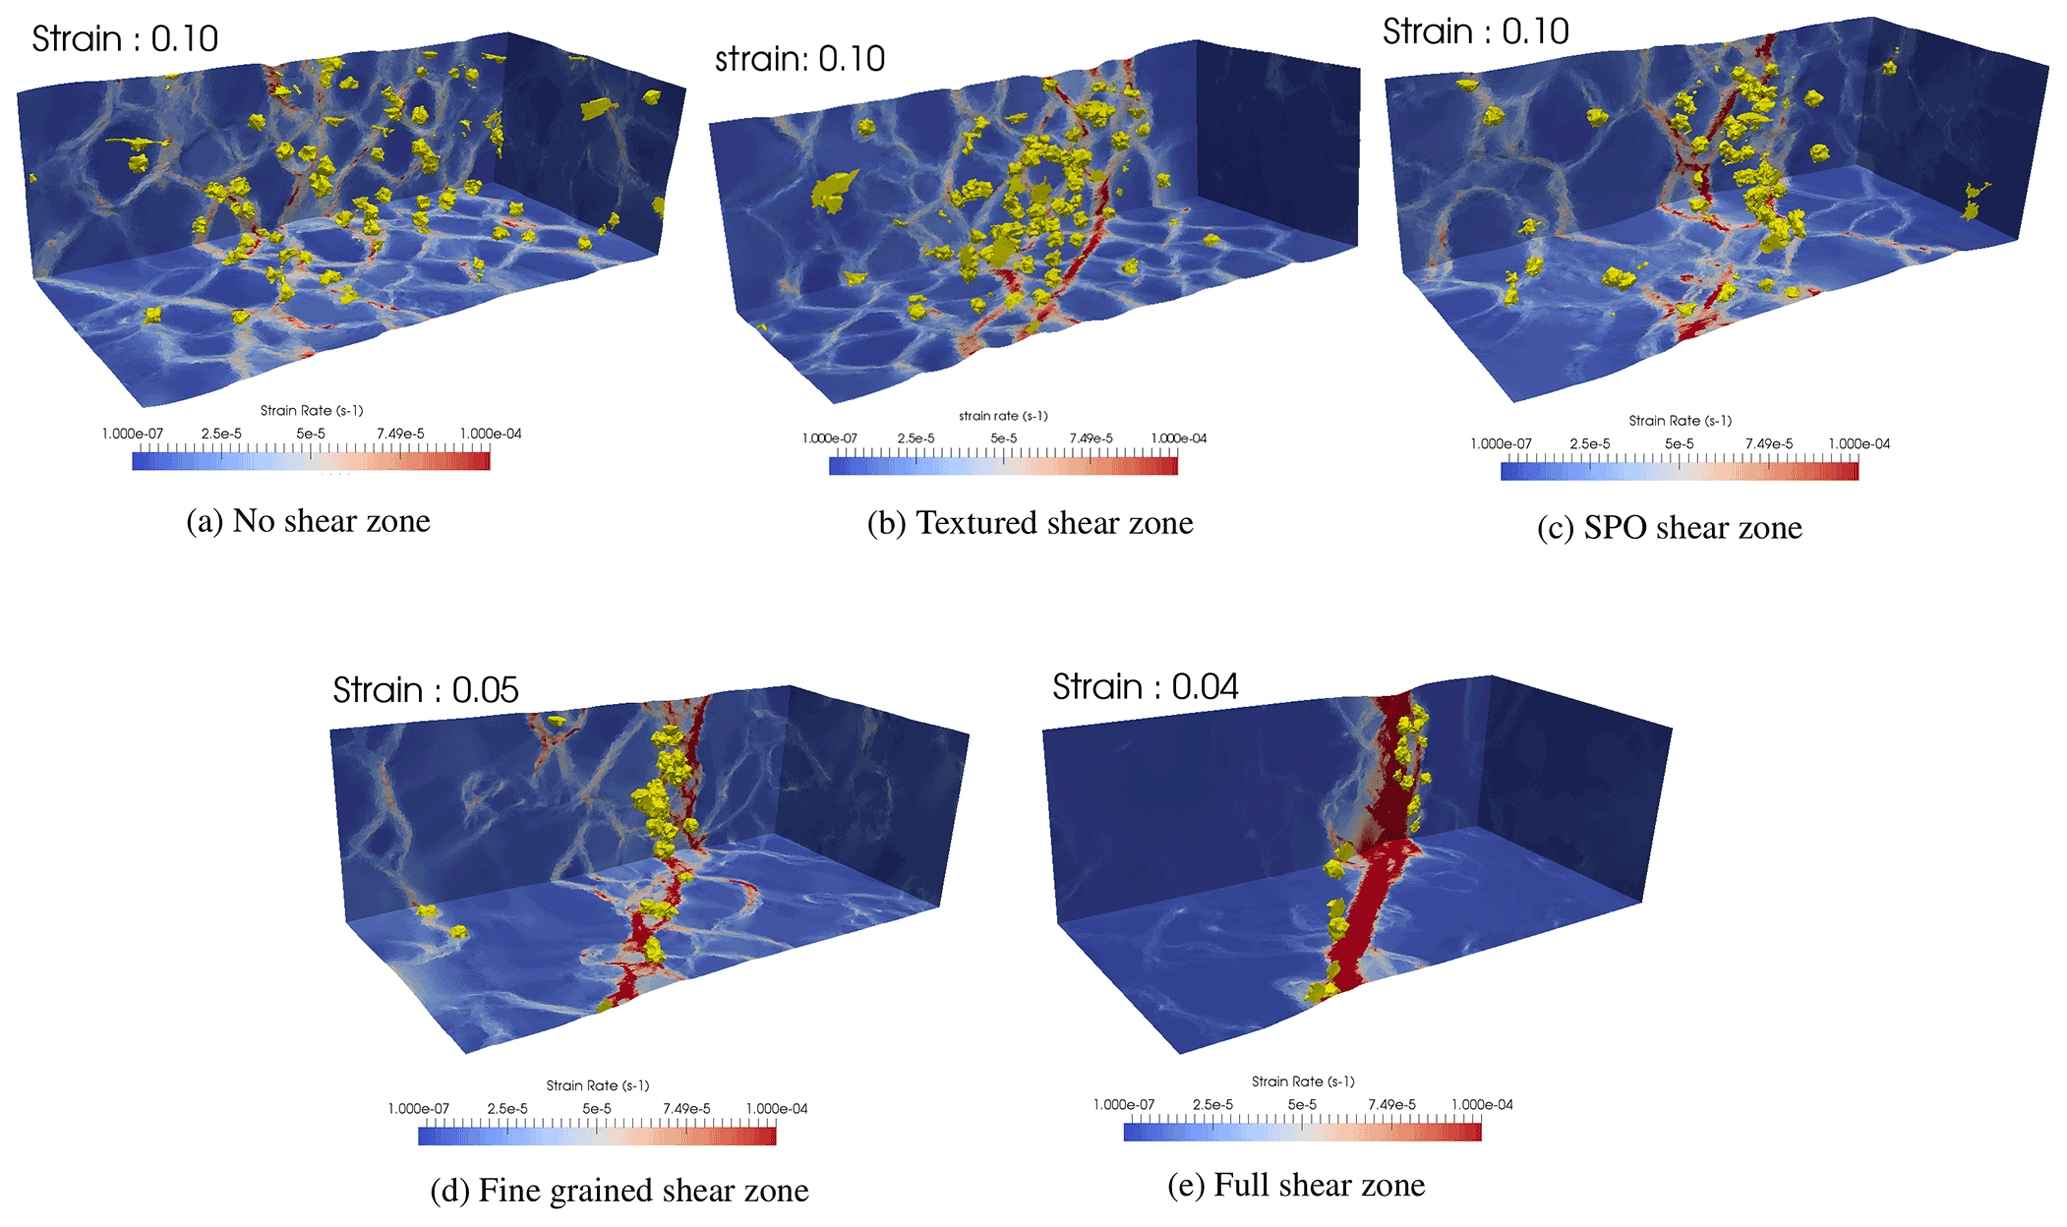
Figure 7Samples after 10 % of macroscopic deformation for no pre-existing (a), textured (b), SPO (c) shear zones, after 5 % of macroscopic strain for small grain size (d) and after 4 % of macroscopic strain for textured plus small grain size shear zone (e). Colors indicate the strain rate intensity and yellow volumes represent the dynamically recrystallized grains.
For the case in which no specific shear zone has been imposed, the inner part of the domain accommodates more strain than the outer parts (≈ 20 % higher after 8 % of macroscopic strain). In this case, the larger strain rates are mainly observed at GB in the whole microstructure and DRX occurs in the sample where dislocation density is the highest (Fig. 7a). The low strain localization observed here could be explained by the geometry and the boundary conditions applied to these models, impeding strain localization close to the model boundaries and leading intrinsically to a higher deformation in the inner part. This intrinsic strain localization due to the model setup has to be kept in mind when analyzing strain localization by pre-existing structures.
For the textured shear zone case, strain localization in the inner zone is much more pronounced (twice as large as the outer parts after 8 % of macroscopic strain, Fig. 6). Moreover, DRX through nucleation events occurs preferentially within the shear zone as well as on the outskirts of the shear zone (Fig. 7b). Here again, large strain rates seem to localize at GB, and more precisely at the interface between well oriented (for dislocation glide) and badly oriented grains. The strain localization ratio increases slowly with increasing strain and continues to increase after 10 % of strain. For the fine grained shear zone, the inner part of the sample accumulates the largest part of the deformation (more than 3 times than the outer parts after 6 % of macroscopic strain, Fig. 6). A large, continuous and quickly deforming shear band (with high strain rate) is observed in the inner zone while nucleation also occurs preferentially around and within the shear zone (Fig. 7d). For the SPO model, the partition of deformation between the inner and the outer zones is nearly equivalent to that of the textured shear zone model, except that strain localization occurs faster, during the first 1 % of strain, and quickly stabilizes with a strain ratio around 2 (Fig. 6). The strain rate distribution is different from the fine grain case: in fact we can observe the formation of multiple shear bands parallel to the initial shear zone and located around this area (Fig. 7c). As for other models, the DRX events are mainly located near the shear zone. For the shear zone combining small grain size and crystallographic texture, the strain accumulated by the inner part is almost equivalent to the sum of the two previously described models and reaches its peak value for strains between 1 and 2 %. The strain accumulated in the outer parts is much lower than for the other cases (3800 % higher in the inner part than in the outer parts after 4 % of macroscopic strain, Fig. 6). Strain rate distribution within the sample exhibits a large contrast between the inner zone, which is strongly deformed, and the outer parts, which are mainly undeformed (Fig. 7e). As for other models with a pre-existing shear zone, the nucleation events are located within and near the weakest part of the sample (Fig. 7e).
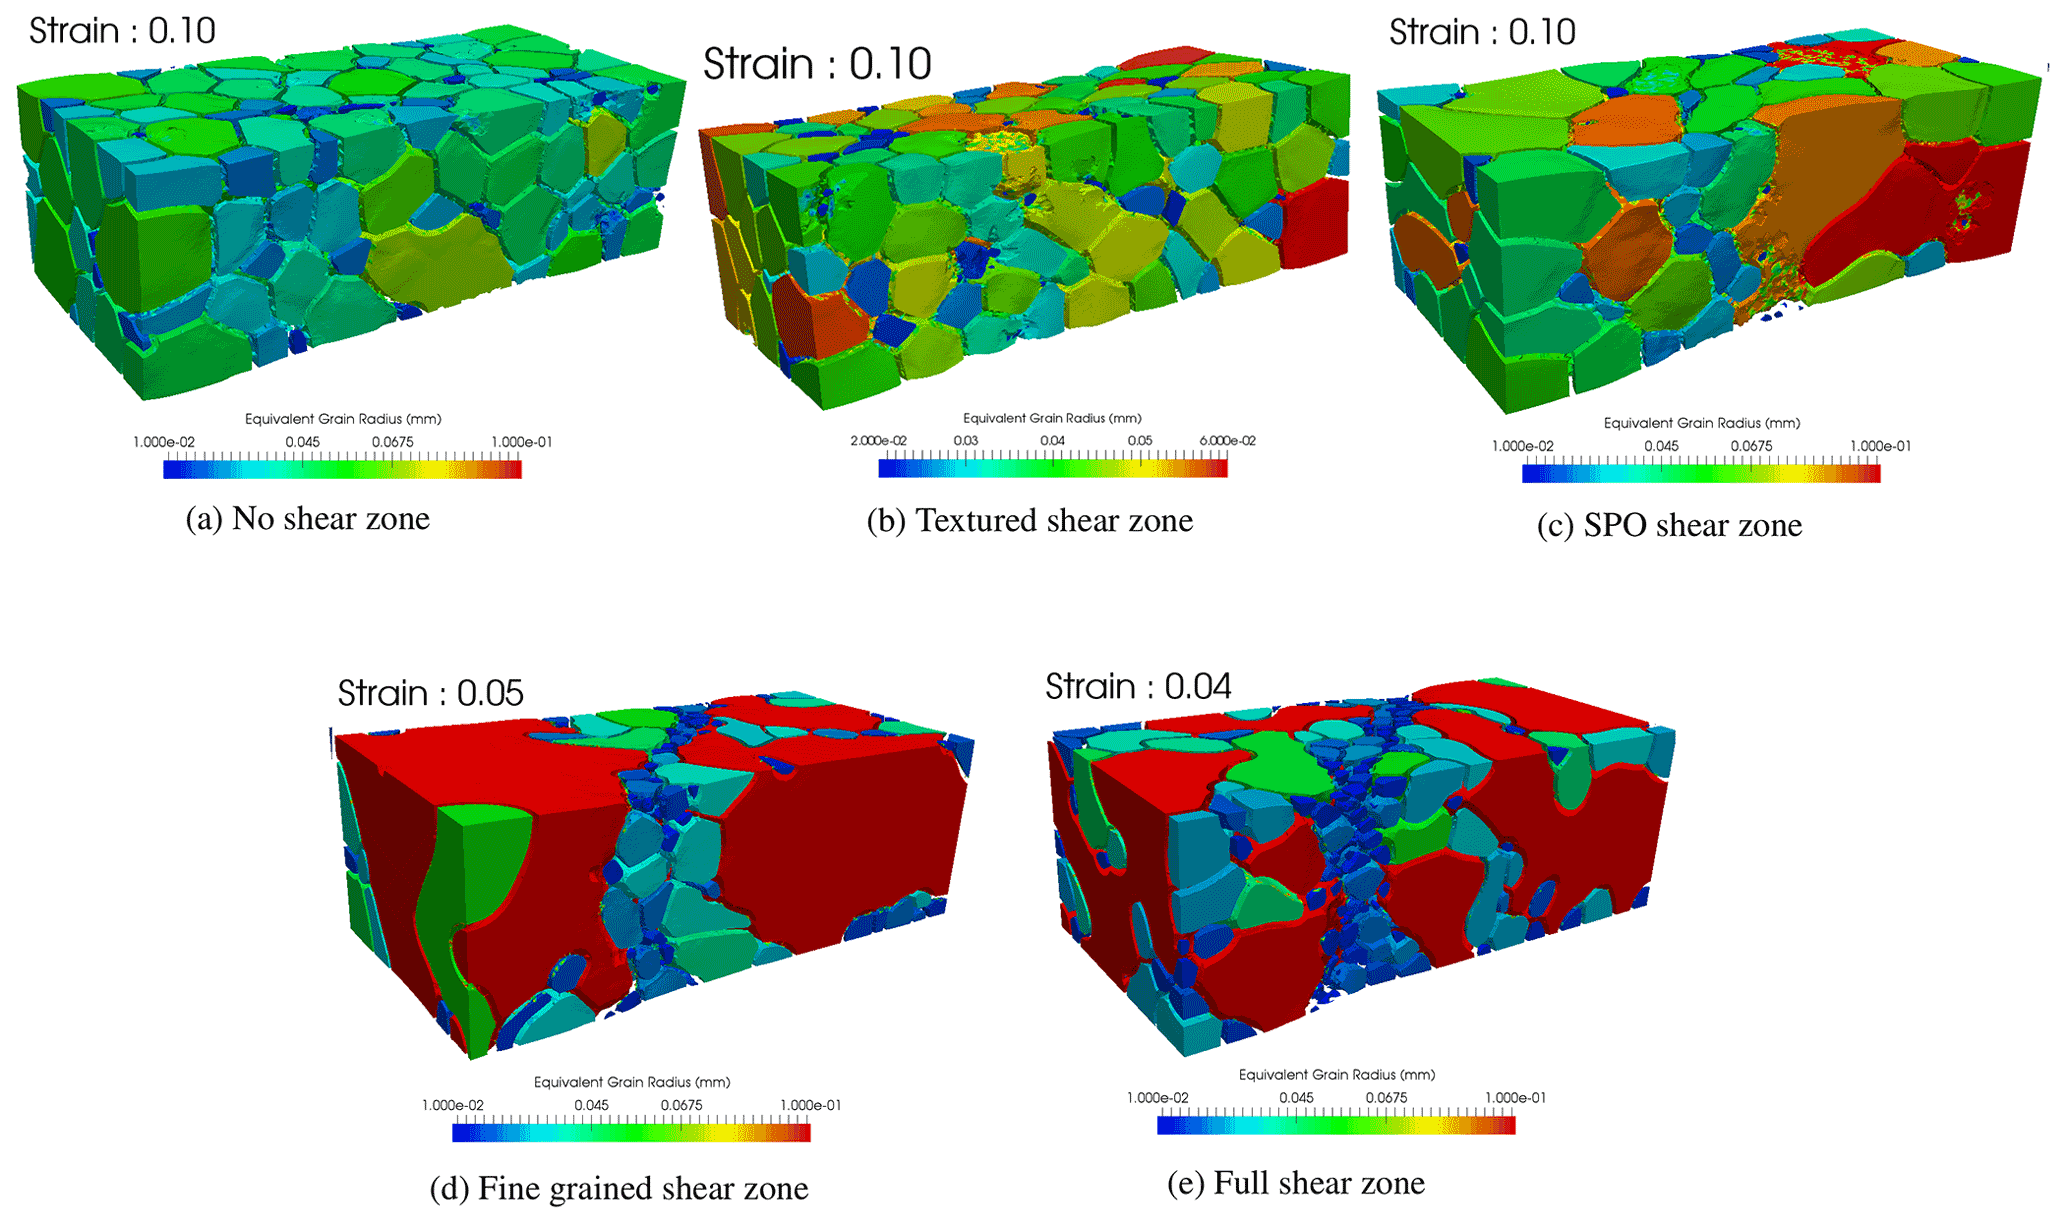
Figure 83D view of the microstructure (colors represent equivalent grain radius) for no pre-existing (a), textured (b), SPO shear zones (c) after 10 % of macroscopic deformation, for small grain size (d) after 5 % of macroscopic deformation and for textured plus small grain size shear zone (e) after 4 % of macroscopic deformation.
Polycrystals also undergo grain growth and/or grain size reduction during the extension test (Fig. 8). For textured and no-shear-zone models, the mean grain size is approximately constant during the deformation (Fig. 8a and b). For small grain size and “full” shear zone models the mean grain size evolutions are similar: large grains of the outer parts are consuming small grains of the inner part (Fig. 8d and e). For the SPO model, the grain sizes within the outer parts are nearly constant while the grain sizes of the inner part, initially elongated, are becoming more equiaxed (Fig. 8c).
In the different full field models presented in this study, the development of a strain-localizing band and its characteristics strongly depend on the nature of the pre-existing weak zone. All models exhibit important strain localization, except the one with no initial weak zone. In this model, the interior of the aggregate deforms more than its outer parts, but the strain is mainly distributed along GB without exhibiting a clear strain localizing band at the sample scale. Although spontaneous development of a weak band could have been expected as a consequence of grain size reduction through DRX, for instance near grain undergoing strong dislocation glide deformation, it has not been observed in our model. This can be due to the high temperature considered in this model allowing an efficient healing through grain growth. Moreover, the low final strain of this traction simulation may also explain the non-formation of a shear band. Finally, it is possible that the shear heating (not considered in this work) plays a crucial role in the shear band formation, even at the microscale.
In the four models with a pre-existing weak zone, a strain localizing band develops during the deformation of the sample. Depending on the nature of the initial weak zone, the mechanical process at stake for strain localization is different. The crystallographic textured shear zone localizes strain through the plastic anisotropy of olivine, due to the lack of slip systems and the heterogeneity of CRSS. This importance of dislocation glide in the textured shear zone is highlighted by several nucleation events occurring within and near the shear zone. However, this process is less efficient than others at low (< 5 %) strains.
The SPO and small grain size shear zone models are expected to localize strain by increasing the total GB volume within the shear zone. The heterogeneity of the relaxation mechanism strength between GB and grain interiors is the main parameter controlling strain localization in these cases. The intensity of strain localization seems to be controlled by the grain boundary density within the shear zone. In fact, the grain boundary volume within the shear zone in the SPO model is lower than in the small grain size model (for which the strain localization is higher). The two parameters permitting strain to be localized (i.e., dislocation glide anisotropy and of the relaxation mechanism strength) seem to have comparable impacts on strain localization, as the magnitude of strain accumulated within the shear zone is similar for the three models (i.e., textured, small grain size and SPO).
The “full” shear zone model, which is characterized by small and well-oriented grains, shows that the two previous mechanical processes can combine, resulting in a much stronger strain localization than when they act separately. This could be expected from our numerical formalism, as the introduction of the relaxation mechanism does not inhibit the contribution of dislocation glide to the deformation. However, the plastic anisotropy due to the lack of slip system is severely reduced by the introduction of this relaxation mechanism, as long as its strength is small (such as within grain boundary). As the strain localization in this model seems to sum up the contributions of both mechanisms we can infer that the plastic anisotropy due to the lack of slip systems is small compared to the one due to the heterogeneity of CRSS.
In all models with an initial weak zone, nucleation events are mainly located inside and near the inner part of the sample. From this observation, one can expect that mean grain size within the shear zone should decrease, and for textured and SPO models it should eventually lead to the formation of a fine grain band. However, for the latter models and for the model without a pre-existing shear zone, the mean grain size remains almost constant during the deformation: some of the newly created nuclei rapidly shrink and disappear, which makes it impossible to define a fine-grained zone. For the two other models, even if nucleation events are also dominantly located inside the shear band, the mean grain size quickly increases as grains within the shear zone undergo rapid grain growth. This can be explained by the high dislocation densities within those grains due to their strong deformation. As a consequence, grains of the outer parts, which are much less deformed (implying a high driving pressure for GBM from difference in stored energy), are consuming the grains of the inner part. Thus, our models cannot predict either the development or the persistence of a fine grain zone (mylonite- or ultramylonite-like). A few reasons can explain this observation.
First, the nuclei shrinking can be linked to a disequilibrium between the driving forces for GBM: indeed, the capillarity force tends to shrink nuclei while difference in stored energy leads to their growth. The shrinking of nuclei is then characteristic of an overly small difference of stored energy. On this point our constitutive model is tainted of uncertainties because the dislocation density levels are strongly related to the Taylor coefficient (see Sect. 2.1.2). In fact, for a same CRSS value, multiple (K1, K2, ψ) triplets are possible but involve different dislocation density levels. For olivine, the value of the Taylor coefficient from the state of the art ranges from 0.5 to 2.8 (Durinck, 2005), which results in very different dislocation density levels. The value chosen for this study could thus be too high and gives overly low dislocation densities, which results in a rapid shrinking of nuclei.
A second possible explanation could be that the thermomechanical conditions used for these models do not permit a fine-grained zone to be developed and/or maintained. In fact, the typical microstructures representative of high temperature deformations do not exhibit fine grain bands, which are much more characteristic of intermediate or low-temperature microstructural features (Braun et al., 1999). The last explanation could be tested using our full field frameworks at lower temperatures. Nevertheless, the material parameters and particularly the nucleation rate Kg is known to be strongly sensitive to temperature. Its dependency with temperature should then be investigated using a set of experimental data before being set up in numerical experiments.
The numerical framework presented here could help to understand physical processes taking place during rock deformation. These processes are tightly linked and we think this work could help us to enhance our understanding of these physical processes and thus may provide relevant predictions for tectonic plate theory. However, even if the model proposes a methodology to explicitly account for the mechanisms involved, several material parameters have to be identified for different thermomechanical conditions.
It is worth mentioning that as with any other model, the proposed framework has to be used carefully out of the calibration bounds. Here, we have presented the application of these frameworks without extrapolating any material parameters by focusing on one thermomechanical condition for which enough data are available. To be extended to more conditions, a large amount of material parameter calibration has to be done. Such a broad range calibration requires a large dataset (which is currently not available in the literature) and would have a high computational cost mainly due to the large amount of 3D full field simulations required that involve recurrent remeshing operations.
In this work, we have presented a full field approach for the modeling of deformation and DRX within olivine aggregates. The mechanical framework, based on a reduced-CP formulation adapted for the specificities of olivine, is able to capture creep regimes controlled by both grain boundaries (e.g., GBS) and grain interiors (dislocation creep). The LS approach coupled with the CP framework permits microstructural evolutions such as GBM and DRX to be modeled.
Using this framework, the interdependence between the microstructural features and the mechanical behavior of olivine aggregates has been highlighted. By studying strain localization at the polycrystal scale on pre-existing shear zones, we have shown that the formation, the intensity and the shape of the developed strain localizing zones are dependent on the nature of the pre-existing shear band. In particular, our models show that the intensity of strain localization triggered by a crystallographic textured or a small grain size shear zones are nearly equivalent while these intensities are added when the shear zone is composed by both textured and small grains. These results underline the importance of taking into account the microstructural characteristics of crystalline aggregates in the rheology of the lithosphere, and not only the mean grain size or LPO, as these two characteristics affect the mechanical behavior with the same intensity and cumulate with each other.
The thermo-mechanical conditions for which the material parameters have been calibrated in this work do not obviously cover either the entire experimental or the natural conditions. This is indeed the next step for this framework to be applied to real situations and provide new insights into strain localization and microstructural evolutions in natural contexts. However, it presents a first step towards the application of this framework to rock mechanics and provide its capability to model the mechanical behavior, the microstructural evolutions and the interdependencies between them in olivine polycrystals. It should be noted that the mechanical response of olivine is complex and the stress vs. strain curves do not provide enough information in order to constrain lower-scale models that aim at modeling its mesoscopic behavior. Better constraints on these parameters could be provided by increasing the amount of available data and microstructural characterization of experimentally deformed rock samples. We deeply believe that such information is extremely valuable and would help the modeling community to better constrain their models.
The data for supporting all figures of the paper are available upon request to the authors. Moreover, the authors are interested in scientific collaboration with readers who would like to use the numerical framework presented here.
JF, CP, CG, MB and DPM designed the project. JF and DPM designed the numerical framework. JF, CP, CG, MB and DPM were part of the discussion and contributed to the writing of the paper.
The authors declare that they have no conflict of interest.
Publisher's note: Copernicus Publications remains neutral with regard to jurisdictional claims in published maps and institutional affiliations.
The authors thank the editor Florian Fusseis and the reviewer Thomas Poulet for their constructive comments. This work was supported by CNRS INSU 2018-programme TelluS-SYSTER. The support of the French Agence Nationale de la Recherche (ANR), ArcelorMittal, FRAMATOME, ASCOMETAL, AUBERT&DUVAL, CEA, and SAFRAN through the DIGIMU Industrial Chair and consortium are gratefully acknowledged.
This research has been supported by CNRS INSU 2018-programme TelluS-SYSTER, the French Agence Nationale de la Recherche (ANR), ArcelorMittal, FRAMATOME, ASCOMETAL, AUBERT&DUVAL, CEA, and SAFRAN through the DIGIMU Industrial Chair and consortium.
This paper was edited by Florian Fusseis and reviewed by Thomas Poulet and one anonymous referee.
Bernacki, M., Logé, R. E., and Coupez, T.: Level set framework for the finite-element modelling of recrystallization and grain growth in polycrystalline materials, Scripta Mater., 64, 525–528, 2011. a
Braun, J., Chéry, J., Poliakov, A., Mainprice, D., Vauchez, A., Tommasi, A., and Daignières, M.: A simple parameterization of strain localization in the ductile regime due to grain size reduction: A case study for olivine, J. Geophys. Res.-Sol. Ea., 104, 25167–25181, 1999. a, b
Castelnau, O., Blackman, D., Lebensohn, R., and Ponte Castañeda, P.: Micromechanical modeling of the viscoplastic behavior of olivine, J. Geophys. Res.-Sol. Ea., 113, B09202, https://doi.org/10.1029/2007JB005444, 2008. a
Castelnau, O., Cordier, P., Lebensohn, R. A., Merkel, S., and Raterron, P.: Microstructures and rheology of the Earth's upper mantle inferred from a multiscale approach, C. R. Phys., 11, 304–315, 2010. a
Chenot, J., Bouchard, P., Fourment, L., Lasne, P., and Roux, E.: Optimization of metal forming processes for improving final mechanical strength, in: COMPLAS XI: proceedings of the XI International Conference on Computational Plasticity: fundamentals and applications, CIMNE, 42–55, 2011. a
Clavijo, S. P., Espath, L., Sarmiento, A., and Calo, V. M.: A continuum theory for mineral solid solutions undergoing chemo-mechanical processes, arXiv [preprint], arXiv:2101.04497, 2021. a
Coble, R.: A model for boundary diffusion controlled creep in polycrystalline materials, J. Appl. Phys., 34, 1679–1682, 1963. a
Detrez, F., Castelnau, O., Cordier, P., Merkel, S., and Raterron, P.: Effective viscoplastic behavior of polycrystalline aggregates lacking four independent slip systems inferred from homogenization methods; application to olivine, J. Mech. Phys. Solids, 83, 199–220, 2015. a
Drury, M. R.: Dynamic recrystallization and strain softening of olivine aggregates in the laboratory and the lithosphere, Geological Society, London, Special Publications, 243, 143–158, 2005. a
Duretz, T., Räss, L., Podladchikov, Y., and Schmalholz, S.: Resolving thermomechanical coupling in two and three dimensions: spontaneous strain localization owing to shear heating, Geophys. J. Int., 216, 365–379, 2019. a
Durinck, J.: Modélisation de la plasticité de la forsterite par calculs à l'échelle atomique et par dynamique des dislocations, PhD thesis, Laboratoire de Structure et Propriété de l’Etat Solide, Lille 1, Villeneuve d'Ascq, France, 2005. a, b, c, d
Durinck, J., Devincre, B., Kubin, L., and Cordier, P.: Modeling the plastic deformation of olivine by dislocation dynamics simulations, Am. Mineral., 92, 1346–1357, 2007. a
Furstoss, J., Bernacki, M., Ganino, C., Petit, C., and Pino-Muñoz, D.: 2D and 3D simulation of grain growth in olivine aggregates using a full field model based on the level set method, Phys. Earth Planet. In., 283, 98–109, 2018. a, b
Furstoss, J., Bernacki, M., Petit, C., Fausty, J., Pino-Muñoz, D., and Ganino, C.: Full field and mean field modeling of grain growth in a multiphase material under dry conditions: application to peridotites, J. Geophys. Res.-Sol. Ea., 125, e53942, https://doi.org/10.1029/2019JB018138, 2020. a
Furstoss, J., Petit, C., Tommasi, A., Ganino, C., Pino-Muñoz, D., and Bernacki, M.: On the role of solute drag in reconciling laboratory and natural constraints on olivine grain growth kinetics, Geophys. J. Int., 224, 1360–1370, 2021a. a, b, c
Furstoss, J., Sarrazola, D. A. R., Bernacki, M., and Muñoz, D. P.: Handling tensors using tensorial Kelvin bases: application to olivine polycrystal deformation modeling using elastically anistropic CPFEM, Comput. Mech., 67, 955–967, 2021b. a
Geers, M., Cottura, M., Appolaire, B., Busso, E. P., Forest, S., and Villani, A.: Coupled glide-climb diffusion-enhanced crystal plasticity, J. Mech. Phys. Solids, 70, 136–153, 2014. a
Gouriet, K., Carrez, P., and Cordier, P.: Ultimate Mechanical Properties of Forsterite, Minerals, 9, 787, https://doi.org/10.3390/min9120787, 2019a. a
Gouriet, K., Cordier, P., Garel, F., Thoraval, C., Demouchy, S., Tommasi, A., and Carrez, P.: Dislocation dynamics modelling of the power-law breakdown in olivine single crystals: Toward a unified creep law for the upper mantle, Earth Planet. Sc. Lett., 506, 282–291, 2019b. a, b
Hansen, L., Zimmerman, M., and Kohlstedt, D. L.: Grain boundary sliding in San Carlos olivine: Flow law parameters and crystallographic-preferred orientation, J. Geophys. Res.-Sol. Ea., 116, B08201, https://doi.org/10.1029/2011JB008220, 2011. a, b
Hansen, L., Zimmerman, M., and Kohlstedt, D.: Laboratory measurements of the viscous anisotropy of olivine aggregates, Nature, 492, 415–418, 2012. a
Heron, P. J., Pysklywec, R. N., and Stephenson, R.: Lasting mantle scars lead to perennial plate tectonics, Nat. Commun., 7, 11834, https://doi.org/10.1038/ncomms11834, 2016. a
Herring, C.: Diffusional viscosity of a polycrystalline solid, J. Appl. Phys., 21, 437–445, 1950. a
Hiraga, T., Miyazaki, T., Tasaka, M., and Yoshida, H.: Mantle superplasticity and its self-made demise, Nature, 468, 1091, https://doi.org/10.1038/nature09685, 2010. a
Hirth, G. and Kohlstedt, D.: Rheology of the upper mantle and the mantle wedge: A view from the experimentalists, Geophysical Monograph-American Geophysical Union, 138, 83–106, 2003. a, b
Hitti, K., Laure, P., Coupez, T., Silva, L., and Bernacki, M.: Precise generation of complex statistical Representative Volume Elements (RVEs) in a finite element context, Comp. Mater. Sci., 61, 224–238, 2012. a
Humphreys, F. J. and Hatherly, M.: Recrystallization and related annealing phenomena, Elsevier, Pergamon Press, New York, 2012. a, b
Ilin, D. N., Bozzolo, N., Toulorge, T., and Bernacki, M.: Full field modeling of recrystallization: Effect of intragranular strain gradients on grain boundary shape and kinetics, Comp. Mater. Sci., 150, 149–161, 2018. a
Isaak, D. G., Anderson, O. L., Goto, T., and Suzuki, I.: Elasticity of single-crystal forsterite measured to 1700 K, J. Geophys. Res.-Sol. Ea., 94, 5895–5906, 1989. a
Jessell, M. W., Siebert, E., Bons, P. D., Evans, L., and Piazolo, S.: A new type of numerical experiment on the spatial and temporal patterns of localization of deformation in a material with a coupling of grain size and rheology, Earth Planet. Sc. Lett., 239, 309–326, 2005. a
Laasraoui, A. and Jonas, J.: Prediction of steel flow stresses at high temperatures and strain rates, Metall. Trans. A, 22, 1545–1558, 1991. a
Mainprice, D., Bachmann, F., Hielscher, R., and Schaeben, H.: Descriptive tools for the analysis of texture projects with large datasets using MTEX: strength, symmetry and components, Geological Society, London, Special Publications, 409, 251–271, 2015. a
Maire, L., Scholtes, B., Moussa, C., Bozzolo, N., Pino-Muñoz, D., Settefrati, A., and Bernacki, M.: Modeling of dynamic and post-dynamic recrystallization by coupling a full field approach to phenomenological laws, Mater. Design, 133, 498–519, 2017. a
Maresca, F., Kouznetsova, V., and Geers, M.: Reduced crystal plasticity for materials with constrained slip activity, Mech. Mater., 92, 198–210, 2016. a, b, c, d, e, f
Marin, E. B.: On the formulation of a crystal plasticity model, Tech. rep., Sandia National Laboratories, USA, 2006. a
Merriman, B., Bence, J. K., and Osher, S. J.: Motion of multiple junctions: A level set approach, J. Comput. Phys., 112, 334–363, 1994. a
Nabarro, F.: Report of a Conference on the Strength of Solids, The Physical Society, London, 75, 1948. a
Phakey, P., Dollinger, G., and Christie, J.: Transmission electron microscopy of experimentally deformed olivine crystals, Flow and fracture of rocks, 16, 117–138, 1972. a, b, c, d, e
Poirier, J. and Nicolas, A.: Deformation-induced recrystallization due to progressive misorientation of subgrains, with special reference to mantle peridotites, J. Geol., 83, 707–720, 1975. a
Précigout, J. and Gueydan, F.: Mantle weakening and strain localization: Implications for the long-term strength of the continental lithosphere, Geology, 37, 147–150, 2009. a
Samae, V., Cordier, P., Demouchy, S., Bollinger, C., Gasc, J., Koizumi, S., Mussi, A., Schryvers, D., and Idrissi, H.: Stress-induced amorphization triggers deformation in the lithospheric mantle, Nature, 591, 82–86, 2021. a
Sarrazola Ruiz, D. A., Maire, L., Moussa, C., Bozzolo, N., Muñoz, D. P., and Bernacki, M.: Full field modeling of dynamic recrystallization in a CPFEM context–Application to 304L steel, Comp. Mater. Sci., 184, 109892, https://doi.org/10.1016/j.commatsci.2020.109892, 2020. a
Scholtes, B., Shakoor, M., Settefrati, A., Bouchard, P. O., Bozzolo, N., and Bernacki, M.: New finite element developments for the full field modeling of microstructural evolutions using the level-set method, Comp. Mater. Sci., 109, 388–398, 2015. a, b
Scholtes, B., Boulais-Sinou, R., Settefrati, A., Pino-Muñoz, D., Poitrault, I., Montouchet, A., Bozzolo, N., and Bernacki, M.: 3D level set modeling of static recrystallization considering stored energy fields, Comp. Mater. Sci., 122, 57–71, 2016. a, b
Shakoor, M., Scholtes, B., Bouchard, P., and Bernacki, M.: An efficient and parallel level set reinitialization method–Application to micromechanics and microstructural evolutions, Appl. Math. Model., 39, 7291–7302, 2015. a
Skemer, P., Sundberg, M., Hirth, G., and Cooper, R.: Torsion experiments on coarse-grained dunite: implications for microstructural evolution when diffusion creep is suppressed, Geological Society, London, Special Publications, 360, 211–223, 2011. a, b, c
Tajčmanová, L., Podladchikov, Y., Powell, R., Moulas, E., Vrijmoed, J., and Connolly, J.: Grain-scale pressure variations and chemical equilibrium in high-grade metamorphic rocks, J. Metamorph. Geol., 32, 195–207, 2014. a
Taylor, G. I.: The mechanism of plastic deformation of crystals. Part I.–Theoretical, P. R. Soc. Lond. A-Conta., 145, 362–387, 1934. a
Tommasi, A., Knoll, M., Vauchez, A., Signorelli, J. W., Thoraval, C., and Logé, R.: Structural reactivation in plate tectonics controlled by olivine crystal anisotropy, Nat. Geosci., 2, 423–427, https://doi.org/10.1038/ngeo528, 2009. a, b, c, d
Van der Wal, D., Chopra, P., Drury, M., and Gerald, J. F.: Relationships between dynamically recrystallized grain size and deformation conditions in experimentally deformed olivine rocks, Geophys. Res. Lett., 20, 1479–1482, 1993. a
Wang, Z., Zhao, Y., and Kohlstedt, D. L.: Dislocation creep accommodated by grain boundary sliding in dunite, J. Earth Sci., 21, 541–554, 2010. a
Watremez, L., Burov, E., d'Acremont, E., Leroy, S., Huet, B., Le Pourhiet, L., and Bellahsen, N.: Buoyancy and localizing properties of continental mantle lithosphere: Insights from thermomechanical models of the eastern Gulf of Aden, Geochem., Geophy. Geosy., 14, 2800–2817, 2013. a
Wheeler, J.: Anisotropic rheology during grain boundary diffusion creep and its relation to grain rotation, grain boundary sliding and superplasticity, Philos. Mag., 90, 2841–2864, 2010. a, b
Zhang, S., Karato, S., Gerald, J., Faul, U. H., and Zhou, Y.: Simple shear deformation of olivine aggregates, Tectonophysics, 316, 133–152, 2000. a, b
- Abstract
- Introduction
- Full field modeling of olivine deformation and microstructural evolutions
- Material parameters and creep regime
- Results
- Discussion
- Conclusions
- Code and data availability
- Author contributions
- Competing interests
- Disclaimer
- Acknowledgements
- Financial support
- Review statement
- References