the Creative Commons Attribution 4.0 License.
the Creative Commons Attribution 4.0 License.
 | 15 Apr 2021
Analytical solution for residual stress and strain preserved in anisotropic inclusion entrapped in an isotropic host
Xin Zhong
Marcin Dabrowski
Bjørn Jamtveit
Raman elastic thermobarometry has recently been applied in many petrological studies to recover the pressure and temperature (P–T) conditions of mineral inclusion entrapment. Existing modelling methods in petrology either adopt an assumption of a spherical, isotropic inclusion embedded in an isotropic, infinite host or use numerical techniques such as the finite-element method to simulate the residual stress and strain state preserved in the non-spherical anisotropic inclusions. Here, we use the Eshelby solution to develop an analytical framework for calculating the residual stress and strain state of an elastically anisotropic, ellipsoidal inclusion in an infinite, isotropic host. The analytical solution is applicable to any class of inclusion symmetry and an arbitrary inclusion aspect ratio. Explicit expressions are derived for some symmetry classes, including tetragonal, hexagonal, and trigonal.
The effect of changing the aspect ratio on residual stress is investigated, including quartz, zircon, rutile, apatite, and diamond inclusions in garnet host. Quartz is demonstrated to be the least affected, while rutile is the most affected. For prolate quartz inclusion (c axis longer than a axis), the effect of varying the aspect ratio on Raman shift is demonstrated to be insignificant. When , only ca. 0.3 cm−1 wavenumber variation is induced as compared to the spherical inclusion shape. For oblate quartz inclusions, the effect is more significant, when , ca. 0.8 cm−1 wavenumber variation for the 464 cm−1 band is induced compared to the reference spherical inclusion case. We also show that it is possible to fit an effective ellipsoid to obtain a proxy for the averaged residual stress or strain within a faceted inclusion. The difference between the volumetrically averaged stress of a faceted inclusion and the analytically calculated stress from the best-fitted effective ellipsoid is calculated to obtain the root-mean-square deviation (RMSD) for quartz, zircon, rutile, apatite, and diamond inclusions in garnet host. Based on the results of 500 randomly generated (a wide range of aspect ratio and random crystallographic orientation) faceted inclusions, we show that the volumetrically averaged stress serves as an excellent stress measure and the associated RMSD is less than 2 %, except for diamond, which has a systematically higher RMSD (ca. 8 %). This expands the applicability of the analytical solution for any arbitrary inclusion shape in practical Raman measurements.
- Article
(3296 KB) - Full-text XML
-
Supplement
(10061 KB) - BibTeX
- EndNote


Raman elastic thermobarometry has been extensively used to recover the pressure and temperature (P–T) conditions of mineral inclusion entrapment, e.g. the mostly studied quartz-in-garnet inclusion–host pair (Ashley et al., 2014; Bayet et al., 2018; Enami et al., 2007; Gonzalez et al., 2019; Kouketsu et al., 2014; Taguchi et al., 2016, 2019; Zhong et al., 2019). Recently, quartz-in-garnet elastic barometry has been calibrated with experiments by synthesizing almandine garnets and quartz inclusions at high P–T conditions and comparing the entrapment pressure recovered based on the residual pressure measured in quartz with the pressure applied in experiments (Bonazzi et al., 2019; Thomas and Spear, 2018). In practice, most mineral inclusions, e.g. quartz, zircon, and rutile, are elastically anisotropic, and the associated effect needs to be addressed to better constrain the entrapment P–T conditions. Existing mechanical models for elastic thermobarometry typically treat the case of a spherical isotropic inclusion entrapped in an infinite, isotropic host (e.g. Angel et al., 2017; Gillet et al., 1984; Guiraud and Powell, 2006; Rosenfeld and Chase, 1961; Zhang, 1998). In recent studies, finite-element (FE) simulations were applied to study anisotropic inclusions entrapped in cubic hosts such as garnet (Alvaro et al., 2020; Mazzucchelli et al., 2019). In this approach, the residual strain preserved within a mineral inclusion is related to the stress and strain state of the system upon entrapment via a relaxation tensor (R) that needs to be pre-calculated using the FE method or other numerical techniques (Mazzucchelli et al., 2019).
For an ellipsoidal, elastically anisotropic inclusion entrapped in an infinite isotropic host, an exact closed-form analytical solution has been available for a long time (Eshelby, 1957; Mura, 1987). This solution has been widely applied in Earth science for many problems, such as viscous creep around inclusions (Freeman, 1987; Jiang, 2016), flanking structures (Exner and Dabrowski, 2010); elastic stress of inclusions at various scales (Meng and Pollard, 2014), microcracking and faulting (Healy et al., 2006), and magma-chamber-induced deformations (Bonaccorso and Davis, 1999). The advantage of such an approach is that no numerical software or programming is required and the solution can be obtained rapidly and precisely, with no numerical approximation error. The rapid calculation also permits in-depth, systematic stress and strain analysis of the inclusion–host system or a potential Monte Carlo simulation for uncertainty propagation. The procedure of calculating the residual stress in an ellipsoidal anisotropic inclusion embedded in an elastic, isotropic host is based on the equivalent eigenstrain method and the classical Eshelby solution (Eshelby, 1957; Mura, 1987). Recently, the Eshelby solution has been applied to exhumed mineral inclusions entrapped in a host and the result has been compared to the finite-element method (Morganti et al., 2020). Mineral inclusions were measured for their crystallographic orientation and shape via X-ray diffraction and tomography (Morganti et al., 2020), but the significance of the aspect ratio, shape, and crystallographic orientation has not been studied in a systematic way. More importantly, the Eshelby solution only applies to perfectly ellipsoidal inclusions, but natural mineral inclusions are faceted. Therefore, the uncertainty in and limitations of using the Eshelby solution for natural faceted inclusions remain to be investigated. In this study, we explore the Eshelby solution in-depth relating to the inclusion–host problem. A general analytical form is first presented in this paper (the previous submission record is given in the Acknowledgements) following the Eshelby equivalent eigenstrain method (Mura, 1987, chap. 4) to calculate residual stress and strain of an anisotropic inclusion in an isotropic host. For inclusions belonging to certain crystallographic symmetry, such as tetragonal, hexagonal, and trigonal classes, simplified explicit expressions describing residual stress and strain are derived. The analytical formulas are cross-validated against the numerical results obtained using a self-developed finite-element code. Convergence tests are successfully performed to show the correspondence of the numerical (FE) and analytical solutions. In-depth analysis of the effects due to (1) inclusion elastic anisotropy, (2) inclusion aspect ratio, and (3) relative orientation between the inclusion crystallographic and geometrical principal axes are performed to show how they affect the application of elastic thermobarometry. The MATLAB code has also been made available alongside the submission.
One major problem of using the Eshelby solution for mineral inclusion is that natural inclusions are faceted in shape, which leads to a heterogeneous residual stress field (e.g. Chiu, 1978; Mazzucchelli et al., 2018). To resolve this issue, we use our self-developed 3D finite-element code to simulate the residual stress distribution within faceted inclusions of varying shapes. Fitting an arbitrary 3D shape with effective ellipsoid is a common practice in image analysis and microstructural research (e.g. Ghosh and Dimiduk, 2011). We explore the possibility of using an effective ellipsoid to approximate the shape of a faceted inclusion. The residual stress obtained from the analytical solution based on the best-fitted effective ellipsoid is used as a proxy to represent the volumetrically averaged stress within the faceted inclusion. By inspecting the numerical (FE) and analytical solutions, we have found that for most mineral inclusions, e.g. quartz, zircon, apatite, and rutile, the volumetrically averaged stress represents the stress state of arbitrarily faceted inclusions very well. This may potentially provide a useful guide for future applications of elastic thermobarometry for any natural faceted mineral inclusions.
2.1 Anisotropic inclusion embedded in isotropic host
We consider an anisotropic, ellipsoidal solid inclusion entrapped in an isotropic, infinite host at high P–T conditions. For a fully entrapped spherical inclusion, the assumption of an infinite host is justified when the distance between the inclusion and host grain outer boundaries, such as the thin-section surface, is more than 3 times the inclusion radius (Mazzucchelli et al., 2018; Zhong et al., 2018). The principal axes of the inclusion are aligned along the Cartesian coordinates x, y, and z, and their lengths are arbitrary. Upon entrapment at depth, the inclusion and host are considered subject to the same stress field. The entrapment stress may be either hydrostatic or non-hydrostatic but it is treated as homogeneous during the inclusion growth within the host grain or the overgrowth of the inclusion by the host grain. At this stage, the lattice strains of the inclusion and host are denoted by and , which are measured with respect to the reference room conditions. The Voigt notation is applied here (Voigt, 1910). The entrapment lattice strains and incorporate both pressure (compressibility) and temperature (thermal expansivity) effects. They can be obtained by relating the lattice parameters measured at high P–T conditions to their reference values under room P–T conditions. For inclusions of cubic, tetragonal, and orthorhombic symmetry classes, the three crystallographic axes a, b, and c are mutually perpendicular to each other, so that the lattice strain can be readily expressed as follows:
where a0 is the reference lattice parameter measured at room conditions and a is the lattice parameter measured at entrapment conditions. Note that for hexagonal and trigonal minerals (e.g. quartz) Eq. (1) still holds if the symmetry of lattice parameters is maintained at entrapment conditions (e.g. for quartz we keep a=b, , ). For lower-symmetry systems with non-orthogonal crystallographic axes (triclinic and monoclinic systems), it is not possible to align all the crystallographic axes parallel to the Cartesian coordinates, and the angles of α, β, and γ may also change under entrapment conditions compared to reference room conditions. Therefore, transformation is needed to convert strains from the crystallographic axes in a unit cell to the Cartesian coordinate system for modelling the mechanical interaction between the inclusion and host. This can be done by using existing software, such as PASCal (Cliffe and Goodwin, 2012), Win_Strain (http://www.rossangel.com/home.htm, last access: 8 April 2021), and STRAIN (Ohashi and Burnham, 1973). Our self-written MATLAB code is provided in Appendix A–C, created following Ohashi's method (Ohashi and Burnham, 1973) for calculating the lattice strain based on the changes of lattice parameters. The results are the same with the three tested software. For the case of an isotropic host under hydrostatic entrapment stress, the initial (entrapment) strain is expected to be isotropic and the principal strain components are simply a third of the volumetric strain, which can be directly obtained from the P–T relationship.
To simulate the exhumation of the inclusion–host system to room P–T conditions, we first unload the system by applying the strain opposite to the initial host strain state, i.e. (Fig. 1b), a procedure which leads to a stress- and strain-free host at room conditions. This is an intermediate step that ignores elastic interaction between the inclusion and host, and the inclusion will possess a virtual strain, , as the internal inclusion–host boundary experiences the unloading strain, . At this moment, the stress state of the inclusion can be readily expressed using the linear-elastic constitutive law as follows: ), where is the elastic stiffness tensor of the inclusion at room T. Einstein summation is used. It is straightforward to find that mechanical equilibrium is not satisfied at this intermediate step because, in general, there is a stress jump between the stressed inclusion and the stress-free host. Using the proposed approach, solving the original mechanical problem is reduced to superposing the homogeneous unloading strain field with a non-uniform solution for an initially stressed and strained inclusion embedded in a stress- and strain-free host at room T. The latter is practically an eigenstrain problem (Eshelby, 1957). The thermal effects on the elastic stiffness tensor have no influence on the superposed deformation field driven by the eigenstrain load due to the mismatch between the lattice strains of the inclusion and the host. The stress and strain of the inclusion that serve as driving force for elastic interaction are as follows:
where is referred to as an inclusion eigenstrain and is eigenstress (Mura, 1987). The eigenstresses correspond to the stress that a soft inclusion would experience if it was perfectly confined by a stiff host, i.e. when the host was not allowed to deform elastically. The eigenstrain and eigenstress are the functions of the lattice strain of inclusion and host at entrapment conditions (taking room conditions as reference state) and the stiffness tensor of the inclusion at room P–T conditions.
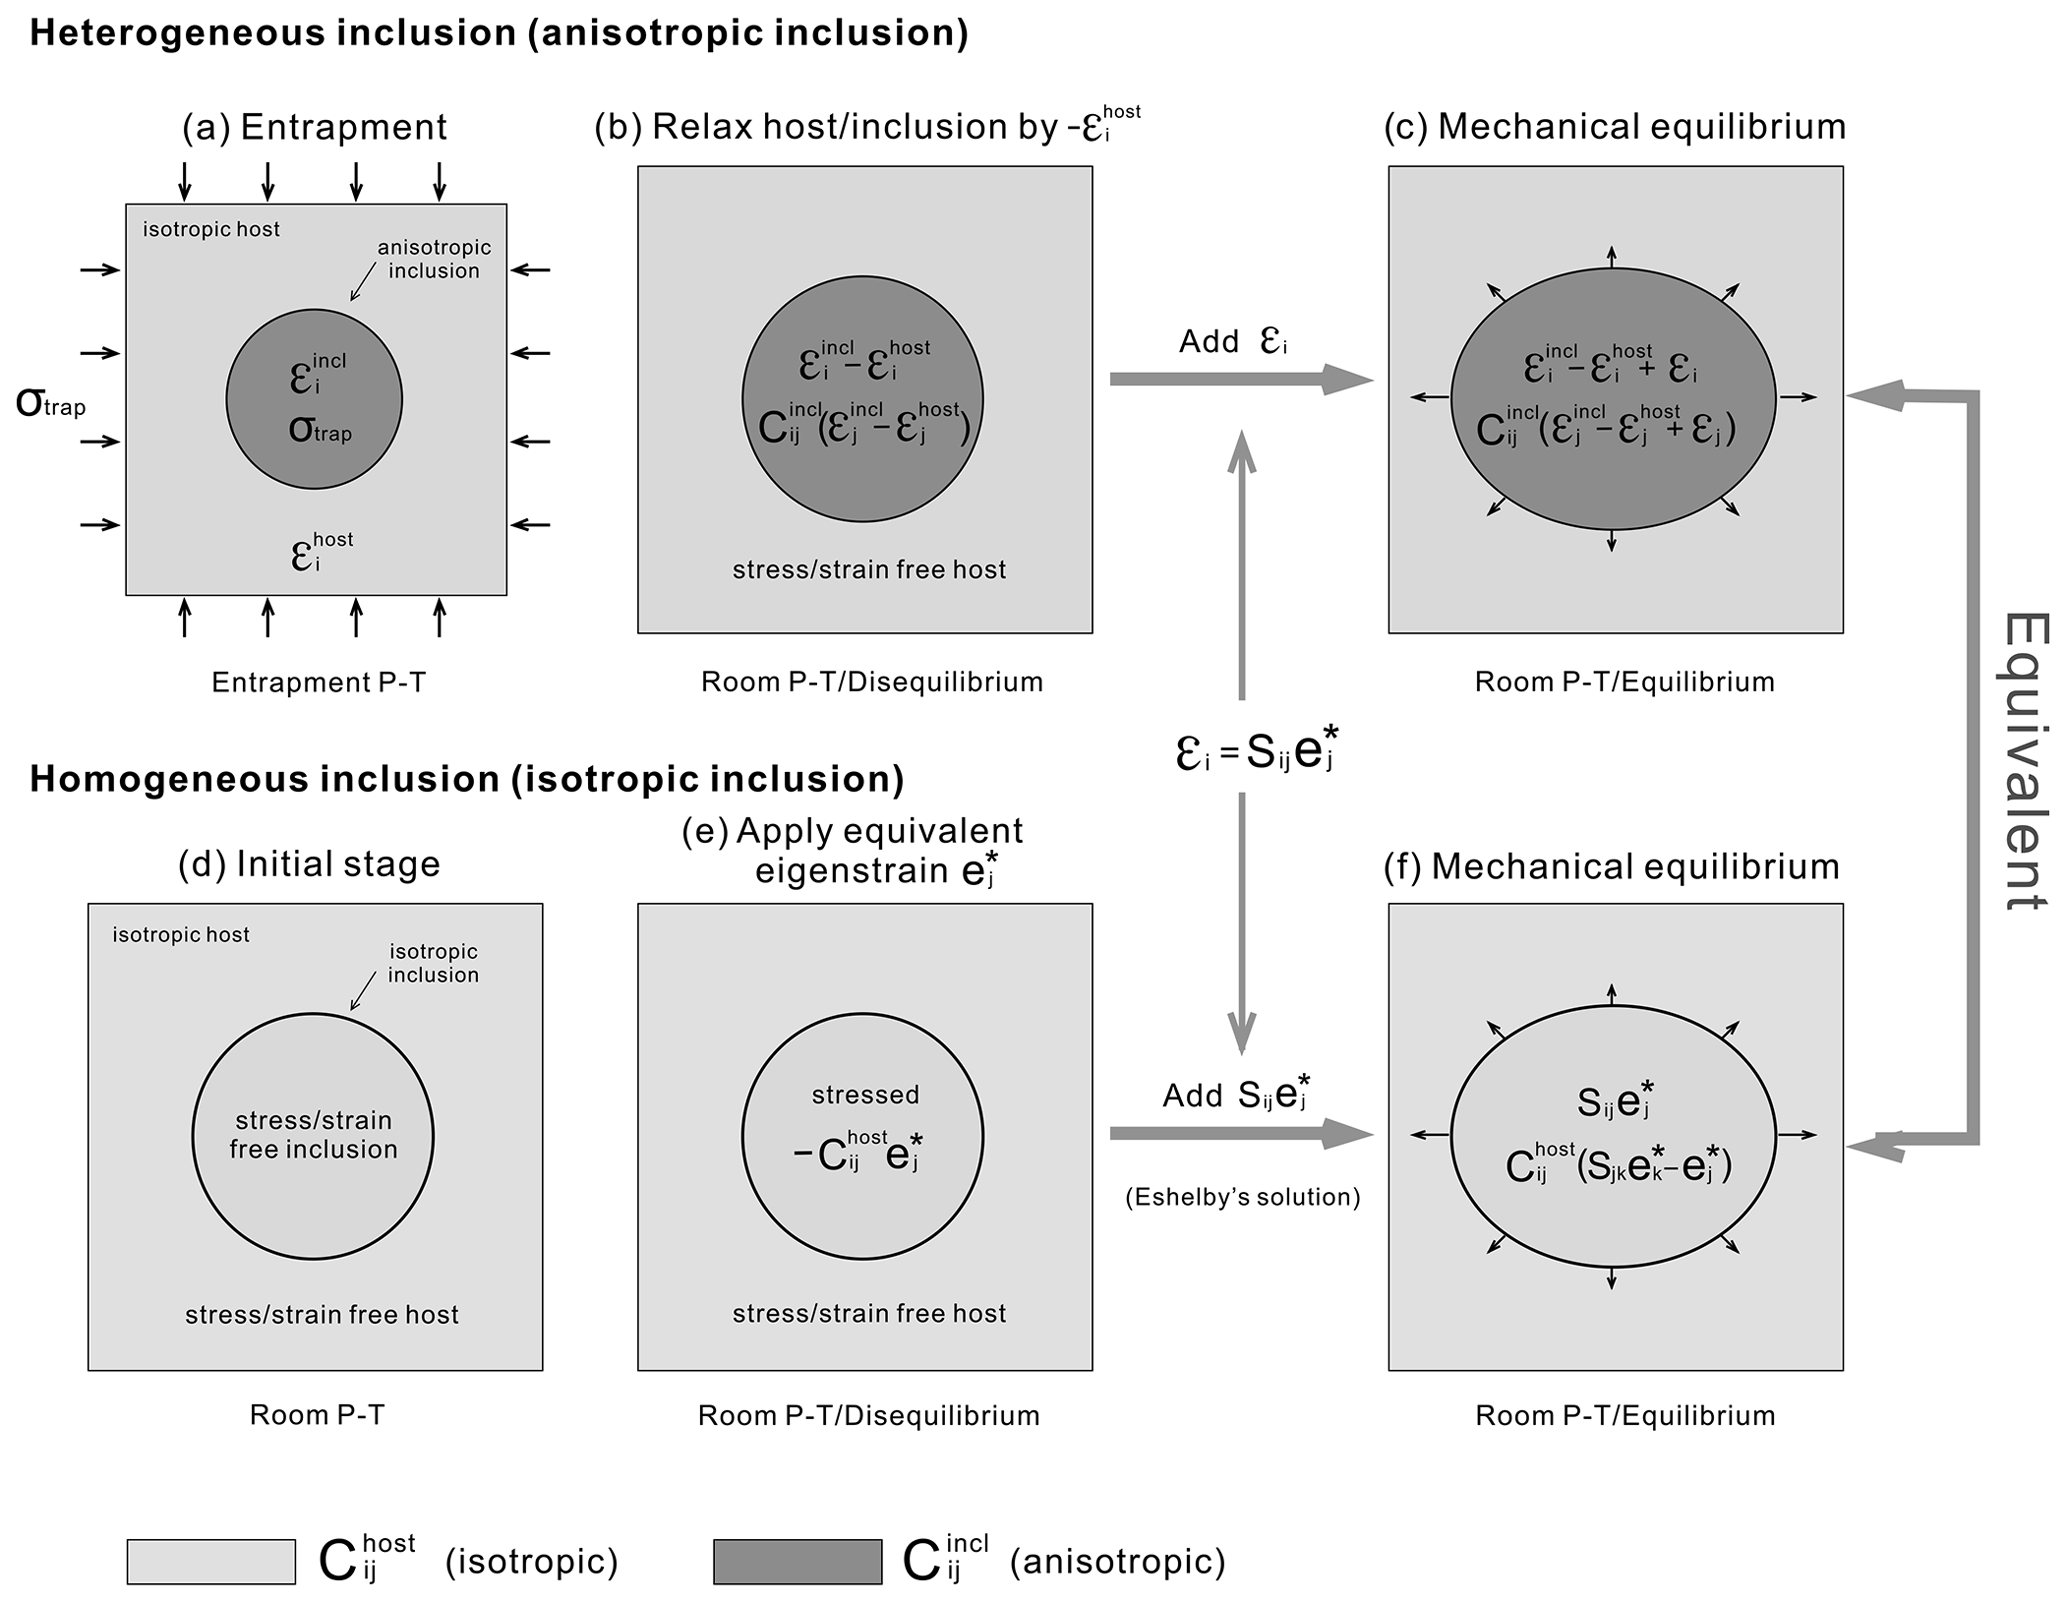
Figure 1Schematic diagram showing how to obtain the residual stress and strain of anisotropic inclusion in isotropic host. (a) Inclusion–host at entrapment conditions. The stress is homogeneous, σtrap, but strains are different, and . (b) First, relax the inclusion and host by to room P–T conditions. Without elastic interaction, the inclusion has strain and stress , and thus the system is not in mechanical equilibrium. (c) Elastic interaction occurs to reach equilibrium by adding strain εi to the inclusion (host also deforms). The residual inclusion stress is ). (d) Equivalent scenario where the inclusion and host are initially stress-free at room P–T and they both have isotropic elasticity of . (e) Equivalent eigenstrains are loaded to the inclusion. Without elastic interaction, the inclusion has stress . Eshelby's method is applied to obtain the final strain state in isotropic inclusion, , and stress, , where Sij is the Eshelby tensor (Eshelby, 1957). The equivalent eigenstrain method states that by properly choosing , the relation can be satisfied (Mura, 1987, chap. 4). The stress of isotropic inclusion (f), , equals the stress of the anisotropic inclusion (c), (see Eq. 7). By solving for , we obtain the residual stress and strain of anisotropic inclusion in isotropic host in Eq. (8).
Because mechanical equilibrium is not satisfied for the stressed inclusion embedded in a stress-free host, elastic deformation will occur (stage shown in Fig. 1b–c). The amount of elastic deformation that affects the inclusion with a pre-strain in a stress-free host to reach mechanical equilibrium is denoted as εi. The strain εi is shown in Fig. 1b–c, and the state with strain is taken as the reference state for this elastic deformation field. By adding the strain εi to the inclusion, we obtain the final residual stress and strain state as follows:
where and are the final residual strains and stresses of the inclusion, which are the true physical stress and strain the inclusion experiences. This final stage is shown in Fig. 1c. Finding the strain εi will solve the anisotropic inclusion problem. This will be sought in the next section using the equivalent eigenstrain method and Eshelby's solution.
2.2 Solving the problem with Eshelby's solution
Eshelby's solution treats a homogeneous, ellipsoidal, isotropic inclusion embedded in an infinite isotropic host (Eshelby, 1957). Following Eshelby (1957), we replace the inclusion–host system with an isotropic homogeneous space with an elastic tensor and load the ellipsoidal inclusion region with an equivalent eigenstrain (to differentiate from the previously introduced eigenstrain term due to lattice strain mismatch). Without elastic interaction, the inclusion would experience a stress under perfect confinement (e.g. a positive eigenstrain (expansion) leads to compressive stress, which is negative). After elastic interaction, the inclusion strain and stress under mechanical equilibrium due to a constant eigenstrain (eigenstress) load applied to an ellipsoidal region of otherwise homogeneous elastic space can be expressed as follows (Eshelby, 1957; Mura, 1987):
where Sij is the Eshelby tensor, which gives the one-to-one mapping between the equivalent eigenstrain () and a homogeneous residual strain () within the inclusion region. Eshelby's solution is manifested in this tensor, which is only a function of the inclusion shape and the Poisson ratio (ν) of the isotropic host. For a spherical inclusion, Sij is symmetric and can be significantly simplified as follows:
All the other components are zero. For general ellipsoidal inclusions, the Sij tensor is given in Appendix A–C and a MATLAB script for calculating the Sij tensor is provided in the Supplement (see Appendix A–C for more details about using the script).
Following the equivalent eigenstrain method (Mura, 1987, chap. 4), one may appropriately choose the equivalent eigenstrain to let in Eq. (4) equal the strain εi in Eq. (3) that drives the pre-strained anisotropic inclusion into mechanical equilibrium with stress-free isotropic host; i.e. we have
By doing so, the stresses in the original anisotropic heterogeneity and the equivalent isotropic inclusion will be equal. This is because the host is stressed (and strained) by the same amount following Eq. (6), which leads to the same inclusion stress because the traction is matched between inclusion and host. By replacing the strain into in Eq. (3) and equating the stresses in Eq. (3) with Eq. (4), we obtain the following relation:
The equivalent eigenstrain can be solved from this equation. By substituting the obtained back into Eq. (7), we may concisely express the final result for the residual strain and stress of the anisotropic inclusion embedded in isotropic, infinite host:
where Iij is the identity matrix. The dimensionless matrix Mkj can be expressed as follows:
The dimensionless matrix Mij depends on the elastic stiffness properties of the inclusion and the host as well as the aspect ratio of the inclusion manifested by the Eshelby tensor. The components of this matrix are close to zero for a stiff host or a soft inclusion (no elastic relaxation; thus, ), and it approaches the identity matrix for an infinitely soft host (in this case, ). An extreme case is represented by a gas or liquid inclusion whose is low compared to the host stiffness; thus, this dimensionless matrix Mij approaches zero and the isochoric assumption for the gas or liquid inclusion is justified. The Mij matrix can be readily calculated by using the published elastic stiffness tensor at room P–T conditions (e.g. Bass, 1995). A MATLAB script is given in the Supplement to perform this task (details for using the code can be found in Appendix A–C)
2.3 Back-calculating eigenstrain terms based on residual inclusion strain
The wavenumber shifts of Raman peaks are induced by lattice strain. By measuring wavenumber shift of the inclusion in a thin section, it is possible to recover the residual strain preserved within the inclusion (Angel et al., 2019; Murri et al., 2018). This can be done by using the Grüneisen tensor. Therefore, can be obtained with, e.g. the least-squares fitting method (Murri et al., 2018) and the residual stress can be readily expressed as .
By inverting the right-hand matrix in Eq. (8), the eigenstrain terms can be expressed as a function of residual strain :
For tetragonal or hexagonal minerals, e.g. zircon, rutile, and apatite, the stiffness tensor comprises six independent components: , , , , , and . For trigonal symmetry, such as in the case of α-quartz, another independent component is also present. For all these mineral inclusions and for axially symmetric residual strains, can be significantly simplified as follows ():
where is the dimensionless inclusion stiffness tensor scaled by the host shear modulus. Interestingly, for trigonal α-quartz inclusions (), the stiffness tensor component is not present in the expression given by Eq. (11). In fact, the terms in the brackets are simply the residual stress components:
By substituting the stiffness tensor components and the measured residual strains, the eigenstrains can be directly calculated. The equation above thus allows for the estimation of the entrapment (hydrostatic or non-hydrostatic) stress (or strain) conditions by knowing the residual stress and strain conditions of the inclusion.
We have validated our implementation of the proposed analytical framework against independent finite-element (FE) solutions. A self-written 3D FE code is used to validate the presented analytical solution (Dabrowski et al., 2008; Zhong et al., 2018). For validation purposes, we used spheroidal quartz inclusions in an almandine garnet host. Adaptive tetrahedral computational meshes, with the highest resolution within and around the inclusion, are generated with Tetgen software (Si, 2015). The anisotropic elastic properties of quartz inclusion at room T are based on Heyliger et al. (2003). The host garnet elasticity is first treated as isotropic based on Jiang et al. (2004). The model length is set as 10 times (denoted as ×10 below) the inclusion's diameter (for the spheroidal inclusion case, the model domain is a box where the side lengths are proportional to the corresponding axis lengths of the inclusion). For the model validation, we adjust the eigenstrain term to generate precisely 1 GPa compressive residual stress for the spherical inclusion in the infinite garnet host. This is done by letting GPa hydrostatically and substituting into Eq. (8) to back-calculate the eigenstrain . Following this, the spheroidal inclusion is loaded by the calculated eigenstrain in the FE code, and the residual stress is compared to results obtained by the presented analytical solution. The choice of eigenstrains (either loading the inclusion to 1 GPa pressure or any other residual stress value) is not influential for validation purposes, as long as both the analytical and FE methods take the same eigenstrains. This and other successful and more general tests with arbitrary aspect ratios and eigenstrains have been performed but are not reported here.
In Fig. 2a, the numerically and analytically obtained residual stresses are plotted together as a function of the aspect ratio of the tested spheroidal inclusions. In Fig. 2b, the difference is plotted as a function of element count and boundary distance (×5, ×10, and ×20). It is clearly shown that the two sets of solutions converge with increasing the number of mesh elements and the computational box size. The success of this convergence test validates the correctness of our presented analytical model (also FE code) for an anisotropic ellipsoidal inclusion entrapped in an isotropic space.
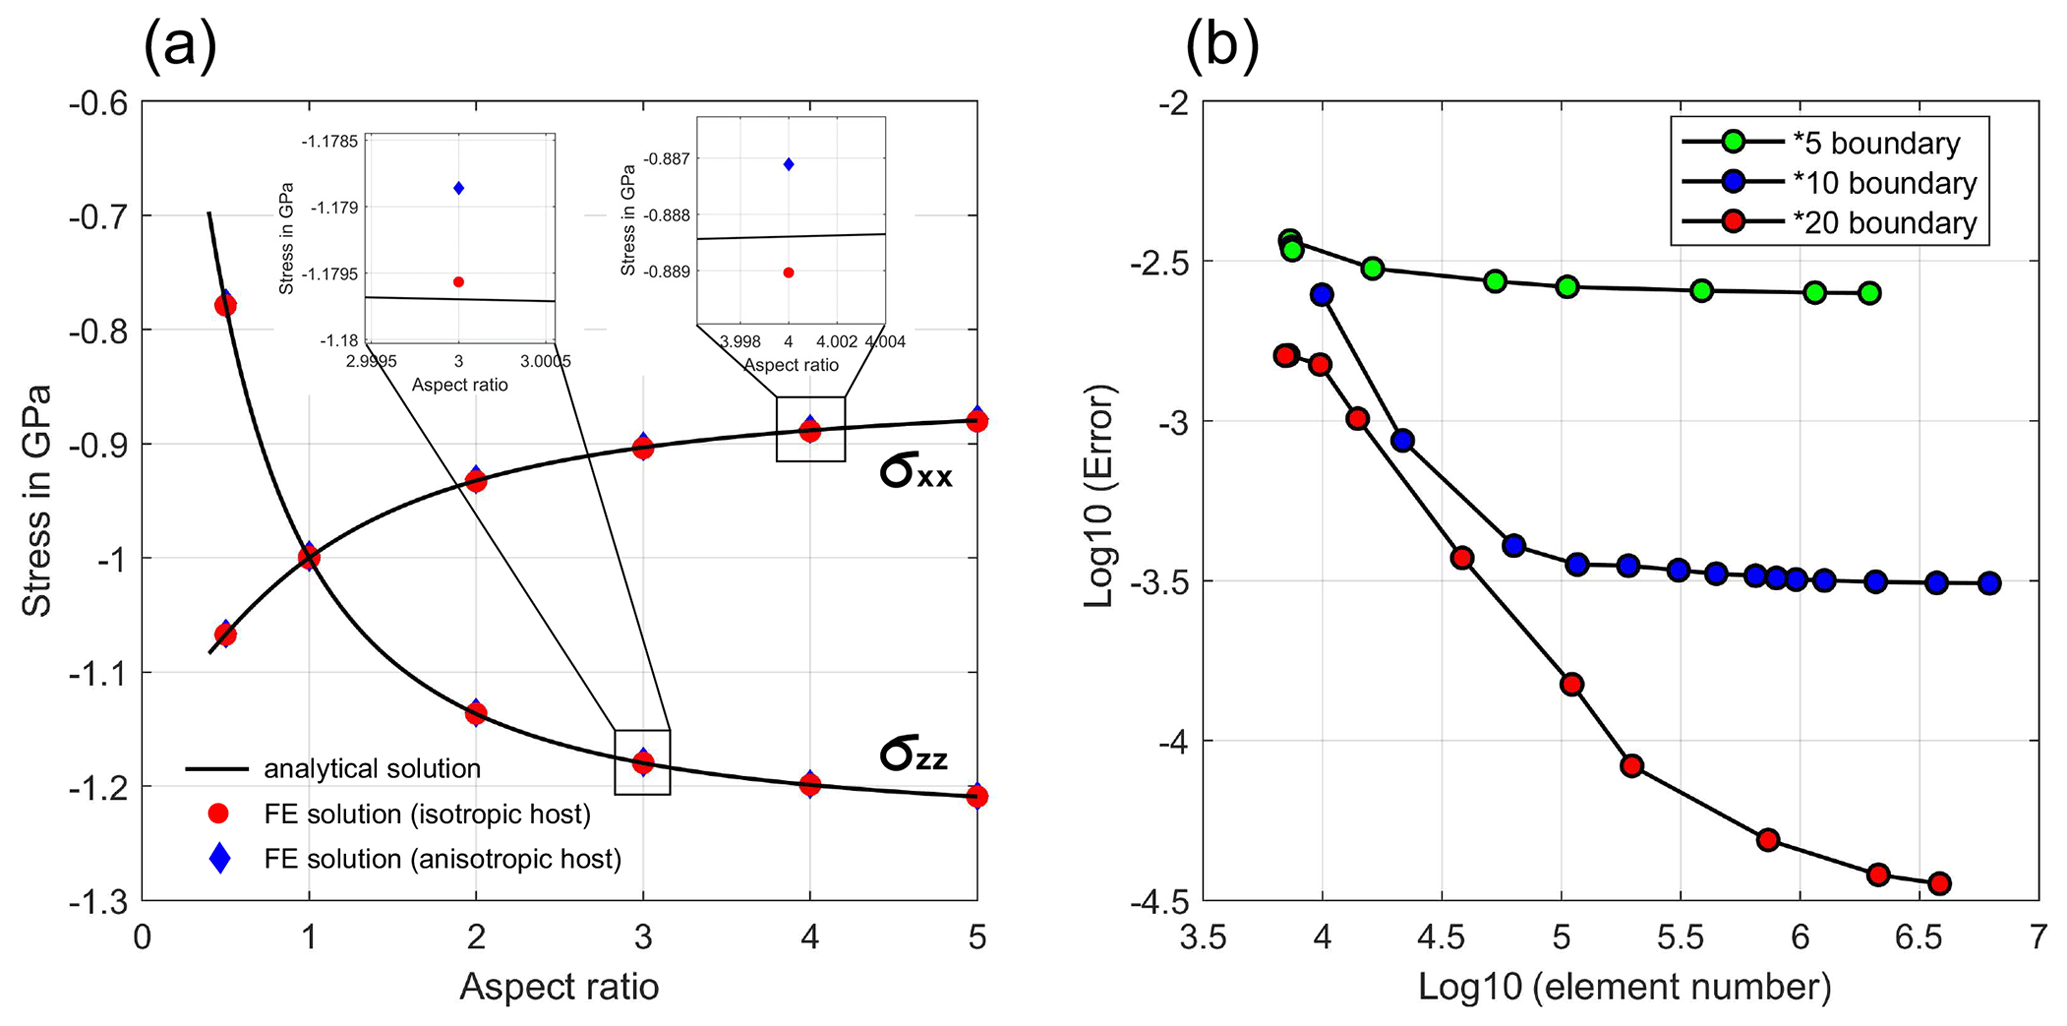
Figure 2Cross-validation results between a finite-element method and the presented analytical method. (a) Direct comparison of residual stress components calculated with FE method and analytical method as a function of the aspect ratio of a spheroidal inclusion. (b) The normalized unsigned difference of the stress between FE method and analytical method as a function of mesh element number and model domain size. Spherical inclusion is used and boundary distance is set to ×5, ×10, and ×20 the inclusion diameter.
In addition, we have also tested the effect of applying cubic elastic stiffness tensor of almandine from Jiang et al. (2004) and compared the residual stress with the results obtained for an elastically isotropic garnet (blue dots in Fig. 2a). The difference in residual stresses obtained with FE method using anisotropic garnet host and the analytical solution (implicitly assuming isotropic host) is less than 0.001 GPa. This suggests that it is not necessary in practice to consider the anisotropy of garnet host. This has been also reported in, e.g. Mazzucchelli et al. (2019). It was suggested that the elastic anisotropy of cubic garnet has no significant impact on the result of elastic barometry. Thus, effective isotropic elastic properties of garnets may be used to model the inclusion–host elastic interaction.
4.1 Effect of inclusion aspect ratio on residual stresses
In Eq. (8), the aspect ratio of the inclusion only affects the Eshelby tensor. Here, we choose some common inclusions in metamorphic garnets, including quartz, apatite, zircon, and rutile, as examples to test the effect of inclusion aspect ratio on residual stresses. The data sources of elastic stiffness tensors of the studied minerals are listed in the caption of Fig. 3. Here, we first focus on spheroidal inclusions and let the crystallographic c axis coincide with the geometrical z axis of the inclusion. The inclusion aspect ratio is controlled by varying the lengths of the principal z and x (y) axes, and it is denoted by the ratio for simplicity in the following text (note it this is not the ratio of the lattice parameters c and a).
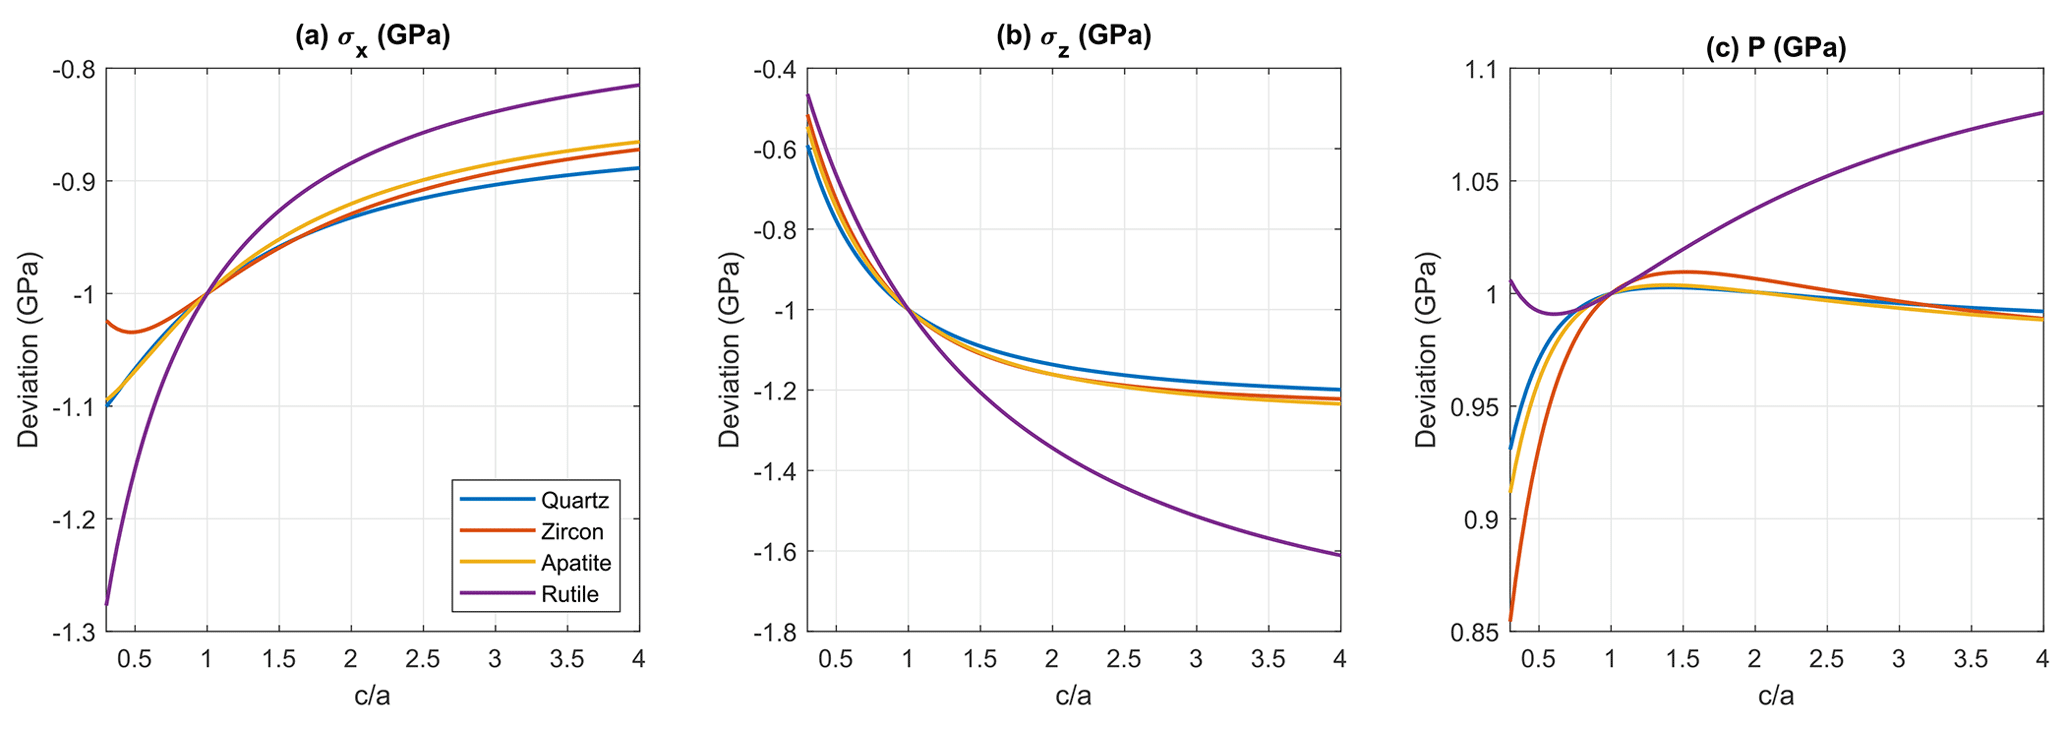
Figure 3Effect of geometrical aspect ratio of spheroidal inclusion along c and a axes on residual stress (). (a, b) Stresses and as a function of the geometrical ratio for quartz, zircon, apatite, and rutile inclusions. To isolate the effects of aspect ratio, the eigenstrain are set to produce GPa for the reference spherical inclusion. Any deviation from −1 GPa is due to shape changes. (c) Pressure as a function of the ratio. Here, the crystallographic c axis is aligned parallel to the long axis for prolate inclusions and the short axis for oblate inclusions. The quartz elastic stiffness tensor is from Heyliger et al. (2003), zircon and diamond are from Bass (1995), rutile is from Wachtman et al. (1962), and apatite is from Sha et al. (1994). The isotropic stiffness tensor of the almandine host is from Milani et al. (2015).
To isolate the effect of the inclusion aspect ratio, the eigenstrains for various inclusion minerals are all set to create 1 GPa compressive hydrostatic residual stress for the reference spherical inclusion embedded in an isotropic, infinite garnet host, which is the same approach as in the previous “cross-validation” section. Therefore, the stress variations shown in Fig. 3 only represent the mechanical effect due purely to varying the geometrical aspect ratio , and they allow direct comparison among different common mineral inclusions in metamorphic garnets.
Among all the tested minerals, the residual stress in quartz inclusions is the least sensitive to variations in aspect ratio. For prolate quartz inclusion (), the change of due to shape variation is within 0.1 GPa and the change of is within 0.2 GPa. The effects of varying the aspect ratio of prolate zircon and apatite inclusions are similar, with variation of from the reference spherical case reaching up to ca. 0.12 GPa and up to ca. 0.2 GPa.
The residual stress in rutile is the most sensitive to aspect ratio variations. With increasing ratio from 1, in prolate rutile inclusions increases up to ca. 0.2 GPa, and decreases by ca. 0.6 GPa. This is relevant for practical measurement as rutile often forms needle-shaped crystals.
The pressure (negative mean stress) is significantly less sensitive to inclusion aspect ratio variations. For prolate inclusions of quartz, zircon, and apatite, the residual pressure differs from the reference level (spherical inclusion shape) by only ca. 0.01 GPa when the aspect ratio is stretched up to 4. For oblate inclusion (), the pressure variation is typically below 0.1 GPa.
The residual stress in mineral inclusions can be easily converted into residual strain, which can be directly translated into Raman shifts (Angel et al., 2019; Murri et al., 2018). The effects of varying the aspect ratio of a quartz inclusion on Raman wavenumber shifts (see Fig. 4) are determined using the calculated residual strain components and the Grüneisen tensor (Murri et al., 2018). The same model settings are applied, with 1 GPa compressive hydrostatic residual stress characterizing the case of a spherical quartz inclusion. It is shown that for prolate inclusions, aspect ratio only introduces minor effects on the Raman shifts. For example, varying the ratio between 1 and 5 induces a wavenumber variation of less than 0.3 cm−1 for the 464 cm−1 Raman peak. This is in most cases insignificant from the viewpoint of practical Raman measurements. The ratio variations are also shown to be insignificant for the spectral shifts, with changes less than 0.2 cm−1 for the 464 cm−1 peak. For oblate inclusion, the impact of inclusion shape is shown to be more significant. For the 464 cm−1 peak, the change of wavenumber shift can reach 0.8 cm−1 for strongly oblate inclusion (), and it is ca. 0.3–0.4 cm−1 for less oblate inclusion ().
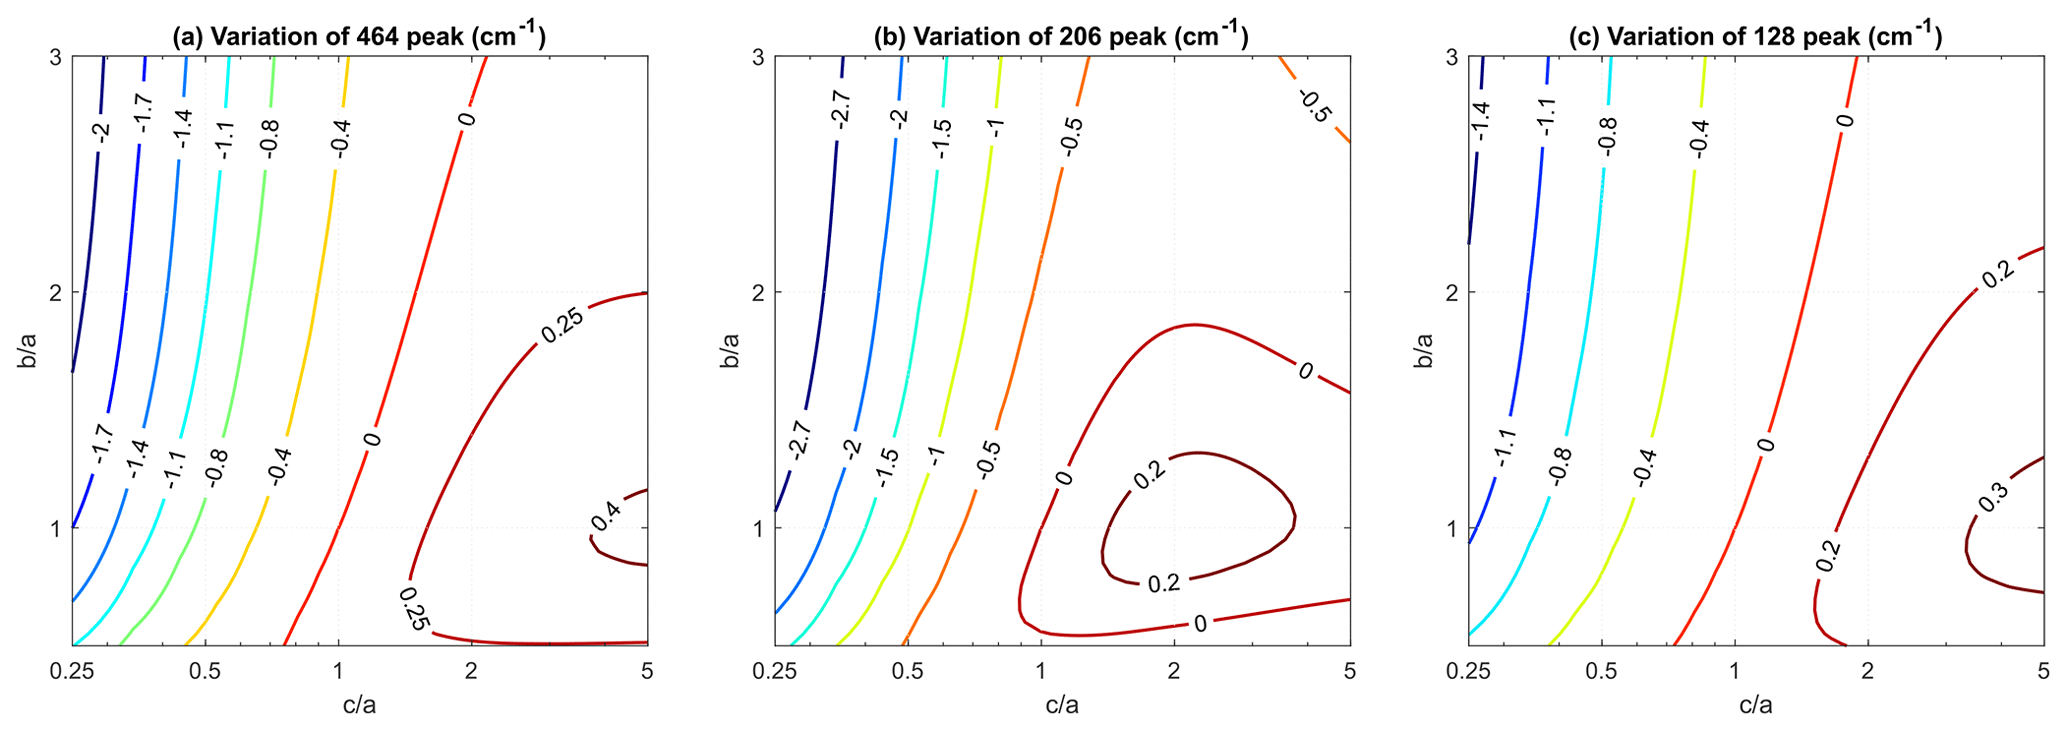
Figure 4The effect of geometrical aspect ratio of ellipsoidal quartz inclusion for axes and axes on Raman wavenumber shift entrapped in garnet host. The contours show the variation of wavenumber shift compared to perfectly spherical quartz inclusion (, ). The initial residual inclusion pressure is assumed to be hydrostatic 1 GPa for the reference spherical inclusion. The wavenumber shift variations are due to changing the geometrical aspect ratios of and axes. The Raman shifts are calculated using the residual strain and the Grüneisen tensor in Murri et al. (2018). For the inclusion is prolate, and for the inclusion is oblate. The stiffness tensor of quartz at room P–T is from Heyliger et al. (2003) and that for almandine garnet is from Milani et al. (2015).
Our results show good consistency with the Raman data reported in Kouketsu et al. (2014), where quartz inclusions with different aspect ratios were measured and no significant variation in spectral shift was found.
4.2 Effect of inclusion crystallographic orientation with respect to the long axis
In nature, the crystallographic axes of an inclusion are not necessarily aligned parallel to its geometrical axes. In this section, the effect of varying the crystallographic orientation with respect to the geometrical axes on the resulting Raman wavenumber shift is systematically studied using the proposed analytical model. Here, we reorient the crystallographic c axis of a spheroidal quartz inclusion from its long axis (Fig. 5) between 0 (crystallographic c axis parallel to the geometrical long axis) and 90∘ (c axis perpendicular to the long axis). The same eigenstrain is applied to quartz as from previous section. The elastic stiffness tensor of quartz is from Heyliger et al. (2003) and that of isotropic almandine garnet is from Milani et al. (2015). The predicted Raman spectral shifts are calculated based on the Grüneisen tensor calibrated by Murri et al. (2018).
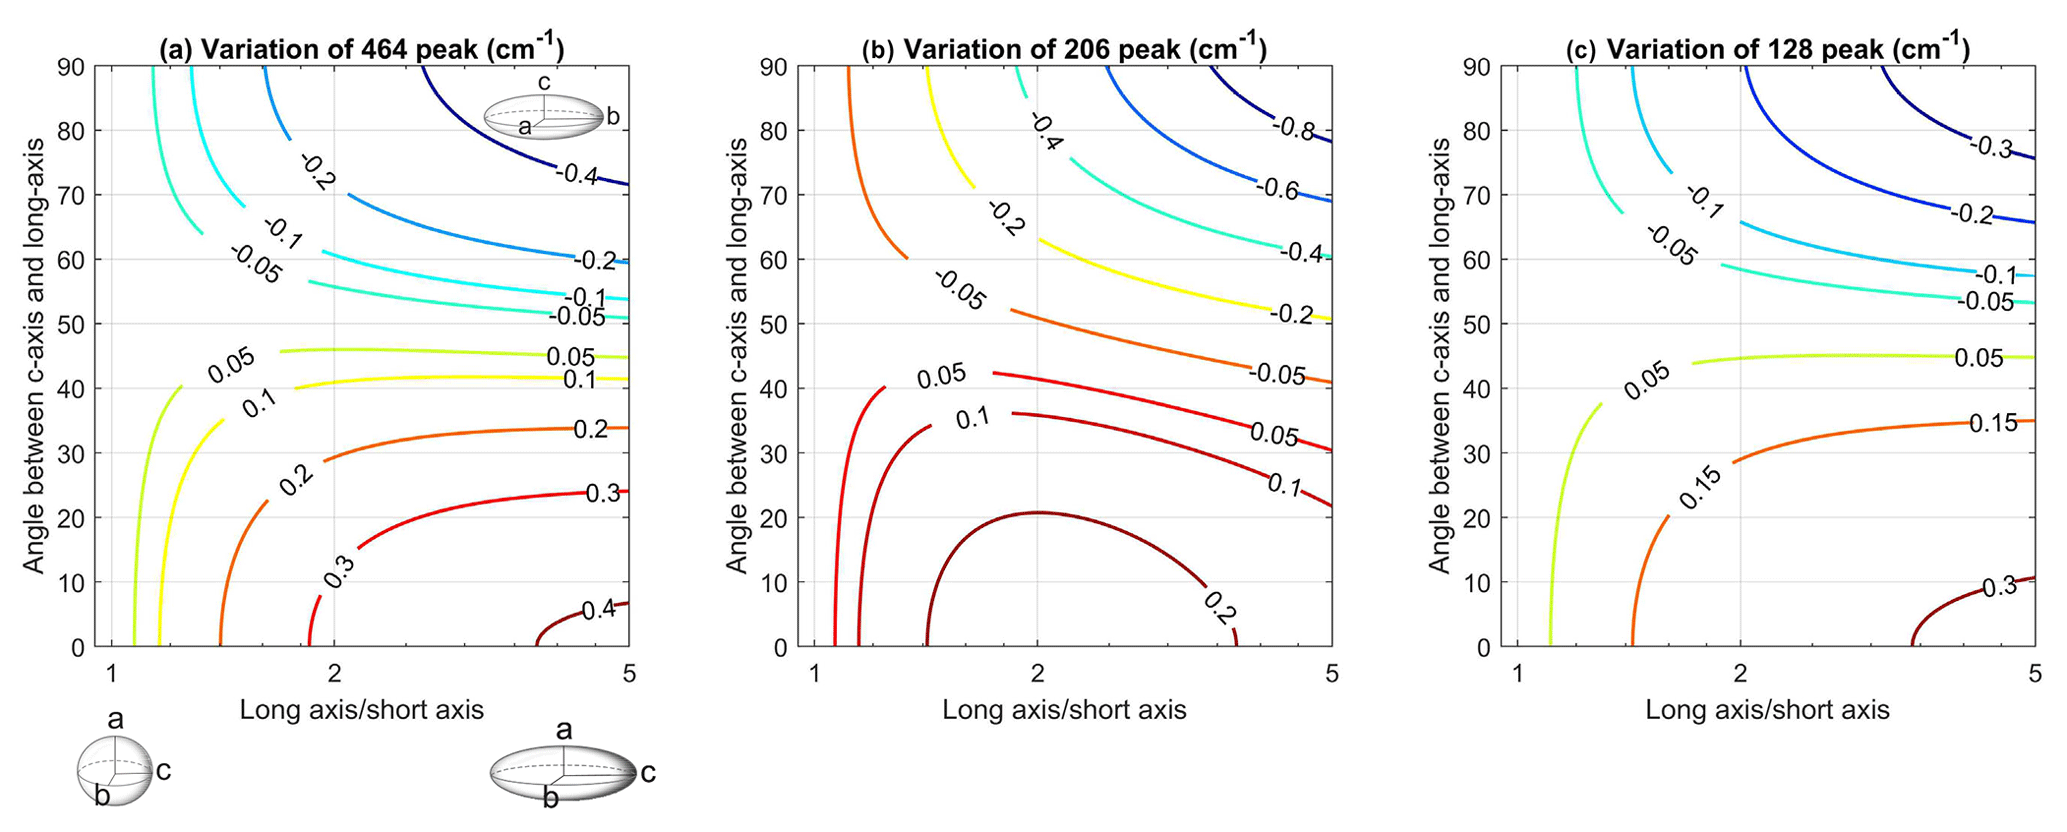
Figure 5The effect of varying the crystallographic orientation (c axis) with respect to the geometrical long axis of a prolate spheroidal quartz inclusion. The contours show the variation of wavenumber shift compared to perfectly spherical quartz inclusion (in this case the crystallographic orientation does not matter). The horizontal axis represents the aspect ratio of the spheroidal inclusion, and the vertical axis shows the angle between the crystallographic c axis and the geometrical long axis. In the plot, c axis is allowed to shift from parallel to the geometrical long axis to parallel to the geometrical short axis of the spheroidal inclusion. The driving eigenstrain is set to produce a hydrostatic residual pressure of 1 GPa in the reference spherical inclusion.
The results are shown in Fig. 5. For an aspect ratio of 2, the 464 cm−1 band varies ca. ± 0.2 cm−1 when the orientation of the crystallographic c axis is varied between the long and the short geometrical axis. The effect of crystallographic orientation (c axis) on the Raman shifts increases towards higher aspect ratios. For an aspect ratio of 5, the 464 cm−1 band varies ca. ± 0.4 cm−1. Similarly, for the 206 and 128 cm−1 bands, the maximal wavenumber variations compared to the reference case of a spherical inclusion are ca. 0.8 and 0.3 cm−1, respectively. The results suggest that the crystallographic orientation of a quartz inclusion with respect to its geometrical axes has no significant impact on the predicted Raman spectral shift, as long as the geometrical aspect ratio is not higher than 2–3.
4.3 Effect of faceted inclusion shape
The analytical solution presented in this study is derived for an ellipsoidal anisotropic inclusion. However, the shape of a natural mineral inclusion may exhibit corners, edges, and facets, which results in stress concentration effects and may have an impact on the overall level of the residual stress.
Here, we explore the possibility of using an effective ellipsoid to fit the shape of a faceted inclusion. We use the equivalent aspect ratio to calculate the residual stress or strain based on the presented analytical solution for ellipsoidal inclusions. Fitting an arbitrary, irregular shape using an ellipsoid in 3D (or an ellipse in 2D) is a common practice in image analysis (Chaudhuri and Samanta, 1991; Li et al., 1999). A pixelated 3D image is used to calculate the second-order moment of the object shape to minimize the mismatch between the 3D irregular inclusion shape and the effective ellipsoid. The method allows for obtaining the lengths and orientations of the major, minor, and intermediate axes of the effective ellipsoid (the method described in Appendix A–C and MATLAB code provided in the Supplement can be used to perform this task).
Similar to previous sections, we use the eigenstrain components that can load the reference spherical inclusion of any given mineral embedded in isotropic almandine garnet host into 1 GPa compressive residual stress. The tested inclusion shapes include: cylinder, tetrahedron, cuboid, octahedron, hexagonal prism, and icosahedron. To vary the aspect ratio, the inclusion shape is stretched in the z axis direction, which is parallel to the crystallographic c axis as shown in Fig. 6.
We study five inclusion minerals: quartz (elastic tensor from Heyliger et al., 2003), zircon (Bass, 1995), rutile (Wachtman et al., 1962), fluorapatite (Sha et al., 1994), and diamond (Bass, 1995). Almandine garnet is taken as the host grain (Milani et al., 2015). For each FE mesh, the size of the computational box is set more than 10 times the inclusion size and adaptive mesh is generated with highest mesh resolution within and close to the inclusion. The 10-node tetrahedron elements with quadratic (second-order) shape (interpolation) functions for the displacement field are used. In total, there are ca. 2 million elements per model (relative error of less than 0.0003 based on benchmark results in Fig. 2).
The results of numerical simulations are shown in Fig. 6. The effective aspect ratio for all different inclusion shapes, together with the residual stress components, are given in the Supplement. The residual stress in non-ellipsoidal inclusions based on the FE model is heterogeneous and we monitor the stress state (1) at the centroid (CT) point (red dots in Fig. 6) and (2) as the volumetric average (VA) within the entire inclusion (orange dots)
The root-mean-square deviation (RMSD) is calculated by comparing the residual stress from the finite-element solutions based on various stress evaluation schemes (CT and VA) and analytical models using the best-fitted effective aspect ratio (Table 1). It is clearly shown that the VA stresses of quartz, zircon, rutile, and apatite inclusion are remarkably similar to the analytical results, with an RMSD generally lower than 0.02–0.03 GPa (ca. 2 %). From CT to VA, a significant improvement on RMSD of a factor of abour 2 is obtained.
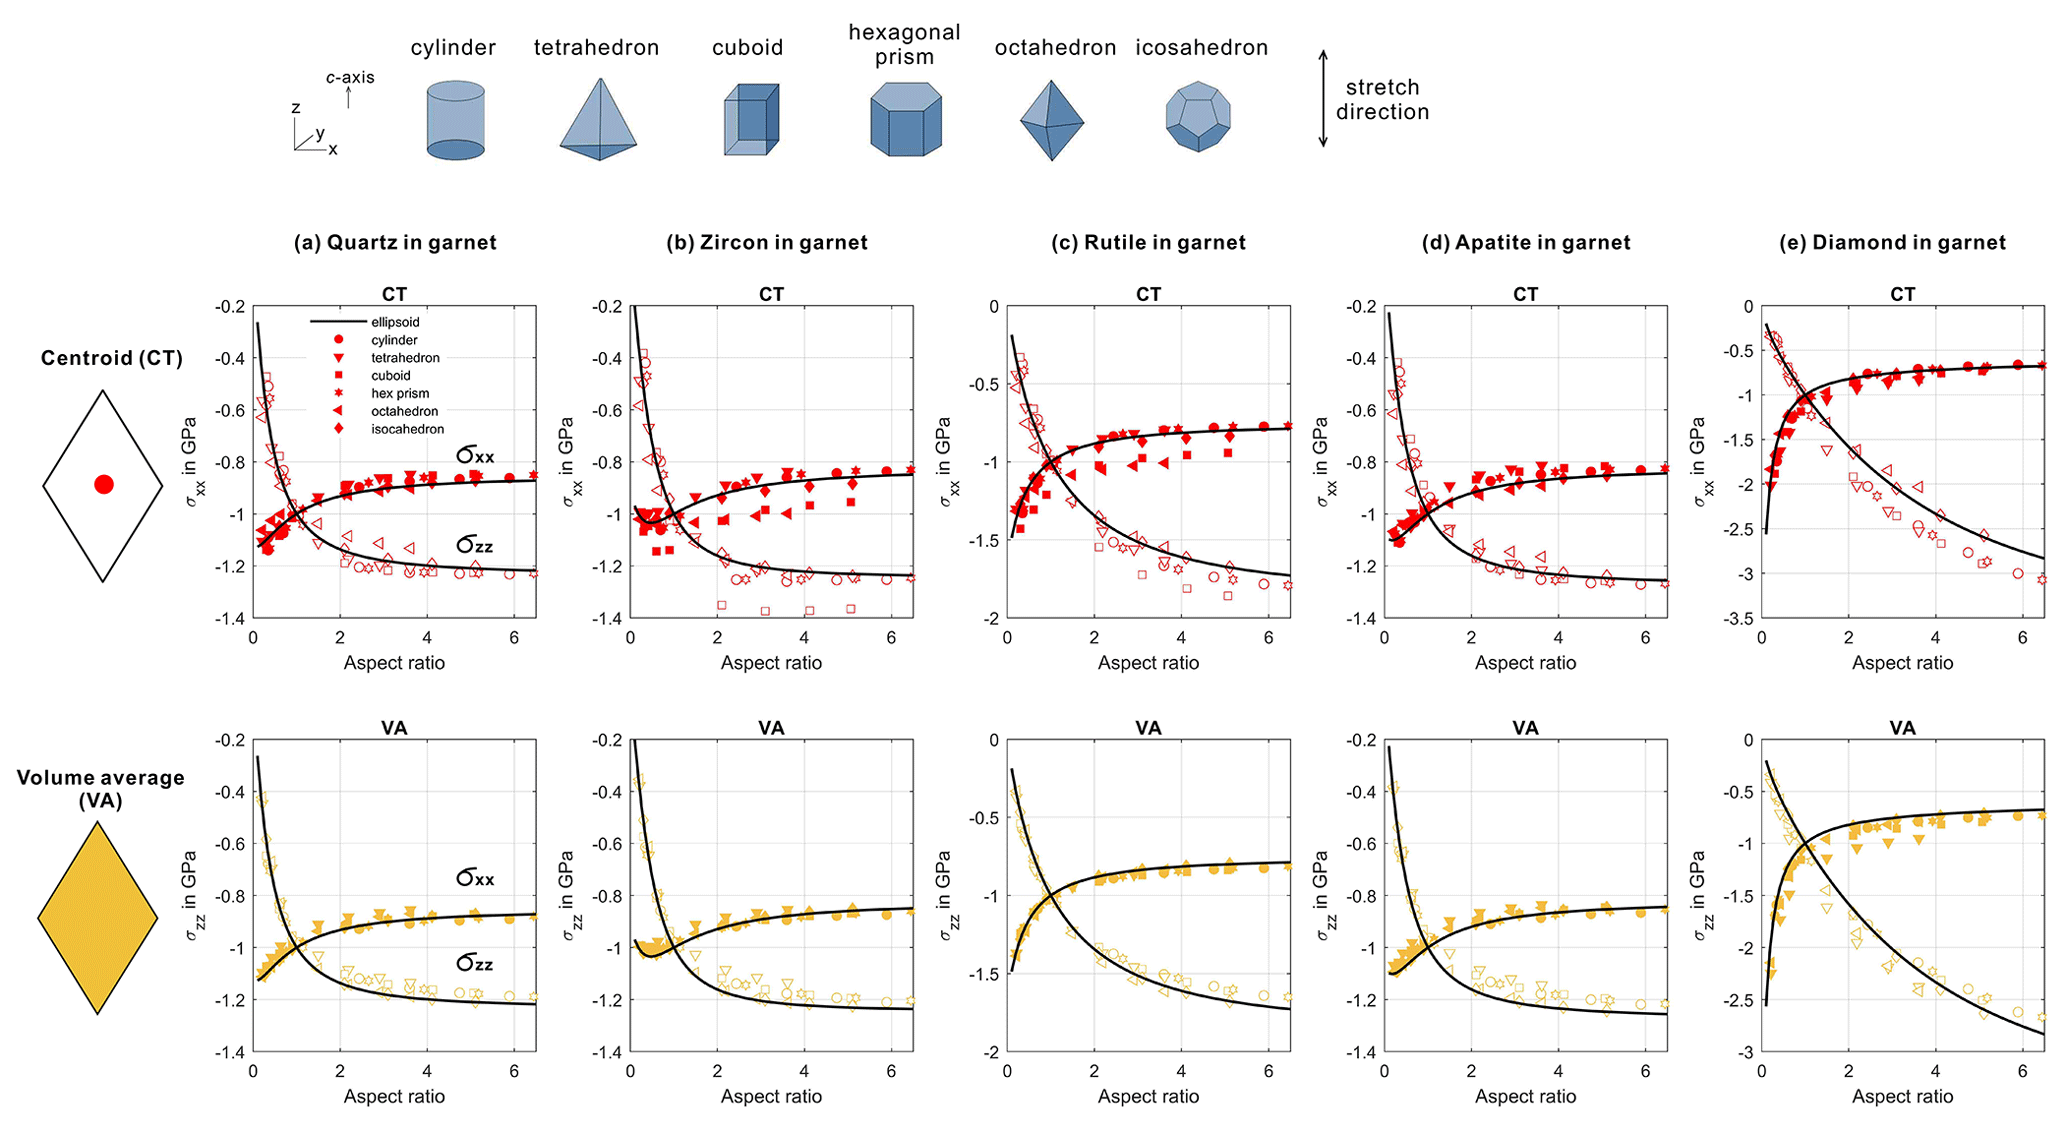
Figure 6Finite-element stress of various inclusion shapes (symbols) compared to the stress of effective spheroidal inclusion based on an analytical method (black curves). The effective aspect ratio of inclusion shape is calculated based on the fitting method of Chaudhuri and Samanta (1991) and Li et al. (1999) (see Appendix A–C). The inclusion is loaded with eigenstrain that generates 1 GPa compressive hydrostatic residual stress for spherical shape. The variation of stress is only caused by the shape change. The c axis coincides with the stretching direction. The red dots correspond to the stress at the inclusion's centroid (CT); the orange dots correspond to the volumetric average (VA) of the entire inclusion. The anisotropic elastic stiffness tensors are listed in the caption of Fig. 3. The root-mean-square deviation (RMSD) for each inclusion shape and inclusion mineral phase is given in Table 1. The raw FE stress data can be found in the Supplement.
Table 1Root-mean-square deviation (RMSD) of the finite-element solution of symmetrically shaped non-ellipsoidal inclusion in Fig. 6 compared to the analytical solution of equivalent spheroidal inclusions. Isotropic almandine garnet is used as a host. For each inclusion mineral and inclusion shape, the aspect ratio varies from 0.2 to 5. The effective aspect ratio is calculated for each shape and used for the analytical solution to obtain the residual stress state. The inclusion is loaded by eigenstrain that creates 1 GPa hydrostatic residual pressure for spherical inclusion in an infinite host. Thus, any stress variation can only be caused by shape change. The calculated stress data for each individual FE run is given in Supplement data. Stress is obtained for (1) the centroid point (CT) and (2) volumetric average (VA) of the entire inclusion (see Fig. 6 for illustration). The RMSD is calculated by comparing the FE results and analytical results based on the best-fitted effective ellipsoid. The unit used for RMSD is GPa. The elasticity of the inclusion mineral given in the caption of Fig. 6.
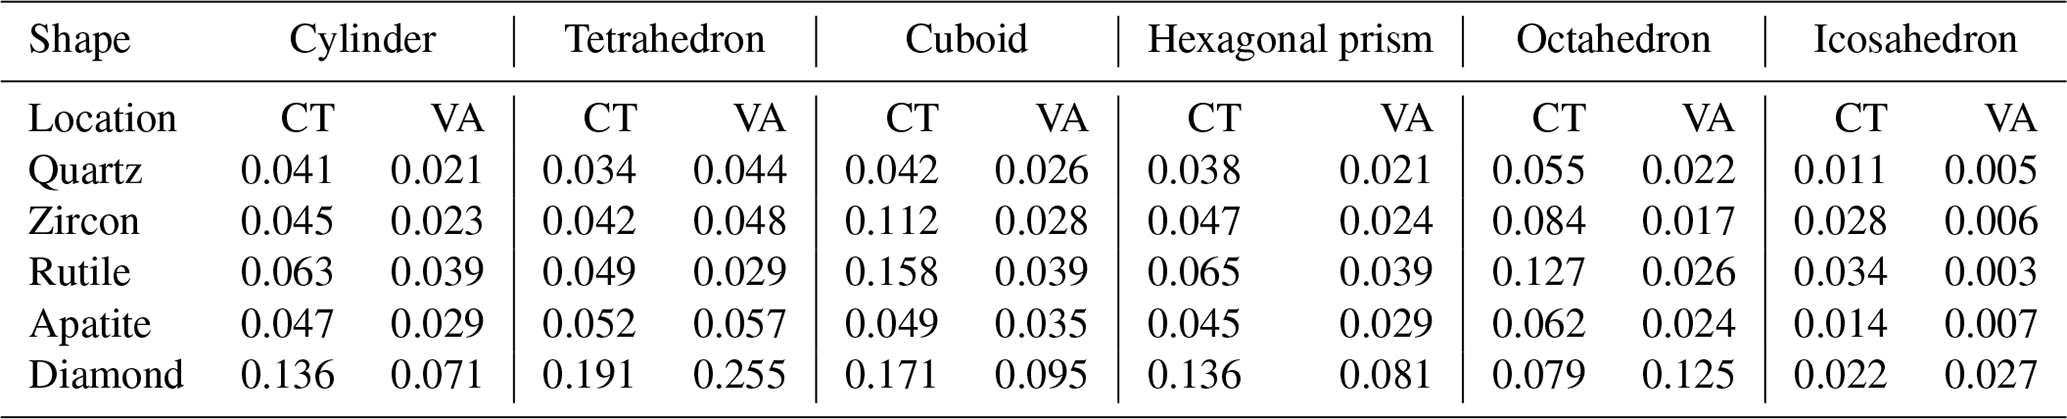
The only exception among the studied minerals is diamond, where the RMSD is higher than in the case of other inclusions, which are elastically softer. This is consistent with the high “geometrical correction factor” reported for diamond in Mazzucchelli et al. (2018). However, as an improvement from Mazzucchelli et al. (2018), where the geometrical correction factor must be applied for all inclusion phases to correct the residual stress due to shape effects, we have found that the stress variation due to varying inclusion shapes for minerals such as quartz, zircon, apatite, and rutile can be satisfactorily approximated by using the proposed approach of the equivalent ellipsoidal inclusion, with RMSD generally lower than 3 %–4 % for most of the studied inclusion shapes. To achieve this improved and satisfactory level of prediction (1) we have used best-fit ellipsoids to better approximate inclusion shapes, instead of a crude measure of the length/width ratio of, e.g. cuboidal or cylindrical inclusion, and (2) we have not only considered the centroid point of the inclusion (which indeed yields a larger RMSD) but also the volumetric average (VA) for the residual stress state sampled during stress measurements, which interestingly provides a significantly better approximation for the residual stress or strain state of the tested mineral inclusions. This is practical and useful in Raman measurement because it is possible to perform either (1) multiple-point averaging during Raman analysis within the entire inclusion or (2) defocus the laser beam to take into account a larger volume for the inclusion strain heterogeneity. For tiny inclusions (size of ca. 1–3 µm) and for a typical in-plane laser beam diameter of ca. 1–2 µm, the stress and strain averaging is, in fact, implicitly performed during measurements. Based on FE analysis, it is clearly shown that the volumetrically averaged stress within the inclusion, rather than centroid point measurements, may provide a closer match compared to the stress predicted based on the presented analytical solution developed for the best-fitted ellipsoid. This effect becomes statistically more significant when the faceted inclusion shape and crystallographic orientation are independent, as demonstrated in the next section.
4.4 Irregularly faceted shapes and random crystallographic orientation
In nature, the shape of mineral inclusions is not necessarily as highly symmetric as presented in the previous section, and the crystallographic orientation can be generally random with respect to the principal geometric axes of the inclusion. Here, a MATLAB script is used to generate completely random 3D inclusion shapes by prescribing random vertices (non-coplanar 5 to 24 vertices) and connecting them to form a closed 3D shape. Delaunay triangulation is used to form 3D volumes enclosed by the triangular faces. Tetgen software is again used to generate unstructured tetrahedron computational meshes fitted to the inclusion surface. The effective aspect ratio (geometrical longest to shortest axis of the best-fitted effective ellipsoid) is controlled to be within 6. In total, we have generated ca. 500 random 3D inclusion shapes and performed a finite-element simulation for the previously studied set of anisotropic inclusion minerals (quartz, zircon, rutile, apatite, and diamond) to calculate the elastic stress field. The generated random shapes are plotted in the Supplement (see the .gif animation that illustrates 100 selected examples of 3D inclusion shapes). We further allow the crystallographic c axis to be pointing along an orientation that is randomly chosen as parallel to either the longest, intermediate, or shortest geometrical axis (best-fitted using the method of Chaudhuri and Samanta, 1991). The FE results are compared to the analytical results based on the effective ellipsoidal inclusion with the same crystallographic orientation. This Monte Carlo type FE simulation allows us to investigate how much stress deviation can be generated for irregularly faceted inclusion shapes with random crystallographic orientation and how accurate the analytical approach based on the best-fitted ellipsoid is to describe the residual stress state in an irregularly shaped inclusion, depending on the stress-sampling scheme (CT and VA). The results are plotted in Fig. 7 (raw data of FE simulations can be found in Supplement).
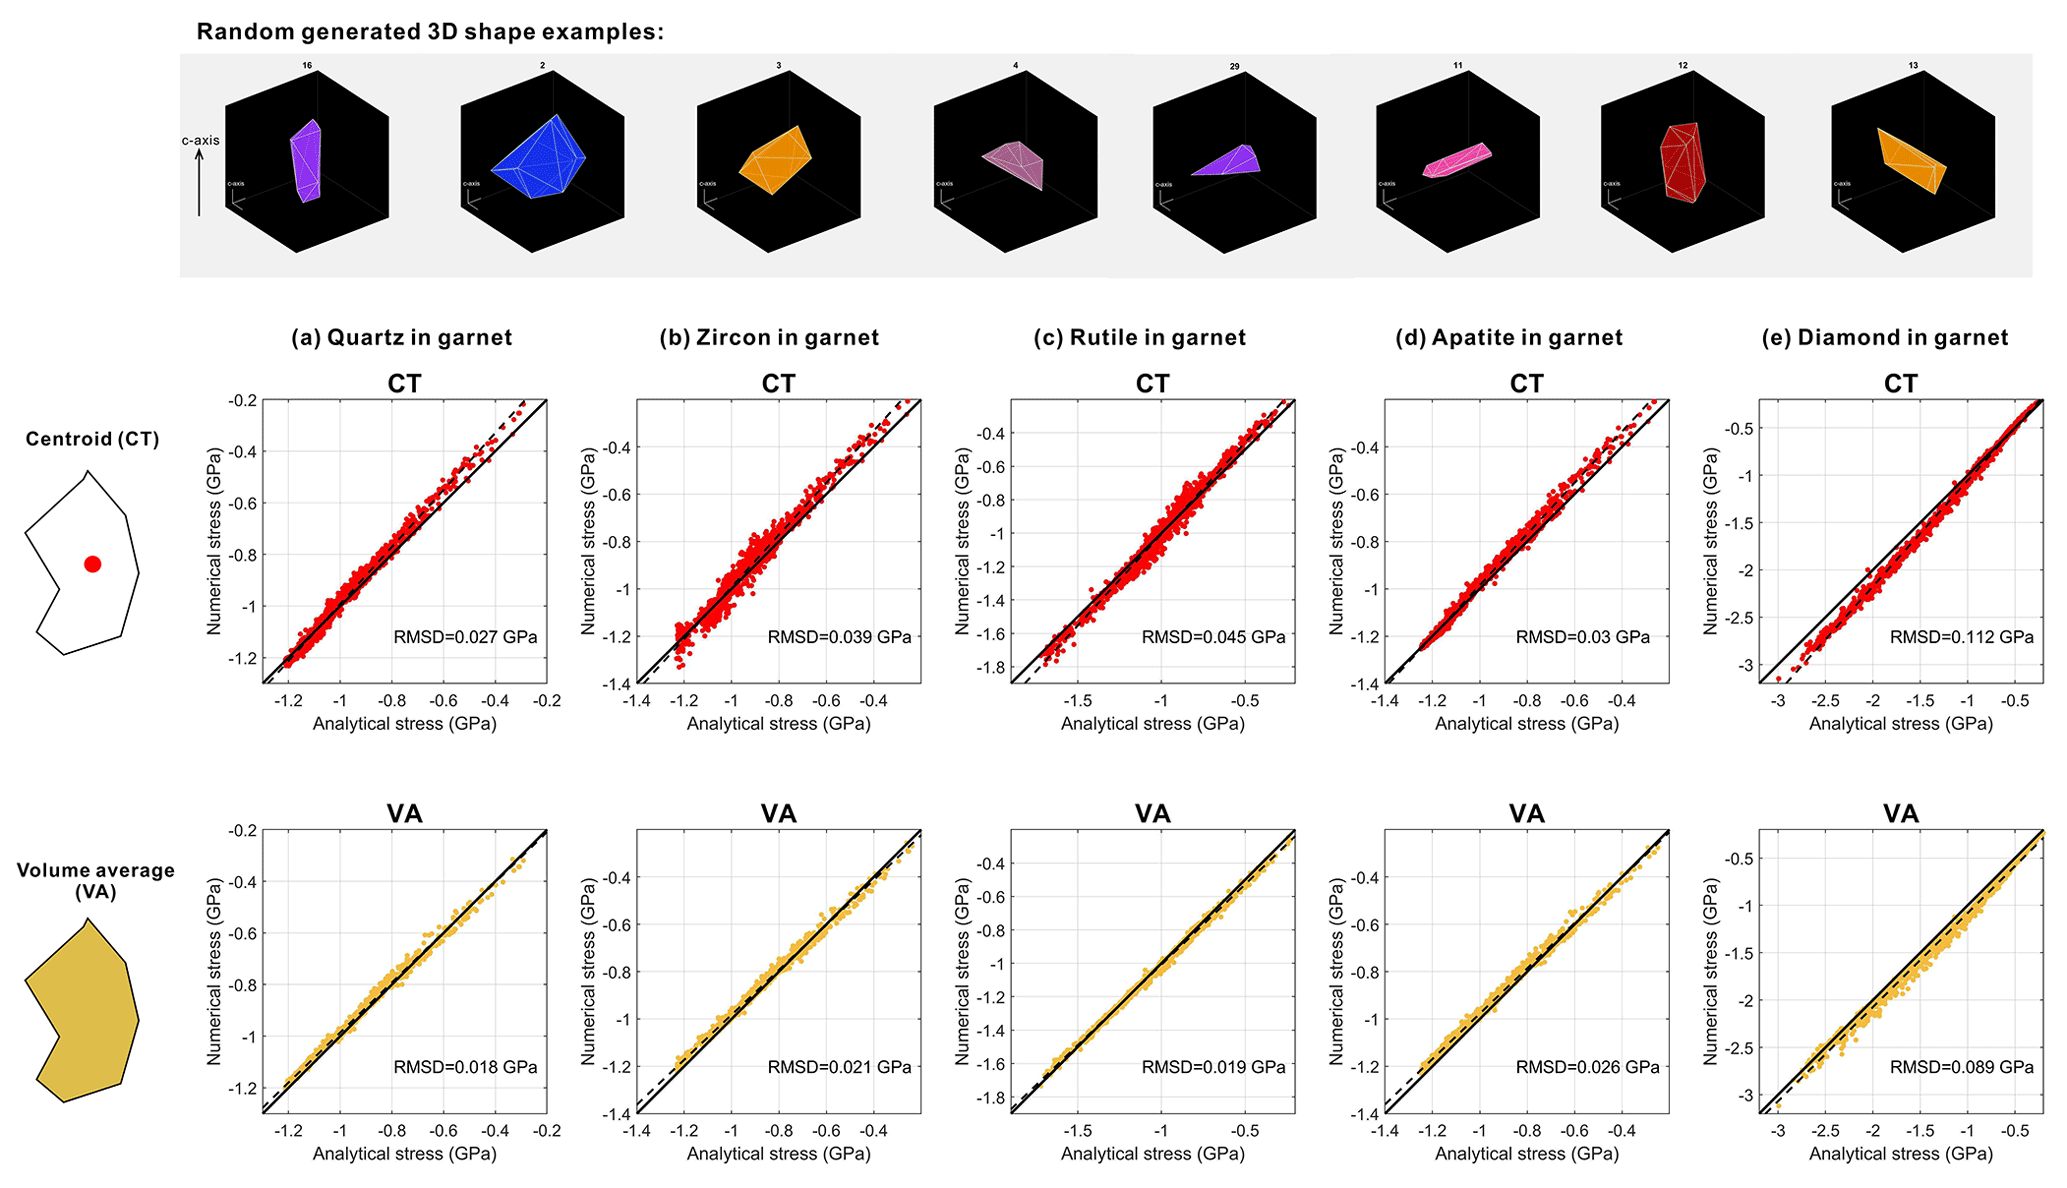
Figure 7The 500 randomly generated inclusion shapes (top panel for examples) calculated with the finite-element method (vertical axis) and analytical method (horizontal axis). All three normal stress components are plotted together in each diagram. The crystallographic c axis orientation is randomly chosen along one of the geometrical principal axes. The red and orange dots show the comparison of FE (numerical) results and analytical results for the normal stress components, respectively. Each dot represents a normal stress component calculated for one randomly generated inclusion shape. The red dots show the stress evaluated at the centroid point (CT); the orange dots show the volumetrically averaged (VA) stress within the inclusion. The raw data can be found in the Supplement and the generated 3D random shape can be viewed in the accompanying .gif file.
For the centroid point (CT), quartz inclusions have the lowest RMSD (ca. 0.03 GPa) for all three normal stress components and diamond inclusions have the highest RMSD (ca. 0.11 GPa). In general, CT stress shows a systematically higher RMSD than volumetrically averaged (VA) stresses. When the stress within the inclusion is volumetrically averaged, the RMSD dramatically drops to a nearly perfect match between the FE results for irregularly faceted inclusion and the analytical prediction based on the best-fitted ellipsoid. The RMSD of volumetrically averaged residual stresses (VA) of quartz, zircon, rutile, and apatite are all lower than ca. 0.02 GPa (2 %), and it shows no obvious dependence on the effective aspect ratio even for the extremely elongated or flattened inclusions (see the near-perfect alignment of the orange dots and 1-to-1 ratio line in the middle and bottom panels of Fig. 7).
Thus, the volumetric average of the residual stress within the inclusion provides a sufficiently reliable match between the exact results for irregularly shaped inclusions and the approximate predictions based on the analytical solution. This shows that it is possible to approximate the stress and strain state of the inclusion using an effective ellipsoid shape for the tested inclusions including quartz, zircon, rutile, and apatite. Only diamond has a notably higher level of RMSD, exhibiting a systematic discrepancy between the exact numerical and approximate analytical results. This indicates that using the proposed equivalent analytical model for diamond inclusion may lead to a potential overestimation of the residual stress by ca. 0.07 GPa (7 %). However, this RMSD may still be acceptable as a crude estimate or may serve as an upper limit for elastic thermobarometry.
The presented model builds on a linear elastic constitutive law at room temperature, i.e. . This assumption is appropriate when the residual stresses and strains of the inclusion are low, and thus the application of a constant anisotropic stiffness tensor determined at room P–T conditions introduces no significant errors. For highly stressed mineral inclusions, e.g. inclusions in diamond host from mantle xenoliths where the residual inclusion pressure may reach several GPa, this approximation may lead to non-negligible deviations. To eliminate such error, the stiffness tensor needs to be treated as a function of either non-hydrostatic stresses or anisotropic strains, i.e. ) or . In experimental studies, is often described as a function of hydrostatic pressure, e.g. Bass (1995). It is beyond the scope of this paper to develop a method of fitting with respect to the individual stress tensor components. If the stiffness tensor can be parameterized by or simply as a function of pressure as a first-order approximation, the residual stresses and strains are readily calculated by iterating Eq. (8), while updating the tensor using the calculated inclusion stress or strain during the iteration loop. Thus, the developed analytical method based on the Eshelby's solution can be extended to the case of a non-linear inclusion phase as long as can be parameterized in terms of stress or strain components or their invariants.
In this study, we use the classical Eshelby solution combined with the equivalent eigenstrain method to calculate the residual strain and stress in an anisotropic, ellipsoidal mineral inclusion embedded in an elastically isotropic host. The residual stresses can be expressed by a linear operator (Eq. 8) acting on the eigenstrain. The linear operator depends on the anisotropic elastic stiffness tensor of the inclusion evaluated at room P–T conditions, the shape of the inclusion, and the shear modulus and Poisson ratio of the host. The studied mechanical problem is loaded by an eigenstrain term, which is given by the difference between the lattice strains of the inclusion and host at the P–T conditions of entrapment.
The effect of inclusion aspect ratio on the inclusion residual stress and strain has been investigated quantitatively. The residual stress in quartz inclusions exhibits the least sensitivity to aspect ratio changes, and rutile shows the most pronounced variation. The popularly used quartz-in-garnet system is studied in more detail. For prolate quartz inclusions, the residual stress variations caused by varying inclusion shape are shown to be insignificant when the crystallographic c axis is subparallel to the geometrical long axis. The Raman wavenumber variation is less than 0.4 cm−1 for the 464 cm−1 peak even for highly elongated inclusions with an aspect ratio of 5. For oblate quartz inclusions with an aspect ratio of ca. 0.5, the additional wavenumber shift may reach ca. 0.8 cm−1. Therefore, it is useful in practice, although potentially technically difficult, to have an estimate of the crystallographic c axis orientation when studying highly stretched or flattened quartz inclusions. As long as the c axis is sub-parallel to the geometrical long axis, the additional wavenumber shifts due to the inclusion aspect ratio are minor.
Our proposed analytical procedures to model residual inclusion stress and strain state do not require pre-FE simulation to obtain the six-by-six “relaxation tensor” as proposed by Mazzucchelli et al. (2019). For application purposes, as long as the lattice strains of inclusion () and host () at high P–T conditions are available, it is possible to calculate the eigenstrain term by subtracting them following Eq. (2). Given the driving eigenstrain, the residual strain and stress preserved within an anisotropic, ellipsoidal inclusion in isotropic host can be easily calculated using Eq. (8). The proposed procedure can be inversely applied to retrieve the residual strain and stress of any natural mineral inclusions embedded in elastically isotropic hosts, such as garnets.
The presented model is only exact for perfectly ellipsoidal inclusions. In nature, inclusions often possess different shapes with facets and edges. Finite-element simulations on various faceted inclusion shapes showed that the residual stress is modified to a different degree compared to the simple ellipsoidal inclusion case, depending on the relative elastic properties between the inclusion and the host grain. However, the proposed approach of using the analytical result for the best-fitted effective ellipsoids yields remarkably good approximation for all the tested inclusion shapes, including highly irregular shapes. The RMSD comparing the FE numerical solution for faceted inclusion and the analytical solution based on a effective best-fitted ellipsoid is typically less than 2 % for quartz, zircon, apatite, and rutile inclusions. The only exception are the elastically stiff diamond inclusions, where the RMSD reaches 7 %. This finding expands the applicability of the analytical framework to arbitrarily shaped inclusions, whose elastic stiffness is not significantly higher than host (such as quartz, rutile, zircon and apatite). One important petrological implication is that it is possible to take the volumetrically averaged stress and strain within the inclusion and use it as a proxy to represent the residual stress and strain state of the inclusion. Then the proposed analytical framework may be used to recover the entrapment condition by back-calculating the eigenstrain using the volumetrically averaged residual stress and strain and the effective ellipsoid aspect ratio of the inclusion (Eq. 8). In fact, averaging the stress and strain within a certain volume is implicitly done in practical Raman measurement, e.g. for a tiny micrometre-sized inclusion with a laser beam size typically exceeding 1 µm.
When the inclusion and host are crystalized at entrapment conditions, they are considered to be stressed and strained by taking the room P–T condition as the reference state. Therefore, it is possible to calculate their strain state using lattice parameters a, b, and c relative to the reference state a0, b0, c0. For cubic, tetragonal, and orthorhombic symmetry systems (or hexagonal and trigonal minerals with symmetry being imposed), the lattice strains can be easily expressed following Eq. (1). For triclinic and monoclinic symmetry systems, the basis vectors of unit cell are not all parallel to the Cartesian coordinates x, y, and z. To obtain the lattice strain, we need use the unit cell parameters before and after the deformation and transform them into strains in the x, y, and z directions. We follow the method from Ohashi and Burnham (1973) to calculate the strain components based on the lattice parameters. Here, a short description on the involved equations is given and detailed can be found the in the appendix to Ohashi and Burnham (1973). This transformation considers the crystallographic c axis parallel to the Cartesian z axis and crystallographic a* axis parallel to the Cartesian x axis.
The matrix Q0 that relates the basis vectors of undeformed crystallographic a0, b0, and c0 axes at reference room P–T conditions to Cartesian coordinates is as follows:
Obtaining a similar transformation matrix relating the deformed crystallographic axes at entrapment conditions to Cartesian coordinates can be easily done by replacing a0, b0c0, α0, β0, and γ0 measured at reference P–T state with a, b, c, α, β, and γ measured at the entrapment conditions from Eq. (A1). This transformation matrix is denoted as Q1. We then calculate the displacement gradient tensor E as follows:
where I is the identity matrix. Without considering the antisymmetric rotation tensor, the infinitesimal Lagrangian strain tensor can be expressed as follows:
A MATLAB code is provided to perform this calculation
(Calculate_Strain.m). The input values are the reference lattice parameters measured at room
P–T conditions and the deformed lattice parameters at the entrapment
conditions. The outputs are both the infinitesimal and finite Lagrangian
strain tensor reported in MATLAB commend window. The results are numerically
the same compared to the available computer programmes such as the “STRAIN”
programme, which can be found at https://www.cryst.ehu.es/cryst/strain.html (last access: 8 April 2021), or the “Win_Strain” programme.
The components of Eshelby's tensor Sij are expressed as functions of the inclusion's principal axes lengths and the Poisson ratio of the isotropic host ν (Mura, 1987). A MATLAB script is provided to calculate Eshelby's tensor (for more detail, see the Supplement).
Here a1, a2, and a3 are the lengths of three principal axes of the inclusions, and they follow the order of . In case this order needs to be changed, a simple 90∘ rotation can be executed on Sij. The provided code in the Supplement automatically performs such a rotation to adjust the axes into the correct order. The required tensors Ii and Iij are evaluated as follows.
Here the functions F(θ,k) and E(θ,k) denote the incomplete elliptic integrals of the first and second kind as follows.
The integrals F(θ,k) and E(θ,k) are evaluated using the method of the arithmetic–geometric mean (Abramowitz and Stegenm, 1964, chap. 17). Once F(θ,k) and E(θ,k) are obtained, I can be computed and substituted into Eshelby's tensor.
The method (for details, see Chaudhuri and Samanta, 1991; Li et al., 1999) requires a 3D data image of the inclusion consisting of regular cubic voxels that has volume Δ in each voxel and coordinate x, y, z at the centre of each voxel. The inclusion is denoted as domain R. Its second-order moment matrix is calculated as follows.
Here xi is the x coordinate of the ith voxel that makes the inclusion, and n is the total number of the voxels that makes the inclusion domain R. A symmetric three-by-three matrix is constructed with the above six components, and its eigenvalues are denoted as I1, I2, and I3. The length of the major, intermediate, and minor axes can, respectively, be straightforwardly calculated as follows:
where I0 is the volume of the shape R, which can be straightforwardly
calculated as I0=nΔ. The principal axes of
the ellipsoid are the three eigenvectors of the three-by-three second-moment matrix
Iij. We provide the MATLAB source code (Fit_Ellipsoid.m) that performs the fit to any
arbitrary shape. The input is a 3D pixelated matrix (D) where 0 is for host
and 1 is for inclusion. The matrix D describes the shape of an arbitrary
inclusion shape. The output is the best-fitted effective ellipsoid's axes
length and orientation. As an example, the fit is performed for an
ellipsoid and the result returns the originally prescribed axes length.
All MATLAB code has been uploaded in the Supplement. Details for how to use the code can be found in Appendix A–C or by directly contacting the authors at xinzhong0708@gmail.com.
All calculated data are available as an excel file (provided in the Supplement) with details provided in Appendix A–C.
The supplement related to this article is available online at: https://doi.org/10.5194/se-12-817-2021-supplement.
XZ and MD conceived the idea and developed the analytical method. XZ created the finite-element model. XZ, MD, and BJ wrote the manuscript together.
The authors declare that they have no conflict of interest.
This work was finished during 2017–2018 and the paper was submitted to American Mineralogist in November 2018 (no. 6895) with two major rounds of reviews but was finally rejected after one year. Later it was submitted to Contributions to Mineralogy and Petrology in late 2019 and Lithos in 2020 with a complete revision but was rejected due to a potential conflict of interest. We acknowledge all the reviewers that commented on this paper. We thank Taras Gerya for editorial handling.
This research has been supported by the Schweizerischer Nationalfonds zur Förderung der Wissenschaftlichen Forschung (grant no. P2EZP2_172220), the Pánstwowy Instytut Geologiczny – PIB (grant no. 62.9012.2063), and the European Research Council, H2020 European Research Council (grant no. DIME (669972)).
We acknowledge support from the Open Access Publication
Initiative of Freie Universität Berlin.
This paper was edited by Taras Gerya and reviewed by two anonymous referees.
Abramowitz, M. and Stegenm, I. A.: Handbook of Mathematical Functions, Dover Publications, New York, p. 319, 1964.
Alvaro, M., Mazzucchelli, M. L., Angel, R. J., Murri, M., Campomenosi, N., Scambelluri, M., Nestola, F., Korsakov, A., Tomilenko, A. A., Marone, F., and Morana, M.: Fossil subduction recorded by quartz from the coesite stability field, Geology, 48, 24–28, https://doi.org/10.1130/G46617.1, 2020.
Angel, R. J., Mazzucchelli, M. L., Alvaro, M., and Nestola, F.: EosFit-Pinc: A simple GUI for host-inclusion elastic thermobarometry, Am. Mineral., 102, 1957–1960, https://doi.org/10.2138/am-2017-6190, 2017.
Angel, R. J., Murri, M., Mihailova, B., and Alvaro, M.: Stress, strain and Raman shifts, Z. Krist.-Cryst. Mater., 234, 129–140, https://doi.org/10.1515/zkri-2018-2112, 2019.
Ashley, K. T., Caddick, M. J., Steele-MacInnis, M. J., Bodnar, R. J., and Dragovic, B.: Geothermobarometric history of subduction recorded by quartz inclusions in garnet, Geochem. Geophy. Geosy., 15, 350–360, https://doi.org/10.1002/2013GC005106, 2014.
Bass, J. D.: Elasticity of Minerals, Glasses, and Melts, in: Mineral Physics and Crystallography: A Handbook of Physical Constants, AGU, Washington DC, 45–63, 1995.
Bayet, L., John, T., Agard, P., Gao, J., and Li, J.: Massive sediment accretion at ∼ 80 km depth along the subduction interface: Evidence from the southern Chinese Tianshan, Geology, 46, 495–498, 2018.
Bonaccorso, A. and Davis, P. M.: Models of ground deformation from vertical volcanic conduits with application to eruptions of Mount St. Helens and Mount Etna, J. Geophys. Res.-Sol. Ea., 104, 10531–10542, https://doi.org/10.1029/1999jb900054, 1999.
Bonazzi, M., Tumiati, S., Thomas, J., Angel, R. J., and Alvaro, M.: Assessment of the reliability of elastic geobarometry with quartz inclusions, Lithos, 350–351, 105201, https://doi.org/10.1016/j.lithos.2019.105201, 2019.
Chaudhuri, B. B. and Samanta, G. P.: Elliptic fit of objects in two and three dimensions by moment of inertia optimization, Pattern Recogn. Lett., 12, 1–7, https://doi.org/10.1016/0167-8655(91)90021-D, 1991.
Chiu, Y. P.: On the Stress Field and Surface Deformation in a Half Space With a Cuboidal Zone in Which Initial Strains Are Uniform, J. Appl. Mech., 45, 302–306, https://doi.org/10.1115/1.3424292, 1978.
Cliffe, M. J. and Goodwin, A. L.: PASCal: A principal axis strain calculator for thermal expansion and compressibility determination, J. Appl. Crystallogr., 45, 1321–1329, https://doi.org/10.1107/S0021889812043026, 2012.
Dabrowski, M., Krotkiewski, M., and Schmid, D. W.: MILAMIN: MATLAB-based finite element method solver for large problems, Geochem. Geophy. Geosy., 9, Q04030, https://doi.org/10.1029/2007GC001719, 2008.
Enami, M., Nishiyama, T., and Mouri, T.: Laser Raman microspectrometry of metamorphic quartz: A simple method for comparison of metamorphic pressures, Am. Mineral., 92, 1303–1315, https://doi.org/10.2138/am.2007.2438, 2007.
Eshelby, J. D.: The determination of the elastic field of an ellipsoidal inclusion, and related problems, P. Roy. Soc. Lond. A Mat., 241, 376–396, 1957.
Exner, U. and Dabrowski, M.: Monoclinic and triclinic 3D flanking structures around elliptical cracks, J. Struct. Geol., 32, 2009–2021, https://doi.org/10.1016/j.jsg.2010.08.002, 2010.
Freeman, B.: The behaviour of deformable ellipsoidal particles in three-dimensional slow flows: implications for geological strain analysis, Tectonophysics, 132, 297–309, https://doi.org/10.1016/0040-1951(87)90349-0, 1987.
Ghosh, S. and Dimiduk, D.: Computational methods for microstructure-property relationships, New York, p. 658, 2011.
Gillet, P., Ingrin, J., and Chopin, C.: Coesite in subducted continental crust: P–T history deduced from an elastic model, Earth Planet. Sc. Lett., 70, 426–436, 1984.
Gonzalez, J. P., Thomas, J. B., Baldwin, S. L., and Alvaro, M.: Quartz-in-garnet and Ti-in-quartz thermobarometry: Methodology and first application to a quartzofeldspathic gneiss from eastern Papua New Guinea, J. Metamorph. Geol., 37, 1193–1208, https://doi.org/10.1111/jmg.12508, 2019.
Guiraud, M. and Powell, R.: P–V–T relationships and mineral equilibria in inclusions in minerals, Earth Planet. Sc. Lett., 244, 683–694, https://doi.org/10.1016/j.epsl.2006.02.021, 2006.
Healy, D., Jones, R. R., and Holdsworth, R. E.: Three-dimensional brittle shear fracturing by tensile crack interaction, Nature, 439, 64–67, https://doi.org/10.1038/nature04346, 2006.
Heyliger, P., Ledbetter, H., and Kim, S.: Elastic constants of natural quartz, J. Acoust. Soc. Am., 114, 644–650, https://doi.org/10.1121/1.1593063, 2003.
Jiang, D.: Viscous inclusions in anisotropic materials: Theoretical development and perspective applications, Tectonophysics, 693, 116–142, https://doi.org/10.1016/j.tecto.2016.10.012, 2016.
Jiang, F., Speziale, S., and Duffy, T. S.: Single-crystal elasticity of grossular- and almandine-rich garnets to 11 GPa by Brillouin scattering, J. Geophys. Res.-Sol. Ea., 109, B10210, https://doi.org/10.1029/2004JB003081, 2004.
Kouketsu, Y., Nishiyama, T., Ikeda, T., and Eniami, M.: Evaluation of residual pressure in an inclusion – host system using negative frequency shift of quartz Raman spectra, Am. Mineral., 99, 433–442, 2014.
Li, M., Ghosh, S., Richmond, O., Weiland, H., and Rouns, T. N.: Three dimensional characterization and modeling of particle reinforced metal matrix composites: Part I: Quantitative description of microstructural morphology, Mater. Sci. Eng. A, 265, 153–173, https://doi.org/10.1016/S0921-5093(98)01132-0, 1999.
Mazzucchelli, M. L., Burnley, P., Angel, R. J., Morganti, S., Domeneghetti, M. C., Nestola, F., and Alvaro, M.: Elastic geothermobarometry: Corrections for the geometry of the host-inclusion system, Geology, 46, 231–234, https://doi.org/10.1130/G39807.1, 2018.
Mazzucchelli, M. L., Reali, A., Morganti, S., Angel, R. J., and Alvaro, M.: Elastic geobarometry for anisotropic inclusions in cubic hosts, Lithos, 350–351, 105218, https://doi.org/10.1016/j.lithos.2019.105218, 2019.
Meng, C. and Pollard, D. D.: Eshelby's solution for ellipsoidal inhomogeneous inclusions with applications to compaction bands, J. Struct. Geol., 67, 1–19, https://doi.org/10.1016/j.jsg.2014.07.002, 2014.
Milani, S., Nestola, F., Alvaro, M., Pasqual, D., Mazzucchelli, M. L., Domeneghetti, M. C., and Geiger, C. A.: Diamond-garnet geobarometry: The role of garnet compressibility and expansivity, Lithos, 227, 140–147, https://doi.org/10.1016/j.lithos.2015.03.017, 2015.
Morganti, S., Mazzucchelli, M. L., Alvaro, M., and Reali, A.: A numerical application of the Eshelby theory for geobarometry of non-ideal host-inclusion systems, Meccanica, 55, 751–764, https://doi.org/10.1007/s11012-020-01135-z, 2020.
Mura, T.: Micromechanics of Defects in Solids, Springer Science & Business Media, Dordrecht, the Netherlands, p. 587, 1987.
Murri, M., Mazzucchelli, M. L., Campomenosi, N., Korsakov, A. V., Prencipe, M., Mihailova, B. D., Scambelluri, M., Angel, R. J., and Alvaro, M.: Raman elastic geobarometry for anisotropic mineral inclusions, Am. Mineral., 113, 1869–1872, 2018.
Ohashi, Y. and Burnham, C. W.: Clinopyroxene Lattice Deformations: The Roles of Chemical Substitution and Temperature, Am. Mineral., 58, 843–849, 1973.
Rosenfeld, J. L. and Chase, A. B.: Pressure and temperature of crystallization from elastic effects around solid inclusions in minerals?, Am. J. Sci., 259, 519–541, https://doi.org/10.2475/ajs.259.7.519, 1961.
Sha, M. C., Li, Z., and Bradt, R. C.: Single-crystal elastic constants of fluorapatite, Ca5F (PO4)3, J. Appl. Phys., 75, 7784–7787, https://doi.org/10.1063/1.357030, 1994.
Si, H.: TetGen, a Delaunay-Based Quality Tetrahedral Mesh Generator, ACM Transactions on Mathematical Software, United States, 1–36, https://doi.org/10.1145/2629697, 2015
Taguchi, T., Enami, M., and Kouketsu, Y.: Prograde evolution of Sulu UHP metamorphic rock in Yangzhuang, Junan region, deduced by combined Raman and petrological studies, J. Metamorph. Geol., 34, 683–696, https://doi.org/10.1111/jmg.12203, 2016.
Taguchi, T., Enami, M., and Kouketsu, Y.: Metamorphic record of the Asemi-gawa eclogite unit in the Sanbagawa belt, southwest Japan: Constraints from inclusions study in garnet porphyroblasts, J. Metamorph. Geol., 37, 181–201, https://doi.org/10.1111/jmg.12456, 2019.
Thomas, J. B. and Spear, F. S.: Experimental study of quartz inclusions in garnet at pressures up to 3.0 GPa: evaluating validity of the quartz-in-garnet inclusion elastic thermobarometer, Contrib. Mineral. Petr., 173, 42, https://doi.org/10.1007/s00410-018-1469-y, 2018.
Voigt, W.: Lehrbuch der Kristallphysik, Teubner Verlag, Berlin, Germany, 1910.
Wachtman, J. B., Tefft, W. E., and Lam, D. G.: Elastic constants of rutile (TiO2), J. Res. NBS. A Phys. Ch., 66, 465, https://doi.org/10.6028/jres.066a.047, 1962.
Zhang, Y.: Mechanical and phase equilibria in inclusion-host systems, Earth Planet. Sc. Lett., 157, 209–222, https://doi.org/10.1016/S0012-821X(98)00036-3, 1998.
Zhong, X., Dabrowski, M., and Jamtveit, B.: Analytical solution for the stress field in elastic half space with a spherical pressurized cavity or inclusion containing eigenstrain, Geophys. J. Int., 216, 1100–1115, 2018.
Zhong, X., Andersen, N. H., Dabrowski, M., and Jamtveit, B.: Zircon and quartz inclusions in garnet used for complimentary Raman-thermobarometry: application to the Holsnøy eclogite, Bergen Arcs, Western Norway, Contrib. Mineral. Petr., 174, 50, https://doi.org/10.1007/s00410-019-1584-4, 2019.
- Abstract
- Introduction
- Method
- Cross-validation against a finite-element solution
- Model applications
- Non-linear elasticity at room T
- Concluding remarks and petrological implications
- Appendix A: Calculating lattice strain under entrapment conditions
- Appendix B: Calculating Eshelby's tensor
- Appendix C: Fitting the arbitrary inclusion shape with the effective ellipsoid
- Code availability
- Data availability
- Author contributions
- Competing interests
- Acknowledgements
- Financial support
- Review statement
- References
- Supplement