the Creative Commons Attribution 4.0 License.
the Creative Commons Attribution 4.0 License.
 | 28 Apr 2021
On the comparison of strain measurements from fibre optics with a dense seismometer array at Etna volcano (Italy)
Philippe Jousset
Rosalba Napoli
Charlotte Krawczyk
Michael Weber
We demonstrate the capability of distributed acoustic sensing (DAS) to record volcano-related dynamic strain at Etna (Italy). In summer 2019, we gathered DAS measurements from a 1.5 km long fibre in a shallow trench and seismic records from a conventional dense array comprised of 26 broadband sensors that was deployed in Piano delle Concazze close to the summit area. Etna activity during the acquisition period gives the extraordinary opportunity to record dynamic strain changes (∼ 10−8 strain) in correspondence with volcanic events. To validate the DAS strain measurements, we explore array-derived methods to estimate strain changes from the seismic signals and to compare with strain DAS signals. A general good agreement is found between array-derived strain and DAS measurements along the fibre optic cable. Short wavelength discrepancies correspond with fault zones, showing the potential of DAS for mapping local perturbations of the strain field and thus site effect due to small-scale heterogeneities in volcanic settings.
- Article
(6127 KB) - Full-text XML
-
Supplement
(1564 KB) - BibTeX
- EndNote


In the recent past, direct measurements of the strain field have been hampered by the complex installation and high maintenance cost of conventional strainmeters. In the best case, a few instruments are deployed in borehole, thus sensing the strain at only a few points (Currenti and Bonaccorso, 2019). Numerical investigations have clearly shown that seismic velocities, gradient displacements and strain dramatically changes at sharp boundaries and in the presence of steep topography (Kumagai et al., 2011; Jousset et al., 2004; Cao and Mavroeidis, 2019). This poses challenges in accurately interpreting strain observations when relying on only a few measurement points.
Nowadays, advances in the direct measurement of strain at an unprecedented high spatial and temporal sampling over a broad frequency range have become possible due to the growing use of distributed acoustic sensing (DAS) technology. Since the application of DAS in geoscience is an emerging field, many open questions still exist about the DAS device response and the coupling effect between the fibre and the ground, which strongly depends on the conditions of the fibre installation (Ajo-Franklin et al., 2019; Reinsch et al., 2017). A few field experiments in various environments have been designed to compare DAS strain measurements and indirect strain estimates from co-located or nearby traditional sensors, such as geophones and broadband seismometers (Jousset et al., 2018; Wang et al., 2018; Yu et al., 2019; Lindsey et al., 2020).
In this paper we compare array-derived strain with direct-strain DAS data acquired at the Etna volcano (Italy). We selected Etna as a test site for its various and frequent activity. Lava flows, explosive eruptions with ash plumes and strombolian lava fountains commonly occur from the Etna summit craters, and these multiple episodes of different styles result in a wide variety of signals (Bonaccorso et al., 2004). A dense seismic array and a 1.5 km long fibre optic cable connected to a DAS interrogator were jointly installed a few kilometres away from the summit craters to assess the reliability of DAS in recording volcano-related strain changes. To validate the DAS measurements, we explore several methods for the indirect estimates of strain field from dense seismic array data.
Several methods exist in the literature for estimating strain from high to quasi-static frequencies that are relevant for seismologic and geodetic investigations. These include the evaluation of seismic rotational components (Basu et al., 2013), the analysis of the performance of rotational seismometers (Suryanto et al., 2006), the estimation of strainmeter response and calibration (Donner et al., 2017; Currenti et al., 2017), the computation of strain rate maps (Teza et al., 2004; Shen et al., 2015), the estimation of the stress field induced by the passage of seismic waves (Spudich et al., 1995), the determination of seismic-phase velocity (Gomberg and Agnew, 1996; Spudich and Fletcher, 2008), and the estimates of wave attributes (Langston and Liang, 2008).
In general, those methods can be grouped into two main families: those relying on single- or multiple-station methods. On the one hand, the single-station method, pertinent only to seismology, has been widely used to estimate dynamic gradient displacements and strain tensors from the translational components of a 3C seismometer (Gomberg and Agnew, 1996). It assumes that seismic energy is carried by plane waves with a known horizontal velocity in a laterally homogeneous medium. On the other hand, multiple-station procedures involve the use of displacements or velocity recordings from a number of close sensors (at least three; Basu et al., 2013; Currenti et al., 2017) or dense arrays (from tens to thousands of sensors, with short spacing covering tens to hundreds of metres). The density and number of stations depends on the objectives of the array (Basu et al., 2017). In such cases, the measurements are processed using spatial interpolation approaches (Sandwell, 1987; Paolucci and Smerzini, 2008; Sandwell and Wessel, 2016) or the well-known seismo-geodetic method (Spudich et al., 1995; Shen et al., 2015; Teza et al., 2004; Basu et al., 2013). Aside from the use of geostatistical approaches, which are generally applied for optimal interpolation of a discrete scalar field, several interpolation schemes have been formulated using the solutions of suitable elasticity problems (Sandwell, 1987; Wessel and Bercovici, 1998; Paolucci and Smerzini, 2008). A complete review of these latter methods can be found in Sandwell and Wessel (2016). In the same paper, the authors, following the biharmonic spline method (Sandwell, 1987), proposed a new solution in which the interpolation functions originate from the computations of the analytic Green's solutions of an elastic body subjected to in-plane forces. Finally, the seismo-geodetic method is based on the Taylor expansions of the displacements field of first- (Spudich et al., 1995) or higher-order derivatives (Basu et al., 2013). Both interpolation and seismo-geodetic methods have been used for seismic dynamic and geodetic quasi-static strain estimates. While the single-station procedure estimates the strain at the single position of the collocated sensor, the other two methods allow deriving a map of strain on irregularly distributed points by making use of sensor array measurements. This makes the multiple station approach appropriate to estimate strain using dense seismic array methods and compare it with values derived from DAS along the fibre cable.
Here, we extend the interpolation method proposed by Sandwell and Wessel (2016) and use the seismo-geodetic method in the formulation by Shen et al. (2015) in order to derive strain estimates from the dense seismic array data acquired at Etna. The aim of the paper is twofold: (i) exploring the performance of interpolation and seismo-geodetic methods in deriving the strain field along a fibre optic cable and (ii) validating the DAS measurements acquired during the experiment at Etna volcano.
We designed the experiment in Piano delle Concazze at the Etna summit (Fig. 1) in order to test the potential of the DAS technology in a volcano-seismology application.
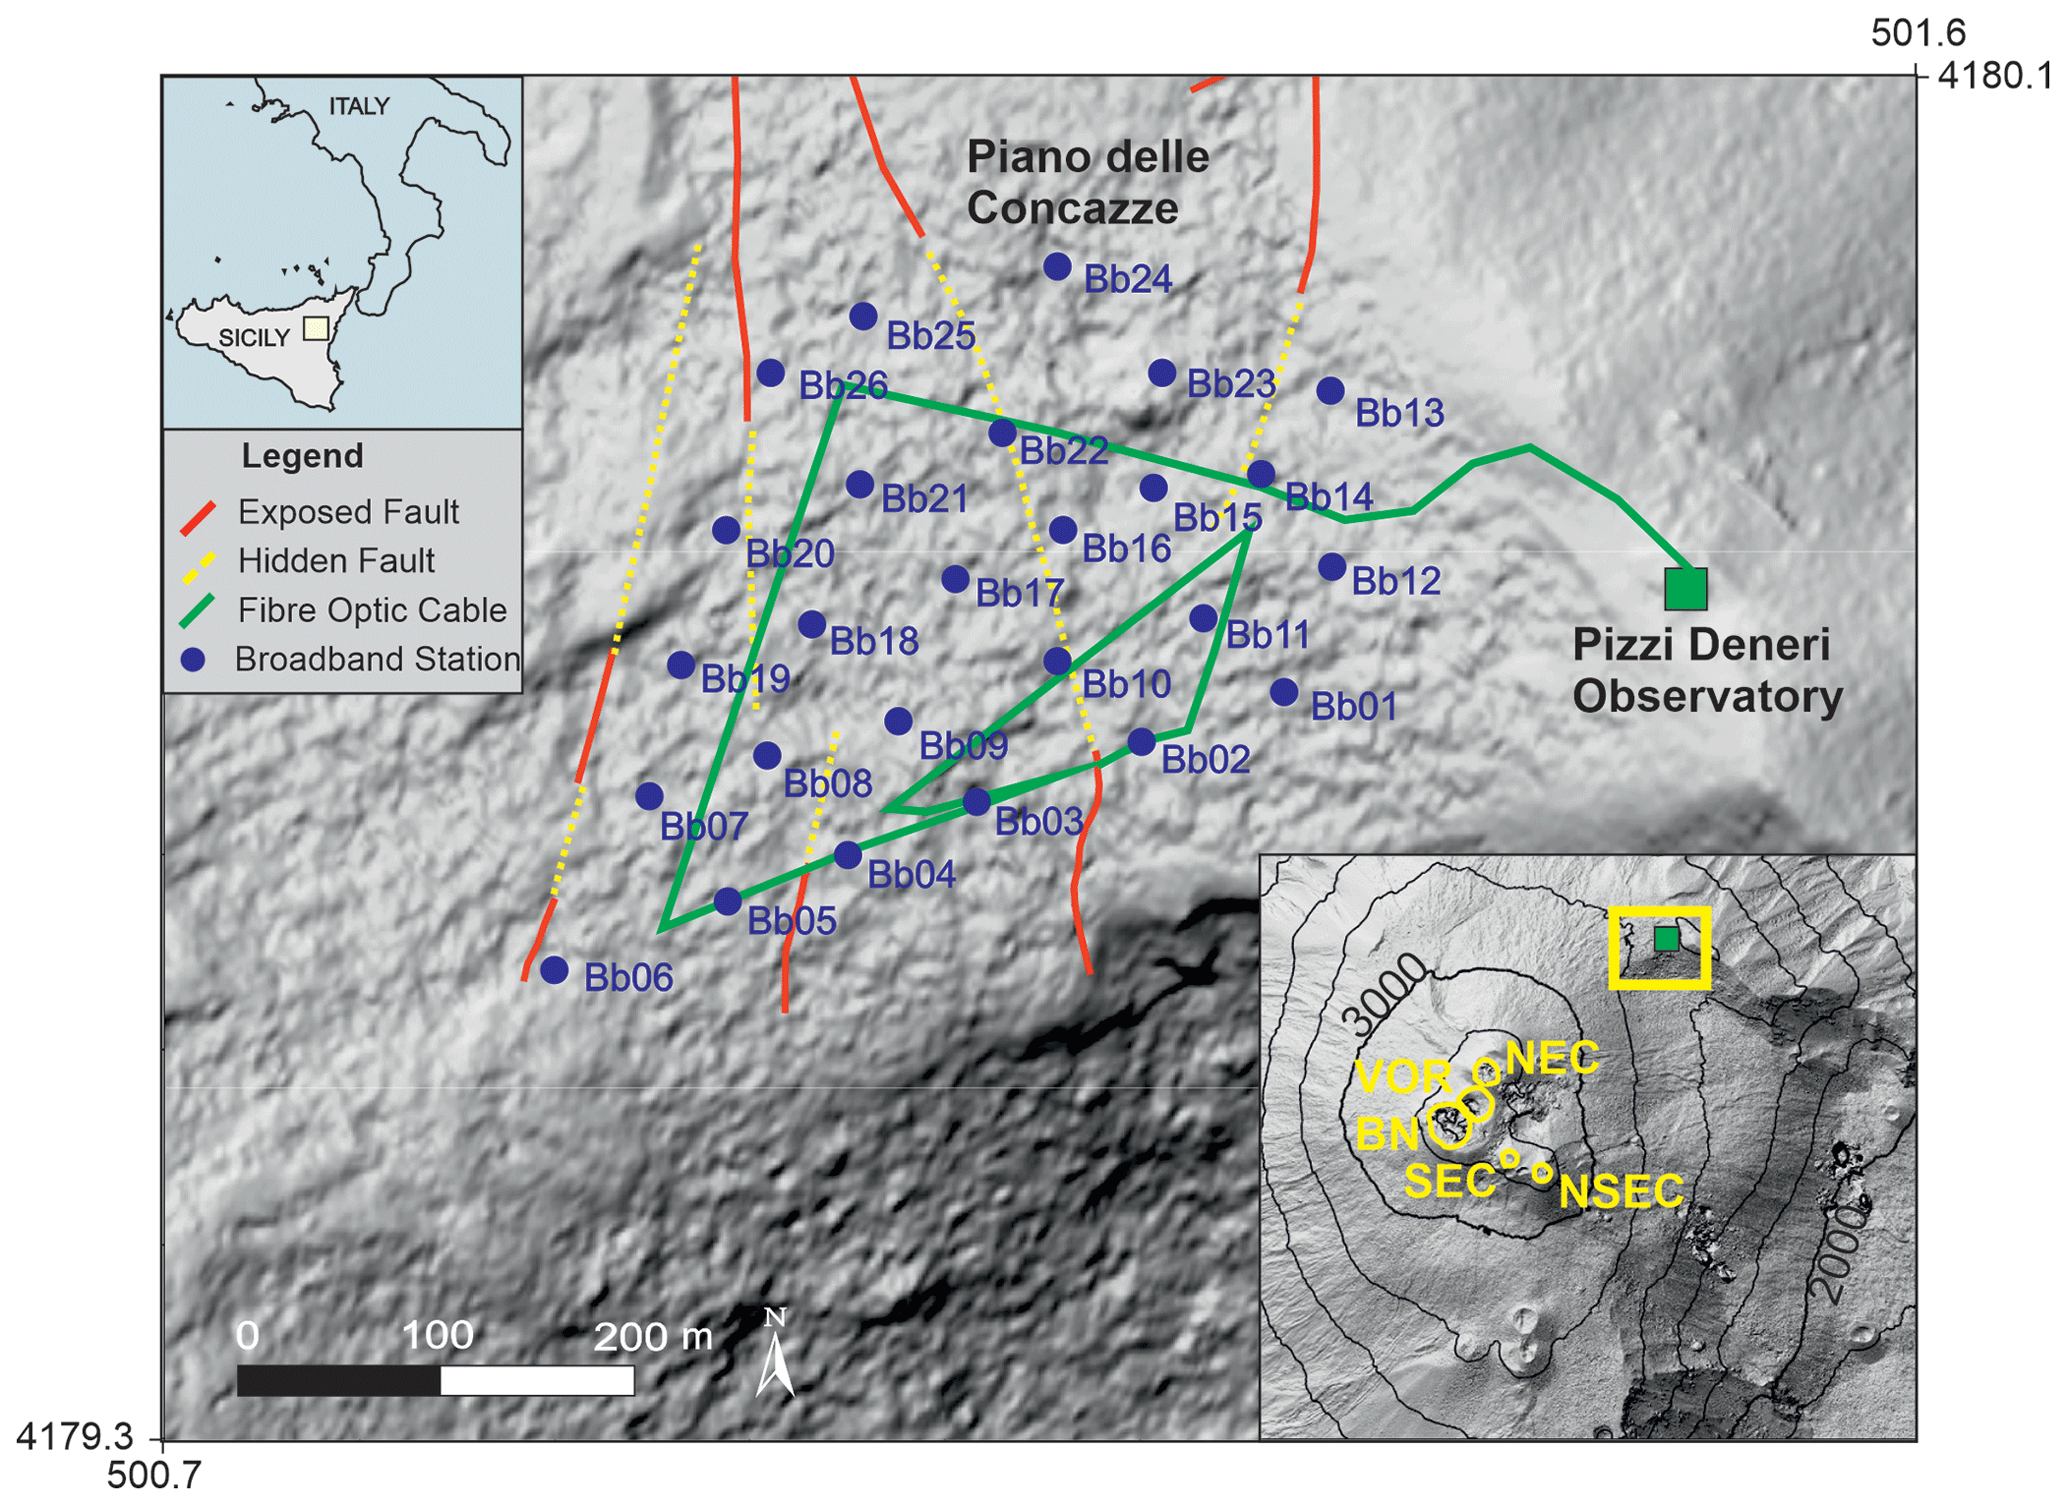
Figure 1Digital terrain model of Piano delle Concazze on the north-eastern flank of the Etna volcano (Palaseanu-Lovejoy et al., 2020) with the dense broadband seismic array (26 stations; Bb01–Bb26) and distributed acoustic sensing (DAS) cable layout. The DAS cable geometry is designed in order to record dynamic strain changes along several directions. No data were recorded by station Bb05 because of a technical problem. The DAS interrogator was hosted inside the Pizzi Deneri Observatory, which is about 2 km away from the five summit craters (North East: NEC; Voragine: VOR; Bocca Nuova: BN; South East: SEC; New South East: NSEC). The investigated area, which is almost flat, is crossed by a sub-vertical fault system (redrawn following Azzaro et al., 2012). Geographic coordinates (in kilometres) are in the UTM33S system.
Deployment of equipment on active and dangerous volcanoes is challenging due to the harsh environment and the danger associated with the volcanic activity. Piano delle Concazze is a large flat area (elevation of about 2800 m) on the northern upper flank of the Etna volcano that is dominated by the North East Crater. It is bounded by the upper extremity of the North-East Rift, a preferential pathway for magma intrusions due to its structural weakness (Andronico and Lodato, 2005), and by the rim of the depression of the Valle del Leone. The area is affected by several north–south-trending faults that result from the accommodation of the extension exerted by the North-East Rift (Azzaro et al., 2012; Napoli et al., 2021). Therefore, Piano delle Concazze is an area where this new methodology can be tested and is close enough to the active craters to study volcanic processes (ca. 1.8 km away from the Etna summit craters) while still being safe.
In order to record strain changes related to volcanic activity, we jointly deployed the following instruments in Piano delle Concazze (Fig. 1).
-
A 1.5 km long fibre connected to a DAS interrogator (“Ella”, an iDAS® from Silixa) set up in Pizzi Deneri Observatory. We interrogated the fibre from 1 July to 23 September 2019. A long trench was dug to deploy the fibre cable at a depth of about 40 cm. At a sampling rate of 1 kHz, the DAS acquired the strain rate along the axial direction of the cable with a spatial resolution of 2 m and a gauge length of 10 m. This results in a dataset of 824 channels distributed along the fibre path. The spatial calibration and locations of the fibre channels were determined by jumping at several points near the fibre with jumping locations determined by GPS. The positions of the channels between the two successive jump locations were computed by linear interpolation.
-
A dense seismic array comprised of 26 Trilium Compact 120 s broadband sensors (inter-station distance of about 70 m) distributed over an area of about 0.2 km2 (Fig. 1). The sensors were placed at a depth of about 40 cm in the compacted pyroclastic deposit. A CUBE digitiser was used to acquire the data at a sampling rate of 200 Hz.
We designed the broadband sensor distribution and the path of the fibre optic cable such that we could compare both records with several methods.
We estimate the strain field from the seismic array data using two different algorithms. The first is a new spatial interpolation method, in which we extend the work presented in Sandwell and Wessel (2016). The second is the seismo-geodetic method in the formulation proposed by Shen et al. (1996, 2015). For both methods the description and the analysis are limited to the 2D domain, since the investigated area is almost flat. However, extension to 3D is straightforward.
3.1 Spatial interpolation method
In the spatial interpolation method (SIM) proposed by Sandwell and Wessel (2016), the general solution of the horizontal displacement components u and v at any location r within a N-element seismic array is given by
where q, p and w are the analytical Green's functions (Sandwell and Wessel, 2016), which solve the quasi-static balance equation of an elastic body subjected to in-plane body forces fx and fy applied at the station location rj. The Green's functions read as follows:
where r is the distance between the location r and the rj station position and υ is the Poisson's ratio. Starting from these deformation solutions we derive the strain field ε, which reads as follows:
where the gradients of the functions q, p and w are given by
We determine the body forces applied at the N locations of the array stations so that they match the displacement data using Eq. (1). Therefore, we solve for a set of N vector body forces fx, fy with j=1…N by setting up a 2N×2N linear system of equations constrained by the horizontal displacement field recorded by the broadband seismic array. By solving the linear system, the body forces are determined and the components of the strain tensor can be computed at the location of the fibre channel using Eq. (3). To avoid the singularity in the computation of the Green's functions (Eqs. 4), a Δr distance factor is added to the distance term r (Sandwell and Wessel, 2016).
3.2 Seismo-geodetic method
The seismo-geodetic method (SGM) is based on the Taylor expansion of the displacement field and has been applied using different assumptions and strategies that lead to very similar formulations (Spudich et al., 1995; Shen et al., 1996; Teza et al., 2004; Langston and Liang, 2008; Basu et al., 2013; Langston, 2018). Here, we follow the formulation proposed in Teza et al. (2004). The displacement components ui(xk,yk) with , recorded at the kth station are expanded with first derivative terms as follows:
where the first term ui(xP,yP) is the ith displacement component and the second and the third terms are the gradient displacements at a point P(xP,yP), respectively. By computing this expression for the N stations of the array, a linear system of N equations is derived, Gm=d, whose solution provides the displacements and their gradient at the point P. If the displacement gradients are rewritten in terms of symmetric and rotational strain components, the system of equations read as follows (Shen et al., 2015).
The vector of the unknowns m (T indicates the transposition operator) is composed of the horizontal displacements, the strain tensor components and the rotation. The vector d is formed by the observed displacements at the stations of the array, and Δxi and Δyi are the relative positions between the ith station and the point P. In the first-order Taylor expansion, the computed displacement gradients are constant (Basu et al., 2013; Shen et al., 2015), and hence the estimated strain tensor is spatially uniform over the entire extent of the array. Therefore, this method provides one representative value within the whole seismic array. To overcome this limit, a distance-weighted approach is introduced that locally weights the data on the basis of the relative distance Ri between the station and the point P (Shen et al., 2015). The diagonal terms of the weighting matrix are computed as exponential functions where D is a spatial smoothing parameter. The system of equations is solved using a weighted least-squares approach . The advantage of this method with respect to the Spudich (1995) formulation is that the displacement and the strain fields can be interpolated at any point P within the array without the need for defining a reference station.
3.3 Strain computations along fibre cable axial direction
Using one of the above methods, the strain tensor is computed at all channels of the fibre and is projected along the local fibre direction to compute the local axial strain. Both procedures are iterated at each time step to obtain the time series of dynamic strain at all the channels of the fibre using the time series of the seismic array.
The accuracy of the array-derived strain estimates is limited by the inter-station distance L. The error of the strain estimate is given by , where λ is the signal wavelength (Bodin et al., 1997; Spudich and Fletcher, 2008). Therefore, an accuracy of 90 % is achievable if the dominant wavelength is larger than about 4 times the inter-station distance (Spudich and Fletcher, 2008, and reference therein). Considering that in Piano delle Concazze the average apparent velocity Va is not greater than 2 km s−1 (Saccorotti et al., 2004), we can deduce that the strain estimates can be derived from the seismic array data with a good accuracy up to a frequency , i.e. of about 7 Hz, for the average station distance of 70 m. It is worth noting that the accuracy of the solution is dependent on the factor , which is the same multiplicative factor giving the DAS response to axial strain over a gauge length of L (Bakku, 2015). This multiplicative factor comes, however, from two independent analyses based on the estimate of strain under spatially uniform approximation (Spudich and Fletcher, 2008) for the interpolation methods and the computation of average strain over a gauge length L (Bakku, 2015).
The SIM and SGM depend on the choice of some parameters that need to be tuned in order to obtain optimal solutions. They are the Poisson ratio and the Δr distance factor for SIM and the spatial smoothing parameter for SGM. For both methods, the parameters are tuned by performing a simple grid search with the aim to improve the fitting between observed and estimated strain. When comparison with direct measurements of strain cannot be carried out, the tuning is performed on the deformation data by a “boot-strapping” method, i.e., omitting one sensor from the computation and then, after calculating the displacement at the same station, comparing the recorded and interpolated displacements (Paolucci and Smerzini, 2008). For the SIM, the more sensitive smoothing parameter is the distance factor introduced to avoid singularities in the analytical solutions. The smaller it is, the sharper the solution. For the SGM, the smoothing parameter D weights the relative contribution of the station with distance in the weighted least-squares inversion. The smaller it is, the lower the influence of the station at larger distances will be. So both of them locally average displacement and filter the signal as a function of wavelength. Smaller distance-smoothing parameters are adapted for shorter wavelengths, whereas larger ones may perform better for longer wavelengths.
During the acquisition period, Etna volcanic activity was mainly characterised by discontinuous strombolian explosions and isolated ash emissions from most of the active summit craters (North East, New South East, Bocca Nuova and Voragine) at a distance of about 2 km from Piano delle Concazze (Fig. 1). These activities, occurring at fluctuating intensity, preceded and accompanied the short-lived effusive eruptions on 18 and 27 July 2019 from the New South East Crater (NSEC) and continued until the end of the experiment. A wide variety of signals have been recorded, e.g. volcanic tremors, LP events, volcanic explosions, teleseismic and local seismic events. In order to validate the DAS records with the approaches described above, here we focus our analysis on classes of events with a frequency content less than 6 Hz. Among the several signals, we selected two types of events (Fig. 2): (i) a volcanic explosion (VE) accompanying the strombolian activity at NSEC on 6 July 2019 and (ii) a long-period event (LP) on 27 August 2019 preceding the intensification of the eruptive activity at the summit craters in early September 2019. In agreement with other similar events recorded at Etna (Cannata et al., 2009), the spectra show frequency contents in the range 0.1 to 1 and 1 to 5 Hz for the LP and the VE events, respectively. Both broadband and DAS signals are filtered with a third-order Butterworth filter. The integration of DAS data over time provides the strain along the fibre optic cable. Data are down-sampled from 1 kHz to 200 Hz for direct comparison with strains derived from broadband array signals.

Figure 2Time series of DAS strain during a small volcanic explosion (VE) at Etna on 6 July 2019 (a, b) and during a long-period (LP) event on 27 August 2019 (c, d). The DAS strain is computed by integrating the DAS records over time. Data are filtered in the frequency range 1 to 5 Hz for the VE event (a, b) and between 0.1 and 1 Hz for the LP event (c, d). (b, c) The broadband velocity at station Bb04 (black line in b and d), located in proximity of the DAS channel 501 (red line in b and d), is projected along the cable direction to compare the data using the single-station procedure. An average scaling factor of 1 s km−1 for the slowness value is found in both cases.
Some of the broadband seismometers (e.g. Bb02, Bb03, Bb04) are co-located with the fibre optic cable (distance of less than 1 m). This configuration also enables the application of the single-station method, which under the plane wave assumption relates the DAS strain at the nearest channel with the broadband particle velocity as , where , and p are the strain, the particle velocity, and the horizontal slowness (i.e. the inverse of the apparent wave propagation velocity) along the cable axial direction x, respectively. In Fig. 2 we report the comparison between the DAS strain at the nearest channel, here channel 501, and the particle velocity at station Bb04. A horizontal slowness of about 1 s km−1 is estimated to optimally scale the particle velocity and match with the strain. For both events a generally good agreement is achieved (Fig. 2b and d). This single-station method is appropriate to estimate the strain only at the position where the seismometer and the cable are co-located. Because of the high spatial variability of the strain along the fibre optic cable (Fig. 2), we attempt to estimate the strain at all channels using the multiple-station methods described in the previous section.
Velocity data are first integrated over time to derive the displacement field, which is then used in the SIM and SGM methods. Residuals, in terms of RMSE (root-mean-square error) misfits, are computed between DAS strain measurements and the strain derived from the seismic array. The RMSE values computed along the fibre give a local estimate of their respective discrepancy (Figs. 3 and 4).
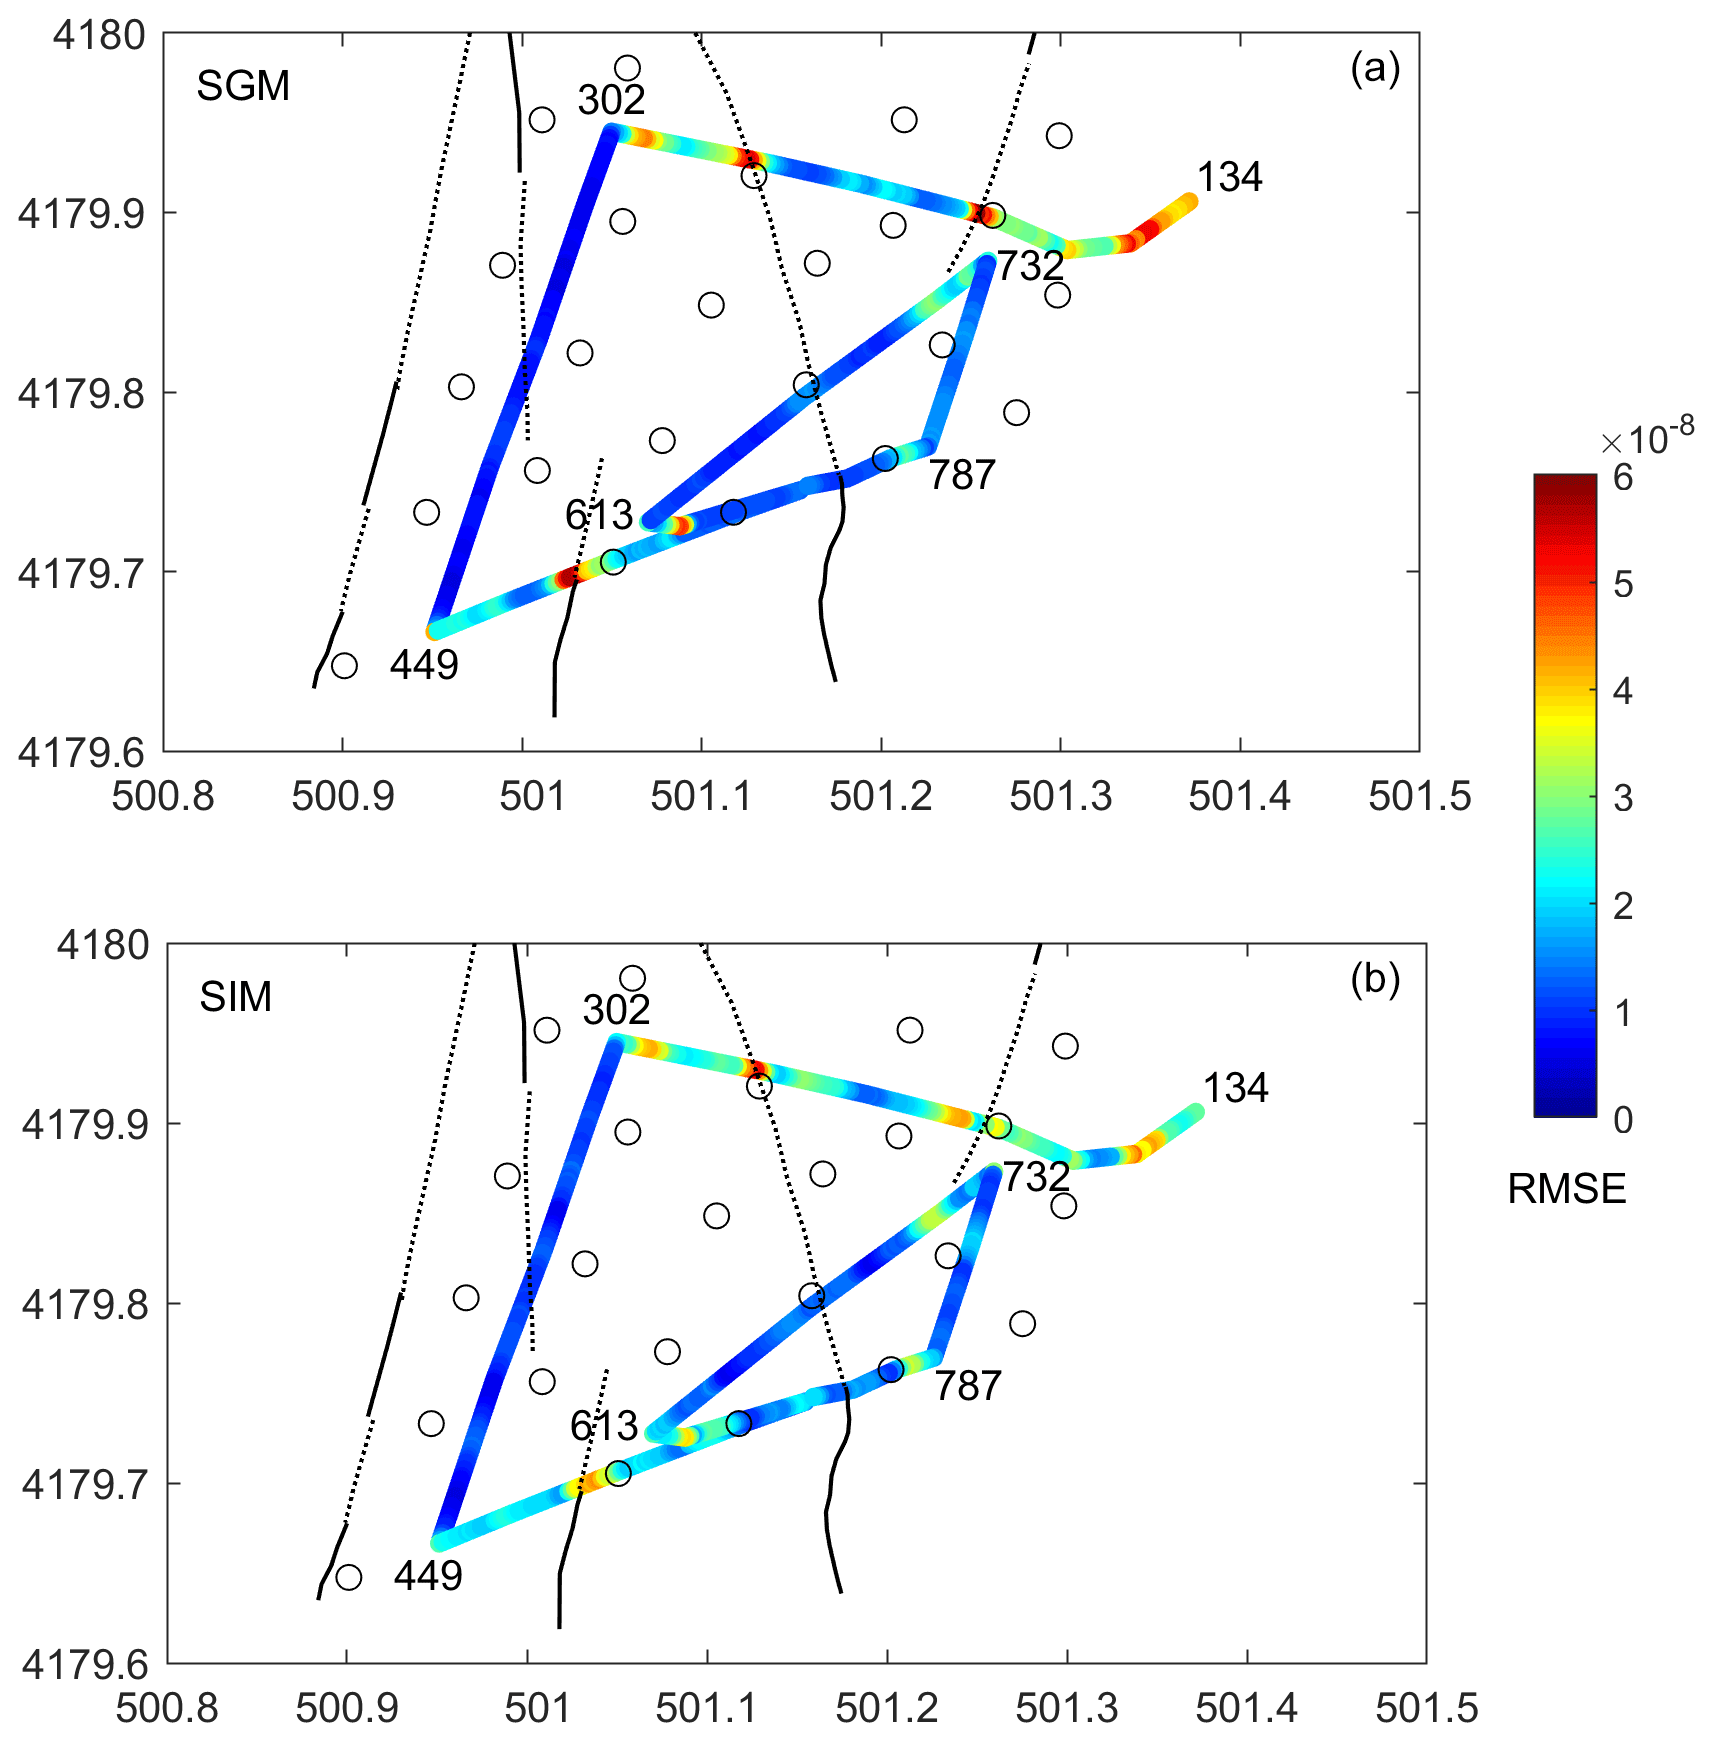
Figure 3RMSE residuals between DAS strain measurements (Fig. 2a) and the strain derived from the seismic array along the fibre for the VE event. (a) DAS vs. the seismo-geodetic method (SGM). (b) DAS vs. the spatial interpolation method (SIM). Black lines and open circles indicate faults and seismometers shown in Fig. 1, respectively. The numbers refer to the fibre channel indices at the main cable corners. For more details, see the text.
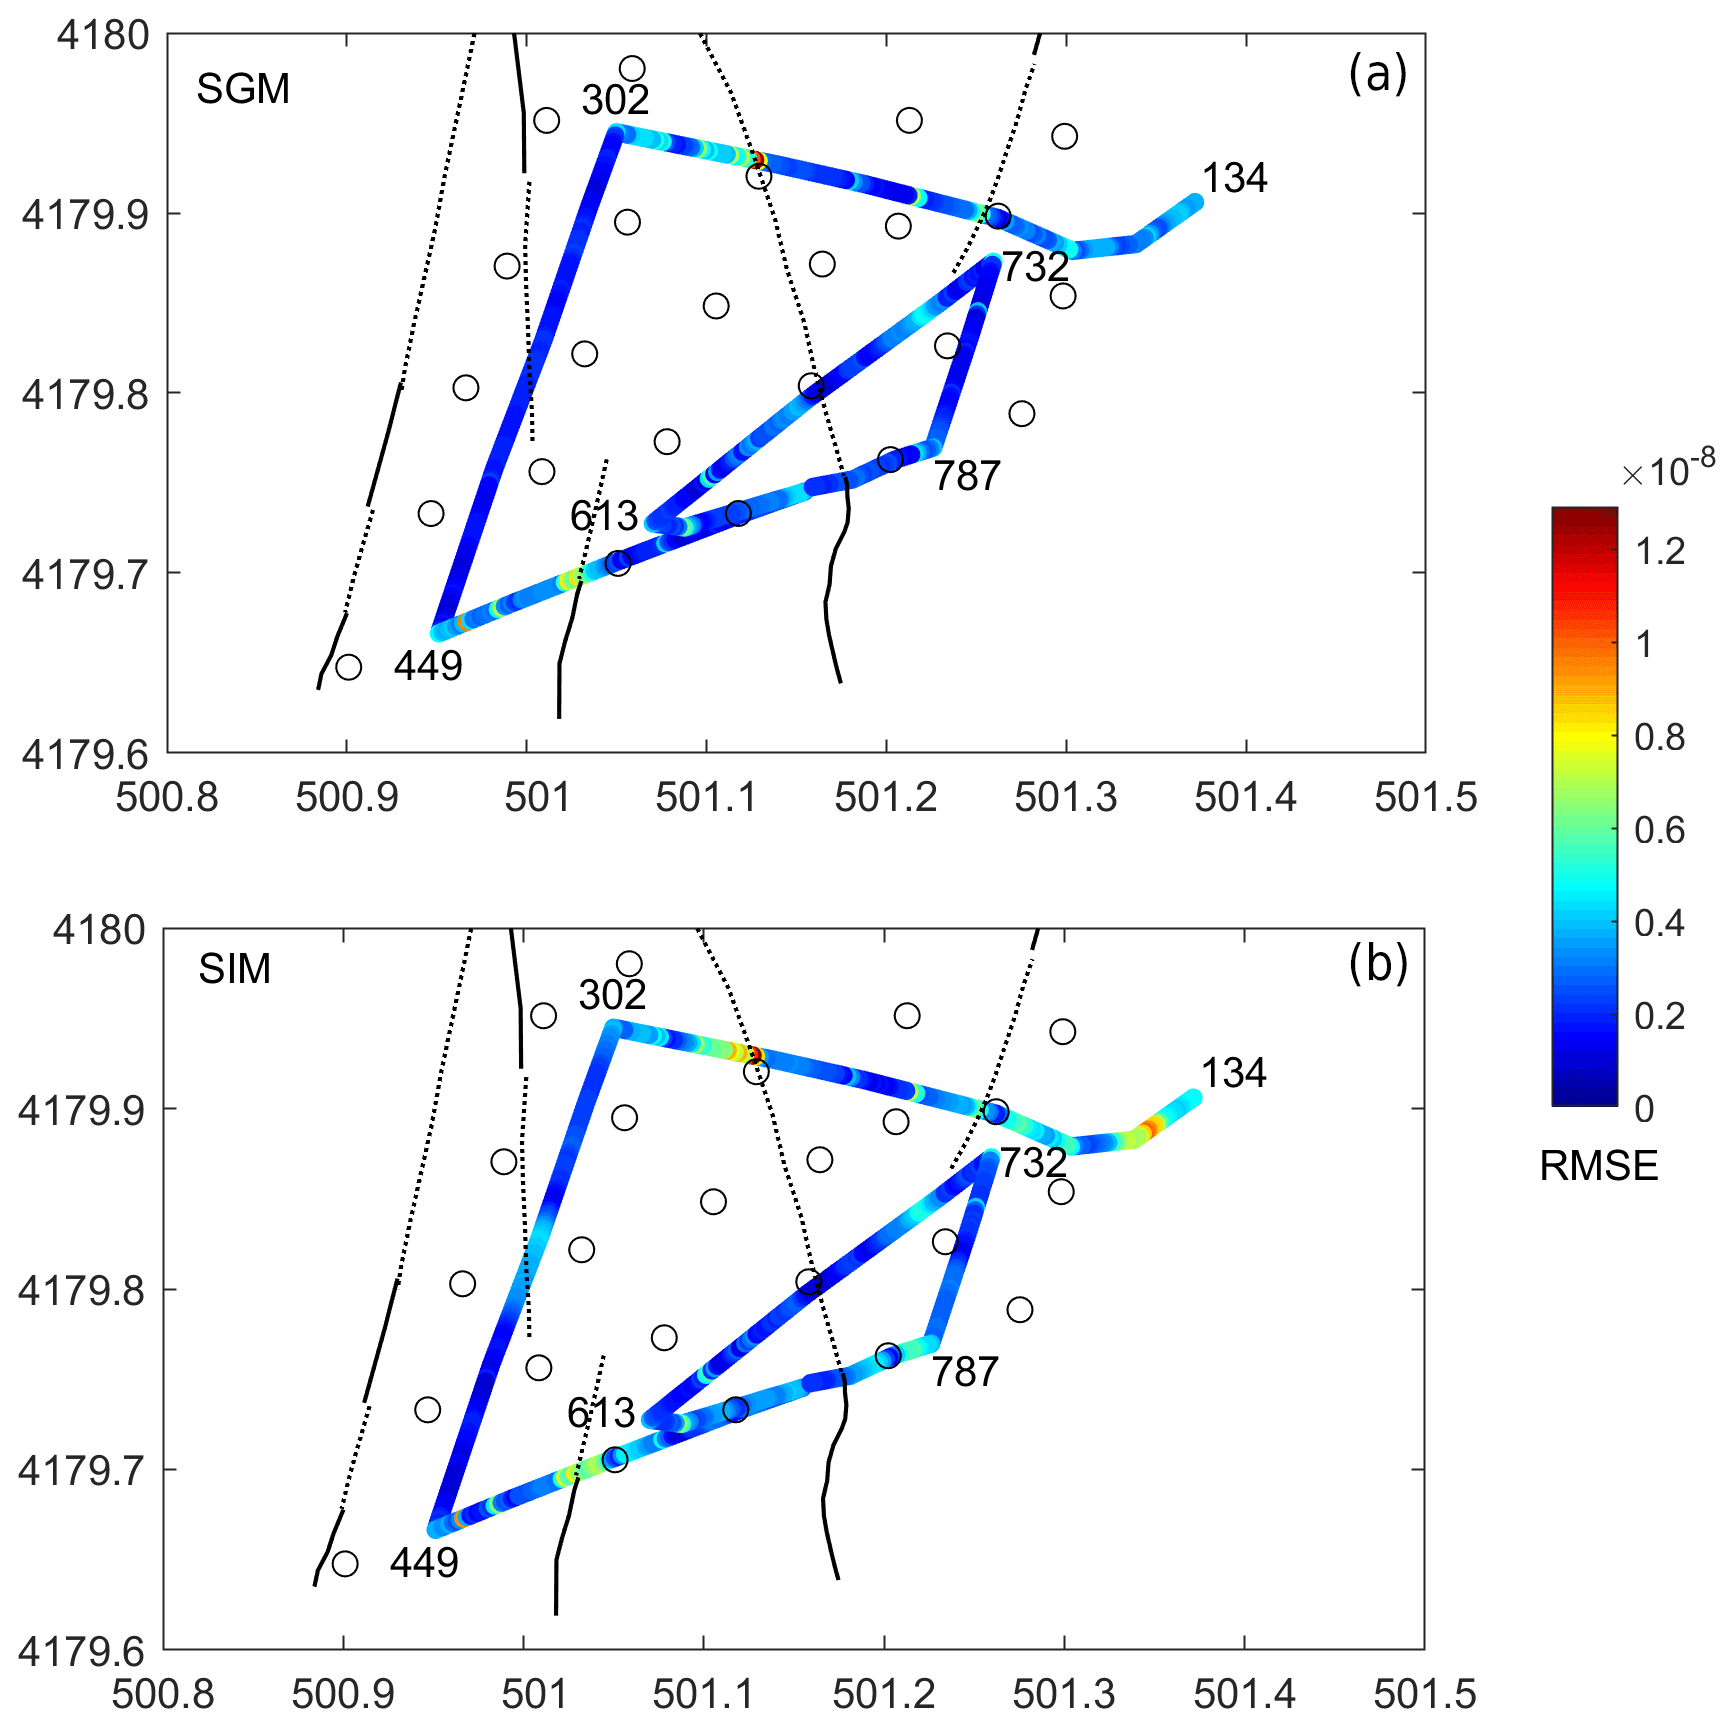
Figure 4RMSE residuals between DAS strain measurements (Fig. 2c) and the strain derived from the seismic array along the fibre for the LP event. Black lines and open circles indicate faults and seismometers shown in Fig. 1, respectively.
The SGM depends strongly on the spatial smoothing parameter D (see above). Therefore, we performed several computations by varying the D parameter and selected the value at which the cumulative RMSE is minimised (Fig. 5). A minimum RMSE is found with a D value of 75 and 100 m for the VE and LP events, respectively. Similar exploration in the parameter space was performed for the SIM, which depends on the Δr distance factor. Here the best fit for Δr was found for a value of 20 and 10 m for the VE and LP event, respectively. An additional search was also carried out on the Poisson's ratio to improve the fit. We tested a range of Poisson ratio from −1 (fully decoupled) to 0.25 and 0.5 (elastic) to 1.0 (incompressible). By comparing the misfits, the solutions with a value of 0.25 was chosen.
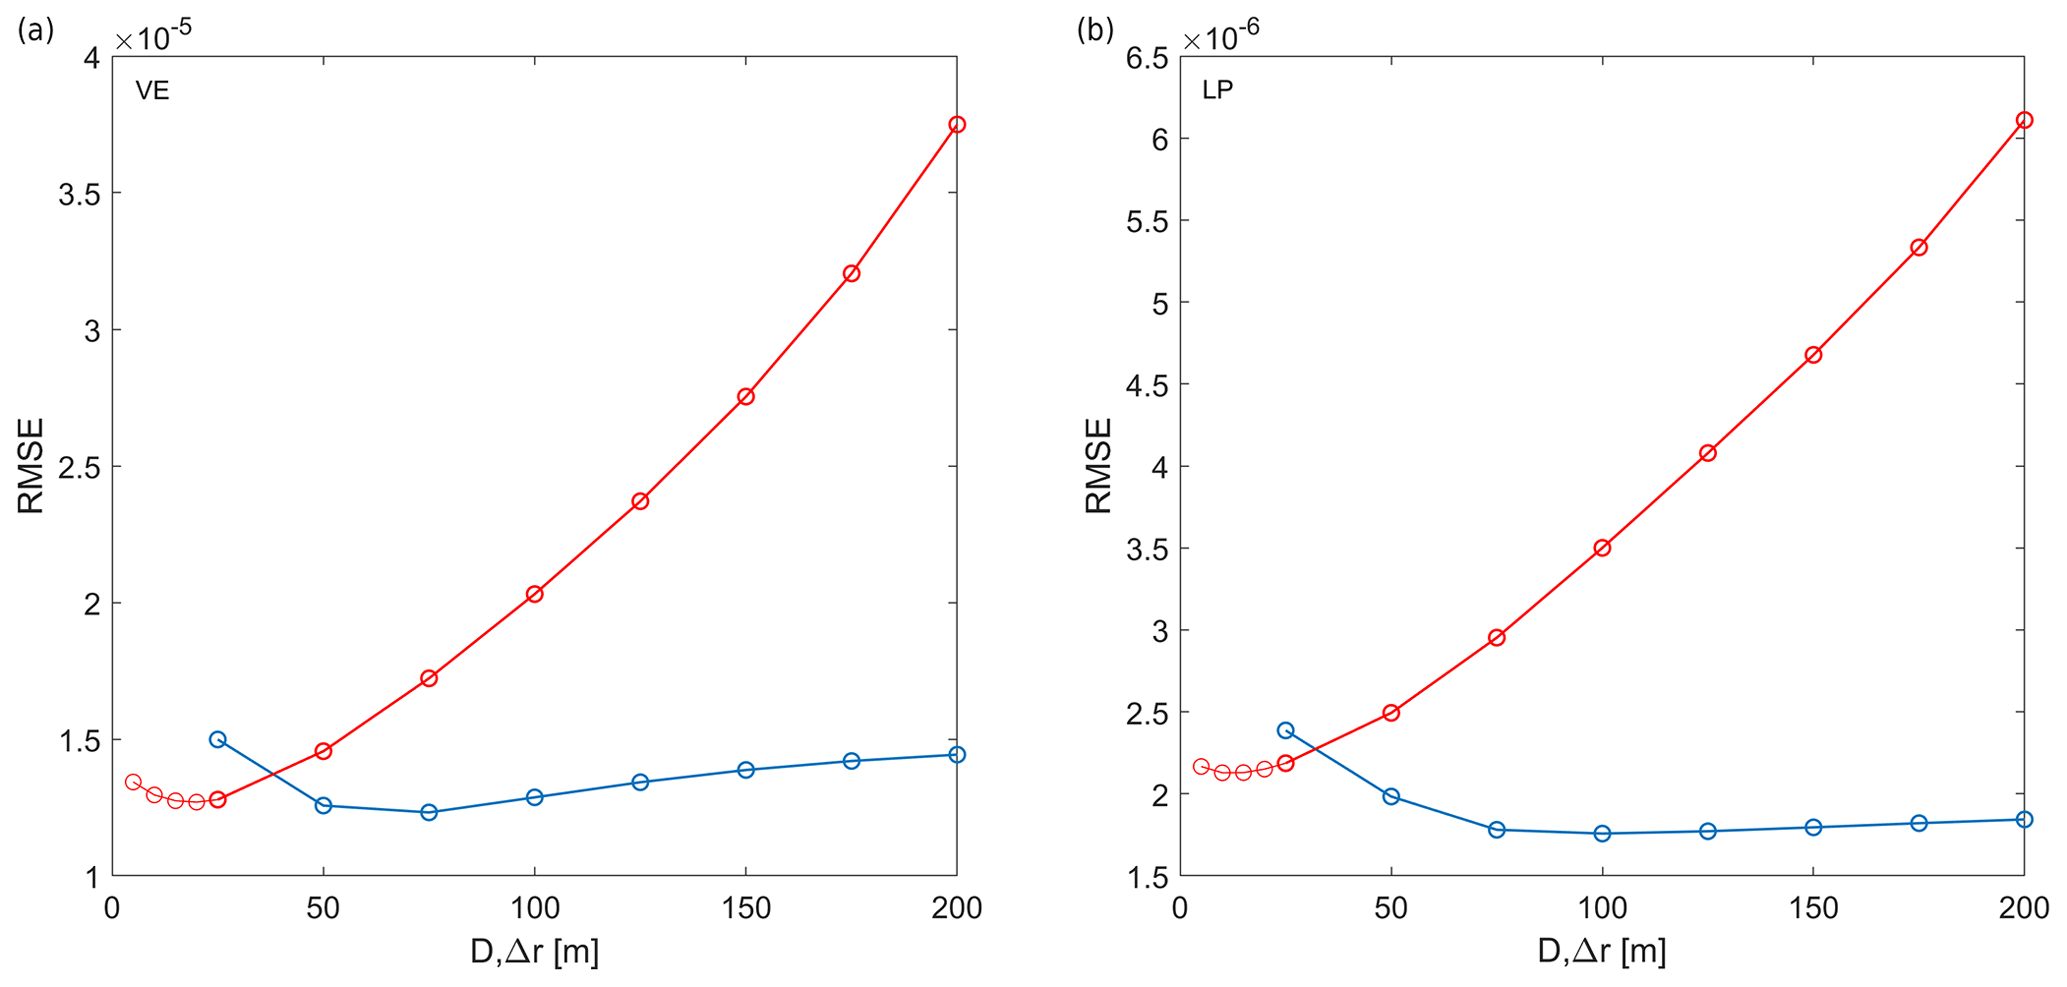
Figure 5Cumulative residuals over all fibre channels between DAS strain measurements and strain derived from SGM (blue line) and from SIM (red line) for different smoothing parameters (D for SGM and Δr for SIM, respectively). Computations are performed for the VE (a) and LP (b) events, respectively.
An overall good match is achieved for both methods (SGM and SIM) along the fibre. Higher RMSE misfits concentrate at the corner points, where the cable direction turns abruptly and the axial strain is locally disturbed. Larger misfits are also visible along the two nearly EW (east–west) branches (channel 134–302; 449–787), where the strain wave field (Figs. 2 and S1–S2 in the Supplement) is more complex and amplified with respect to the nearly NS (north–south) branch (channel 302–449). Furthermore, discrepancies are also observed in regions where the fibre crosses fault zones (Figs. 3 and 4). The amplitude of the array-derived strain estimates in the fault zone is mostly underestimated.
We investigated several methods for indirect strain estimates from dense seismic array data, aiming at the assessment of DAS records. After a straightforward recasting and derivation of equations, we compared the SIM and the SGM methods for the estimates of strain fields from dense array data, which, in similar forms, have been applied in several fields of seismology and geodesy. To our knowledge, these approaches are adapted and tested on DAS data for the first time here.
SIM and SGM offer some advantages over single-station methods. Both provide a direct comparison between strain data and their estimates from velocity data, without any assumption on the local-phase seismic velocity as required by single-station procedure. Specifically, when media are dispersive, the assumption of a constant phase velocity is possibly prone with errors. Usually, and especially in volcanic areas, the estimate of a phase seismic velocity is challenging because of the presence of strong heterogeneity and fractured zones. Specifically, at Piano delle Concazze the phase seismic velocity varies markedly along the fibre cable because of the local complex structural geology that is characterised by a lava flow succession interbedded with volcaniclastic products (Branca et al., 2011) and by sub-vertical north–south trending faults affecting the superficial layers up to a maximum depth of about 40 m (Azzaro et al., 2012; Napoli et al., 2021).
Indeed, our results highlight strong discrepancies between direct DAS measures and indirect strain estimates in coincidence with fault zones (Figs. 3, 4). Thanks to the high spatial resolution of the DAS records, it is possible to observe how small-scale soil structure heterogeneities affect strain. Local strain perturbations are much shorter in wavelength (a few tens of metres) with respect to the wavelength resolution of the array (λ>200 m). The seismic wave field is distorted by the local geological structural features with clear amplifications of strain in correspondence to fault zones (Fig. 2). This agrees with the amplification of DAS strain observed in the proximity of faults in the DAS experiment carried out in Iceland (Jousset et al., 2018; Schantz, 2020) and at Etna (Currenti et al., 2020; Jousset et al., 2020). These findings clearly show that complex site effects introduced by lateral heterogeneities may increase the strain significantly with respect to simplified evaluations and may underestimate such effects severely. These results emphasise the potential of the use of the DAS technique to both characterise and monitor local strain in the vicinity of fault zones by providing a direct measure of strain at a spatial sampling unachievable even with large N arrays. However, local strain perturbations are not found at all of the positions where the fibre cable crosses the fault systems (Figs. 3, 4). Discerning the cause of the dissimilar response of the ground is hindered by the limited geological characterisation of the area. Further investigation with complementary geophysical exploration methods could help in understanding the different behaviour at different locations.
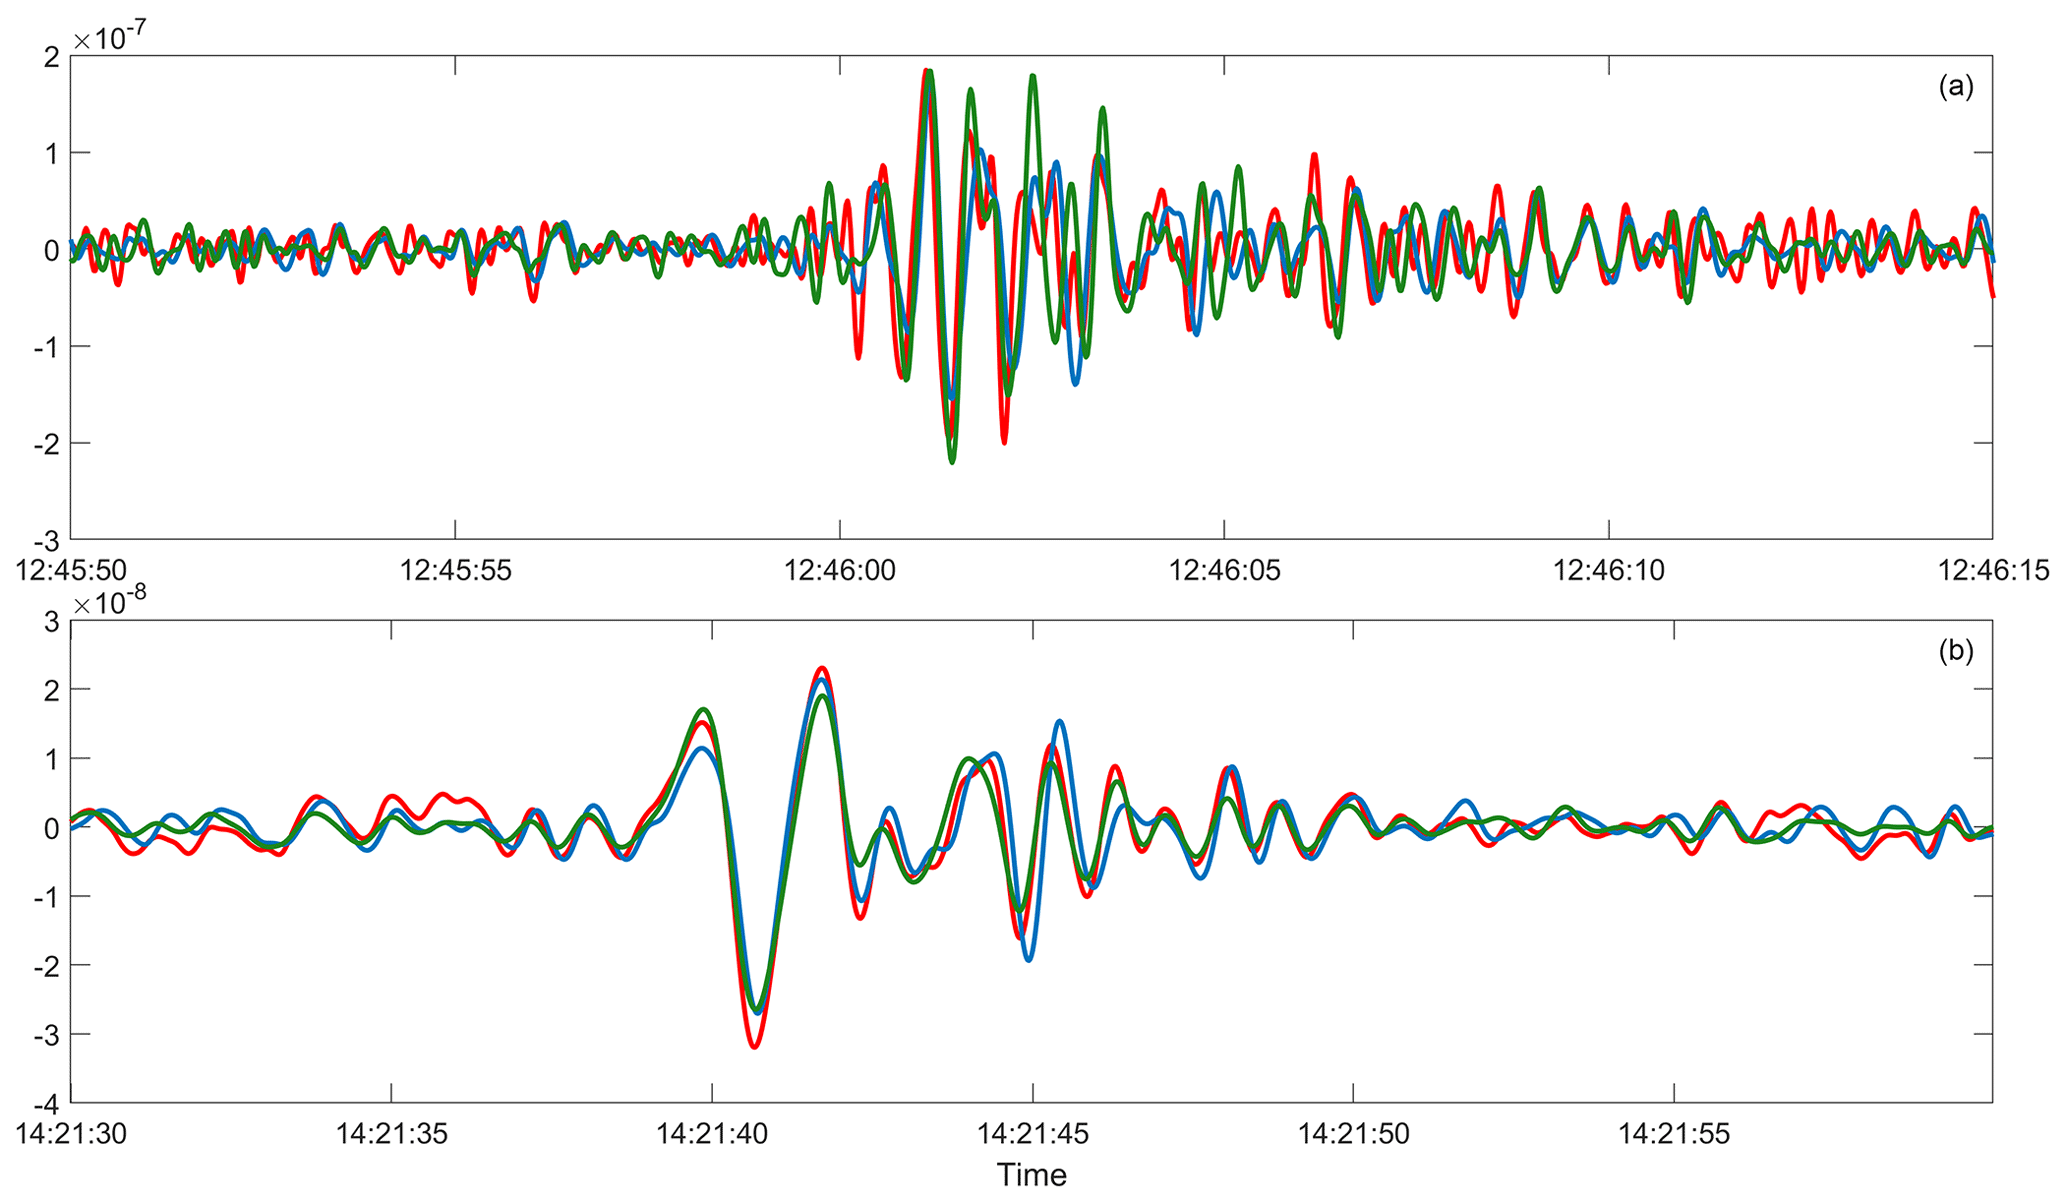
Figure 6Array-derived strain estimates at station Bb04 (Fig. 1) using the SIM (green line) and the SGM (blue line) in comparison with DAS strain data (red line). Computations are performed for the VE (a) and LP (b) events.
The discrepancies are higher for the shorter wavelength signal recorded during the VE event with respect to the LP event (Figs. 6, 7), for which good estimates are obtained at almost all channels (Figs. 4, 8). Indeed, as already noted in Currenti et al. (2020), explosive events excite more phases due to scattering and reflection on faults and layered geology (Figs. 2 and S1). The discrepancies are larger in the nearly EW branches, possibly due to the relative direction between the main structural geology and the cable branches. For the longer wavelengths (e.g. LP event), SIM and SGM (Fig. 6) perform better than the single-station approach (Fig. 2).

Figure 7Strain estimates over all fibre channels using SGM (a) and SIM (b) for the VE event. The solutions with the minimum RMSE are chosen, respectively (Fig. 5).

Figure 8Strain estimates over all fibre channels using SGM (a) and SIM (b) for the LP event. The solutions with the minimum RMSE are chosen, respectively (Fig. 5).
We also attempt to investigate how the gauge length may average out the effect of the small-scale heterogeneities by virtually increasing the gauge length with a spatial average of DAS data. We report the analysis on the VE event (Figs. S3–S8), where the effect of increasing the gauge length from 10 to 30 and 100 m is more significant due to the higher-frequency content. Indeed, as expected, at higher gauge lengths the shorter wavelengths are filtered out (Fig. S3, S6). We used two averaging approaches: (i) a simple average over channels (Figs. S4, S7) and (ii) a moving average with a shift of 1 channel (Figs. S5, S8). With a gauge length of 30 m, the simple average degrades the signals and the main phases are already lost. On the other hand, the moving average preserves the main signal but smooths out local scattering and reflections that are no longer visible. When computing the misfit with the array-derived strain estimates (Figs. S4–S8), the localised anomalies (Fig. 3) in coincidence of the faults due to the small-scale heterogeneities are flattened and broaden. These findings confirm that the distortion of the strain field is very localised and difficult to observe via traditional seismic array methods, which require deployment of very dense network along “well-chosen active faults and a good amount of luck” (Cao and Mavroeidis, 2019).
Both methods allow for estimating strain on points distributed irregularly exploiting all the available dataset instead of relying on a single-point measure (Figs. 7, 8). Moreover, the derivation of the analytical strain solutions in the SIM (i) avoids using the finite-difference scheme to derive strain from regular grid point distribution of displacements and hence (ii) provides the strain at any point of the investigated area once the body force coefficients have been estimated by solving the linear system of equations. This results in a greater accuracy.
Finally, the proposed approaches offer the possibility to combine seismic array data with DAS measures to derive a 2D map of the local strain of the investigated area. By recasting the system of linear equations, it is straightforward to include the DAS strain measures and perform a joint inversion.
The joint deployment of a DAS device and of a dense seismic array at Etna summit offers a unique opportunity to observe and accurately quantify strain changes related to volcanic activity. The dataset recorded during summer 2019 showed the great potential of distributed fibre optic sensing in a volcanic environment. To our knowledge this is the first time that tiny strain changes related to volcanic explosions and LP events have been clearly recorded by DAS technology, opening new perspectives for its use in volcano monitoring. The high spatial sampling of DAS measurements confirms the high variability of strain variations in complex geology and may offer a great opportunity to study soil response. These findings also contribute in explaining the difficulties often encountered in interpreting local strain changes from single strainmeter observations. The indirect strain estimates derived by the dense seismic array match quite well with the direct DAS measurements. Our findings validate both the proposed methods and the accuracy of DAS measurements in sensing strain changes produced by volcanic processes.
MATLAB scripts and data are available upon request to the corresponding author.
The supplement related to this article is available online at: https://doi.org/10.5194/se-12-993-2021-supplement.
PJ, CK and MW conceived and supervised the project. PJ, GC and RN were involved with the experiment planning. GC conceptualised this study and performed the analyses. All authors contributed to the acquisition of the field data, the writing of the manuscript and the discussion of the results.
The authors declare that they have no conflict of interest.
This article is part of the special issue “Fibre-optic sensing in Earth sciences”. It is not associated with a conference.
Broadband seismometers and data logger equipment are from the Geophysical Instrument Pool Potsdam (GIPP). Thanks are due to Valentin Parra and the INGV staff composed of Salvatore Consoli, Danilo Contrafatto, Graziano Larocca, Daniele Pellegrino and Mario Pulvirenti for their great help during the field work.
This research has been supported by the INGV, GeoForschungZentrum Potsdam, and Helmholtz Association. The experiment was also financially supported through the Trans National Activity “FAME” within the EUROVOLC project (EU grant agreement ID: 731070).
This paper was edited by Zack Spica and reviewed by Corentin Caudron and one anonymous referee.
Ajo-Franklin, J. B., Dou, S., Lindsey, N. J., Monga, I., Tracy, C., Robertson, M., Tribaldos, V. R., Ulrich, C., Freifeld, B., Daley, T., and Li, X.: Distributed acoustic sensing using dark fiber for near-surface characterization and broadband seismic event detection, Scientific Reports, 360, 1–14, 2019.
Andronico, D. and Lodato, L.: Effusive Activity at Mount Etna Volcano (Italy) During the 20th Century: A Contribution to Volcanic Hazard Assessment, Nat. Hazards, 36, 407–443, https://doi.org/10.1007/s11069-005-1938-2, 2005.
Azzaro, R., Branca, S., Gwinner, K., and Coltelli, M.: The volcano-tectonic map of Etna volcano, 1:100.000 scale: an integrated approach based on a morphotectonic analysis from high-resolution DEM constrained by geologic, active faulting and seismotectonic data, Ital. J. Geosci., 131, 153–170, https://doi.org/10.3301/IJG.2011.29, 2012.
Bakku, S. K.: Fracture characterization from seismic measurements in a borehole, PhD thesis, Massachusetts Institute of Technology, MA, USA, 2015.
Basu, D., Whittaker, A. S., and Costantinou, M. C.: Extracting rotational components of earthquake ground motion using data recorded at multiple station, Earthquake Engng. Struct. Dyn., 42, 451–468, https://doi.org/10.1002/eqe.2233, 2013.
Basu, D., Whittaker, A. S., and Costantinou, M. C.: On the design of a dense array to extract rotational components of earthquake ground motion, B. Earthq. Eng., 15, 827–860, https://doi.org/10.1007/s10518-016-9992-6, 2017.
Bodin, P., Gomberg, J., Singh, S. K., and Santoyo M.: Dynamic deformations of shallow sediments in the Valley of Mexico, part I: Three-dimensional strains and rotations recorded on a seismic array, B. Seismol. Soc. Am., 87, 528–539, 1997.
Bonaccorso, A., Calvari, S., Del Negro, C., and Falsaperla, S.: Mt. Etna: Volcano Laboratory, Geophys. Monogr. Ser. 143, 369 pp., AGU, Washington, D. C., https://doi.org/10.1029/GM143, 2004.
Branca, S., Coltelli, M., Groppelli, G., and Lentini, F.: Geological map of Etna volcano, 1:50,000 scale, Ital. J. Geosci., 130, 265–291, https://doi.org/10.3301/IJG.2011.15, 2011.
Cannata, A., Hellweg, M., Di Grazia, G., Ford, S., and Alparone, S.: Long period and very long period events at Mt. Etna volcano: Characteristics, variability and causality, and implications for their sources, J. Volcanol. Geoth. Res., 187, 227–249, https://doi.org/10.1016/j.jvolgeores.2009.09.007, 2009.
Cao, Y. and Mavroeidis, G. P.: A Parametric Investigation of Near-Fault Ground Strains and Rotations Using Finite-Fault Simulations, B. Seismol. Soc. Am., 109, 1758–1784, https://doi.org/10.1785/0120190045, 2019.
Currenti, G. and Bonaccorso, A.: Cyclic magma recharge pulses detected by high-precision strainmeter data: the case of 2017 inter-eruptive activity at Etna volcano, Scientific Reports, 9, 7553, https://doi.org/10.1038/s41598-019-44066-w, 2019.
Currenti, G., Zuccarello, L., Bonaccorso, A., and Sicali, A.: Borehole volumetric strainmeter calibration from a nearby seismic broadband array at Etna volcano, J. Geophys. Res.-Sol. Ea., 122, 7729–7738, https://doi.org/10.1002/2017JB014663, 2017.
Currenti, G., Jousset, P., Chalari, A., Zuccarello, L., Napoli, R., Reinsch, T., and Krawczyk, C.: Fibre optic Distributed Acoustic Sensing of volcanic events at Mt Etna, EGU General Assembly 2020, Online, 4–8 May 2020, EGU2020-11641, https://doi.org/10.5194/egusphere-egu2020-11641, 2020.
Donner, S., Chin-Jen, L., Hadziioannou, C., Gebauer, A., Vernon, F., Agnew, D. C., Igel, H., Schreiber, U., and Wassermann, J.: Comparing Direct Observation of Strain, Rotation, and Displacement with Array Estimates at Piñon Flat Observatory, California, Seismol. Res. Lett., 88, 1107–1116, https://doi.org/10.1785/0220160216, 2017.
Gomberg, J. and Agnew, D.: The accuracy of seismic estimates of dynamic strains: An evaluation using strainmeter and seismometer data from Piñon Flat Observatory, California, B. Seismol. Soc. Am., 86, 212–220, 1996.
Jousset, P., Neuberg, J., and Jolly, A.: Modelling low-frequency volcanic earthquakes in a viscoelastic medium with topography, Geophys. J. Int., 159, 776–802, https://doi.org/10.1111/j.1365-246X.2004.02411.x, 2004.
Jousset, P., Reinsch, T., Ryberg, T., Blanck, H., Clarke, A., Aghayev, R., Hersir, G. P., Henninges, J., Weber, M., and Krawczyk, C. M.: Dynamic strain determination using fibre-optic cables allows imaging of seismological and structural features, Nat. Commun., 9, 2509, https://doi.org/10.1038/s41467-018-04860-y, 2018.
Jousset, P., Currenti, G., Napoli, R., Krawczyk, C., Weber, M., Clarke, A., Reinsch, T., Chalari, A., Lokmer, I., Pellegrino, D., Larocca, G., Pulvirenti, M., Contrafatto, D., and Consoli, S.: FAME: Fibre optic cables: an Alternative tool for Monitoring volcanic Events, EGU General Assembly 2020, Online, 4–8 May 2020, EGU2020-19078, https://doi.org/10.5194/egusphere-egu2020-19078, 2020.
Kumagai, H., Saito, T., O'Brien, G., and Yamashina, T.: Characterization of scattered seismic wavefields simulated in heterogeneous media with topography, J. Geophys. Res., 116, B03308, https://doi.org/10.1029/2010JB007718, 2011.
Langston, C. A.: Calibrating dense spatial arrays for amplitude statics and orientation errors, J. Geophys. Res.-Sol. Ea., 123, 3849–3870, https://doi.org/10.1002/2017JB015098, 2018.
Langston, C. A. and Liang, C.: Gradiometry for polarized seismic waves, J. Geophys. Res., 113, B08305, https://doi.org/10.1029/2007JB005486, 2008.
Lindsey, N. J., Rademacher, H., and Ajo-Franklin, J. B.: On the broadband instrument response of fiber-optic DAS arrays, J. Geophys. Res.-Sol. Ea., 125, e2019JB018145, https://doi.org/10.1029/2019JB018145, 2020.
Napoli, R., Currenti, G., and Sicali, A.: Magnetic signatures of subsurface faults on the northern upper flank of Mt Etna (Italy), Ann. Geophys.-Italy, 64, PE108, https://doi.org/10.4401/ag-8582, 2021.
Palaseanu-Lovejoy, M., Bisson, M., Spinetti, C., Buongiorno, M. F., Alexandrov, O., and Cerere, T.: Digital surface model of mt Etna, Italy, derived from 2015 Pleiades Satellite Imagery, U.S. Geological Survey data release, https://doi.org/10.5066/P9IGLDYE, 2020.
Paolucci, R. and Smerzini, C.: Earthquake-induced Transient Ground Strains from Dense Seismic Networks, Earthq. Spectra, 24, 453–470, https://doi.org/10.1193/1.2923923, 2008.
Reinsch, T., Thurley, T., and Jousset, P.: On the mechanical coupling of a fiber optic cable used for distributed acoustic/vibration sensing applications – a theoretical consideration, Meas. Sci. Technol., 28, 127003, https://doi.org/10.1088/1361-6501/aa8ba4, 2017.
Saccorotti, G., Zuccarello, L., Del Pezzo, E., Ibanez, J., Gresta, S.: Quantitative analysis of the tremor wavefield at Etna Volcano, Italy, J. Volcanol. Geotherm. Res, 136 223–245, https://doi.org/10.1016/j.jvolgeores.2004.04.003, 2004.
Sandwell, D. T.: Biharmonic spline interpolation of GEOS-3 and SEASAT altimeter data, Geophys. Res. Lett., 14, 139–142, https://doi.org/10.1029/GL014i002p00139, 1987.
Sandwell, D. T. and Wessel, P.: Interpolation of 2-D vector data using constraints from elasticity, Geophys. Res. Lett., 43, 10703–10709, https://doi.org/10.1002/2016GL070340, 2016.
Schantz, A.: Earthquake Characterization Using Distributed Acoustic Sensing (DAS) in a Case Study in Iceland, MSc thesis, TU Berlin, 101 pp., 2020.
Shen, Z.-K., Jackson, D. D., and Ge, B. X.: Crustal deformation across and beyond the Los Angeles basin from geodetic measurements, J. Geophys. Res., 101, 27957–27980, https://doi.org/10.1029/96JB02544, 1996.
Shen, Z.-K., Wang, M., Zeng, Y., and Wang, F.: Optimal Interpolation of Spatially Discretized Geodetic Data, B. Seismol. Soc. Am., 105, 2117–2127, https://doi.org/10.1785/0120140247, 2015.
Spudich, P. and Fletcher, J. B.: Observation and Prediction of Dynamic Ground Strains, Tilts, and Torsions Caused by the Mw 6.0 2004 Parkfield, California, Earthquake and Aftershocks, Derived from UPSAR Array Observations, B. Seismol. Soc. Am., 98, 1898–1914, https://doi.org/10.1785/0120070157, 2008.
Spudich, P., Steck, L. K., Hellweg, M., Fletcher, J., and Baker, L. M.: Transient stresses at Parkfield, California, produced by the M7.4 Landers earthquake of June 28, 1992: Observations from the UPSAR dense seismograph array, J. Geophys. Res., 100, 675–690, https://doi.org/10.1029/94JB02477, 1995.
Suryanto, W., Igel, H., Wassermann, J., Cochard, A., Schuberth, B., Vollmer, D., Scherbaum, F., Schreiber, U., and Velikoseltsev, A.: First comparison of array-derived rotational ground motions with direct ring laser measurements, B. Seismol. Soc. Am., 96, 2059–2071, https://doi.org/10.1785/0120060004, 2006.
Teza, G., Pesci, A., and Galgaro, A.: Software packages for strain field computation in 2D and 3D environments, Comput. Geosci., 34, 1142–1153, https://doi.org/10.1016/j.cageo.2007.07.006, 2004.
Yu, C., Zhan, Z., Lindsey, N. J., Ajo-Franklin, J. B., and Robertson, M.: The potential of DAS in teleseismic studies: Insights from the Goldstone experiment, Geophys. Res. Lett., 46, 1320–1328, https://doi.org/10.1029/2018GL081195, 2019.
Wang, H. F., Zeng, X., Miller, D. E., Fratta, D., Feigl, K. L., Thurber, C. H., and Mellors, R. J.: Ground motion response to an ML 4.3 earthquake using co-located distributed acoustic sensing and seismometer arrays, Geophys. J. Int., 213, 2020–2036, https://doi.org/10.1093/gji/ggy102, 2018.
Wessel, P. and Bercovici, D.: Interpolation with splines in tension: A Green's function approach, Math. Geol., 30, 77–93, https://doi.org/10.1023/A:1021713421882, 1998.