the Creative Commons Attribution 4.0 License.
the Creative Commons Attribution 4.0 License.
 | 12 Aug 2022
How do differences in interpreting seismic images affect estimates of geological slip rates?
Uncertainties of geological structural geometry constructed based on seismic reflections can stem from data acquisition, processing, analysis, or interpretation. Uncertainties arising from structural interpretations and subsequent estimates of geological slip have been particularly less quantified and discussed. To illustrate the implications of interpretation uncertainties for seismic potential and structural evolution, I use an example of a shear fault-bend fold in the central Himalaya. I apply a simple solution from the kinematic model of shear fault-bend folding to resolve the geological input slip of given structure and then compare the result with a previous study to show how differences in structural interpretations could impact dependent conclusions. The findings show that only a little variance in interpretations owing to subjectivity or an unclear seismic image could yield geological slip rates differing by up to ∼ 10 mm yr−1, resulting in significantly different scenarios of seismic potential. To reduce unavoidable subjectivity, this study also suggests that the epistemic uncertainty in raw data should be included in interpretations and conclusions.
- Article
(5328 KB) - Full-text XML
- BibTeX
- EndNote


Geological studies typically integrate various spatial and temporal data that may have large uncertainties; these uncertainties originate from a lack of guiding models or accessible records in the natural settings, sometimes from necessary simplification in models, or from our limited understanding of how to interpret raw data. Also, given that geology is hermeneutic in nature (Frodeman, 1995), to reduce subjectivity, identifying, including, and quantifying uncertainties of interpreted information have been widely recognized as necessary (e.g. Wellmann and Caumon, 2018).
Two main foci of structural geology are evaluating reserves of natural resources and seismic hazards, which are respectively based primarily on established geological models as well as geological slip and its rate. Geological models are used to present spatial relations between faults and stratigraphic horizons; uncertainties of geological models have been widely studied and expressed (e.g. Lindsay et al., 2012; Thiele et al., 2016; Wellmann and Caumon, 2018; Randle et al., 2018; Schaaf and Bond, 2019). Geological or geomorphic slip, a metric of estimating seismic potential, is constrained by offsets or deformation in surface features (e.g. fluvial terraces, fold scarps) together with the proposed underlying structural geometry; their uncertainties have also been considered in several studies (e.g. Thompson et al., 2002; Davis et al., 2005; Bird, 2007; Zechar and Frankel, 2009; Amos et al., 2010; Li et al., 2013; Xu et al., 2020). Subsurface fault geometry – a critical element for constraining geological slip – is mostly simplified as a single planar fault, which can thus lead to large uncertainties (e.g. Brandes and Tanner, 2014; Butler et al., 2018; Drukpa et al., 2018). In some cases (when funding is less of a hurdle and field conditions allow it), the geometry is constrained by seismic reflection imagery, which is considered to yield a precise fault geometry. However, seismic reflection imagery may also suffer from several sources of uncertainties including the resolution of seismic images (e.g. Faleide et al., 2021), choice of velocity models (e.g. Totake et al., 2017), and bias in interpretations.
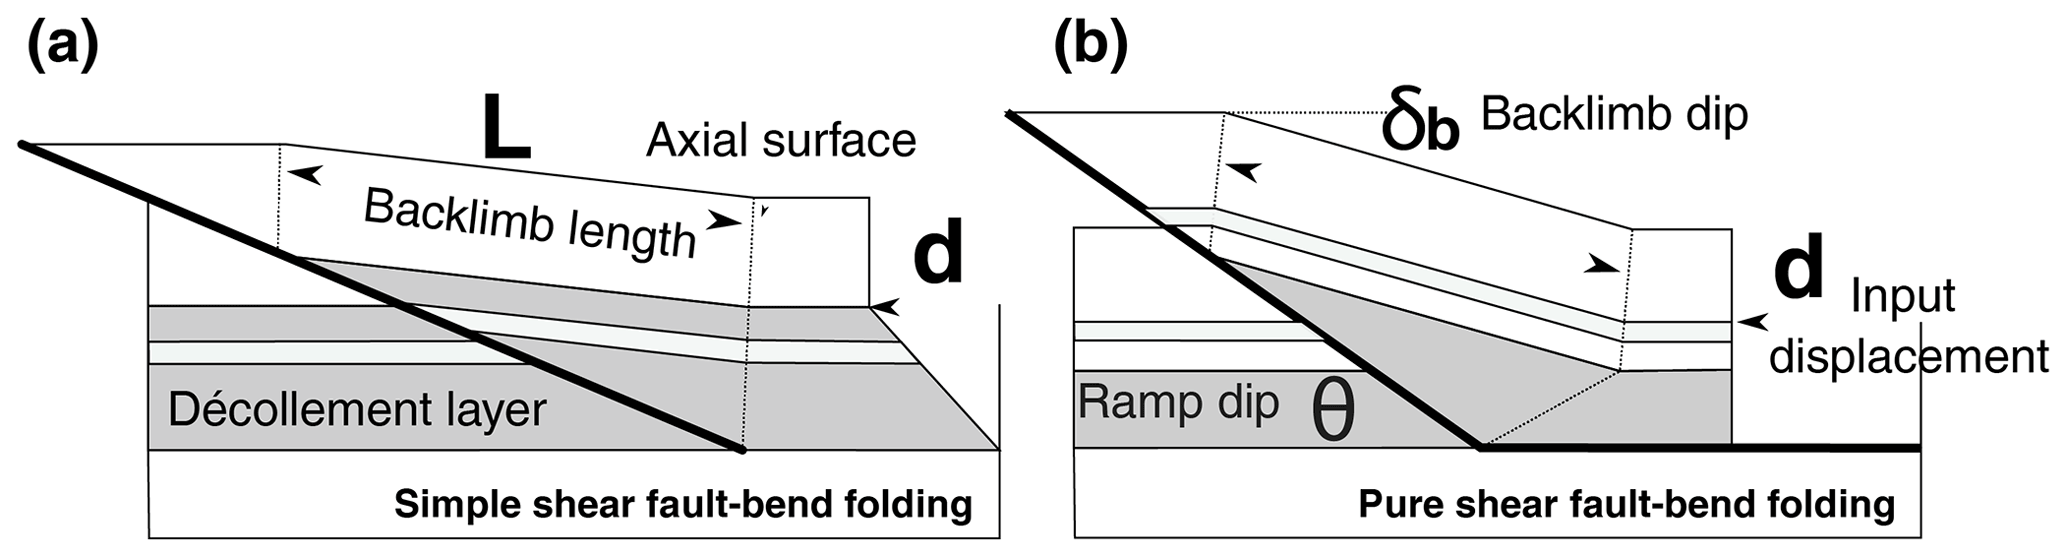
Figure 1Two end-member models for shear fault-bend folding; after Suppe et al. (2004). (a) Simple shear and (b) pure shear fault-bend folding. The relations of the four geometric features – backlimb dip (δb), ramp dip (θ), backlimb length (L), and input displacement (d) – are described by Eq. (1).
Generally, a wide range of interpretations of a seismic image is possible mostly because seismic images are rarely clear enough to determine fault geometry conclusively. Moreover, differences in interpretations could be associated with an interpreter's prior knowledge and experience or guiding models with different underlying assumptions (e.g. Rankey and Mitchell, 2003; Bond et al., 2007, 2012, 2015; Groshong et al., 2012; Bond, 2015; Alcalde et al., 2017, 2019; Butler et al., 2018). The further impact of such differences in interpretations remains less discussed, especially how these differences could impact estimates of geological slip rates and thus seismic hazards and structural evolutions.
Here, I illustrate such an issue with a case of an unclear seismic image of a shear fault-bend fold in the central Himalaya. Firstly, I highlight a simple solution derived in Suppe et al. (2004). This solution can directly acquire the input displacement accommodated by shear layers in shear fault-bend folds based on the features in the shallow part of seismic images. Thus, the solution could be used to acquire total slip even when the quality of the seismic image is poor. This solution is validated with a case of a better-imaged structure – the Tainan anticline in the fault-and-thrust belt of Taiwan. Subsequently, I apply this solution to the case of the Main Frontal Thrust in the frontal part of the central Himalaya and compare the acquired total geological slip with a previous study. Finally, I quantitatively show how this difference in seismic image interpretation could impact the following conclusions regarding geological slip rates and thus implications for seismic potential and structural evolution.
2.1 Geometry and kinematics of shear fault-bend folding
Shear fault-bend folds are commonly identified in thrust belts worldwide (e.g. Moore et al., 1990; Suppe et al., 2004; Shaw et al., 2005; Corredor et al., 2005; Yue et al., 2011; Almeida et al., 2018; Le Béon et al., 2019), and they are distinctly characterized by long, gentle, and rotated backlimbs. These characteristics are caused by shear strain in décollement layers (Suppe et al., 2004; Shaw et al., 2005; Hardy and Connors, 2006). Based on shear strain mechanisms, two end-members of kink-style kinematic models for shear fault-bend folding have been proposed (Suppe et al., 2004). First, the simple shear fault-bend fold has externally imposed bed-parallel and homogeneous simple shear accommodated by the basal shear layer, with no basal fault slip (Fig. 1a). Second, the pure shear fault-bend fold has no simple shear within the décollement layer (Fig. 1b); instead, its shortening is evenly accommodated by pure shear within the décollement layer, which moves along the basal fault.
Suppe et al. (2004) derived geometric relations among features in shear fault-bend folds of both types based on assumptions of conservation of area, line length, and bed thickness in the plane profile. Since these geometric relations are powerful for predicting unknown geometry based on partially revealed features, they are widely and successfully utilized in interpreting seismic reflections.
2.2 Acquiring total slip of given structures from seismic images
For tackling issues of seismic potentials and structural evolutions, the most critical element needed is the total slip along the targeted structures. Given that the input displacement along the décollement (i.e. input slip or shortening where décollement is horizontal) is mostly nearly horizontal, the total displacement cannot be identified directly from seismic reflections. Therefore, the slip amount is mostly indirectly decided based on applications of area–depth strain (ADS) analysis, or the area-of-relief method (e.g. Epard and Groshong, 1993, 1995; Gonzalez-Mieres and Suppe, 2006, 2011; Schlische et al., 2014; Groshong, 2015; Eichelberger et al., 2017; Wang et al., 2018). This method, assuming that area is conserved along the profile, requires at least two pairs of area–relief (i.e. excess areas of a horizon and decided reliefs from the given horizon). However, these features cannot always be determined in an ambiguous seismic image or could be incorrectly determined in a structurally complex area (Carboni et al., 2019), potentially leading to a large uncertainty in estimates of geological slip along a given structure.
Here, I apply geometric derivations from Suppe et al. (2004) and show that while this solution does not require the ramp locations or area–relief pairs in seismic images to be determined, it can independently constrain the slip along the décollement based on geometric features which are mostly clearer than other features in seismic images.
According to the geometric solutions in Suppe et al. (2004)'s shear fault-bend fold model, the input slip (d) accommodated by the shear strain within the décollement layer above the basal fault can be decided by Eq. (1) (Eq. 6 in Suppe et al., 2004):
This equation determines the relations between the input slip (d), representing the total slip of the structure here, ramp dip (θ), backlimb dip (δb), and the length between the two axial surfaces that define the backlimb length (L).
Applying this solution to decide input slip has three advantages. First, L and δb specifically reflect the amounts of shear strain in the décollement layer (Fig. 1), and generally, due to their shallower positions, they could be more easily determined in the seismic images than other geometric features. Second, θ is a stratigraphy-controlled factor, so if it is unclear in seismic images, its possible range could be determined based on regional geological information. Third, the input slip (d) obtained by this solution is independent of types of shear strain (i.e. pure or simple shear), which are mostly indistinguishable in seismic images. With the deterministic relationship between these four variables (L, θ, δb, d), d can be assigned as the response variable and the other three variables (L, θ, δb) as the predictor variables. These predictor variables can be assigned reasonable values by referring to seismic images or regional geological information.
2.3 Including and propagating uncertainties
To minimize subjectivity in interpreting seismic images, I include uncertainties inherited from ambiguous seismic images and decide a range of possible realizations for each variable, which might be interpreted differently by individuals, together with assignments of the probability distribution functions (PDFs) for the predictor variables. These PDFs represent our best knowledge of these variables currently, and their widths of distributions could be narrowed down once the fault geometry is better resolved. Then, uncertainties from predictor variables propagate to the response variable by Monte Carlo simulations.
I firstly validate the highlighted simple solution by applying it to a case of the shear fault-bend fold in the foreland of Taiwan (Le Béon et al., 2019). Next, I apply this solution to an analogous case in the central Himalaya (Almeida et al., 2018), and then show the differential estimates of total slip and further implications originating from the difference in interpretations.
3.1 The Houchiali backthrust in the fold-and-thrust belt of Taiwan
The Tainan anticline has been categorized as a pure shear fault-bend fold above the Houchiali backthrust in the fold-and-thrust belt of southwestern Taiwan (Le Béon et al., 2019). Le Béon et al. derived total accommodated shortening according to the ADS analysis (e.g. Groshong, 2015); in their analysis, least squares linear regression of pairs of depths of interpreted horizons and corresponding excess areas are used to constrain the total shortening.
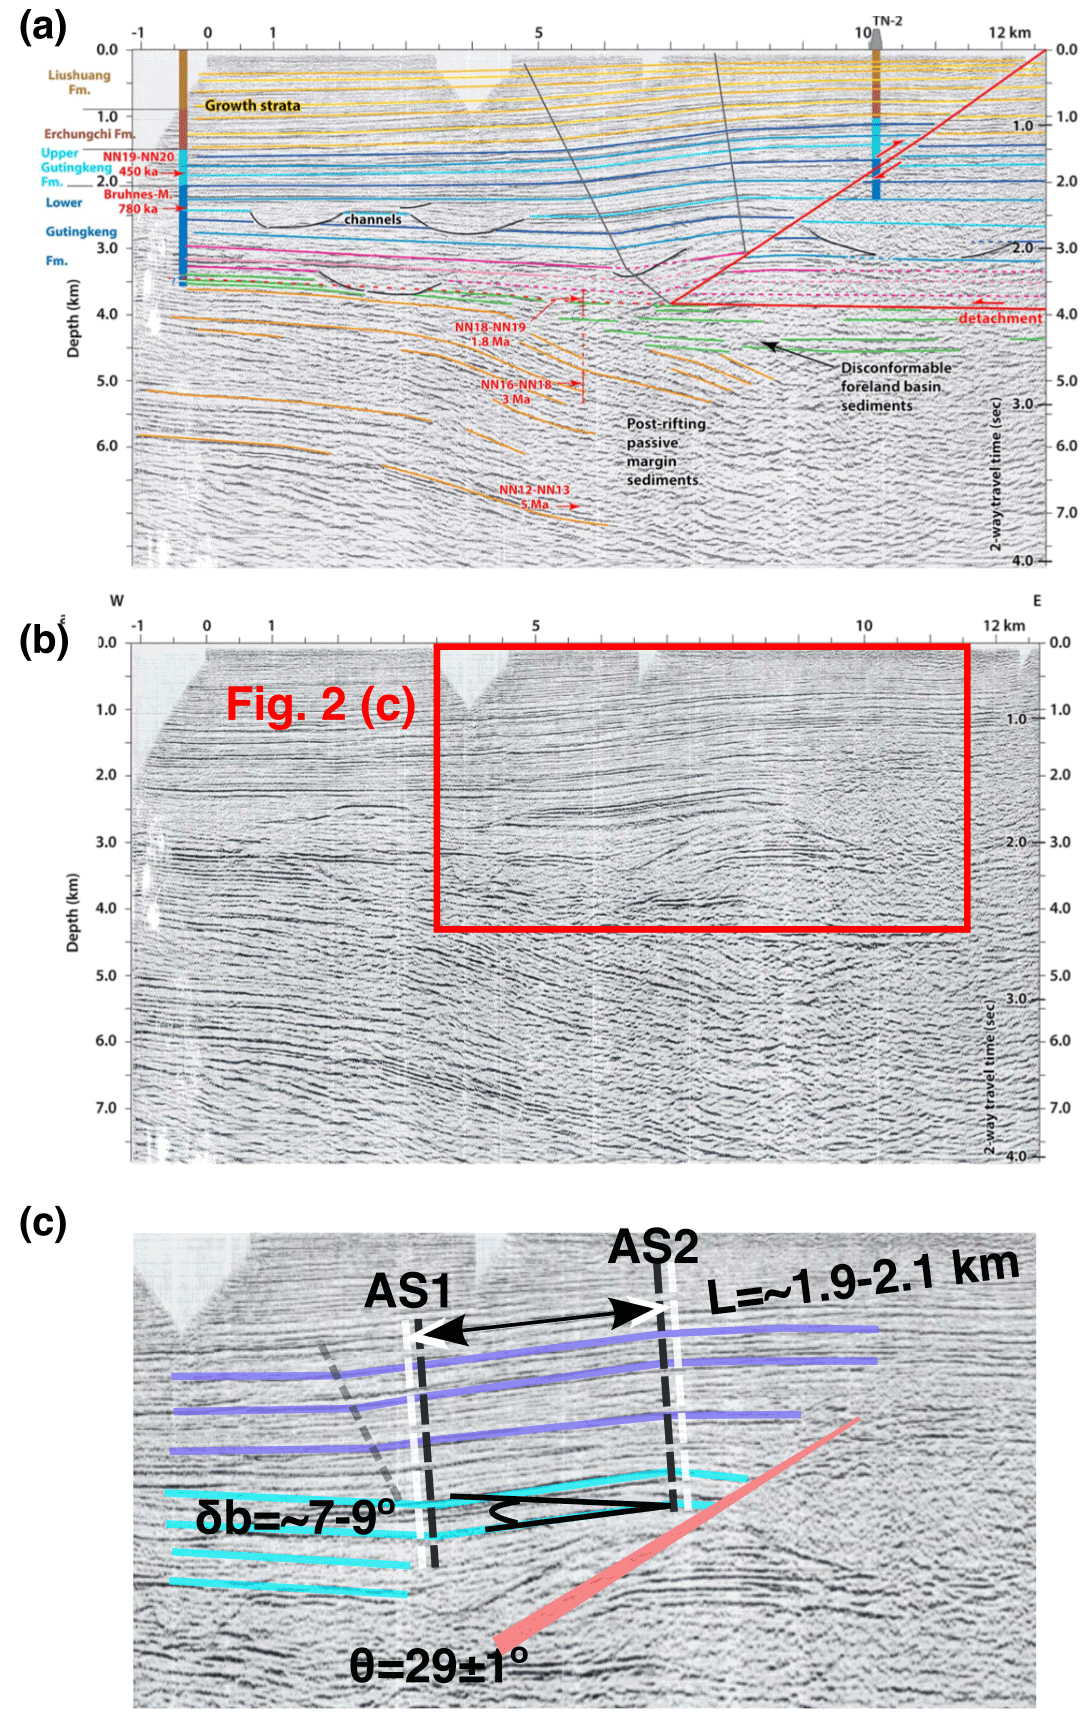
Figure 2(a, b) The interpreted and uninterpreted seismic profile – D5, Fig. 2 in Le Béon et al. (2019). (c) The interpretation of this study and the decisions of predictor variables (i.e. L – backlimb length, θ – ramp dip, δb – backlimb dip). The pre-growth strata are interpreted in cyan, and the growth strata are interpreted in lavender. The distributions of predictor and response variables are shown in Fig. 3.
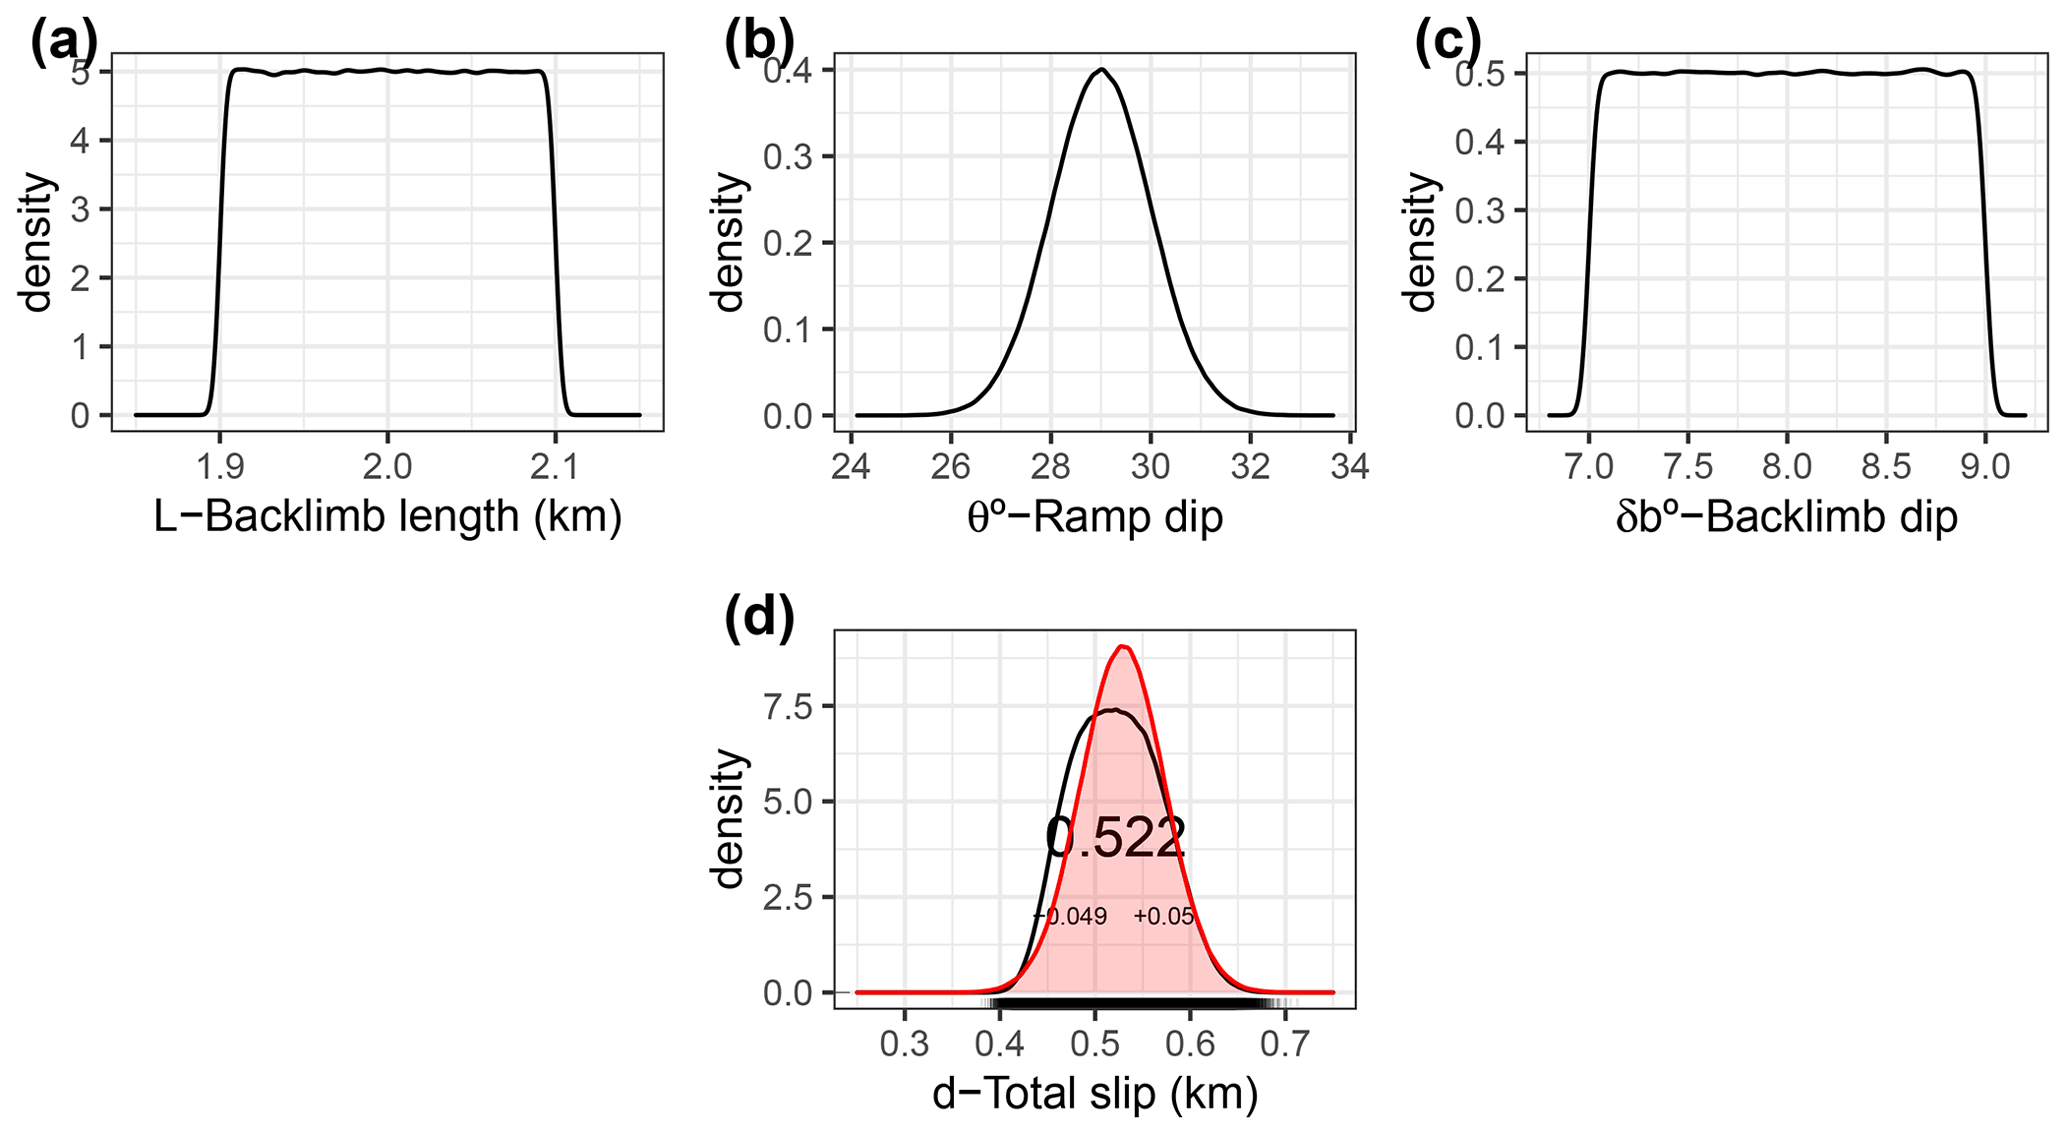
Figure 3The distributions (a–c) of the predictor variables (L – backlimb length, θ – ramp dip, δb – backlimb dip) and (d) the response variable (d – total slip) for the Houchiali backthrust. The total slip estimated by this study ( km) and Le Béon et al. (2019) (0.529 ± 0.044 km), shown by red fill, almost fully overlap.
3.1.1 Deciding the predictor variables
Independently from Le Béon et al. (2019)'s interpretation, I assign predictor variables of backlimb length (L), which is the distance between two axial surfaces (AS1 and AS2 in Fig. 2c) that bisect the interlimb angles in the theoretical model, as a uniform distribution with a range of ∼ 1.9 to 2.1 km. The ramp dip (θ) is assigned to be normally distributed with a mean of 29∘ and a standard deviation of 1∘. The backlimb dip (δb) of pre-growth strata (i.e. reflectors interpreted in cyan) falls within ∼ 7 to 9∘ (Fig. 2c). I then apply the Monte Carlo simulation with 1 million random samples from the space of predictor variables, distributed according to the assigned PDFs, to simulate the full range of possible realizations of the predictor variables and arrive at the distribution of the response variable (d) (Fig. 3).
3.1.2 Results
The total slip estimated here ( km) is nearly identical to Le Béon et al. (2019)'s result (0.529 ± 0.044 km). This similarity shows that nearly identical values can be acquired through different methods if the seismic image is properly interpreted. Also, the similarity demonstrates the effectiveness of the proposed solution to resolve slip along a given structure with a single planar ramp. The proposed solution is procedurally efficient, and not requiring certain steps, such as deciding area–relief pairs, reduces potential artificial uncertainties. Furthermore, two of three decided features could be defined from the shallow part of seismic reflections, and parameterized features can be processed without visualizing the full geometry.
3.2 The Bardibas thrust in the front of the central Himalaya
Next, the example of the Bardibas thrust in the foreland of the central Himalaya, Nepal, is examined. The Bardibas thrust is the foremost strand of the Main Frontal Thrust (MFT), which is suggested to accommodate most of the shortening across the Himalayan wedge in the Holocene (e.g. Lavé and Avouac, 2000), and thus the concluded slip rate of the Bardibas thrust has implications for the seismic potential in the Himalaya. The fold above the Bardibas thrust has been identified as a pure shear fault-bend fold, and the total slip accommodated has been decided based on only one pair of excess area and decided depth of décollement. The décollement depth was stated by Almeida et al. (2018) to have been based on Suppe et al. (2004)'s shear fault-bend fold model together with a decided ramp location. However, first, the quality of the image is not high enough to decide the mentioned features conclusively. Second, we cannot rule out the possibility of an existing upper décollement, along which mass can flux out; in such a case, the area used to derive the total slip, based on a calculation from a pair of area–relief, can be underestimated and the total slip is thus overestimated. Third, the shear mechanism for the shear fault-bend fold is decided to be a totally pure shear by Almeida et al. (2018), but if any simple shear involves the shear layer, the total slip – according to their calculation – would be underestimated (e.g. Epard and Groshong, 1993).
Here, independently from the decided features, I apply the simple solution proposed and validated in the previous sections to acquire the total slip of the Bardibas thrust. I then compare the result with Almeida et al. (2018)'s interpretation and discuss further implications.
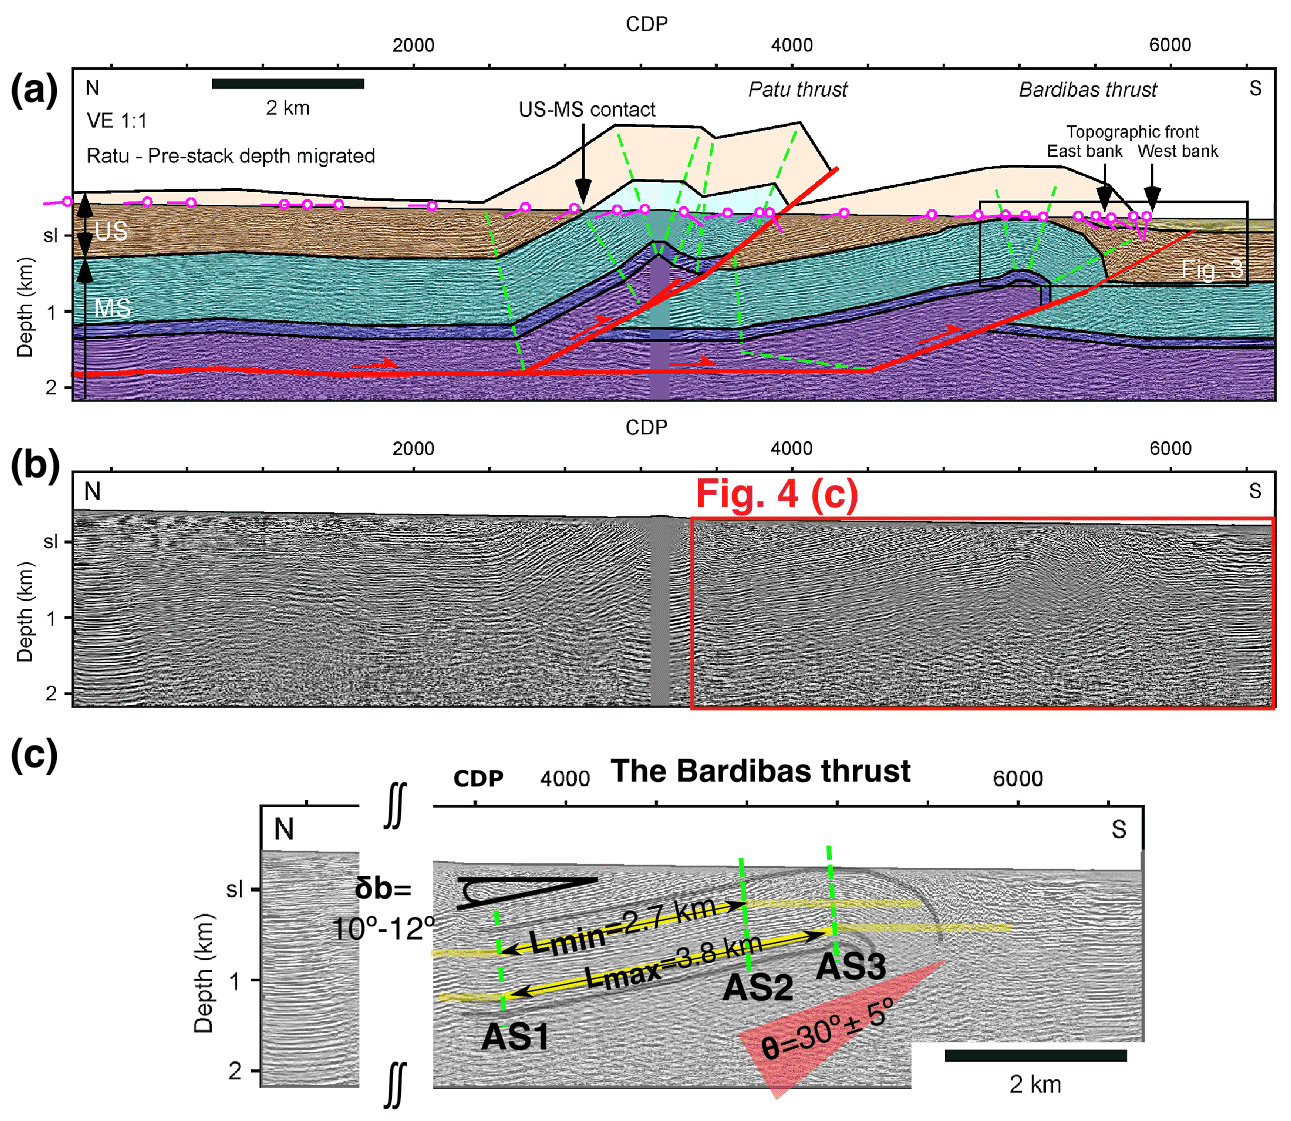
Figure 4(a, b) Interpreted and uninterpreted seismic profile; Fig. 2 in Almeida et al. (2018). (c) Assigning the ranges of possible values for predictor variables (i.e. L – backlimb length, θ – ramp dip, δb – backlimb dip) according to Almeida et al. (2018)'s seismic image of the Bardibas thrust. Their distributions are shown in Fig. 5.
3.2.1 Deciding the predictor variables
The anticline above the Bardibas thrust is in fact not exclusively a shear fault-bend fold (Suppe et al., 2004), but it is affected by fault-propagation folding (Suppe and Medwedeff, 1990). Fault-propagation folding specifically can complicate the length of the backlimb (L), which is used to indicate the shear strain in the basal shear layer. Where a fold is a combination of both shear fault-bend folding and fault-propagation folding, L may not straightforwardly indicate the strain in the shear layer. In this structure, the unconstrained portion, which is attributed to fault-propagation folding, of the L is treated as an epistemic uncertainty that is related to the quality of the seismic image. Thus, I include a possible range of L, inferring shear strain in the décollement layer. The minimum length (Lmin) is 2.7 km, which is the length between axial surfaces 1 and 2 (AS1 and AS2), where bedding starts to change its trend. The maximum length (Lmax) is 3.8 km, which is the length between axial surface 1 and 3 (AS1 and AS3), where the bedding starts to flex downward (Fig. 4). Thus, I assign L as uniformly distributed in a range of ∼ 2.7 to 3.8 km. The backlimb dip (δb) is not changed by the evolution of the fault-propagation folding and it is relatively clear; I assign it a range of 10–12∘ with a uniform distribution. The ramp location and ramp dip (θ) could not be conclusively determined from Almeida et al. (2018)'s seismic image. Referring to regional bedding attitudes (e.g. Hirschmiller et al., 2014; Shrestha et al., 2019), I accordingly assign a normal distribution, with a mean of 30∘ and a standard deviation of 5∘ (Fig. 4), and assume it is a single planar ramp.
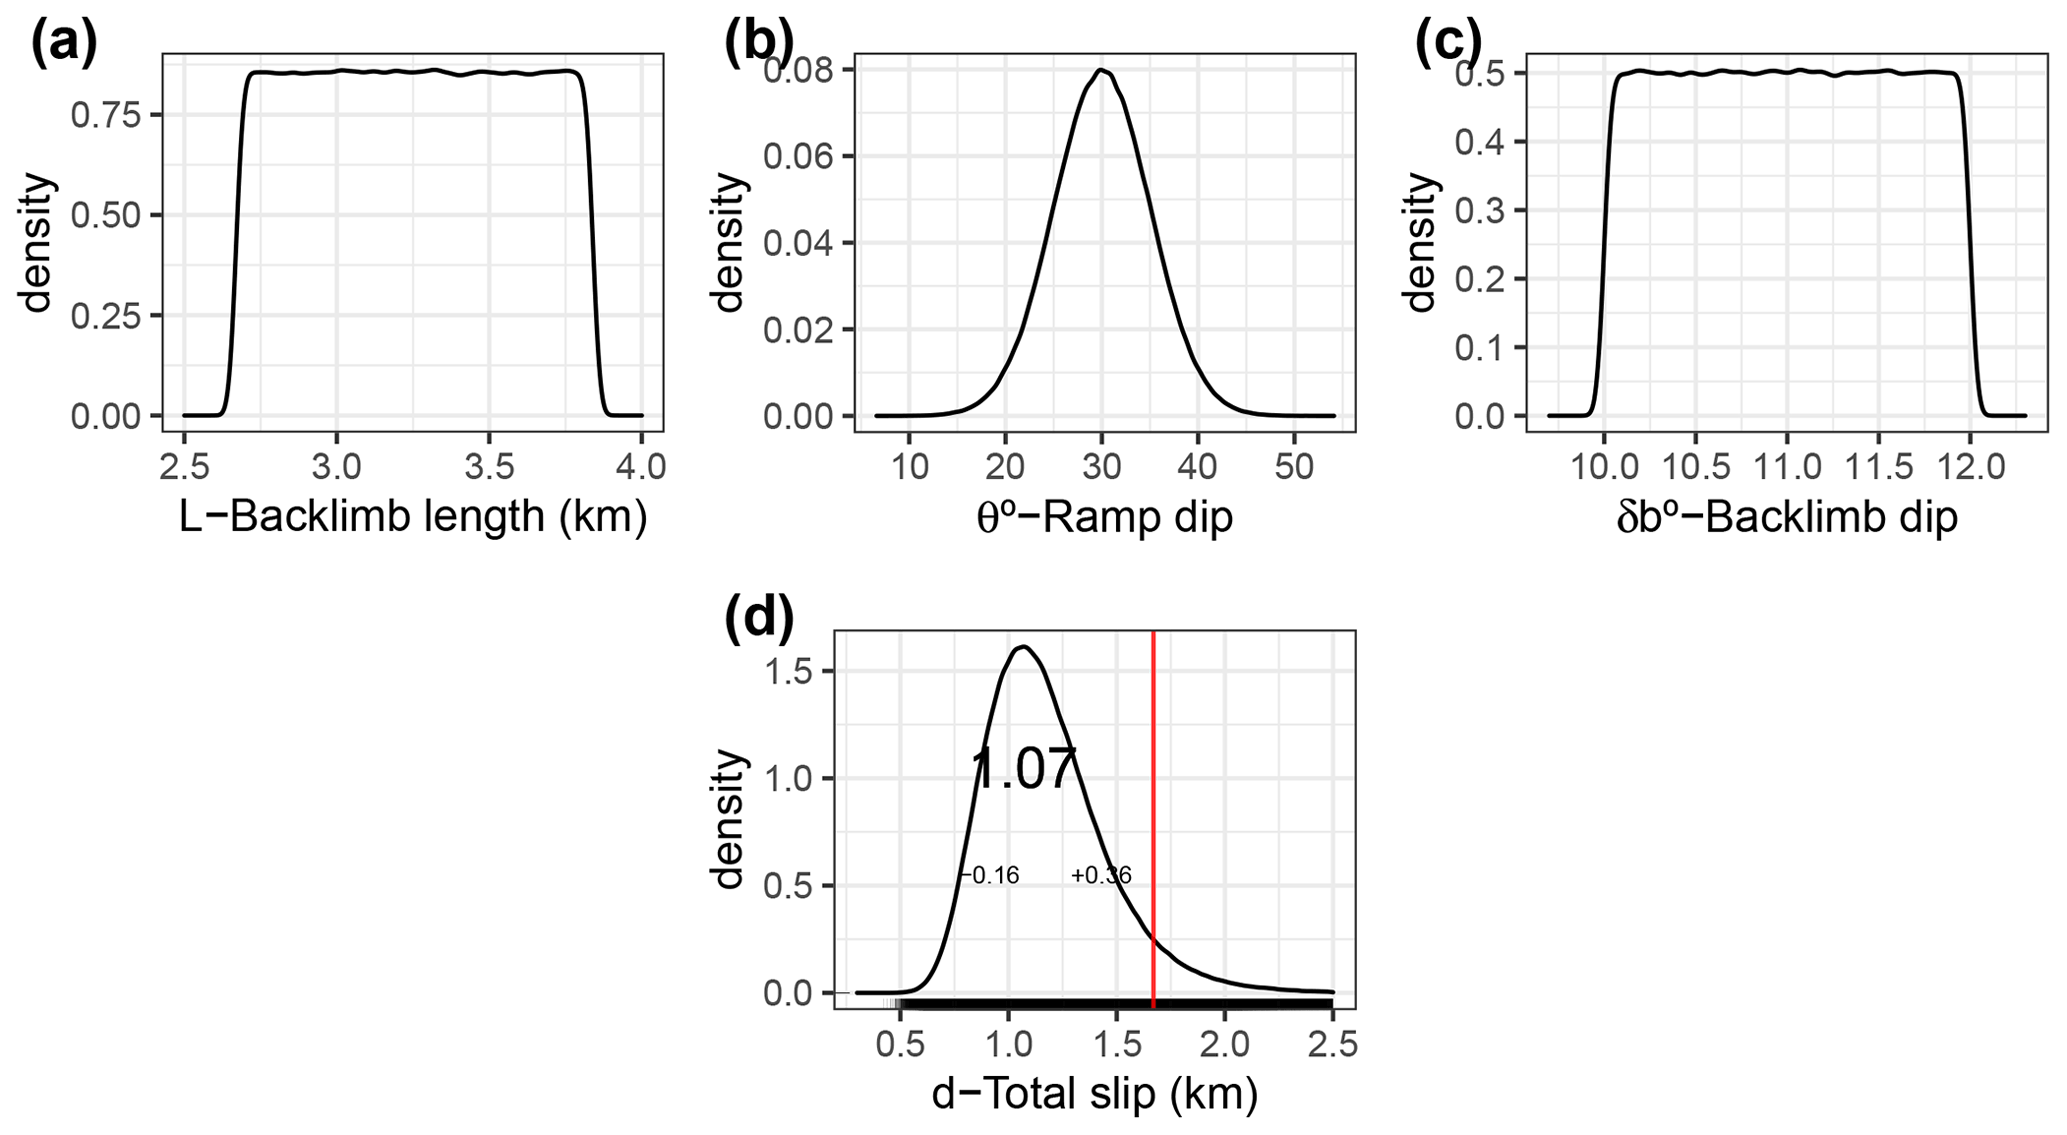
Figure 5The distributions (a–c) of the predictor variables (L – backlimb length, θ – ramp dip, δb – backlimb dip) and (d) the response variable (d – total slip) for the Bardibas thrust. The total slip estimated in Almeida et al. (2018, 1.67 km), shown by the vertical red line, varies significantly by ∼ 0.6 km from the most probable value ( km) estimated in this study.
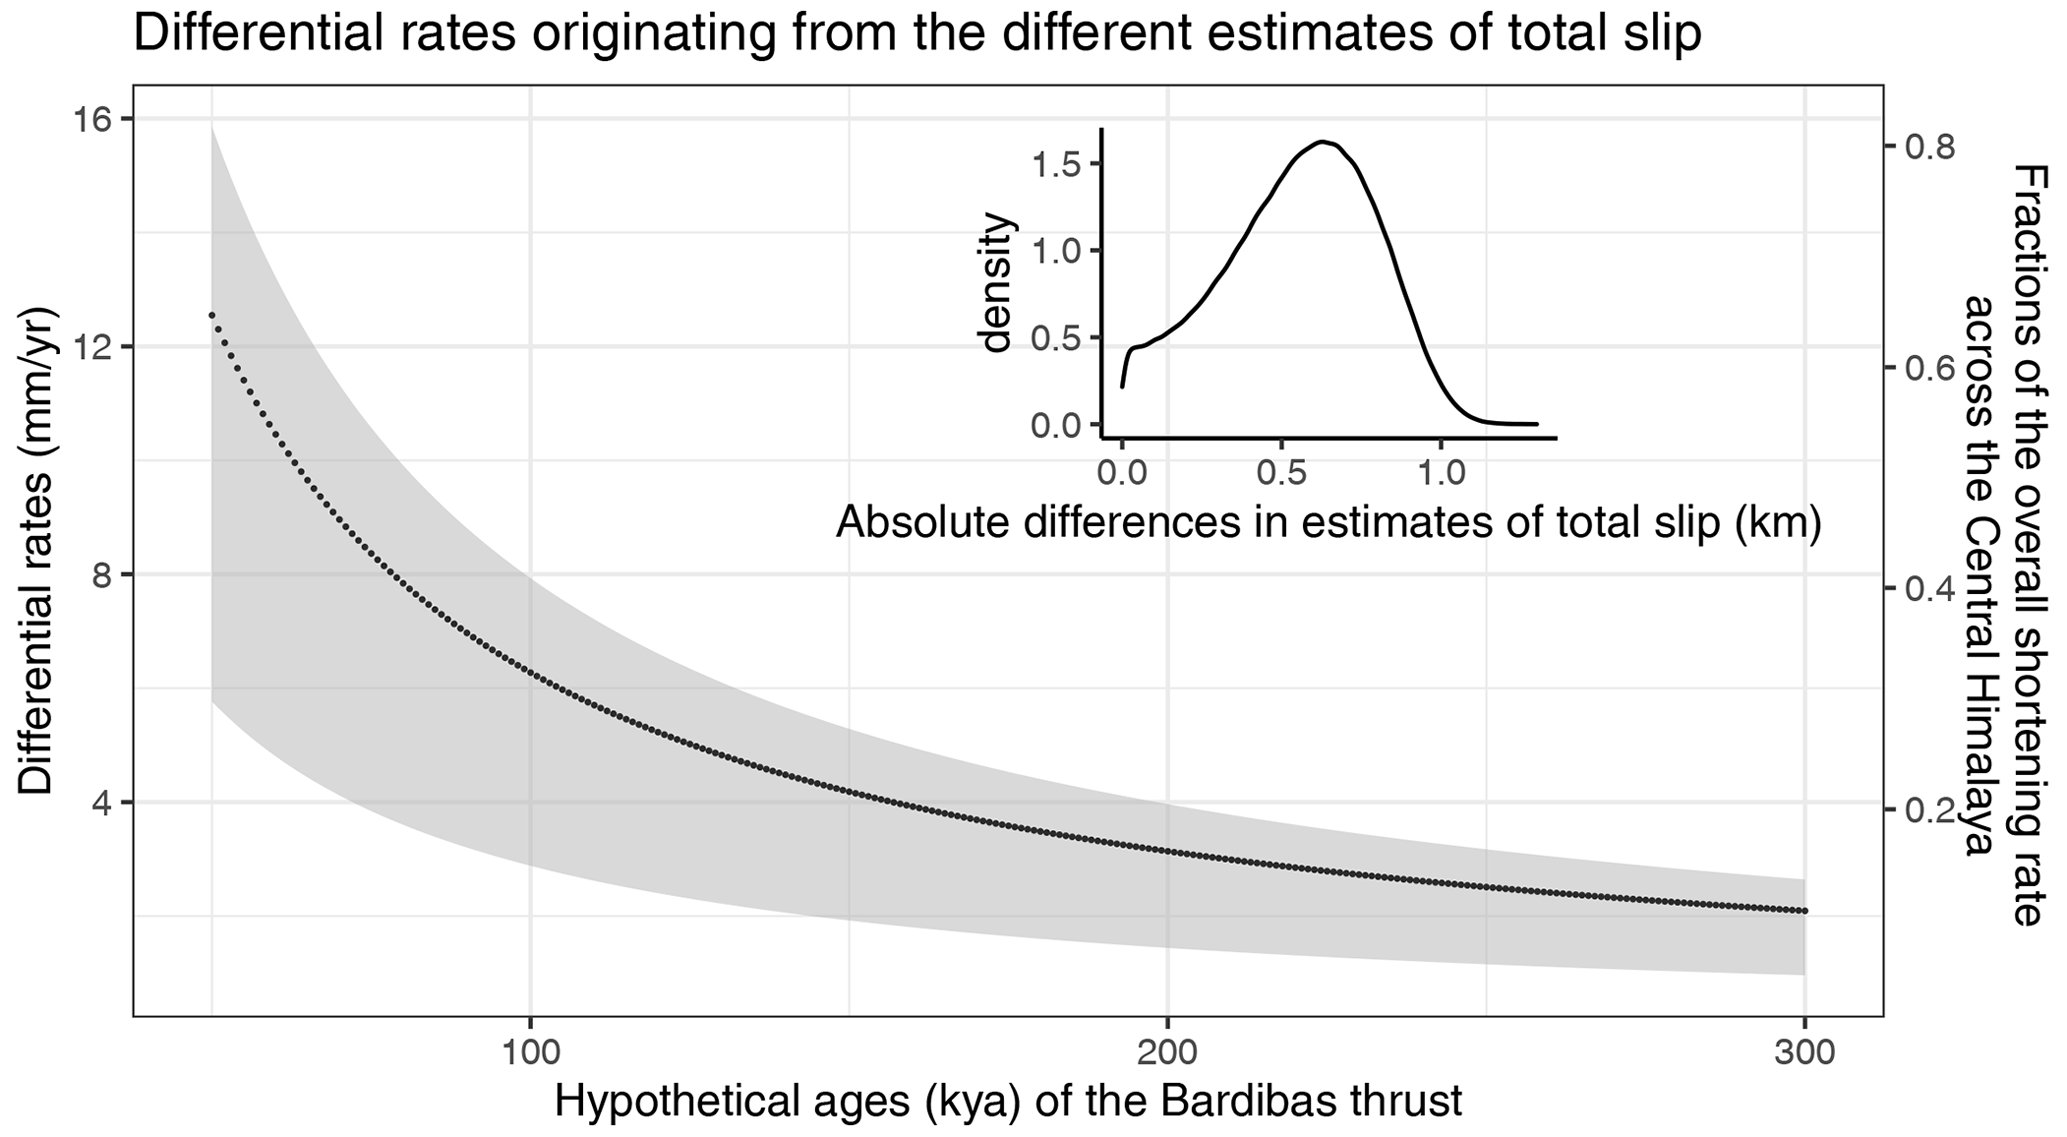
Figure 6Hypothetical ages of the Bardibas thrust (horizontal axis), the corresponding fractions of the shortening rates across the central Himalaya (right axis, overall shortening rate is ∼ 19.4 mm yr−1 based on Stevens and Avouac, 2015), and the corresponding differential rates (left axis). These differential rates originate from the varying estimates of the total slip by Almeida et al. (2018) and this study. The black dots show the most probable values, and the grey shaded area shows the 68 % confidence interval.
3.2.2 Results and further implications
The total slip of the Bardibas thrust is estimated in this study to be km, which is within the 68 % confidence interval; this is significantly lower than ∼ 1.7 km inferred by Almeida et al. (2018) (Fig. 5). I examine here how the different estimates of the total slip can impact the following derivations of geological slip rates, which serve as metrics to assess seismic potential when compared with the geodetic shortening rate across the given structure. Taking the estimated total slip ∼ 1.07 km and dividing it by the expected geological slip rate, the Bardibas thrust should be activated at ∼ 61 ka. The expected geological slip rate is suggested according to the geodetic shortening rate across the central Himalaya (∼ 19.4 mm yr−1, Stevens and Avouac, 2015). If the thrust has been active since ∼ 61 ka, the difference in the geological slip rates derived from the difference of the total slip (∼ 600 m) could be as high as ∼ 10 mm yr−1, which is more than half of the total shortening rate across the central Himalaya measured geodetically (Fig. 6). This differential rate could be even larger if the structure is younger or less if the structure is older. However, even if the fault had been activated 5 times earlier (∼ 300 ka), the differential rate would still account for ∼ 10 % of the overall geodetic shortening (Fig. 6). The differences in estimates of the total slip thus have a knock-on effect on seismic hazard assessments: the overestimation of the total slip along the Bardibas thrust leads to underestimation of the slip rate deficit of the MFT and thus underestimated seismic potential. Moreover, scenarios of slip partitioning among faults and the implications for structural evolutions may vary. For example, the discrepancy between the slip of the Patu thrust, a hinterland strand of the MFT, and the Bardibas thrust may actually be more significant than 1.8 km for the former and 1.7 km for the latter estimated by Almeida et al. (2018).
Except the differential estimates of the total slip, another source of uncertainty for estimating geomorphic slip rates by terraces above is the solely decided ramp dip. Almeida et al. (2018)'s seismic image in their Fig. 2 is described as providing direct evidence of fault dip, which is claimed to allow for a more precise conversion between uplift and input displacement. Yet, the seismic image allows alternative interpretations, and if the ramp dip is 10∘ steeper or gentler than the drawn dip of ∼ 20∘, then the ratio of crestal uplift to the input slip could differ by ∼ 30 %–60 % for all types of fault-bend folds (Hardy and Connors, 2006). However, the potential uncertainties of the fault geometry inherited from the seismic image are neither expressed nor included in their interpretations, so future applications of Almeida et al. (2018)'s results may inherit (unawares) these uncertainties.
In this study, I resolve the total geological slip of a shear fault-bend fold with a simple solution from Suppe et al. (2004), validated with a case from Le Béon et al. (2019). The benefit of the proposed solution is that the full geometry does not need to be visualized; instead, the solution relies on the ramp dip and features (i.e. backlimb length and dip), which are commonly located in the better-imaged shallow part of seismic images. Though this solution may entail further considerations in more structurally complicated cases (e.g. structures with changing bed lengths, a significant amount of off-fault deformation, or curved fault planes) and the degrees of uncertainty may vary from case to case (e.g. Randle et al., 2018), I quantitatively demonstrate a previously neglected source of uncertainty in estimating geological slip rates with a simple case of the Bardibas thrust in the central Himalaya. This subtle difference in structural interpretations and estimates of the total slip (∼ 600 m) for the structure can substantially affect the following estimates of the geological slip rate by up to ∼ 10 mm yr−1 and thus implications for seismic potential and structural evolutions, especially if the structure is younger. Also, the exclusively interpreted ramp geometry could lead to up to ∼ 60 % difference in the uplift-to-slip ratio. Therefore, I suggest that seismic reflection can provide more precise structural geometry and estimates of the total slip only if the method for interpretations is properly applied and compatible with available data quality. Otherwise, it may introduce unintended uncertainty.
Structural geometry is central to estimating geological or geomorphic slip rates and thus to assessment of seismic hazard. The unclear fault geometry at depth (Hu and Stevens, 2022) or near the surface, as shown in this study, can lead to non-negligible uncertainty in terms of the issues mentioned above. Though ambiguous fault geometry is unavoidable, subjectivity in structural interpretations can be reduced by either including uncertainties in interpretations or proposing multiple working hypotheses (Chamberlin, 1965).
No data sets were produced in this article. All the data used are available in the cited references.
The author has declared that there are no competing interests.
Publisher's note: Copernicus Publications remains neutral with regard to jurisdictional claims in published maps and institutional affiliations.
The author thanks the editors (Stefano Tavani and Federico Rossetti) and the reviewers (Filippo Carboni and Charlotte Botter) for their constructive comments and thanks Pavel Adamek for his language advice. The author is being supported by the Singapore International Graduate Award (SINGA), awarded by Agency for Science, Technology and Research (A*STAR) and Nanyang Technological University, Singapore.
This paper was edited by Stefano Tavani and reviewed by Charlotte Botter and Filippo Carboni.
Alcalde, J., Bond, C. E., Johnson, G., Butler, R. W. H., Cooper, M. A., and Ellis, J. F.: The importance of structural model availability on seismic interpretation, 97, 161–171, https://doi.org/10.1016/j.jsg.2017.03.003, 2017.
Alcalde, J., Bond, C. E., Johnson, G., Kloppenburg, A., Ferrer, O., Bell, R., and Ayarza, P.: Fault interpretation in seismic reflection data: an experiment analysing the impact of conceptual model anchoring and vertical exaggeration, Solid Earth, 10, 1651–1662, https://doi.org/10.5194/se-10-1651-2019, 2019.
Almeida, R. V., Hubbard, J., Liberty, L., Foster, A., and Sapkota, S. N.: Seismic imaging of the Main Frontal Thrust in Nepal reveals a shallow décollement and blind thrusting, Earth Planet. Sc. Lett., 494, 216–225, https://doi.org/10.1016/j.epsl.2018.04.045, 2018.
Amos, C. B., Burbank, D. W., and Read, S. A. L.: Along-strike growth of the Ostler fault, New Zealand: Consequences for drainage deflection above active thrusts, Tectonics, 29, TC4021, https://doi.org/10.1029/2009TC002613, 2010.
Bird, P.: Uncertainties in long-term geologic offset rates of faults: General principles illustrated with data from California and other western states, Geosphere, 3, 577–595, https://doi.org/10.1130/GES00127.1, 2007.
Bond, C. E.: Uncertainty in structural interpretation: Lessons to be learnt, J. Struct. Geol., 74, 185–200, https://doi.org/10.1016/j.jsg.2015.03.003, 2015.
Bond, C. E., Gibbs, A. D., Shipton, Z. K., and Jones, S.: What do you think this is? “Conceptual uncertainty” In geoscience interpretation, GSA Today, 17, 4–10, https://doi.org/10.1130/GSAT01711A.1, 2007.
Bond, C. E., Lunn, R. J., Shipton, Z. K., and Lunn, A. D.: What makes an expert effective at interpreting seismic images?, Geology, 40, 75–78, https://doi.org/10.1130/G32375.1, 2012.
Bond, C. E., Johnson, G., and Ellis, J. F.: Structural model creation: The impact of data type and creative space on geological reasoning and interpretation, Geol. Soc. Spec. Publ., 421, 83–97, https://doi.org/10.1144/SP421.4, 2015.
Brandes, C. and Tanner, D. C.: Fault-related folding: A review of kinematic models and their application, Earth Sci. Rev., 138, 352–370, https://doi.org/10.1016/j.earscirev.2014.06.008, 2014.
Butler, R. W. H., Bond, C. E., Cooper, M. A., and Watkins, H.: Interpreting structural geometry in fold-thrust belts: Why style matters, J. Struct. Geol., 114, 251–273, https://doi.org/10.1016/j.jsg.2018.06.019, 2018.
Carboni, F., Back, S., and Barchi, M. R.: Application of the ADS method to predict a “hidden” basal detachment: NW Borneo fold-and-thrust belt, J. Struct. Geol., 118, 210–223, https://doi.org/10.1016/j.jsg.2018.10.011, 2019.
Chamberlin, T. C.: The Method of Multiple Working Hypotheses, Science (80-.), 148, 754–759, 1965.
Corredor, F., Shaw, J. H., and Bilotti, F.: Structural styles in the deep-water fold and thrust belts of the Niger Delta, Am. Assoc. Petr. Geol. B., 89, 753–780, https://doi.org/10.1306/02170504074, 2005.
Davis, K., Burbank, D. W., Fisher, D., Wallace, S., and Nobes, D.: Thrust-fault growth and segment linkage in the active Ostler fault zone, New Zealand, J. Struct. Geol., 27, 1528–1546, https://doi.org/10.1016/j.jsg.2005.04.011, 2005.
Drukpa, D., Gautier, S., Cattin, R., Namgay, K., and Le Moigne, N.: Impact of near-surface fault geometry on secular slip rate assessment derived from uplifted river terraces: Implications for convergence accommodation across the frontal thrust in southern Central Bhutan, Geophys. J. Int., 212, 1315–1330, https://doi.org/10.1093/gji/ggx478, 2018.
Epard, J. L. and Groshong, R. H.: Excess area and depth to detachment, AAPG Bull., 77, 1291–1302, https://doi.org/10.1306/bdff8e66-1718-11d7-8645000102c1865d, 1993.
Epard, J.-L. and Groshong, R. H.: Kinematic model of detachment folding including limb rotation, fixed hinges and layer-parallel strain, Tectonophysics, 247, 85–103, https://doi.org/10.1016/0040-1951(94)00266-C, 1995.
Eichelberger, N. W., Nunns, A. G., Groshong, R. H., and Hughes, A. N.: Direct estimation of fault trajectory from structural relief, Am. Assoc. Petr. Geol. B., 101, 635–653, https://doi.org/10.1306/08231616065, 2017.
Faleide, T. S., Braathen, A., Lecomte, I., Mulrooney, M. J., Midtkandal, I., Bugge, A. J., and Planke, S.: Impacts of seismic resolution on fault interpretation: Insights from seismic modelling, Tectonophysics, 816, 229008, https://doi.org/10.1016/j.tecto.2021.229008, 2021.
Frodeman, R.: Geological reasoning: geology as an interpretive and historical science, Geol. Soc. Am. Bull., 107, 960–968, https://doi.org/10.1130/0016-7606(1995)107<0960:GRGAAI>2.3.CO, 1995.
Gonzalez-Mieres, R. and Suppe, J.: Relief and shortening in detachment folds, J. Struct. Geol., 28, 1785–1807, https://doi.org/10.1016/j.jsg.2006.07.001, 2006.
Gonzalez-Mieres, R. and Suppe, J.: Shortening histories in active detachment folds based on area-of-relief methods, in: Thrust Fault-Related Folding, AAPG Mem., 39–67, https://doi.org/10.1306/13251332M943428, 2011.
Groshong, R. H.: Quality control and risk assessment of seismic profiles using area-depth-strain analysis, in: Interpretation, Vol. 3, Society of Exploration Geophysicists American Association of Petroleum Geologists, SAA1–SAA15, https://doi.org/10.1190/INT-2015-0010.1, 2015.
Groshong, R. H., Withjack, M. O., Schlische, R. W., and Hidayah, T. N.: Bed length does not remain constant during deformation: Recognition and why it matters, J. Struct. Geol., 41, 86–97, https://doi.org/10.1016/j.jsg.2012.02.009, 2012.
Hardy, S. and Connors, C. D.: Short note: A velocity description of shear fault-bend folding, J. Struct. Geol., 28, 536–543, https://doi.org/10.1016/j.jsg.2005.12.015, 2006.
Hirschmiller, J., Grujic, D., Bookhagen, B., Coutand, I., Huyghe, P., Mugnier, J. L., and Ojha, T.: What controls the growth of the himalayan foreland fold-and-thrust belt?, Geology, 42, 247–250, https://doi.org/10.1130/G35057.1, 2014.
Hu, W.-L. and Stevens, V. L.: Duplex kinematics reduces both frontal advance and seismic moment deficit in the Himalaya, Geology, https://doi.org/10.1130/G50229.1, 2022.
Lavé, J. and Avouac, J. P.: Active folding of fluvial terraces across the Siwaliks Hills, Himalayas of central Nepal, J. Geophys. Res.-Sol. Ea., 105, 5735–5770, https://doi.org/10.1029/1999jb900292, 2000.
Le Béon, M., Marc, O., Suppe, J., Huang, M. H., Huang, S. T., and Chen, W. S.: Structure and Deformation History of the Rapidly Growing Tainan Anticline at the Deformation Front of the Taiwan Mountain Belt, Tectonics, 38, 3311–3334, https://doi.org/10.1029/2019TC005510, 2019.
Li, T., Chen, J., Thompson, J. A., Burbank, D. W., and Yang, X.: Quantification of three-dimensional folding using fluvial terraces: A case study from the Mushi anticline, northern margin of the Chinese Pamir, J. Geophys. Res.-Sol. Ea., 118, 4628–4647, https://doi.org/10.1002/jgrb.50316, 2013.
Lindsay, M. D., Aillères, L., Jessell, M. W., de Kemp, E. A., and Betts, P. G.: Locating and quantifying geological uncertainty in three-dimensional models: Analysis of the Gippsland Basin, southeastern Australia, Tectonophysics, 546–547, 10–27, https://doi.org/10.1016/j.tecto.2012.04.007, 2012.
Moore, G., Shipley, T., Stoffa, P., Karig, D., Taira, A., Kuramoto, S., Tokuyama, H., and Suyehiro, K.: Structure of the Nankai Trough Accretionary Zone from multichannel seismic reflection data, J. Geophys. Res., 95, 8753–8766, https://doi.org/10.1029/JB095iB06p08753, 1990.
Randle, C. H., Bond, C. E., Lark, R. M., and Monaghan, A. A.: Can uncertainty in geological cross-section interpretations be quantified and predicted?, Geosphere, 14, 1087–1100, https://doi.org/10.1130/GES01510.1, 2018.
Rankey, E. C. and Mitchell, J. C.: That's why it's called interpretation: Impact of horizon uncertainty on seismic attribute analysis, Leading Edge, 22, 820, https://doi.org/10.1190/1.1614152, 2003.
Schlische, R. W., Groshong, R. H., Withjack, M. O., and Hidayah, T. N.: Quantifying the geometry, displacements, and subresolution deformation in thrust-ramp anticlines with growth and erosion: Frommodels to seismic-reflection profile, J. Struct. Geol., 69, 304–319, https://doi.org/10.1016/j.jsg.2014.07.012, 2014.
Schaaf, A. and Bond, C. E.: Quantification of uncertainty in 3-D seismic interpretation: implications for deterministic and stochastic geomodeling and machine learning, Solid Earth, 10, 1049–1061, https://doi.org/10.5194/se-10-1049-2019, 2019.
Shaw, J. H., Connors, C., and Suppe, J.: Seismic Interpretation of Contractional Fault-Related Folds, edited by: Mancini, E. A., The American Association of Petroleum Geologists (AAPG) Tulsa, Oklahoma, USA, https://doi.org/10.1306/St531003, 2005.
Shrestha, A., Joshi, G., Paudel, L. P., Sapkota, S. N., and Almeida, R.: Geology of the area between Bardibas and Sindhuli Madi, Sub-Himalaya, Central Nepal, J. Nepal Geol. Soc., 58, 131–138, https://doi.org/10.3126/jngs.v58i0.24597, 2019.
Stevens, V. L. and Avouac, J. P.: Interseismic coupling on the main Himalayan thrust, Geophys. Res. Lett., 42, 5828–5837, https://doi.org/10.1002/2015GL064845, 2015.
Suppe, J. and Medwedeff, D. A.: Geometry and kinematics of fault-propagation folding, Eclogae Geol. Helv., 83, 409–454, https://doi.org/10.5169/seals-166595, 1990.
Suppe, J., Connors, C. D., and Zhang, Y.: Shear fault-bend folding, in: Thrust Tectonics and Hydrocarbon Systems, AAPG Mem., 303–323, https://doi.org/10.1306/m82813c17, 2004.
Thiele, S. T., Jessell, M. W., Lindsay, M., Ogarko, V., Wellmann, J. F., and Pakyuz-Charrier, E.: The topology of geology 1: Topological analysis, J. Struct. Geol., 91, 27–38, https://doi.org/10.1016/j.jsg.2016.08.009, 2016.
Thompson, S. C., Weldon, R. J., Rubin, C. M., Abdrakhmatov, K., Molnar, P., and Berger, G. W.: Late Quaternary slip rates across the central Tien Shan, Kyrgyzstan, central Asia, J. Geophys. Res.-Sol. Ea., 107, ETG 7-1-ETG 7-32, https://doi.org/10.1029/2001jb000596, 2002.
Totake, Y., Butler, R. W. H., and Bond, C. E.: Structural validation as an input into seismic depth conversion to decrease assigned structural uncertainty, J. Struct. Geol., 95, 32–47, https://doi.org/10.1016/j.jsg.2016.12.007, 2017.
Wang, W., Yin, H., Jia, D., Wu, Z., Wu, C., and Zhou, P.: Calculating detachment depth and dip angle in sedimentary wedges using the area–depth graph, J. Struct. Geol., 107, 1–11, https://doi.org/10.1016/j.jsg.2017.11.014, 2018.
Wellmann, F. and Caumon, G.: 3-D Structural geological models: Concepts, methods, and uncertainties, Adv. Geophys., 59, 1–121, https://doi.org/10.1016/bs.agph.2018.09.001, 2018.
Xu, J., Chen, J., Arrowsmith, J. R., Li, T., Zhang, B., Di, N., and Pang, W.: Growth Model and Tectonic Significance of the Guman Fold Along the Western Kunlun Mountain Front (Xinjiang, China) Derived From Terrace Deformation and Seismic Data, Front. Earth Sci., 8, 1–19, https://doi.org/10.3389/feart.2020.590043, 2020.
Yue, L. F., Suppe, J., and Hung, J. H.: Two contrasting kinematic styles of active folding above thrust ramps, western taiwan, in: Thrust Fault-Related Folding, AAPG Mem., 153–186, https://doi.org/10.1306/13251337M943431, 2011.
Zechar, J. D. and Frankel, K. L.: Incorporating and reporting uncertainties in fault slip rates, J. Geophys. Res.-Sol. Ea., 114, 1–9, https://doi.org/10.1029/2009JB006325, 2009.