the Creative Commons Attribution 4.0 License.
the Creative Commons Attribution 4.0 License.
 | 29 Sep 2022
Raman spectroscopy in thrust-stacked carbonates: an investigation of spectral parameters with implications for temperature calculations in strained samples
Lauren Kedar
Clare E. Bond
David K. Muirhead
Raman spectroscopy is commonly used to estimate peak temperatures in rocks containing organic carbon. In geological settings such as fold–thrust belts, temperature constraints are particularly important as complex burial and exhumation histories cannot easily be modelled. Many authors have developed equations to determine peak temperatures from Raman spectral parameters, most recently to temperatures as low as 75 ∘C. However, recent work has shown that Raman spectra can be affected by strain as well as temperature. Fold–thrust systems are often highly deformed on multiple scales, with deformation characterised by faults and shear zones, and therefore temperatures derived from Raman spectra in these settings may be erroneous. In this study, we investigate how some of the most common Raman spectral parameters (peak width, Raman band separation) and ratios (intensity and area) change through a thrust-stacked carbonate sequence. By comparing samples from relatively low-strain localities to those on thrust planes and in shear zones, we show maximum differences of 0.16 for ID / IG and 0.11 for R2, while full width at half-maximum (FWHM[d]) and Raman band separation show no significant change between low- and high-strained samples. Plausible frictional heating temperatures of faulted samples suggest that the observed changes in Raman spectra are not the result of frictional heating. We also consider the implications of these results for how temperatures are determined using Raman spectra in strained and unstrained rock samples.
- Article
(4515 KB) - Full-text XML
- BibTeX
- EndNote


Raman spectroscopy can be used to provide information on the nanostructure of organic carbon in rocks (Tuinstra and Koenig, 1970; Landis, 1971; Nemanich and Solin, 1979; Knight and White, 1989; Ferrari and Robertson, 2001; Beyssac et al., 2002a; Muirhead et al., 2012, 2017a, 2021; Schito et al., 2017; Kedar et al., 2020). Since this nanostructure changes irreversibly with increasing temperature (e.g. Beyssac et al., 2002; Rahl et al., 2005; Huang et al., 2010; Muirhead et al., 2012), Raman is a useful tool for establishing the peak temperature of rocks in a variety of settings. In turn, peak temperatures can provide information about sedimentary burial conditions (e.g. Beyssac et al., 2002; Muirhead et al., 2012, 2017a; Schito et al., 2017), low-grade contact metamorphism (e.g. Aoya et al., 2010; Chen et al., 2017; Muirhead et al., 2017b), and tectonic thrust stacking. (Nibourel et al., 2018; Muirhead et al., 2019). Much work has been done to develop temperature equations that are based on Raman spectral parameters and are applicable across a range of settings and geological processes (e.g. Beyssac et al., 2002; Lahfid et al., 2010; Kouketsu et al., 2014; Schito and Corrado, 2018; Wilkins et al., 2018). With increasing understanding of organic carbon nanostructure, such equations have been recently applied to a much wider range of temperatures (down to 75 ∘C; Schito and Corrado, 2018; Muirhead et al., 2019) and geological settings such as fold–thrust belts (Nibourel et al., 2018, 2021; Muirhead et al., 2019). Fold–thrust systems, driven by deformation, are subject to complex burial and exhumation histories, so the temperature history for a specific rock within a thrust-stacked sequence is often not straightforward. In addition to this thermal complexity, recent work has shown Raman spectra to be affected by strain (Kwiecinska et al., 2010; Kitamura et al., 2012; Furuichi et al., 2015; Kedar et al., 2020). Therefore, if temperatures are to be investigated using Raman spectroscopy in strained terrains, the individual effects of strain and temperature on Raman spectra need to be isolated from one another.
In this study, we analyse the impact of strain and temperature on organic carbon nanostructure in a fold–thrust belt. Raman spectral parameters for a suite of samples, taken from a transect across a thrust-stacked carbonate sequence in the French Alps, are plotted on a cross-section. We use this visualisation, and the associated Raman data, to investigate how the most commonly used Raman spectral parameters in published temperature equations – peak intensity ratio (ID / IG), Raman band separation (RBS), peak width (also known as full width at half-maximum, or FWHM), and peak area ratio (R2) – change through the sequence. We also identify samples which are affected by locally high strain, such as thrust faults and shear zones, and assess how the Raman spectra of these samples differ from adjacent samples which have only been exposed to regional “background” strain levels as opposed to localised deformation. By quantifying how each Raman spectral parameter listed above changes in strained samples, we assess the sensitivity to strain of each parameter. We compare faulted samples to those from a ductile shear zone to investigate the effect of seismic slip events vs. aseismic creep on Raman spectra, an important step towards separating the effects of strain and temperature. We discuss the implications of our findings on the ability of Raman-based geothermometers to predict geothermal gradients in thrust-stacked sequences and to predict temperatures in locally strained rock samples.
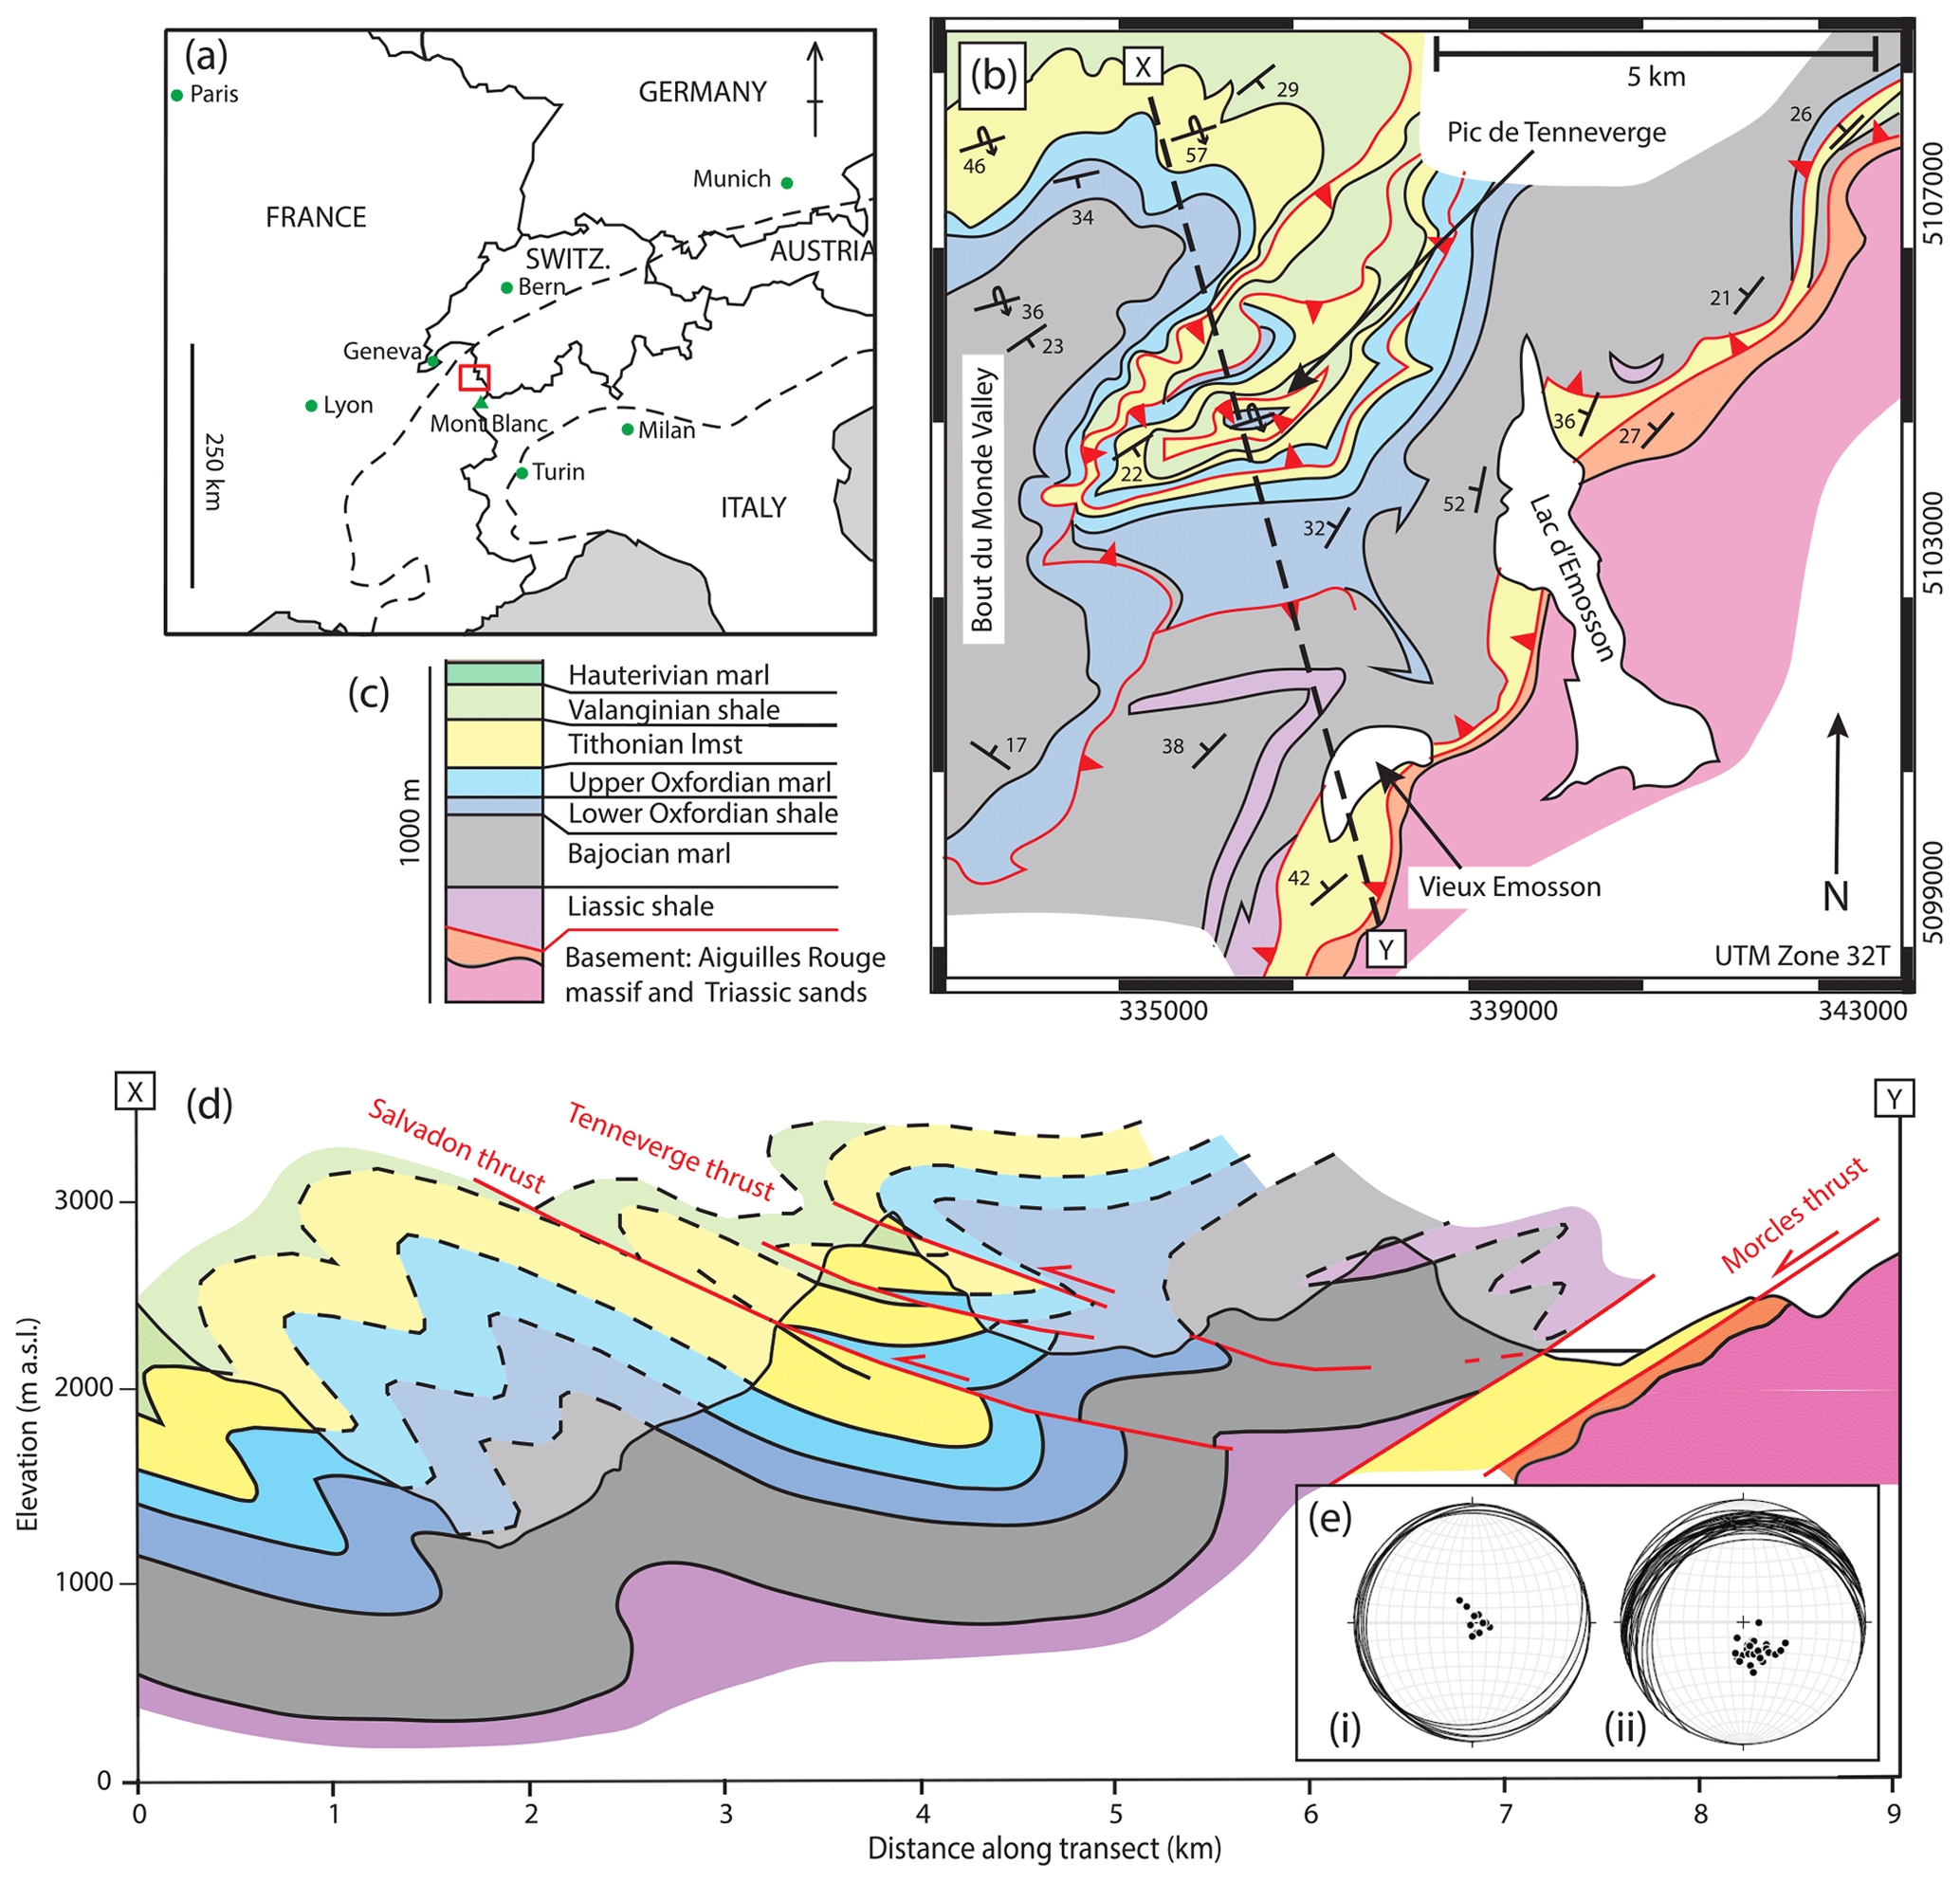
Figure 1Geology of the Haut Giffre. (a) Location of the Haut Giffre region (red box) within the Alpine chain (dashed lines) on the French–Swiss border. (b) Simplified geological map of the eastern Haut Giffre, including major thrust faults and regional dips. Significant geographic features are labelled. The cross-section line x–y is indicated by a dashed line. (c) Main lithological units outcropping in the Haut Giffre. (d) NNW–SSE cross-section as indicated by line x–y in (a). (e) Stereonets showing cleavage and poles to cleavage at the (i) highest stratigraphic levels (lower Oxfordian and above, limited to Pic de Tenneverge massif) and (ii) lowest stratigraphic levels (within 1 km of the Morcles thrust).
The Haut Giffre region of the French Alps (Fig. 1a, b) encompasses 3000 m of Jurassic–Cretaceous carbonates, split into six broad units (Fig. 1c) of contrasting mechanical properties. Each unit has a characteristic bed thickness, ranging from 0.005 m in shale-rich layers (Valanginian and lower Oxfordian) to 10 m in the massive Tithonian carbonates. The complete sequence is shown in cross-section in Fig. 1d. A regional cleavage pervades the stratigraphy, dipping NNW at a low angle (5–10∘) with an average strike of around 210∘. Approaching the Morcles thrust, the cleavage shallows to horizontal and then steepens to dip at 20–40∘ towards the SE (Fig. 1b). Throughout the stratigraphy, the finer-grained, more thinly bedded units, typically with higher organic carbon content, exhibit stronger cleavage.
The Morcles nappe, in which the study area lies, is the lowermost of the Helvetic nappes and consists of a “normal” limb and a lower overturned limb (Ramsay, 1980; Dietrich and Durney, 1986; Dietrich and Casey, 1989; Kirschner et al., 1999; Austin et al., 2008). The normal limb was subject to around 6 km of burial during the Alpine orogeny (Pfiffner, 1993; Kirschner et al., 1999; Austin et al., 2008). It is at this point that peak metamorphic (and hence maximum temperature) conditions are thought to have occurred; these remain “sub-greenschist” (Kirschner et al., 1995). The overturned limb of the Morcles nappe outcrops in a 600 m thick band which dips NW, parallel to the Morcles thrust below (Fig. 1d; note that here the Morcles thrust occupies the geometry of a low-angle normal fault). This overturned limb is mostly sheared Tithonian limestone in the study area, with small wedges of other units included in thrust splays. Beneath the nappe, Triassic sands cap the Aiguilles Rouge massif, and these together are treated as basement here.
Regional-scale thrust faults in the Haut Giffre cut through multiple carbonate units. The carbonate units themselves have contrasting mechanical properties. Massive or thickly bedded limestones (e.g. Tithonian, Urgonian) act as competent beams, folding coherently on 100 m scale wavelengths in the hanging walls and footwalls of thrusts. Interspersed between these massive limestones is a series of thinly bedded, relatively carbon-rich shales and marls (e.g. Liassic, lower Oxfordian, Valanginian) which have undergone internal deformation by means of incoherent folding and the formation of multiple internal detachment surfaces. The non-uniform distribution of strain in the Haut Giffre makes it the suitable subject of an investigation into the effect of strain on Raman spectra.
Samples were taken throughout the 3 km thick thrust-stacked sequence. Significant topographic relief in the form of inaccessible cliff sections necessitated sampling at laterally distributed sites (Fig. 1b); these sites are represented in the cross-section (Fig. 1d) as lateral equivalents. Sample sites that could not be traced laterally to the section line, e.g. due to faulting or folding, are not included in the study.
Samples were categorised for their level of strain and classified on a simple binary scale as either (1) being distal from thrusts or shear zones, where strain fabrics were present but not intense, indicative of a background level of strain; or (2) where zones of intense strain were present. These two sample site types are termed (1) “background” and (2) “strained” for the purpose of this study. It should be noted that although all samples have been subject to regional deformation, the term strained in this context implies that the samples have undergone localised deformation in the form of thrust faults or shear zones as opposed to background strain levels.
In order to differentiate between sites of relatively high and low shear strain, outcrop- and hand specimen-scale strain indicators were visually analysed in the field. The NNW-oriented regional cleavage, which is more pervasive in the marls than the massive limestones, was used as a baseline for signs of a strain fabric within each lithology; a more intense fabric (for example, one in which the cleavage more strongly overprinted the bedding features than in the surrounding rock) or a localised change in cleavage orientation might suggest a localised intensification of the strain field. Usually such changes in cleavage orientation were associated with a fold hinge, a thrust, or a shear zone. Where these features were not present and the dominant fabric occupied a similar orientation and intensity as those of the regional cleavage, samples were considered to have undergone background levels of strain.
Localities were defined as strained if they were associated with a structure such as a fold hinge, thrust, or shear zone and had therefore undergone locally high levels of shear strain in comparison to background levels. As mentioned above, often there was a change in the strain fabric from background levels – either in intensity, orientation, or both – approaching these structures. Moving away from the structure, once the fabric had returned to the regional intensity and orientation, samples were no longer considered strained.
Within strained localities, fine-scale (0.1 to 10 m scale) transects were sampled perpendicular to the orientation of the structure – for example, in the case of a thrust, a sample would be taken on the thrust plane, 10–30 cm above and below the thrust plane, and 1 to 10 m above and below it, depending on where shear strain appeared to return to background levels. Five samples would therefore be the minimum number for a transect across a thrust. Within broader shear zones, multiple samples were taken from within the shear zone itself, and then at least two were taken at varying distances from the shear zone in either direction, provided the outcrop permitted this. Where complex shear zones contained multiple thrust splays on a metre scale, samples were taken from individual thrust planes, and one or more would be collected from each intervening thrust slice. Samples were also taken from outwith the fault or shear zone to complete the transect.
Background samples were collected to establish the trend in parameters through the complete stratigraphy. At these sites, transects were not made, and background sample sites represent either one sample or the average of a cluster of two to three samples from a single outcrop.
3.1 Background sample sites
Samples were deemed to be subject to background strain only if they conformed to two criteria: (1) strain fabric at the sample site was parallel to the regional strain fabric in that area, and (2) the sample strain fabric was visually interpreted to be of similar intensity as the regional fabric in that unit. This interpretation, for the purposes of initial sample selection, was based on field observations and confirmed through inspection of micro-scale structures in thin section (note that most organic material was located between calcite grains and within seams of insoluble material). Practically, this meant that the sample was not part of a shear zone or a fault. Background samples were collected at distances of greater than 10 m from such localised high-strain zones. Where a high-strain zone was diffusely bounded, with a gradual return to background levels, the area was avoided entirely for the purpose of background sampling. Since the entire field area is part of a fold–thrust system, avoiding localised zones of high strain significantly limited potential sample sites. In total, 22 background samples from 15 different sites were included in the study, distributed approximately evenly within the intervening stratigraphy, between strained sites.
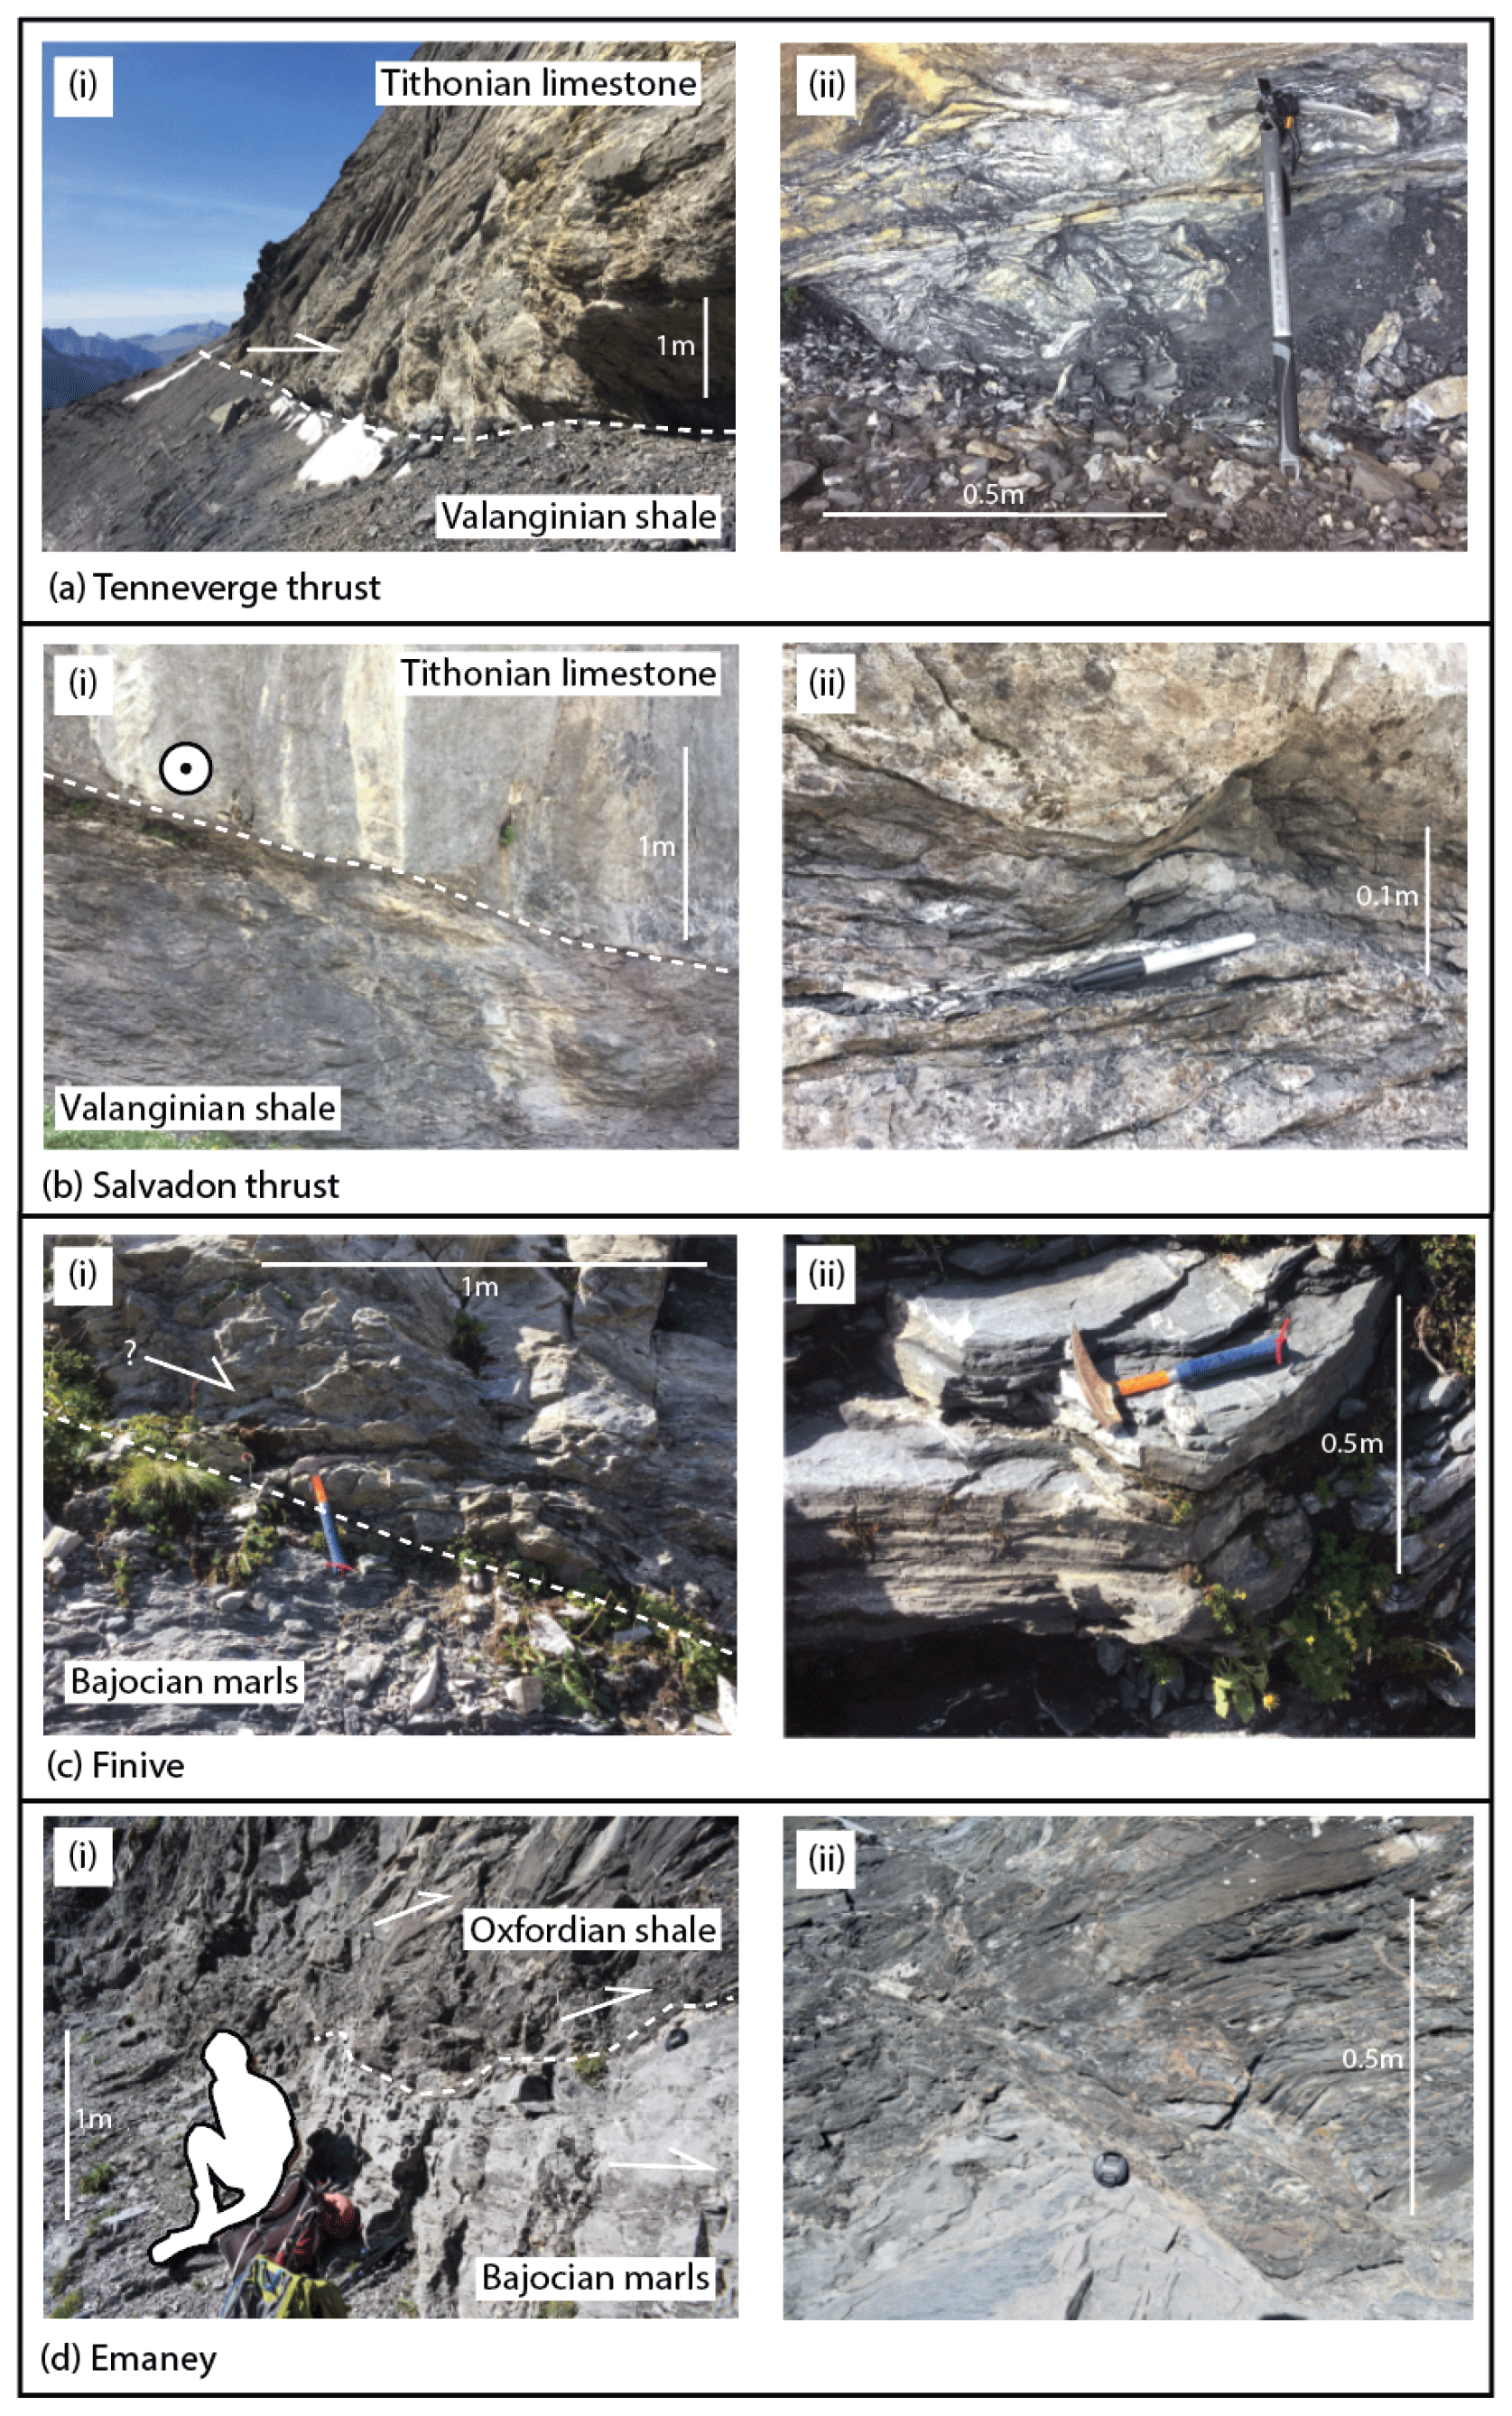
Figure 2“Strained” localities. (a) Tenneverge thrust, showing (i) Tithonian limestone in the hanging wall thrusted at a low angle over Valanginian shale, and (ii) a close-up of the thrust surface, showing penetration of the fault zone into the footwall shales. (b) Salvadon thrust, showing (i) the thrust surface at outcrop scale, with Tithonian limestone thrust over Valanginian shales, and the direction of displacement obliquely out of the page; (ii) a close-up view of the thrust surface, showing a clear step change in lithology and small undulations in the surface. (c) Finive shear zone and thrust splay, with (i) the fault exhibiting displacement on a 1 to 10 m scale, occupying the apparent geometry of a low-angle normal fault; (ii) ductile fabrics of the surrounding shear zone. (d) Emaney shear zone, demonstrating (i) the partitioning of strain into the overlying shales, evident in the differing fabric intensities; (ii) a close-up of the boundary between the two units.
3.2 Strained site samples
Four strained sample sites were selected (Fig. 2), three of which are centred around thrusts (Tenneverge, Salvadon, and Finive) and one in the Emaney shear zone. They are described in detail below. Displacements across thrusts and shear zones are estimated from cross-sections based on field mapping.
3.2.1 Tenneverge (Fig. 2a)
The Tenneverge thrust forms a discrete fault plane between Valanginian in the footwall and the Tithonian which overlies it (Fig. 2a, i). Displacement here is estimated at 1 km (Fig. 1d). The Tithonian in the hanging wall is overturned at this locality, and the thinner beds at the base of the Tithonian sequence, which here lie (overturned) directly above the thrust plane, show localised tight chevron folding.
Samples collected from the Valanginian footwall at 12, 5, and 0.5 m from the thrust plane show a gradual reduction in observable primary bedding towards the thrust, replaced by a deformation fabric of increasing intensity (Fig. 2a, ii). This intensification is manifested in a transition from visible bedding planes, coupled with the regional sub-horizontal deformation fabric, into a dominant fault-parallel foliation which overrides the other fabrics. In the final 0.5 m below the thrust surface, the deformation fabric has been further deformed by rotation and small detachments, suggesting highly localised strain partitioning as part of a complex evolutionary history involving multiple fault movements and fabric overprinting. Intense veining accompanies this deformed layer (Fig. 2a, ii). In the 10 cm adjacent to the thrust plane the fabric appears more coherent, with the foliation orientated parallel to the fault surface.
3.2.2 Salvadon (Fig. 2b)
The Salvadon thrust is a regional thrust fault with a maximum lateral displacement of 2 km towards the NW (Fig. 1d). At the sample site, Tithonian limestone is thrust over a thickened wedge of Valanginian shale. The thrust plane dips approximately 25∘ SE, with Tithonian bedding sub-parallel to this (strike 122∘, dip 25∘ SW). The contrasting competencies of the lithologies here give rise to a discrete fault surface (Fig. 2b, i).
Small (10 cm scale) undulations in the fault surface (Fig. 2b, ii), along with small fractures interrupting bedding at the base of the Tithonian, indicate that some strain was partitioned into the section of the Tithonian most proximal to the thrust (<0.5 m thick). Above this, the Tithonian loses evidence of additional horizontal strain, reverting to bedding-parallel stylolites and orthogonal sub-vertical fracture sets that are common to the Tithonian throughout the Haut Giffre. In the footwall, Valanginian shales show evidence of increased strain several metres below the thrust surface. The first metre below the fault plane is dominated by a fault-parallel foliation (050/23∘ SE), which gradually rotates towards a more bedding-parallel orientation (122/25∘ SW) with distance from the fault surface over ∼4 m. In a 4–5 m thick zone approaching the fault, en echelon and orthogonal fracture sets (Fig. 2b, i) are present in the footwall, indicative of a high degree of strain. Foliation-parallel veins are also present in the upper 1 m of the footwall, increasing in frequency towards the thrust plane (Fig. 2b, i).
3.2.3 Finive (Fig. 2c)
The Finive sample site is an intraformational thrust splay (Fig. 2c, i). The splay branches from a regional thrust below, which separates the sheared overturned lower limb of the Morcles nappe from the normal limb above, and runs parallel to the Morcles thrust 400 m below (Fig. 1d). Above this regional thrust, Bajocian marls and Liassic shales are tightly folded and thrusted. All samples at the Finive sample site are from the lowermost Bajocian, within which the intraformational thrust splay sits, and it is likely that this portion of the unit is overturned. However, most sedimentary features here have been heavily, if not fully, overprinted during deformation. Compositional layers have been stretched and thinned to 1–5 cm (Fig. 2c, ii); around 10 %–30 % of the thickness of such layers is outwith this deformation zone. Boudinage and centimetre-scale folding are both common features in these compositional bands. Straight, foliation-parallel veins 1–5 mm thick are a pervasive feature. The thrust splay, around which sampling was concentrated, is parallel to the deformation fabric, which is at a low angle to compositional layering (around 10∘ separation); as a result, displacement is difficult to estimate. Samples were taken from 10 m above, 0.1 m above, 0.1 to 1 m below, 2 m below, and 10 m below the thrust.
3.2.4 Col d'Emaney (Fig. 2d)
Samples taken from Col d'Emaney are from the base of the sheared lower limb of the Morcles nappe. Here, a wedge of Bajocian material overlain by a shale-rich unit (Fig. 2d, i) is overthrust by overturned Tithonian. It is unclear as to whether the Bajocian wedge is overturned or not, as the overlying shale-rich unit is highly sheared. Previous geological surveys (e.g. those carried out by the French geological survey, BRGM) have mapped the shale as Oxfordian (suggesting this wedge is the right way up), but it could also be overturned Liassic; distinction based on field observations is inconclusive owing to the strong strain fabric that overprints sedimentary characteristics in the shale. The precise lithological unit is not of great importance here; what matters is the position within the overall thrust-stacked sequence and the mechanical properties of the unit.
The contact of the shale unit with the Bajocian gives rise to a 4 m thick shear zone within the shale, where deformation fabrics are greatly enhanced. S- and C-style fabrics are visible on a centimetre scale, along with low-angle fractures which tend to run parallel to the shear fabrics and are bounded by rotated compositional bands (Fig. 2d, ii). The combination of these ductile fabrics and brittle, blocky fractures suggests a complicated deformation history. Many of the S–C shears form tight clusters which act to increase the discontinuity between “blocks” of material. Additionally, deformation-related undulations in the upper surface of the Bajocian (which resemble 0.5 m scale normal faults, with rotation of the Bajocian cleavage to run parallel to the lithological contact) are accompanied by significant concentrations of ductile strain fabrics and veining in the shale above (Fig. 2d, ii). The entire wedge is sheared to an extent, evidenced by strong cleavage and thinning of compositional bands. However, approaching the contact (i.e. within 1 m), the Bajocian cleavage rotates to be almost parallel to the perturbations in the contact surface, resulting in metre-scale “waves” in the fabric. Within the shale, the highly concentrated deformation zone extends for around 4 m before the fabric consistently returns to the regional orientation.
4.1 Introduction to Raman spectroscopy
Raman spectroscopy measures the wavelengths of radiation produced by inelastic (Raman) scattering during the de-excitation of electrons in different molecular bonds, in this case focussing on those involved in different forms of organic carbon. In rocks, organic carbon can take on a range of nanostructures, depending on many factors during both deposition and burial: these include, but are not limited to, initial kerogen type, peak temperature, and the strain conditions to which the rock has been exposed. In the initial stages of burial, the carbon will have a nanostructure resembling that of kerogen (Thrower, 1989; Beyssac et al, 2002a; Rouzaud et al., 2015). As temperatures start to increase, the carbon nanostructure breaks down into smaller fragments as bonds are broken. With the application of strain (Kwiecinska et al., 2010; Kitamura et al., 2012, 2018; Savage et al., 2014; Furuichi et al., 2015) or very high temperatures (Wopenka and Pasteris, 1993; Oberlin et al., 1999; Schito et al., 2017), these fragments are aligned into parallel sheets, approaching a graphitic nanostructure. Graphitisation has not occurred in any samples in this study.
4.2 Sample preparation and spectral acquisition
A total of 62 samples were crushed and powdered before being treated with 10 % HCl to remove inorganic carbon and therefore improve the signal-to-noise ratio when obtaining Raman spectra (Pasteris, 1989; Salver-Disma et al., 1999; Beyssac et al., 2002b; Mostefaoui et al., 2008; Muirhead et al., 2012). The residue was then rinsed and dried at room temperature to avoid thermal alteration. Using a Renishaw InVia Raman spectrometer at the University of Aberdeen, a 514 nm laser was targeted at individual grains in the residual powders; the laser power was <0.3 mW at the sample, and spot size was 1–2 µm. Each run comprised three co-adds of 5 s acquisitions to produce a single spectrum for analysis. This process was carried out on 10 individual grains from each sample.
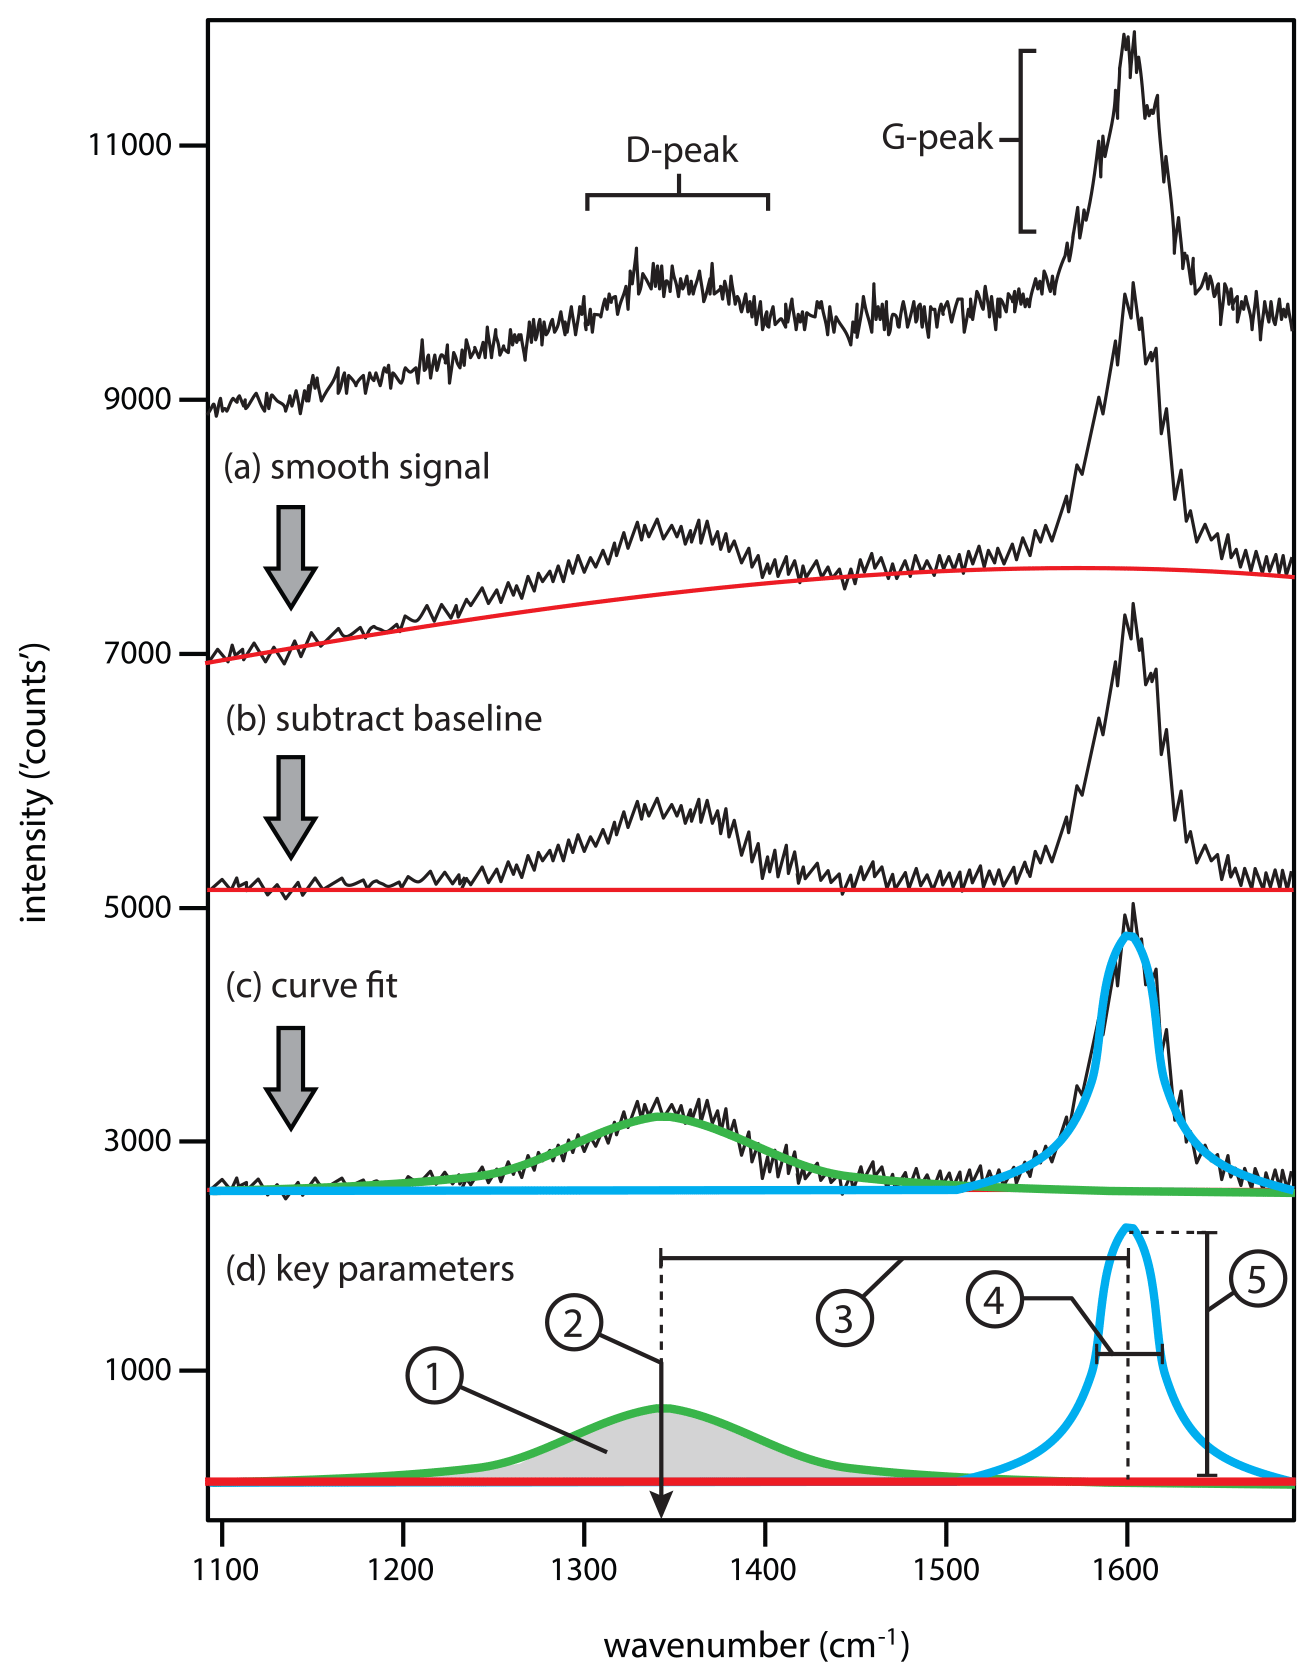
Figure 3Deconvolution process using WiRE 3.4, showing (a) noise reduction, (b) baseline removal by means of user-guided cubic spline interpolation, (c) Gaussian curve fit of two curves, and (d) key components used in parameter calculations: (1) curve area (A), (2) peak position (W), (3) Raman band separation (RBS), (4) full width at half-maximum (FWHM), (5) peak intensity (I).
Backscattered radiation was recorded, deconvolved, and analysed using Renishaw WiRE 3.4 software (Fig. 3). Using in-built software functions, noise reduction was first carried out on each spectrum (Fig. 3a), before baseline removal was performed using a cubic spline interpolation, which was user-guided (Fig. 3b). Finally, a Gaussian curve fit was applied to the two visible peaks in the spectrum (Fig. 3c), as in Bonal et al. (2006), and the Raman spectra parameters (peak intensity, position, width and area) were recorded (Fig. 3d; Quirico et al., 2009; Olcott Marshall et al., 2012). This process was carried out three times for each spectrum to minimise the error involved in the user-guided baseline removal process, resulting in 30 analyses per sample. Data points presented in this study therefore represent an average derived from 30 spectra per sample.
4.3 Raman spectral parameters
Different Raman spectral parameters are used in combination to determine the carbon nanostructure in a sample. Figure 3d highlights five key spectral parameters that can be calculated from the two curves fitted to the D and G peaks.
-
Peak area (A). The height and therefore area of a single peak are affected by signal strength, but comparing the areas beneath the D and G peaks negates this issue. The most common ratio comparison is known as R2, which is calculated as A[d] (A[g] + A[d]).
-
Peak position (W). This is the wavenumber of the peak. In this study we consider a broad D peak around 1350 cm−1 and a sharp G peak in the range of 1585–1610 cm−1.
-
Raman band separation (RBS). This is the difference between the two peak positions (W[g] − W[d]).
-
Peak width (FWHM). Calculated as the full width at half-maximum, FWHM is measured parallel to the horizontal axis.
-
Peak intensity (I). The intensity of a single peak is a direct product of signal strength, i.e. how many Raman-scattered photons come into contact with the detector. This can be affected by several factors including the amount of carbon present within the laser spot or the strength of the laser. It is therefore more common to use the ratio between the D and G peaks (ID / IG), which will be characteristic of the nanostructural features regardless of signal strength.
The G peak defined here can be considered a composite of up to three spectral bands (D2, G, and D3) depending on metamorphic grade, but at low maturities such as those in this study they are difficult to distinguish and can be collectively referred to as a single peak (Beyssac et al., 2002; Muirhead et al., 2021).
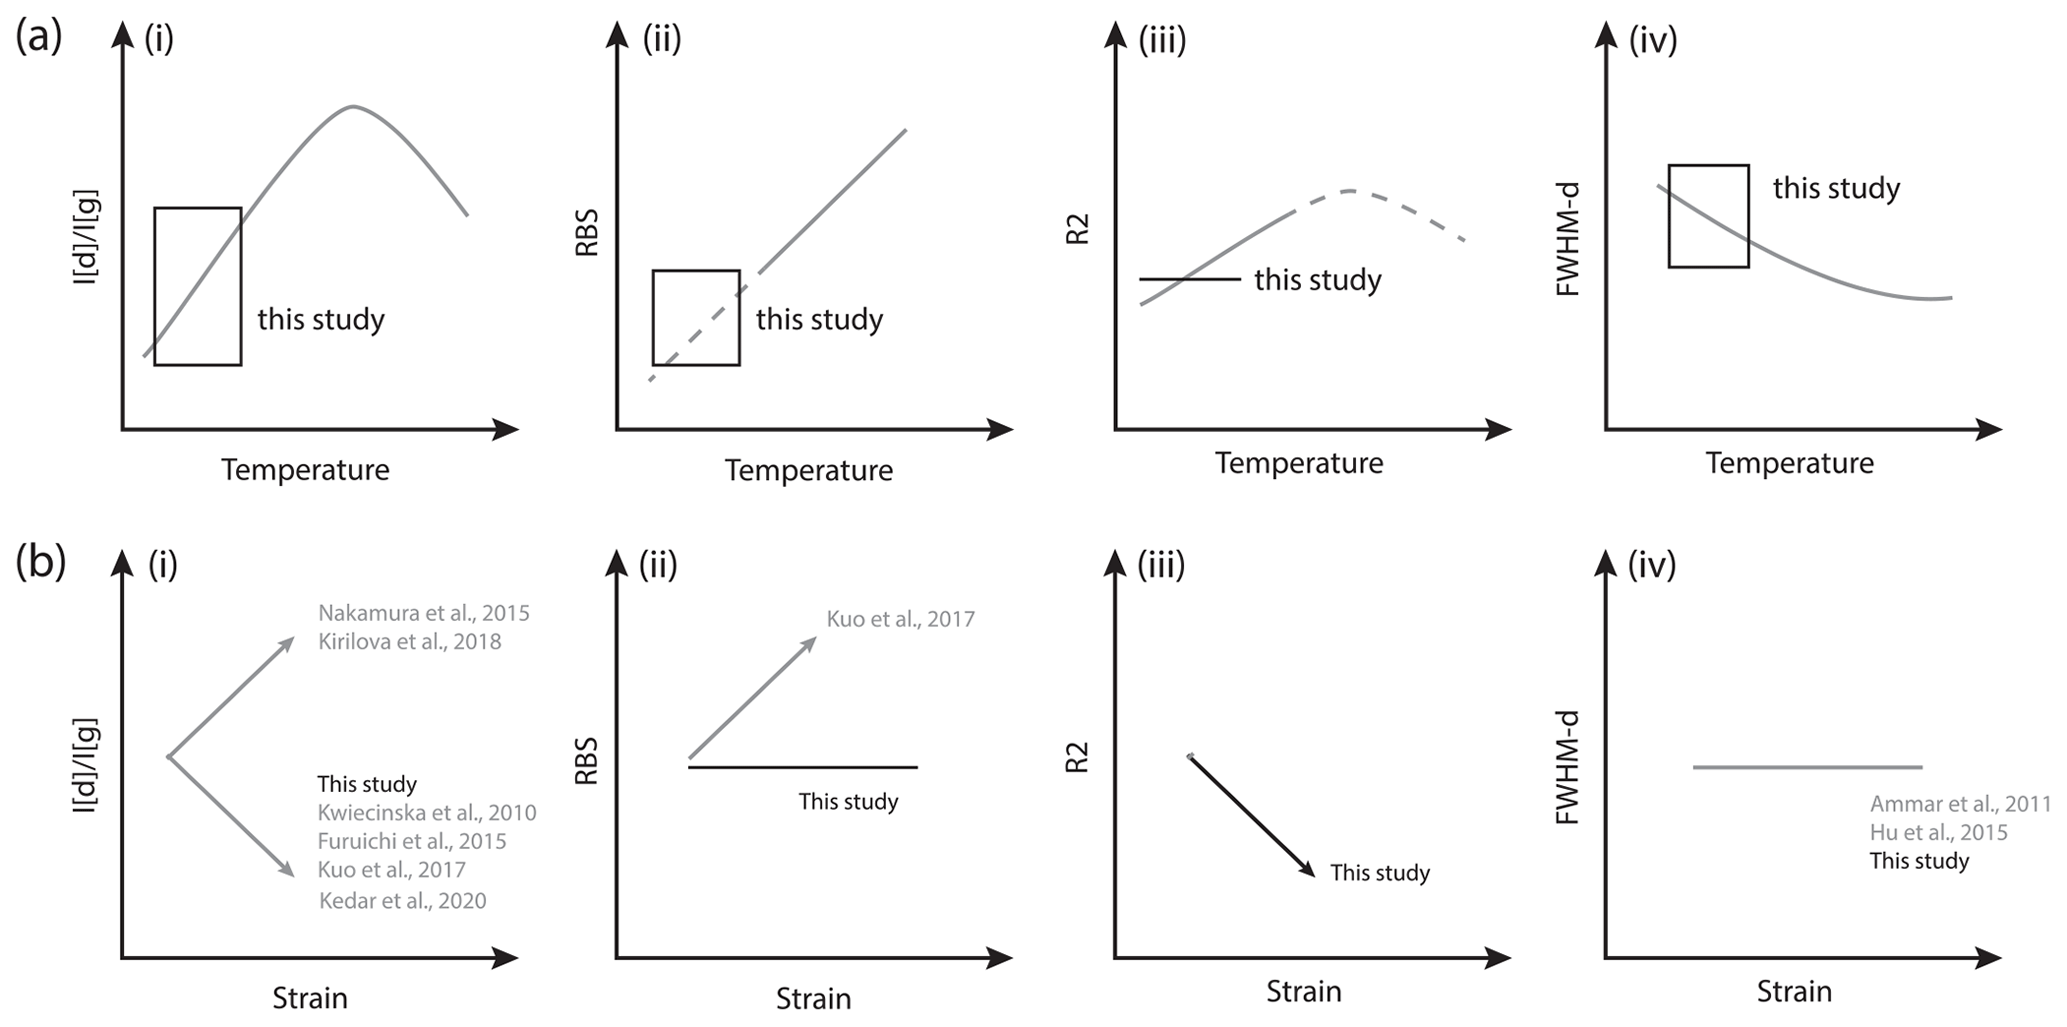
Figure 4Typical changes in Raman spectroscopic parameters with temperature and strain, represented schematically. Exact temperature, strain, or parameter values are not stipulated, since these will vary depending on starting material. Where data from this study match the trend, the applicable zone is marked with a black box; where they differ from the usual trend, data from this study are marked with a black line representing the observed trend. Where there are two trend lines in (b)(i), this indicates the study of different carbon starting types. (a) Parametric changes with temperature: (i) intensity ratio (ID / IG); (ii) Raman band separation (RBS); (iii) area ratio (R2); (iv) D-peak width (FWHM[d]). (b) Direction of parametric shifts with the application of strain: (i) intensity ratio; (ii) Raman band separation; (iii) area ratio; (iv) D-peak width.
Figure 4 shows a schematic summary of the changes in Raman spectral parameters with increasing temperature and strain. At low maturities, as amorphous carbon degrades with increasing temperature, the D peak increases in intensity (Tuinstra and Koenig, 1970; Levine, 1993; Oberlin et al., 1999). This increases the ID / IG ratio (Fig. 4a, i). Subsequently, as higher maturities are reached, carbonaceous fragments align into sheets and the G peak becomes more intense, decreasing ID / IG (Muirhead et al., 2012, 2017; Buseck and Beyssac, 2014). Generally, a decrease in ID / IG is observed when strain is applied to relatively low-maturity organic carbon (Fig. 4a, ii; Kwiecinska et al., 2010; Kitamura et al., 2012; Furuichi et al., 2015), but brittle fragmentation has been reported when mature, nearly graphitic carbon is subject to low-temperature strain, resulting in an ID / IG increase (Nakamura et al., 2015; Kirilova et al., 2018).
In addition to changing intensity, both the D and G peaks shift towards lower wavenumbers as the material approaches complete graphitisation, but the D peak shifts more significantly (Wopenka and Pasteris, 1993; Beyssac et al., 2002; Quirico et al., 2009). This causes the RBS to change (e.g. Zhou et al., 2014; Schmidt et al., 2017; Schito and Corrado, 2018; Henry et al., 2019). Figure 4b(i) shows an increase in RBS with increasing temperature at higher maturities, but little is known about how the parameter changes at low maturities such as in this study. The effect of strain has not been studied extensively, although Kuo et al. (2017) reported an increase in RBS with the application of strain (Fig. 4b, ii).
Figure 4c(i) illustrates how the R2 (curve area) ratio has been shown to correlate with temperature (Beyssac et al., 2002; Aoya et al., 2010; Nakamura et al., 2015; Chen et al., 2017; Kirilova et al., 2018; Henry et al., 2019). It follows a pattern similar to that of ID / IG with temperature, but little work has been done to establish whether this similarity extends to strain (Fig. 4c, ii).
It is generally accepted that the width (measured as full width at half-maximum, FWHM) of the D and G peaks changes with temperature (Zeng and Wu, 2007; Aoya et al., 2010; Kouketsu et al., 2014; Zhou et al., 2014; Hu et al., 2015; Bonoldi et al., 2016; Chen et al., 2017). However, the nature of the change varies depending on the thermal and barometric conditions, along with the nature of the organic starting material. At relatively low temperatures (<300 ∘C), these studies report a decrease in FWHM[d] with increasing temperature (Fig. 4d, i), which also correlates with an increase in ID / IG. FWHM[d] is thought to undergo very little change, if any, when exposed to differential strain (Ammar et al., 2011; Hu et al., 2015; Fig. 4d, ii).
Therefore, comparison of the relative intensities, positions, widths, and areas of the D and G peaks is a common method of assessing the extent to which a rock has been heated, which can be correlated with geological processes such as burial depth, contact metamorphism, and exposure to hot fluids. By comparison, the investigation of the effect of strain on these parameters is in its infancy (Kwiecinska et al., 2010; Kitamura et al., 2012; Furuichi et al., 2015; Kuo et al., 2017; Kedar et al., 2020).
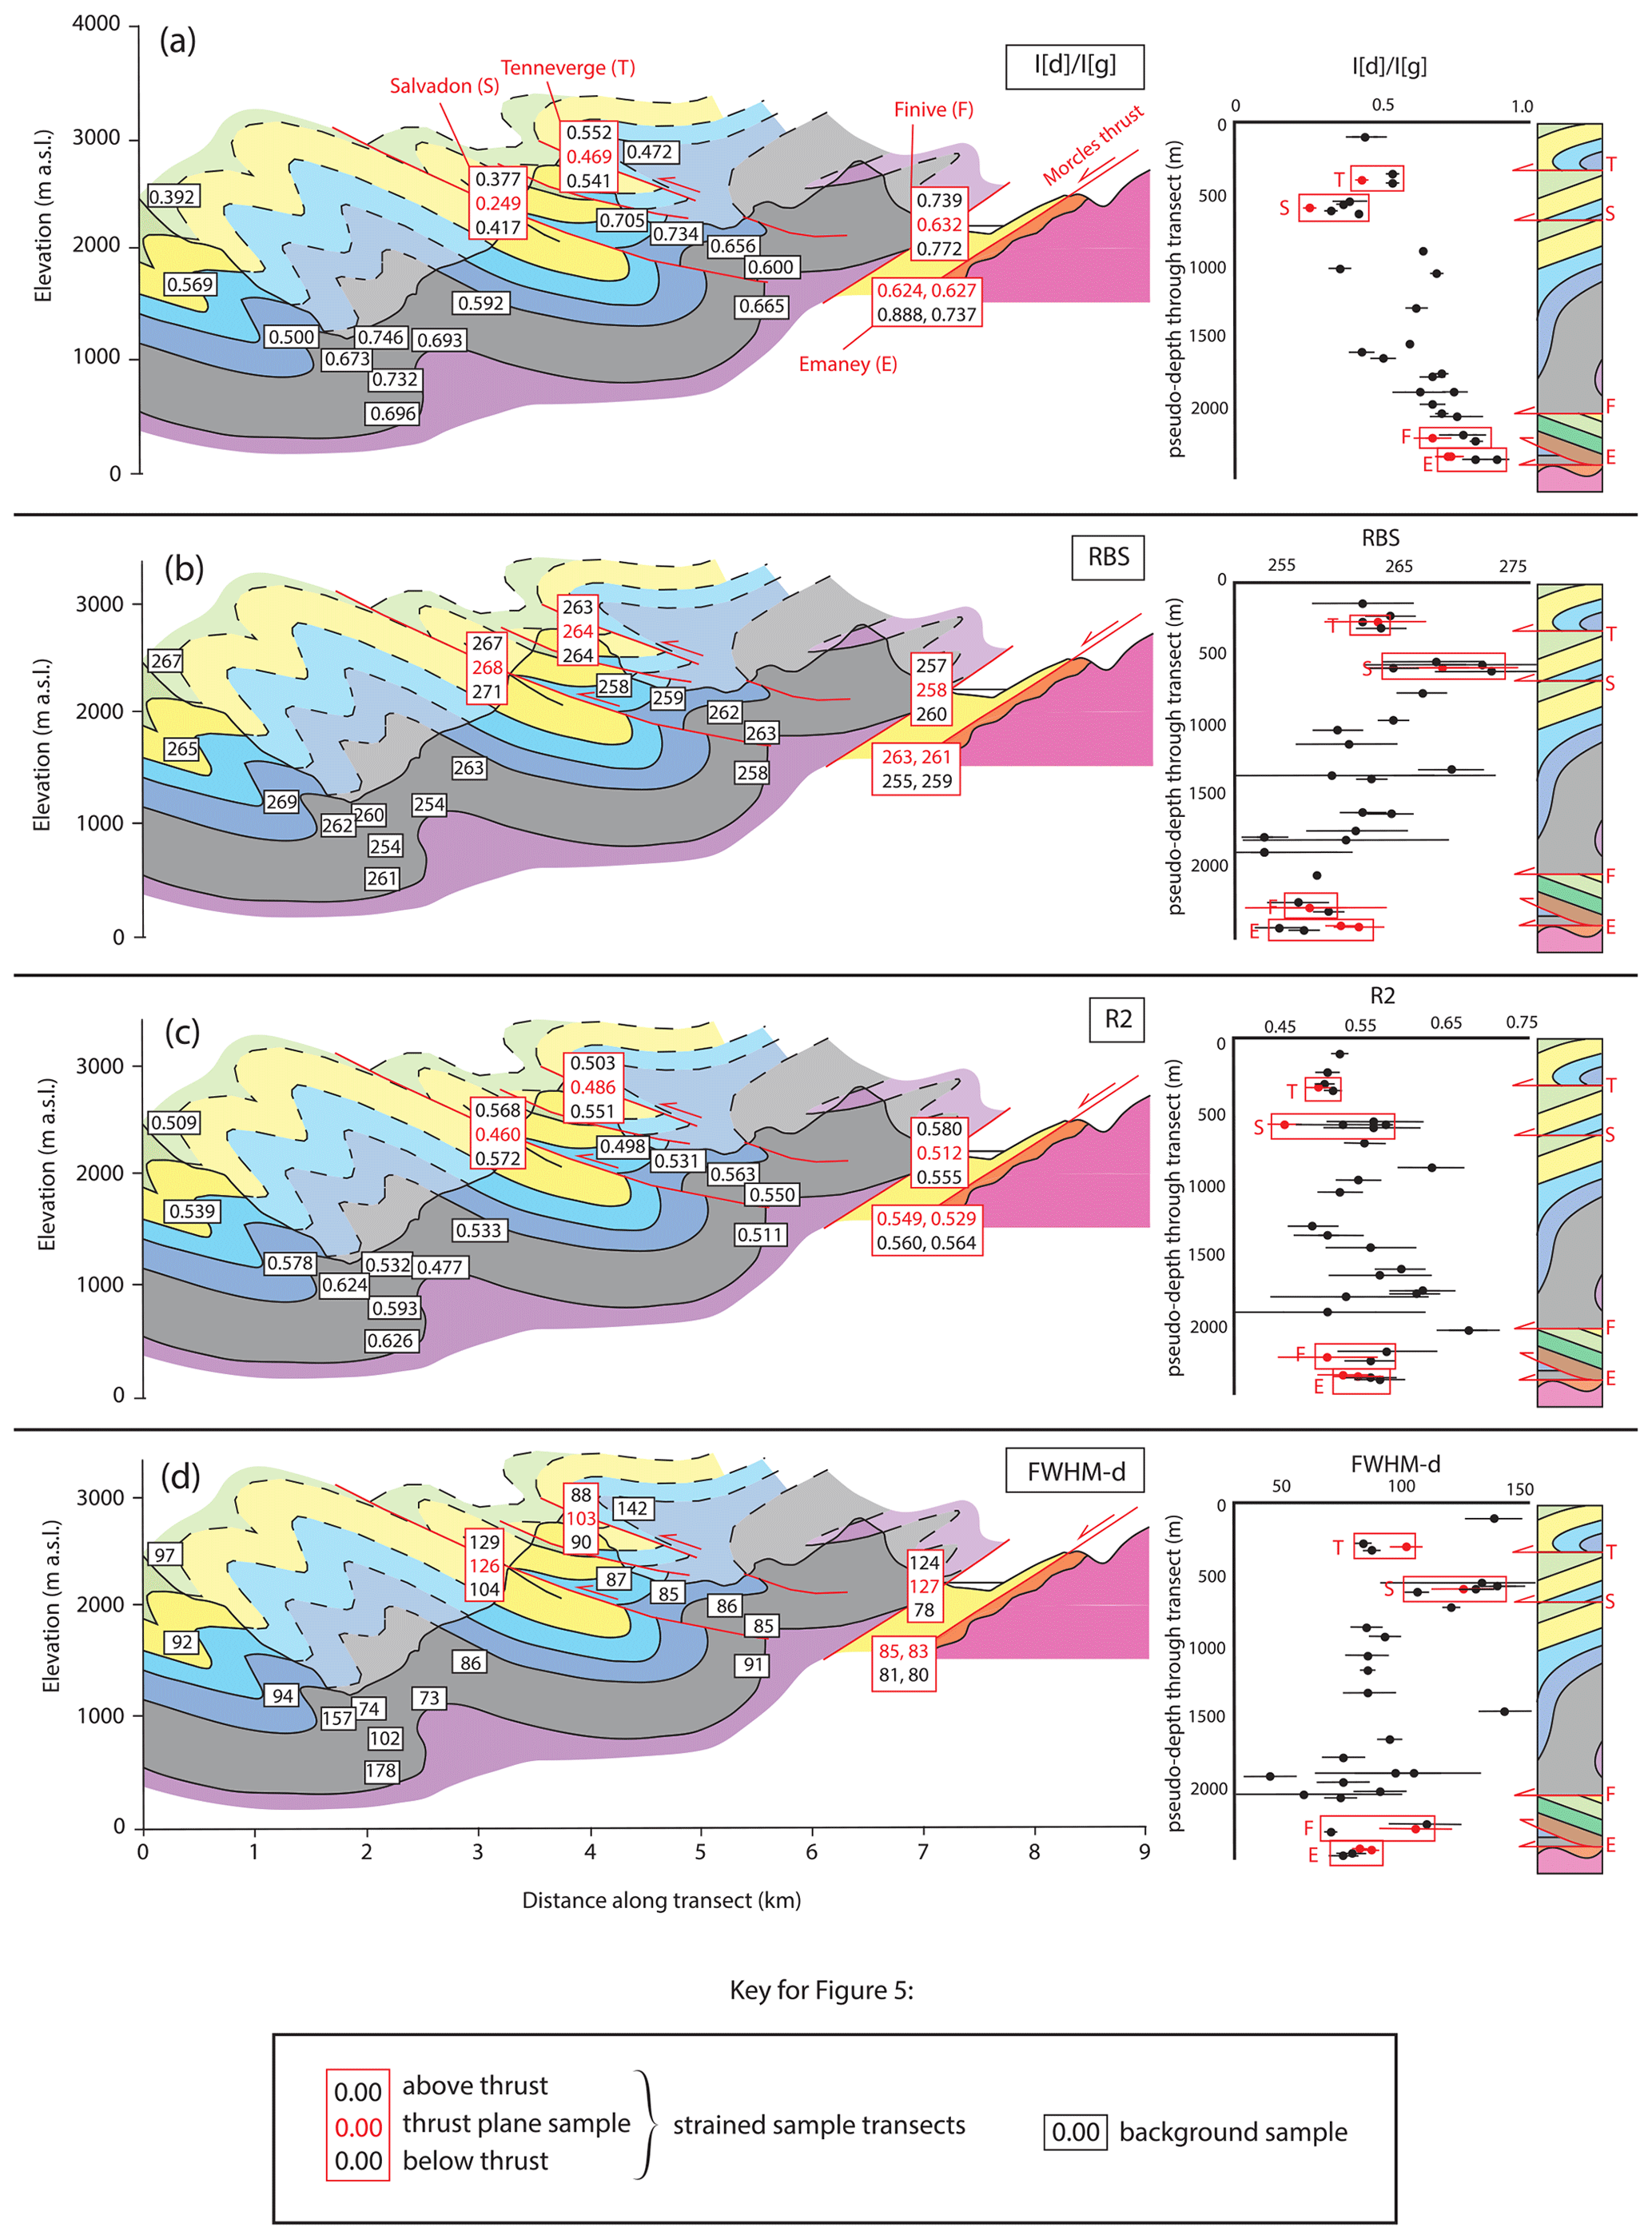
Figure 5Cross-sections and depth transects showing values of (a) ID / IG, (b) Raman band separation, (c) area ratio R2, and (d) D-peak width. Labelled values on cross-sections indicate the approximate position of samples, with numbers in black boxes representing “background” samples and those in red boxes indicating samples through “strained” localities. Within strained localities, red numbers represent fault plane or shear zone samples. The depth transects on the right of each panel are accompanied by a simplified stratigraphic column for reference. Strained localities are highlighted by red boxes labelled with a corresponding letter (T: Tenneverge, S: Salvadon, F: Finive, E: Emaney), with the thrust plane or shear zone sample indicated by a red dot. Horizontal lines on transects are error bars (standard deviation for all spectra and deconvolutions for that sample).
Figure 5 shows four individual Raman spectral parameters (ID / IG, R2, FWHM[d], and RBS) plotted on separate cross-sections, with each point corresponding to a sample site. Background samples taken distal from thrusts and shear zones are marked as single points. We first consider the relationship between the thrust plane and shear zone samples and their proximal neighbours, as well as how these relate to the regional trends observed across the area as visualised on the cross-section. Later we examine in more detail the 10 cm to 1 m scale sampling in the interceding 10 m above and below the thrust planes and across the shear zones. Results are grouped by parameter, in each case with the background samples described first, followed by the strained samples. Figure 6 shows detailed transects for each strained locality, demonstrating how the parameters change with distance from the fault or shear zone. The lithological unit is indicated by the colour of the chart area, whilst thrusts are represented by a thick dashed line and the Emaney shear zone by a series of thin, grey dashes. For context, the furthest points above and below the thrust–shear zones in each panel of Fig. 6 are the values labelled above and below strained samples in Fig. 5.
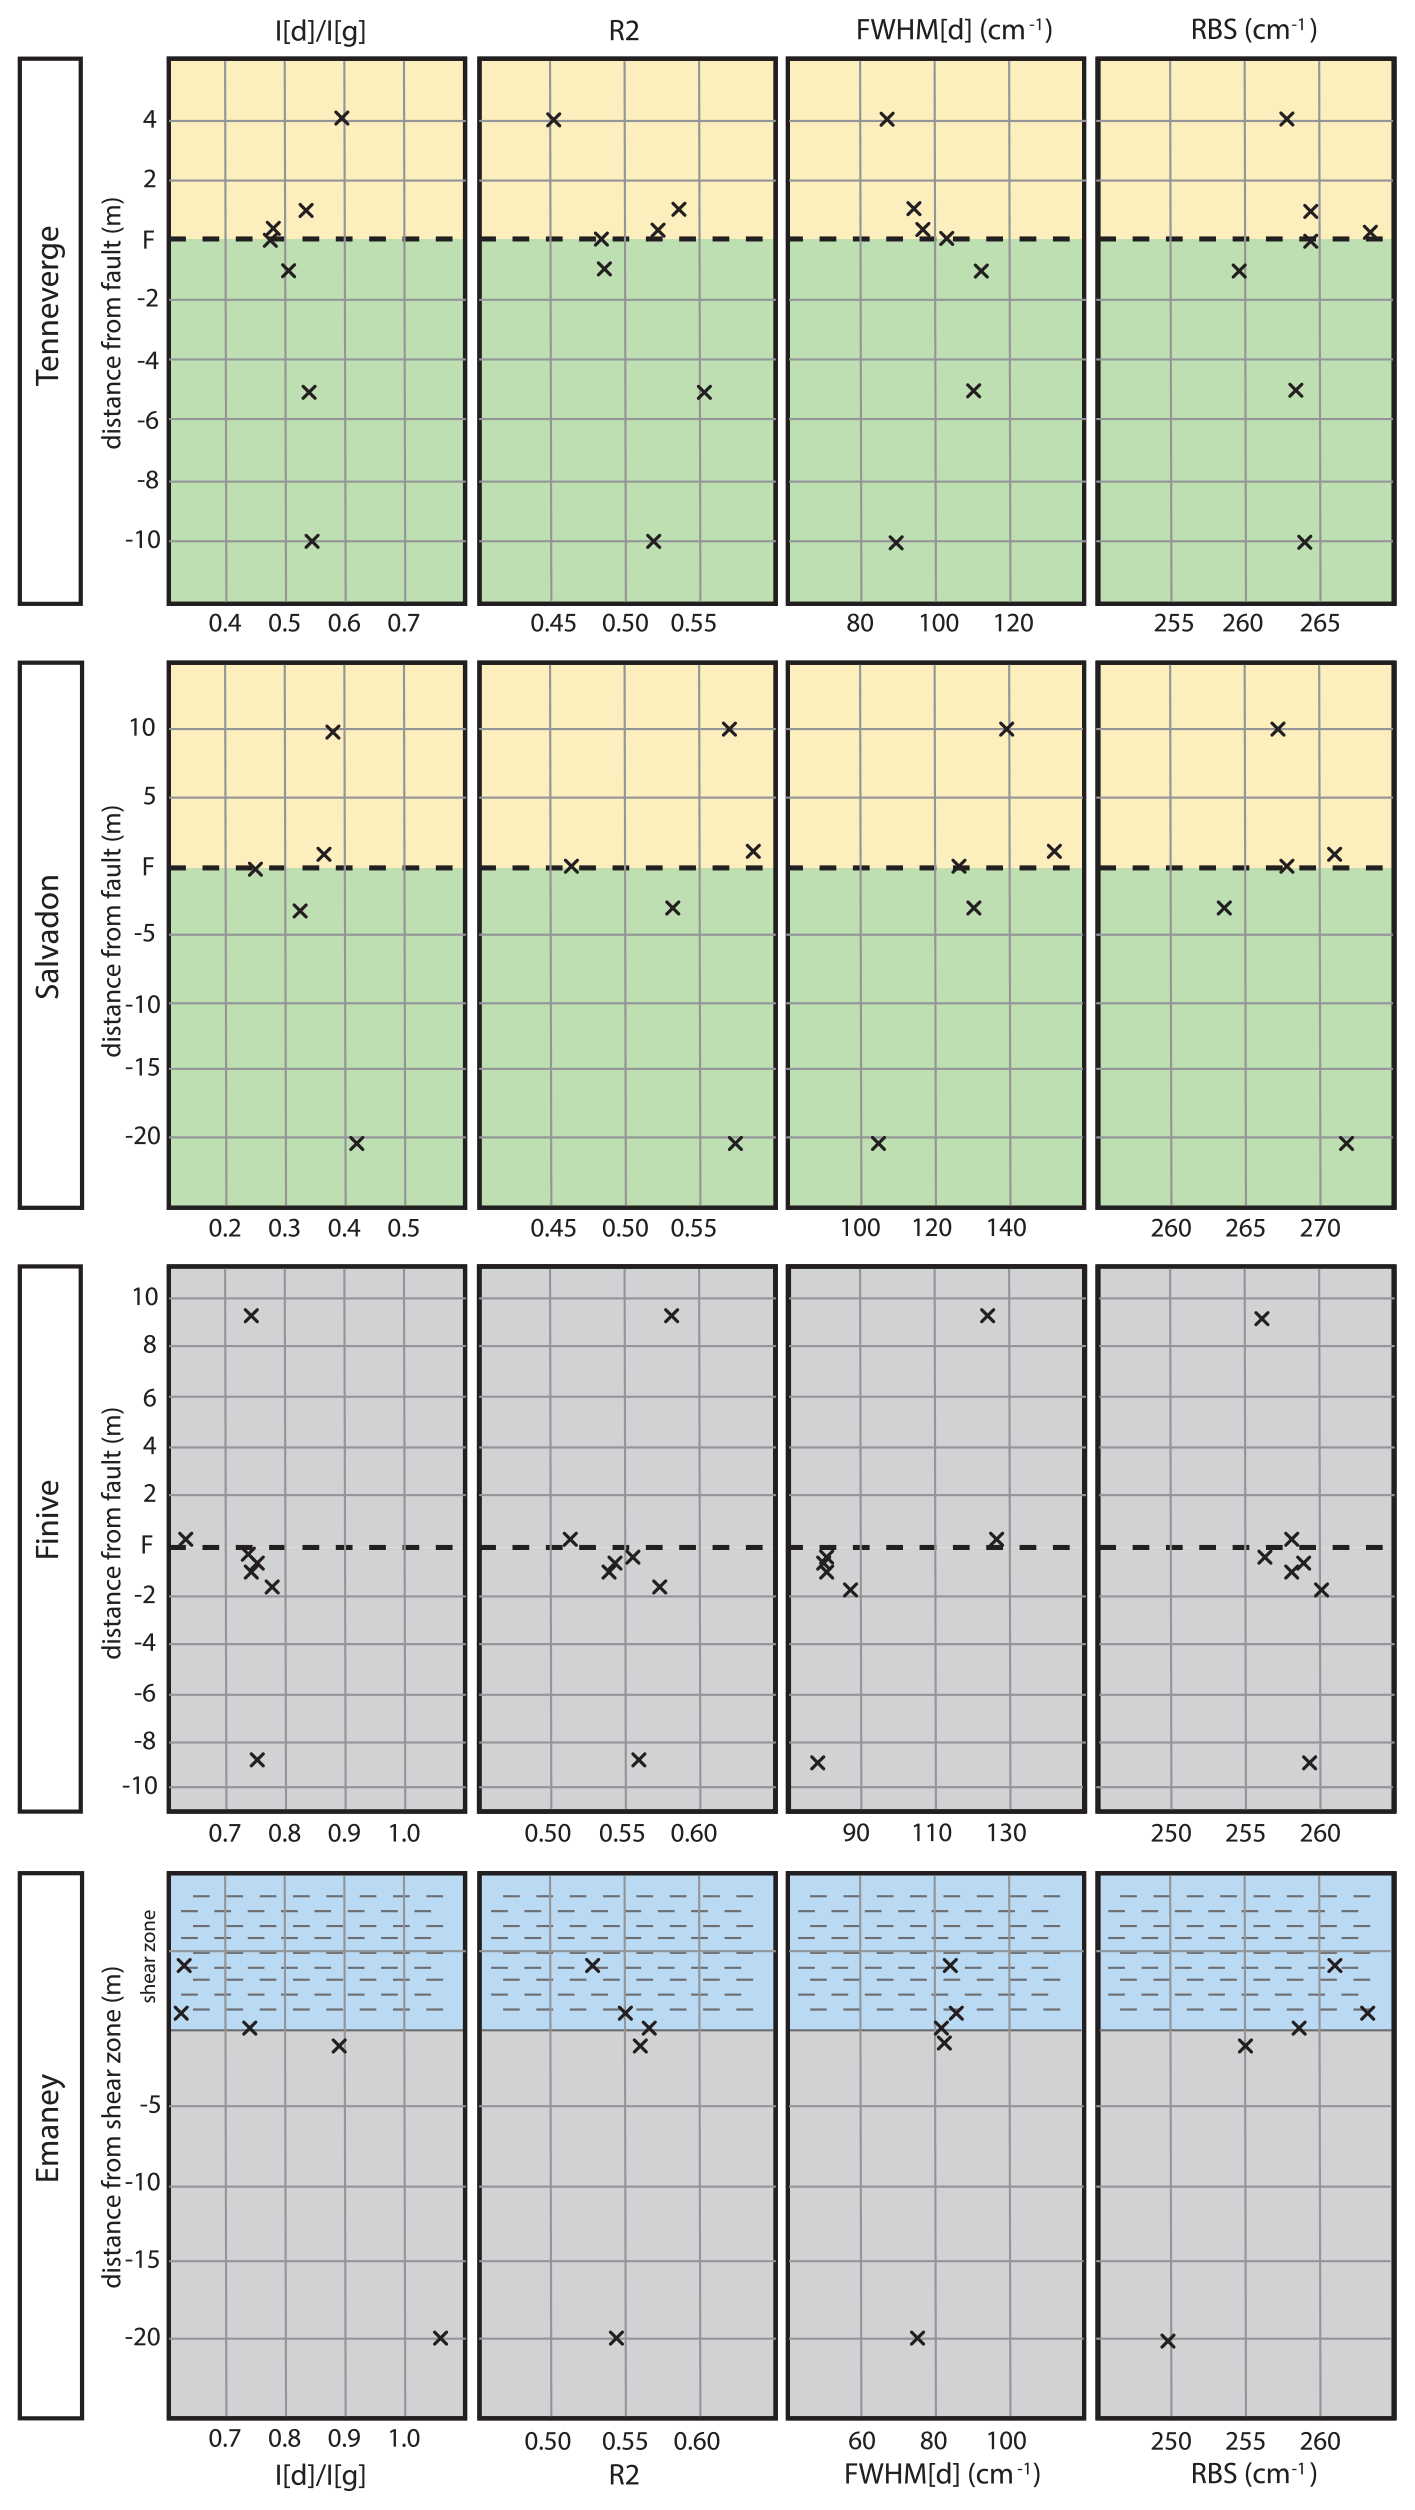
Figure 6Plots showing the four main Raman parameters in this study (ID / IG, R2, FWHM[d], and RBS) for each of the four “strained localities” (Tenneverge, Salvadon, Finive, and Emaney), with height in metres above (and below) each thrust plane or shear zone labelled on the y axis of each panel. Note that the scale for each plot within a column is the same, but the bounds of the x axis may change. Within each row, lithology is represented by colour, corresponding to the rest of the paper (grey: Bajocian, blue: Oxfordian, yellow: Tithonian, green: Valanginian). Additionally, black dotted lines indicate the presence of a thrust at that height, while grey dashes indicate a shear zone.
5.1 ID / IG
ID / IG shows a general trend from lower values (0.3–0.4) in the upper stratigraphy to higher values (0.7–0.8) in the lowest stratigraphy (Fig. 5a) in background samples. This trend correlates with the depth through the thrust stack, and the graph of ID / IG with depth (Fig. 5a, ii) highlights the gradual increase towards higher values approaching the basal thrust. The Morcles thrust flattens towards the NW end of the cross-section, coinciding with a more vertical trend in ID / IG values. This trend appears to be disrupted across thrust planes and shear zones in the strained samples. In the case of the Salvadon thrust, the samples taken 10 m above and below the thrust plane are consistent with the regional trend, with values of 0.377 and 0.417, respectively. However, ID / IG values on the thrust plane are 25 %–30 % lower, with an average value of 0.249. There is a similar though slightly less significant drop on the Tenneverge thrust plane from 0.552 and 0.541 to 0.469, which is a decrease of around 18 %. In the case of both the Salvadon and Tenneverge thrusts, there is a gradual reduction in ID / IG approaching the thrust plane, which occurs more abruptly and closer to the thrust plane in the hanging wall than the footwall where the change is more gradual. On the Finive thrust plane there is a drop to 0.632 from surrounding values of 0.739 and 0.772. The Emaney shear zone, which is not immediately associated with a major fault, exhibits values of 0.624 and 0.627 within the shear zone itself, with higher values (0.772 and 0.888) outwith the shear zone, which is a similar change as observed at the thrust localities.
5.2 RBS
Raman band separation (RBS) varies through the stratigraphy (Fig. 5b), with what appears to be a prevalence of values >265 in the upper stratigraphy and <265 in the lower sequence. The average error associated with each sample is ±4, suggesting that the change through the stratigraphic sequence is not significant. Unlike ID / IG, there is no distinct shift on the thrust planes (Fig. 6); instead the RBS value on the Tenneverge and Salvadon thrust planes sits between the values of samples taken immediately above and below the thrust. There is a small shift to slightly higher values in the Emaney shear zone (263/261 from 255/259 below the shear zone), but these values are accompanied by an approximate error of ±2, which is comparable to the magnitude of the difference between samples.
5.3 R2
R2 (the area ratio; Fig. 5c) shows little overall change with depth towards the Morcles thrust, although there is a weak trend towards higher values with increasing depth within individual thrusted packages. Outwith the strained samples, there is a prevalence of values <0.6 towards the top of the stratigraphy and >0.6 in the lower half, but many values are accompanied by errors as high as ±0.1. There is a marked drop on each thrust plane and within the shear zone, similar to the behaviour seen in ID / IG. On the Salvadon thrust, there is a decrease from 0.572 (20 m below the thrust plane) and 0.568 (10 m above the thrust) to 0.460 on the thrust plane. Here, the pattern resembles that of the ID / IG change for this thrust, with a more gradual change approaching the thrust from the footwall than in the hanging wall. On the Tenneverge thrust plane the R2 value is 0.486 compared to 0.503 at a distance 0.5 m above and 0.551 at 5 m below (note the different distances are due to the extent of the shear zone bounding the thrust, which is thicker in the footwall). In the case of the Finive thrust, R2 is 0.512 on the thrust plane, whilst above and below it, R2 sits at 0.580 and 0.555, respectively. Finally, there is also a decrease in R2 moving from 10 m below the Emaney shear zone (0.560 and 0.564) to within it (0.549 and 0.529). The average error for each sample was ±0.078, so only the Salvadon thrust samples exhibit a change with a greater magnitude than this, but importantly (at least within the immediate vicinity of the strained samples) the direction of change is consistent.
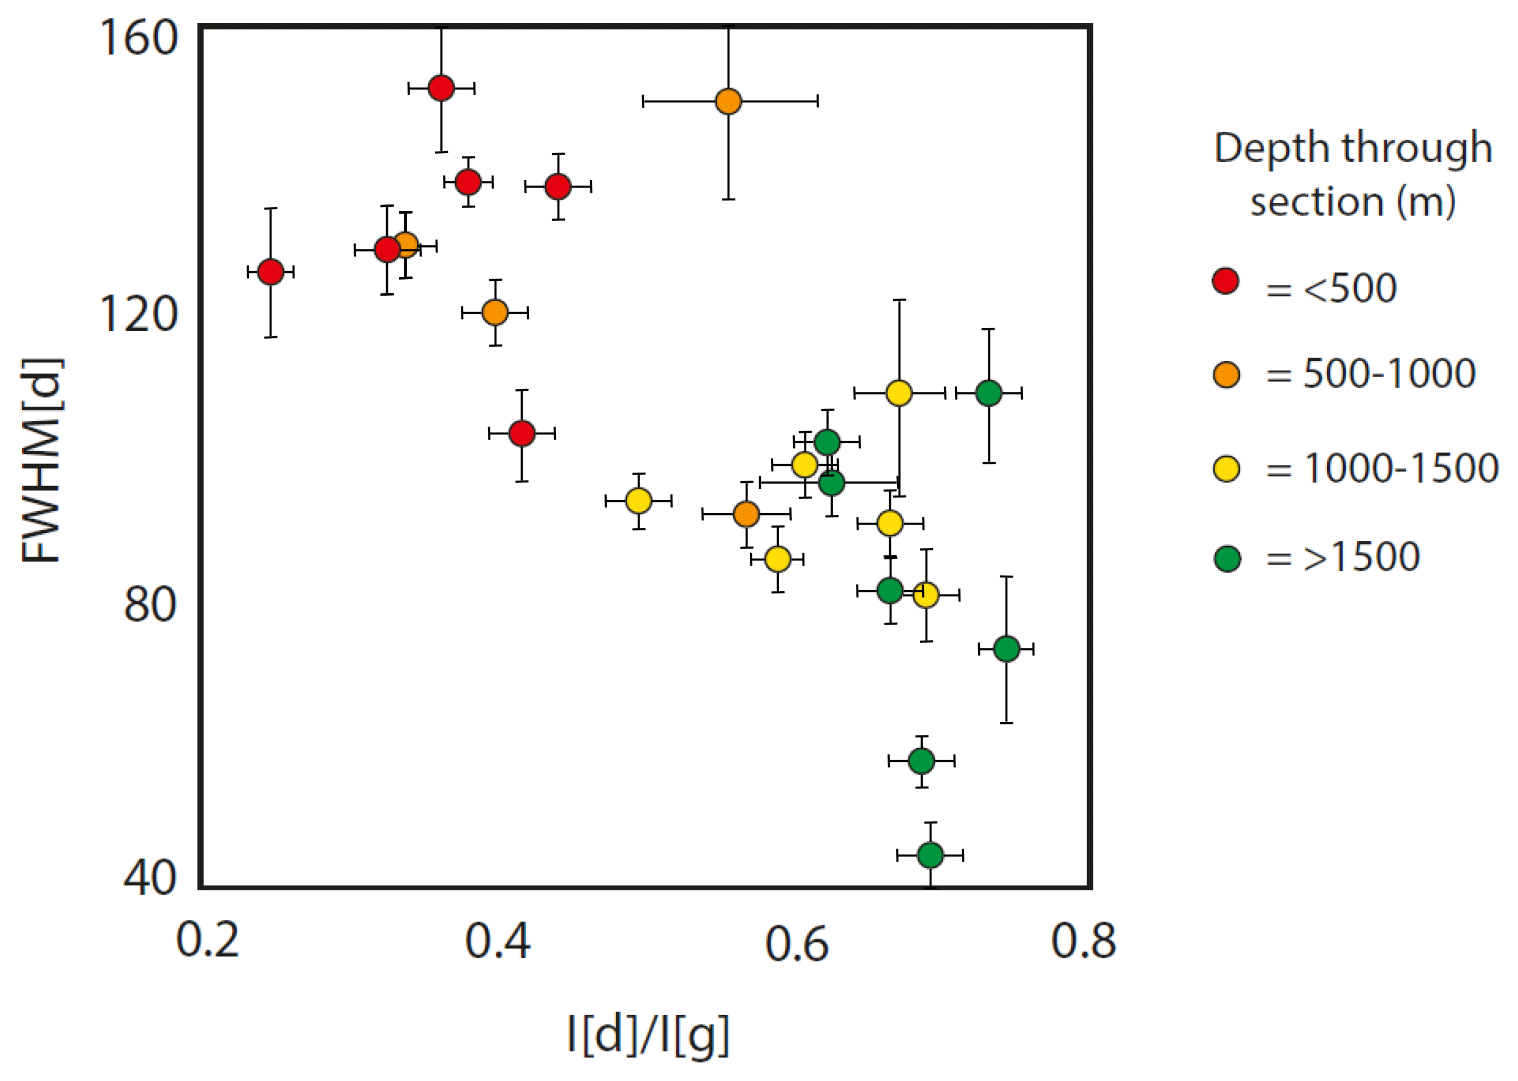
Figure 7D-peak width (FWHM[d]) plotted against intensity ratio (ID / IG), with points coloured by depth through the overall transect.
5.4 FWHM[d]
Only FWHM[d] is shown in Fig. 5d, as FWHM[g] varies significantly and shows no discernible trend in our data (the reader is referred to https://zenodo.org/record/4771951#.Yt5t33bMI2w). There appears to only be a small shift, if any, on thrust planes and in the shear zone. There is, however, a slight general decrease in FWHM[d] with depth towards the Morcles thrust (Fig. 5c) and therefore a reverse correlation with ID / IG, as illustrated in Fig. 7.
6.1 ID / IG
At low thermal maturities, increasing temperatures cause a rise in ID / IG (Fig. 4a; Dietrich and Casey, 1989; Muirhead et al., 2012; Sauerer et al., 2017). In the Haut Giffre, we estimate peak burial temperatures to be 150–250 ∘C based on a standard geothermal gradient of 25 ∘C km−1 and an estimated burial depth of 6 km at the top of the exposed stratigraphic pile (Pfiffner, 1993; Kirschner et al., 1999; Austin et al., 2008). Therefore, it is reasonable to suggest that the increase in the ID / IG ratio towards the basal Morcles thrust is associated with increasing peak temperature and hence maximum burial. This fits with the observations, for example, of Schito et al. (2017), wherein a similar trend of increasing ID / IG with depth is seen through some 4 km of core containing siliciclastics from the lower Congo Basin, Angola, at temperatures up to 170 ∘C.
There is a significant drop in ID / IG on thrust planes and in shear zones, with as much as a 40 % decrease in the ratio values on the Salvadon thrust plane compared to the surrounding stratigraphy (0.417 to 0.279, a difference of 0.168) and 30 % difference between samples in the Emaney shear zone compared to those adjacent (0.888 to 0.624, a difference of 0.264). There are several possible causes of this drop.
-
A lower peak temperature on the fault plane than the surrounding rock would reduce the ID / IG value on the fault plane. However, there is no plausible mechanism to explain how this would occur.
-
A very large temperature increase on the fault plane (>500 ∘C) could cause such a spectral change that ID / IG values begin to drop again (Fig. 4a; Bustin et al., 1995; Furuichi et al., 2015; Kaneki et al., 2016; Nakamura et al., 2019). A possible mechanism for such a local temperature elevation could be flash heating due to friction on the fault plane. Frictional heating is known to occur on fault planes (Goldsby and Tullis, 2007; Smith et al., 2015), particularly in episodes of rapid seismic slip (Rabinowitz et al., 2020). However, the magnitude and duration of elevated temperatures from friction depend on a range of factors such as permeability, slip duration, and fault thickness (Bustin, 1983; Mase and Smith, 1987; Fulton and Harris, 2012; Kitamura et al., 2012), and there is therefore uncertainty as to whether this would always be sufficient to alter the Raman spectra. Mase and Smith (1987) modelled frictional heating on fault planes and found that in porous rocks, the slip duration would have to be much greater than 100 s for thermal pressurisation to occur. Our results show that ID / IG decreases similarly in thrust faults and in broader shear zones. Transient frictional heating cannot explain the decrease in ID / IG values in the Emaney shear zone, which has undergone mostly ductile deformation over a more widely distributed area.
-
Strain-related spectral changes can also reduce ID / IG (Kwiecinska et al., 2010; Kitamura et al., 2012; Furuichi et al., 2015; Kedar et al., 2020), and this would be applicable to both fault planes and distributed shear zones. Kedar et al. (2020) reported a drop of 0.1 to 0.15 in ID / IG in the sheared, overturned limb of a recumbent isoclinal fold, corresponding to an increase in strained microfabrics in those samples.
It is worth noting that although the downward shift in ID / IG is very prominent on the Salvadon thrust plane, there is also a gradual decrease in values as the thrust plane is approached (Fig. 6). In the footwall, which comprises Valanginian marls with a gradual intensification of the strain fabric approaching the thrust, ID / IG values begin to decrease several metres out from the thrust plane. However, in the hanging wall, which consists of Tithonian limestone, ID / IG remains high until much closer to the thrust. This pattern is also observed in the case of the Tenneverge thrust, which comprises the same lithologies as the Salvadon thrust. It is possible that such a pattern is indicative of the respective rheological properties of the hanging wall and footwall lithologies, with the softer footwall marls forming a deformation shear zone and hence lowering the ID / IG value further from the thrust plane itself, if strain is indeed the mechanism by which the carbon structure is changing. Meanwhile, the more competent hanging wall limestones do not form such a broad deformation zone, and therefore the potentially strain-related shift in ID / IG is reserved for a much narrower zone just above the thrust plane.
6.2 RBS
Raman band separation (RBS) is reported to increase with increasing temperature (Fig. 4b; Zhou et al., 2014; Bonoldi et al., 2016; Sauerer et al., 2017) and should therefore increase with depth towards the basal thrust in our study. Pressure also affects peak positions (Ross and Bustin, 1990; Bustin, 1995; Huang et al., 2010). However, the trend is weak in our RBS data. If frictional heating on fault planes were the primary control on changes in RBS, and we assume an approximate instantaneous slip magnitude of ∼1 m, then it would be expected that temperatures could rise by >400 ∘C (Savage et al., 2014). This should be enough to produce a shift in RBS which is greater than the general variation we see in our samples. However, Nakamura et al. (2019) report that in addition to temperature, RBS is sensitive to lithology and the effects of fluids, which may explain the variable results we see in this study.
6.3 FWHM[d]
D-peak width (FWHM[d]) exhibits a reverse trend as that of ID / IG, decreasing slightly with depth towards the basal thrust. This supports experiments by Zeng and Wu (2007), who observed a decrease in FWHM[d] with increasing temperature, although their experiments were on samples at 300 ∘C and above. Zhou et al. (2014) also observed a decrease in FWHM[d] with increasing ID / IG in solid bitumen, similar to the trend seen in this study. Studies on coal approaching a magmatic contact by Chen et al. (2017) indicate that both FWHM[d] and FWHM[g] decrease with increasing temperature, but in this study we only observe a decrease in FWHM[d], whilst FWHM[g] changes very little. This is also observed in the case of other starting materials including kerogen (Henry et al., 2019). However, since kerogen (and organic carbon in general) can take on such a wide variety of forms, it is easily possible that a trend observed in one case may not be strong in another.
Unlike ID / IG, there is little change in FWHM[d] across fault planes or shear zones, which suggests that the two parameters are not directly related. For samples affected by polishing during sample preparation, it has been noted that Raman spectral peak widths are less influenced than peak intensities (Ammar et al., 2011; Hu et al., 2015), suggesting that FWHM[d] does not change significantly due to shearing. In light of our results, it may be possible to extend this suggestion to shearing on fault planes and in shear zones. This is supported by the results of fine-scale transects across strained localities (Fig. 6), wherein the error and general variation in FWHM[d] seems to outweigh any significant shift on fault planes or in shear zones.
6.4 R2
R2 (the area ratio) shows a trend similar to that of ID / IG, only not as pronounced. Note that the range in R2 values is lower than that of ID / IG due to the normalised denominator used to calculate R2 (Eq. 1), so a trend weaker than ID / IG is expected. There is a drop in R2 on thrust planes and within the Emaney shear zone; this drop is 6 %–20 % (a difference of 0.035; see Fig. 5c) compared to 15 %–40 % for ID / IG. However, the percent change in R2 on fault planes is comparable to the total change in R2 between the upper and lower sections of the stratigraphy (though this is subject to a high degree of variation).
Since peak area is a product of peak intensity and peak width, it follows that R2 is dependent on ID / IG and FWHM[d]. These two parameters have opposing trends with depth through the sequence, resulting in a general dampening of any R2 trend. However, in strained samples, ID / IG tends to drop, whilst FWHM[d] remains unchanged. This means that R2 also drops and makes this parameter more sensitive to strain-related spectral changes than to burial trends.
6.5 Implications for Raman geothermometry
There are numerous geothermometric equations which use Raman spectral parameters to calculate predicted maximum temperatures. These have been developed for different geological settings, each applicable to a particular carbon type, predicted temperature range, and methodology (such as laser wavelength and deconvolution method). Such examples include but are not limited to Lahfid et al. (2010), Kouketsu et al. (2014), Wilkins et al. (2018), Schito and Corrado (2018), and Muirhead et al. (2019). However, our work demonstrates that strain has an effect on certain Raman spectral parameters, with some more affected than others. This could have significant implications for the results of Raman geothermometers. Here we consider one geothermometric equation – that of Schito and Corrado (2018) – as an example in order to demonstrate how strained rocks might impact results.
This equation uses (in order of decreasing significance) the following Raman spectral parameters: ID / IG (intensity ratio), RBS (Raman band separation), FWHM[d] (D-peak width), FWHM[g] (G-peak width), A[d] (D-peak area), and A[g] (G-peak area) to give a vitrinite reflectance value (%Ro equivalent) of 0.3 to 1.0.
The result is then converted to an approximate temperature value using the equation proposed by Barker and Pawlewiscz (1986).
Applying this to our results gives a calculated temperature range across all the samples of 79 to 104 ∘C, with a 10 ∘C increase in local temperature on the Salvadon thrust plane and a 5–10 ∘C decrease in the Emaney shear zone; otherwise, little change is noted in the strained samples.
An actual temperature increase due to frictional heating would explain any increase in temperature on a fault plane but may not account for observations in a ductile shear zone. Further to this, frictional heating could easily raise temperatures to values outside the calibration range of the Schito and Corrado (2018) equation, giving erroneous results using this equation and necessitating the use of a different geothermometer in these samples. However, a transient temperature rise during frictional heating on a fault plane may be too short-lived to promote spectral changes (Bustin, 1983; Fulton and Harris, 2012; Kitamura et al., 2012; Furuichi et al., 2015). Inconsistencies in the magnitude of temperature change can potentially be explained by differing thicknesses of active slip (Raboniwitz et al., 2020) or a low slip magnitude in a single event (Polissar et al., 2011; Savage et al., 2014, 2018; Raboniwitz et al., 2020). However, these do not explain the distinct drop in apparent temperature on the Salvadon thrust plane or the elevated temperature values within the Emaney shear zone, where frictional heating should not play a role.
The most significant term in the equation is ID / IG, and our data show that ID / IG is strongly affected by strain-related spectral changes. It therefore follows that the equation should be sensitive to strain, but the fact that not all strained samples produce calculated temperature shifts of the same direction or magnitude suggests that the process is more complex than simply strain or temperature having an effect. Regardless of cause, however, if a strained sample can produce a difference in calculated temperature of 10 ∘C in a stratigraphic sequence with an overall temperature range of only 25 ∘C, then context is important when estimating temperatures using this method. For example, if using these temperature data to reconstruct a burial history, then a strained sample might be “out” by over a kilometre, or it might give the correct value. It is therefore important that more work is done to calibrate Raman geothermometers in rocks which have undergone strain in natural environments.
Analysis of samples from an Alpine carbonate fold–thrust system has revealed trends and anomalies in Raman spectral data. We chose four key parameters which are frequently used to assess thermal maturity of organic carbon in rock samples and plotted the values at the corresponding sample sites on a cross-section. By separating samples that had been affected by locally high strain (such as on fault planes or in shear zones) from those that had only been subjected to the background regional strain and by plotting metre-scale transects across these strained sites, we were able to apply context to the data and hence discern regional thermal trends from localised strain-related anomalies.
Parameters showed varying sensitivities to strain and temperature. In background samples, ID / IG increased with depth towards the basal thrust, suggesting an expected “burial trend”. FWHM[d] decreased with depth, whilst R2 – a product of ID / IG and, to some extent, FWHM[d] – increased slightly. RBS showed no discernible trend. In strained samples, ID / IG dropped by 0.1 to 0.15 (up to 40 % depending on location in the stratigraphy), and R2 showed a small decrease. There was little change, if any, in FWHM[d] or RBS in strained samples. In the fine-scale transects across the Salvadon and Tenneverge thrusts, ID / IG and R2 both showed a gradual decrease towards the thrust in the footwall marls where a shear zone was present, whilst the decrease appeared to be more abrupt and closer to the thrust plane in the hanging wall limestones. We suggest that this may be due to rheological differences in the two lithologies and may also be linked to the differing levels of strain experienced by the hanging wall and footwall of a thrust fault. In both cases, the driving factor for the rate of decrease in ID / IG and R2 approaching the thrust would be the extent of strain partitioning in the rocks immediately above and below the thrust surface. A lack of change – or at least a lack of consistency and magnitude – in FHWM[d] to match these ID / IG changes suggests that strain rather than temperature is the main driver. This is supported by the similarity in the results plotted across the Emaney shear zone. However, since the influence of frictional heating cannot be ignored in the case of a thrust surface, there is scope for future work to attempt to further separate these two signals in naturally deformed rocks such as these.
Data can be accessed through Zenodo at https://doi.org/10.5281/zenodo.4771951 (Kedar et al., 2021).
LK was responsible for fieldwork, Raman spectroscopy analysis and interpretation, original draft preparation, and figure preparation. CEB was responsible for original conceptualisation, input into rewriting and framing the original draft, and fieldwork (support). DKM was responsible for Raman spectroscopy interpretation as well as input into writing and re-drafting of the original draft. All authors have contributed to the writing and framing of the paper as well as discussion of all concepts.
The contact author has declared that none of the authors has any competing interests.
Publisher's note: Copernicus Publications remains neutral with regard to jurisdictional claims in published maps and institutional affiliations.
This study was carried out as part of a University of Aberdeen PhD supported by the UKRI Centre for Doctoral Training in Oil & Gas (grant number NE/R01051X/1).
This research has been supported by the UK Research and Innovation (grant no. NE/R01051X/1).
This paper was edited by Virginia Toy and reviewed by Aaron Jubb, Jeffrey Rahl, and Yoshihiro Nakamura.
Ammar, M. R., Charon, E., Rouzaud, J.-N., Aleon, J., Guimbretière, G., and Simon, P.: On a Reliable Structural Characterization of Polished Carbons in Meteorites by Raman Microspectroscopy, Spectrosc. Lett., 44, 535–538, https://doi.org/10.1080/00387010.2011.610417, 2011.
Aoya, M., Kouketsu, Y., Endo, S., Shimizu, H., Mizukami, T., Nakamura, D., and Wallis, S.: Extending the applicability of the Raman carbonaceous-material geothermometer using data from contact metamorphic rocks, J. Metamorph. Geol., 28, 895–914, https://doi.org/10.1111/j.1525-1314.2010.00896.x, 2010.
Austin, N., Evans, B., Herwegh, M., and Ebert, A.: Strain localization in the Morcles nappe (Helvetic Alps, Switzerland), Swiss J. Geosci., 101, 341–360, https://doi.org/10.1007/s00015-008-1264-2, 2008.
Beyssac, O., Rouzaud, J.-N., Goffé, B., Brunet, F., and Chopin, C.: Graphitization in a high-pressure, low-temperature metamorphic gradient: a Raman microspectroscopy and HRTEM study, Contrib. Mineral. Petrol., 143, 19–31, https://doi.org/10.1007/s00410-001-0324-7, 2002a.
Beyssac, O., Goffé, B., Chopin, C., and Rouzaud, J. N.: Raman spectra of carbonaceous material in metasediments: a new geothermometer, J. Metamorph. Geol., 20, 859–871, https://doi.org/10.1046/j.1525-1314.2002.00408.x, 2002b.
Bonal, L., Quirico, E., Bourot-Denise, M., and Montagnac, G.: Determination of the petrologic type of CV3 chondrites by Raman spectroscopy of included organic matter, Geochim. Cosmochim. Ac., 70, 1849–1863, https://doi.org/10.1016/j.gca.2005.12.004, 2006.
Bonoldi, L., Di Paolo, L., and Flego, C.: Vibrational spectroscopy assessment of kerogen maturity in organic-rich source rocks, Vib. Spectrosc., 87, 14–19, https://doi.org/10.1016/j.vibspec.2016.08.014, 2016.
Buseck, P. R. and Beyssac, O.: From Organic Matter to Graphite: Graphitization, Elements, 10, 421–426, https://doi.org/10.2113/gselements.10.6.421, 2014.
Bustin, R. M.: Heating during thrust faulting in the rocky mountains: friction or fiction?, Tectonophysics, 95, 309–328, https://doi.org/10.1016/0040-1951(83)90075-6, 1983.
Bustin, R. M., Ross, J. V., and Rouzaud, J.-N.: Mechanisms of graphite formation from kerogen: experimental evidence, Int. J. Coal Geol., 28, 1–36, https://doi.org/10.1016/0166-5162(95)00002-U, 1995.
Chen, S., Wu, D., Liu, G., and Sun, R.: Raman spectral characteristics of magmatic-contact metamorphic coals from Huainan Coalfield, China, Spectrochim. Ac., 171, 31–39, https://doi.org/10.1016/j.saa.2016.07.032, 2017.
Dietrich, D. and Casey, M.: A new tectonic model for the Helvetic nappes, Geol. Soc. London, Spec. Publ., 45, 47–63, https://doi.org/10.1144/GSL.SP.1989.045.01.03, 1989.
Diftrich, D. and Durney, D. W.: Change of direction of overthrust shear in the Helvetic nappes of western Switzerland, J. Struct. Geol., 8, 389–398, https://doi.org/10.1016/0191-8141(86)90057-X, 1986.
Fulton, P. M. and Harris, R. N.: Thermal considerations in inferring frictional heating from vitrinite reflectance and implications for shallow coseismic slip within the Nankai Subduction Zone, Earth Planet. Sc. Lett., 335, 206–215, https://doi.org/10.1016/J.EPSL.2012.04.012, 2012.
Furuichi, H., Ujiie, K., Kouketsu, Y., Saito, T., Tsutsumi, A., and Wallis, S.: Vitrinite reflectance and Raman spectra of carbonaceous material as indicators of frictional heating on faults: Constraints from friction experiments, Earth Planet. Sc. Lett., 424, 191–200, https://doi.org/10.1016/J.EPSL.2015.05.037, 2015.
Goldsby, D. L., Tullis, T. E., Goldsby, D. L., and Tullis, T. E.: Flash Heating and Weakening of Crustal Rocks During Coseismic Fault Slip, AGUFM, 2007, T11A-0352 [online], https://ui.adsabs.harvard.edu/abs/2007AGUFM.T11A0352G/abstract (last access: 19 March 2021), 2007.
Henry, D. G., Jarvis, I., Gillmore, G., and Stephenson, M.: A rapid method for determining organic matter maturity using Raman spectroscopy: Application to Carboniferous organic-rich mudstones and coals, Int. J. Coal Geol., 203, 87–98, https://doi.org/10.1016/j.coal.2019.01.003, 2019.
Hu, S., Evans, K., Craw, D., Rempel, K., Bourdet, J., Dick, J., and Grice, K.: Raman characterization of carbonaceous material in the Macraes orogenic gold deposit and metasedimentary host rocks, New Zealand, Ore Geol. Rev., 70, 80–95, https://doi.org/10.1016/j.oregeorev.2015.03.021, 2015.
Kaneki, S., Hirono, T., Mukoyoshi, H., Sampei, Y., and Ikehara, M.: Organochemical characteristics of carbonaceous materials as indicators of heat recorded on an ancient plate-subduction fault, Geochem. Geophys. Geosys., 17, 2855–2868, https://doi.org/10.1002/2016GC006368, 2016.
Kedar, L., Bond, C. E., and Muirhead, D.: Carbon ordering in an aseismic shear zone: Implications for Raman geothermometry and strain tracking, Earth Planet. Sc. Lett., 549, 116536, https://doi.org/10.1016/j.epsl.2020.116536, 2020.
Kedar, L., Bond, C., and Muirhead, D.: Raman spectral data from carbonates in the Haut Giffre, French Alps, Zenodo [data set], https://doi.org/10.5281/zenodo.4771951, 2021.
Kirilova, M., Toy, V., Rooney, J. S., Giorgetti, C., Gordon, K. C., Collettini, C., and Takeshita, T.: Structural disorder of graphite and implications for graphite thermometry, Solid Earth, 9, 223–231, https://doi.org/10.5194/se-9-223-2018, 2018.
Kirschner, D. L., Sharp, Z. D., and Masson, H.: Oxygen isotope thermometry of quartz-calcite veins: Unraveling the thermal-tectonic history of the subgreenschist facies Morcles nappe (Swiss Alps), Geol. Soc. Am. Bull., 107, 1145–1156, https://doi.org/10.1130/0016-7606(1995)107<1145:OITOQC>2.3.CO;2, 1995.
Kirschner, D. L., Masson, H., and Sharp, Z. D.: Fluid migration through thrust faults in the Helvetic nappes (Western Swiss Alps), Contrib. Mineral. Petrol., 136, 169–183, https://doi.org/10.1007/s004100050530, 1999.
Kitamura, M., Mukoyoshi, H., Fulton, P. M., and Hirose, T.: Coal maturation by frictional heat during rapid fault slip, Geophys. Res. Lett., 39, 1–5, https://doi.org/10.1029/2012GL052316, 2012.
Kouketsu, Y., Mizukami, T., Mori, H., Endo, S., Aoya, M., Hara, H., Nakamura, D., and Wallis, S.: A new approach to develop the Raman carbonaceous material geothermometer for low-grade metamorphism using peak width, Isl. Arc., 23, 33–50, https://doi.org/10.1111/iar.12057, 2014.
Kuo, L.-W., Di Felice, F., Spagnuolo, E., Di Toro, G., Song, S.-R., Aretusini, S., Li, H., Suppe, J., Si, J., and Wen, C.-Y.: Fault gouge graphitization as evidence of past seismic slip, Geology, 45, 979–982, https://doi.org/10.1130/G39295.1, 2017.
Kwiecinska, B., Suárez-Ruiz, I., Paluszkiewicz, C., and Rodriques, S.: Raman spectroscopy of selected carbonaceous samples, Int. J. Coal Geol., 84, 206–212, https://doi.org/10.1016/J.COAL.2010.08.010, 2010.
Lahfid, A., Beyssac, O., Deville, E., Negro, F., Chopin, C., and Goffé, B.: Evolution of the Raman spectrum of carbonaceous material in low-grade metasediments of the Glarus Alps (Switzerland), Terra Nov., 22, 354–360, https://doi.org/10.1111/j.1365-3121.2010.00956.x, 2010.
Levine, J. R.: Coalification: The evolution of coal as source rock and reservoir rock for oil and gas, in: Hydrocarbon from coal, edited by: Law, B. E. and Rice, D. D., Tulsa, Oklahoma: The American Association of Petroleum Geologists, 38, 39–77, 1993.
Marshall, A. O., Emry, J. R., and Marshall, C. P.: Multiple Generations of Carbon in the Apex Chert and Implications for Preservation of Microfossils, Astrobiology, 12, 160–166, https://doi.org/10.1089/ast.2011.0729, 2012.
Mase, C. W. and Smith, L.: Effects of frictional heating on the thermal, hydrologic, and mechanical response of a fault, J. Geophys. Res., 92, 6249–6272, https://doi.org/10.1029/JB092iB07p06249, 1987.
Mostefaoui, S., Perron, C., Zinner, E., and Sagon, G.: Metal-associated carbon in primitive chondrites: Structure, isotopic composition, and origin, Geochim. Cosmochim. Ac., 64, 1945–1964, https://doi.org/10.1016/S0016-7037(99)00409-3, 2000.
Muirhead, D. K., Parnell, J., Taylor, C., and Bowden, S. A.: A kinetic model for the thermal evolution of sedimentary and meteoritic organic carbon using Raman spectroscopy, J. Anal. Appl. Pyrolys., 96, 153–161, https://doi.org/10.1016/J.JAAP.2012.03.017, 2012.
Muirhead, D. K., Parnell, J., Spinks, S., and Bowden, S. A.: Characterization of organic matter in the Torridonian using Raman spectroscopy, Geol. Soc. London, Spec. Publ., 448, 71–80, https://doi.org/10.1144/SP448.2, 2017a.
Muirhead, D. K., Bowden, S. A., Parnell, J., and Schofield, N.: Source rock maturation owing to igneous intrusion in rifted margin petroleum systems, J. Geol. Soc. London., 174, 979–987, https://doi.org/10.1144/jgs2017-011, 2017b.
Muirhead, D. K., Bond, C. E., Watkins, H., Butler, R. W. H., Schito, A., Crawford, Z., and Marpino, A.: Raman Spectroscopy: an effective thermal marker in low temperature carbonaceous fold-thrust belts, Geol. Soc. London, Spec. Publ., SP490-2019–27, https://doi.org/10.1144/sp490-2019-27, 2019.
Nakamura, Y., Oohashi, K., Toyoshima, T., Satish-Kumar, M., and Akai, J.: Strain-induced amorphization of graphite in fault zones of the Hidaka metamorphic belt, Hokkaido, Japan, J. Struct. Geol., 72, 142–161, https://doi.org/10.1016/J.JSG.2014.10.012, 2015.
Nakamura, Y., Hara, H., and Kagi, H.: Natural and experimental structural evolution of dispersed organic matter in mudstones: The Shimanto accretionary complex, southwest Japan, Isl. Arc, 28, e12318, https://doi.org/10.1111/IAR.12318, 2019.
Nibourel, L., Berger, A., Egli, D., Luensdorf, N. K., and Herwegh, M.: Large vertical displacements of a crystalline massif recorded by Raman thermometry, Geology, 46, 879–882, https://doi.org/10.1130/G45121.1, 2018.
Nibourel, L., Berger, A., Egli, D., Heuberger, S., and Herwegh, M.: Structural and thermal evolution of the eastern Aar Massif: insights from structural field work and Raman thermometry, Swiss J. Geosci., 114, 1–43, https://doi.org/10.1186/s00015-020-00381-3, 2021.
Oberlin, A., Bonnamy, S., and Rouxhet, P. G.: Colloidal and supermolecular aspect of carbon, in: Chemistry and physics of carbon, edited by: Thrower, P. A. and Radovic, L. R., New York, NY: Marcel Dekker, Inc., 26, 1–148, 1999.
Pasteris, J. D.: In Situ Analysis in Geological Thin-Sections by Laser Raman Microprobe Spectroscopy: A Cautionary Note, Appl. Spectrosc., 43, 567–570, https://doi.org/10.1366/0003702894202878, 1989.
Pfiffner, O. A.: The structure of the Helvetic nappes and its relation to the mechanical stratigraphy, J. Struct. Geol., 15, 511–521, https://doi.org/10.1016/0191-8141(93)90145-Z, 1993.
Polissar, P. J., Savage, H. M., and Brodsky, E. E.: Extractable organic material in fault zones as a tool to investigate frictional stress, Earth Planet. Sc. Lett., 311, 439–447, https://doi.org/10.1016/j.epsl.2011.09.004, 2011.
Quirico, E., Montagnac, G., Rouzaud, J. N., Bonal, L., Bourot-Denise, M., Duber, S., and Reynard, B.: Precursor and metamorphic condition effects on Raman spectra of poorly ordered carbonaceous matter in chondrites and coals, Earth Planet. Sc. Lett., 287, 185–193, https://doi.org/10.1016/j.epsl.2009.07.041, 2009.
Rabinowitz, H. S., Savage, H. M., Polissar, P. J., Rowe, C. D., and Kirkpatrick, J. D.: Earthquake slip surfaces identified by biomarker thermal maturity within the 2011 Tohoku-Oki earthquake fault zone, Nat. Commun., 11, 1–9, https://doi.org/10.1038/s41467-020-14447-1, 2020.
Ramsay, J. G.: Shear zone geometry: A review, J. Struct. Geol., 2, 83–99, https://doi.org/10.1016/0191-8141(80)90038-3, 1980.
Rouzaud, J.-N., Deldicque, D., Charon, É., and Pageot, J.: Carbons at the heart of questions on energy and environment: A nanostructural approach, Comptes Rendus Geosci., 347, 124–133, https://doi.org/10.1016/J.CRTE.2015.04.004, 2015.
Salver-Disma, F., Tarascon, J. M., Clinard, C., and Rouzaud, J. N.: Transmission electron microscopy studies on carbon materials prepared by mechanical milling, Carbon N. Y., 37, 1941–1959, https://doi.org/10.1016/S0008-6223(99)00059-7, 1999.
Sauerer, B., Craddock, P. R., AlJohani, M. D., Alsamadony, K. L., and Abdallah, W.: Fast and accurate shale maturity determination by Raman spectroscopy measurement with minimal sample preparation, Int. J. Coal Geol., 173, 150–157, https://doi.org/10.1016/J.COAL.2017.02.008, 2017.
Savage, H. M., Polissar, P. J., Sheppard, R., Rowe, C. D., and Brodsky, E. E.: Biomarkers heat up during earthquakes: New evidence of seismic slip in the rock record, Geology, 42, 99–102, https://doi.org/10.1130/G34901.1, 2014.
Savage, H. M., Rabinowitz, H. S., Spagnuolo, E., Aretusini, S., Polissar, P. J., and Di Toro, G.: Biomarker thermal maturity experiments at earthquake slip rates, Earth Planet. Sc. Lett., 502, 253–261, https://doi.org/10.1016/j.epsl.2018.08.038, 2018.
Schito, A. and Corrado, S.: An automatic approach for characterization of the thermal maturity of dispersed organic matter Raman spectra at low diagenetic stages, Geol. Soc. London, Spec. Publ., 484, 107, https://doi.org/10.1144/sp484.5, 2018.
Schito, A., Romano, C., Corrado, S., Grigo, D., and Poe, B.: Diagenetic thermal evolution of organic matter by Raman spectroscopy, Org. Geochem., 106, https://doi.org/10.1016/j.orggeochem.2016.12.006, 2017.
Smith, S. A. F., Nielsen, S., and Di Toro, G.: Strain localization and the onset of dynamic weakening in calcite fault gouge, Earth Planet. Sc. Lett., 413, 25–36, https://doi.org/10.1016/j.epsl.2014.12.043, 2015.
Thrower, P.: Chemistry and physics of carbon: a series of advances, Marcel Dekkker, 22, 1–143, 1989.
Wilkins, R. W. T., Sherwood, N., and Li, Z.: RaMM (Raman maturity method) study of samples used in an interlaboratory exercise on a standard test method for determination of vitrinite reflectance on dispersed organic matter in rocks, Mar. Pet. Geol., 91, 236–250, https://doi.org/10.1016/j.marpetgeo.2017.12.030, 2018.
Wopenka, B. and Pasteris, J. D.: Structural characterization of kerogens to granulite-facies graphite: Applicability of Raman microprobe spectroscopy, Am. Mineral., 78, 533–557, 1993.
Zeng, Y. and Wu, C.: Raman and infrared spectroscopic study of kerogen treated at elevated temperatures and pressures, Fuel, 86, 1192–1200, https://doi.org/10.1016/j.fuel.2005.03.036, 2007.
Zhou, Q., Xiao, X., Pan, L., and Tian, H.: The relationship between micro-Raman spectral parameters and reflectance of solid bitumen, Int. J. Coal Geol., 121, 19–25, https://doi.org/10.1016/j.coal.2013.10.013, 2014.