the Creative Commons Attribution 4.0 License.
the Creative Commons Attribution 4.0 License.
 | 10 Oct 2022
Mechanical compaction mechanisms in the input sediments of the Sumatra subduction complex – insights from microstructural analysis of cores from IODP Expedition 362
Kitty L. Milliken
Peter Vrolijk
Guillaume Desbois
Janos L. Urai
The input sediments of the North Sumatra subduction zone margin, drilled during IODP Expedition 362, exhibit remarkable uniformity in composition and grain size over the entire thickness of the rapidly deposited Nicobar Fan succession (seafloor to 1500 m b.s.f.), providing a unique opportunity to study the micromechanisms of compaction. Samples were prepared from dried core samples (from Sites U1480 and U1481) by both Ar-ion cross-section polishing and broad ion beam cutting and imaged with a field-emission scanning electron microscope (SEM). The shallowest samples (seafloor to 28 m b.s.f.) display a sharp reduction in porosity from 80 % to 52 % due to collapse of large clay-domain surrounding matrix pores associated with rotation and realignment of clay platelets parallel to the bedding plane. The deeper succession (28 to 1500 m b.s.f.) exhibits less rapid reduction in porosity from 52 % to 30 % by the progressive collapse of silt-adjacent larger pores through bending as well as subsequent sliding and/or fracturing of clay particles. In addition, there is a correlated loss of porosity in the pores too small to be resolved by SEM.
Clastic particles show no evidence of deformation or fracturing with increasing compaction. In the phyllosilicates, there is no evidence for pressure solution or recrystallization: thus, compaction proceeds by micromechanical processes. An increase in effective stress up to 18 MPa (∼ 1500 m b.s.f.) causes the development of a weakly aligned phyllosilicate fabric mainly defined by illite clay particles and mica grains, while the roundness of inter-particle pores decreases as the pores become more elongated. We propose that bending of the phyllosilicates by inter-particle slip may be the rate-controlling mechanism.
Pore size distributions show that all pores within the compactional force chain deform, irrespective of size, with increasing compactional strain. This arises because the force chain driving pore collapse is localized primarily within the volumetrically dominant and weaker clay-rich domains; pores associated with packing around isolated silt particles enter into the force chain asynchronously and do not contribute preferentially to pore loss over the depth range studied.
- Article
(18800 KB) - Full-text XML
-
Supplement
(30622 KB) - BibTeX
- EndNote


Muds are fine-grained sediments (>50 % of particles <63 µm diameter) comprising platy detrital clay minerals and equidimensional detrital grains such as quartz, feldspar, and calcite (Nakano, 1967; Hesse, 1975; Sintubin, 1994). Understanding the mechanical, chemical, and microstructural properties of mud and mudstone is of great interest for rock property prediction in basic earth science, exploration, subsurface integrity studies, and geotechnical engineering (Yagiz, 2001; Aplin and Macquaker, 2011; Lazar et al., 2015). The chemical and physical behavior of marine muds plays a critical role in defining the geometry of accretionary prisms, locating the décollement for fault rupture (Vrolijk, 1990; Chester et al., 2013), and understanding subduction zone earthquakes and tsunamis (Dean et al., 2010; Chester et al., 2013; Hüpers et al., 2017).
Marine mud is deposited with a highly porous isotropic fabric (Bowles, 1969; Bennett et al., 1981, 1991); depositional porosity in mud is about twice as high as in sand (e.g., Velde, 1996; Lundegard, 1992). In contrast, mudstones have low porosities, modal pore sizes measured in nanometers, and an absence of textural controls on porosity (e.g., Aplin et al., 2006; Milliken et al., 2012, 2013). The processes in this dramatic evolution of porosity have similarities to compaction of sand to sandstone, comprising a combination of compaction and cementation (Milliken and Day-Stirrat, 2013), although the much smaller, elongated phyllosilicate grains increase the role of clay-bound water in the process (Karaborni et al., 1996). Whereas a refined and somewhat predictive understanding exists for porosity evolution in sand and sandstones (e.g., Lander and Walderhaug, 1999; Paxton et al., 2002; Lander et al., 2008; Ajdukiewicz and Lander, 2010; Desbois et al., 2011), such a model is at best preliminary for muds and mudstones (Pommer and Milliken, 2015; Milliken and Olson, 2017). It seems clear that the composition of the grain assemblage importantly sets the stage for porosity evolution in muds (Milliken, 2014), with cementation being the greatest in muds with abundant biogenic debris. In contrast to sandstones, however, cementation is far less common globally in mudstones (Milliken, 2019), leading to the notion that mechanical compaction may be far more important in muds. In addition, depositional environment also strongly controls porosity evolution, compaction, and diagenesis in mudrocks (e.g., Burland, 1990; Baruch et al., 2015; Delle Piane et al., 2015) as the initial clay and rigid grain compositions significantly affect both compaction (as this paper shows) and subsequent diagenetic alteration due to variations in composition. Establishing the expected compaction behavior for muds in a setting of well-constrained mud properties is an essential contribution that our study hopes to serve.
Investigations of mud and mudstone compaction are usually based on proxy data, such as velocity or density, rather than direct measurements of porosity (e.g., references in Mondol et al., 2007). Direct measurement of porosity is broadly classified into two categories: (1) experimental compaction in the laboratory (e.g., Mitchell, 1956; Bennett et al., 1981; Griffiths and Joshi, 1989, 1990; Vasseur et al., 1995; Djeran-Maigre et al., 1998; Cetin, 2004; Mondol et al., 2007; Fawad et al., 2010; Emmanuel and Day-Stirrat, 2012) and (2) studies on natural samples those are compacted in situ with depth (e.g., Meade, 1964; Ho et al., 1999; Aplin et al., 2003, 2006; Day-Stirrat et al., 2008, 2010, 2012; Milliken and Reed, 2010; Milliken et al., 2012, 2013). A common shortcoming of the studies on the naturally compacted samples is the assumption that the bulk porosity is a direct measure of compaction, although porosity loss has contributions of both compaction and cementation (Ehrenberg, 1989; Lundegard, 1992; Paxton et al., 2002), and this can only be accomplished by petrographic inspection (Milliken and Curtis, 2016). Experimental studies generally avoid this shortcoming as the sample sets generally do not undergo any chemical change during the investigation. Studies of shallowly buried units (like the present study) are the ones most likely to avoid the complication of cementation, especially if temperatures are low and bulk grain assemblages are siliciclastic (Milliken, 2008, 2014).
Previous studies report contrasting ideas about the mechanisms of mechanical compaction of mud. Some studies conclude that rotation is the dominant particle-scale mechanism for mechanical compaction (Bowles et al., 1969; Oertel and Curtis, 1972; Vasseur et al., 1995), although other particle-scale deformation mechanisms were not investigated by these authors. A few studies state that burial compaction significantly increases the alignment of phyllosilicate (clay and mica) parallel to the bedding planes (Bowles et al., 1969; Oertel and Curtis, 1972; Vasseur et al., 1995) (a detailed review of the previous studies on mechanical compaction is given in Document S1 in the Supplement). Other studies suggest that intense mechanical compaction (i.e., effective stress) has a limited impact on the development of phyllosilicate fabric in mud (Ho et al., 1999; Aplin et al., 2006; Day-Stirrat et al., 2008, 2011). In addition, earlier authors concluded that an increase in effective stress causes preferential loss of larger pores, and as a result, the mean porosity of the samples decreases (Delage and Lefebvre, 1984; Griffiths and Joshi, 1989, 1990; Emmanuel and Day-Stirrat, 2012). With increasing consolidation stress, a bimodal pore size distribution curve shifts toward smaller pore sizes as larger pores rapidly collapse (Griffiths and Joshi, 1989, 1990, 1991). These studies investigated the changes in particle alignment and reduction in porosity (Ho et al., 1999; Aplin et al., 2006; Day-Stirrat et al., 2008, 2011) but without imaging the evolution of pore morphology with increasing compactional strain. Moreover, in previous studies, the authors mainly performed laboratory consolidation experiments on lab-produced particle packs and used conventional techniques, such as mercury-intrusion porosimetry and high-resolution X-ray pole figure goniometry (HRXTG), to understand the evolution of pore size distribution with consolidation stress (Ho et al., 1999; Aplin et al., 2006). Studies on naturally compacted samples are less common.
We received 55 mud samples from drill cores collected during IODP Expedition 362 west of the North Sumatra subduction zone margin and investigated the evolution of petrographic microstructure and pore morphology as a function of compactional strain. Apart from general implications for global mudrocks, we hope this investigation will also contribute to studies that seek to predict rock properties in the deeper subsurface at the Sumatra subduction front.
The Sumatra subduction zone extends 5000 km from the Andaman–Nicobar Islands in the northwest to the Java–Banda arc in the southeast (Fig. 1a and b) (Prawirodirdjo et al., 1997; Hippchen and Hyndman, 2008). The trench of the Sumatra subduction zone (Fig. 1a) developed on the subducting Indo-Australian Plate at a convergence rate of 5.5 cm yr−1 in the north and 7.23 cm yr−1 in the south (Ghosal et al., 2014; Moeremans and Singh, 2015).
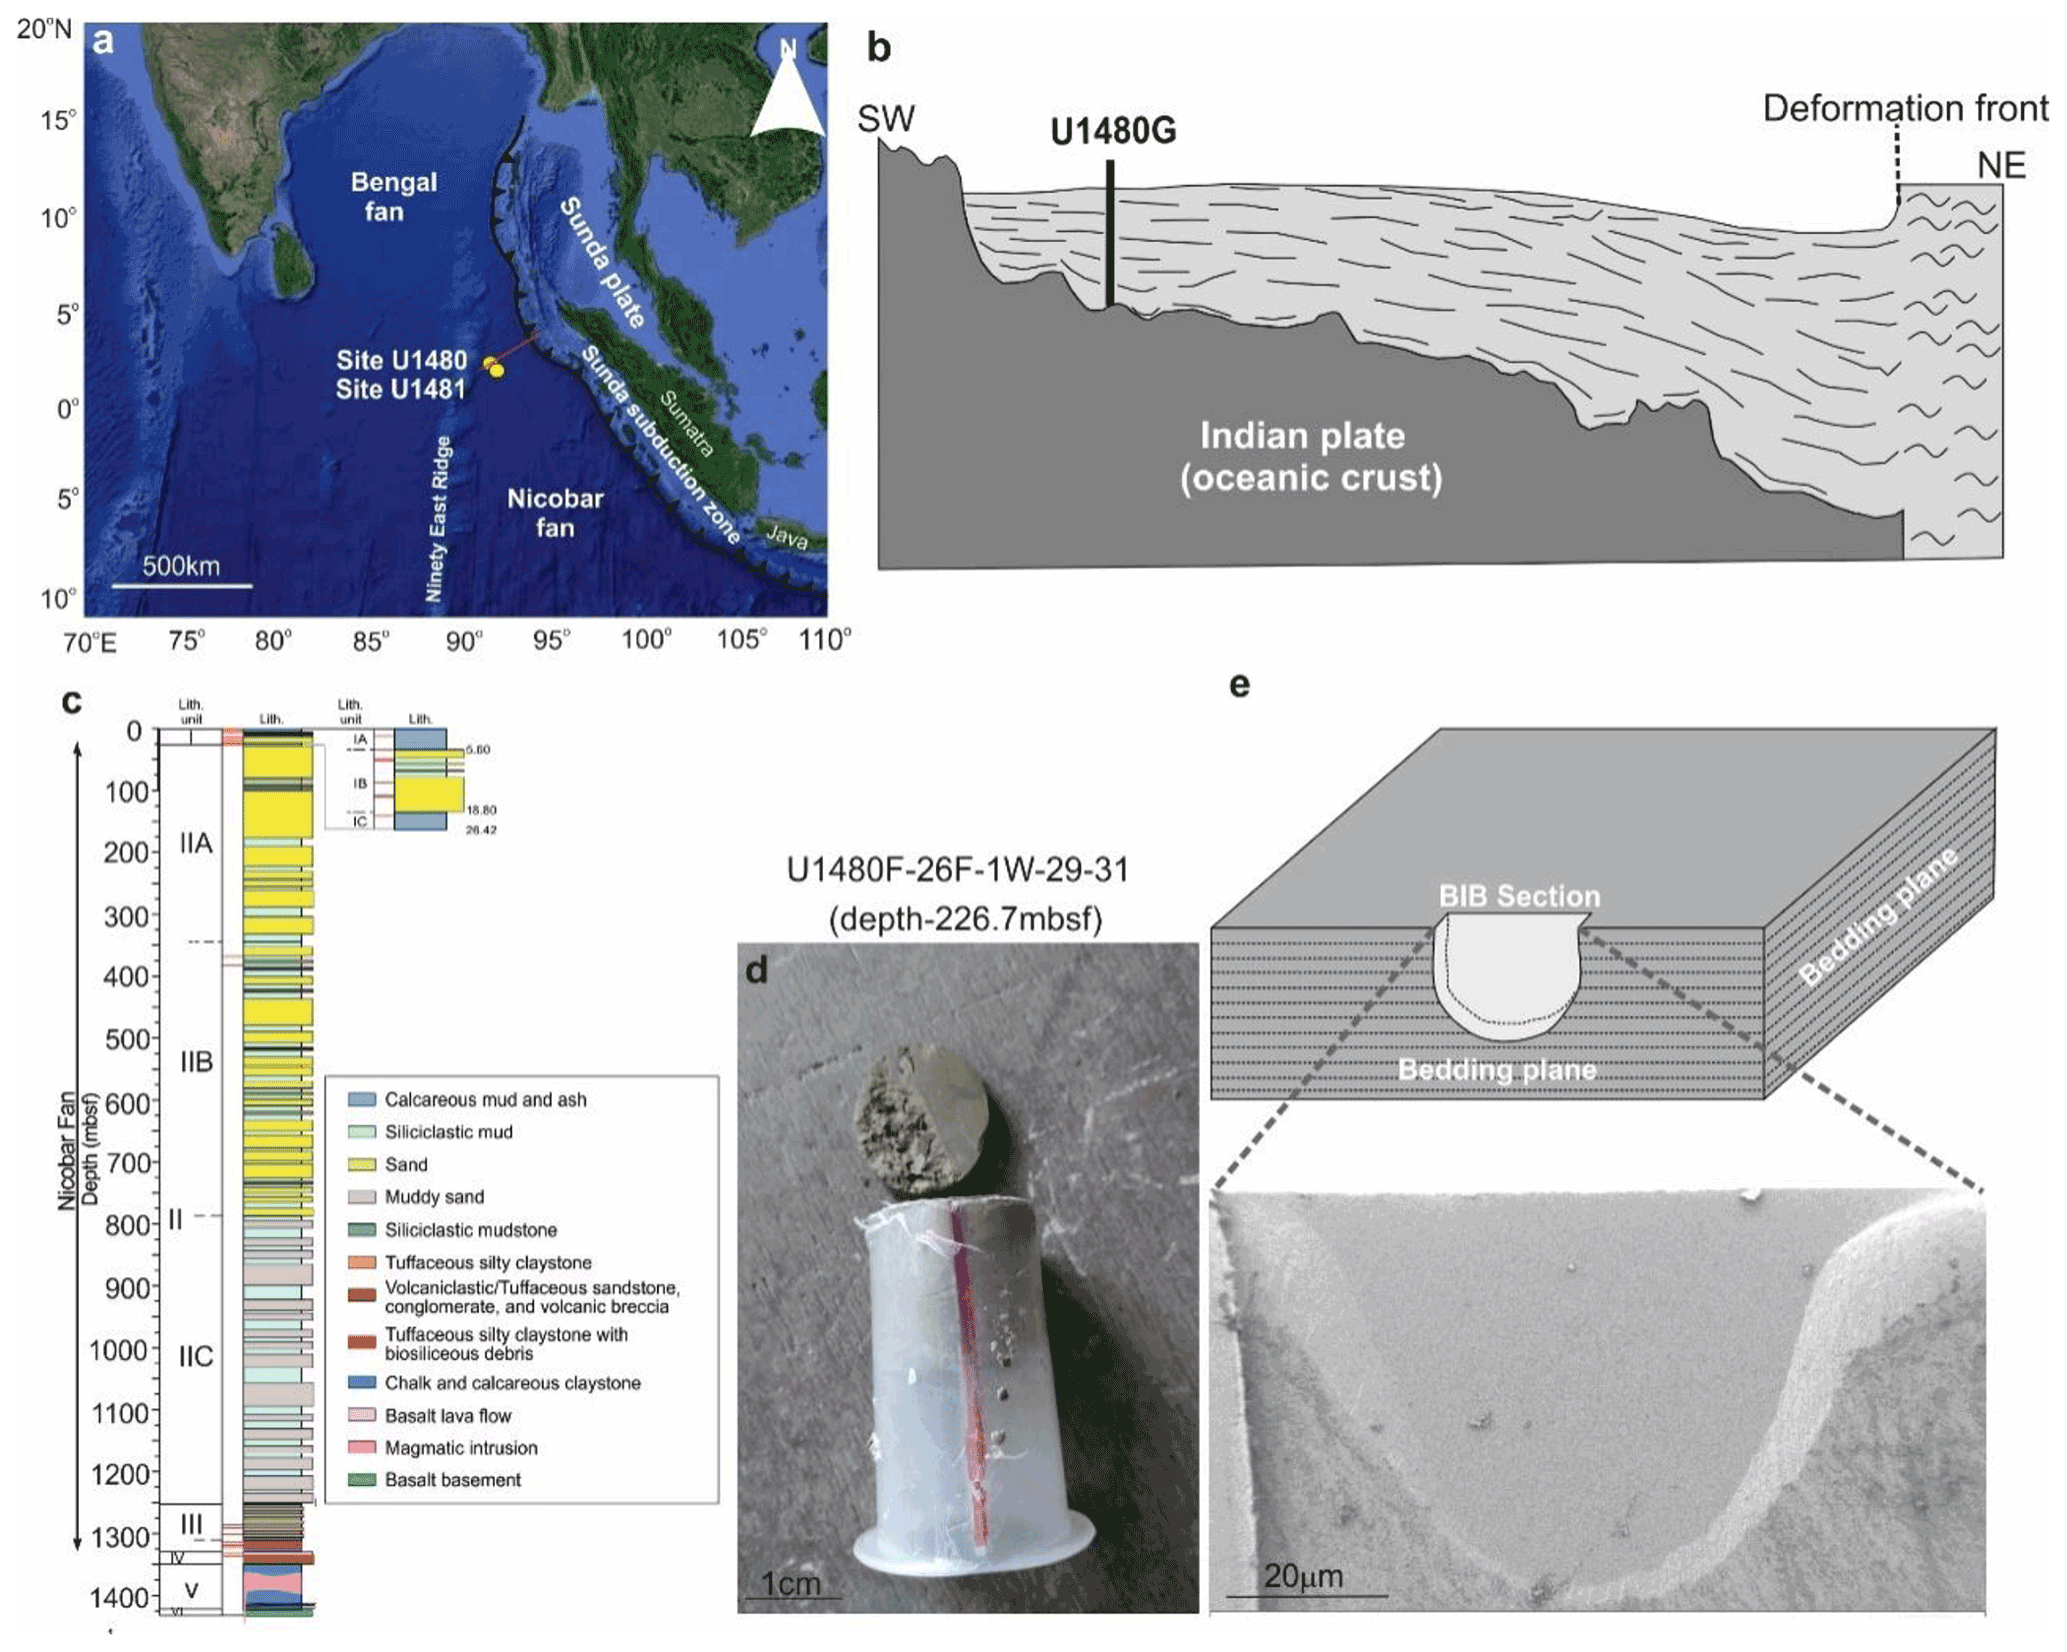
Figure 1(a) Satellite image of the Sumatra subduction zone and locations of the U1480 and U1481 drilling sites (created from © Google Maps). (b) Schematic diagram showing the location of the primary drilling site and the deepest drill hole (Hole G) at Site U1480 in sectional view (adapted from a seismic profile from SW to NE after Hüpers et al., 2017). The location and extension of the seismic profile are represented by the red line in (a). (c) Lithostratigraphic units encountered at Site U1480 (adapted after McNeill et al., 2017a). (d) Representative tube sample received from the IODP repository, Japan. The red-colored line on the tube surface represents the notch used to denote the orientation of samples collected from the drill core. (e) Representative BIB cross-section polished perpendicular to the bedding plane.
On 26 December 2004, the west coast of North Sumatra recorded one of the largest earthquakes (Mw 9.3) in the 21st century, generating a devastating tsunami in the Indian Ocean (Ammon et al., 2005; Lay et al., 2005). Understanding the mechanism(s) behind this unprecedented event was the central idea behind IODP Expedition 362 (Fig. 1). The main objective of the expedition was to collect core and log data from the incoming sedimentary succession of the Indo-Australian oceanic plate to understand the seismogenic process related to the margin (Dugan et al., 2017; McNeill et al., 2017a). During the expedition in 2016, drilling was performed on two sites: U1480 (Holes E, F, G, and H) and U1481 (Hole A) located on the oceanic plate west of the North Sumatra subduction margin and east of the Ninety East Ridge (Fig. 1a, b) (Dugan et al., 2017). The drilling sites recovered a complete, 1.5 km thick sedimentary section from late Cretaceous to Pleistocene down to the basement of basaltic crust (Dugan et al., 2017; McNeill et al., 2017a).
The input sedimentary section of the Sumatra subduction zone comprises the distal part of the trench wedge, Nicobar Fan sequence, and pre-fan pelagic section on the basaltic crust at the bottom (Dugan et al., 2017; McNeill et al., 2017a). At Site U1480, the entire recovered section was categorized into six lithological entities: Units I to VI (Fig. 1c) (McNeill et al., 2017a). Unit I (0 to 26.72 m b.s.f.) consists of unconsolidated calcareous clay, which is silty clay with alternating fine sand (McNeill et al., 2017a). Unit II from 26.72 to 1250 m b.s.f. consists of three subunits (IIA, IIB, and IIC) and mainly exhibits alternating fine-grained sand and silty clay to silt (McNeill et al., 2017a). Unit III (1250 ∼ 1327 m b.s.f.) is divided into two subunits: Units IIIA and IIIB (McNeill et al., 2017a). Unit IIIA consists of thin to medium-bedded, gray–green, or brown mudstone and intercalated siltstone, and Unit IIIB is composed of reddish-brown tuffaceous silty claystone with fragmented sponge spicules and radiolaria (McNeill et al., 2017a). The boundary between Units IIIA and IIIB (1310 m b.s.f.) at this site marks the base of the Nicobar Fan and the beginning of the thin pre-fan succession (Pickering et al., 2020). Units IV, V, and VI include volcanoclastic rocks with tuffaceous sandstone, conglomerates, and basaltic oceanic crust, respectively. At Site U1481, the pre-fan succession was not encountered, and Unit III, a thicker equivalent of Subunit IIIA at Site U1480, represents the material of the lower Nicobar Fan (see Fig. F15 in Site U1481 report; McNeil et al., 2017a). This study is restricted to the thin, distal trench wedge (Unit I) and Nicobar Fan sequence (Units II and IIIA, which is equivalent to Unit III at U1481).
X-ray diffraction (XRD) of bulk samples and clay fractions at Site U1480 shows a clay mineral assemblage dominated by illite with lesser amounts of smectite and chlorite (Rosenberger et al., 2020) (Fig. 2a, b, c, and d; Table S1 and Fig. S1 in the Supplement). Clay mineral data arise from three separate analyses: (1) bulk sample analyses of air-dried samples (random orientation) on board the ship used to define the proportion of all clay minerals in a sediment sample (McNeill et al., 2017a; Underwood et al., 2020), (2) air-dried clay-sized samples (sedimented and oriented) analyzed in New Mexico that define the types and abundances of clay minerals (Rosenberger et al., 2020; note that abundances are limited to clay minerals used in the reference mixtures, which include discrete illite and discrete smectite), and (3) glycol-saturated clay-sized samples (sedimented and oriented) analyzed in New Mexico that determine the amount of illite in mixed layer , defined as smectite no. 2 (Rosenberger et al., 2020). Note that the amount of illite in the mixed layer is only accounted for in the expandability value and never in the discrete illite value.
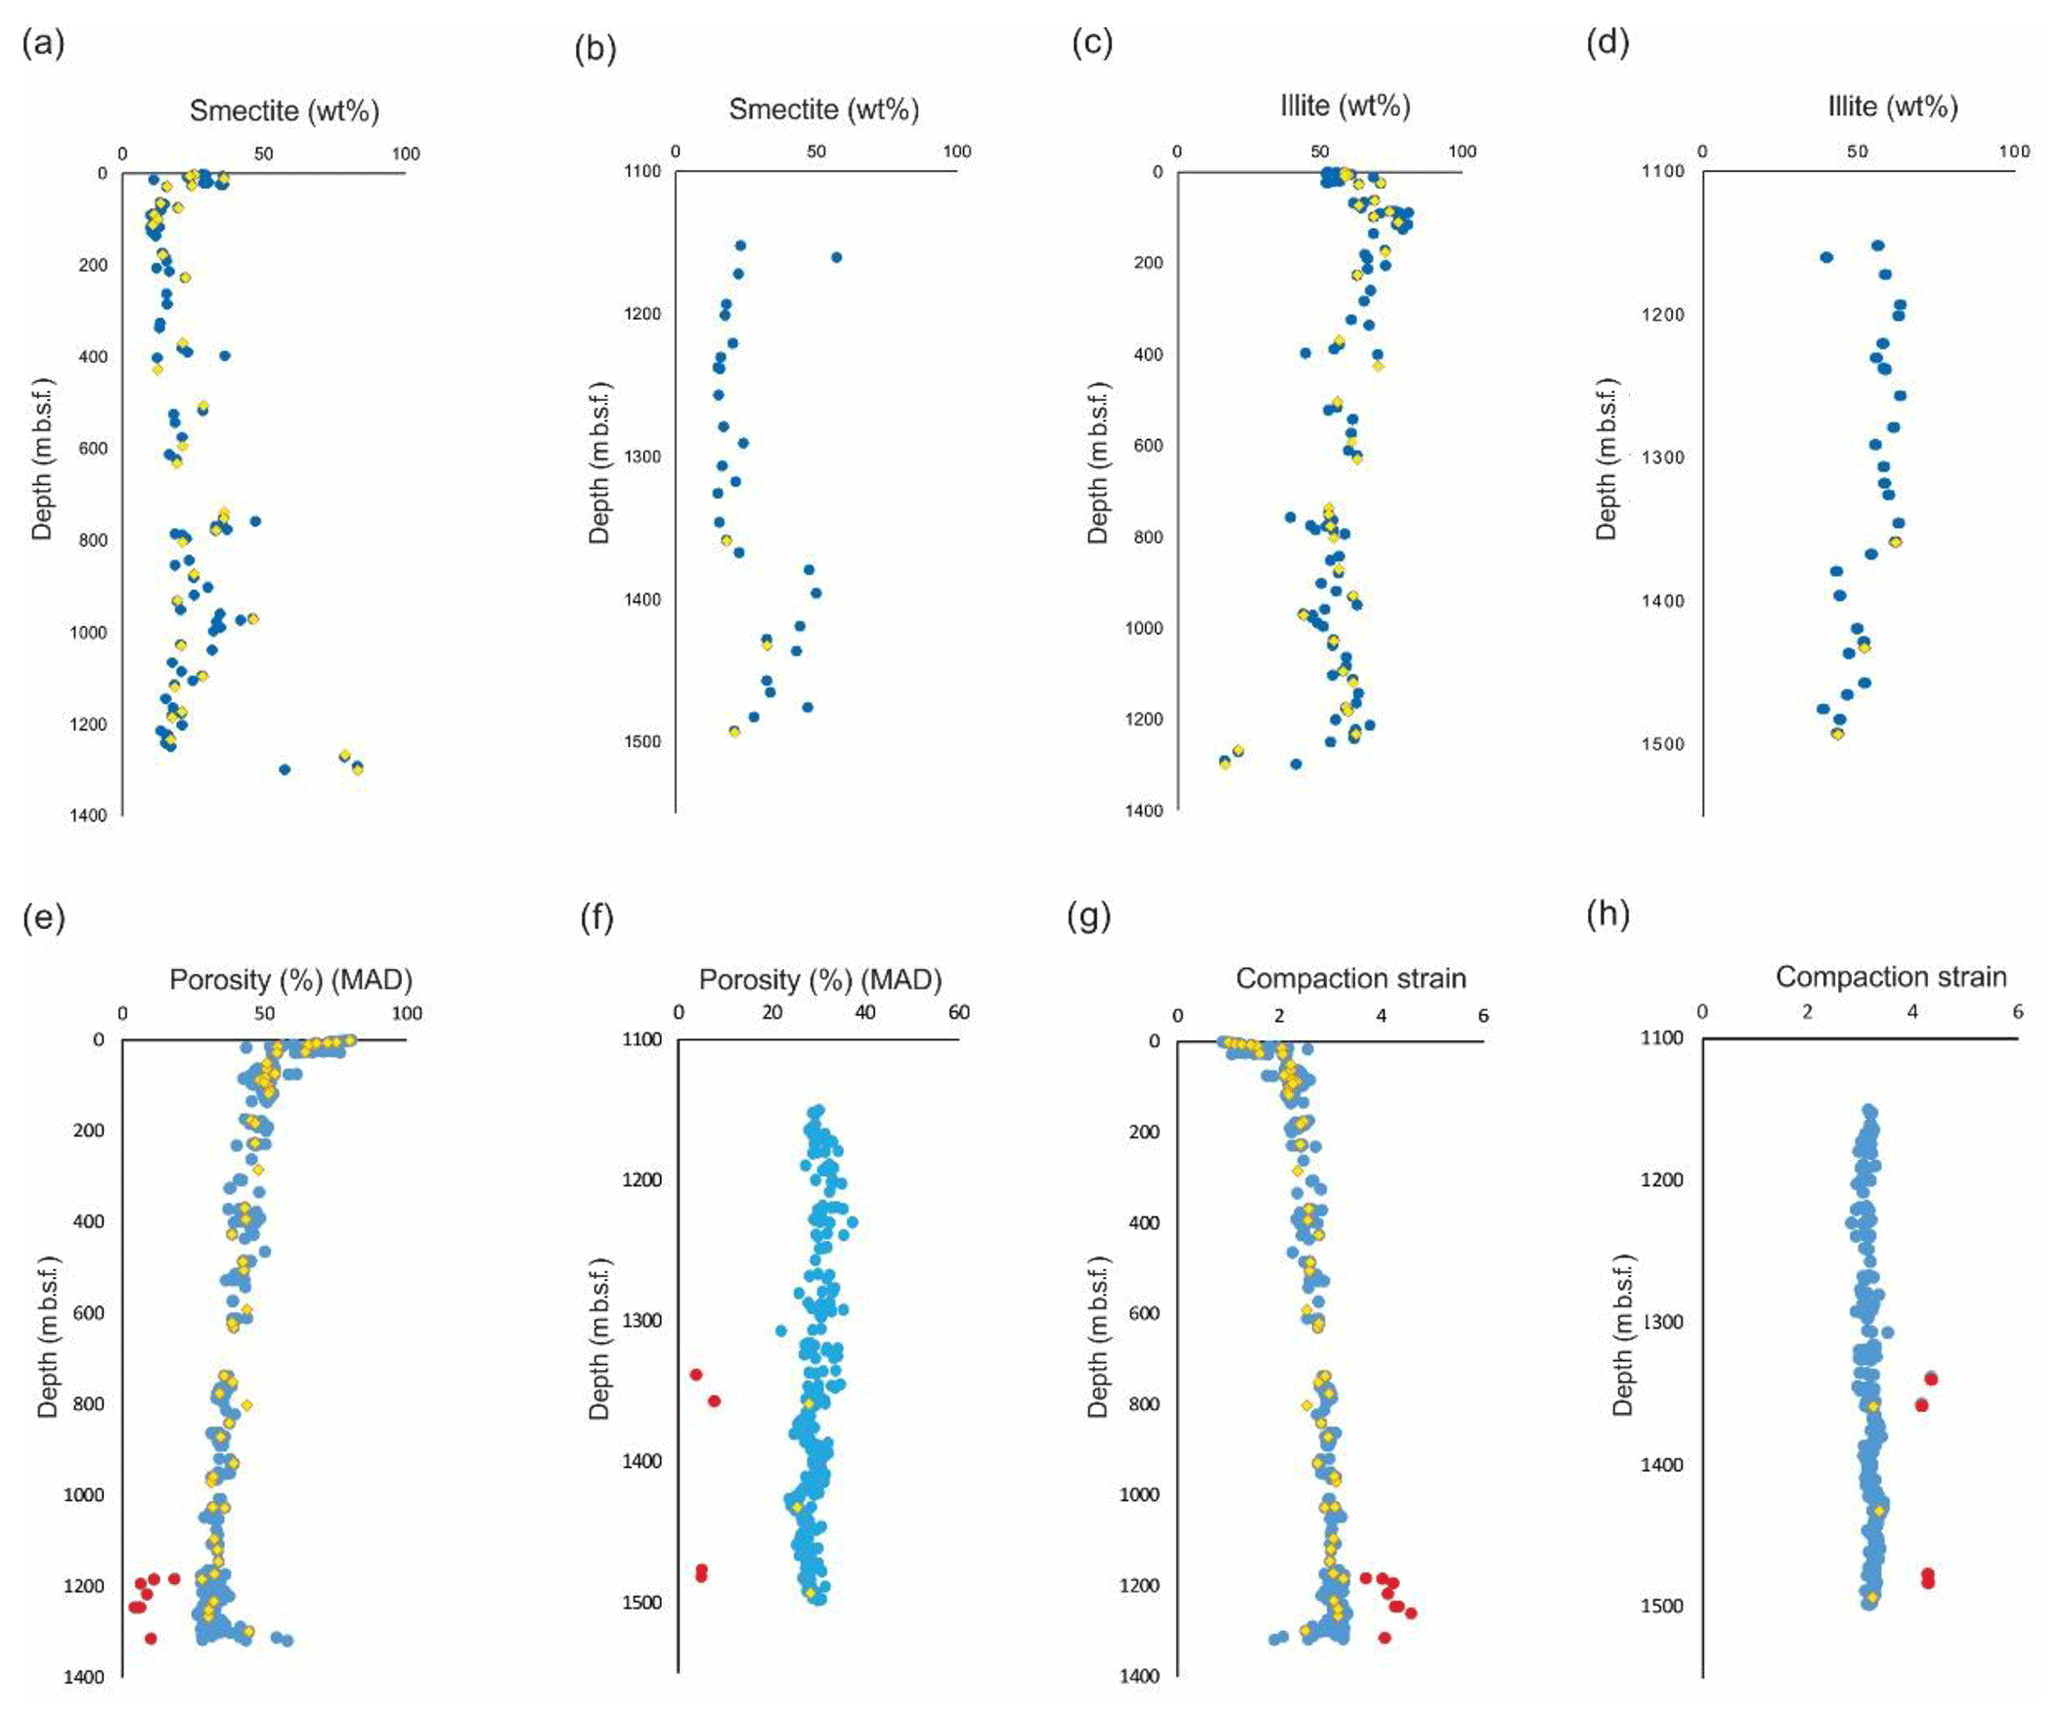
Figure 2Depth profiles of smectite content (wt %; clay fraction) for Sites U1480 (a) and U1481 (b) (blue symbol). Depth profiles of illite content (wt %; clay fraction) for Sites U1480 (a) and U1481 (b) (blue symbol). Yellow symbols indicate samples analyzed by SEM imaging. (e–f) Shipboard MAD (moisture and density) porosity profiles for mudstone samples recovered from Sites U1480 and U1481 (blue symbol). (g–h) Calculated compaction strain profiles for Sites U1480 and U1481 (blue symbols). Red-colored points are cemented (concretion) samples. Clay mineralogy data are plotted from Rosenberger et al. (2020), and MAD data are extracted from McNeill et al. (2017b).
Siliciclastic samples consist of 50 %–70 % clay minerals (McNeill et al., 2017a). Smectite fraction, determined from the air-dried, clay-sized samples (as described in Underwood et al., 2020), is more abundant in Unit I than Unit II, where smectite abundance ranges from 5 %–30 % with rare samples containing as much as 45 % smectite. In Unit II, smectite fraction ranges from 10 %–30 % with local discreet enrichments as great as 40 %–45 %. Smectite again increases in Unit III, reaching a value as high as 68 % in the samples attributed to the Nicobar Fan section. There is a weak increase in the expandability of mixed layer with depth (determined from glycol-saturated, clay-sized samples; Rosenberger et al., 2020; Underwood et al., 2020; Fig. S2), suggesting a shift in clay mineral provenance rather than smectite–illite diagenesis. Montmorillonite is interpreted as the smectite mineral (Rosenberger et al., 2020). Chlorite+kaolinite abundance is similar in Units I and II, ranging from 8 % to 20 % with rare occurrences as high as 24 %; Unit III is almost devoid of chlorite+kaolinite. Heating experiments on select samples indicate that chlorite makes up 66 %–100 % of this mineral category (Rosenberger et al., 2020). Illite comprises the remainder of the clay mineral assemblage, ranging from 50 %–79 % in Unit II, while Unit I is correspondingly less illite-rich (42 %–70 %). In the Unit III Nicobar Fan section, illite makes up only 18 %–36 % of the clay fraction. Again, it should be noted that the shipboard methodology used for XRD analysis is semiquantitative and has limitations in identifying bulk mineralogy of the samples; the abundance of mixed layer clays and the expandability of mixed layer is only inferred qualitatively (McNeil et al., 2017a; Underwood et al., 2020).
The Nicobar Fan sequence exhibits almost compositionally homogeneous (silt clay ratio; mostly “silty clay”) subunits with uniform grain size (McNeill et al., 2017a) and a history of rapid deposition (125–290 m my−1; Backman et al., 2019). The sedimentary sequence exhibits no evidence of uplift and currently occurs at maximum burial depth. The drilling sites are 255 km away from the deformation front; thus, the samples are undisturbed by tectonic faulting associated with subduction (Fig. 1b). In addition, owing to the scarcity of biogenic grains and the low temperatures encountered (<68 ∘C), cementation is only observed as highly localized concretions (red-colored symbols in Fig. 2e, f, g, and h) (McNeil et al., 2017b; Torres et al., 2022). Such a homogeneous sedimentary succession extending across 1.5 km depth is rare in sedimentary basins. Hence, these samples provide us with a unique opportunity to study depth-wise variation in microstructure as a function of vertical effective stress with few complications from multiple causes of porosity loss.
This study is based on two sample sets that were obtained from Sites 1480 (Holes E, F, G, and H) and 1481 (Hole A) independently and analyzed by slightly different methods. Samples have been prepared using Ar-ion cross-section polishing and analyzed using a scanning electron microscope equipped with a field-emission gun (BIB–SEM technique). The first sample set (33 mud samples; depth 1.24 to 1300 m b.s.f.) was prepared and analyzed at RWTH Aachen University, Germany. The second sample set (22 samples; depths 6.25 to 1493.30 m b.s.f.) was prepared and studied at the Bureau of Economic Geology (BEG) at the University of Texas at Austin. Respective core descriptions of these 55 mud samples and their bulk mineralogy data are tabulated in Table 1.
Table 1Core description, bulk mineralogy (McNeill et al., 2017b), and clay composition (Rosenberger et al., 2020) of the analyzed samples. Bulk measurements were done shipboard on Expedition 362 (McNeil et al., 2017a; Underwood et al., 2020). Additional clay mineralogical analysis was done on the <2 µm particle fraction onshore using a different instrument and methodology (Rosenberger et al., 2020). Plag: plagioclase feldspar, Smec: smectite*, Chl: chlorite, Kaol: kaolinite, Calc: calcite.
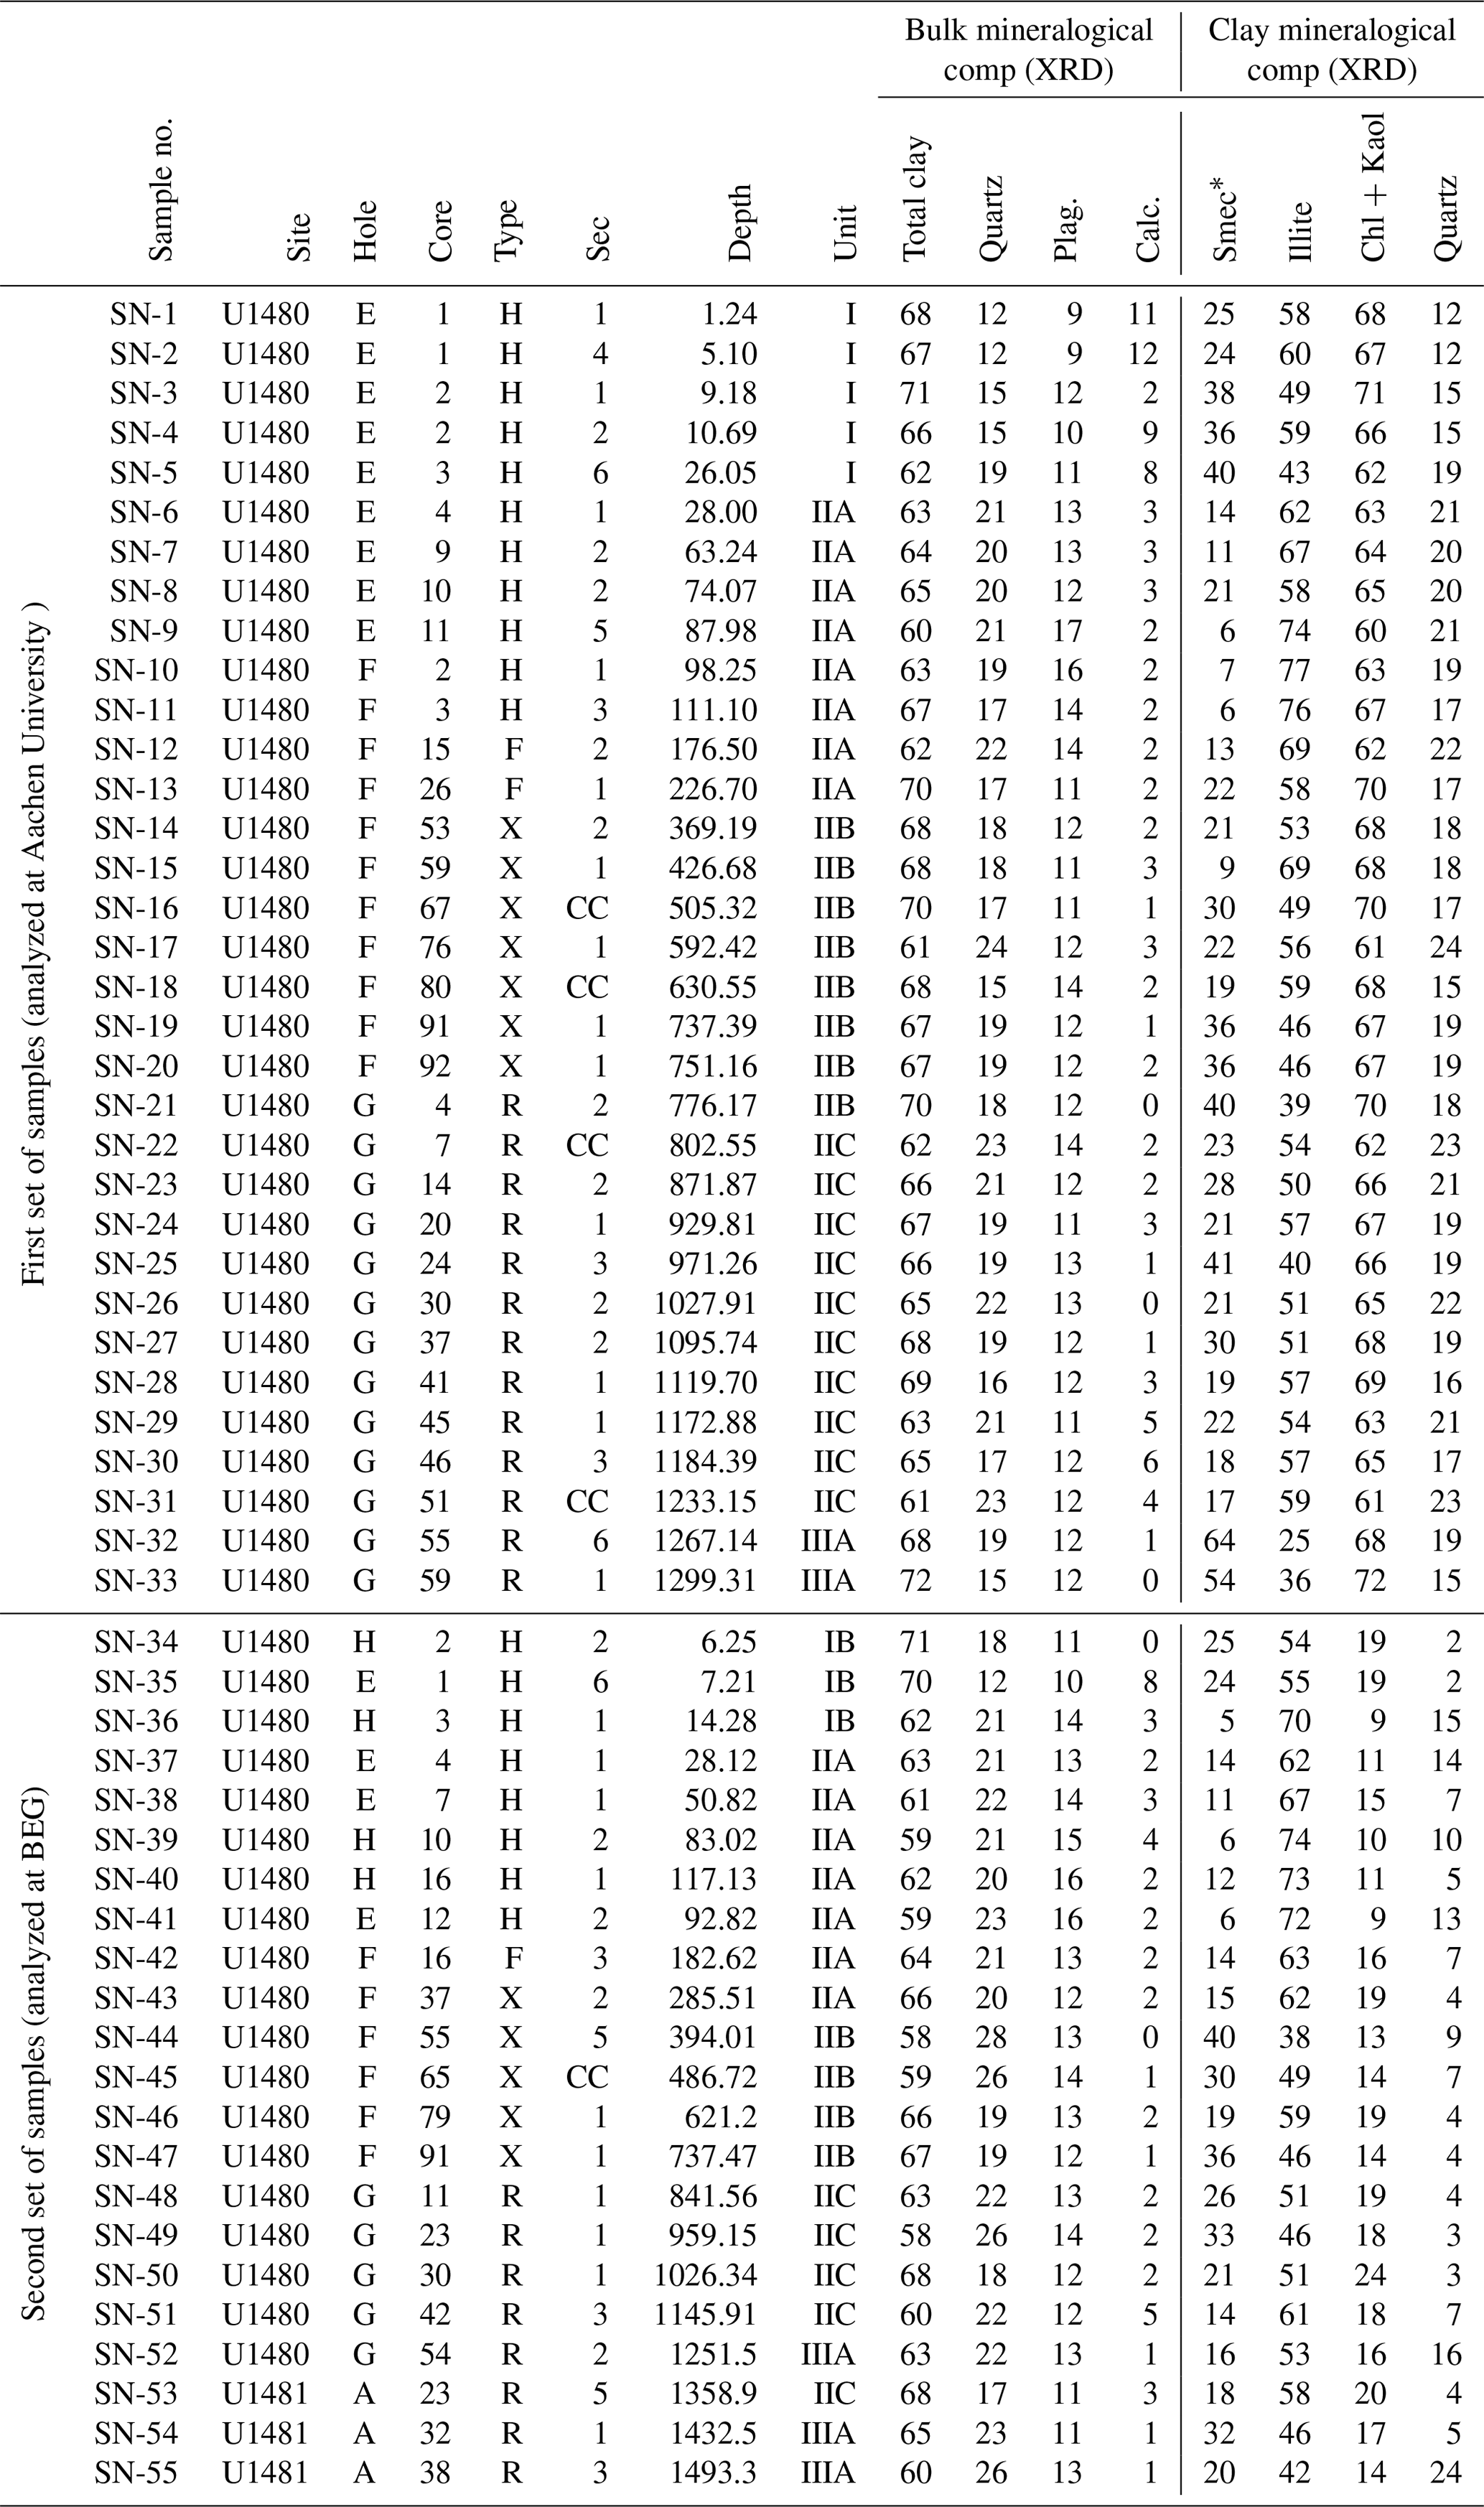
* Smectite includes all mixed layer ; the expandability of mixed layer was determined separately (Rosenberger et al., 2020).
3.1 BIB–SEM technique (first set of samples, Aachen University)
3.1.1 Sample preparation for BIB–SEM and imaging
After drilling, the samples were stored at the Kochi drill core repository (IODP), Japan, for 4 years (2016–2020) in refrigerated storage areas, maintaining a temperature of ca. 4 ∘C and 80 % humidity (http://www.kochi-core.jp/en/iodp-curation/curation-sop_2.html, last access: 24 July 2022). We received a total of 33 freeze-dried mud samples (SN-1 to SN-33 in Table 1) for analysis at Aachen. The samples were collected using a tube inserted perpendicular to the cut face of the drill core in such a way that the notch of the tube identified the top of the sample, so the orientation of bedding planes for each sample was known. In Fig. 1d, a tube sample received from the IODP repository is shown; the red line on the top of the tube identifies the notch. Subsamples (10 × 5 × 2 mm3) were cut from the individual freeze-dried samples using a razor blade. These subsamples were pre-polished using silicon carbide (SiC) paper to reduce the roughness of the surface down to 10 µm. Further, broad ion beam (BIB) polishing was carried out using a JEOL SM-09010 cross-section polisher for 10 h at 6 kV and 150 µA. BIB reduces surface damage by removing a 100 µm thick layer to generate a high-quality polished cross-section of 1–2 mm2 with topography less than 5 nm (Desbois et al., 2009).
After polishing, the BIB cross-sections were coated with tungsten and imaged with a Zeiss Supra 55 SEM with an SE2, BSE, and EDX detector (Fig. S3). SE2 images were used to image porosity, and BSE images are combined with an EDX map as well as EDX point analysis for identifying mineral phases. For each cross-section, we made mosaics of hundreds of SE2 and BSE images at a magnification of 20 000× (∼ 14.3 nm pixel value) and 10 000×, respectively, with an overlap of 20 % to 30 %, (Klaver et al., 2012, 2015, 2016; Hemes et al., 2013, 2015, 2016; Laurich et al., 2014). The mosaics are stitched together using Aztec software, preserving the original pixel resolution. Finally, these stitched images are used for the segmentation of pore spaces, minerals, and other respective analyses.
3.1.2 Image segmentation and pore analysis
For quantifying porosity and pore morphology, individual SE2 image mosaics were segmented using a “seed and grow” algorithm (Adams and Bischof, 1994) implemented with a MATLAB code (Jiang et al., 2015; Schmatz et al., 2017) (Fig. S3). The seed and grow algorithm works based on the difference in intensity of the grayscale value in an image (bright: minerals, dark: pores). After automatic segmentation, individual pores in SE2 images are manually corrected if required.
Similarly, using ImageJ software (threshold toolbox and machine learning algorithm), segmentation of the individual mineral phases was carried out by combining BSE images and EDX elemental maps. While quartz, calcite, pyrite, and mica minerals are efficiently segmented using these tools, feldspars are found to be difficult to segment because of similar composition as clay (Figs. S4, S5 and S6). Finally, corrected pore-segmented SE2 mosaics are overlaid on the phase maps using the “georeference” tool of QGIS (http://qgis.osgeo.org, last access: 11 December 2021) (Figs. S4, S5, and S6).
3.1.3 Pore detection resolution (PPR) and representative area analysis (REA)
Practical pore detection resolution (PPR) indicates the pore sizes above which one can assume detection of 100 % of the pores present in the SE2 mosaic (Klaver et al., 2012). In agreement with earlier results using this instrument (Klaver et al., 2012, 2015, 2016; Hemes et al., 2013, 2015, 2016; Laurich et al., 2014), we found PPR of ∼ 2000 and ∼ 8500 nm2 for the magnification of 20 000 × and 10 000 × images, respectively, corresponding to 10 pixels.
After segmenting all minerals, representative elementary area analysis (REA) was performed using the box counting technique on mineralogical phase maps (Kameda et al., 2006; Klaver et al., 2012). Similar steps are also followed for determining a representative elementary area for SE2 images. The estimated REA values using SE2 and BSE mosaics for the analyzed 33 mudstone samples are documented in Table S2.
Porosity, pore morphology, pore size, and the statistical distribution of pores were obtained using image analysis techniques on 2D images collected using the BIB–SEM technique. Because pores are non-spherical 3D objects that are cut perpendicular to the bedding plane to acquire a 2D image dataset, there may be random and systematic errors when comparing 2D and 3D results. We plotted shipboard-measured MAD (moisture and density) porosity vs. depth (Fig. 2e) and also BIB–SEM porosity vs. depth for the analyzed samples (Fig. 3a); MAD porosity documents bulk porosity for the sample, and BIB–SEM porosity represents 2D cuts of the non-spherical 3D pores and porosity. As there is a first-order correspondence between the two porosity measurements, we deduce that porosity and pore size distributions obtained from 2D image analysis reflect the bulk rock porosity and 3D pore size distribution of the samples. In addition, the estimated REA appears to be appropriate for minimizing systematic errors in the bulk pore characteristics of the sample.
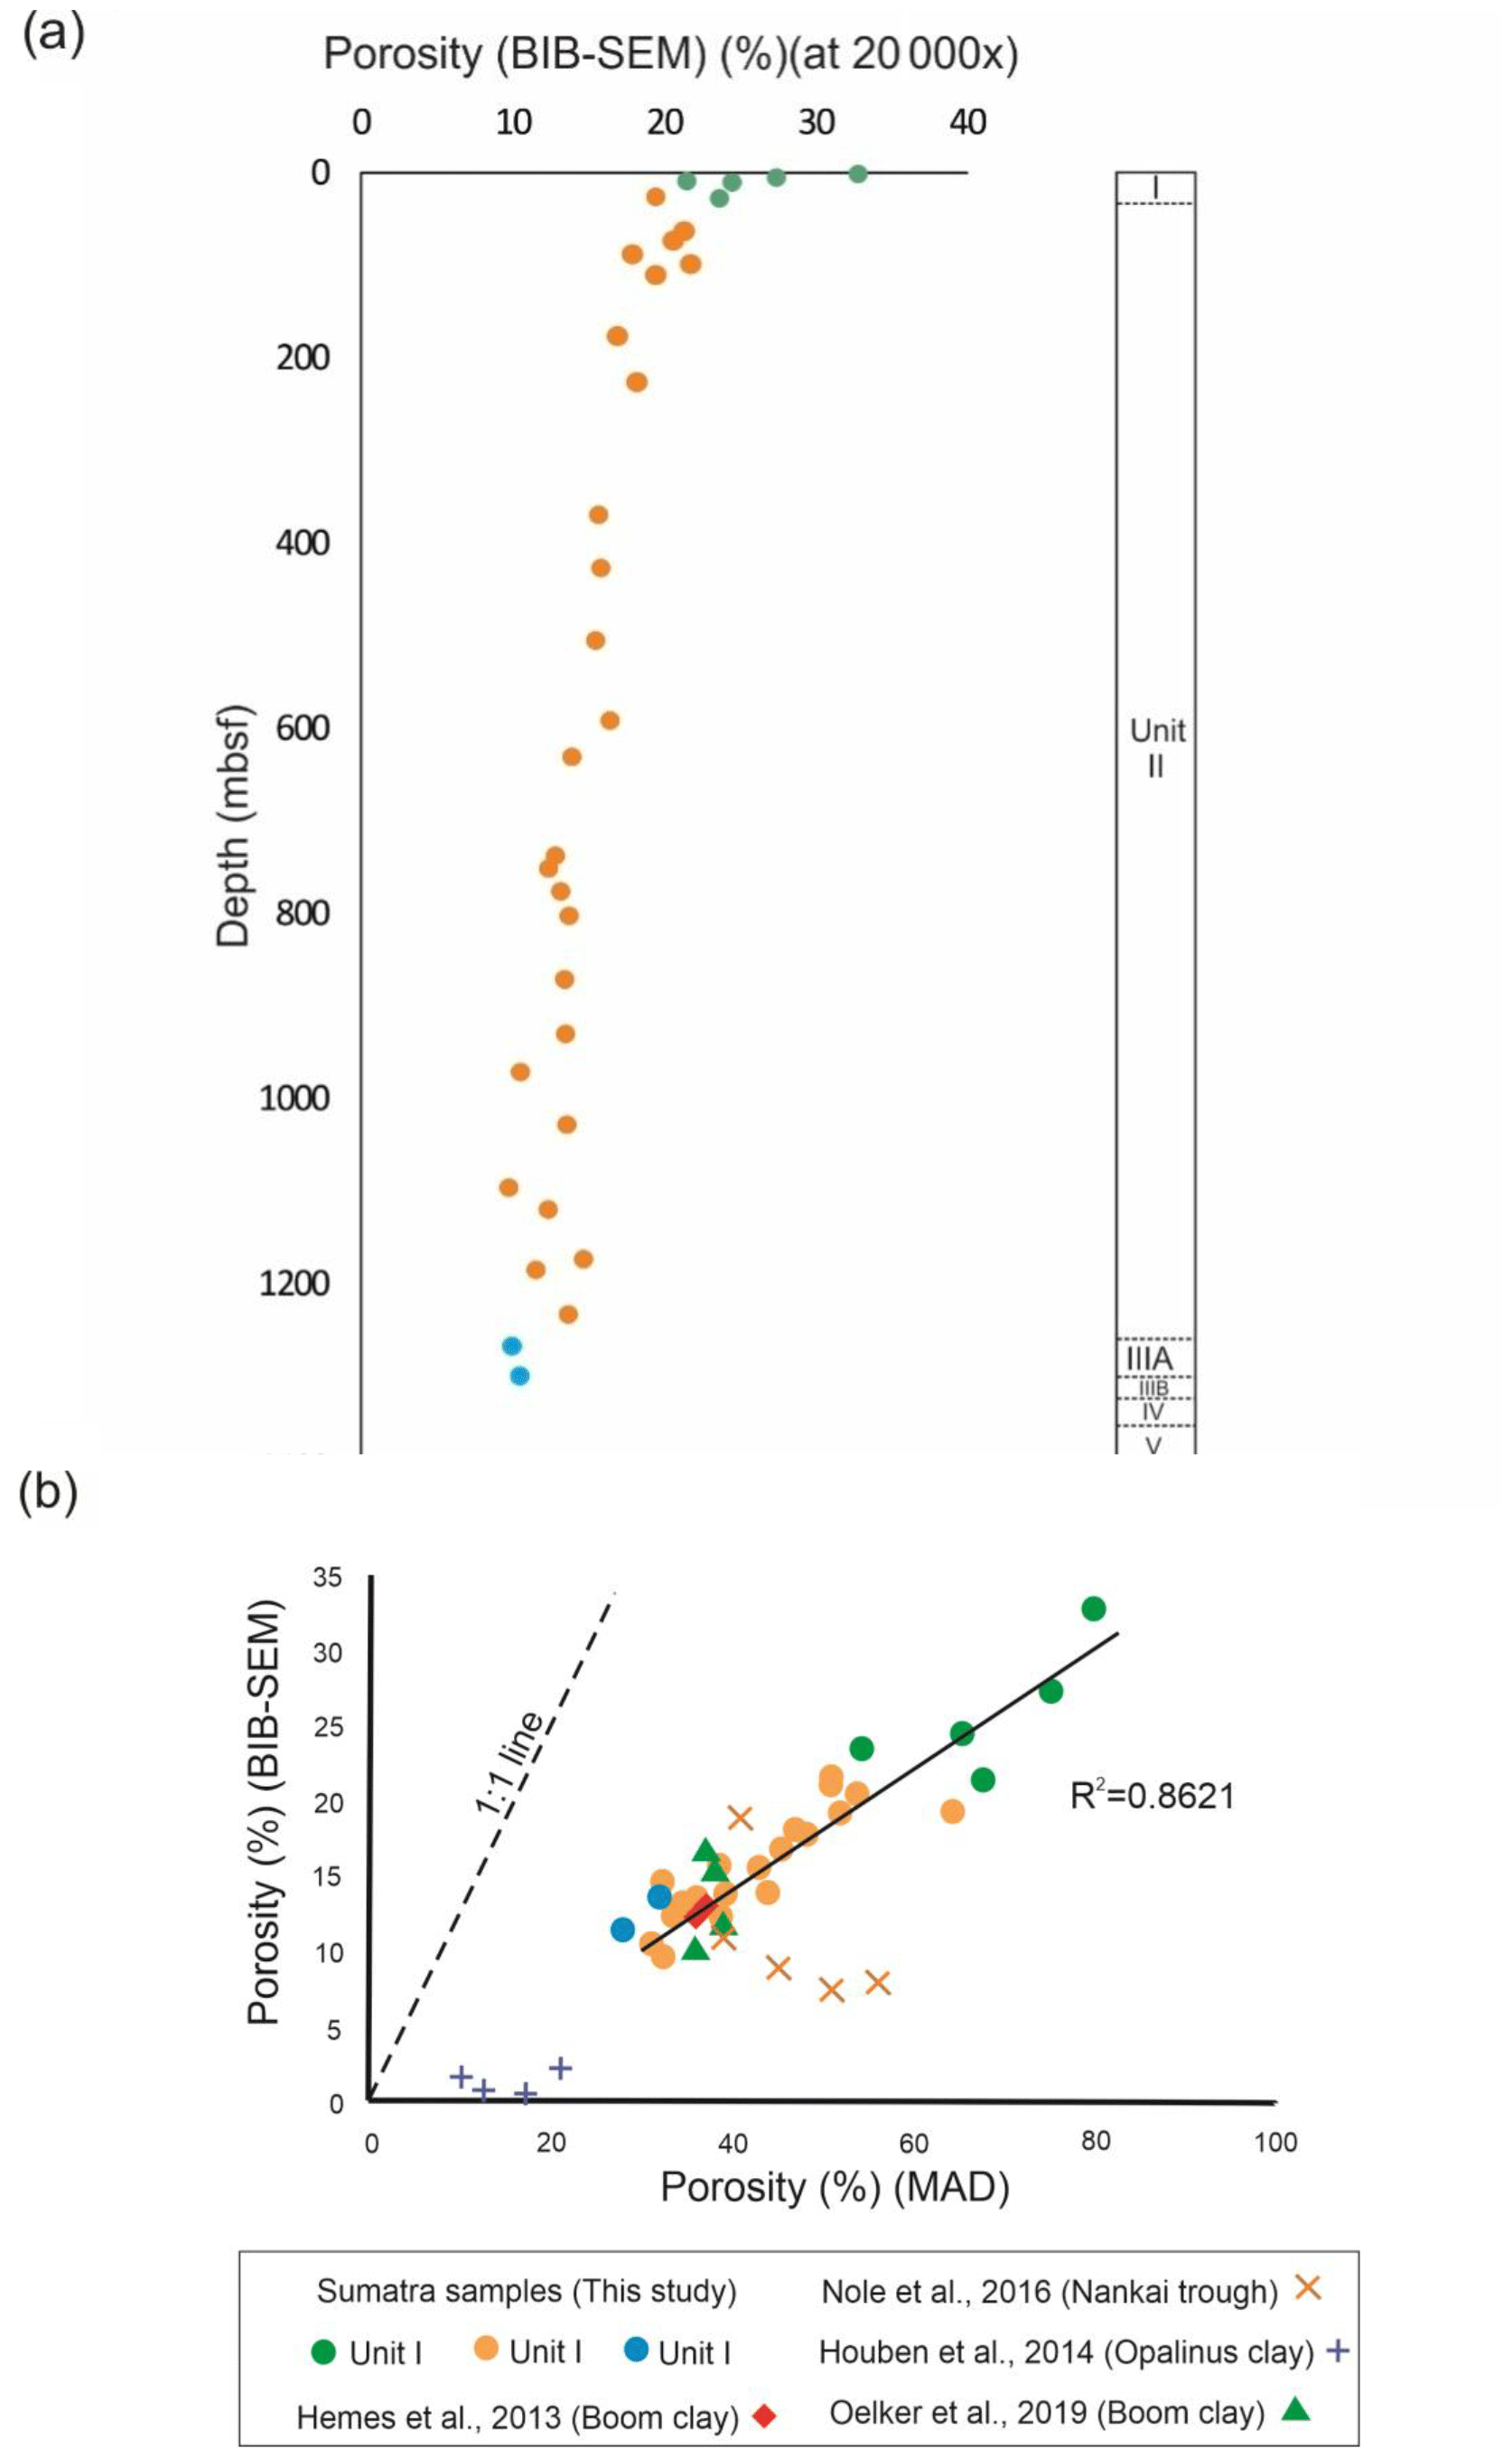
Figure 3Porosity data for Units I (green dots), II (orange dots), and IIIA (blue dots). (a) BIB–SEM porosity – depth plot; (b) BIB–SEM porosity vs. MAD porosity. Note the linear relationship that intersects the origin. Data reported by Hemes et al. (2013), Houben et al. (2014), and Oelker et al. (2019) follow a similar trend. However, data estimated from Nole et al. (2016) deviate from the trend.
3.2 Ion polishing and SEM technique (second set of samples; BEG, UT Austin)
A total of 22 samples (SN-34 to SN-55 in Table 1) were taken shipboard from the sample half of the still-wet core in small plastic tubes (similar to the ones used for the sample set at Aachen) inserted into the core by manual pressure. The tubes were removed from the core and sealed in plastic bags. In the laboratory at the BEG, sample bags were opened, and the muds were allowed to dry slowly in the tubes over several weeks. No discernible shrinkage was observed as the dried core pieces still fully filled the tubes. The tubes were carefully removed, and a small cube (approximately 0.5 to 1 cm3) was cut using a sharp knife and small handsaws; an orientation mark was placed on the cube to indicate the bedding direction. Bed-perpendicular surfaces were prepared by Ar-ion cross-section polishing using the Leica EM TIC020 triple ion beam miller and coated with Ir for imaging. Manual placement of the cut cubes into the ion mill is not precise, so the ion-polished surfaces have slight variation from perpendicular to bedding. Pore imaging was performed on the FEI Nova NanoSEM 430 using the in-lens SE detector, a 30 µm aperture, 15 KeV accelerating current, a working distance of around 5–6 mm, and an intermediate-range sample current (spot size 3 nm, mid-range for the instrument). Randomly selected views (typically 3–6) of all samples were collected at 6000× machine magnification; additional views illustrating pore types and pore–grain relationships were made at 10 000 to 30 000× (machine magnification).
4.1 Compaction strain derived from MAD porosity data
During Expedition 362, mass and volume of mud samples were measured on board in both wet and dry states using a high-precision electronic mass balance and helium pycnometer (http://www-odp.tamu.edu/publications/tnotes/tn37/tn37_8.htm, last access: 25 September 2020). Using the obtained mass and volume dataset for wet and dry conditions, bulk MAD (moisture and density) porosities were calculated. Porosity values reported by McNeill et al. (2017b) and downloaded from IODP databases serve as the basis for strain calculations.
Shipboard MAD porosity for mud samples exhibits a sharp reduction from 80 % to 52 % from the seafloor to 28 m b.s.f. (Fig. 2e). Deeper samples display a comparatively smaller reduction in porosity of approximately from 52 % to 30 % over a depth range of 28 to 1500 m b.s.f. (Fig. 2e and f).
We calculated compaction strain following a method proposed by Nollet et al. (2005) and subsequently used by Neagu et al. (2010) (Fig. 2g and h), assuming 1D consolidation and no change in solid volume. The compaction strain (εc) is then computed as
Here ϕ0 is initial porosity, and ϕ1 is final porosity. Samples from Sites U1480 and U1481 show no evidence of tectonic faults (McNeill et al., 2017a), supporting an assumption of 1D strain. We considered the initial porosity ϕ0 to be the MAD porosity at 0.6 m b.s.f. depth (ϕ0= 80 %). Compaction strain following Eq. (1) (Table S2) is plotted against depth in Fig. 2g and h. Compaction strain increases from 1 to 2.05 from the seafloor to 28 m b.s.f. (i.e., Unit I) and from 2.00 to 3.05 from 28 m b.s.f. to 1500 m b.s.f. (Fig. 2g and h).
Another common measure of compaction is the intergranular volume (IGV; Paxton et al., 2002), which corresponds to the sum of intergranular porosity and intergranular cement. In some mudstones, it may be necessary to calculate IGV differently because of the presence of abundant primary intragranular pores and pore-filling bitumen (Milliken and Olson, 2017). In our sample set, cement is absent, and IGV is taken to equal the bulk porosity from shipboard MAD measurements.
Compactional porosity loss (COPL), referenced against the original sediment volume, is calculated from the initial primary intergranular porosity (Pi; 80 % in this case) and the IGV as follows (Ehrenberg, 1989; Lundegard, 1992):
At an IGV of 50 %, COPL is 60 %; in the deepest samples in the Nicobar fan (IGV of around 30 %) COPL is 70 % (Table S2).
4.2 Description of grain microstructure and pore morphology
To have consistency in the dataset, we prepared SE2 mosaics for all samples from the Aachen sample set at 20 000× magnification covering an average 100 × 100 µm2 area. In addition, to examine the effect of magnification on BIB–SEM porosity and representative area analysis (REA), three samples (i.e., SN-7, SN-15, and SN-29) were also imaged at 5000 and 10 000× magnification. A decrease in magnification and resolution reduces visible BIB–SEM porosity.
We observed consistent results for the REA analysis. For SE2 mosaics, REA varies between 45 × 45 µm2 and 85 × 85 µm2 at 20 000× magnification, and for segmented phase maps, REA varies between 90 × 90 µm2 and 130 × 130 µm2 at 10 000× magnification. In the UT sample set, the standard images taken at 6000× with machine magnification are 49.7 × 45.7 µm2, so these images are also within the estimated REA range.
Based on EDX elemental map or point analysis, six mineral phases occur in significant amounts in the Sumatra samples: quartz, feldspar (K-feldspar, Na-feldspar), calcite, pyrite, micas (muscovite, biotite, and chlorite), and clay. Based on XRD analyses (Rosenberger et al., 2020), the clay size fraction is dominated by illite. Clay+mica percentage in these mudstone samples varies between 65 % and 75 %. Samples SN-1 (77 %) and SN-4 (76 %) have more clay+mica, whereas SN-7, SN-9, SN-17, SN-28, SN-29, and SN-31 contain less clay+mica (<65 %) (Table S2). It should be noted that, using EDX analysis, we are able to differentiate Na-feldspar and K-feldspar considering the concentration of Na and K elements in the grains. However, the XRD dataset provides only information about the overall percentage of plagioclase feldspar present in these samples (Table 1), which is perhaps an artifact of different detection limits for EDX and XRD analyses.
Using BIB–SEM and automatic pore segmentation techniques, an average of > 30 000 pores have been detected for each individual sample in the Aachen sample set at 20 000× magnification. Correlating with the MAD dataset, the estimated BIB–SEM porosity is reduced from 32 % to 19 % over a depth range of seafloor to 28 m b.s.f., while the deeper samples display a smaller reduction from 19 % to 10 % over a depth range of 28 to 1500 m b.s.f., respectively (Fig. 3a). Consistent with numerous previous studies, the results document a mismatch between bulk measured porosity (MAD) and imaging porosity (BIB–SEM) (e.g., Hemes et al., 2013; Houben et al., 2014; Nole et al., 2016; Oelker et al., 2019) (Table S2). We plotted BIB–SEM porosity vs. MAD porosity and found an approximately linear correlation with the coefficient of determination (R2= 0.8621) (Fig. 3b). It should also be noted that, although there is a correlation, there is a large difference in the porosity values, which increases with increasing porosity.
4.3 Type of pores
Intergranular pores contribute >99 % of the total visible porosity. Intragranular pores (see below) are rare. The size and shape of intergranular pores change during compaction (Table S3).
Intergranular pores are classified (Fig. 4) based on the size of surrounding particles (irrespective of mineralogy): (1) clay-domain (matrix) pores and (2) silt-adjacent pores. Based on the variation in size, clay-domain pores are divided further into (1) large clay-domain pores (pore size >5×10⁵ nm2) with the pore boundary defined by more than three clay particles and (2) small clay-domain pores (pore size <5×10⁵ nm2) that occur between two and three clay particles (see further details below). Large and small clay-domain pores are classified by geometry as (1) elongate pores (aspect ratio >3:1) and (2) equant-shaped pores (aspect ratio <3:1). Elongate pores consist of (1) linear-elongated pores and (2) crescent-shaped elongated pores. Examples of different clay-domain pore types are shown in Figs. 5, 6, and 7.
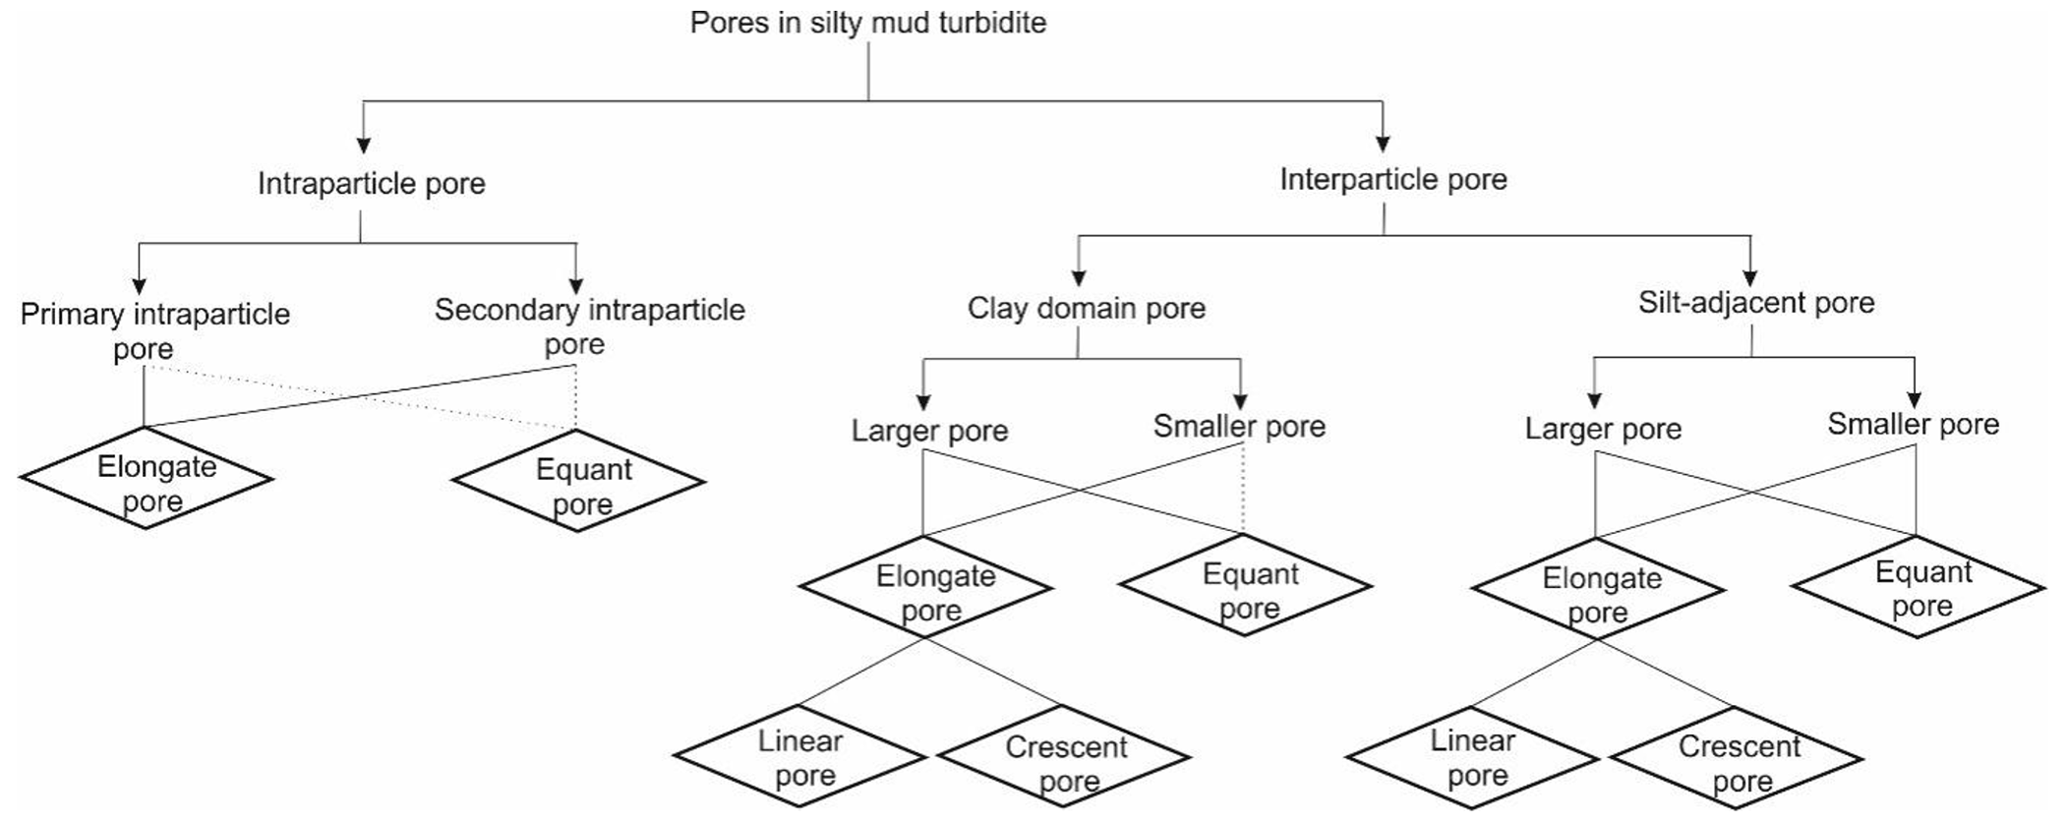
Figure 4Classification scheme adopted to demonstrate pore reduction mechanics with increasing compactional strain. Dashed lines indicate rare pore types.
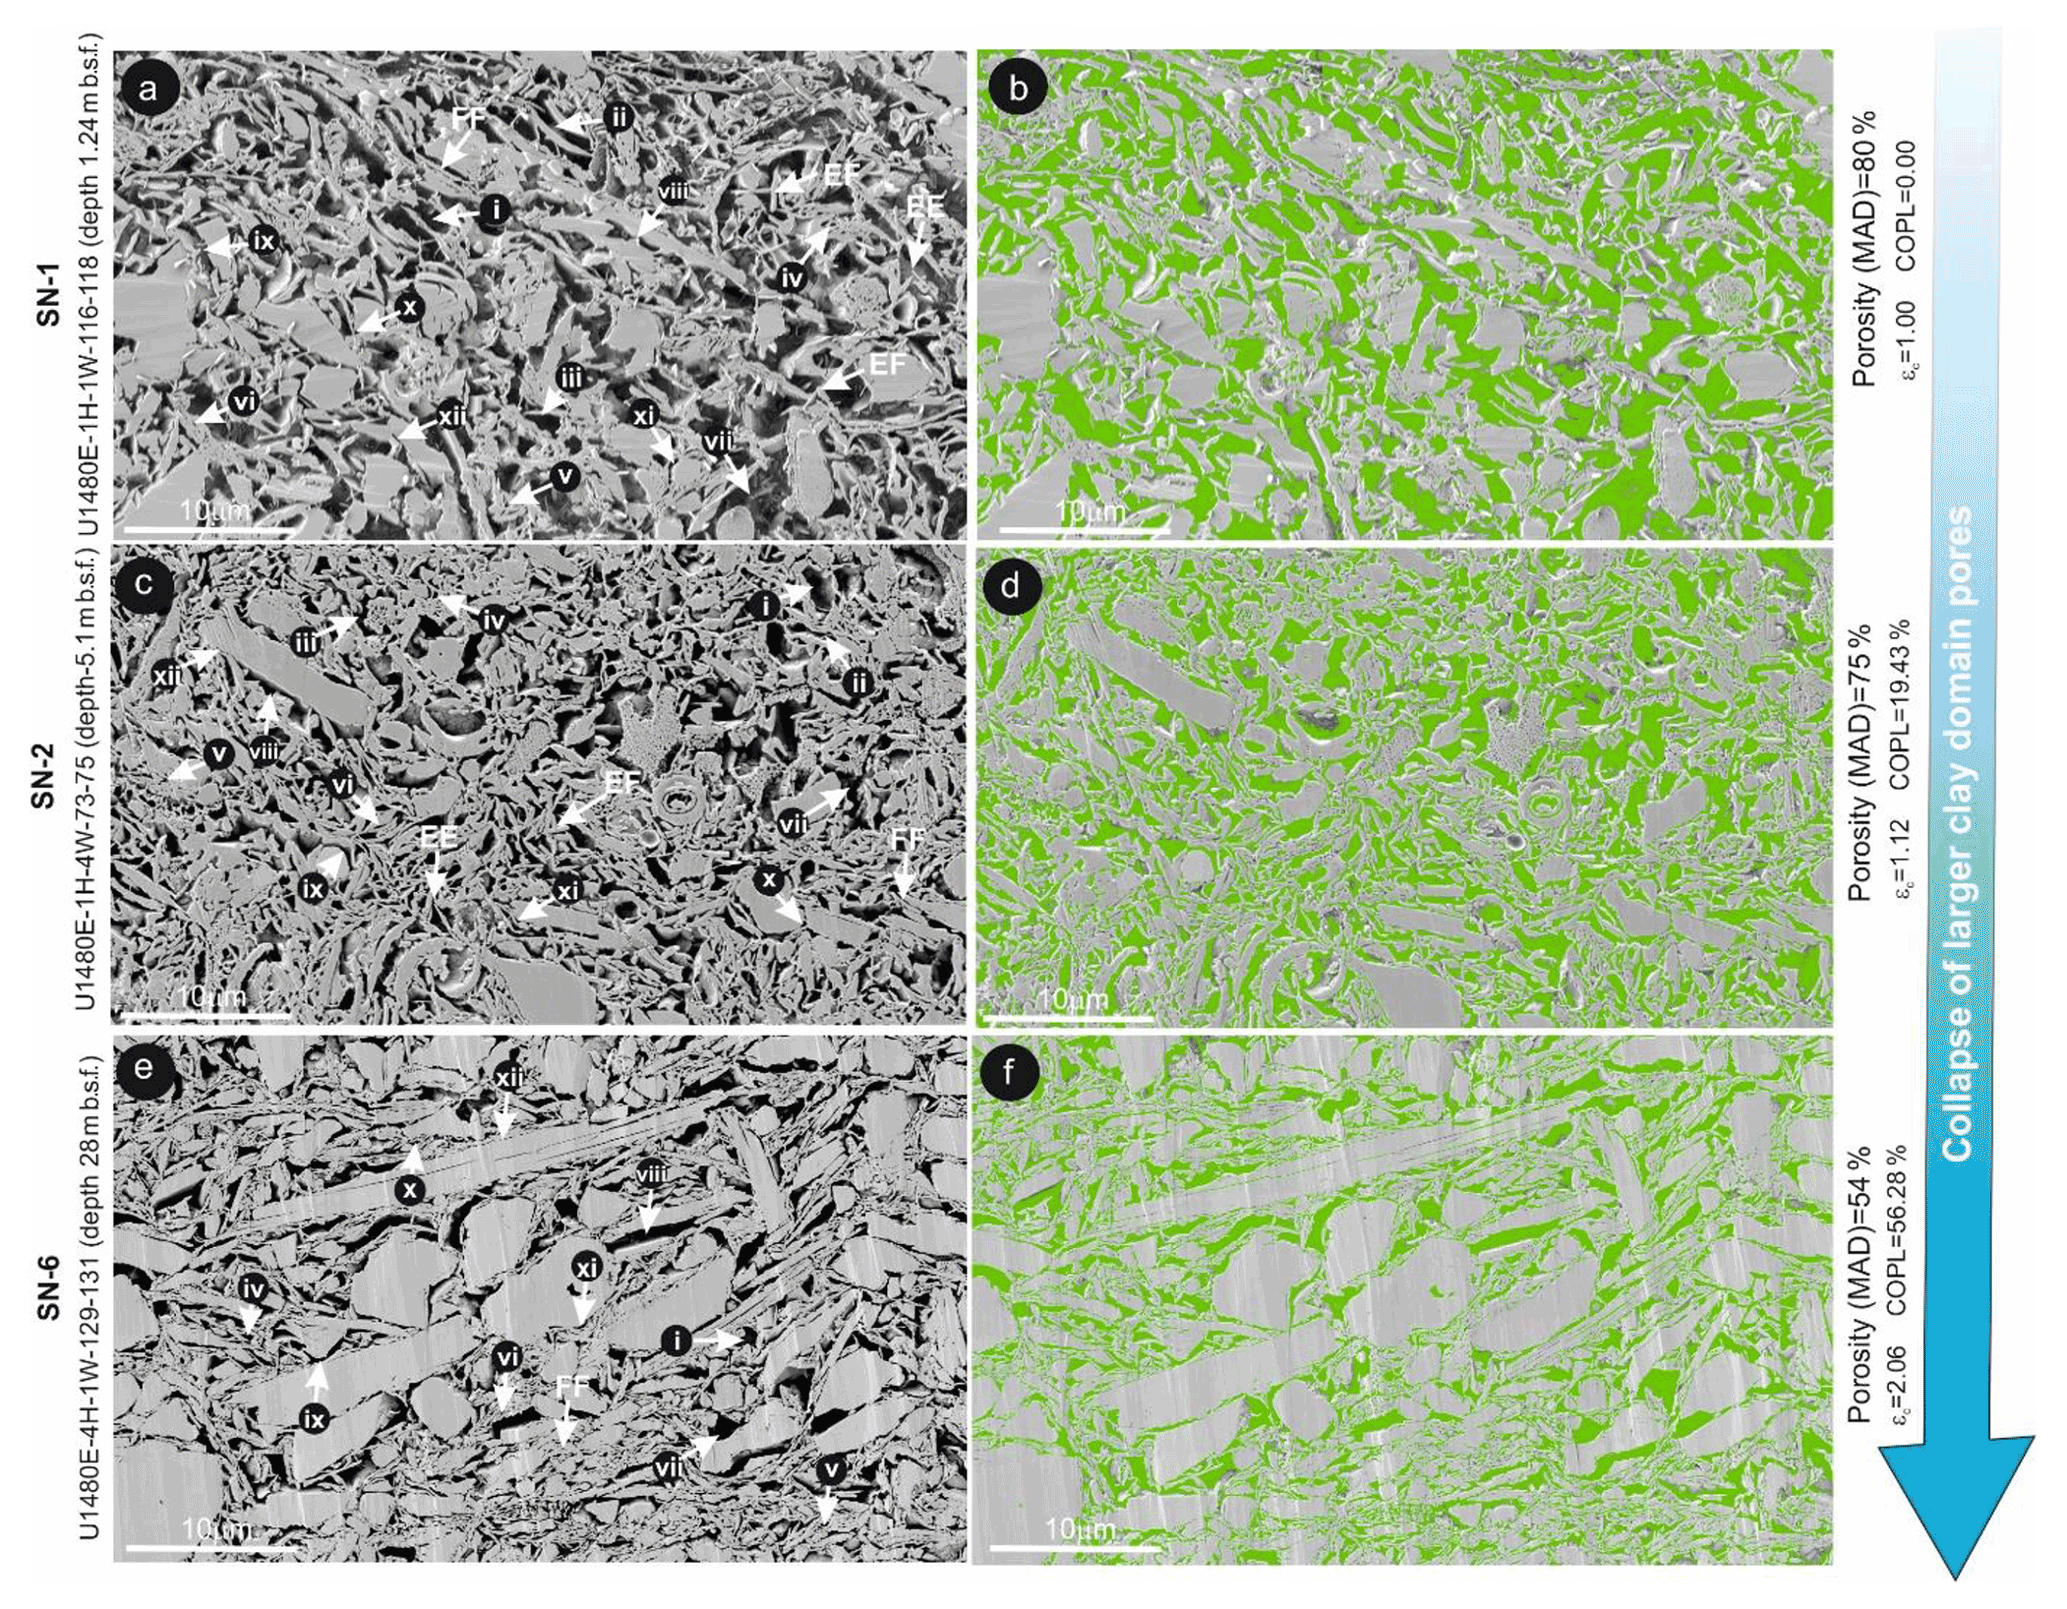
Figure 5Microstructural overview (BIB–SEM) of samples SN-1 (a and b), SN-2 (c and d), and SN-6 (e and f). Green represents segmented pores of the corresponding microstructure of the sample. (i) Equant large clay-domain pores, (ii) elongated large clay-domain pores, (iii) crescent-shaped large clay-domain pores, (iv) equant small clay-domain pores, (v) crescent-shaped small clay-domain pores, (vi) elongated small clay-domain pores, (vii) equant large silt-adjacent pores, (viii) elongated large silt-adjacent pores, (ix) crescent-shaped large silt-adjacent pores, (x) equant small silt-adjacent pores, (xi) crescent-shaped small silt-adjacent pores, (xii) elongated small silt-adjacent pores. EE: edge-to-edge contact, EF: edge-to-face contact, and FF: face-to-face contact.
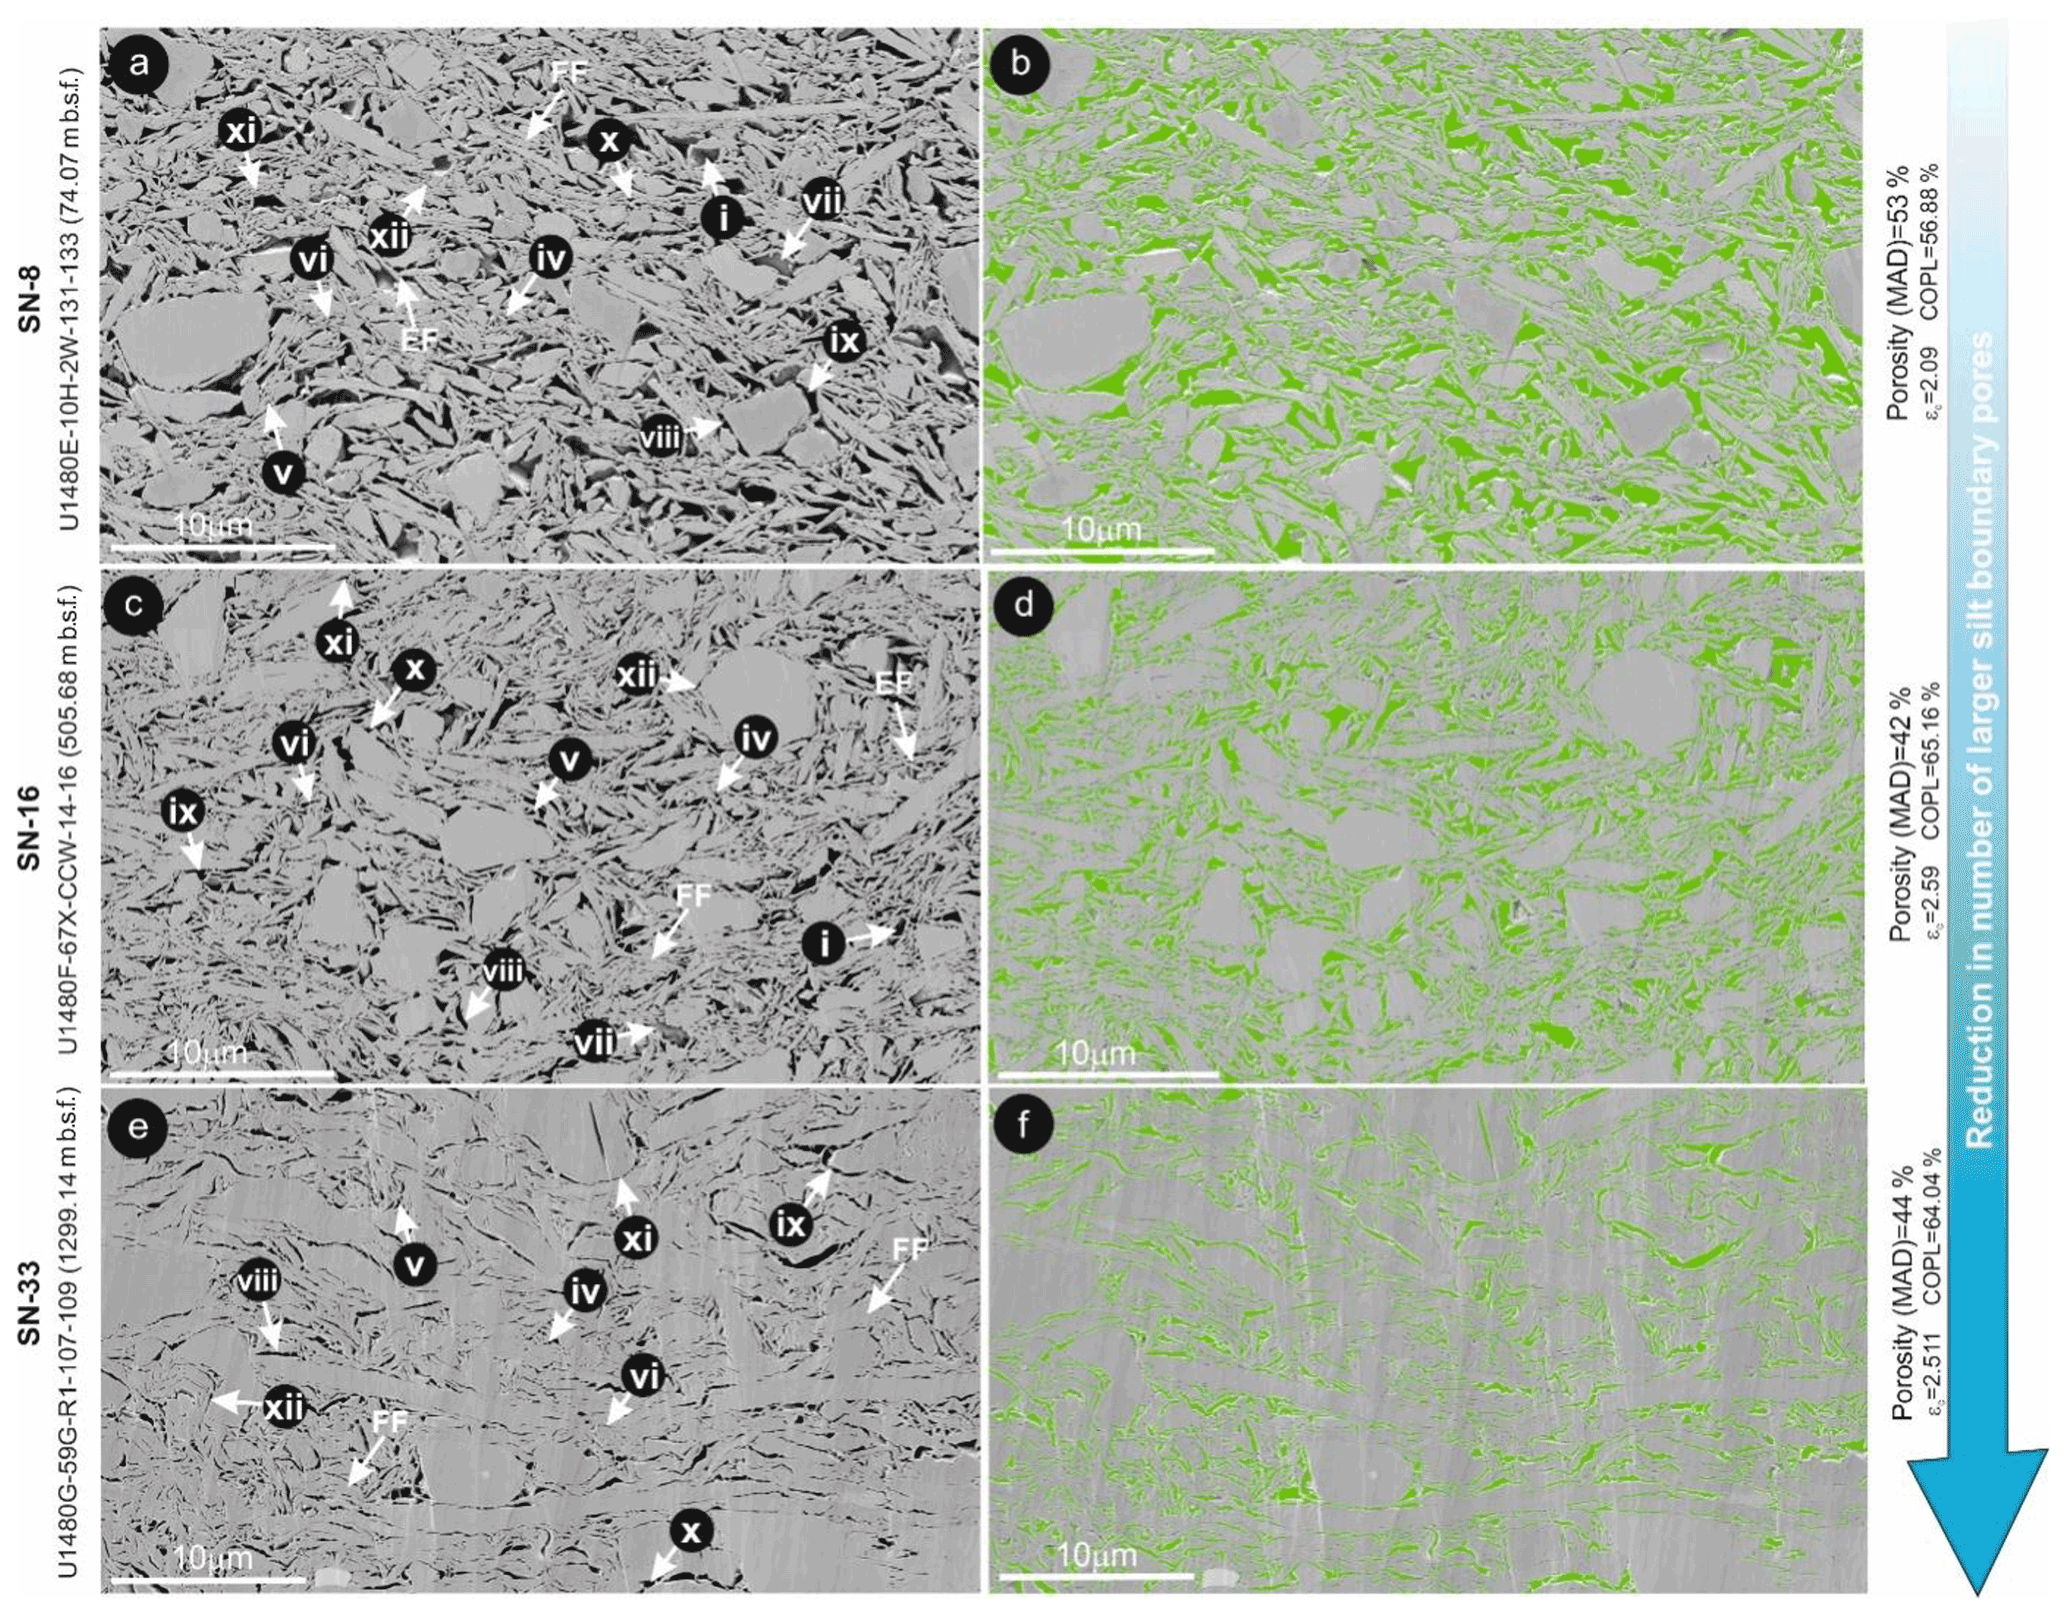
Figure 6Microstructural overview (BIB–SEM) of samples SN-8 (a and b), SN-16 (c and d), and SN-33 (e and f). Green represents segmented pores of the corresponding microstructure of the sample. (i) Equant large clay-domain pores, (ii) elongated large clay-domain pores, (iii) crescent-shaped large clay-domain pores, (iv) equant small clay-domain pores, (v) crescent-shaped small clay-domain pores, (vi) elongated small clay-domain pores, (vii) equant large silt-adjacent pores, (viii) elongated large silt-adjacent pores, (ix) crescent-shaped large silt-adjacent pores, (x) equant small silt-adjacent pores, (xi) crescent-shaped small silt-adjacent pores, (xii) elongated small silt-adjacent pores. FF: face-to-face contact, EF: edge-to-face contact.

Figure 7Microstructural overview (field-emission SEM) of samples SN-34, SN-49, and SN-55. (i) Equant large clay-domain pores, (ii) elongated large clay-domain pores, (iii) crescent-shaped large clay-domain pores, (iv) equant small clay-domain pores, (v) crescent-shaped small clay-domain pores, (vi) elongated small clay-domain pores, (vii) equant large silt-adjacent pores, (viii) elongated large silt-adjacent pores, (ix) crescent-shaped large silt-adjacent pores, (x) equant small silt-adjacent pores, (xi) crescent-shaped small silt-adjacent pores, (xii) elongated small silt-adjacent pores. FF: face-to-face contact, EF: edge-to-face contact.
Silt-adjacent pores are categorized by two types: (1) large silt-adjacent pores are >5×10⁵ nm2 with pore boundaries defined by more than three particles, and (2) small silt-adjacent pores include pore sizes <5×10⁵ nm2 with pore boundaries defined by two to three particles (see further detail on the modal sizes of these pore types below). Large and small silt-adjacent pores are either (1) equant-shaped (aspect ratio <3:1) or (2) elongated (aspect ratio >3:1). Further, elongated silt-adjacent pores consist of (1) linear-shaped elongated pores and (2) crescent-shaped elongated pores. These pore types are highlighted in Figs. 5, 6, and 7.
4.4 Change in inter-particle pore morphology with depth
4.4.1 Seafloor to 28 m b.s.f. (Unit I)
The shallow mud samples in Unit I are unconsolidated and porous (Fig. 5a). We analyzed a total of 10 samples (six samples at Aachen and four samples at UT Austin) from this depth range. Among them, two samples have been analyzed in both Aachen and Austin. Sample SN-1 (1.24 m b.s.f.) has a maximum MAD porosity of 80 %. We observe three types of clay particle contacts in the microstructure of SN-1: edge-to-edge (EE), edge-to-face (EF), and face-to-face (FF) contacts (Table S4). Among them, EF and FF contacts are abundant, and EE contacts are rare. The sample exhibits abundant large clay-domain pores and large silt-adjacent pores that are equant with smooth edges and a rounded pore perimeter. The sample also contains abundant linear-elongated and equant-shaped small clay-domain pores. Crescent-shaped small clay-domain pores are rare in the microstructure of this sample. Equant-shaped, small silt-adjacent pores are abundant. In addition, linear-elongated and crescent-shaped, small, silt-adjacent pores are also common (Fig. 5a; Table S3).
With increasing compaction strain (εc=1.119) and depth (5.1 m b.s.f.; Fig. S7), porosity (MAD) is reduced to 75 % and corresponding COPL is 19 % (sample SN-2; Fig. 5b, Table S2). The microstructures of SN-2 display characteristics similar to those observed in sample SN-1, although there are fewer large clay-domain pores in SN-2 than SN-1. Linear-elongated and equant-shaped small clay-domain pores are common (Table S3), but crescent-shaped small clay-domain pores are rare. The microstructures of SN-2 exhibit abundant equant-shaped large and small silt-adjacent pores.
With an increase in compaction strain to εc∼ 2.00 (28 m b.s.f.), the sample microstructure is dominated by FF contacts (Fig. 5e), and EE and EF contacts are rare (Table S4). Additionally, large clay-domain pores become infrequent in the microstructure (Figs. 5e and 8). Crescent-shaped, small clay-domain pores in the microstructure are rare, whereas equant-shaped small clay-domain pores are common. Both small and large silt-adjacent pores exhibit equant shapes (Figs. 5e and 8d, e, f). The sample analyzed at the base of Unit I (SN-6; 28 m b.s.f.) contains rare large clay-domain pores and abundant FF contacts (Fig. 5c; MAD porosity 54 % and COPL 55 %).
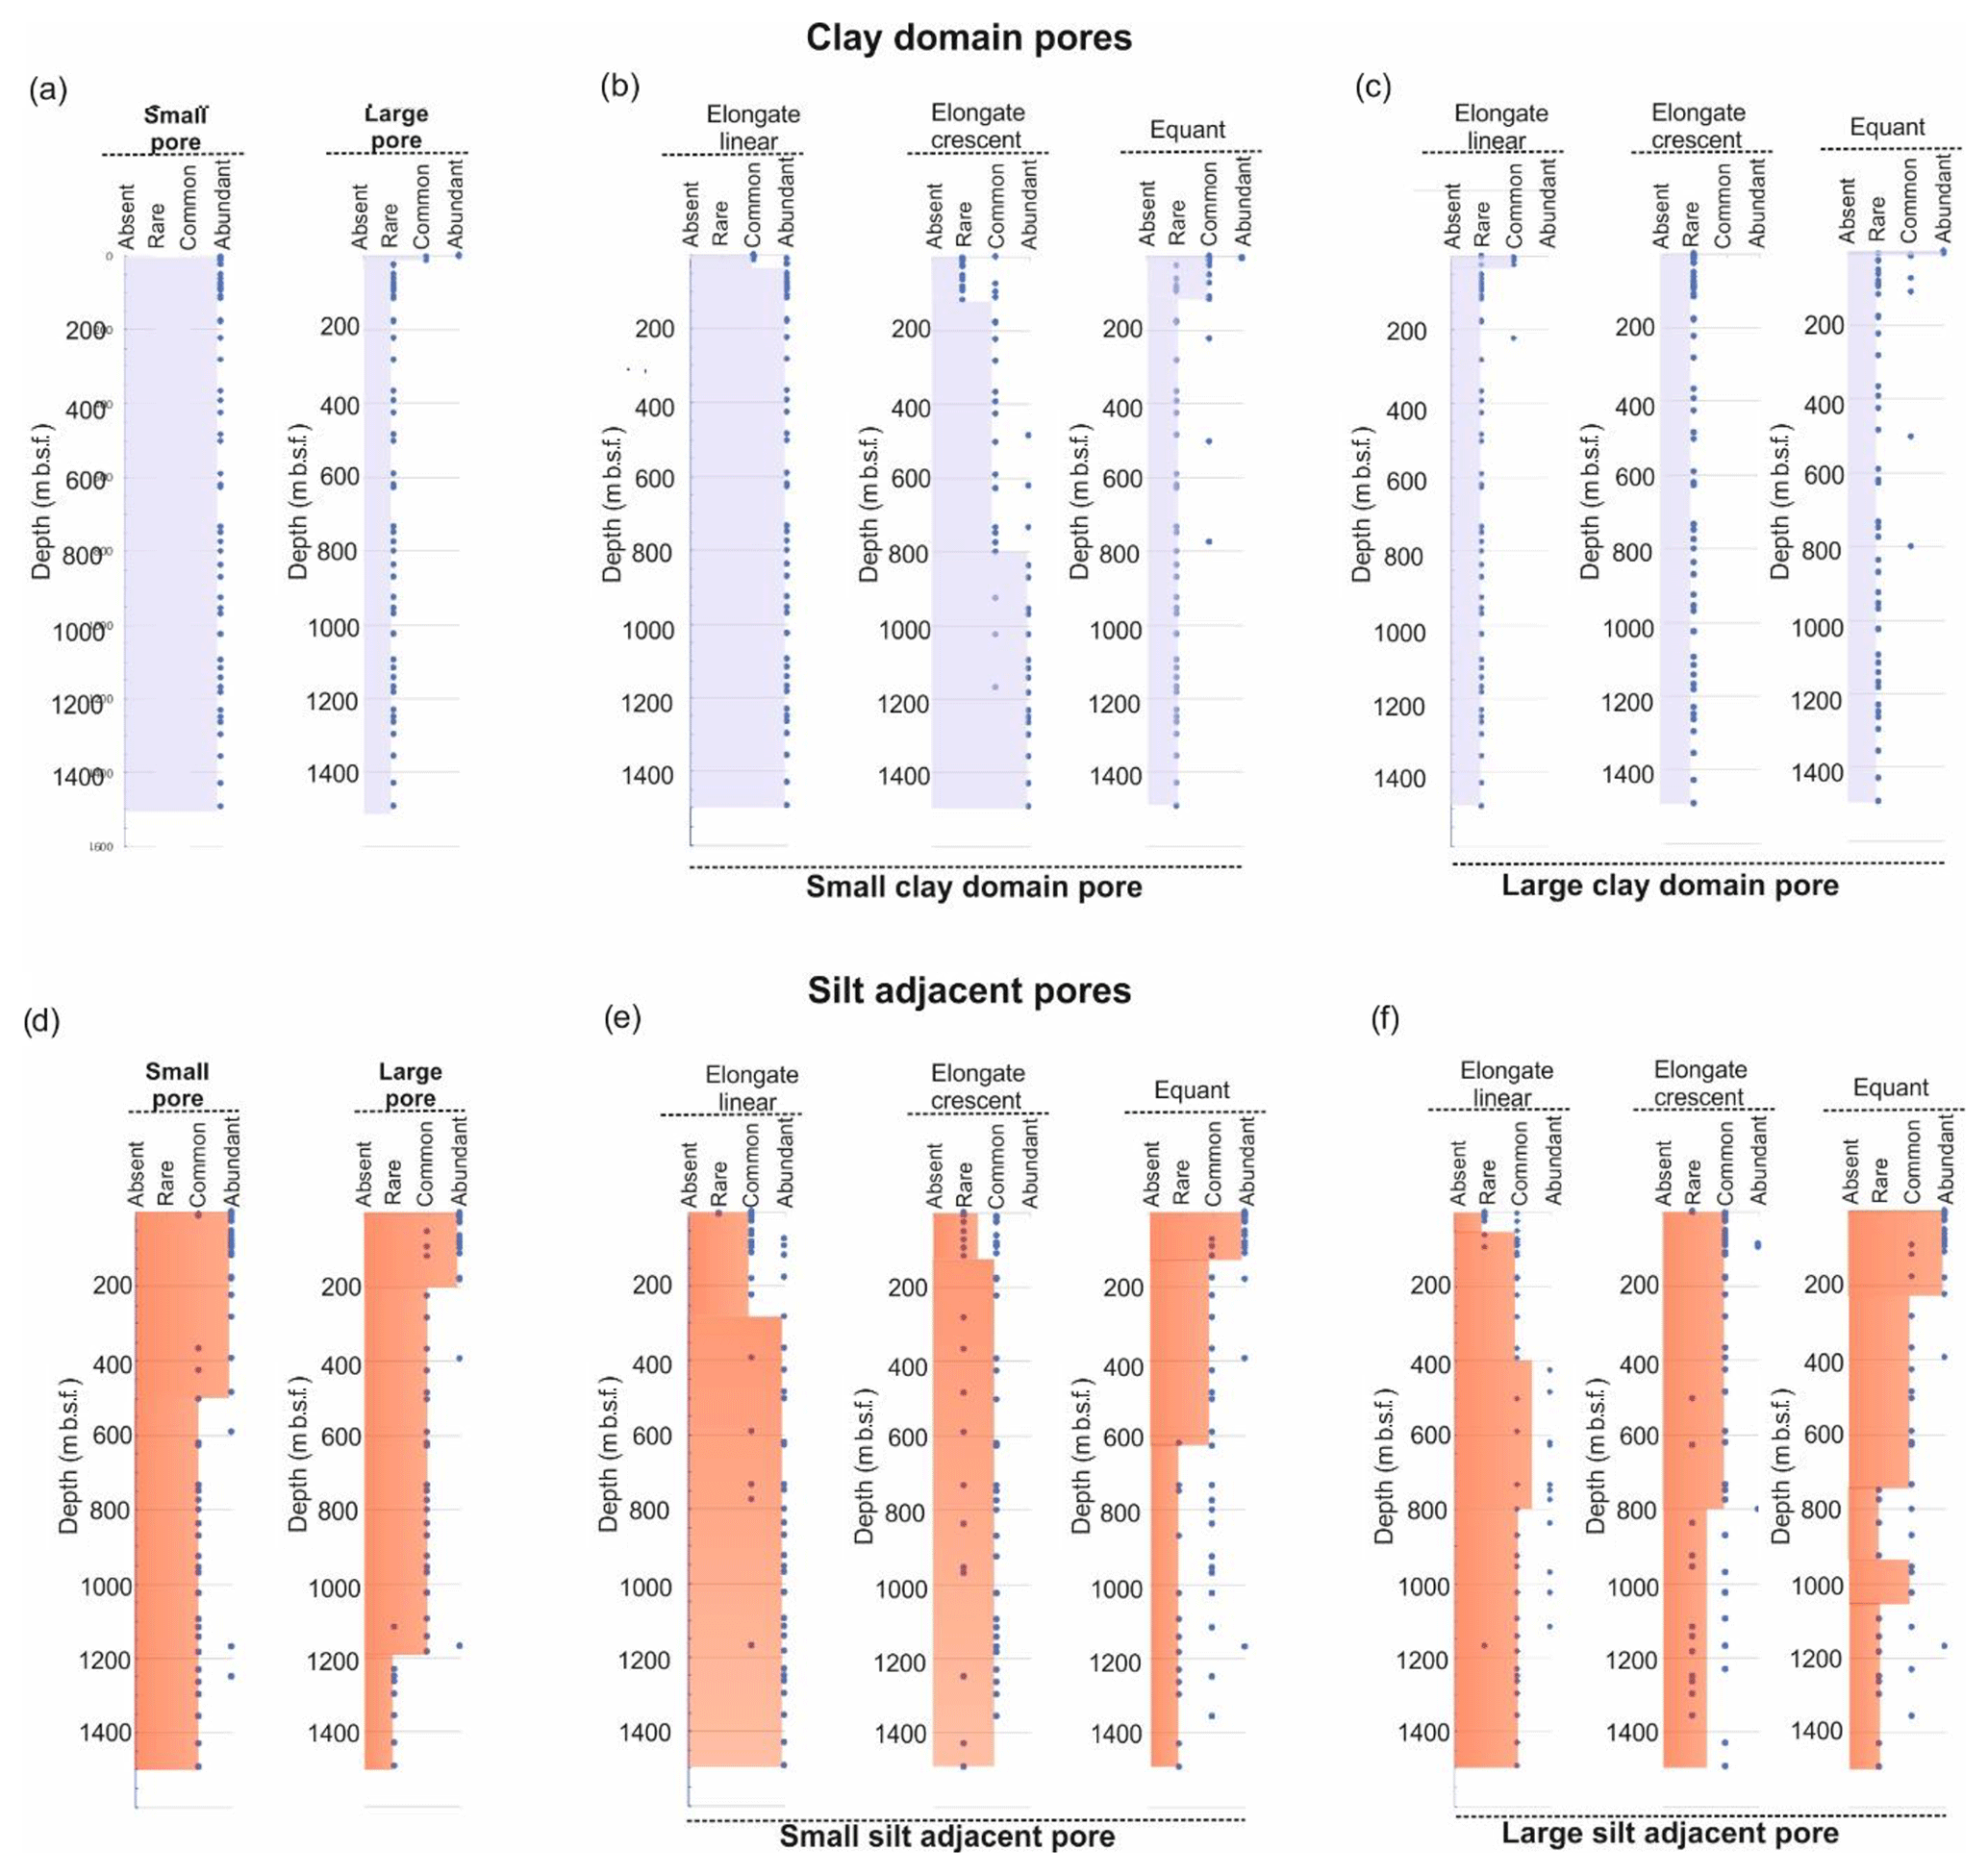
Figure 8Pore type summary for clay-domain (a–c) and silt-adjacent (d–f) pore types. (a) Abundance of small and large clay-domain pores. (b–c) Depth progression of small and large clay-domain pore morphologies. (d) Abundance of small and large silt-adjacent pores. (e–f) Depth progression of small and large clay-domain pore morphologies. Abundant: >25 % pores, common: 2 %–25 % pores, rare: 0 %–2 % pores, absent: not observed.
4.4.2 28 to 1500 m b.s.f. (Units II and III)
Mud samples from the Nicobar Fan section are more compacted than shallower samples (Figs. 6, 7 and S8). We analyzed a total of 29 samples at Aachen and 18 samples at UT Austin from this section. An increase in compactional strain from 2.00 to 3.15 over a depth range of 28 to 1500 m b.s.f. causes a porosity reduction (MAD) of 54 % to 28 %, and the corresponding change in average COPL is 55 % to 72 %. The microstructure of these samples is dominated by FF contacts among clay particles; EF and EE contacts are rare (Table S4; Figs. 6 and 7b, c). All samples exhibit abundant small linear-elongated clay-domain pores between two parallel clay sheets (Fig. 8b). Equant-shaped, small clay-domain pores are rarely observed below 150 m b.s.f. depth (εc>2.4). Crescent-shaped, small, clay-domain pores are rare at shallow depth but become abundant with an increase in compactional strain εc>2.95 (871.87 m b.s.f.) as the surrounding clay particles are bent (Fig. 6). In addition, large clay-domain pores in these samples are rarely observed in the vicinity of silt clasts (Fig. 6).
Below 100 m b.s.f. (εc=2.20), silt-adjacent small pores are dominantly equant-shaped, but below 300 m b.s.f. (εc>2.5) silt-adjacent small pores are dominantly linear-elongated (Fig. 8e). Crescent-shaped, small, silt-adjacent pores are common in all samples. Large silt-adjacent pores are dominantly equant above 200 m b.s.f. depth (εc<2.40) and commonly linear-elongate below 400 m b.s.f. depth (εc>2.5) (Fig. 8f). It appears that due to an increase in compactional strain, the shape of the silt-adjacent pores changes from equant to linear-elongated (Table S3). In samples with more silt, equant-shaped small and large, silt-adjacent pores can persist at greater depths (Fig. 8e and f).
Below 28 m b.s.f. (εc>2.0), the number of large silt-adjacent pores in the microstructures decreases. Comparing samples SN-8 (74.07 m b.s.f. and εc=2.09) and SN-33 (1299.14 m b.s.f. and εc=2.51) illustrates how the number of large, silt-adjacent pores decreases with depth (Fig. 6a, and c) when the clay fraction (Table S2) is comparable. This relationship is apparent even in samples separated by a smaller depth difference (SN-49 from 959.14 m b.s.f. and SN-55 from 1433.36 m b.s.f.; Fig. 7b and c). While the number of large pores diminishes, the maximum size of the large silt-adjacent pores remains constant (107 nm2; Fig. S9).
It can be observed in Fig. 2e that around 1300 m b.s.f. depth MAD porosity for the sample sets again rapidly increases. However, microstructural observations of the sample from this horizon do not exhibit an increase in porosity (Fig. 6c). Hence, the increase in MAD porosity in this horizon is attributed to the increase in smectite content (Fig. 2a) (Dutilleul et al., 2022). In general, the moisture and density method (MAD) overestimates the measured porosity of the smectite-rich sediment because of the inclusion of the interlayer water from smectite during measurement (Brown and Ransom, 1996; Dutilleul et al., 2020).
4.5 Variation in the orientation of pores and grains due to compactional strain
We examined the change in orientation of the long axis of pores with increasing compaction strain. For all segmented pores, the angle between the long axis and the bedding plane was determined and plotted in rose diagrams (Fig. S10). Samples from the seafloor to 28 m b.s.f. exhibit a weak preferred orientation of the long axis of pores with maxima oriented obliquely to the bedding planes. However, below 28 m b.s.f. the samples have a preferred orientation of the long axis of pores aligned subparallel to the bedding plane. Further, due to an increase in vertical effective stress down-section below 28 m b.s.f. in Units II and III, the degree of preferred alignment of the long axis of pores only increases by a small amount (Fig. S10).
We determined the angle between the long axis of individual silt grains and the bedding plane for all samples and plotted the angle in a rose diagram (Fig. S10). For quartz, feldspar, and calcite the degree of preferred orientation of the long axis of grains changes little with depth. However, the rose diagrams obtained for mica show weak maxima parallel to the bedding plane and several submaxima oriented obliquely to the bedding plane above 28 m b.s.f. Preferred alignment of the long axis of mica grains increases at 28 m b.s.f. with a strong maximum oriented parallel to the bedding plane. Below 28 m b.s.f., the further increase in the degree of preferred alignment is small.
4.6 Size distribution of pores
Pore size distributions (Fig. 9) of shallow samples (Unit I) are trimodal. Sample SN-1 has peaks between 105 and 106 nm2, 106 and 107 nm2, and 107 and 108 nm2, and SN-2 has peaks from 104 to 105 nm2, 105 to 106 nm2, and 106 to 107 nm2. These three pore size regimes correspond to the small clay-domain and silt-adjacent pores, large clay-domain pores, and large silt-adjacent pores. Samples of Units II and III exhibit bimodal pore size distributions (SN-10, SN-26, and SN-33 in Fig. 9). SN-10 has a peak between 105 and 106 nm2, corresponding to small clay-domain and silt-adjacent pores, and between 106 and 107 nm2, reflecting large silt-adjacent pores. Large clay-domain pores are absent from samples below 28 m b.s.f. depth (Units II and III) based on the pore size distributions combined with image analysis. At shallow depths, the contribution to total porosity by larger silt-adjacent pores is greater compared to the contribution by small clay-domain pores (Fig. 9e and g). The contribution of large, silt-adjacent pores to total porosity diminishes with depth. Hence, at greater depth, the contribution to total porosity by larger silt-adjacent pores is lower compared to small clay-domain pores (Fig. 9i).
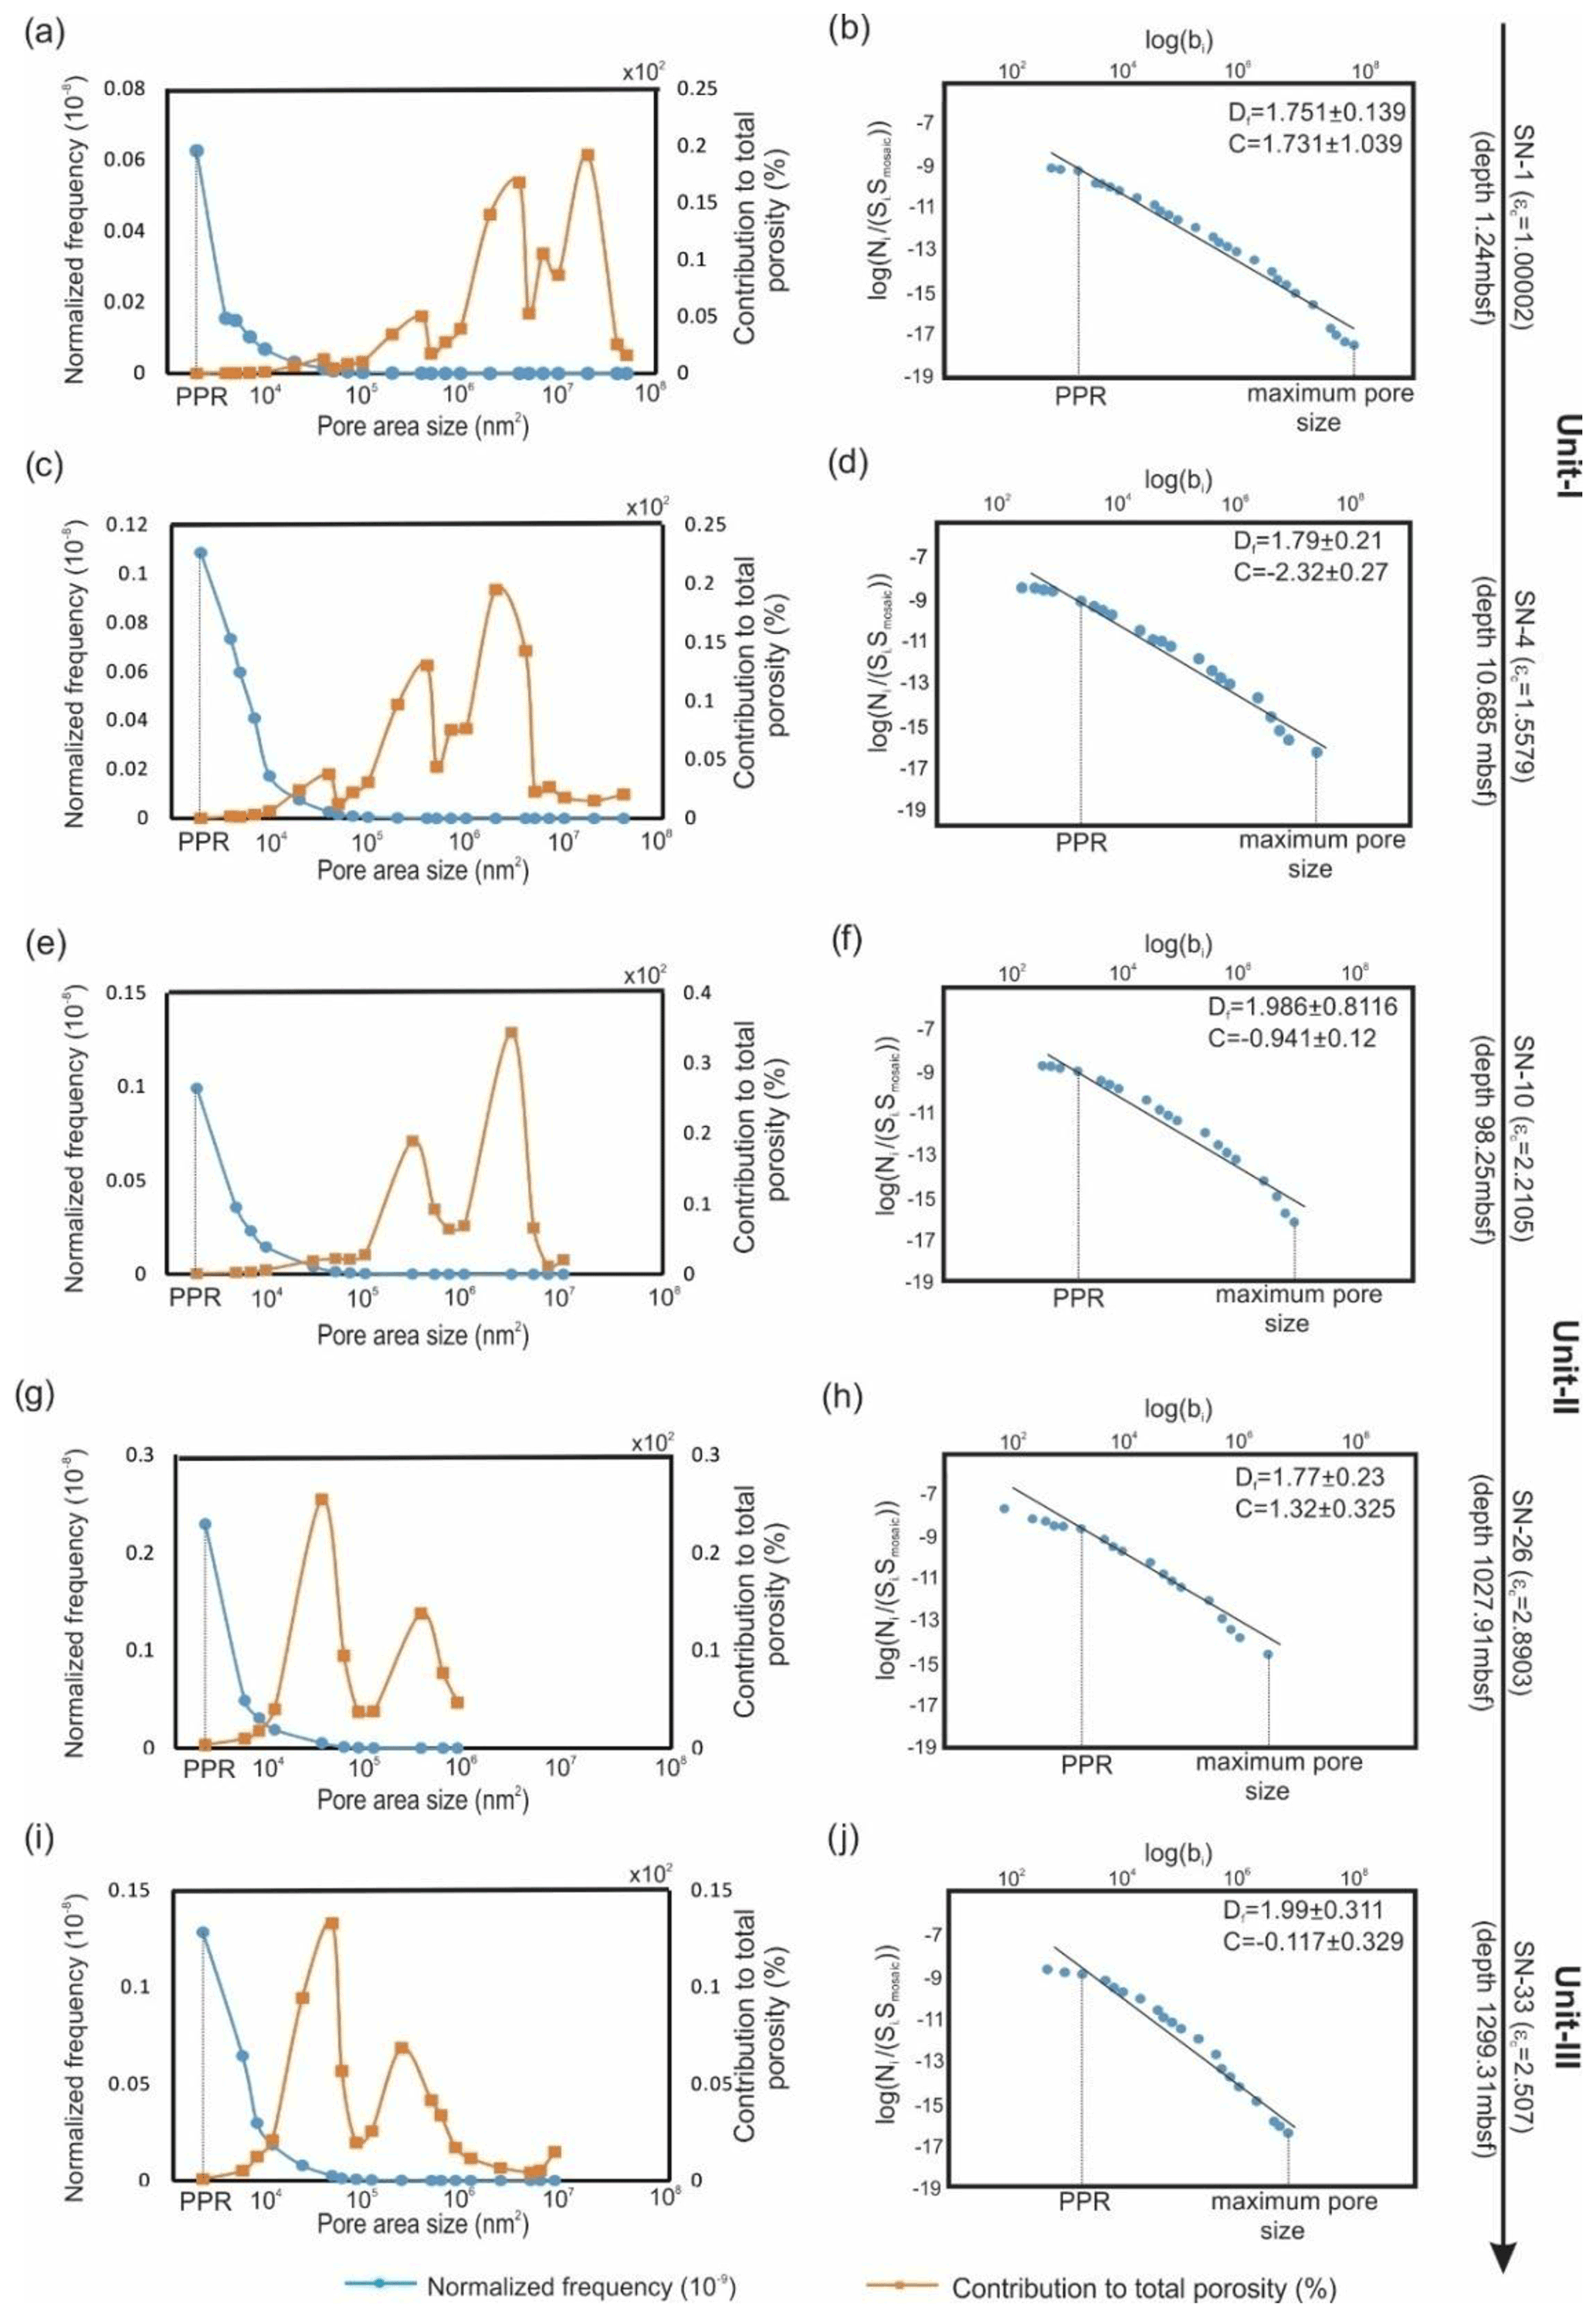
Figure 9Pore size distribution defined by pore area. Left column: normalized frequency (blue) and contribution to total porosity (orange). Right column: pore size–frequency log–log distribution. The power law between PPR and maximum pore size is interpreted as a black line with corresponding regression parameters. Sample number, depth, and compactional strain are defined along the right side of the diagram.
Pore size distributions follow a power law shown on a double logarithmic graph following the equations (Klaver et al., 2012, 2015, 2016, Hemes et al., 2013, 2015, 2016; Laurich et al., 2014)
where Ni is the number of pores with area Spore, bi is bin size, Smosaic is the surface area of the current mosaic, C is constant, and D is the power-law exponent. The resulting power-law exponent (D) varies between 1.70 and 2.00 (Table S2).
4.7 Effect of texture on porosity, pore morphology, and orientation of pores
We analyzed six samples (SN-7, SN-9, SN-17, SN-28, SN-29, and SN-31) that are enriched in silt content compared to the rest of the mud samples (Table S2). Silt content has a positive correlation with the total SEM porosity. For example, sample SN-29 (1172.88 m b.s.f.) exhibits a BIB–SEM porosity of 14 %, whereas other samples from a similar depth with less silt exhibit an average BIB–SEM porosity of 12 % (Table S2) at 20 000× magnification. The samples with greater silt content are also enriched in equant-shaped silt-adjacent larger pores (Fig. 10a). We also estimated the orientation of the long axis of pores for these three samples and plotted the obtained results as rose diagrams (Fig. 10b). The obtained results exhibit a relatively weak preferred alignment of the long axis of pores with respect to the bedding planes (Fig. 10b).
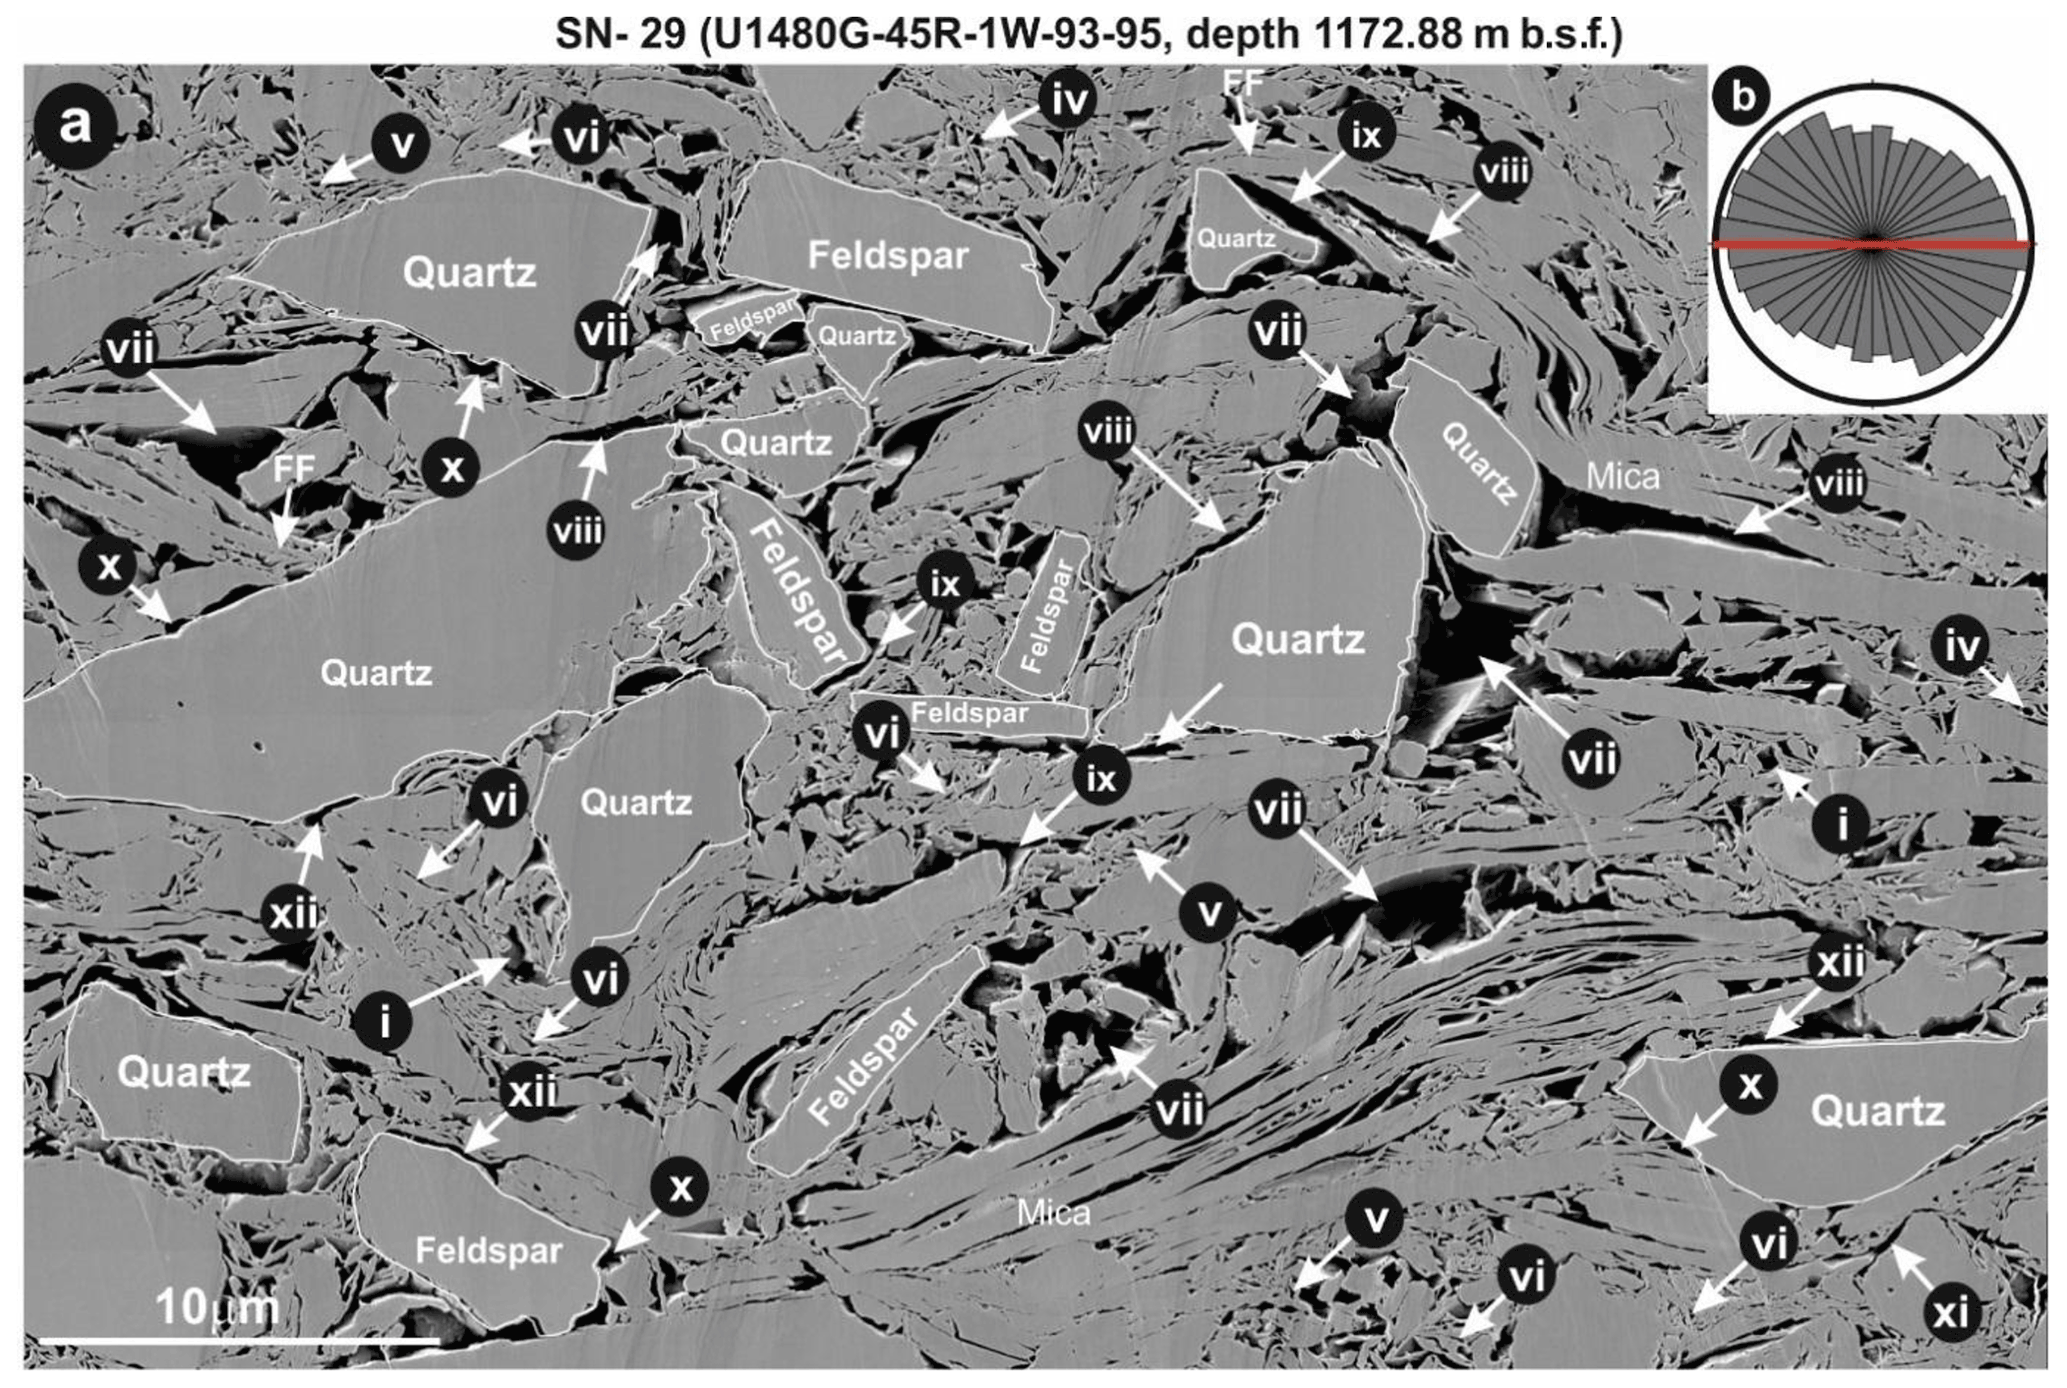
Figure 10Silt-rich sample (SN-29; 1173 m b.s.f.). In panel (a), the following are indicated. (i) Equant large clay-domain pores, (ii) elongated large clay-domain pores, (iii) crescent-shaped large clay-domain pores, (iv) equant small clay-domain pores, (v) crescent-shaped small clay-domain pores, (vi) elongated small clay-domain pores, (vii) equant large silt-adjacent pores, (viii) elongated large silt-adjacent pores, (ix) crescent-shaped large silt-adjacent pores, (x) equant small silt-adjacent pores, (xi) crescent-shaped small silt-adjacent pores, (xii) elongated small silt-adjacent pores. (b) Rose diagram of long axes of pores (bedding: red line). FF: face-to-face contact of clay particles.
5.1 Effective stress vs. porosity: comparison with an experimental study
To understand the consolidation mechanisms of the Sumatra sediments, we estimated vertical effective stress following the steps proposed by Hüpers et al. (2015). Following Terzaghi and Peck (1948), vertical effective stress () is expressed as
Here, σv is the total vertical stress caused by the overburden load, and Pf is fluid pressure. To compute vertical effective stress of a layered sediment, we use Eq. (6):
where ρs is the bulk density of the sediment, ρw is the density of the pore water, Δz is the depth interval, and g is gravitational acceleration. Although small offset strike-slip faults are evident at the seafloor and in seismic reflection profiles (McNeill et al., 2017a), the amount of strain attributed to these fault offsets supports the idea that the maximum horizontal stress is comparable to the vertical stress; there is no evidence in seismic reflection data or from core microstructures for thrust or reverse faults associated with a vertical least principal stress. On this basis, we assume that vertical stress is the maximum principal stress and that pore pressure is hydrostatic. Bulk density of the sediment ρs was acquired from the MAD dataset obtained from the IODP website (McNeill et al., 2017a), and ρw was considered to be the density of seawater, i.e., 1025 kg m−3 (Hüpers et al., 2015).
We plotted vertical effective stress against MAD porosity for 55 mud samples (Fig. 11). Fawad et al. (2010) experimentally studied the consolidation behavior of mud with varied proportions of silt and clay. While Sumatra samples follow trends like those defined by Fawad et al. (2010), the experimental samples are more compacted than natural Sumatra samples for the same silt content.
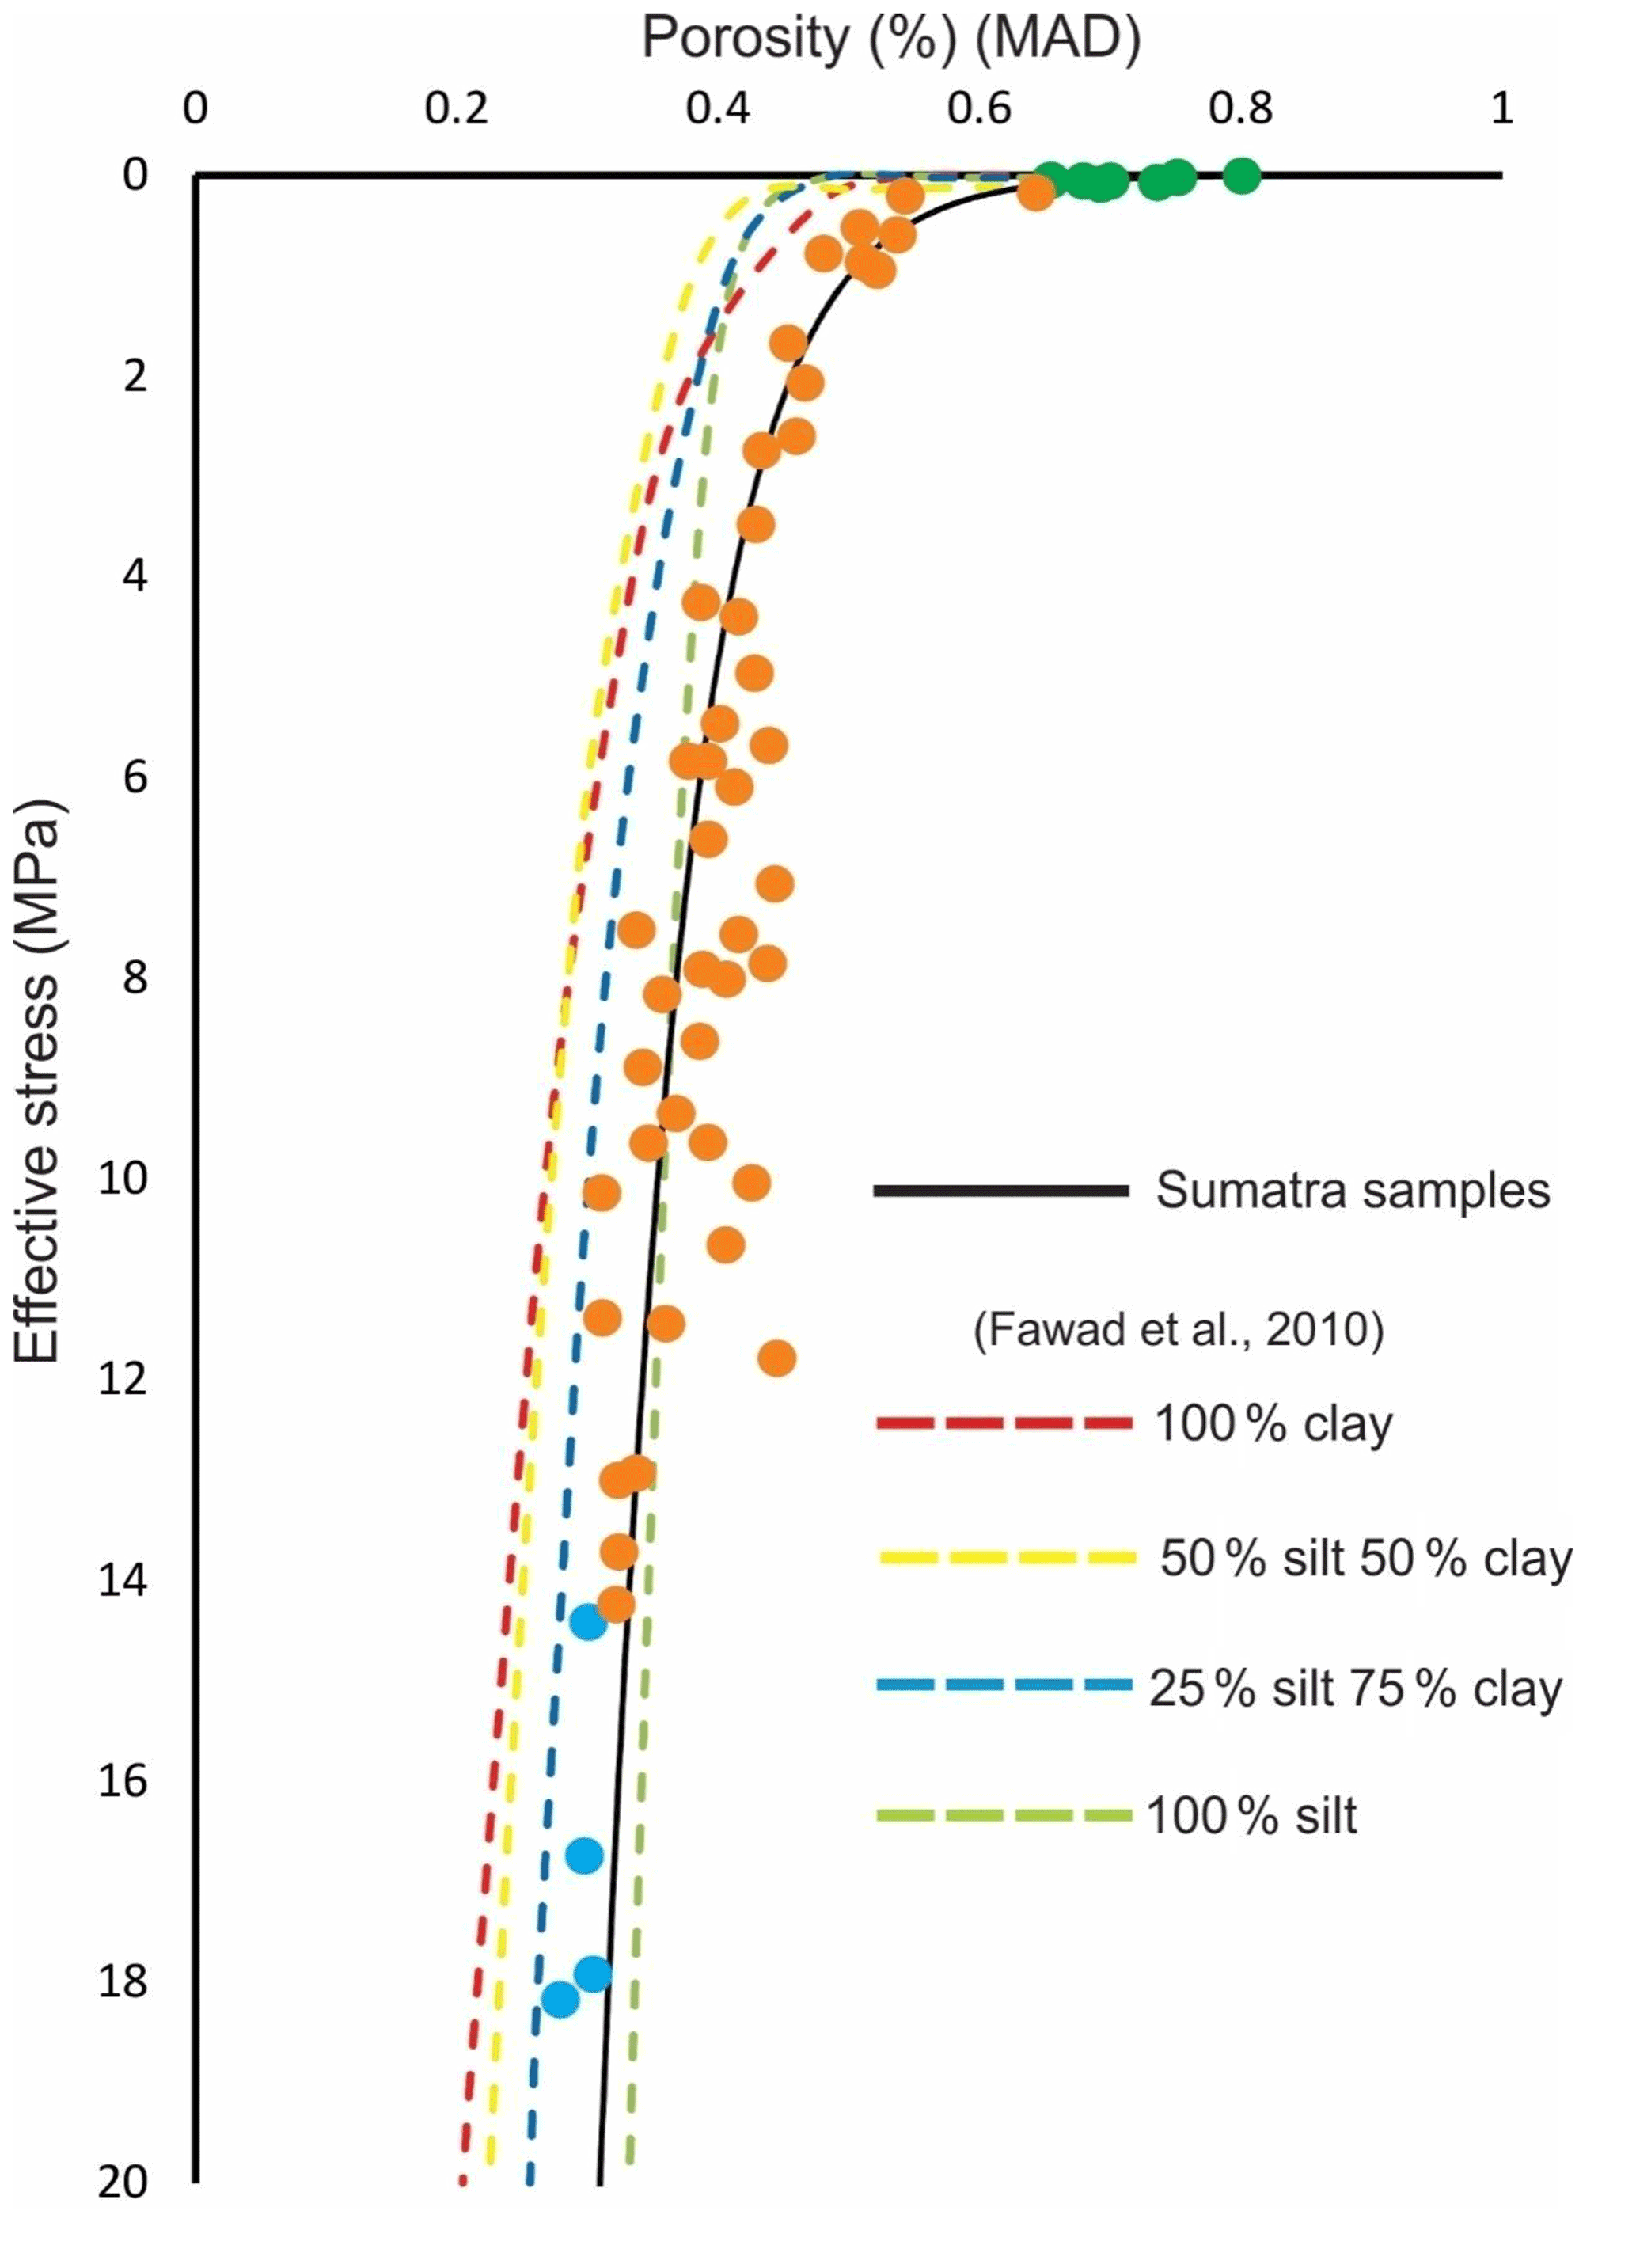
Figure 11Effective stress vs. porosity (MAD) for experimental mixtures of clay and silt (dashed lines; Fawad et al., 2010) compared with Sumatra data (Unit 1: green; Unit II: orange; Unit III: blue). The solid black solid line is a best-fit data regression for Sumatra samples.
Clay mineralogy has a significant effect on the compaction behavior of mudstone (Mondol et al., 2007). Mondol et al. (2007) performed compaction experiments using pure smectite and pure kaolinite clay particle packs because they represent two end-members compared to other clay minerals (illite and chlorite) in terms of grain size and surface area. Smectite is the more fine-grained clay with the largest surface area, while kaolinite is coarser and has a smaller surface area than other clay mineral types (Meade, 1964; Mesri and Olson, 1971; Rieke and Chilingarian, 1974). Kaolinite is more compressible than smectite, and clay compaction gradually decreases with an increasing proportion of small-sized clay particles in the sample (Mondol et al., 2007).
Fawad et al. (2010) used clay mixtures of 81 % kaolinite, 14 % mica, and 5 % microcline grains, whereas Sumatra mud samples are composed of 50 %–79 % illite and 5 %–30 % smectite, with only 8 %–20 % undifferentiated chlorite and kaolinite and 5 %–10 % quartz particles. Therefore, due to higher illite and smectite content, Sumatra muds appeared to be less compacted than the experimental samples used by Fawad et al. (2010).
5.2 BIB–SEM porosity vs. MAD porosity
We note that BIB–SEM porosity is lower than the porosity found from shipboard MAD data; however, the two measurements correlate along a line through the origin (Fig. 3b). The reason for this difference is that MAD porosity measures the total amount of moisture in a much larger sample and accounts for pores far below the PPR. Rare large pores are also underrepresented in the 1 mm2 BIB section. Earlier studies also documented and discussed mismatches between MAD and BIB–SEM measurements (Hemes et al., 2013; Houben et al., 2014; Nole et al., 2016; Oelker et al., 2019). They concluded that the mismatch could be due to several factors: (i) BIB–SEM porosity largely depends on the magnification and resolution of images; (ii) there can be variation in sample sizes; and (iii) MAD porosity takes into account the pores whose sizes are much lower than PPR, whereas the BIB–SEM technique detects only the pores larger than PPR. We plotted estimated BIB–SEM porosity and MAD porosity data from earlier studies on Boom clay (Hemes et al., 2013; Oelker et al., 2019), Opalinus clay (Houben et al., 2014), and samples from the Nankai trough (Nole et al., 2016). The data for Boom clay and Opalinus clay follow a trend similar to the Sumatra samples, whereas clay samples from the Nankai trough show a different trend. This difference may be attributed to differences in magnification of Nankai trough samples.
In addition, we plotted clay content against the difference between the two porosities in Fig. 12a. We performed regression analysis using the dataset for the 33 mud samples analyzed at Aachen (Fig. 12b) for BIB–SEM porosity versus MAD porosity (following Eq. 7) but also incorporating the effect of clay content (following Eq. 8).
The coefficients of determination (R2) for Eqs. (7) and (8) are 0.7126 and 0.9262, respectively. These results suggest that the ratio in porosity depends on depth and clay content.

Figure 12(a) Clay content vs. the difference between MAD and BIB–SEM porosity. Green, orange, and blue symbols represent the samples from Units I, II, and III, respectively. (b) Multivariate regression analysis using three parameters: BIB–SEM porosity, clay content, and MAD porosity (33 samples).
For all samples, the BIB–SEM pore size distribution follows a power law over an interval of 3 orders of magnitude. We may extrapolate this below the practical pore resolution (PPR; Klaver et al., 2012; Kuila and Prasad, 2013; Wang et al., 2019). Extrapolating our dataset down to 3 nm pore diameter, the BIB–SEM porosity increases only up to 20 %–25 %. A mismatch of 15 % to 20 % between the MAD porosity and extrapolated BIB–SEM porosity remains. The fall-off from the normal trend in log–log pore size distribution plots (Fig. 9b) for the shallow depth (Unit I) samples suggests that large pores are also undercounted in the dataset. The mud samples from Unit I contain forams that are rare or absent in the deeper section (Fig. S11a, b, c, and d), and some of the missing pore volume can be attributed to the intact forams that may be missed due to the small size of the BIB–SEM sample.
Another factor that can create a mismatch between datasets is drying artifacts. In the past, Desbois et al. (2014) performed a detailed study on drying artifacts of mudstone samples using the cryogenic BIB–SEM technique. They identified four types of drying damage (types I, II, III, and IV) that can develop during drying of a mudstone. Type-I and type-II drying damage develops at clay–clay particle interfaces with tip to long axis contact and at clay–clast interfaces. Heterogeneous deformational behavior or shrinkage strain of clay and/or non-clay mineral grains can cause a build-up in stress at the boundary between particles during drying. Type-III drying artifacts are large cracks that develop within the clay matrix itself. Type-IV drying artifacts involve small damage that modifies pore morphology during drying. Among all of them, types II and III are the most spectacular and large enough to modify microstructure significantly. The morphology of the type-II and type-III drying artifacts is characterized by large, irregularly shaped, very elongated pores with serrated pore boundaries. However, in the present study, the large clay domains and silt-adjacent pores in all samples potentially show smooth edges and rounded pore tip ends, which are incompatible with the typical morphologies of the drying artifacts (Figs. 5, 6, and 7). Hence, drying artifacts appear to be less important for reconciling a mismatch between MAD and BIB–SEM porosity.
Shallow samples from Unit I are richer in smectite content than deeper samples, although a few samples from 400 to 1000 m b.s.f. have similar smectite abundances as Unit I. The moisture and density method (MAD) may overestimate the measured porosity of the sediment if interlayer water from smectites included in the measurement (Brown and Ransom, 1996; Dutilleul et al., 2020). Greater smectite content in the shallow samples (Unit I) may have contributed to an overestimation of the MAD porosity in the study. This is also consistent with the observation that the difference between the measurements gets larger as porosity increases.
5.3 Micromechanical model for porosity reduction
5.3.1 Sharp reduction in porosity at the shallow depth from the seafloor to 28 m b.s.f.
High porosity (80 % MAD; 32 % BIB–SEM) in the shallowest sediments is attributed to large pores in the samples created by abundant EE and EF particle contacts (Figs. 5a and 7a). These contacts are unstable and collapse under low effective stress to form FF contacts, resulting in a rapid porosity decrease within the first 28 m of burial (Fig. S12). This deformation is apparent from the reduction of large clay-domain pores observed over this interval (Figs.5 and 8). Collapse of pores surrounded by EE and EF contacts is further recognized by the progressive alignment of clay particles into the bedding plane, which promotes an increase in the number of elongated, small, clay-domain pores parallel to the bedding plane. Each of these observations is consistent with rotation of clay particles into the bedding plane as these large clay-domain pores collapse.
5.3.2 Mechanism of porosity reduction from 28 to 1500 m b.s.f.
Below 28 to >1500 m b.s.f., porosity continues to decrease from 52 %–30 % (MAD) but at a reduced pace. SEM observations suggest that this porosity decline results from the progressive loss of silt-adjacent pores, with large silt-adjacent pores lost before small ones (Fig. 8), although they remain present in common abundance to 1200 m b.s.f.. Small clay-domain pores are abundant throughout the section, and the large clay-domain pores are lost between the seafloor and 28 m b.s.f.
Within the population of silt-adjacent pores, the large, equant pores are most susceptible to collapse (Fig. 8). Large, elongate pores persist in abundance in both linear and crescent geometries. While it seems plausible that large, equant pores collapse to form large, elongate pores, no corresponding increase in the elongate pore population is observed. Large, elongate pores may collapse further and become small silt-adjacent pores. Microstructural evidence supports the idea that large equant pores collapse as surrounding clay particles within clay-rich domains bend and shrink the size of the remaining pore (Fig. 13) and that the collapse results in an increasing aspect ratio of the pore.
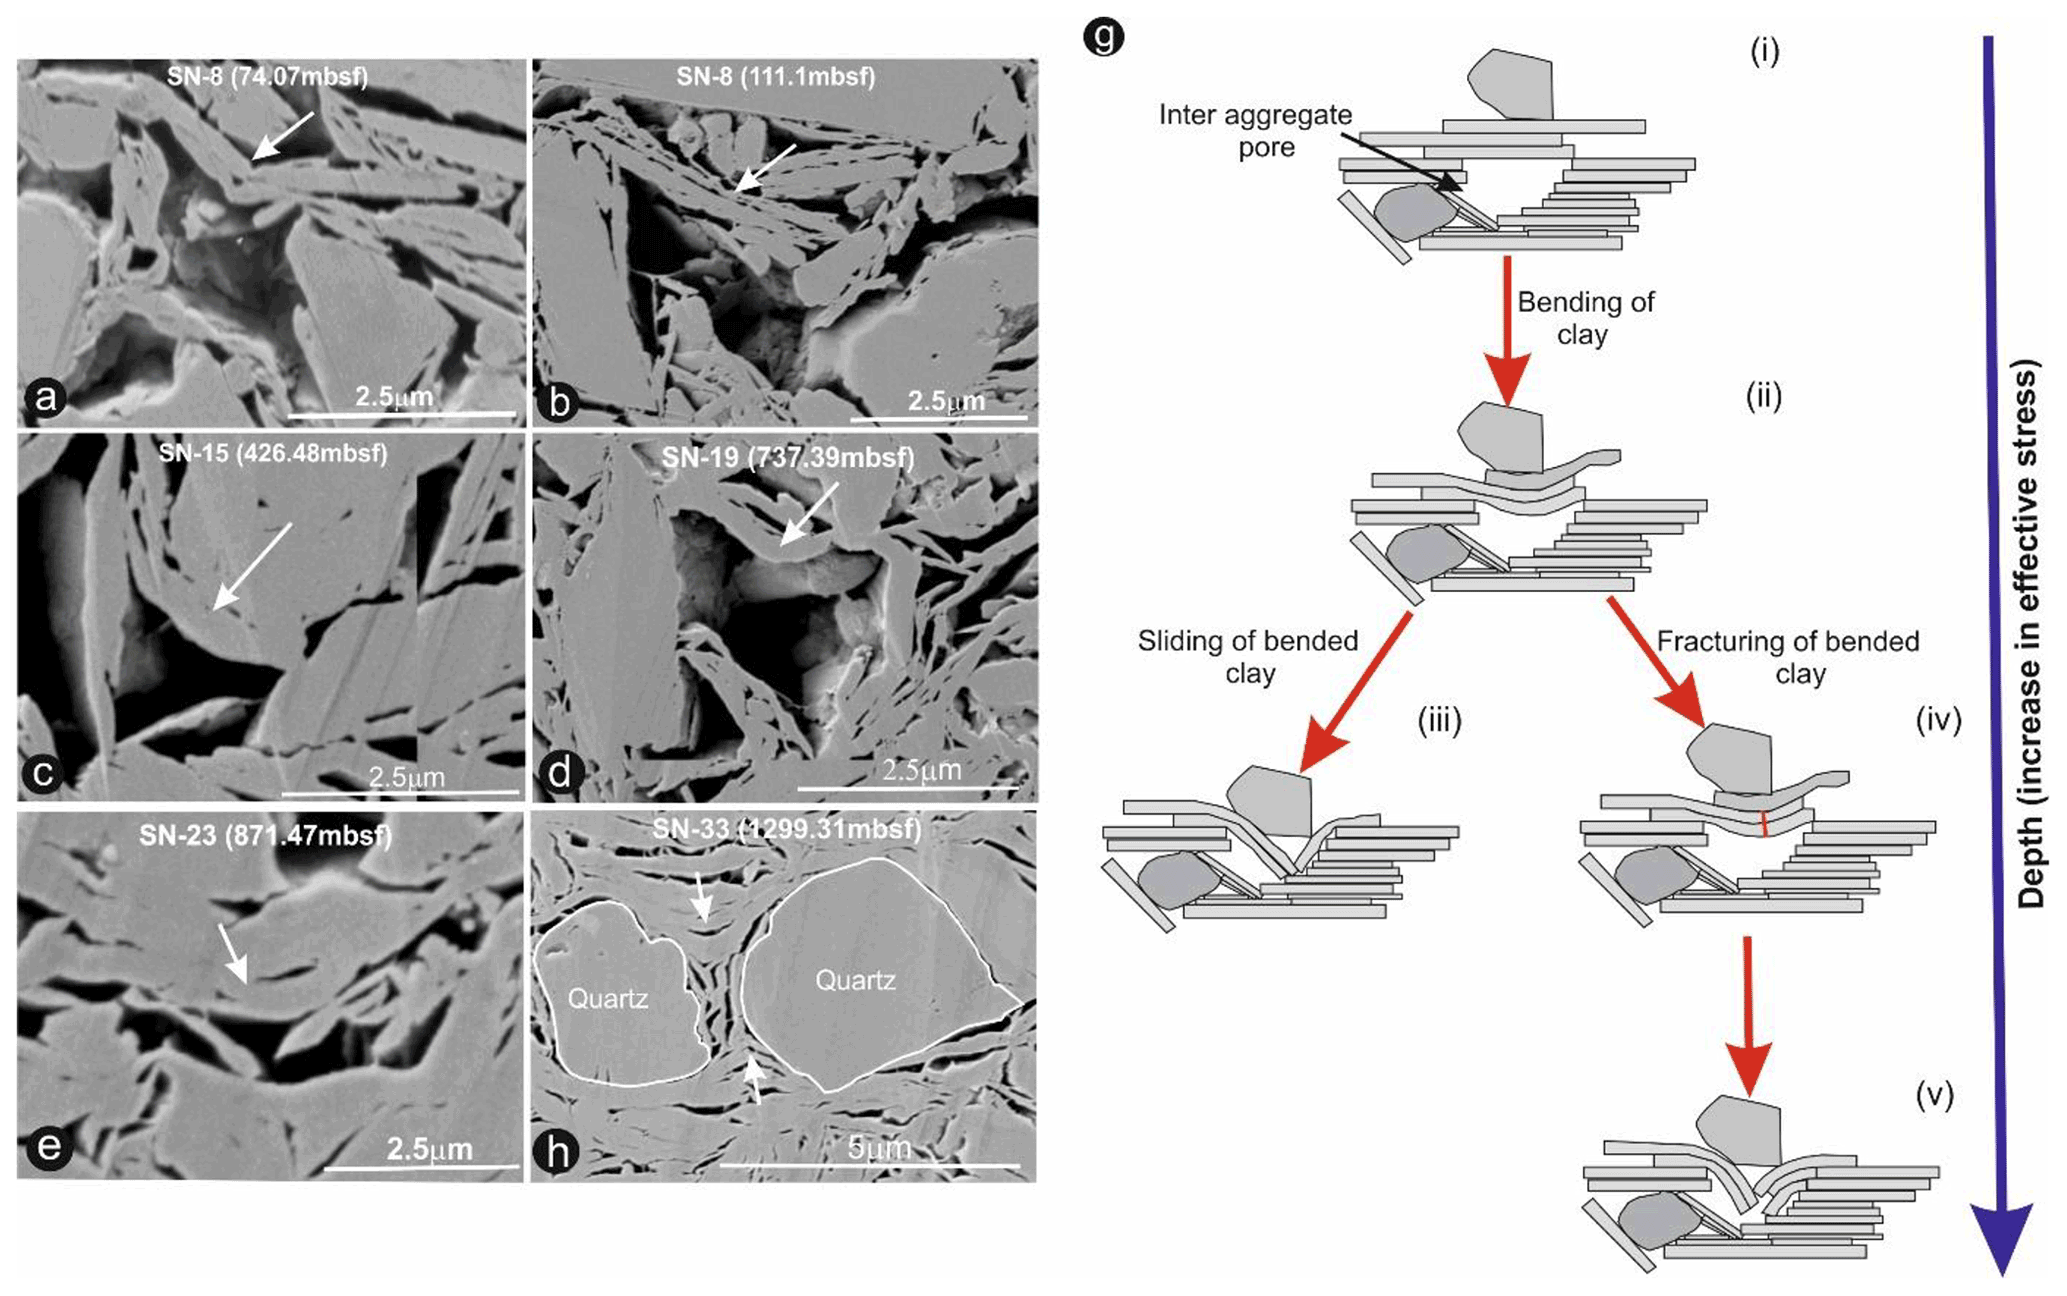
Figure 13(a–f) Examples of bent clay particles on top of silt-adjacent larger pores; sample ID and depth are labeled in photos. (g) Micromechanical model for collapse of large silt-adjacent pores.
Frequently, bent clay particles are observed on the top of larger silt-adjacent pores. In the clay microstructure, large silt-adjacent pores act as a zone of heterogeneous strain localization. Clay particles can bend and collapse into large silt-adjacent pores more readily than the smaller pores in the clay matrix (Fig. 13a to f). With increasing vertical effective stress two situations can arise, which are demonstrated in the model shown in Fig. 13g. First, with an increase in effective stress, the bent clay particles can lose frictional resistance from the sidewall (Fig. 13a and b), continue to bend, and slide down to fill the larger silt-adjacent pore space (Fig. 13g–iii). Second, with an increase in vertical effective stress, bent clay particles may develop fractures (red lines in Fig. 13g–iv) and subsequently collapse into the larger silt-adjacent pore space to reduce the porosity of samples (Fig. 13g–v). Figure 13a represents fractured bent clay on the top of the larger silt-adjacent pore (shown by the white arrow). Similarly, two small clay particles appear to have fallen into the larger silt-adjacent pore space (Fig. 13e), while another bent clay particle (shown by the white arrow) covers the pore. Figure 13f represents a bent clay particle wrapping across the top of two quartz particles, and four small clay platelets fill the space between two quartz particles, suggesting an older larger silt-adjacent pore filled by fractured clay platelets. Within the pore space between two equant quartz grains (Fig. 13f), four small clay particles appear to have developed due to the fracturing of two large bent clay particles. Hence, it appears that the collapse of larger silt-adjacent pores in these mud samples is governed by the bending of clay particles and subsequent fracturing due to an increase in vertical effective stress. While these processes are defined within individual pores, the observed deformation is interpreted to result from an imposed force chain that acts on specific pores in a progressive manner as the force chain evolves and as adjacent pores deform.
Small silt-adjacent pores also become less abundant with burial, but the transition occurs deeper than the large pores, and small, silt-adjacent pores remain common throughout the section (Figs. 6 and 8). Small equant pores are lost like the large pores, and elongate pores remain abundant within this population subset throughout. There is a loose correspondence between the loss of small, equant pores and an increase in elongate pores, suggesting that pore flattening is part of the pore collapse history. The pore collapse evolution outlined for large pores (Fig. 13g) appears to also hold for small pores, even though observations are more challenging.
Small, clay-domain pores appear to remain resilient throughout the compaction history (Fig. 8), even though some of these pores must become lost to account for porosity loss. Small, equant pores are lost between 100 and 200 m, and this loss appears to be accommodated by an increase in elongate pores (Fig. 8). Elongate crescent pores increase in abundance around 800 m b.s.f., and we interpret this to reflect folding of abundant linear-elongate pores as the overall system compacts.
Large equant pores in the clay domain are lost within the first few tens of meters of burial. Elongate pores appear to form at the expense of equant pores, and there may be a reduction in pore size associated with this shape change. Most of the pores remaining after 1500 m of burial are small, elongate pores found in both clay-domain and silt-adjacent pores.
The presence of silt particles locally redistributes the force chain of load to retain undeformed, silt-adjacent, large pores (Schneider et al., 2011). The samples with greater silt content are also enriched in equant-shaped silt-adjacent larger pores (Fig. 10) in the microstructure. Hence, as a result, they display greater porosity compared to other samples from similar depth intervals (Fig. 10).
Previous studies report contrasting ideas on the development of phyllosilicate fabric strength due to mechanical compaction. Some studies suggest that mechanical compaction creates a phyllosilicate fabric in mud (Bowles et al., 1969; Oertel and Curtis, 1972; Vasseur et al., 1995), whereas other studies conclude that vertical effective stress has a limited impact on phyllosilicate fabric development (Ho et al., 1999; Aplin et al., 2006; Day-Stirrat et al., 2008, 2011). Here, we consider the preferred orientation of pores as a proxy for the alignment of phyllosilicate (Hemes et al., 2013). At shallow depth (Unit I), a weak preferred alignment of the long axis of pores with maxima oriented obliquely to the bedding planes is formed (Fig. S10), and at greater depth (Units II and III) the long axes of pores become aligned subparallel to the bedding plane. An increase in vertical effective stress below 28 m b.s.f. depth creates only a small increase in the preferred orientation of the long axis of pores. Hence, we found only a limited change in phyllosilicate fabric strength with increasing vertical stress.
Previous authors also document the evolution of pore size distribution in mud with an increase in consolidation stress using laboratory experiments and mercury-intrusion porosimetry (Griffiths and Joshi, 1989, 1990). They conclude that the pore size distribution appears to be bimodal, and the distribution curve shifts toward smaller pore sizes with an increase in applied consolidation stress (Griffiths and Joshi, 1989). We observe an initial transition from trimodal to bimodal pore size distribution around 28 m b.s.f. depth due to rapid collapse of large clay-domain pores by compactional strain. With an increase in depth below 28 m b.s.f., the bimodal pore size distribution persists and tends to shift toward small pore sizes as the number of larger silt-adjacent pores diminishes.
Laboratory studies have emphasized the importance of clay particle rotation as a dominant mechanism for mechanical compaction in mudstone (Bennett et al., 1981, 1991; Vasseur et al., 1995; Aplin et al., 2006; Day-Stirrat et al., 2008, 2011). We observe particle rotation only in the shallowest samples wherein unstable EE and EF particle contacts are present. Clay particle bending as well as sliding and/or fracturing are considered more important for most of the section studied.
5.3.3 Mechanical compaction of marine sediment: a conceptual model
According to earlier studies (Delage and Lefebvre, 1984; Griffiths and Joshi, 1989, 1990; Emmanuel and Day-Stirrat, 2012), the reduction of pores in sedimentary rocks during compaction is size-dependent – larger pores deform much readily than smaller pores. According to the model considered by Delage and Lefebvre (1984), Griffiths and Joshi (1989, 1990), and Emmanuel and Day-Stirrat (2012), larger pores rapidly decrease in size during compaction to reduce the overall porosity of the sample. However, microstructural analysis of Sumatra samples suggests that porosity reduction is accomplished by compaction of all pore sizes. Moreover, the maximum size of pores remains almost constant irrespective of increasing vertical effective stress and depth (Fig. S9), with little difference observed for the maximum pore size in samples from 98.25 and 1299.31 m b.s.f. The preservation of a constant ratio between MAD and BIB–SEM porosity measurements (Fig. 3b) suggests that porosity loss is distributed across all pore sizes. We infer that all pore sizes are available for compaction for every increment of applied stress but acknowledge that pore size reduction in different size classes may proceed at different rates.
We propose a new model for the reduction in porosity in which all pores within the force chain of load take part in the reduction of porosity during compaction irrespective of their size. At shallow depth up to 28 m b.s.f., larger clay-domain pores are the most susceptible to early response during an increase in compactional strain for two reasons: (1) the “domains” defined by the clay particles are weaker compared to the larger, rigid silt grains; (2) due to the higher relative proportion of clay-rich regions within the mud, the force chain of load dominantly passes through the clay domains. The dispersed nature of the silt-sized particles and the high proportion of phyllosilicates in the mud samples indicate that soft clay particles act as the principal load-bearing framework. Hence, larger clay-domain pores are more unstable compared to silt-adjacent pores in the mud microstructure. Similarly, below 28 m b.s.f. depth, under an increase in vertical effective stress, both the larger silt-adjacent pores and smaller pores in the clay matrix that come within the force chain of load collapse. Hence, the ratio between BIB–SEM porosity vs. MAD porosity remains almost constant irrespective of the depth. All larger silt-adjacent pores do not come within the force chain of load at the same time. Hence, some of the larger silt-adjacent pores remained undeformed to the maximum depth of 1500 m b.s.f. depth. Therefore, the maximum size of the larger silt-adjacent pores remains almost constant irrespective of the depth and/or vertical effective stress.
In this study, we investigated how systematically pore types evolve with increasing depth in naturally compacted samples. However, tracking the pore evolution through additional size categories would elucidate the pore evolution in more detail. Preliminary pore size distribution data (Fig. 9) indicate that four size bins exist in these samples. Developing this approach requires improved image analysis techniques to tie all the pore attributes together on a pore-by-pore basis for a huge number of pores.
5.4 Compaction strain accommodation and grain-scale deformation
Deformation of clay-rich sedimentary rocks involves four possible mechanisms: (1) particulate flow (Morgenstern and Tchalenko, 1967; Borradaile et al., 1981), (2) cataclasis (Ukar and Cloos, 2019), (3) diffusive mass transfer (Blenkinsop, 2007; Fossen, 2016), and (4) intercrystalline plasticity (Blenkinsop, 2007; Fossen, 2016). Intensity and occurrence of a particular deformation mechanism in a mudstone depend on several parameters, such as effective stress, water content, cementation, and temperature (Desbois et al., 2017; Den Hartog and Spiers, 2014).
All our samples show evidence of particulate flow controlled by friction between grains. At shallow depths, illite platelets contacted at EE and EF junctions lose these weak bonds, and particles rotate into bedding-parallel orientation. Once FF contacts dominate, large-scale rotations are reduced, and inter-particle slip becomes important. This is best evidenced in collapse of large, silt-adjacent pores where bent clay particles overlay pores (Fig. 14a to f). In deforming granular foam material, bending was reported as the dominant deformation mechanism for the reduction in porosity and developing preferred alignment of the long axis of pores perpendicular to the applied stress (Elliott et al., 2002; Zhou et al., 2004; Samsudin et al., 2017; Zakaria et al., 2018) (a review of these earlier studies on the experimental deformation of granular foam is described in Document S2). Friction adheres clay particles to the edge of pores while the middle of particles drops into the pore, resulting in bending by inter-particle slip. A cartoon (Fig. 14g) illustrates the compaction mechanism associated with the bending of clay particles. With increasing compaction strain, clay particles undergo bending, and as a result, pore area is reduced, and the orientation of the pores tends to align perpendicular to the applied effective stress (Fig. 14g). At shallow depths (Unit I), particles get enough free space for rotation to align parallel to the bedding plane because of higher porosity (Fig. S12a and b). However, at greater depth where porosity decreases, space problems limit particle deformation to bending and fracturing as compactional strain increases (Fig. S12c and d).

Figure 14(a–f) Examples of clay aggregate bending (white arrows). (g) Conceptual diagram tracing porosity reduction and an increase in preferred alignment of the long axes of pores by bending of clay perpendicular to applied vertical stress.
5.5 Compaction of Sumatra input section: generalized implication for rock property evolution
The overall compaction curve obtained for Sumatra muds is comparable with the experimental study by Fawad et al. (2010) in the context of compactional range (Fig. 8).The curve shows a mono-exponential decrease in porosity with an increase in vertical effective stress, which is evidence of normal consolidation (Fawad et al., 2010; Dutilleul et al., 2020).
The larger silt-adjacent pores seen in the deepest of these samples (1500 m burial) suggest these muds retain considerable potential for additional mechanical compaction with deeper burial. As this marine sediment progressively approaches greater burial closer to the accretionary prism, it will undergo further changes in physical and deformational properties (Bray and Karig, 1985). Despite the substantial compactional strain, the relatively high porosity of the deepest sample and the survival of larger and mechanically unstable silt-margin pores suggest that compactional stabilization has yet to be reached because such IGVs and pore types are not generally observed in older and lithified mudrocks. Based on the current understanding of subduction zone deformation behavior and mudrock properties, it seems likely that mechanical compaction will continue to dominate the pore loss in deeper burial.
The general absence of early cementation and the corresponding dominance of mechanical compaction in the total pore loss are consistent with observations of other siliciclastic-dominated muds (Milliken, 2014, 2019). The trends for intergranular volume change observed from the seafloor and 1500 m b.s.f. place useful constraints on the maximum cement volumes that theoretically could be emplaced at this depth range in sediments containing a more reactive grain assemblage. At the depths of burial attained at the deformation front, any cementation of the Sumatra input sediments will be limited to <30 % of the rock volume or possibly much less, as mechanical compaction is expected to continue up to the burial temperatures that initiate grain reactions and associated cementation.
Pores are classified by size and microstructural position, resulting in a multi-modal contribution to the total porosity. Shallow samples (seafloor to 28 m b.s.f.) display a sharp reduction in porosity from 80 % to 52 % as large clay-domain and/or matrix pores collapse. Deeper samples (28 m b.s.f. to 1500 m b.s.f.) exhibit a smaller reduction in porosity from 50 % to 32 % due to the collapse of silt-adjacent pores by bending as well as subsequent fracturing and/or sliding of clay particles.
The class of large pores next to silt-sized grains (between 104 and 106 nm2) remains common to >1 km burial irrespective of the mineralogy of the silt-sized grains, but their size decreases with depth. Small, equant pores next to silt particles are abundant in the first 100 m of burial and remain common over the entire depth range.
Small pores in clay domains are almost all elongated and abundant over all observed depths. Small, crescent-shaped elongate pores increase in abundance with depth as clay particles become folded by compactional processes.
The size independence of pore loss arises because the force chain driving pore collapse is localized primarily within the volumetrically dominant and weaker clay-rich domains; larger pores around isolated silt particles enter into the force chain somewhat randomly and asynchronously and do not contribute preferentially to pore loss over the depth range studied.
An increase in effective stress up to 18 MPa (∼ 1500 m b.s.f.) causes the development of weakly aligned phyllosilicate fabric (defined by mica and illite clay particles) in the microstructure.
Compaction processes in our samples are dominated by granular flow (rotation and frictional sliding of illite clay particles) at shallow depths. With increasing depth, compaction is additionally accommodated by bending of clay particles.
High-resolution SE2 and BSE images of 33 samples (SN1 to SN33 in Table 1, i.e., sample set analyzed at Aachen University) are available online at https://figshare.com/s/cbaada517b0b1409d575 (Lahiri et al., 2022). Please create a profile and log in to https://figshare.com to download the high-resolution SE2 and BSE images of the analyzed samples. In inconvenient circumstances, contact the corresponding author.
The supplement related to this article is available online at: https://doi.org/10.5194/se-13-1513-2022-supplement.
SL and KLM performed sample preparation and BIB–SEM microscopy. SL analyzed the data. JLU and GD acquired funding. JLU managed the project. PV, KLM, and JLU significantly contributed to interpreting the data. SL wrote the first draft of the paper. PV, KLM, and JLU contributed to the correction and improvement of the paper.
The contact author has declared that none of the authors has any competing interests.
Publisher's note: Copernicus Publications remains neutral with regard to jurisdictional claims in published maps and institutional affiliations.
Sivaji Lahiri and Janos L. Urai thank the German Research Foundation (Deutsche Forschungsgemeinschaft, DFG; grant no. UR 64/19-1) for providing funding to carry out the research. The IODP (International Ocean Discovery Program) sample repository, Japan, is acknowledged for providing oriented mud samples for the study. Funding for sample preparation and SEM imaging at Austin was supported by a post-expedition award to Kitty L. Milliken from the Consortium for Ocean Leadership. Sivaji Lahiri thanks Manuel Menzel, Jop Klaver, Liene Spruženiece, and Joyce Schmatz for providing valuable time to teach BIB–SEM techniques.
This research has been supported by the Deutsche Forschungsgemeinschaft (grant no. UR 64/19-1).
This paper was edited by Federico Rossetti and reviewed by David Dewhurst and Bernhard Schuck.
Adams, R. and Bischof, L.: Seeded region growing, IEEE T. Pattern Anal., 16, 641–647, https://doi.org/10.1109/34.295913, 1994.
Ajdukiewicz, J. M. and Lander, R. H.: Sandstone reservoir quality prediction: state of the art, AAPG Bull., 94, 1082–1091, https://doi.org/10.1306/intro060110, 2010.
Ammon, C. J., Ji, C., Thio, H. K., Robinson, D., Ni, S., Hjorleifsdottir, V., Kanamori, H., Lay, T., Das, S., Helmberger, D., and Ichinose, G.: Rupture process of the 2004 Sumatra-Andaman earthquake, Science, 308, 1133–1139, https://doi.org/10.1126/science.1112260, 2005.
Aplin, A. C. and Macquaker, J. H.: Mudstone diversity: Origin and implications for source, seal, and reservoir properties in petroleum systems, AAPG Bull., 95, 2031–2059, https://doi.org/10.1306/03281110162, 2011.
Aplin, A. C., Matenaar, I. F., and van der Pluijm, B. A.: Influence of mechanical compaction and chemical diagenesis on the microfabric and fluid flow properties of Gulf of Mexico mudstones, J. Geochem. Explor., 78, 449–451, https://doi.org/10.1016/S0375-6742(03)00035-9, 2003.
Aplin, A. C., Matenaar, I. F., McCarty, D. K., and van der Pluijm, B. A.: Influence of mechanical compaction and clay mineral diagenesis on the microfabric and pore-scale properties of deep-water Gulf of Mexico mudstones, Clay. Clay Miner., 54, 500–514, https://doi.org/10.1346/CCMN.2006.0540411, 2006.
Backman, J., Chen, W., Kachovich, S., Mitchison, F. L., Petronotis, K. E., Yang, T., and Zhao, X.: Data report: Revised age models for IODP Sites U1480 and U1481, Expedition 362, Proceedings of the International Ocean Discovery Program, Expedition Reports 362, https://doi.org/10.14379/iodp.proc.362.202.2019, 2019.
Baruch, E. T., Kennedy, M. J., Löhr, S. C., and Dewhurst, D. N.: Feldspar dissolution-enhanced porosity in Paleoproterozoic shale reservoir facies from the Barney Creek Formation (McArthur Basin, Australia), AAPG Bull., 99, 1745–1770, https://doi.org/10.1306/04061514181, 2015.
Bennett, R. H., Bryant, W. R., and Keller, G. H.: Clay fabric of selected submarine sediments; fundamental properties and models, J. Sediment. Res., 51, 217–232, https://doi.org/10.1306/212F7C52-2B24-11D7-8648000102C1865D, 1981.
Bennett, R. H., O'Brien, N. R., and Hulbert, M. H.: Microstructure of Fine-Grained Sediments, in: Determinants of clay and shale microfabric signatures: processes and mechanisms, Springer, New York, NY, 5–32, https://doi.org/10.1007/978-1-4612-4428-8_2, 1991.
Blenkinsop, T. G.: Deformation microstructures and mechanisms in minerals and rocks, Springer Science & Business Media, ISBN 978-0-412-73480-9, 2007.
Borradaile, G. J.: Particulate flow of rock and the formation of cleavage, Tectonophysics, 72, 305–321, https://doi.org/10.1016/0040-1951(81)90243-2, 1981.
Bowles, F. A., Bryant, W. R., and Wallin, C.: Microstructure of unconsolidated and consolidated marine sediments, J. Sediment. Res., 39, 1546–1551, https://doi.org/10.1306/74D71E7E-2B21-11D7-8648000102C1865D, 1969.
Bray, C. J. and Karig, D. E.: Porosity of sediments in accretionary prisms and some implications for dewatering processes, J. Geophys. Res.-Sol. Ea., 90, 768–778, https://doi.org/10.1029/JB090iB01p00768, 1985.
Brown, K. M. and Ransom, B.: Porosity corrections for smectite-rich sediments: Impact on studies of compaction, fluid generation, and tectonic history, Geology, 24, 843–846, https://doi.org/10.1130/0091-7613(1996)024<0843:PCFSRS>2.3.CO;2, 1996.
Burland, J. B.: On the compressibility and shear strength of natural clays, Géotechnique, 40, 329–378, https://doi.org/10.1680/geot.1990.40.3.329, 1990.
Chester, F. M., Rowe, C., Ujiie, K., Kirkpatrick, J., Regalla, C., Remitti, F., Moore, J. C., Toy, V., Wolfson-Schwehr, M., Bose, S., and Kameda, J.: Structure and composition of the plate-boundary slip zone for the 2011 Tohoku-Oki earthquake, Science, 342, 1208–1211, https://doi.org/10.1126/science.1243719, 2013.
Cetin, H.: Soil-particle and pore orientations during consolidation of cohesive soils, Eng. Geol., 73, 1–11, https://doi.org/10.1016/j.enggeo.2003.11.006, 2004.
Day-Stirrat, R. J., Aplin, A. C., Środoń, J., and van der Pluijm, B. A.: Diagenetic reorientation of phyllosilicate minerals in Paleogene mudstones of the Podhale Basin, southern Poland, Clay. Clay Miner., 56, 100–111, https://doi.org/10.1346/CCMN.2008.0560109, 2008.
Day-Stirrat, R. J., Milliken, K. L., Dutton, S. P., Loucks, R. G., Hillier, S., Aplin, A. C., and Schleicher, A. M.: Open-system chemical behavior in deep Wilcox Group mudstones, Texas Gulf Coast, USA, Mar. Petrol. Geol., 27, 1804–1818, https://doi.org/10.1016/j.marpetgeo.2010.08.006, 2010.
Day-Stirrat, R. J., Schleicher, A. M., Schneider, J., Flemings, P. B., Germaine, J. T., and van der Pluijm, B. A.: Preferred orientation of phyllosilicates: Effects of composition and stress on resedimented mudstone microfabrics, J. Struct. Geol., 33, 1347–1358, https://doi.org/10.1016/j.jsg.2011.06.007, 2011.
Day-Stirrat, R. J., Flemings, P. B., You, Y., Aplin, A. C., and van der Pluijm, B. A.: The fabric of consolidation in Gulf of Mexico mudstones, Mar. Geol., 295, 77–85, https://doi.org/10.1016/j.margeo.2011.12.003, 2012.
Dean, S. M., McNeill, L. C., Henstock, T. J., Bull, J. M., Gulick, S. P., Austin, J. A., Bangs, N. L., Djajadihardja, Y. S,. and Permana, H.: Contrasting décollement and prism properties over the Sumatra 2004–2005 earthquake rupture boundary, Science, 329, 207–210, https://doi.org/10.1126/science.1189373, 2010.
Delage, P. and Lefebvre, G.: Study of the structure of a sensitive Champlain clay and of its evolution during consolidation, Can. Geotech. J., 21, 21–35, https://doi.org/10.1139/t84-003, 1984.
DellePiane, C., Almqvist, B. S., MacRae, C. M., Torpy, A., Mory, A. J., and Dewhurst, D. N.: Texture and diagenesis of Ordovician shale from the Canning Basin, Western Australia: Implications for elastic anisotropy and geomechanical properties, Mar. Petr. Geol., 59, 56–71, https://doi.org/10.1016/j.marpetgeo.2014.07.017, 2015.
Den Hartog, S. A. and Spiers, C. J.: A microphysical model for fault gouge friction applied to subduction megathrusts, J. Geophys. Res.-Sol. Ea., 119, 1510–1529, https://doi.org/10.1002/2013JB010580, 2014.
Desbois, G., Urai, J. L., and Kukla, P. A.: Morphology of the pore space in claystones – evidence from BIB/FIB ion beam sectioning and cryo-SEM observations, eEarth Discussions, 4, 1–19, https://doi.org/10.5194/eed-4-1-2009, 2009.
Desbois, G., Urai, J. L., Kukla, P. A., Konstanty, J., and Baerle, C.: High-resolution 3D fabric and porosity model in a tight gas sandstone reservoir: A new approach to investigate microstructures from mm-to nm-scale combining argon beam cross-sectioning and SEM imaging, J. Petrol. Sci. Eng., 78, 243–257, https://doi.org/10.1016/j.petrol.2011.06.004, 2011.
Desbois, G., Urai, J. L., Hemes, S., Brassinnes, S., De Craen, M., and Sillen, X.: Nanometer-scale pore fluid distribution and drying damage in preserved clay cores from Belgian clay formations inferred by BIB-cryo-SEM, Eng. Geol., 179, 117–131, https://doi.org/10.1016/j.enggeo.2014.07.004, 2014.
Desbois, G., Höhne, N., Urai, J. L., Bésuelle, P., and Viggiani, G.: Deformation in cemented mudrock (Callovo–Oxfordian Clay) by microcracking, granular flow and phyllosilicate plasticity: insights from triaxial deformation, broad ion beam polishing and scanning electron microscopy, Solid Earth, 8, 291–305, https://doi.org/10.5194/se-8-291-2017, 2017.
Djeran-Maigre, I., Tessier, D., Grunberger, D., Velde, B., and Vasseur, G.: Evolution of microstructures and of macroscopic properties of some clays during experimental compaction, Mar. Petrol. Geol., 15, 109–128, doi.org/10.1016/S0264-8172(97)00062-7, 1998.
Dugan, B., McNeill, L., and Petronotis, K.: Expedition 362 preliminary report: Sumatra subduction zone, International Ocean Discovery Program, https://doi.org/10.14379/iodp.pr.362.2017, 2017.
Dutilleul, J., Bourlange, S., Conin, M., and Géraud, Y.: Quantification of bound water content, interstitial porosity and fracture porosity in the sediments entering the North Sumatra subduction zone from Cation Exchange Capacity and IODP Expedition 362 resistivity data, Mar. Petrol. Geol., 111, 156–165, https://doi.org/10.1016/j.marpetgeo.2019.08.007, 2020.
Ehrenberg, S. N.: Assessing the relative importance of compaction processes and cementation to reduction of porosity in sandstones: discussion, Am. Assoc. Petr. Geol. B., 73, 1274–1276, https://doi.org/10.1306/44B4AA1E-170A-11D7-8645000102C1865D, 1989.
Elliott, J. A., Windle, A. H., Hobdell, J. R., Eeckhaut, G., Oldman, R. J., Ludwig, W., Boller, E., Cloetens, P., and Baruchel, J.: In-situ deformation of an open-cell flexible polyurethane foam characterised by 3D computed microtomography, J. Mater. Sci., 37, 1547–1555, https://doi.org/10.1023/A:1014920902712,2002.
Emmanuel, S. and Day-Stirrat, R. J.: A framework for quantifying size dependent deformation of nano-scale pores in mudrocks, J. Appl. Geophy., 86, 29–35, https://doi.org/10.1016/j.jappgeo.2012.07.011, 2012.
Fawad, M., Mondol, N. H., Jahren, J., and Bjørlykke, K.: Microfabric and rock properties of experimentally compressed silt-clay mixtures, Mar. Petr. Geol., 27, 1698–1712, https://doi.org/10.1016/j.marpetgeo.2009.10.002, 2010.
Fossen, H.: Structural geology, Cambridge university press, ISBN 978-1-107-05764-7, 2016.
Ghosal, D., Singh, S. C., and Martin, J.: Shallow subsurface morphotectonics of the NW Sumatra subduction system using an integrated seismic imaging technique, Geophys. J. Int., 198, 1818–1831, https://doi.org/10.1093/gji/ggu182, 2014.
Griffiths, F. J. and Joshi, R. C.: Change in pore size distribution due to consolidation of clays, Geotechnique, 39, 159–167, https://doi.org/10.1680/geot.1989.39.1.159, 1989.
Griffiths, F. J. and Joshi, R. C.: Clay fabric response to consolidation, Applied Clay Science, 5, 37–66, https://doi.org/10.1016/0169-1317(90)90005-A, 1990.
Griffiths, F. J. and Joshi, R. C.: Change in pore size distribution owing to secondary consolidation of clays, Can. Geotech. J., 28, 20–24, https://doi.org/10.1139/t91-003, 1991.
Hemes, S., Desbois, G., Urai, J. L., De Craen, M., and Honty, M.: Variations in the morphology of porosity in the Boom Clay Formation: insights from 2D high resolution BIB-SEM imaging and Mercury injection Porosimetry, Neth. J. Geosci., 92, 275–300, doi.org/10.1017/S0016774600000214, 2013.
Hemes, S., Desbois, G., Urai, J. L., Schröppel, B., and Schwarz, J. O.: Multi-scale characterization of porosity in Boom Clay (HADES-level, Mol, Belgium) using a combination of X-ray μ-CT, 2D BIB-SEM and FIB-SEM tomography, Microp. Mesopor. Mat., 208, 1–20, https://doi.org/10.1016/j.micromeso.2015.01.022, 2015.
Hemes, S., Desbois, G., Klaver, J., and Urai, J. L.: Microstructural characterisation of the Ypresian clays (Kallo-1) at nanometre resolution, using broad-ion beam milling and scanning electron microscopy, Neth. J. Geosci., 95, 293–313, https://doi.org/10.1017/njg.2016.16, 2016.
Hesse, R.: Turbiditic and non-turbiditic mudstone of Cretaceous flysch sections of the East Alps and other basins, Sedimentology, 22, 387–416, https://doi.org/10.1111/j.1365-3091.1975.tb01638.x, 1975.
Hippchen, S. and Hyndman, R. D.: Thermal and structural models of the Sumatra subduction zone: Implications for the megathrust seismogenic zone, J. Geophys. Res.-Sol. Ea., 113, 1–10, https://doi.org/10.1002/2015TC003901, 2008.
Ho, N. C., Peacor, D. R., and van der Pluijm, B. A.: Preferred orientation of phyllosilicates in Gulf Coast mudstones and relation to the smectite-illite transition. Clay, Clay Miner., 47, 495–504, https://doi.org/10.1346/CCMN.1999.0470412, 1999.
Houben, M. E., Desbois, G., and Urai, J. L.: A comparative study of representative 2D microstructures in Shaly and Sandy facies of Opalinus Clay (Mont Terri, Switzerland) inferred form BIB-SEM and MIP methods, Mar. Petr. Geol., 49, 143–161, https://doi.org/10.1016/j.marpetgeo.2013.10.009, 2014.
Hüpers, A., Ikari, M. J., Dugan, B., Underwood, M. B., and Kopf, A.J.: Origin of a zone of anomalously high porosity in the subduction inputs to Nankai Trough, Mar. Geol., 361, 147–162, https://doi.org/10.1016/j.margeo.2015.01.004, 2015.
Hüpers, A., Torres, M. E., Owari, S., McNeill, L. C., Dugan, B., Henstock, T. J., Milliken, K. L., Petronotis, K. E., Backman, J., Bourlange, S., and Chemale, F.: Release of mineral-bound water prior to subduction tied to shallow seismogenic slip off Sumatra, Science, 356, 841–844, https://doi.org/10.1126/science.aal3429, 2017.
Jiang, M., Klaver, J., Schmatz, J., and Urai, J. L.: Nanoscale porosity analysis in geological materials, in: 14th International Congress for Stereology and Image Analysis, Liège, 7–10 July 2015, ISSN 0351-580X, 2015.
Kameda, A., Dvorkin, J., Keehm, Y., Nur, A., and Bosl, W.: Permeability-porosity transforms from small sandstone fragments, Geophysics, 71, N11–N19, https://doi.org/10.1190/1.2159054, 2006.
Karaborni, S., Smit, B., Heidug, W., Urai, J., and Van Oort, E.: The swelling of clays: molecular simulations of the hydration of montmorillonite, Science, 271, 1102–1104, https://doi.org/10.1126/science.271.5252.1102, 1996.
Klaver, J., Desbois, G., Urai, J. L., and Littke, R.: BIB-SEM study of the pore space morphology in early mature Posidonia Shale from the Hils area, Germany, Int. J. Coal Geol., 103, 12–25, https://doi.org/10.1016/j.coal.2012.06.012, 2012.
Klaver, J., Desbois, G., Littke, R., and Urai, J. L.: BIB-SEM characterization of pore space morphology and distribution in postmature to overmature samples from the Haynesville and Bossier Shales, Mar. Petrol. Geol., 59, 451–466, https://doi.org/10.1016/j.marpetgeo.2014.09.020, 2015.
Klaver, J., Desbois, G., Littke, R., and Urai, J. L.: BIB-SEM pore characterization of mature and post mature Posidonia Shale samples from the Hils area, Germany, Int. J. Coal Geol., 158, 78–89, https://doi.org/10.1016/j.coal.2016.03.003, 2016.
Kuila, U. and Prasad, M.: Specific surface area and pore-size distribution in clays and shales, Geophys. Prospect., 61, 341–362, https://doi.org/10.1111/1365-2478.12028, 2013.
Lahiri, S., Milliken, K. L., Vrolijk, P., Desbois, G., and Urai, J. L.: Data: Mechanical compaction mechanisms in the input sediments of the Sumatra Subduction Complex- insights from microstructural analysis of cores from IODP Expedition-362, Figshare [data set], https://figshare.com/s/cbaada517b0b1409d575, 2022.
Lander, R. H. and Walderhaug, O. W.: Predicting porosity through simulating sandstone compaction and quartz cementation, Am. Assoc. Petr. Geol. B., 83, 433–449, https://doi.org/10.1306/00AA9BC4-1730-11D7-8645000102C1865D, 1999.
Lander, R. H., Larese, R. E., and Bonnell, L. M.: Toward more accurate quartz cement models: The importance of euhedral versus noneuhedral growth rates, Am. Assoc. Petr. Geol. B., 92, 1537–1563, https://doi.org/10.1306/07160808037, 2008.
Laurich, B., Urai, J. L., Desbois, G., Vollmer, C., and Nussbaum, C.: Microstructural evolution of an incipient fault zone in Opalinus Clay: Insights from an optical and electron microscopic study of ion-beam polished samples from the Main Fault in the Mt-Terri Underground Research Laboratory, J. Struct. Geol., 67, 107–128, https://doi.org/10.1016/j.jsg.2014.07.014, 2014.
Lay, T., Ward, S., Aster, R. C., and Beck, S.: The great Sumatra-Andaman earthquake of 26 December 2004, Science, 308, 1127–1133, https://doi.org/10.1126/science.1112250, 2005.
Lazar, O. R., Bohacs, K. M., Macquaker, J. H., Schieber, J., and Demko, T. M.: Capturing key attributes of fine-grained sedimentary rocks in outcrops, cores, and thin sections: nomenclature and description guidelines, J. Sediment. Res., 85, 230–246, https://doi.org/10.2110/jsr.2015.11, 2015.
Lundegard, P. D.: Sandstone porosity loss–a “big picture” view of the importance of compaction, J. Sediment. Petrol., 62, 250–260, https://doi.org/10.1306/D42678D4-2B26-11D7-8648000102C1865D, 1992.
McNeill, L. C., Dugan, B., Petronotis, K. E., Backman, J., Bourlange, S., Chemale, F., Chen, W., Colson, T. A., Frederik, M. C. G., Guèrin, G., Hamahashi, M., Henstock, T., House, B. M., Hüpers, A., Jeppson, T. N., Kachovich, S., Kenigsberg, A. R., Kuranaga, M., Kutterolf, S., Milliken, K. L., Mitchison, F. L., Mukoyoshi, H., Nair, N., Owari, S., Pickering, K. T., Pouderoux, H. F. A., Yehua, S., Song, I., Torres, M. E., Vannucchi, P., Vrolijk, P. J., Yang, T., and Zhao, X.: Sumatra Subduction Zone, Proceedings of the International Ocean Discovery Program, 362, 1–59, https://doi.org/10.14379/iodp.proc.362.102.2017, 2017a.
McNeill, L. C., Dugan, B., Petronotis, K. E., Backman, J., Bourlange, S., Chemale, F., Chen, W., Colson, T. A., Frederik, M. C. G., Guèrin, G., Hamahashi, M., Henstock, T., House, B. M., Hüpers, A., Jeppson, T. N., Kachovich, S., Kenigsberg, A. R., Kuranaga, M., Kutterolf, S., Milliken, K. L., Mitchison, F. L., Mukoyoshi, H., Nair, N., Owari, S., Pickering, K. T., Pouderoux, H. F. A., Yehua, S., Song, I., Torres, M. E., Vannucchi, P., Vrolijk, P. J., Yang, T., and Zhao, X.: Sumatra Subduction Zone, Proceedings of the International Ocean Discovery Program, 362, https://doi.org/10.14379/iodp.proc.362supp.2017, 2017b.
Meade, R. H.: Removal of water and rearrangement of particles during the compaction of clayey sediments-review, USGS publication Warehouse, Series no. 497, 1–23, https://doi.org/10.3133/pp497B, 1964.
Mesri, G. and Olson, R. E.: Mechanisms controlling the permeability of clays, Clay. Clay Miner., 19, 151–158, 1971.
Milliken, K. L.: A compositional classification for grain assemblages in fine-grained sediments and sedimentary rocks, J. Sediment. Res., 84, 1185–1199, https://doi.org/10.2110/jsr.2014.92, 2008.
Milliken, K. L.: A compositional classification for grain assemblages in fine-grained sediments and sedimentary rocks, J. Sediment. Res., 84, 1185–1199, https://doi.org/10.2110/jsr.2014.92, 2014.
Milliken K. L.: Compactional and mass-balance constraints inferred from the volume of quartz cementation in mudrocks. Mudstone Diagenesis: New Research Perspectives for Shale Hydrocarbon Reservoirs, Seals, and Source Rocks, AAPG, 120, 33–48, https://doi.org/10.1306/13672209M121252, 2019.
Milliken, K. L. and Curtis, M. E.: Imaging pores in sedimentary rocks: Foundation of porosity prediction, Mar. Petr. Geol., 73, 590–608, https://doi.org/10.1016/j.marpetgeo.2016.03.020, 2016.
Milliken, K. L. and Day-Stirrat R. J.: Cementation in mudrocks: Brief review with examples from cratonic basin mudrocks. Memoir. J.-Y. Chatellier. Tulsa, Oklahoma, USA, AAPG, 103, 133–150, 2013.
Milliken, K. L. and Olson, T.: Silica diagenesis, porosity evolution, and mechanical behavior in siliceous mudstones, Mowry Shale Cretaceous, Rocky Mountains, USA, J. Sediment. Res., 87, 366–387, https://doi.org/10.2110/jsr.2017.24, 2017.
Milliken, K. L. and Reed, R. M.: Multiple causes of diagenetic fabric anisotropy in weakly consolidated mud, Nankai accretionary prism, IODP Expedition 316, J. Struct. Geol., 32, 1887–1898, https://doi.org/10.1016/j.jsg.2010.03.008, 2010.
Milliken, K. L., Esch, W. L., Reed, R. M., and Zhang. T.: Grain assemblages and strong diagenetic overprinting in siliceous mudrocks, Barnett Shale Mississippian, Fort Worth Basin, Texas, USA, AAPG Bull., 96, 1553–1578, https://doi.org/10.1306/12011111129, 2012.
Milliken, K. L., Rudnicki, M., Awwiller, D. N., and Zhang, T.: Organic matter-hosted pore system, Marcellus Formation Devonian, Pennsylvania, USA, AAPG Bull., 97, 177–200, https://doi.org/10.1306/07231212048, 2013.
Mitchell, J. K.: The fabric of natural clays and its relation to engineering properties, in: Highway Research Board Proceedings, 35, https://onlinepubs.trb.org/Onlinepubs/hrbproceedings/35/35-047.pdf (last access: 28 June 2021), 1956.
Moeremans, R. E. and Singh, S. C.: Fore-arc basin deformation in the Andaman-Nicobar segment of the Sumatra-Andaman subduction zone: Insight from high-resolution seismic reflection data, Tectonics, 34, 1736–1750, https://doi.org/10.1002/2015TC003901, 2015.
Mondol, N. H., Bjørlykke, K., Jahren, J., and Høeg, K.: Experimental mechanical compaction of clay mineral aggregates – Changes in physical properties of mudstones during burial, Mar. Petr. Geol., 24, 289–311, https://doi.org/10.1016/j.marpetgeo.2007.03.006, 2007.
Morgenstern, N. R. and Tchalenko, J. S.: Microstructural observations on shear zones from slips in natural clays, in: Proceedings of The Geotechnical Confer, United States, 1, 147–152, https://trid.trb.org/view/124931 (last access: 28 June 2021), 1967.
Nakano, R.: On weathering and change of properties of tertiary mudstone related to landslide, Soils Found., 7, 1–14, https://doi.org/10.3208/sandf1960.7.1, 1967.
Neagu, R. C., Cartwright, J., and Davies, R.: Measurement of diagenetic compaction strain from quantitative analysis of fault plane dip, J. Struct. Geol., 32, 641–655, https://doi.org/10.1016/j.jsg.2010.03.010, 2010.
Nole, M., Daigle, H., Milliken, K. L., and Prodanović, M.: A method for estimating microporosity of fine-grained sediments and sedimentary rocks via scanning electron microscope image analysis, Sedimentology, 63, 1507–1521, https://doi.org/10.1111/sed.12271, 2016.
Nollet, S., Hilgers, C., and Urai, J.: Sealing of fluid pathways in overpressure cells: a case study from the Buntsandstein in the Lower Saxony Basin (NW Germany), Int. J. Earth Sci., 94, 1039–1055, https://doi.org/10.1007/s00531-005-0492-1, 2005.
Oelker, A.: Deformation properties of Boom Clay: Implementation of a multi-scale concept, Dissertation, Rheinisch-WestfälischeTechnische Hochschule Aachen, https://doi.org/10.18154/RWTH-2019-09913, 2019.
Oertel, G. and Curtis, C. D.: Clay-ironstone concretion preserving fabrics due to progressive compaction, Geol. Soc. Am. Bull., 83, 2597–2606, https://doi.org/10.1130/0016-7606(1972)83[2597:CCPFDT]2.0.CO;2, 1972.
Paxton, S. T., Szabo, J. O., Adjukiewicz, J. M., and Klimentidis, R. E.: Construction of an intergranular volume compaction curve for evaluating and predicting compaction and porosity loss in rigid-grain sandstone reservoirs, Am. Assoc. Petr. Geol. B., 86, 2047–2067, https://doi.org/10.1306/61EEDDFA-173E-11D7-8645000102C1865D, 2002.
Pickering, K. T., Carter, A., Andò, S., Garzanti, E., Limonta, M., Vezzoli, G., and Milliken, K. L.: Deciphering relationships between the Nicobar and Bengal submarine fans, Indian Ocean, Earth Planet. Sci. Lett., 544, 116329, https://doi.org/10.1016/j.epsl.2020.116329, 2020.
Pommer, M. E. and Milliken, K. L.: Pore types and pore-size distributions across thermal maturity, Eagle Ford Formation, South Texas, AAPG Bull., 99, 1713–1744, https://doi.org/10.1306/03051514151, 2015.
Prawirodirdjo, L., Bocl, Y., McCaffrey, R., Genrich, J., Calais, E., Stevens, C., Puntodewo, S. S. O., Subarya, C., Rais, J., Zwick, P., and Fauzi, R. M.: Geodetic observations of interseismic strain segmentation at the Sumatra subduction zone, Geophys. Res. Lett., 24, 2601–2604, https://doi.org/10.1029/97GL52691, 1997.
Rieke, H. H. and Chilingarian, G. V.: Compaction of argillaceous sediments, Dev. Petr. Sc., 41, 147–164, https://doi.org/10.1016/S0376-7361(06)80049-X, 1974.
Rosenberger, K., Underwood, M. B., Vrolijk, P., and Haines, S.: Data report: clay mineral assemblages in hemipelagic sediments entering the Sumatra subduction zone, IODP Sites U1480 and U1481, Expedition 362, Expedition, 362, 1–14, https://doi.org/10.14379/iodp.proc.362.204.2020, 2020.
Samsudin, M. S. F., Ariff, Z. M., and Ariffin, A.: Deformation behavior of open-cell dry natural rubber foam: Effect of different concentration of blowing agent and compression strain rate, AIP Conf. Proc., 1, 1–5, https://doi.org/10.1063/1.4981829, 2017.
Schmatz, J., Klaver, J., Jiang, M., and Urai, J. L.: Nanoscale morphology of brine/oil/mineral contacts in connected pores of carbonate reservoirs: Insights on wettability from Cryo-BIB-SEM, SPE J., 22, 1374–1384, https://doi.org/10.2118/180049-PA, 2017.
Schneider, J., Flemings, P. B., Day-Stirrat, R. J., and Germaine, J. T.: Insights into pore-scale controls on mudstone permeability through resedimentation experiments, Geology, 39, 1011–1014, https://doi.org/10.1130/G32475.1, 2011.
Sintubin, M.: Clay fabrics in relation to the burial history of shales, Sedimentology, 41, 1161–1169, https://doi.org/10.1130/G32475.1, 1994.
Terzaghi, K. and Peck, R. B.: Soil Mechanics. Engineering Practice, John Wiley and Sons, Inc., New York, ISBN: 0471086584, 1948.
Torres, M. E., Milliken, K. L., Hüpers, A., Kim, J. H., and Lee, S. G.: Authigenic clays versus carbonate formation as products of marine silicate weathering in the input sequence to the Sumatra Subduction Zone, Gechem. Geophy. Geosy., 23, 1–17, https://doi.org/10.1029/2022GC010338, 2022.
Ukar, E. and Cloos, M.: Cataclastic deformation and metasomatism in the subduction zone of mafic blocks-in-mélange, San Simeon, California, Lithos, 346, 105116, https://doi.org/10.1016/j.lithos.2019.06.018, 2019.
Underwood, M. B., Lawler, N., and McNamara, K.: Data report: standard mineral mixtures, normalization factors, and determination of error for quantitative X-ray diffraction analyses of bulk powders and clay-sized mineral assemblages, Proceedings of the International Ocean Discovery Program, 372, https://doi.org/10.14379/iodp.proc.372B375.201.2020, 2020.
Vasseur, G., Djeran-Maigre, I., Grunberger, D., Rousset, G., Tessier, D., and Velde, B.: Evolution of structural and physical parameters of clays during experimental compaction, Mar. Petr. Geol., 12, 941–954, https://doi.org/10.1016/0264-8172(95)98857-2, 1995.
Velde, B.: Compaction trends of clay-rich deep sea sediments, Mar. Geol., 133, 193–201, https://doi.org/10.1016/0025-3227(96)00020-5, 1996.
Vrolijk, P.: On the mechanical role of smectite in subduction zones, Geology, 18, 703–707, https://doi.org/10.1130/0091-7613(1990)018<0703:OTMROS>2.3.CO;2, 1990.
Wang, X., Jiang, Z., Jiang, S., Chang, J., Zhu, L., Li, X., and Li, J.: Full-scale pore structure and fractal dimension of the Longmaxi shale from the Southern Sichuan Basin: Investigations using FE-SEM, gas adsorption and mercury intrusion porosimetry, Minerals, 9, 543, https://doi.org/10.3390/min9090543, 2019.
Yagiz, S.: Overview of classification and engineering properties of shales for design considerations, in: Construction and Materials Issues, Houston, Texas, United States, 10–13 October 2001, 156–165, https://doi.org/10.1061/40591(269)16, 2001.
Zakaria, Z., Mohamad Ariff, Z., and Abu Bakar, A.: Monitoring deformation mechanism of foam cells in polyethylene foams via optical microscopy: Effect of density and microstructure, J. Cell. Plast., 54, 957–976, https://doi.org/10.1177/0021955X18795035, 2018.
Zhou, J., Shrotriya, P., and Soboyejo, W. O.: Mechanisms and mechanics of compressive deformation in open-cell Al foams, Mech. Mater., 36, 781–797, https://doi.org/10.1016/j.mechmat.2003.05.004, 2004.