the Creative Commons Attribution 4.0 License.
the Creative Commons Attribution 4.0 License.
 | 26 Oct 2022
Shear zone evolution and the path of earthquake rupture
Christie D. Rowe
James D. Kirkpatrick
Crustal shear zones generate earthquakes, which are at present unpredictable, but advances in mechanistic understanding of the earthquake cycle offer hope for future advances in earthquake forecasting. Studies of fault zone architecture have the potential to reveal the controls on fault rupture, locking, and reloading that control the temporal and spatial patterns of earthquakes. The Pofadder Shear Zone exposed in the Orange River in South Africa is an ancient, exhumed, paleoseismogenic continental transform which preserves the architecture of the earthquake source near the base of the seismogenic zone. To investigate the controls on earthquake rupture geometries in the seismogenic crust, we produced a high-resolution geologic map of the shear zone core mylonite zone. The core consists of ∼ 1–200 cm, pinch-and-swell layers of mylonites of variable mineralogic composition, reflecting the diversity of regional rock types which were dragged into the shear zone. Our map displays centimetric layers of a unique black ultramylonite along some mylonite interfaces, locally adding to thick composite layers suggesting reactivation or bifurcation. We present a set of criteria for identifying recrystallised pseudotachylytes (preserved earthquake frictional melts) and show that the black ultramylonite is a recrystallised pseudotachylyte, with its distribution representing a map of ancient earthquake rupture surfaces. Pseudotachylytes are most abundant on interfaces between the strongest wall rocks. We find that the geometry of lithologic interfaces which hosted earthquakes differs from interfaces lacking pseudotachylyte at wavelengths of ≳ 10 m. We argue that the pinch-and-swell structure of the mylonitic layering, enhanced by viscosity contrasts between layers of different mineralogy, is expected to generate spatially heterogeneous stress during viscous creep in the shear zone, which dictated the path of earthquake ruptures. The condition of rheologically layered materials causing heterogeneous stresses should be reasonably expected in any major shear zone, is enhanced by creep, and represents the pre-seismic background conditions through which earthquakes nucleate and propagate. This has implications for patterns of earthquake recurrence and explains why some potential geologic surfaces are favored for earthquake rupture over others.
- Article
(16065 KB) - Full-text XML
-
Supplement
(134739 KB) - BibTeX
- EndNote


The small-scale structure of fault zones, especially the local attitude and continuity of pre-existing structures, controls the seismogenic behavior of major fault systems (e.g. Fehler et al., 1987; Thurber et al., 2004; Kaven and Pollard, 2013). Earthquake relocation techniques enable imaging of earthquake distribution in time and space in active settings (Yang et al., 2011; Savage et al., 2017; Tan et al., 2021). However, it is usually not possible to be able to examine the overall structure of faults and shear zones from geophysical observations, particularly the distribution of seismic slip surfaces toward the base of the seismogenic zone (Wibberley et al., 2008). The architecture of faults at seismogenic depths is best revealed by geological field studies of exhumed structures (Sibson, 1979; Chester et al., 1993; Allen, 2005; Di Toro and Pennacchioni, 2005; Swanson, 2006; Lin et al., 2010; Allen and Shaw, 2011; Rowe et al., 2018a).
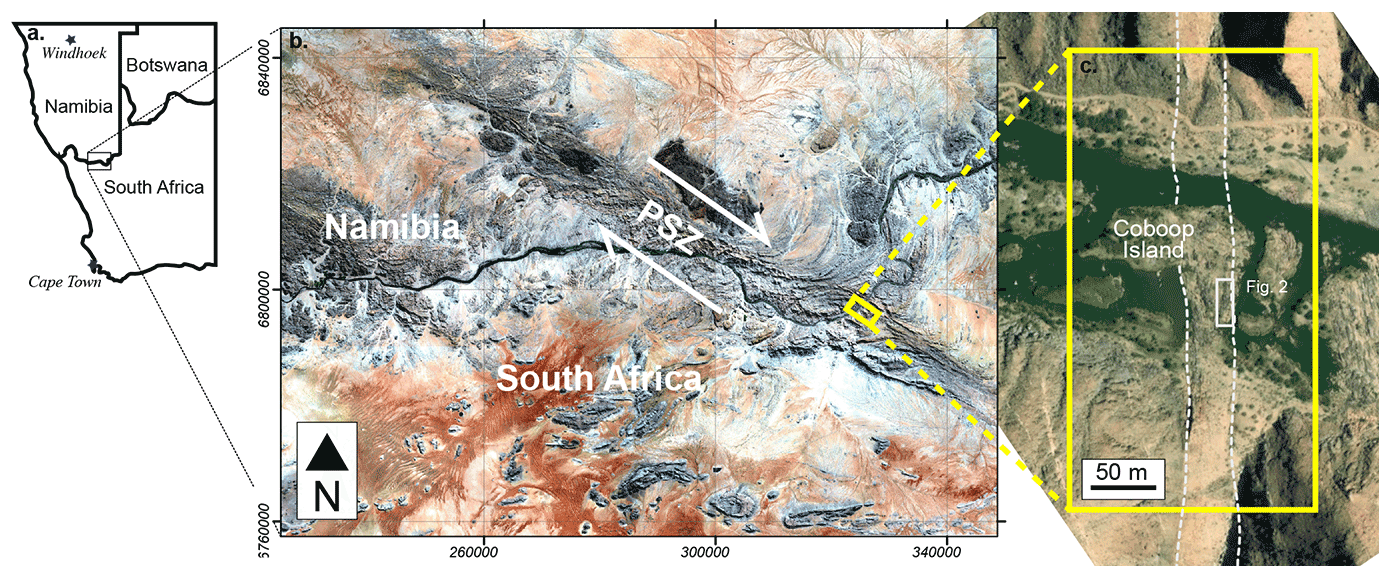
Figure 1(a) Location of study area in the region. (b) Copernicus Sentinel-2 (2016) imagery of the southeastern Pofadder Shear Zone (PSZ) striking NW–SE where it crosses the Orange River (Namibia–South Africa border). Yellow rectangle indicates the location of (c). (c) Coboop Island is only exposed at low water in the Orange River, so offers clean bedrock exposure. White dashed lines show approximate edges of shear zone core (Melosh et al., 2018, Fig. 2). White box shows location of high-resolution map of ultramylonite zone on the northeastern edge of the shear zone core (Fig. 2). Background image: ESRI World Imagery.
In continental strike-slip faults, earthquakes can propagate from the shallow brittle crust down to the transition zone, below which plastic flow dominates (Sibson, 1982, 1983). The largest earthquakes tend to nucleate near the transition zone and rupture through the entire seismogenic zone (Sibson, 1980). As a result of ductile deformation, the structure of the fault in the transition zone is distinct from the canonical brittle fault core characterised by one or more discrete principal slip surfaces surrounded by a damage zone (e.g. Chester and Logan, 1986; Caine et al., 1996; Faulkner et al., 2010; Savage and Brodsky, 2011) and is better described as a zone of distributed planar to anastomosing layering, differentiated by distinct mineralogy and fabrics (e.g. Burg and Laurent, 1978; Tobisch et al., 1991; Fitz Gerald and Stünitz, 1993; Melosh et al., 2018; Fagereng and Beall, 2021). Distinct lithologic banding is produced by material heterogeneity on scales from the grain scale (tens to hundreds of micrometers) to lithologic layering (tens to hundreds of centimeters), resulting in flow instabilities forming compositional banding (1 cm to tens of centimeters, Ishii, 1992; Walcott and Craw, 1993; Goodwin and Tikoff, 2002). These grain-scale to mesoscale fabrics act as guides for seismic waves (Lloyd et al., 2009). Field studies of pseudotachylyte-bearing shear zones show that, in some cases, pseudotachylyte fault veins are parallel to compositional layering, indicating that material heterogeneity may influence propagating earthquake ruptures as well (e.g. Swanson, 1988; Allen, 2005; Allen and Shaw, 2013; Campbell et al., 2019). Establishing how the evolution of compositional or rheological layering within high-strain shear zones develops and is distributed is therefore necessary to determine the controls on rupture propagation in the transition zone.
We use an extraordinary exposure of an ancient seismogenic strike-slip shear zone (Melosh et al., 2014, 2016, 2018) exhumed from the depth of the brittle–plastic transition, to investigate the interaction of shear zone structure with earthquake slip. Using highly detailed outcrop maps we test for spatial patterns connecting composition and grain size of layering, geometry of layer interfaces, and the occurrence of recrystallised and deformed pseudotachylytes, which are interpreted as paleoseismic slip surfaces. We find that the pseudotachylytes are not randomly distributed across the shear zone but are strongly associated with specific wall rock juxtapositions. Pseudotachylyte-bearing contacts have geometric characteristics that distinguish them from pseudotachylyte-absent contacts. We discuss the cause and effect relationships between seismic slip and fault rock evolution in the shear zone on co-seismic to interseismic timescales. We will argue that pseudotachylyte emplacement can result in alteration of pinch-and-swell geometry and that the interseismic viscous creep processes exerted some control on the architecture of the shear zone and developed the structures that hosted and guided seismic slip, ultimately controlling the strength and patterns of seismicity in this crustal-scale strike-slip shear zone.
The Pofadder Shear Zone is a NW–SE-striking, transcurrent, dextral shear zone, which can be traced nearly 500 km from southern Namibia into northwestern South Africa (Fig. 1; Joubert, 1974; Toogood, 1976; Coward, 1980; MacClaren, 1988). The shear zone was active for ∼ 37–57 Myr (Lambert, 2013) during the last of several regional deformation events that together broadly define the Namaqua Orogeny (Joubert, 1974; Macey et al., 2017). Mineral ages in the Namaqua–Natal Metamorphic Belt indicate that the Namaqua Orogeny comprised at least four distinct deformation events which occurred over a roughly 900 Myr period concluding ∼ 950 Myr ago, characterised by episodic plutonism and metamorphism (Macey et al., 2017). The Pofadder Shear Zone cuts the Richtersveld arc (a terrane within the Namaqua–Natal Metamorphic Belt), which contains Paleoproterozoic orthogneisses and paragneisses, metamorphosed at amphibolite facies and intruded by arc magmas (Macey et al., 2017). The Pofadder Shear Zone offset and transposed the peak metamorphic fabrics around 1 Ga (Lambert, 2013).
In the study area near Pofadder, South Africa (Fig. 1), the shear zone is hosted in a series of orthogneissic rocks (the “Pella Domain” of Macey et al., 2017) including pre-kinematic pink gneisses, grey gneisses, amphibolites, and some hydrothermally altered equivalents (Macey et al., 2017). The study area consists of an exposed shear zone core, which is composed of compositionally diverse mylonitic rocks and variably deformed pre- to syn-kinematic pegmatites (Lambert, 2013; Melosh et al., 2018). The exposure surface is on an island within the Orange River only exposed at low water and is subhorizontal with minimal topographic relief (< 20 cm owing to fluvial erosion) and encompasses the ∼ 15 m wide layered mylonite–ultramylonite zone on the NE edge of the shear zone core (see Fig. 2 of Melosh et al., 2018).
Mylonite, ultramylonite, and pegmatite distinguished by different lithology and grain size form continuous pinch-and-swell layers and, locally, boudins. The mylonites are commonly isoclinally folded in upright folds with variably plunging axes. A strong subhorizontal rodding lineation is visible on mylonitic foliation surfaces, and the conical rotations of lineations around fold hinges in the mylonites indicate rolling hinges and lineation rotation during differential shearing between different mylonite layers (e.g. Melosh et al., 2018) (Fig. 2; see the Supplement for measurement distribution on map). Evidence of paleoseismicity in the form of pseudotachylytes (Kirkpatrick and Rowe, 2013; Melosh et al., 2014) and dynamic breccias (Melosh et al., 2016) is abundant in the mylonitic fault core. Both the pseudotachylyte and dynamic breccias have been shown to be mutually crosscutting with mylonitic foliations, indicating earthquake rupture and plastic creep were broadly coeval during the later stages of shear zone activity at temperatures of 400–500 ∘C, consistent with the deepest seismogenic zone or transition zone (Melosh et al., 2014, 2016, 2018).
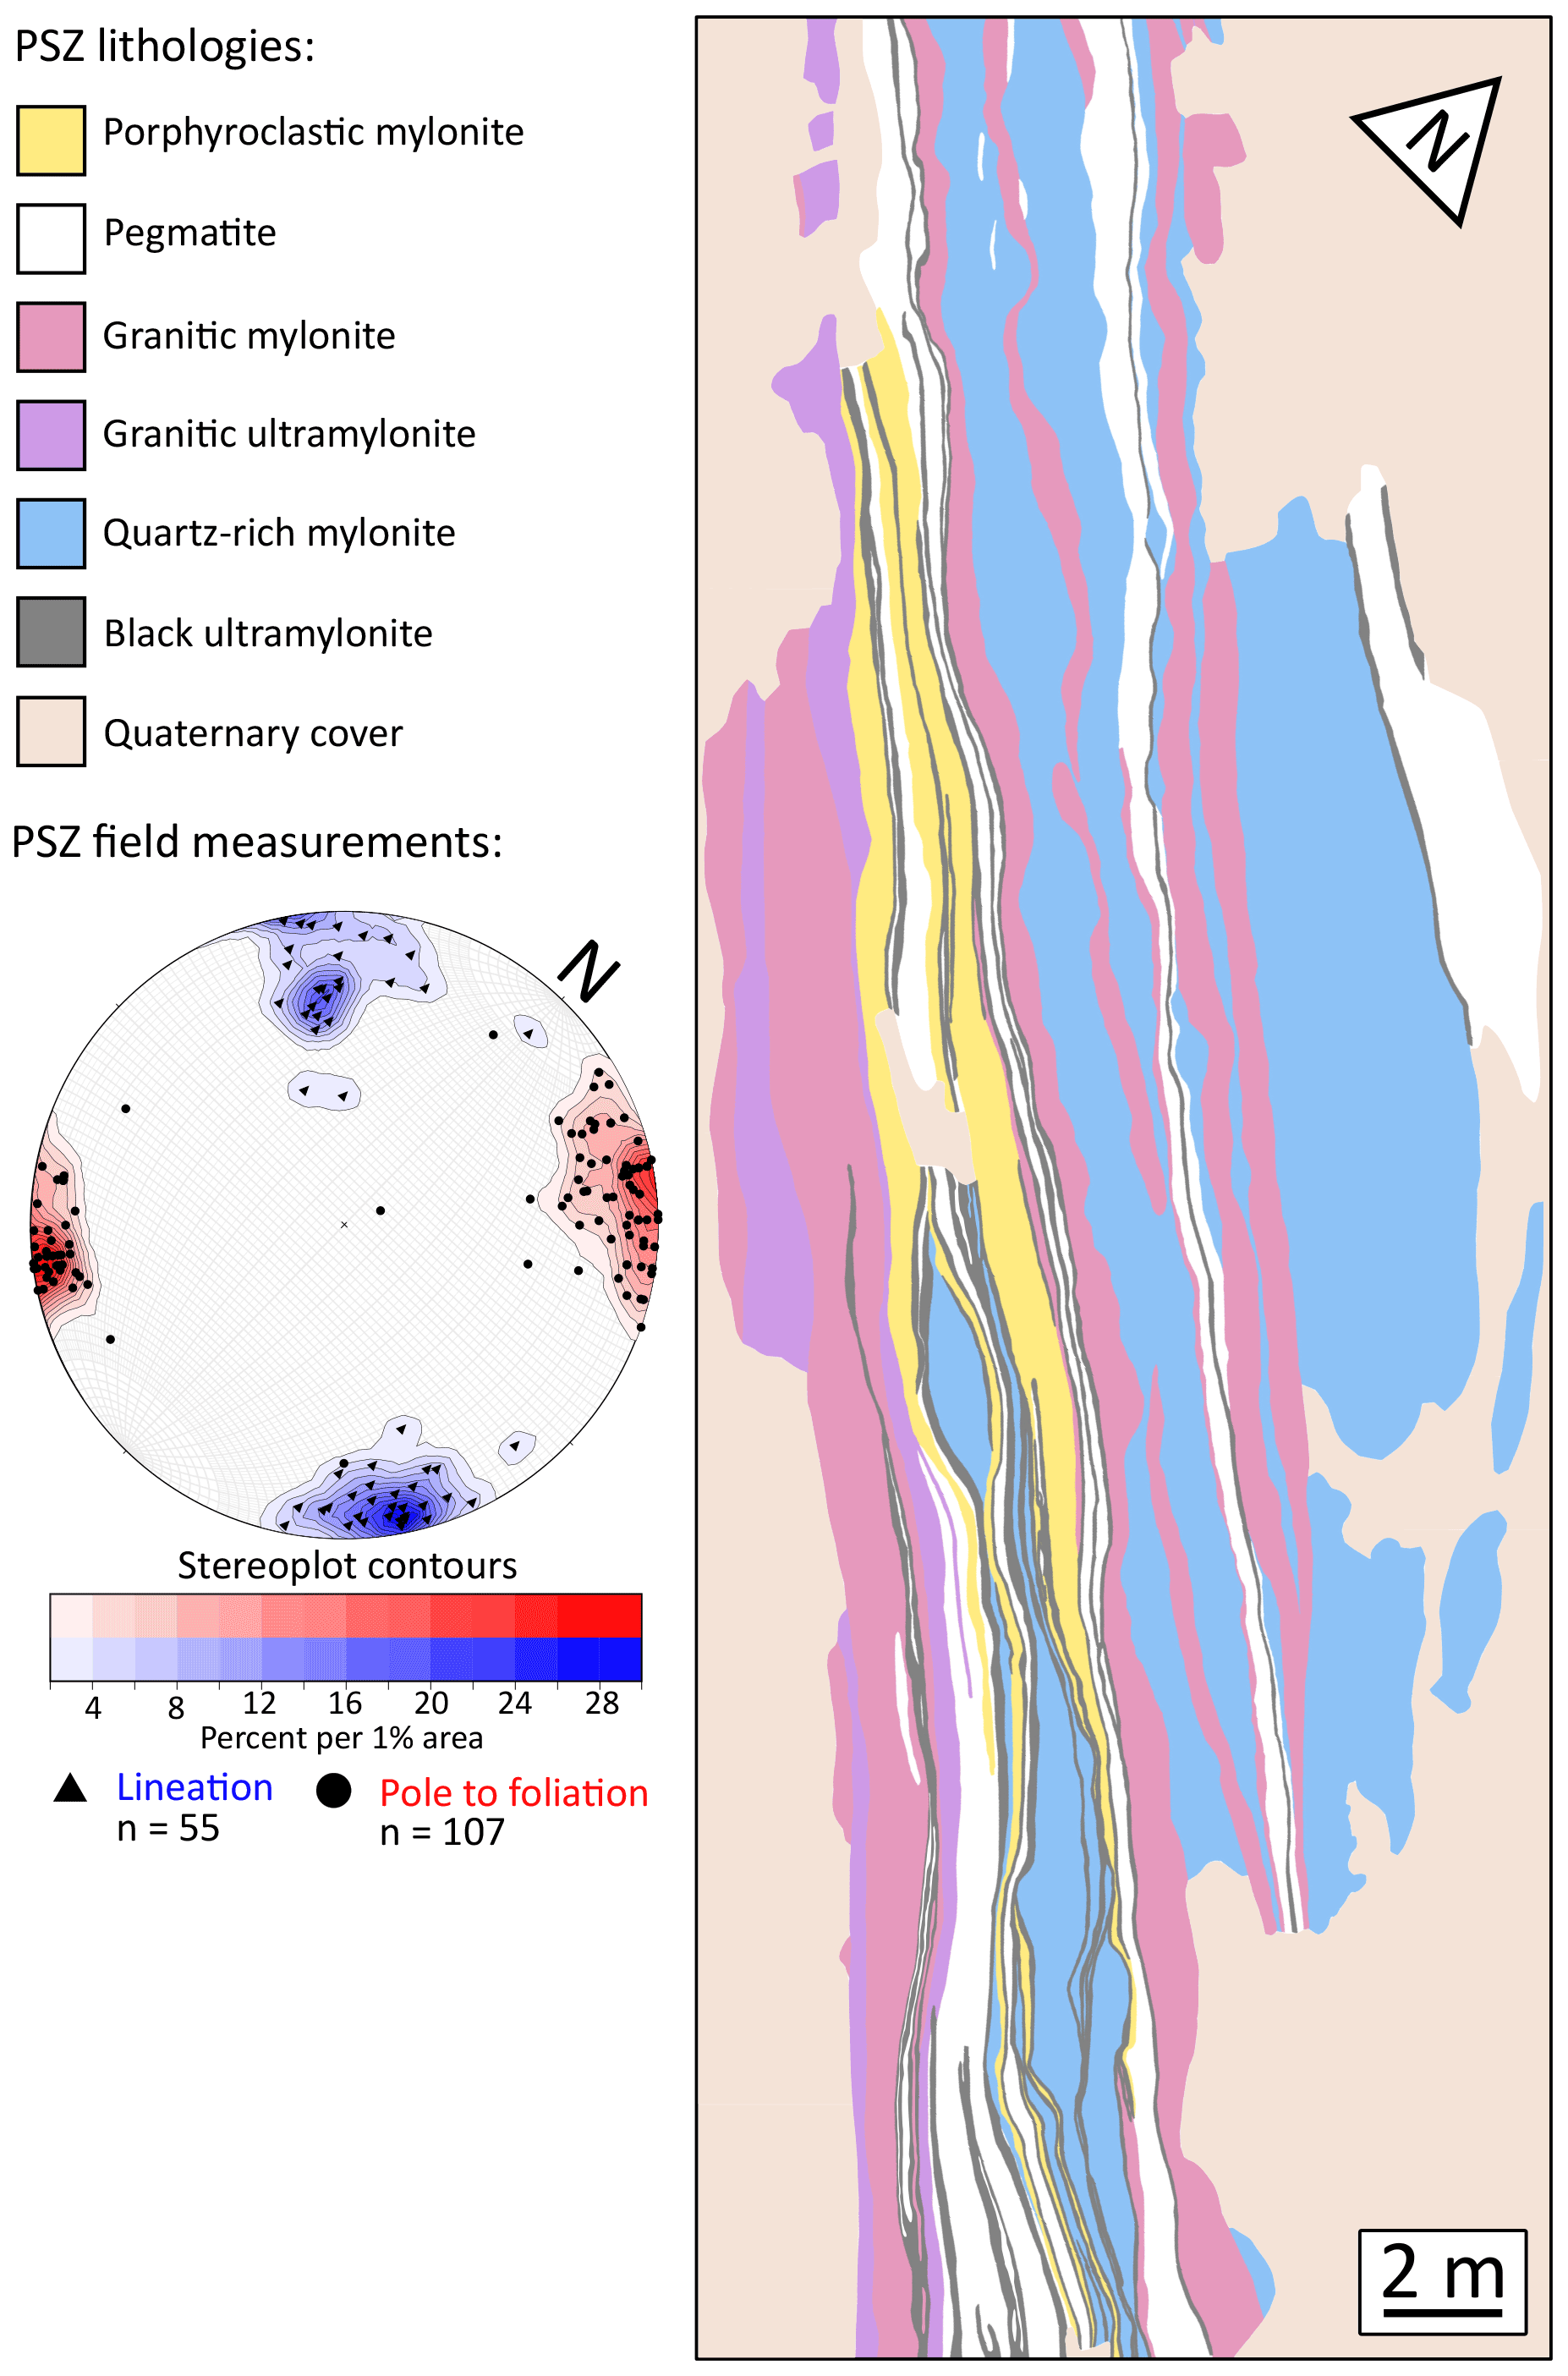
Figure 2Map of the Coboop Island fault core showing major mylonite units and Quaternary cover. Stereonet is rotated to match the orientation of the map and contains contoured measurements of poles to foliation (circles) and lineations (triangles). High-resolution basemap and map structural measurements are included as a Supplement.
Previous work in the Pofadder Shear Zone provided a general description for the mylonitic core (area in yellow box, Fig. 1; Melosh et al., 2014, 2016, 2018). We selected a small area of nearly uninterrupted, smooth, river-polished exposure for a detailed study within the mylonitic core to focus on the occurrence of pseudotachylyte and its contact relationships. In this section we present methods for small-scale field mapping and describe the field and microstructural characteristics of the rocks, from which we developed a simplified descriptive scheme for comparing the different mylonites. We then present the arguments supporting recognition of one ultramylonite type as recrystallised pseudotachylyte and use this identification to gain insight into the seismogenic architecture of the shear zone.
3.1 Methods
The mineralogy and fabric of the Pofadder Shear Zone mylonites were documented on multiple scales: ∼ 1 cm–10 m scales were mapped in the field on drone photography, and micrometer to millimeter scales were mapped using optical and electron microscopy.
Field mapping
For field mapping, we used a DJI Phantom 3 drone flown at 1.5–15 m altitude and a handheld DSLR camera to collect high-resolution images of the outcrop. AGIsoft Photoscan Pro was used to combine the photos into a digital elevation model with draped composite photographs, from which a rectified, georeferenced horizontal orthophoto was extracted. We exported subsets of the orthophoto onto tablets onto which we mapped in the field at a scale of 1:175. We mapped field-classified rock types onto the orthophotos (pegmatites, mylonites, and ultramylonites). The scale of completion of the maps, for lithologically distinct bodies and contacts, is ∼ 1 cm. Due to low relief (locally < 20 cm), outcrop surface roughness was neglected as the rectified orthophoto closely approximates a horizontal slice through the geologic structures, containing the average slip vector. Field maps were digitised in ArcGIS from the georeferenced orthophotos. Each contact was classified according to the units it juxtaposed and the presence or absence of earthquake-indicator features such as pseudotachylyte for subsequent geometric analysis. We sampled each rock type redundantly throughout the field area for microstructural analysis.
Microstructural component mapping
A combination of microphotography and image analysis was used to describe lithologic and textural characteristics of different components of the mylonites on a thin-section scale in order to compare the grain-scale mineralogy and structure. We used Microsoft Research's Image Composite Editor (ICE) to create composite photomicrographs from optical images and scanning electron microscope (SEM) backscattered electron (BSE) images collected using a Phillips XL30 SEM (using 15 keV and spot size 30) to create high-resolution grain boundary maps. We divided the thin sections into four major components and determined the relative area of the thin sections comprised of each component using both optical and electron microscopy (Bruker Quantax energy dispersive X-ray microanalysis system, EDS) in tandem to identify the sub-30 µm matrix phases. Textural and mineralogical data for all samples at all scales were estimated from a 2D sample region and do not necessarily correspond to volume percent of the rock.
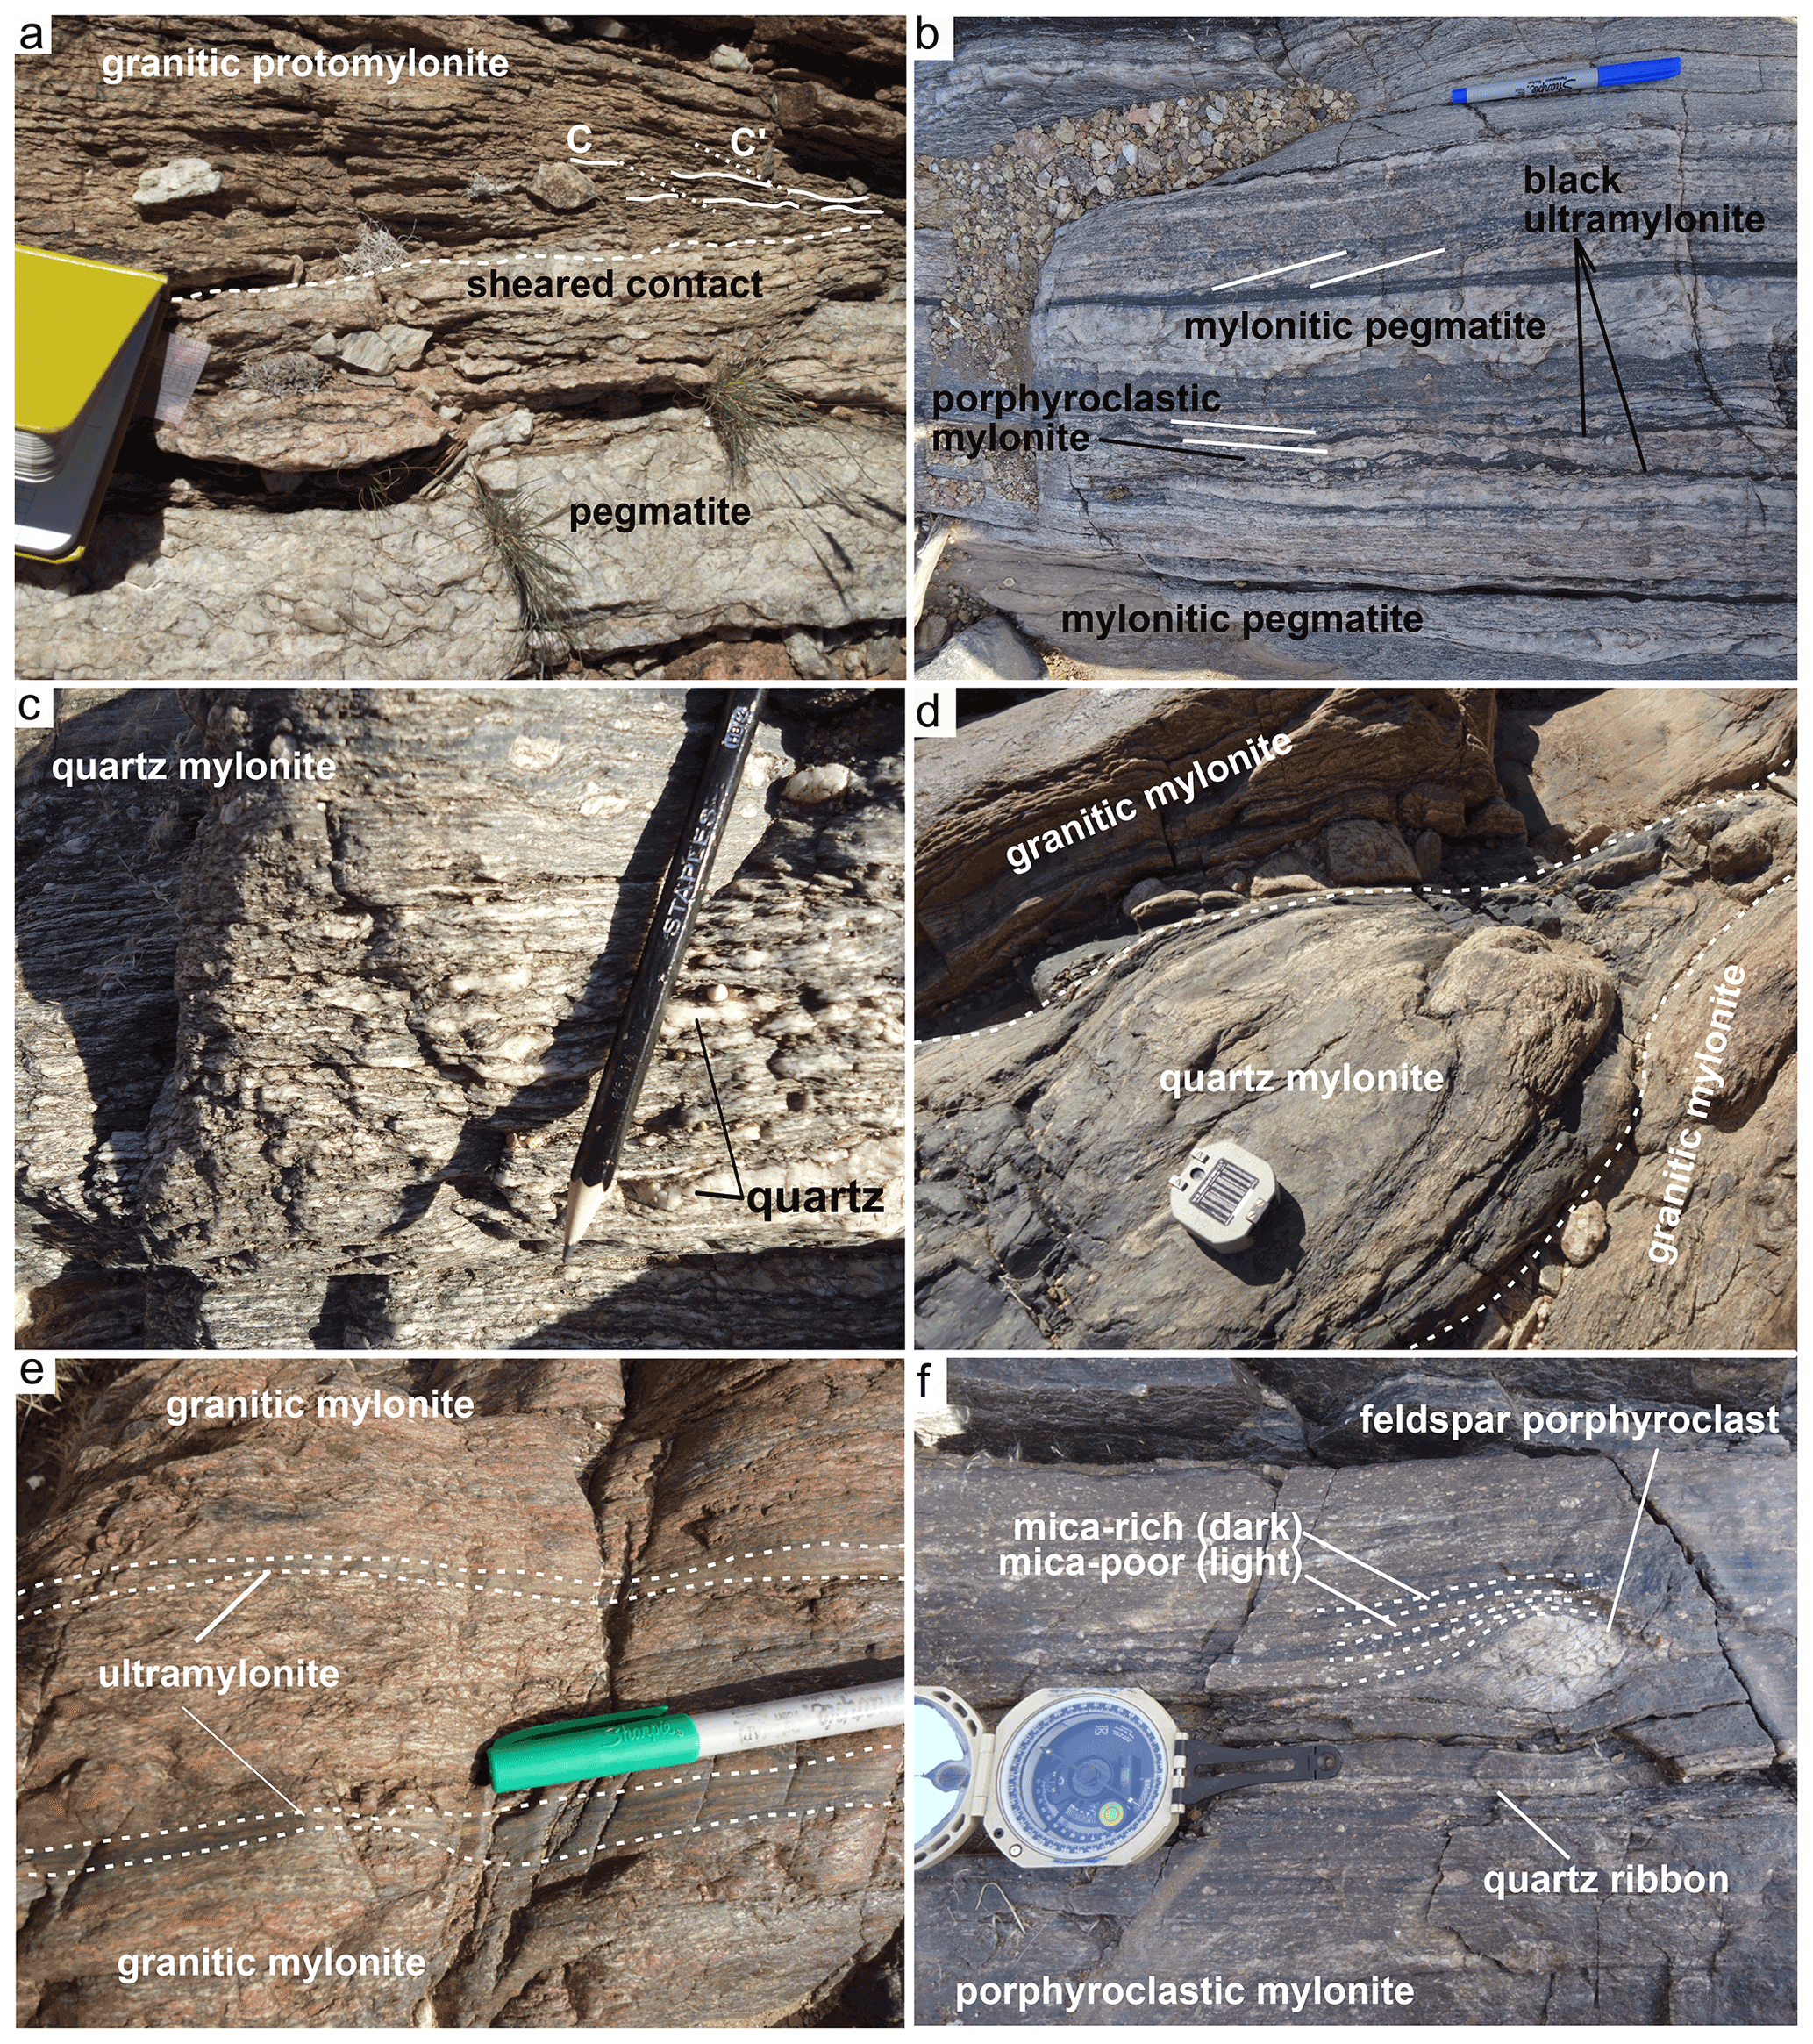
Figure 3Field photographs of lithologies found in the Coboop Island shear zone core with selected layer interfaces indicated with dotted lines. All photos oriented with NW to the right and SE to the left. (a) Granitic protomylonite with sheared intrusive pegmatite contact. Field notebook edge is 12 cm. (b) Layers of mylonitic pegmatite, porphyroclastic mylonite, and black ultramylonite crosscutting foliation at low angle (white lines). Pen is 10 mm wide. (c) Quartz-rich mylonite with strongly aligned and tailed quartz aggregates, interlayered with aluminosilicate-rich matrix. Pencil is 8 mm wide. (d) Boudinaged quartz-rich mylonite contained between layers of granitic mylonite. Compass is 70 mm wide. (e) Granitic mylonite cut by granitic ultramylonite horizons. Pen is 10 mm wide. (f) Porphyroclastic mylonite with feldspar porphyroclast derived from pegmatite protolith, wrapped by foliation layers of variable mica content. Compass is 70 mm wide.
3.2 Pofadder Shear Zone mylonites
The shear zone core contains layers of mylonitic rocks ranging from several centimeters to meters in thickness, of varying mineralogy, grain size, and fabric. For this study we focused on a small area (∼ 960 m2) in order to map at sufficiently high resolution to resolve the thinnest layers of interest (∼ centimeter-scale thickness). Further subdividing the lithologic classifications of Melosh et al. (2018), we mapped weakly to moderately foliated pegmatite, quartz-rich mylonite, granitic mylonite and ultramylonite, porphyroclastic mylonite, and black ultramylonite (Figs. 2 and 3). We also present the mineralogical and textural characteristics of a coarser granitic protomylonite that is abundant along the shear zone core edges ∼ 5 m south of the mapping area to elucidate the progression of mylonitisation of the granite wall rock.
Pegmatite, granitic mylonite, and quartz-rich mylonite form foliation-parallel pinch-and-swell layers (Fig. 2), locally separating into boudins. Porphyroclastic mylonite forms pinch-and-swell layers 40–90 cm thick and occurs primarily in contact with pegmatite. Black ultramylonite forms layers averaging ∼ 6 cm thick bands (locally in composite layers containing wall rock selvedges up to ∼ 50 cm) which are commonly found along interfaces between other lithologies. Individual layers exhibit thickness variation along-strike (e.g. Fig. 3b), while thick composite lenses of black ultramylonite are discontinuous (Fig. 2; see full photo stitch of map area in the Supplement). The interfaces between lithologically and/or texturally distinct layers are sharp, smooth, and undulating, sometimes displaying a zone a few centimeters wide of enhanced foliation within the layer on one or both sides of the interface but without lithologic mixing. We describe the major mineralogy and fabric of each lithology below.
3.2.1 Pegmatite
Undeformed pegmatites are primarily composed of ∼ 2–5 cm white albitic feldspar crystals which make up approximately ∼ 90 % of the rock and occasional 1–2 cm quartz crystals and biotite clusters which make up the remaining ∼ 10 % (Fig. 3a). Different pegmatite layers display different degrees of foliation intensity, consistent with syn-shearing intrusion along foliation (Lambert, 2013). The foliation is defined by alignment of the long axes of all mineral grains, increase in the aspect ratio of feldspar and quartz grains, and reduced grain size compared to unfoliated pegmatites (Fig. 3b). Coarse (1–2 cm) mica grains are observed in weakly foliated pegmatite layers but are absent in moderately to strongly foliated pegmatites. The pegmatites are so coarse-grained that a small number of crystals can be observed in a thin section, so this rock type was not included in the microstructural analysis.
3.2.2 Quartz-rich mylonite
Quartz-rich mylonite has a metapelitic composition, dominated by alternating bands of quartz and aluminosilicates defining the foliation (Fig. 3c) which imparts a cleavage to the rock (Fig. 3d). The long axes of crystals and quartz aggregates are parallel with one another and the edges of the bands. The aluminosilicate-rich layers form pinch-and-swell structures between elongate quartz ribbons. Quartz ribbons are 2 to 5 mm thick, formed from either very fine (∼ 10 µm) equigranular crystals or elongate ribbon-quartz grains (> 2 mm), exhibiting sweeping undulous extinction. Mica-rich bands have a similar thickness to the quartz ribbons and are composed of extremely fine-grained quartz and pinite (< 5 µm) with occasional remnant coarser muscovite, sillimanite, and cordierite grains (10–50 µm) (Fig. 4a and b). Slight deformation of pinite pseudomorphs after cordierite is interpreted as evidence for fabric development pre- to syn-retrogression (Fig. 4a and b).
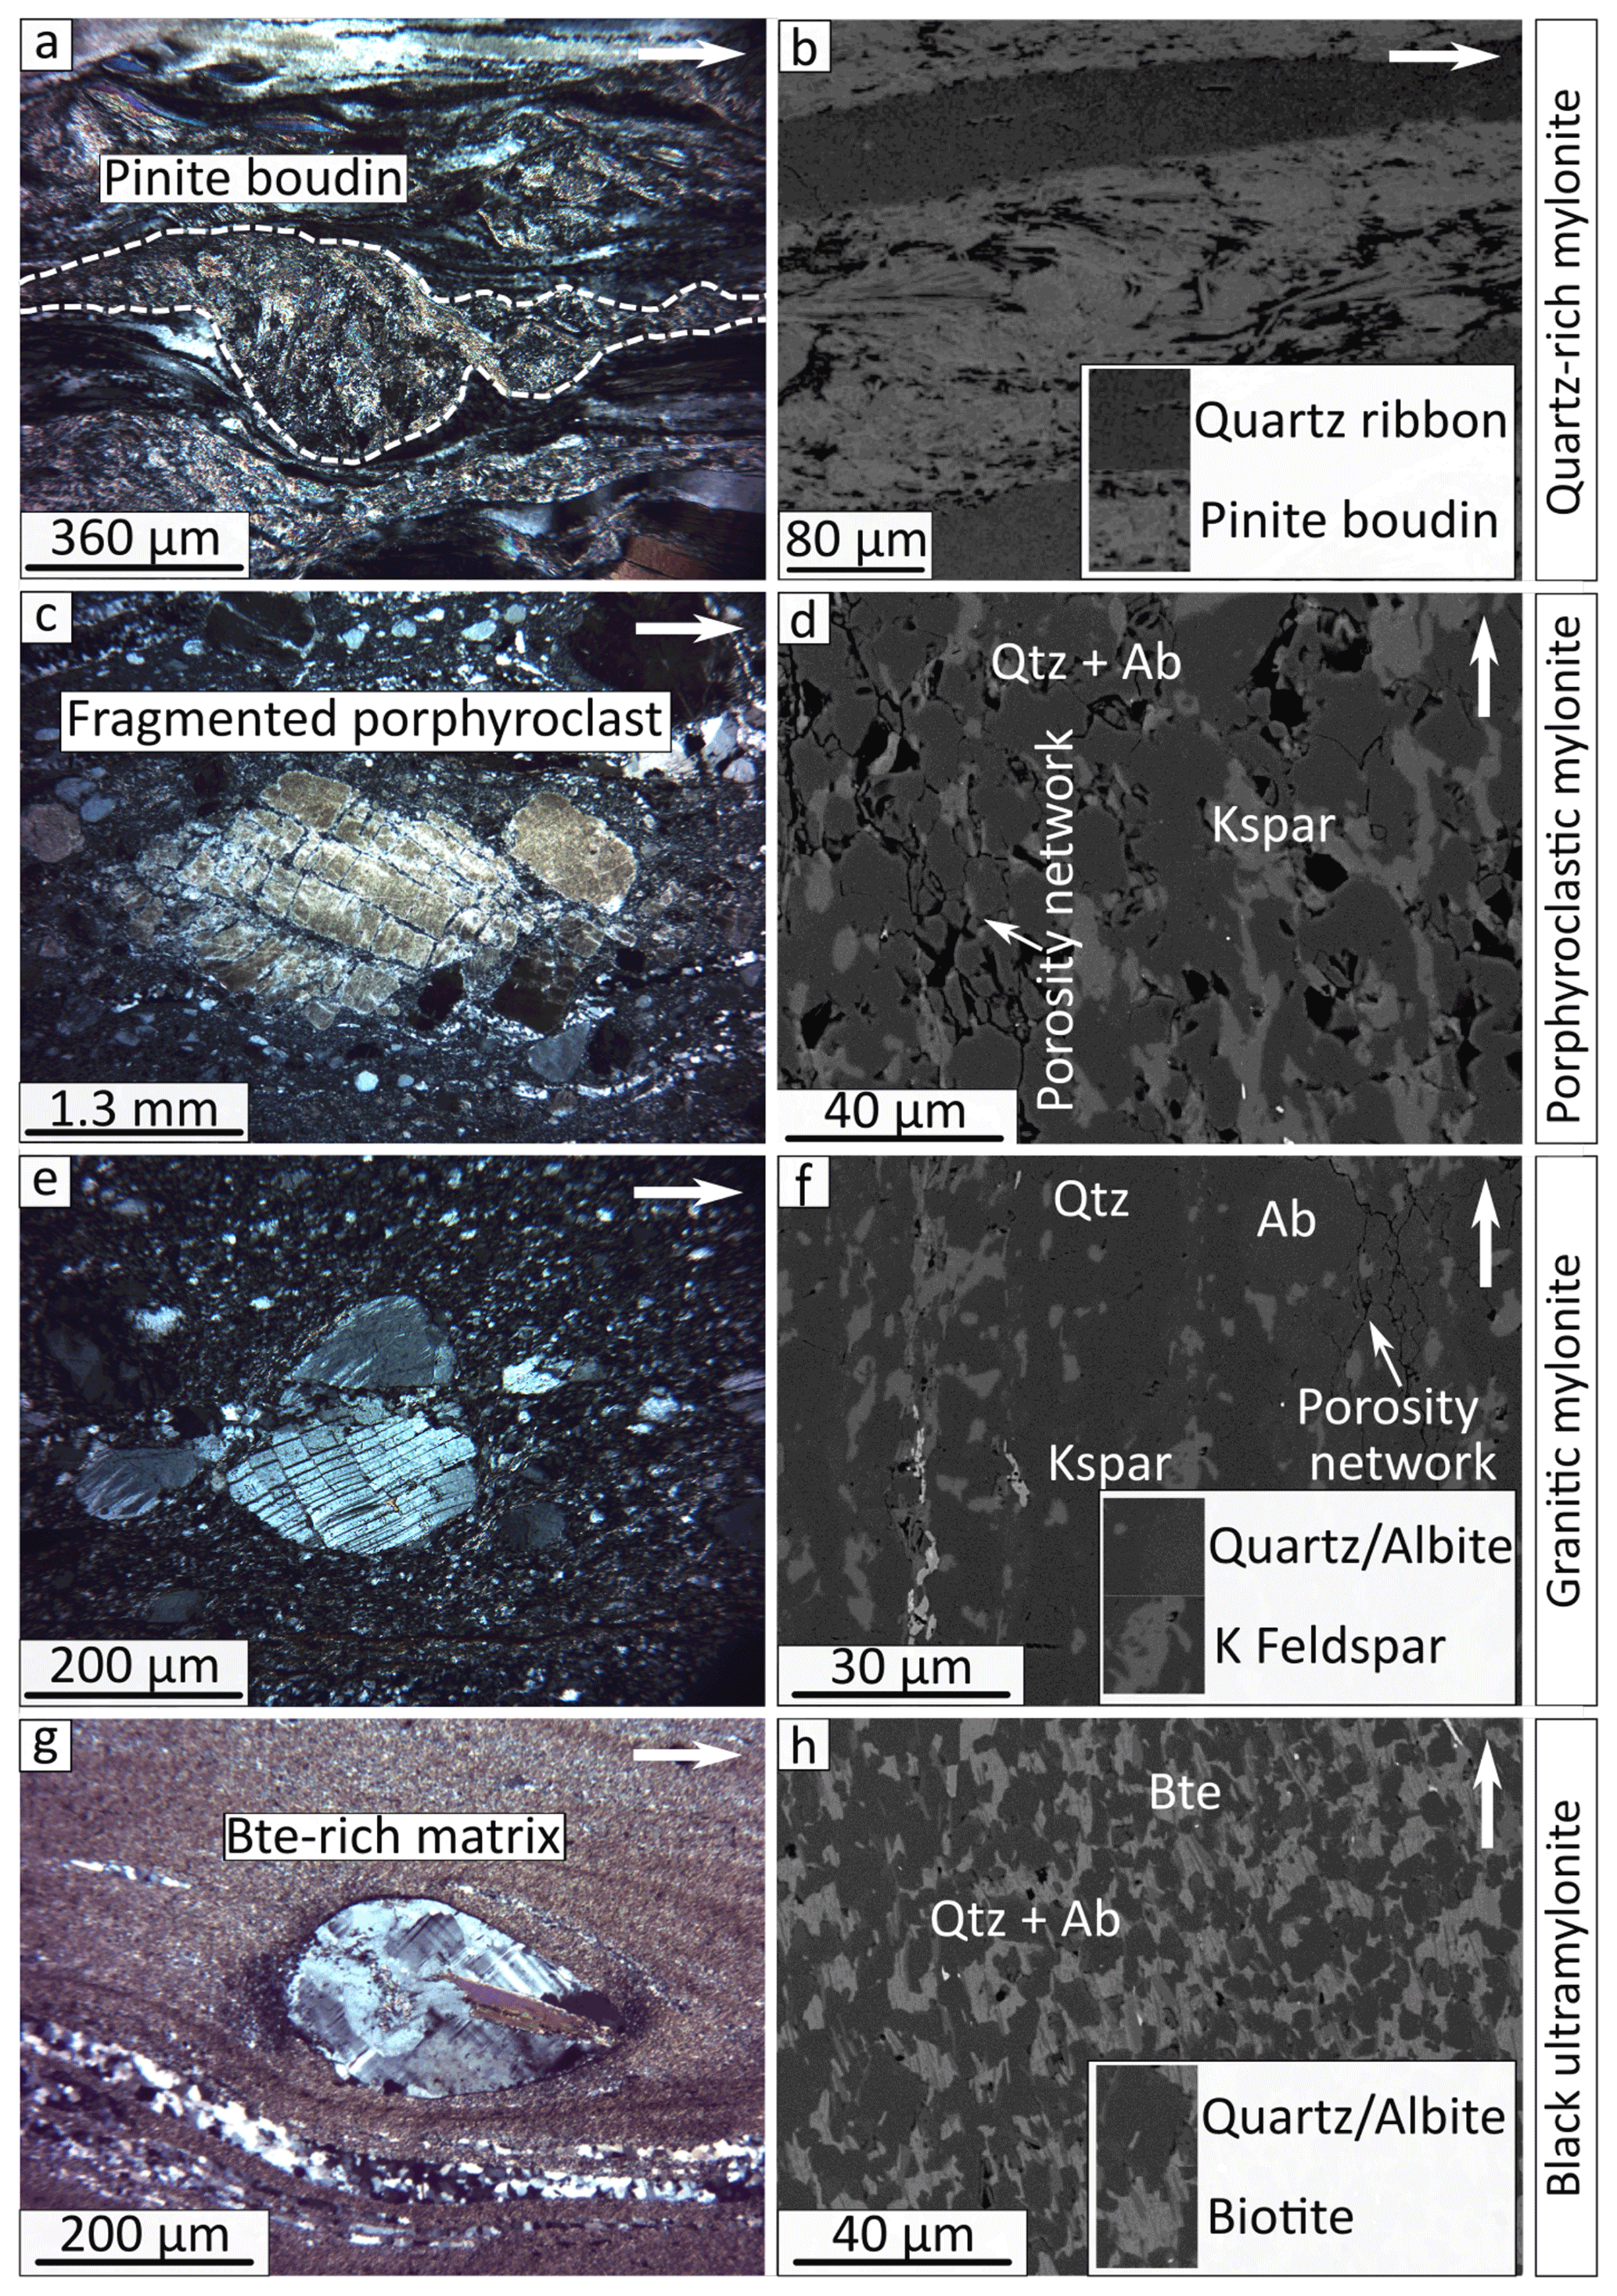
Figure 4Characteristic microstructure of different Pofadder mylonites (left), with BSE image of fine-grained matrices (right). (a) Pinite pseudomorphing boudinaged cordierite in quartz-rich mylonite. (b) Pinite band bounded by quartz ribbons. (c) Large fragmented porphyroclast of sericite-altered feldspar in porphyroclastic mylonite. (d) Quartz and/or albite (darker grey), and potassium feldspar (medium grey) in the matrix of porphyroclastic mylonite. Intergranular porosity is black. (e) Fragmented plagioclase porphyroclast in granitic mylonite. (f) Quartz (darkest grey), albite (dark grey) and potassium feldspar (light grey) composing granitic ultramylonite matrix. Intergranular porosity is black and muscovite is white. (g) Rounded porphyroclast in black ultramylonite. (h) Well-distributed biotite (light grey) and quartz and/or albite (dark grey) matrix in black ultramylonite. Intergranular porosity is black. Thin-section orientation is indicated with a white arrow directed to the NW in each panel.
3.2.3 Granitic mylonite and ultramylonite
Mylonitic rocks of potassic granitic composition (pink orthogneisses), which are the locally predominant wall rock lithology at our study site, contain deformation fabrics that vary from protomylonitic outside the shear zone core to mylonitic and ultramylonitic within it (Fig. 3a, d, and e). The mylonitic fabric is defined by millimetric layers of parallel elongated feldspar and quartz. The shear surface foliation (C) is dominant, but locally S-C or C-C' fabrics occur (e.g. Fig. 3a). Monomineralic quartz layers 100–1000 µm thick are common, containing equigranular grains with abundant subgrains (subgrain size varies from ∼ 10 µm in the ultramylonite to ∼ 35 µm in the protomylonite). The majority of the porphyroclasts are σ and δ clasts of potassium feldspar or, less commonly, quartz (Fig. 4e) and are dominantly fragmented showing little evidence of crystal plastic deformation. Rare biotite porphyroclasts are ∼ 1–5 mm in size. A strongly lineated and foliated matrix of ∼ 4–6 µm quartz, albite, potassium feldspar, and muscovite is present in the mylonite and dominant in the ultramylonite. Ultramylonite displays sub-millimetric tabular straight to gently wavy color banding and is locally translucent (Fig. 3e). Weathered surfaces and fresh surfaces of mylonite are pink to light greyish pink, whereas fresh surfaces of ultramylonite are aphanitic and dark mauve. Protomylonites display a rough weathered surface (Fig. 7a), and ultramylonites are always very smooth (Fig. 3e).
3.2.4 Porphyroclastic mylonite
Porphyroclastic mylonite has an aphanitic matrix with abundant large (up to centimetric) white feldspar porphyroclasts (Fig. 3b and f). It is usually closely associated with pegmatite layer contacts (Fig. 3b). A lineation is defined by elongate feldspar crystals (mainly plagioclase, with less abundant potassium feldspar, < 1–110 mm) and rare quartz crystals. The matrix is black to greyish green on weathered surfaces, and light grey to light pink on fresh surfaces (Fig. 3f). Abundant 80–500 µm thick quartz ribbons are occasionally folded and are composed of ∼ 30 µm equigranular grains with abundant subgrains. The majority of porphyroclasts are plagioclase feldspar with minor potassium feldspar and, rarely, quartz, forming σ and δ clasts which are commonly fragmented. Fragmented feldspar porphyroclasts contain networks of fine-grained mica within the fracture planes indicative of solution-assisted breakdown (Fig. 4c; Kerrich et al., 1980, 1981). The matrix is composed of ∼ 3–10 µm grains of quartz ± albite ± potassium feldspar ± muscovite (Fig. 4c and d). Isolated pores and pore sheets are observed in the matrix (Fig. 4d; cf. Gilgannon et al., 2021).
3.2.5 Black ultramylonite
Black ultramylonite has a black aphanitic matrix containing well-rounded < 1–2 mm feldspar and quartz porphyroclasts (Fig. 3b). The matrix is very mica-rich except for halos around the porphyroclasts, which generally have poorly developed or no tails (Fig. 4g and h). Rarely, porphyroclasts are internally fractured. Discontinuous pockets of fine-grained quartz or granitic mylonite are 500–1000 µm thick, discontinuous along-strike (< 15 mm long), and often folded within the matrix. These pockets are composed of either ∼ 30 µm equigranular quartz crystals or occasional porphyroclasts within a foliated mylonitic matrix. Compositional banding > 100 µm wide is present in the matrix due to varying proportions of biotite ± muscovite ± quartz ± albite and foliation-parallel strings of very fine-grained ilmenite, with matrix grain sizes of ∼ 5 µm (varying from 1 to 15 µm; Fig. 4h). Generally, micas are near-homogeneously distributed within the matrix, and pores are small (a few micrometers) and isolated. Black ultramylonite forms thin layers both within other rock types and along contacts (Fig. 3). Multi-layered accumulations of black ultramylonite are observed where layers converge, producing thicker patches of composite tabular black ultramylonite layers separated by thin or discontinuous lenses of local wall rock. This is the only lithology observed crosscutting foliation planes of other mylonites, although most often the foliation in adjacent mylonite bands is wavy and parallel (Fig. 3b).
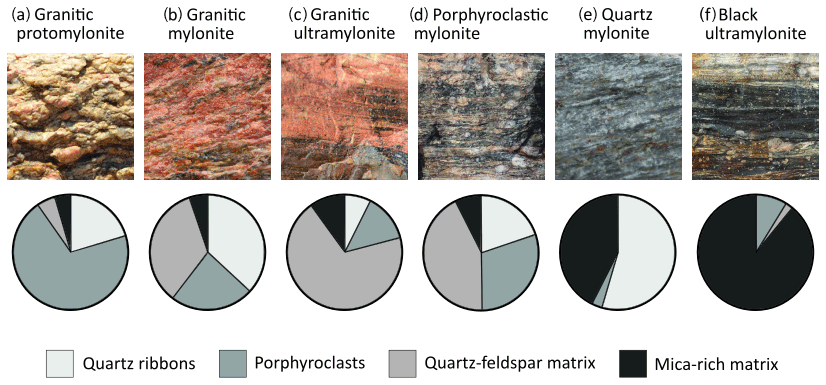
Figure 5The six rock types which (with pegmatite) dominate the map area, with example photos and pie charts demonstrating the relative proportions of coarse grains (quartz ribbons and porphyroclasts) and fine matrix (divided into quartz–feldspar-rich and mica-rich). Each example photo has a field of view of 3 cm.
3.3 Microstructural components of mylonites
In order to relate the field-scale characteristics of the mylonites to mineralogy and microstructure related to deformation behavior, we identified common components occurring in several rock types. We estimated the relative modes of these components using image analysis of photomicrograph mosaics for representative samples. The components are as follows:
-
Quartz ribbons – monomineralic areas of homogeneous recrystallised quartz crystals;
-
Porphyroclasts – coarse-grained mono-crystalline clasts surrounded by finer-grained material; includes quartz, feldspars, and rarely micas;
-
Quartz–feldspar-rich matrix – micrometer-scale polymineralic matrix which constitutes the groundmass surrounding porphyroclasts;
-
Mica-rich matrix – matrix with approximately half mica and half quartz and/or feldspar.
Figure 5 reports the relative abundance of the four components in representative thin sections of six rock types. These component modes are consistent with fault rock naming schemes for ductily deformed rocks (e.g. Sibson, 1977). Amongst the granitic mylonites, the trend with decreasing grain size (proto → ultramylonite; Fig. 5a–c) is shown by the decrease in porphyroclast content from 70 % down to 13 % of the rock and a corresponding increase in matrix from 10 % up to 80 % of the rock. The quartz ribbon content appears to increase between granitic protomylonite to granitic mylonite but then decrease to 8 % in the ultramylonite, possibly due to more efficient phase mixing at the smaller grain size incorporating the quartz into the background matrix (e.g. Cross and Skemer, 2017). The porphyroclastic mylonite (Fig. 5d) is similar to the granitic mylonite, with just under half the rock dominated by a very fine matrix but more abundant quartz ribbons in the granitic matrix and higher proportion of porphyroclasts in the porphyroclastic mylonite. The large porphyroclasts which give the rock its name are notable since they reflect the exceptional bimodality of grain size in the porphyroclastic mylonite, requiring a coarse-grained or porphyroclastic parent rock. The composition and its common occurrence along the margin of pegmatites (dominated by coarse albite and quartz) suggest that the porphyroclastic mylonite is mostly derived from the pegmatite. The quartz-rich mylonite (Fig. 5e) is distinctive, composed of nearly equal parts mica-rich matrix and quartz ribbons. The black ultramylonite (Fig. 5f) is overwhelmingly mica-rich with low (< 10 %) porphyroclast content. The black ultramylonite will be discussed further in Sect. 3.4.
3.4 Identifying recrystallised pseudotachylyte
For this study, it is necessary to identify the surfaces within the Pofadder Shear Zone core which can be shown to have hosted earthquakes. Due to the setting of our study outcrop near the base of the seismogenic zone, the pseudotachylytes formed in this environment are overprinted to some degree by crystal plastic deformation to form ultramylonites (e.g. Passchier, 1982; Clarke and Norman, 1993; Takagi et al., 2000; Price, 2012; Kirkpatrick and Rowe, 2013).
3.4.1 Microstructural identification criteria
We have adapted the descriptive criteria developed by previous authors to develop an identification scheme for recrystallised pseudotachylytes in our field area and use this to distinguish which ultramylonite bands can be shown to represent paleo-earthquake slip surfaces. These criteria are based on the observation that ultramylonites are defined by grain size and matrix proportion (Sibson, 1977), but rocks which develop these attributes may arrive here by two different pathways: one by dynamic grain size reduction from mylonites during crystal plastic flow and the other by coarsening and aligned growth from pseudotachylyte (White et al., 1980; Passchier, 1982; Bestmann et al., 2012). The mineralogical and compositional fractionation effects of melting and distinct contact geometries preserve the difference in the histories of the ultramylonites (Kirkpatrick et al., 2009; Price, 2012; Kirkpatrick and Rowe, 2013).

Figure 6Pseudotachylyte/black ultramylonite microstructures. Numbers in circles highlight microstructural identification criteria listed in the text. (a) Flow folds (2) including eddies around polycrystalline (7) and quartz (8) survivor clasts in a layered biotite-rich/quartz matrix. (b) Isotropic pseudotachylyte (1) sharply cross cuts (10) grain shape preferred orientation in granitic mylonite layer (3). Note the colors are skewed toward brighter interference colors because the section is slightly thicker than 30 µm, which emphasises the crystallographic preferred orientation. (c, d) Same field of view; (c) is non-polarised transmitted light and (d) is cross-polarised. Embayed feldspar survivor grain (8) with mantle of feldspar-rich matrix (9) interpreted as partially melted and dragged along flow banding (2; toward the right side away from the grain) forming a tail of quartz-enriched pseudotachylyte within the mixed biotite–quartz matrix (1). (e, f) SEM backscatter images of granitic ultramylonite (e; same as Fig. 4f) and black ultramylonite (f; same as Fig. 4h) matrices. Interconnected porous horizons (annotated with sparse dashed lines) and phase boundaries extending along multiple grain boundaries (annotated with solid lines; 6). Albite grains are delineated to increase contrast relative to quartz grains. (g) An injection vein is shown in hand sample.
Here we present a list of characteristics of ultramylonites which are consistent with, and potentially indicative of, pseudotachylyte origin. The characteristics apply to the matrix, the shape and composition of porphyroclasts, and the layer boundaries. We then compare a variety of distinct ultramylonite samples from our field area to this list:
-
homogeneous fine grain size in polymineralic matrix (e.g. Passchier, 1982; White, 1996; Ueda et al., 2008; Price et al., 2012) (Fig. 6a and c);
-
flow banding preserved as 100–1000 µm mineralogical layering, usually parallel to vein margins with discontinuous tight to isoclinal folds, and forming swirls and eddies around clasts and wall rock asperities (e.g. Sibson, 1975; Lin, 1994; White, 1996; Price et al., 2012);
-
ultramylonite layers may locally crosscut wall rock foliation;
-
bulk mineralogy of pseudotachylyte usually similar to, or more hydrous (mica-rich) than host rock and reflects preferential incorporation of hydrous host rock minerals (e.g. Magloughlin, 1989; Pittarello et al., 2012; Kirkpatrick and Rowe, 2013) (Fig. 6d);
-
spatially dispersed opaque minerals (e.g. Magloughlin, 2005; Kirkpatrick and Rowe, 2013);
-
grain-scale (micrometers) compositional banding and through-going, interconnected porous grain boundaries are either absent or rarely extend further than three to four grain boundaries (Fig. 6c and d; cf. Mancktelow et al., 1998);
-
polycrystalline (often rounded, and occasionally folded) wall rock fragments are commonly contained within the pseudotachylyte matrix preserving truncated pockets of wall rock microstructures (including foliation and quartz ribbons) (e.g. Figs. 4g and 6b, Sibson, 1975);
-
refractory minerals, stronger minerals, and those with weak cleavage are disproportionally represented in porphyroclast population (especially quartz, calcic feldspar relative to alkali; Sibson, 1975; Lin, 1999; Di Toro and Pennacchioni, 2004);
-
rims of survivor clasts that may coarsen and shear into fine-grained monomineralic mantles and tails during recrystallisation, but asymmetric tails are generally poorly developed (Fig. 6a; Price et al., 2012) ;
-
interfaces between pseudotachylyte and host rock may be sharp on a very small (∼ µm) scale (Fig. 6a; Price et al., 2012);
-
characteristic field geometries of pseudotachylyte (e.g. injection veins) which could form in gouge/cataclasite (Rowe et al., 2012; Kirkpatrick and Rowe, 2013) but which never form in mylonites may be preserved or inferable from deformed geometries (Fig. 6g).
Table 1Results of microstructural comparison of 14 samples (eight black ultramylonite and six granitic ultramylonite) to the recrystallised pseudotachylyte identification criteria. N/A indicates that it was impossible to assess the criterion in the thin section (e.g. sharpness of layer boundary when the thin section did not contain a layer boundary). Percentage match is calculated with N/A values removed.

3.4.2 Application of criteria for identifying relict pseudotachylyte
Dark-colored ultramylonites with aphanitic matrix in the Pofadder Shear Zone have previously been interpreted as recrystallised and deformed pseudotachylyte (Kirkpatrick and Rowe, 2013; Melosh et al., 2018). By charting the characteristics listed in the previous section, we tested each rock type for a match with known characteristics of pseudotachylytes to evaluate the possibility of genetic links. In our study area, there was only one other ultramylonite (pinkish granitic ultramylonite), although there are different colors of granitic ultramylonite elsewhere in the shear zone core (Melosh et al., 2018). We evaluated eight samples of black ultramylonite (Fig. 4g) and six samples of granitic ultramylonite (Fig. 4e) (Table 1). The black ultramylonite samples matched on average characteristics for recrystallised pseudotachylyte, while the granitic ultramylonites averaged a match. Of the granitic ultramylonites, three samples matched zero to two characteristics (Table 1). We therefore interpret that the granitic ultramylonites in general do not show characteristics diagnostic of pseudotachylyte origin and were probably formed by dynamic grain size reduction, whereas the black ultramylonite probably formed through coarsening of pseudotachylyte which initially had a finer (∼ µm) grain size. Three samples of granitic ultramylonite matched three or four characteristics, raising the possibility that they could be recycled pseudotachylytes in advanced stages of recrystallisation/deformation so that many of the indicator features have been lost (e.g. Passchier, 1982; Price, 2012; Kirkpatrick and Rowe, 2013).
No single criterion divides the two ultramylonites perfectly, although the compositional mica enrichment (criterion 4) and possibly the sharp layer boundaries (criterion 10) may be the strongest discriminators (Table 1). Polymineralic host rock clasts (criterion 7) were absent from all but one of the granitic ultramylonite samples, and that sample was also the only one to display a preponderance of refractory minerals (e.g. quartz) as clasts, consistent with preservation as survivor grains in a melt. That sample (PF07) also met the most pseudotachylyte criteria (), so it is the strongest candidate amongst the granitic ultramylonites to be a “completely” recycled pseudotachylyte.
We interpret black ultramylonite strands as recrystallised pseudotachylyte and the product of seismic slip and transient frictional heating, while other ultramylonites are more likely to be derived or are indistinguishable from dynamic grain size reduction in parent mylonites. We therefore confirm the interpretation of Melosh et al. (2014, 2016) that the fault rocks in the PSZ record seismic activity in the brittle–plastic transition zone and will refer to the black ultramylonites as recrystallised pseudotachylytes and use the detailed map of black ultramylonites as a map of paleo-earthquake rupture surfaces to examine their distribution.
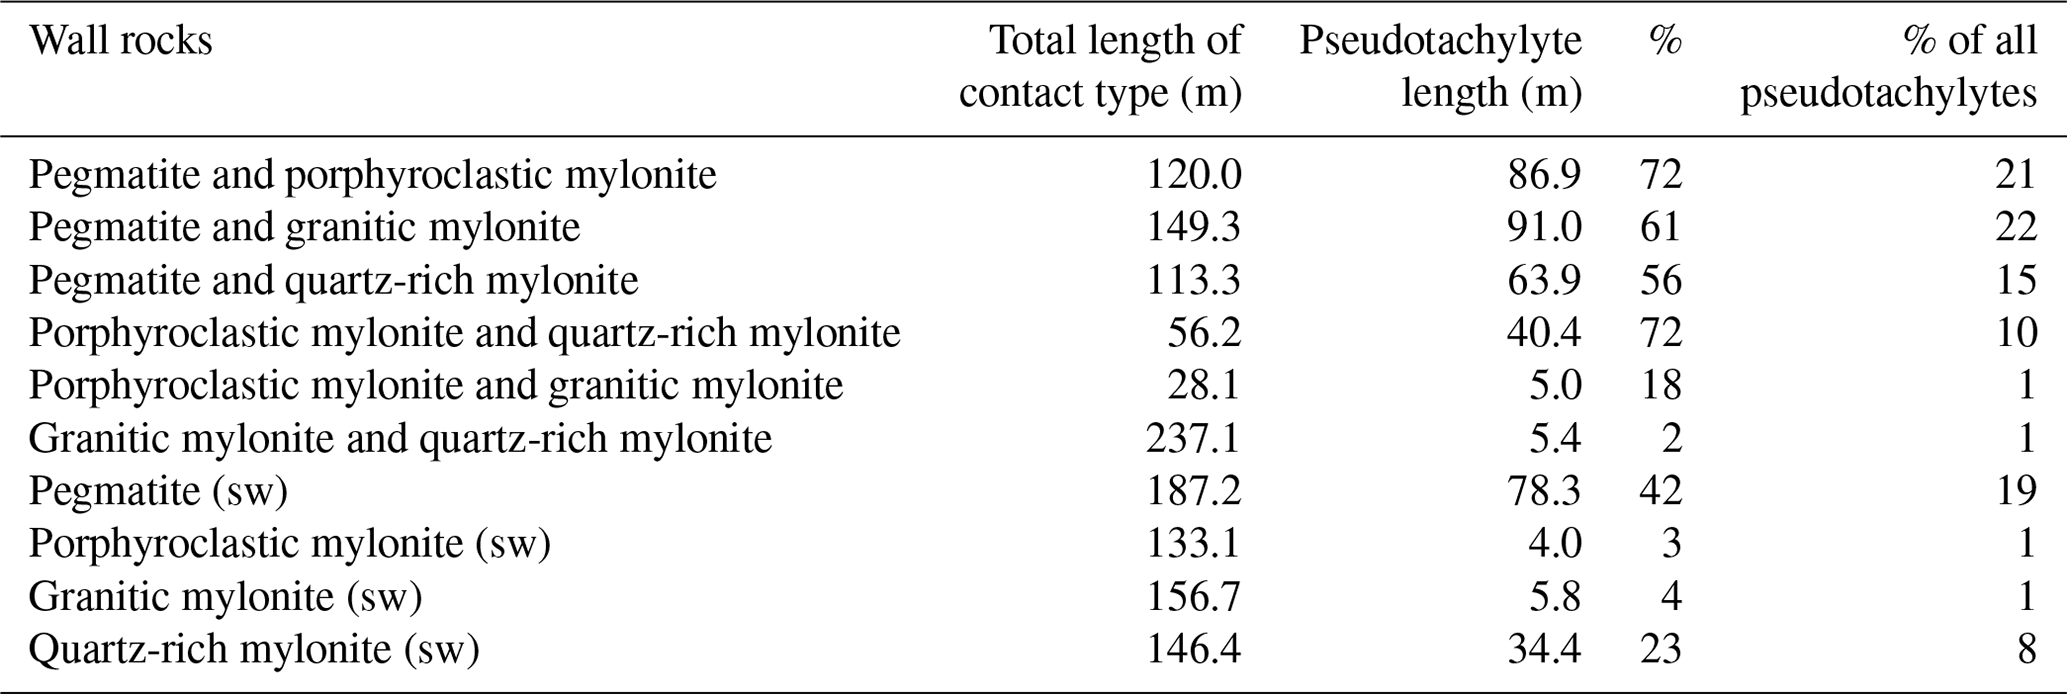
Table 2Total length of contacts in mapped area, categorised by the lithologies juxtaposed across the contacts (similar on either side of pseudotachylyte (sw) or different wall rocks), with percentage of total length by wall rock lithology which is decorated by pseudotachylyte. Rows ordered by apparent relative strength.
3.5 Spatial relationships between mylonites and recrystallised pseudotachylyte
The shear zone consists of dozens of parallel bands of mylonites and ultramylonites, creating a very large number of sub-parallel, pre-existing lithologic interfaces which could have been activated during seismic slip. The majority of the lithologic layers pinch and swell and exhibit gently wavy interfaces. This observation is consistent with existing theory on pinch-and-swell morphologies in deforming viscous layers (Gardner et al., 2015), wherein the shape is controlled by relative competency of the layers, which is a cumulative property influenced by mineralogy, fabric, layer thickness, and grain size of the rocks. However, the individual bands of recrystallised pseudotachylytes are uniformly a few centimeters thick, with parallel wavy interfaces, and display much smaller thickness variation along-strike than other mylonite layers (Fig. 2). We classified each interface in our small map area by the lithologies present as wall rocks on either side. The cumulative length of recrystallised pseudotachylyte along contacts between each pair of lithologies was determined as a proportion of the total cumulative length of contacts of the same type. When pseudotachylyte is recorded within layers of a single mylonite type (located entirely within a boudinaged layer), we determine the proportion of pseudotachylyte length compared to the total along-strike extent of that mylonite type's layers within the studied outcrop.
The geometry of the interfaces were then characterised and compared to pseudotachylyte abundance (Table 2, and expressed as the length of interface with pseudotachylyte as a percentage of total length of interface between wall rock lithology pairs).
We identify eight interconnected pseudotachylyte networks (black strands in Fig. 2; for definition of pseudotachylyte networks, see Rowe et al., 2018a). As the strike length of the mapped area is only 48 m, likely much smaller than the rupture patches of the paleo-earthquakes that produced the pseudotachylyte, we cannot determine whether the eight identified networks represent different earthquakes or are part of one or more networks which formed in the same earthquake (cf. Allen, 2005; Rowe et al., 2018a). By area, the eight recrystallised pseudotachylyte networks account for ∼ 8 % of the mapped fault core area. Layers of recrystallised pseudotachylyte are < 1–13 cm thick (average 5.7 cm). As some of these are thicker than pristine pseudotachylyte fault veins from similar faults (e.g. Sibson, 1975; Sibson and Toy, 2006; Allen and Shaw, 2011; Rowe et al., 2018a), these could represent repeated slip of multiple earthquakes along a single slip surface (e.g. Camacho et al., 1995), or the pseudotachylyte layers were thickened during dynamic recrystallisation by folding and early stages of transposition (e.g. Melosh et al., 2018). In addition, multiple interlayered ∼ 1–2 cm horizons of mylonite and recrystallised pseudotachylyte are observed (these horizons are represented as black ultramylonite on the map in Fig. 2 and the fine layering can be distinguished on the high-resolution stitched outcrop image provided in the Supplement).
We found that 71 % of recrystallised pseudotachylyte is located along an interface between two different lithologies, and 29 % occurs within a wall rocks of the same lithology (listed as sw in Table 2, bounded by the same lithology on either side of the pseudotachylyte). Pseudotachylyte is most abundant along interfaces between porphyroclastic mylonite and pegmatite (72 %) and between quartz-rich mylonite and porphyroclastic mylonite (71 %) and moderately abundant along contacts between pegmatite and either granitic mylonite (61 %) or quartz-rich mylonite (56 %) (Table 2). The interface between granitic mylonite and quartz-rich mylonite almost never has pseudotachylyte (2 %). Finally, while the interface between granitic mylonite and porphyroclastic mylonite also has a low pseudotachylyte occurrence (18 %), the total length of this type of interface is only 28 m, making this a lithological relationship with lower occurrence than other contact types (56–237 m) within the study area, meaning this percentage may be less representative. The majority of pseudotachylyte with similar wall rock is hosted by pegmatite (42 %), with decreasing abundance in quartz-rich (23 %), granitic (4 %), and porphyroclastic (3 %) mylonite (Table 2, ratio of pseudotachylyte length within single lithology and total along-strike length of that lithology within the shear zone core).
These data demonstrate that the pseudotachylytes are not randomly distributed across all the possible interfaces in the shear zone core; they are preferentially associated with particular wall rock combinations.
Some of the rock types in the shear zone core form shorter, higher-amplitude boudins, while others tend to flow and fill the space between boudins, producing different interface geometries between different wall rocks. To test the hypothesis that the distribution of pseudotachylyte might be related to the interface geometry, we extracted the interfaces from our field map for quantitative description and analysis. If interface geometry affects the likelihood of finding pseudotachylyte along an interface, then we should be able to identify a geometric difference between pseudotachylyte-bearing and pseudotachylyte-absent interfaces. We determined the relative competency of the different lithologies based on the shape of the interfaces. We then applied a fast Fourier transform (FFT) to characterise the shape of contacts for comparison.
4.1 Relative competency from qualitative comparison of layer contact shapes
Differences in the geometry of boudinaged or pinch–swell contacts have been associated with competency contrast in analog models and numerical modelling studies (Cloos, 1947; Ramberg, 1955; Gardner et al., 2015, 2016). The amplitude / wavelength ratio of boudinaged contacts increases with increasing competency contrast, strain, and thickness contrasts as well as the feedback between viscosity and strain rate which controls stress (Ramberg, 1955; Marques et al., 2012). As all the lithologies in the shear zone are polymineralic, directly estimating their strengths from experimentally derived flow laws is untenable (e.g. Handy, 1994). However, pinch-and-swell curvature reflects the sense of competency contrasts (with the less viscous lithology filling pinches and gaps in the more viscous one; Quirke, 1923; Ramberg, 1955). Combining qualitative observations of layer shape with information on layer thickness can therefore produce a relative hierarchy of lithologic strength during deformation which reflects the local strain rate and stress.
Quartz-rich mylonite layers typically display the largest thickness variations (0 to > 1 m) and are commonly observed pinching out completely along-strike regardless of the thickness of neighboring mylonite bands (e.g. Fig. 3d, where the thickness of quartz-rich mylonite layer resulted in higher competency in spite of lower viscosity than the surrounding granitic mylonite). Granitic mylonite boudins display less thickness variation (up to ∼ 30 cm) and only pinch out completely when the layer thickness ratio between this mylonite and the surrounding material is > 4. Porphyroclastic mylonite and pegmatite layers are not observed pinching out but do exhibit cyclical changes in thickness on the order of 10–20 cm (Fig. 3a and b). Pinch–swell and boudinage is also observed between layers of the same lithology (especially quartz-rich mylonite) where thickness variation may be the stronger determinant of competency (Fig. 2).
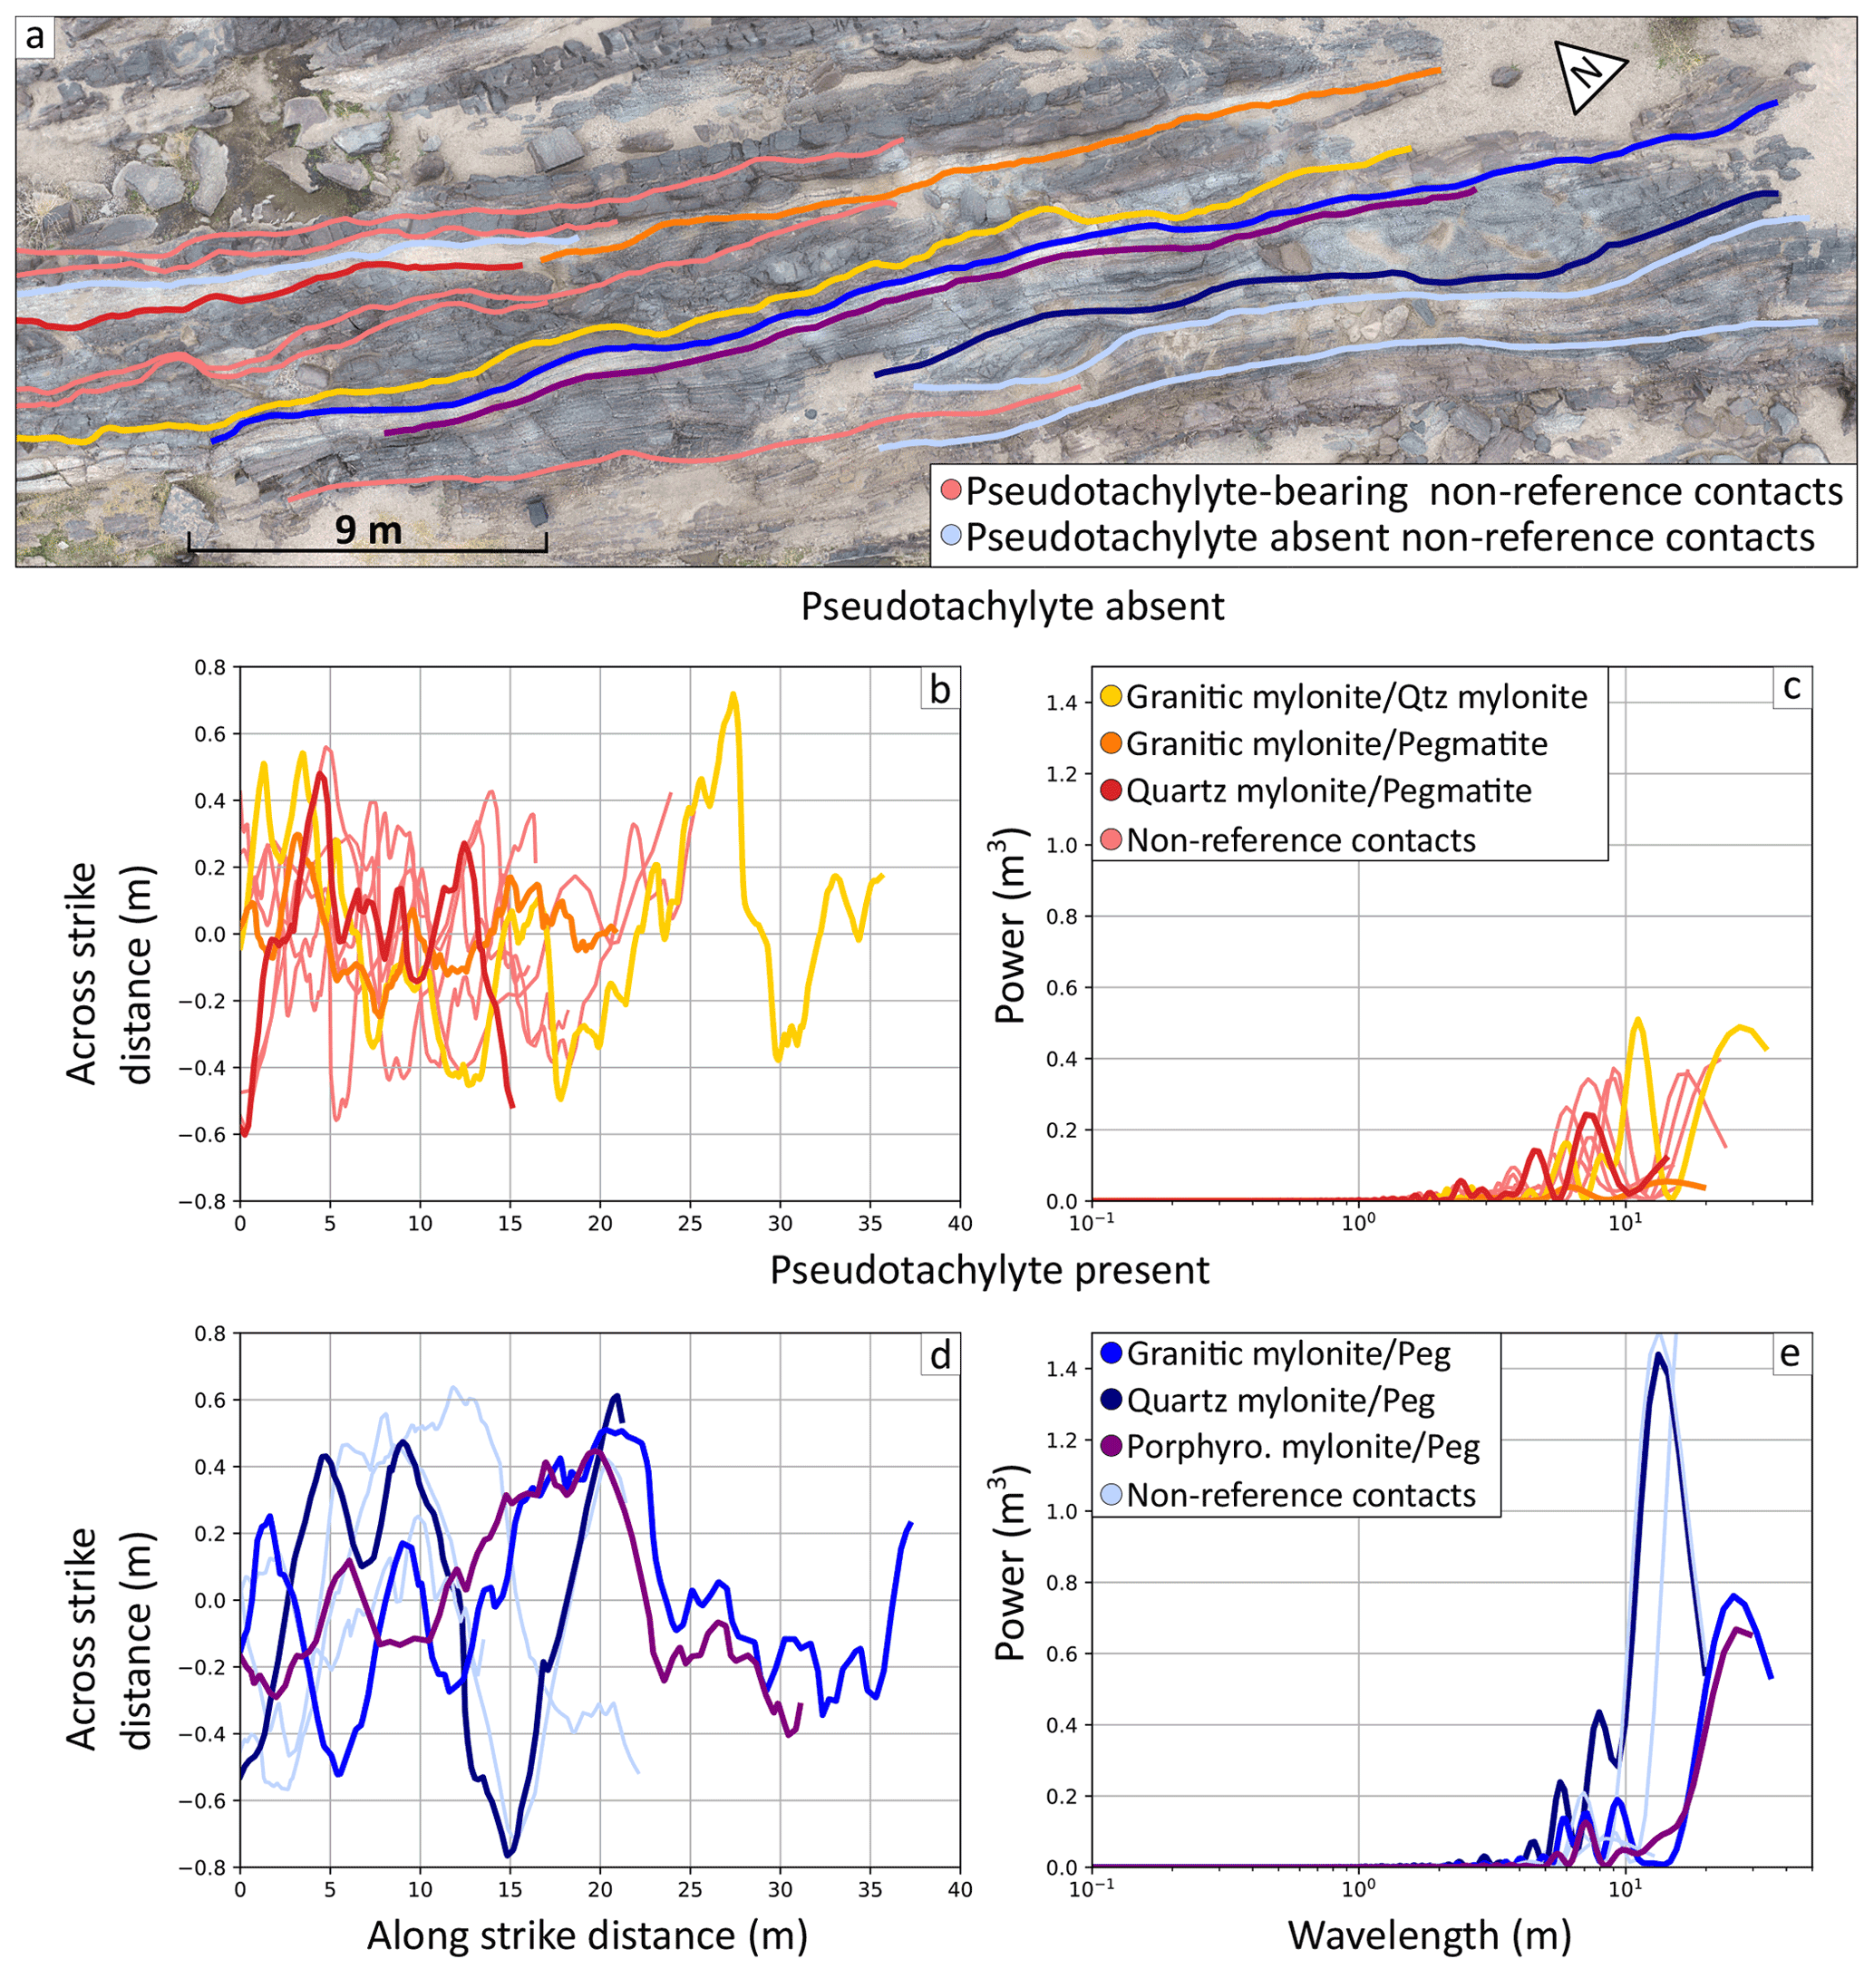
Figure 7Mylonite layer interface maps. (a) Drone image with contact traces delineated, cool colors have pseudotachylyte and warm colors have no pseudotachylyte. Reference traces of similar wall rock layer thickness are shown in bright colors (see legend for plots) and other interfaces which are not controlled for layer thickness appear in pale colors. Top row of plots shows data for pseudotachylyte-bearing contacts (b, c), and bottom row shows pseudotachylyte-absent contacts (d, e). (b, d) Detrended profiles. (c, e) FFT for same contact traces highlights the wavelengths of increased power (m3).
Combining observations of thickness variations (Fig. 2), contact morphologies (Fig. 3), grain size (Fig. 4), and mineralogy (Fig. 5), we define a qualitative hierarchy of competency between the shear zone core lithologies (cf. Gardner et al., 2016). The coarse-grained, plagioclase-dominated pegmatites display only minor thickness changes, demonstrating that they were more competent than all other rocks in the mylonite zone. The porphyroclastic mylonite (likely derived from dynamic grain size reduction and alteration of the pegmatite) appears to be the second-most competent, as it makes cusps along boundaries with the pegmatite and displays minor to moderate layer thickness variations, but the amplitude of its contacts with pegmatite is much lower than the other lithologies against pegmatite (Fig. 7). The granitic mylonite appears to be less competent than the porphyroclastic mylonite, based on boudin shapes, discontinuity of layers, and higher-amplitude contacts when comparing between layers of similar thickness. The quartz-rich mylonite shows higher contact amplitudes than granitic mylonite in contact with the stronger rocks, in spite of greater layer thickness, so was less competent than all the other mylonites.
4.2 Quantitative mapping and analysis of contact shapes
We identified 14 segments of lithologic interfaces for FFT analysis (Fig. 7a). These segments represent the longest mapped contacts where we have continuous control on wall rock lithology and thickness of the immediate bounding mylonite layers. Six of those interface segments are lined with recrystallised pseudotachylyte, and eight are sharp contacts between mylonitic wall rocks. The detrended contacts are presented in Fig. 7b and c, where the origin is the northwestern end of each mapped contact. The lengths of layer interfaces (15.1–37.2 m) vary, and traces are truncated by wall rock changes or pseudotachylyte bifurcations. The amplitude of undulations is ≲ 1 m (across-strike distance in Fig. 7b and d). To control for layer thickness, we selected six reference contacts which juxtapose equal-thickness layers (three with pseudotachylyte present, three without; Fig. 7c and e).
We calculated the power spectral density (PSD; as a measure of amplitude of the signal as a function of frequency) for each contact trace (Fig. 7c and e). This yielded quantitative measures of the power of undulations at different wavelengths along the traces and allowed us to interpret differences in roughness of these surfaces. Contact traces from the field map were converted into coordinate arrays. The selected interfaces were populated with coordinates at a fixed along-strike interval of 0.05 m through linear interpolation between digitised nodes. The contact geometry was then detrended to remove the shear zone's northwest–southeast strike from the amplitude component of the digitised contacts. Signal tapering was used to minimise spectral leakage; a forward linear extrapolation (beginning at the trace end point and terminating once extrapolated amplitude matched the trace beginning amplitude) was applied to the detrended interfaces. Fast Fourier transforms were performed on converted interfaces in Python 3.7 (utilising the Numpy library FFT capabilities) to determine the dominant wavelengths of the interface undulations by extracting power spectral density. The input interfaces were zero-padded to increase frequency resolution at low frequencies. Frequencies less than the signal's period length were discarded.
Our analysis suggests there is a distinct difference between pseudotachylyte-bearing interfaces (cool colors in Fig. 7a, d, and e) and pseudotachylyte-absent interfaces (warm colors in Fig. 7a–c). All interfaces exhibit a complex geometry that is represented by multiple sinusoidal components with different wavelengths in the FFT results. In general, the power increases as the wavelength increases. Interfaces decorated by pseudotachylyte (cool colors) display notably larger power compared to interfaces without pseudotachylyte at long wavelengths (≳ 10 m). Pseudotachylyte-absent interfaces appear to plateau around an upper power level of ∼ 0.4 at wavelengths of 7–10 m. These characteristics of the spectral analysis are qualitatively evident in the detrended interface profiles (Fig. 7b and d), where the pseudotachylyte-present interfaces have a geometry dominated by large-amplitude, long-wavelength components, whereas the pseudotachylyte-absent interfaces show lower overall amplitudes and predominance of multiple short wavelength components. This pattern is robust when layer thickness and lithology are controlled, as shown by two pairs of reference contacts with matching wall rock lithologies (quartz-rich mylonite/pegmatite (red vs. navy blue) and granitic mylonite/pegmatite (orange vs. royal blue); Fig. 7).
Two of the pseudotachylyte-absent reference interface segments are adjacent segments of one interface mapped across a transition from one wall rock type to another in series (red to orange in Fig. 7a). Making the reasonable assumption that the finite strain is similar along the entire interface, the effect of changing one wall rock can be observed (Fig. 7b and c). The wall rock on the north side is pegmatite, and on the south, the interface progresses from quartz-rich mylonite in the west (red in Fig. 7a) to granitic mylonite in the east (orange in Fig. 7a). We observe a reduction in the peak power between the quartz-rich mylonite (red) and granitic mylonite (orange) segments. This amplitude difference is attributable to the difference in competency of the quartz-rich mylonite (weaker) vs. the granitic mylonite (stronger) when they share an interface with pegmatite, the strongest lithology. The interface between quartz-rich mylonite and granitic mylonite (yellow in Fig. 7) may have a different finite strain, but the high power suggests again that the competency contrast is significant. Comparing each mylonite against the same strong opposing wall rock (pegmatite) results in relative competency hierarchies consistent with our qualitative competency hierarchy presented in the previous section.
The difference in geometry between pseudotachylyte-bearing and pseudotachylyte-absent contacts remains present when considering all contacts that extend multiple boudin lengths along-strike, whether or not we control for layer thickness. The measured power differs for each individual contact but the predominance of higher power computed for pseudotachylyte-bearing contacts at wavelengths greater than ∼ 10 m persists for all 14 contacts.
Our detailed mapping of the Pofadder Shear Zone core presents the lithologic and architectural complexities of the earthquake source in the deep seismogenic zone. In this section, we reflect on the relationship between interseismic viscous flow and brittle rupture, discuss the possible causes of non-random distribution of pseudotachylyte amongst the layers of mylonites, and speculate on possible effects both on and due to earthquake cycles in the middle crust.
5.1 Long-term deformation of mylonitic layering
Pinch-and-swell geometries are present in every compositional layer we mapped, which represent the finite deformation within the shear zone, and therefore inform the long-term conditions and processes. As the quartz-rich mylonite, granitic mylonite, and porphyroclastic mylonite are very similar in grain size (Fig. 4) but display indications of significant competency contrasts in outcrop, mineralogy seems to be the strongest factor which affected their relative competence during viscous flow. A multitude of grain-scale deformation mechanisms accommodated strain in the mylonites. We commonly observe fragmented feldspar porphyroclasts (dominantly plagioclase) in granitic and porphyroclastic mylonites, which show minimal evidence of dynamic recrystallisation. In all mylonites, the microstructure in monomineralic quartz ribbons (with strong crystallographic preferred orientation; Melosh et al., 2016) suggests that quartz deformed predominantly through dislocation creep. The abundance of flake-shaped pores and co-planar grain boundaries crossing phase boundaries in the mylonite matrices (Fig. 4) are consistent with the activity of additional deformation mechanisms, such as grain boundary sliding (e.g. Fliervoet et al., 1997; Fusseis et al., 2009). Syn-kinematic solution precipitation may also explain the elevated mica contents in the ultramylonites relative to mylonites and to the host rock (e.g. Fig. 5; Simpson, 1985; Janecke and Evans, 1988; Fusseis and Handy, 2008; Gilgannon et al., 2017). This complexity of deformation mechanisms makes it impossible to estimate the bulk strengths of individual mylonites from mineralogy and microstructure, but the pinch-and-swell geometries are consistent with power law viscous flow with stress exponents < 5 and effective viscosity contrasts on the order of 20–100 times (Schmalholz et al., 2008).
Our qualitative competency hierarchy (pegmatite > porphyroclastic mylonite > granitic mylonite > quartz-rich mylonite) and the observations of fractured plagioclase porphyroclasts are consistent with plagioclase as the strongest major mineral during deformation. The porphyroclastic mylonite retains a higher proportion of plagioclase, while the granitic mylonite contains more quartz and alkali feldspar (Fig. 4f vs. d). The weakest mylonite is the quartz-rich mylonite, whose framework is dominated by dynamically recrystallised quartz and mica rather than feldspar. We therefore conclude that the decreasing abundance and grain size of feldspar was the main cause of the inferred decrease in bulk rock viscosity between the lithologies (Fig. 5). This has been noted in other granitic shear zones, where replacing feldspar with mica contributed to monotonic weakening in the shear zone core (e.g. Fitz Gerald and Stünitz, 1993; Bailey et al., 1994; Wintsch et al., 1995).
Overall, our results demonstrate that in high-strain shear zones that contain an array of lithologies and grain sizes, mylonitic layering in the shear zone core is characterised by competency variations that result in wavy interfaces between layers. The Pofadder is typical of mid-crustal shear zones which cut through lithologically heterogeneous crust, with thinned and extended layers of different mineralogies, so we suggest this general structure may be a characteristic of continental transforms in the deep portions of seismogenic zones and transitional zones (e.g. Price et al., 2012; Rennie et al., 2013; Schulte-Pelkum and Mahan, 2014).
5.2 Distribution of preserved earthquakes
The Pofadder earthquakes occurred within an actively deforming and exhuming region, with strong ductile fabrics established in a zone several kilometers wide prior to the initiation of pseudotachylyte formation (or preservation; Fig. 1; Lambert, 2013; Melosh et al., 2014). This prior strain history established the extended layers of variable lithology during viscous shear at amphibolite facies (∼ 650 ∘C; Melosh et al., 2016). So although there is no record of the precise geometry of the lithologic interfaces prior to any given earthquake rupture, the geometries of layer interfaces were likely wavy at the time of pseudotachylyte emplacement, similar to the preserved geometries we see today (Fig. 2; Supplement). That is to say that the shear zone contained a variety of potential rupture surfaces, with variable roughness characteristics, continuity, and amplitude already established when regional exhumation brought the rocks which are currently exposed into the seismogenic zone, although they have likely continued to evolve since pseudotachylyte emplacement began. The mylonitic foliation and the layer boundaries are both wavy throughout the shear zone core, on all scales (Figs. 2 and 6). Pseudotachylytes lie along these surfaces and are therefore also wavy, locally crosscutting pre-existing fabrics at a low angle (e.g. Figs. 3b and 6b). There is no way of determining whether these earthquakes nucleated locally, in which case they are representative of the hypocentres (e.g. Allen, 2005), or nucleated at shallower depths and propagated downwards into the conditionally stable region (Sibson, 1980; Campbell and Menegon, 2019). Regardless, the abundant pseudotachylytes in the Pofadder Shear Zone core preserve the passage of seismic slip and allow us to explore the interactions between earthquake slip and interseismic shear zone development.
Most of the pseudotachylytes, and therefore most of the earthquake ruptures, followed lithologic interfaces (Table 2), supporting the hypothesis that these contacts acted as earthquake guides. Furthermore, if the earthquake ruptures were insensitive to local conditions, such as interface cohesion, rock properties, or interface geometry, then we would expect to find the pseudotachylyte distributed randomly amongst the interfaces, but this is not the case. Table 2 shows that some combinations of wall rocks are far more likely to show pseudotachylytes on their interfaces than other combinations.
We examined the possibility that some of the lithologies are more likely to melt during earthquakes, resulting in a pseudotachylyte map which records melting tendency rather than rupture patterns. Mica-rich rocks would be predicted to melt with less frictional heating due to higher water content and lower melting point (Spray, 2010). This cannot have been the only factor controlling frictional melting in the Pofadder Shear Zone, as some of the highest mica content mylonite (quartz-rich mylonite; Fig. 5e) is sometimes associated with the lowest pseudotachylyte abundance interfaces (e.g. granitic mylonite vs. quartz-rich mylonite, which displays only 2.3 % pseudotachylyte decoration). Quartz and plagioclase are characterised by higher melting points (with quartz > plagioclase) and lower thermal conductivity than the other major rock forming minerals across all mylonites (Spray, 2010), resulting in these minerals overwhelmingly dominating survivor grain populations in pseudotachylytes (Dobson et al., 2018). Plagioclase is the dominant mineral in pegmatite and porphyroclastic mylonite, a combination which is overwhelmingly favorable for pseudotachylyte (72 %). However, high-feldspar contacts between porphyroclastic mylonite and granitic mylonite and high-quartz contacts between quartz-rich mylonite and granitic mylonite, show low pseudotachylyte abundance. Neither low melting point (mica) nor high frictional heating (plagioclase and quartz) can explain the distribution of pseudotachylytes, suggesting that mineralogy has a weak effect. The map of pseudotachylyte therefore is likely a map of paleoseismic rupture traces.
Below, we assess the influence of different interface characteristics (interface cohesion, wall rock strength, and interface geometry) on the distribution of seismic slip in the shear zone.
5.2.1 Interface cohesion
Seismic slip is most likely to occur along pre-existing faults or weak surfaces due to lower cohesion (Hutchinson and Suo, 1991). In the presence of two materials with a cohesionless interface between them, slip is controlled by differences in frictional properties of the materials (Lykotrafitis and Rosakis, 2006), which causes the rotation of local maximum principal stress away from perpendicular to the fault plane. This results in a decrease in the energy required to maintain dynamic slip and increases displacement for a given stress state (Andrews and Ben-Zion, 1997). Previous field observations of pseudotachylyte-bearing mylonite zones have demonstrated that deformation tends to localise along pre-existing joints, faults, or contacts (Di Toro and Pennacchioni, 2005; Shaw and Allen, 2007; Allen and Shaw, 2011; Mittempergher et al., 2021). However, in shear zones, lithologic interfaces are not completely decoupled, as boudin formation or pinch-and-swell layer geometries imply some degree of coupling across the interfaces on long timescales (e.g. Abe and Urai, 2012). Our results demonstrate that lithologic interfaces are favored for rupture but not exclusively, as nearly one-third of pseudotachylyte lengths lie between identical wall rocks and so may have ruptured through anisotropic but intact crystalline rock. The distribution of post-seismic deformation across pseudotachylytes and wall rock indicates that healing after co-seismic melting was effective, with grain growth having occurred during post-seismic healing (cf. Passchier, 1982; Price et al., 2012; Metteer, 2021).
Due to the higher mica content and finer grain size of the pseudotachylyte relative to the pre-existing mylonite, the thin layers of pseudotachylyte are likely to have been weaker, resulting in a lower shear resistance along the interface than prior to the earthquake. This lower effective coupling would have partitioned strain along the pseudotachylyte (as seen in the development of crystallographic preferred orientations in dynamically recrystallised pseudotachylyte) and reduced the drag across the interface, impeding the enhancement of the pinch–swell instabilities (Ramberg, 1955; Marques et al., 2012; Bamberg et al., 2022). The most likely effect of pseudotachylyte would be to discourage, or slow down, the enhancement boudinage geometry reflected as increasingly short wavelength pinch-and-swell contact geometries.
It therefore seems unlikely that cohesion contrasts play a decisive role in controlling the strong preference for earthquake ruptures along some interfaces over others and more likely that the changes in interface coupling for long-term viscous deformation are an effect, rather than a cause, of the presence of pseudotachylyte.
5.2.2 Wall rock strength
At the timescale of seismic slip, rupture propagation is not affected by viscous deformation but is influenced by elastic properties and stress heterogeneities that may pre-exist in the fault zone (Bhat et al., 2010). For example, numerical models suggest that dissimilar elastic properties between wall rocks can lead to variations in normal stress during seismic slip (Dunham and Rice, 2008). As all the mylonites are quartz- and feldspar-dominated and highly anisotropic, they likely had similar, highly anisotropic elastic moduli (Punturo et al., 2014; Wenning et al., 2018), so differences in elastic properties are unlikely to have determined the distribution of earthquakes. However, the patterns of pinch-and-swell layering imply that a heterogeneous stress distribution existed in the shear zone at any moment during viscous creep (e.g. Abe and Urai, 2012). Previous work on the stress distributions associated with folding and boudinage in power law viscous materials have shown that the magnitude of stress heterogeneities around rigid inclusions can reach tens to hundreds of megapascal (Melosh et al., 2018; Campbell and Menegon, 2019) and perhaps higher during accelerated creep transients (Papa et al., 2020). Furthermore, high-viscosity contrast interfaces have the largest resolved shear stress during the deformation of layered media due to the displacement mismatches across them (Lloyd et al., 1982). In nature, high tractions along a lithologic interface may result in frictional failure (Fagereng et al., 2014; Phillips et al., 2020). We propose that rupture propagation is most favored along pathways with the greatest background shear stress. Pseudotachylytes are most abundant along interfaces with the highest-viscosity rocks (e.g. pegmatites) and interfaces with the highest-viscosity contrasts (e.g. porphyroclastic mylonite vs. quartz-rich mylonite; Table 2). Thus, the viscosity contrasts contributed to the development of stress heterogeneity prior to earthquake rupture, which appears to have influenced the locus of seismic slip.
5.2.3 Interface geometry
The maps of interface geometry are 2D but extend to wavelengths > 10 m, which are rarely reached in field studies on fault roughness (e.g. Bistacchi et al., 2011; Candela et al., 2012; Shervais and Kirkpatrick, 2016). All the analyzed lithologic interfaces are largely indistinguishable at shorter (meters and smaller) wavelengths, with amplitude / wavelength ratios similar to faults (∼ 10−2–10−3; e.g. Renard et al., 2013; Fang and Dunham, 2013) and with amplitudes that increase with wavelength in the same way as faults. However, above wavelengths of ∼ 10 m, the pseudotachylyte-bearing interfaces have amplitudes that exhibit a power-law-like scaling with wavelength (steep increase on the log–linear plot), while the interfaces without pseudotachylyte do not increase appreciably in power with increasing wavelength. The levelling off of the power density above ∼ 10 m wavelength may be consistent with progressive boudinage and wavelength halving as the major control on the geometry of these pseudotachylyte-absent interfaces (Abe and Urai, 2012).
Observations of earthquake slip surfaces often indicate that rupture geometrically straightens faults by propagating through, rather than around, asperities, producing low-angle crosscutting relationships to older fault rock layers (Shervais and Kirkpatrick, 2016; Dascher-Cousineau et al., 2018). However, ruptures also branch, link, and jump to create networks of surfaces that slip in the same earthquake, with an overall preferred orientation but including many strands that deviate from parallel (Rowe et al., 2018b; Quigley et al., 2017). We find no evidence that the waviness displayed on our mapped interfaces created geometric obstructions to rupture due to either asperity height or divergence from favorable orientation. The pseudotachylytes formed between similar wall rocks (no viscosity contrast, sw in Table 2) exhibit similar wavy geometries to those between contrasting wall rocks, implying that some rupture surfaces may have been wavy without later boudinage driven by viscosity contrasts. If these attributes do affect rupture geometry, the effect may only be important at scales much larger than our ∼ 50 m along-strike study dimension.
The reduction in coupling along pseudotachylyte-bearing interfaces (Sect. 5.2.1) may reduce tensile stress within the boudinaging layers, impede wavelength halving, and suppress the development of shorter wavelength boudins (Abe and Urai, 2012; Bamberg et al., 2022). The effect would be to maintain and enhance pinch–swell/boudinage at longer wavelengths, while reducing the efficacy of viscous drag to contribute to division of boudins into shorter wavelengths and impeding power increases at longer wavelengths, resulting in the observed scaling change that differentiates pseudotachylyte-bearing from barren interfaces at wavelengths above ∼ 10 m .
5.3 Contribution of earthquakes to shear zone structure
As discussed above, interface cohesion, geometry, and wall rock strength are all predicted to affect the favorability of specific pre-existing surfaces for earthquake rupture, but as these characteristics are all modified by background viscous flow and affect one another, these are not independent hypotheses and the shear zone evolution has to be viewed in a holistic way. In this section we discuss the constraints from field observations that help shed light on the controls on slip surface choice by earthquakes rupturing through the Pofadder Shear Zone.
Above, we enumerated the ways in which the appearance of pseudotachylyte could have changed the distribution of stress and deformation within the shear zone core. During interseismic creep, viscosity heterogeneities across lithologic layer contacts resulted in pinch–swell and boudinage development throughout the mylonite zone, creating myriad wavy pathways for future ruptures to take. Our detailed map shows that neither melt susceptibility of different rock types nor cohesion contrasts seem to correlate to the distribution of pseudotachylyte, so although these factors probably have an effect, they are not the most important.
Following an earthquake, the sudden appearance of a pseudotachylyte along mylonitic interface would have reduced the effective cohesion and shear resistance along that surface. During subsequent creep, this fine-grained micaceous layer would have promoted strain localisation and reduced the coupling between wall rock layers that drives boudinage. We suggest this would reduce, but not completely prevent, the long-term amplification of pinch–swell on interfaces that experienced earthquakes. This effect is only detectable at longer (> 10 m) wavelengths.
5.4 Contributions of shear zone structure to rupture propagation
Occasional interlayered horizons of mylonite and recrystallised pseudotachylyte indicate the presence of multiple rupture paths adjacent to each other. The composite layers of black ultramylonite reach local thicknesses of > 0.5 m but always contain thin wall rock selvedges indicating these thick layers formed by rupture of adjacent rather than re-used rupture surfaces (Fig. 2; Supplement). This indicates that rupture-favorable conditions persisted at these sites through multiple earthquake cycles, so are likely related to long-term properties (e.g. wall rock characteristics) rather than short-term (e.g. interface cohesion which could evolve by healing within a single earthquake cycle).
We suggest that pre-rupture stress heterogeneity caused by the geometry variations generated by viscosity contrast between lithologic layers could have exerted a significant control on the location of earthquake rupture within the Pofadder Shear Zone. This is in contrast to frictional faults in the seismogenic zone that may progressively evolve toward smoother, more mature structures (Dascher-Cousineau et al., 2018) which are correlated with greater slip (e.g. Bletery et al., 2016). Due to more complete healing in crystalline rock, earthquakes may behave differently in the conditionally ductile zone, and the stress heterogeneity patterns associated with healing and interseismic flow may be different to interseismic stress evolution in purely elastic–brittle crust.
Considering previous modelling results that suggest the largest earthquakes occur in areas of highest stress heterogeneity (Allam et al., 2019), our field observations and interpreted paleo-earthquakes from pseudotachylyte occurrence show that structural complexity could have directly impacted the ancient earthquakes. Aagaard and Heaton (2008) showed that ruptures propagating through heterogeneous stress conditions, even on a geometrically planar fault, would display slip heterogeneity and leave a heterogeneous post-seismic stress field in their wake. Therefore, both interseismic creep and post-seismic stress-drop heterogeneity contribute to keeping stress heterogeneous throughout the seismic cycle.
One mechanism of maintaining co-seismic stress heterogeneity may be the production of a “drag stress” proportional to the ratio of the slip to the minimum wavelength of roughness (Fang and Dunham, 2013). For reasonable slip magnitudes consistent with moderate continental strike-slip earthquakes (∼ 0.1–1 m), a rough fault like our pseudotachylyte-bearing faults (amplitude ∼ 0.1–0.5 m at 10 m wavelengths) should experience drag stress on an order 10–100 MPa, approaching one-third of the background normal stress at seismogenic depths and compatible with the predictions of Fang and Dunham (2013) for propagating earthquake ruptures.
Rupture models never approach the small spatial resolution of our field study, so the minimum scale at which stress heterogeneities might affect earthquake rupture is untested numerically (Allam et al., 2019; Bruhat et al., 2020). Milliner et al. (2016) showed that slip variability is correlated with geometric complexity at wavelengths down to ∼ 200 m. Our observations indicate that we may have captured the length scale of transition below which stress heterogeneities are too small to influence earthquake propagation (at scales of < 10 m) to the scale at which the effect can be detected (> 10 m).
Lithologic and geometric heterogeneity are intrinsic to shear zones in the middle crust, which develop progressively and are maintained during deformation. Heterogeneous stress conditions, at scales and magnitudes sufficient to affect rupture distribution, should be expected in the conditionally ductile crust.
This study investigates the distribution of earthquake slip surfaces within a lithologically diverse exhumed continental-scale shear zone using high-resolution geologic mapping of an excellent exposure of the shear zone core from the brittle–ductile transition zone. We ranked the different types of mylonites in order of their relative competence: the strongest was plagioclase-rich pegmatite, followed by porphyroclastic mylonite and granitic mylonite, and quartz-rich mylonite was the weakest. We identified thin layers of black ultramylonite as recrystallised pseudotachylyte networks derived from paleo-earthquake slip and propose comprehensive microstructural criteria for differentiating ultramylonites formed by recrystallisation of pseudotachylyte from ultramylonites formed only through crystal plastic deformation. We have determined that these recrystallised pseudotachylyte are not randomly distributed and are concentrated on particular lithologic interfaces associated with the strongest rocks and the highest-strength contrasts between wall rocks. The paleoseismic rupture surfaces are distinguished from other lithologic contacts by higher-amplitude roughness at length scales ≳ 10 m. We show that earthquakes in the conditionally brittle zone are guided by structures that reflect long-term (pre- and interseismic) heterogeneous flow in the mylonite zone, which produces geometric complexity and related stress heterogeneities. Earthquakes also affect the interseismic flow patterns in the mylonite zone, as pseudotachylytes may serve to reduce interlayer coupling, concentrate strain, and, in the long term, promote the amplification of longer (> 10 m) wavelength roughness on shear zone layering. Any mid-crustal shear zone of significant strain history is likely to be lithologically banded at depth; this banding leads to rheologic layering, which leads to pinch–swell geometries, and ultimately interacts with periodic episodes of earthquake rupture at these scales. We suggest that this environment provides a paradigm for understanding the environment of earthquake nucleation in active continental faults which could contribute to more naturalistic earthquake cycle models through understanding the interseismic evolution of the fault zone conditions.
The Python code and contact traces used for quantitative geometry analysis are available at https://doi.org/10.5281/zenodo.7230199 (Young, 2022). Rock samples and thin sections are stored at the McGill University Department of Earth and Planetary Sciences and are available for lending – contact Christie D. Rowe (christie.rowe@mcgill.ca).
The supplement related to this article is available online at: https://doi.org/10.5194/se-13-1607-2022-supplement.
CDR conceived of the original study and EMY and CDR co-developed the details. JDK lead the acquisition and processing of basemaps, and EMY carried out the fieldwork with contributions from CDR and JDK. EMY performed the field data processing, microscopy, and microstructural work. EMY implemented the quantitative geometric analysis with assistance from JDK. The methods were adapted from code initially developed by JDK. EMY led the paper preparation, with contributions from CDR. All authors contributed to various aspects of the interpretation, produced figures, and edited the paper.
The contact author has declared that none of the authors has any competing interests.
Publisher's note: Copernicus Publications remains neutral with regard to jurisdictional claims in published maps and institutional affiliations.
Noah Phillips, Deyanira Cisneros, and Jodie Miller assisted with field mapping and field logistics. Special thanks go to Noah Phillips for continued and extremely helpful scientific input throughout the project and to Jodie Miller and Moses Angombe for organising field equipment and access to facilities at Stellenbosh University. Additional logistics and advice on the regional geology was provided by Moses Angombe of the Geological Survey of Namibia and Hendrik Smith of the Council for Geoscience, South Africa. Erik M. Young thanks the staff of the McGill University and University of British Columbia Electron Microscopy Labs for help with imaging. Thanks go to Paul Macey, Conrad Groenewald, Chris Lambert, and Alex Kisters for introducing Christie D. Rowe to the Pofadder Shear Zone. We are grateful for financial support provided by the Natural Sciences and Engineering Research Council of Canada, McGill University, and the GSA student grants program. We would like to thank Friedrich Hawemann and Simone Papa for helpful and insightful comments that have improved the final presentation of the work and Florian Fusseis for editorial handling of the paper.
This research has been supported by the Natural Sciences and Engineering Research Council of Canada (NSERC Discovery Grants: Christie D. Rowe, grant no. RGPIN-2017-05266, and James D. Kirkpatrick, grant no. RGPIN-2022-04193).
This paper was edited by Florian Fusseis and reviewed by Simone Papa and Friedrich Hawemann.
Aagaard, B. T. and Heaton, T.: Constraining fault constitutive behavior with slip and stress heterogeneity, J. Geophys. Res.-Sol. Ea., 113, B04301, https://doi.org/10.1029/2006JB004793, 2008. a
Abe, S. and Urai, J. L.: Discrete element modeling of boudinage: Insights on rock rheology, matrix flow, and evolution of geometry, J. Geophys. Res.-Sol. Ea., 117, B01407, https://doi.org/10.1029/2011JB008555, 2012. a, b, c, d
Allam, A., Kroll, K., Milliner, C., and Richards-Dinger, K.: Effects of fault roughness on coseismic slip and earthquake locations, J. Geophys. Res.-Sol. Ea., 124, 11336–11349, 2019. a, b
Allen, J. L.: A multi-kilometer pseudotachylyte system as an exhumed record of earthquake rupture geometry at hypocentral depths (Colorado, USA), Tectonophysics, 402, 37–54, 2005. a, b, c, d
Allen, J. L. and Shaw, C. A.: Seismogenic structure of a crystalline thrust fault: Fabric anisotropy and coeval pseudotachylyte–mylonitic pseudotachylyte in the Grizzly Creek shear zone, Colorado, Geological Society, London, Special Publications, 359, 135–151, 2011. a, b, c
Allen, J. L. and Shaw, C. A.: Seismogenic fault-zone processes and heterogeneity recorded by pseudotachylyte: New insights from the Homestake shear zone, Colorado, in: Classic Concepts and New Directions: Exploring 125 Years of GSA discoveries in the Rocky Mountain Region, edited by: Abbott, L. D. and Hancock, G. S., vol. 33 of Field Guide Series, Geological Society of America, 165–183, 2013. a
Andrews, D. J. and Ben-Zion, Y.: Wrinkle-like slip pulse on a fault between different materials, J. Geophys. Res.-Sol. Ea., 102, 553–571, 1997. a
Bailey, C. M., Simpson, C., and De Paor, D. G.: Volume loss and tectonic flattening strain in granitic mylonites from the Blue Ridge province, central Appalachians, J. Struct. Geol., 16, 1403–1416, 1994. a
Bamberg, B., von Hagke, C., Virgo, S., and Urai, J. L.: Spacing and strain during multiphase boudinage in 3D, J. Struct. Geol., 161, 104636, 2022. a, b
Bestmann, M., Pennacchioni, G., Nielsen, S., Göken, M., and De Wall, H.: Deformation and ultrafine dynamic recrystallization of quartz in pseudotachylyte-bearing brittle faults: A matter of a few seconds, J. Struct. Geol., 38, 21–38, 2012. a
Bhat, H. S., Biegel, R. L., Rosakis, A. J., and Sammis, C. G.: The effect of asymmetric damage on dynamic shear rupture propagation II: With mismatch in bulk elasticity, Tectonophysics, 493, 263–271, 2010. a
Bistacchi, A., Griffith, W. A., Smith, S. A., Di Toro, G., Jones, R., and Nielsen, S.: Fault roughness at seismogenic depths from LIDAR and photogrammetric analysis, Pure Appl. Geophys., 168, 2345–2363, 2011. a
Bletery, Q., Thomas, A. M., Rempel, A. W., Karlstrom, L., Sladen, A., and De Barros, L.: Mega-earthquakes rupture flat megathrusts, Science, 354, 1027–1031, 2016. a
Bruhat, L., Klinger, Y., Vallage, A., and Dunham, E. M.: Influence of fault roughness on surface displacement: From numerical simulations to coseismic slip distributions, Geophys. J. Int., 220, 1857–1877, 2020. a
Burg, J. and Laurent, P.: Strain analysis of a shear zone in a granodiorite, Tectonophysics, 47, 15–42, 1978. a
Caine, J. S., Evans, J. P., and Forster, C. B.: Fault zone architecture and permeability structure, Geology, 24, 1025–1028, 1996. a
Camacho, A., Vernon, R., and Gerald, J. F.: Large volumes of anhydrous pseudotachylyte in the Woodroffe Thrust, eastern Musgrave Ranges, Australia, J. Struct. Geol., 17, 371–383, 1995. a
Campbell, L. and Menegon, L.: Transient high strain rate during localized viscous creep in the dry lower continental crust (Lofoten, Norway), J. Geophys. Res.-Sol. Ea., 124, 10240–10260, 2019. a, b
Campbell, L. R., Phillips, R. J., Walcott, R. C., and Lloyd, G. E.: Rupture geometries in anisotropic amphibolite recorded by pseudotachylytes in the Gairloch Shear Zone, NW Scotland, Scott. J. Geol., 55, 75–92, 2019. a
Candela, T., Renard, F., Klinger, Y., Mair, K., Schmittbuhl, J., and Brodsky, E. E.: Roughness of fault surfaces over nine decades of length scales, J. Geophys. Res.-Sol. Ea., 117, B08409, https://doi.org/10.1029/2011JB009041, 2012. a
Chester, F. and Logan, J. M.: Implications for mechanical properties of brittle faults from observations of the Punchbowl fault zone, California, Pure Appl. Geophys., 124, 79–106, 1986. a
Chester, F. M., Evans, J. P., and Biegel, R. L.: Internal structure and weakening mechanisms of the San Andreas fault, J. Geophys. Res.-Sol. Ea., 98, 771–786, 1993. a
Clarke, G. and Norman, A.: Generation of pseudotachylite under granulite facies conditions, and its preservation during cooling, J. Metamorph. Geol., 11, 319–335, 1993. a
Cloos, E.: Boudinage, Eos T. Am. Geophys. Un., 28, 626–632, 1947. a
Copernicus Sentinel-2: Retrieved from ASF DAAC 1 November 2017, processed by ESA, Copernicus Sentinel-2 data, 2016. a
Coward, M.: Shear zones in the Precambrian crust of southern Africa, J. Struct. Geol., 2, 19–27, 1980. a
Cross, A. and Skemer, P.: Ultramylonite generation via phase mixing in high-strain experiments, J. Geophys. Res.-Sol. Ea., 122, 1744–1759, 2017. a
Dascher-Cousineau, K., Kirkpatrick, J. D., and Cooke, M. L.: Smoothing of fault slip surfaces by scale-invariant wear, J. Geophys. Res.-Sol. Ea., 123, 7913–7930, 2018. a, b
Di Toro, G. and Pennacchioni, G.: Superheated friction-induced melts in zoned pseudotachylytes within the Adamello tonalites (Italian Southern Alps), J. Struct. Geol., 26, 1783–1801, 2004. a
Di Toro, G. and Pennacchioni, G.: Fault plane processes and mesoscopic structure of a strong-type seismogenic fault in tonalites (Adamello batholith, Southern Alps), Tectonophysics, 402, 55–80, 2005. a, b
Dobson, D. P., Thomas, R. W., and Mitchell, T. M.: Diffusion profiles around quartz clasts as indicators of the thermal history of pseudotachylytes, Geochem. Geophy. Geosy., 19, 4329–4341, 2018. a
Dunham, E. M. and Rice, J. R.: Earthquake slip between dissimilar poroelastic materials, J. Geophys. Res.-Sol. Ea., 113, B09304, https://doi.org/10.1029/2007JB005405, 2008. a
Fagereng, Å. and Beall, A.: Is complex fault zone behaviour a reflection of rheological heterogeneity?, Philos. T. R. Soc. A, 379, 20190421, https://doi.org/10.1098/rsta.2019.0421, 2021. a
Fagereng, Å., Hillary, G. W., and Diener, J. F.: Brittle-viscous deformation, slow slip, and tremor, Geophys. Res. Lett., 41, 4159–4167, 2014. a
Fang, Z. and Dunham, E. M.: Additional shear resistance from fault roughness and stress levels on geometrically complex faults, J. Geophys. Res.-Sol. Ea., 118, 3642–3654, https://doi.org/10.1002/jgrb.50262, 2013. a, b, c
Faulkner, D., Jackson, C., Lunn, R., Schlische, R., Shipton, Z., Wibberley, C., and Withjack, M.: A review of recent developments concerning the structure, mechanics and fluid flow properties of fault zones, J. Struct. Geol., 32, 1557–1575, 2010. a
Fehler, M., House, L., and Kaieda, H.: Determining planes along which earthquakes occur: method and application to earthquakes accompanying hydraulic fracturing, J. Geophys. Res.-Sol. Ea., 92, 9407–9414, 1987. a
Fitz Gerald, J. and Stünitz, H.: Deformation of granitoids at low metamorphic grade. I: Reactions and grain size reduction, Tectonophysics, 221, 269–297, 1993. a, b
Fliervoet, T. F., White, S. H., and Drury, M. R.: Evidence for dominant grain-boundary sliding deformation in greenschist-and amphibolite-grade polymineralic ultramylonites from the Redbank Deformed Zone, Central Australia, J. Struct. Geol., 19, 1495–1520, 1997. a
Fusseis, F. and Handy, M.: Micromechanisms of shear zone propagation at the brittle–viscous transition, J. Struct. Geol., 30, 1242–1253, 2008. a
Fusseis, F., Regenauer-Lieb, K., Liu, J., Hough, R., and De Carlo, F.: Creep cavitation can establish a dynamic granular fluid pump in ductile shear zones, Nature, 459, 974–977, 2009. a
Gardner, R. L., Piazolo, S., and Daczko, N. R.: Pinch and swell structures: evidence for strain localisation by brittle–viscous behaviour in the middle crust, Solid Earth, 6, 1045–1061, https://doi.org/10.5194/se-6-1045-2015, 2015. a, b
Gardner, R. L., Piazolo, S., and Daczko, N. R.: Shape of pinch and swell structures as a viscosity indicator: Application to lower crustal polyphase rocks, J. Struct. Geol., 88, 32–45, 2016. a, b
Gilgannon, J., Fusseis, F., Menegon, L., Regenauer-Lieb, K., and Buckman, J.: Hierarchical creep cavity formation in an ultramylonite and implications for phase mixing, Solid Earth, 8, 1193–1209, https://doi.org/10.5194/se-8-1193-2017, 2017. a
Gilgannon, J., Waldvogel, M., Poulet, T., Fusseis, F., Berger, A., Barnhoorn, A., and Herwegh, M.: Experimental evidence that viscous shear zones generate periodic pore sheets, Solid Earth, 12, 405–420, https://doi.org/10.5194/se-12-405-2021, 2021. a
Goodwin, L. B. and Tikoff, B.: Competency contrast, kinematics, and the development of foliations and lineations in the crust, J. Struct. Geol., 24, 1065–1085, 2002. a
Handy, M. R.: Flow laws for rocks containing two non-linear viscous phases: a phenomenological approach, J. Struct. Geol., 16, 287–301, 1994. a
Hutchinson, J. W. and Suo, Z.: Mixed mode cracking in layered materials, Adv. Appl. Mech., 29, 63–191, 1991. a
Ishii, K.: Partitioning of non-coaxiality in deforming layered rock masses, Tectonophysics, 210, 33–43, 1992. a
Janecke, S. U. and Evans, J. P.: Feldspar-influenced rock rheologies, Geology, 16, 1064–1067, 1988. a
Joubert, P.: The gneisses of Namaqualand and their deformation, S. Afr. J. Geol., 77, 339–345, 1974. a, b
Kaven, J. O. and Pollard, D. D.: Geometry of crustal faults: Identification from seismicity and implications for slip and stress transfer models, J. Geophys. Res.-Sol. Ea., 118, 5058–5070, 2013. a
Kerrich, R., Allison, I., Barnett, R. L., Moss, S., and Starkey, J.: Microstructural and chemical transformations accompanying deformation of granite in a shear zone at Mieville, Switzerland; with implications for stress corrosion cracking and superplastic flow, Contrib. Mineral. Petr., 73, 221–242, 1980. a
Kerrich, R., La Tour, T., and Barnett, R.: Mineral reactions participating in intragranular fracture propagation: implications for stress corrosion cracking, J. Struct. Geol., 3, 77–87, 1981. a
Kirkpatrick, J., Shipton, Z., and Persano, C.: Pseudotachylytes: rarely generated, rarely preserved, or rarely reported?, B. Seismol. Soc. Am., 99, 382–388, 2009. a
Kirkpatrick, J. D. and Rowe, C. D.: Disappearing ink: How pseudotachylytes are lost from the rock record, J. Struct. Geol., 52, 183–198, 2013. a, b, c, d, e, f, g, h
Lambert, C. W.: Granitic melt transport and emplacement along transcurrent shear zones: Case study of the Pofadder Shear Zone in South Africa and Namibia, MSc thesis, Stellenbosch University, 2013. a, b, c, d, e
Lin, A.: Glassy pseudotachylyte veins from the Fuyun fault zone, northwest China, J. Struct. Geol., 16, 71–83, 1994. a
Lin, A.: Roundness of clasts in pseudotachylytes and cataclastic rocks as an indicator of frictional melting, J. Struct. Geol., 21, 473–478, 1999. a
Lin, A., Ren, Z., and Kumahara, Y.: Structural analysis of the coseismic shear zone of the 2008 Mw7.9 Wenchuan earthquake, China, J. Struct. Geol., 32, 781–791, 2010. a
Lloyd, G., Ferguson, C., and Reading, K.: A stress-transfer model for the development of extension fracture boudinage, J. Struct. Geol., 4, 355–372, 1982. a
Lloyd, G. E., Butler, R. W., Casey, M., and Mainprice, D.: Mica, deformation fabrics and the seismic properties of the continental crust, Earth Planet. Sc. Lett., 288, 320–328, 2009. a
Lykotrafitis, G. and Rosakis, A.: Dynamic sliding of frictionally held bimaterial interfaces subjected to impact shear loading, P. Roy. Soc. Lond. A Mat., 462, 2997–3026, 2006. a
MacClaren, A.: The geology of the area east of Pofadder with emphasis on shearing associated with the Pofadder Lineament, Northwest Cape, Master's thesis, University of Cape Town, 1988. a
Macey, P. H., Thomas, R. J., Minnaar, H. M., Gresse, P. G., Lambert, C. W., Groenewald, C. A., Miller, J. A., Indongo, J., Angombe, M., Shifotoka, G., Frei, D., Diener, J. F. A., Kisters, A. F. M., Dhansay, T., Smith, H., Doggart, S., Le Roux, P., Hartnady, M. I., and Tinguely, C.: Origin and evolution of the ∼ 1.9 Ga Richtersveld Magmatic Arc, SW Africa, Precambrian Res., 292, 417–451, 2017. a, b, c, d, e
Magloughlin, J. F.: The nature and significance of pseudotachylite from the Nason terrane, North Cascade Mountains, Washington, J. Struct. Geol., 11, 907–917, 1989. a
Magloughlin, J. F.: Immiscible sulfide droplets in pseudotachylyte: Evidence for high temperature (> 1200 ∘C) melts, Tectonophysics, 402, 81–91, 2005. a
Mancktelow, N. S., Grujic, D., and Johnson, E. L.: An SEM study of porosity and grain boundary microstructure in quartz mylonites, Simplon Fault Zone, Central Alps, Contributions in Mineralogy and Petrology, 131, 78–85, 1998. a
Marques, F. O., Fonseca, P. D., Lechmann, S., Burg, J.-P., Marques, A. S., Andrade, A. J. M., and Alves, C.: Boudinage in nature and experiment, Tectonophysics, 526-529, 88–96, 2012. a, b
Melosh, B. L., Rowe, C. D., Smit, L., Groenewald, C., Lambert, C. W., and Macey, P.: Snap, Crackle, Pop: Dilational fault breccias record seismic slip below the brittle–plastic transition, Earth Planet. Sc. Lett., 403, 432–445, 2014. a, b, c, d, e, f
Melosh, B. L., Rowe, C. D., Gerbi, C., Bate, C. E., and Shulman, D.: The spin zone: Transient mid-crust permeability caused by coseismic brecciation, J. Struct. Geol., 87, 47–63, 2016. a, b, c, d, e, f, g
Melosh, B. L., Rowe, C. D., Gerbi, C., Smit, L., and Macey, P.: Seismic cycle feedbacks in a mid-crustal shear zone, J. Struct. Geol., 112, 95–111, 2018. a, b, c, d, e, f, g, h, i, j, k, l, m
Metteer, S.: Strength implications of recycled pseudotachylyte fault veins within mylonites of the Norumbega Shear Zone, Southern Maine, USA, Masters thesis, McGill University, 2021. a
Milliner, C., Sammis, C., Allam, A., Dolan, J., Hollingsworth, J., Leprince, S., and Ayoub, F.: Resolving fine-scale heterogeneity of co-seismic slip and the relation to fault structure, Sci. Rep.-UK, 6, 1–9, 2016. a
Mittempergher, S., Zanchi, A., Zanchetta, S., Fumagalli, M., Gukov, K., and Bistacchi, A.: Fault reactivation and propagation in the northern Adamello pluton: The structure and kinematics of a kilometre-scale seismogenic source, Tectonophysics, 806, 228790, https://doi.org/10.1016/j.tecto.2021.228790, 2021. a
Papa, S., Pennacchioni, G., Menegon, L., and Thielmann, M.: High-stress creep preceding coseismic rupturing in amphibolite-facies ultramylonites, Earth Planet. Sc. Lett., 541, 116260, https://doi.org/10.1016/j.epsl.2020.116260, 2020. a
Passchier, C.: Pseudotachylyte and the development of ultramylonite bands in the Saint-Barthelemy Massif, French Pyrenees, J. Struct. Geol., 4, 69–79, 1982. a, b, c, d, e
Phillips, N. J., Motohashi, G., Ujiie, K., and Rowe, C. D.: Evidence of localized failure along altered basaltic blocks in tectonic mélange at the updip limit of the seismogenic zone: Implications for the shallow slow earthquake source, Geochem. Geophy. Geosy., 21, e2019GC008839, https://doi.org/10.1029/2019GC008839, 2020. a
Pittarello, L., Pennacchioni, G., and Di Toro, G.: Amphibolite-facies pseudotachylytes in Premosello metagabbro and felsic mylonites (Ivrea Zone, Italy), Tectonophysics, 580, 43–57, 2012. a
Price, N. A.: Structure and rheology of the Sandhill Corner shear zone, Norumbega fault system, Maine: A study of a fault from the base of the seismogenic zone, PhD thesis, University of Maine, 2012. a, b, c
Price, N. A., Johnson, S. E., Gerbi, C. C., and West Jr, D. P.: Identifying deformed pseudotachylyte and its influence on the strength and evolution of a crustal shear zone at the base of the seismogenic zone, Tectonophysics, 518, 63–83, 2012. a, b, c, d, e, f
Punturo, R., Cirrincione, R., Fazio, E., Fiannacca, P., Kern, H., Mengel, K., Ortolano, G., and Pezzino, A.: Microstructural, compositional and petrophysical properties of mylonitic granodiorites from an extensional shear zone (Rhodope Core complex, Greece), Geol. Mag., 151, 1051–1071, 2014. a
Quigley, M. C., Mohammadi, H., and Duffy, B.: Multi-fault earthquakes with kinematic and geometric rupture complexity: how common, INQUA Focus Group Earthquake Geology and Seismic Hazards, 2017. a
Quirke, T. T.: Boudinage, an unusual structural phenomenon, Bull. Geol. Soc. Am., 34, 649–660, 1923. a
Ramberg, H.: Natural and experimental boudinage and pinch-and-swell structures, J. Geol., 63, 512–526, 1955. a, b, c, d
Renard, F., Candela, T., and Bouchaud, E.: Constant dimensionality of fault roughness from the scale of micro-fractures to the scale of continents, Geophys. Res. Lett., 40, 83–87, 2013. a
Rennie, S., Fagereng, Å., and Diener, J.: Strain distribution within a km-scale, mid-crustal shear zone: the Kuckaus Mylonite Zone, Namibia, J. Struct. Geol., 56, 57–69, 2013. a
Rowe, C. D., Kirkpatrick, J. D., and Brodsky, E. E.: Fault rock injections record paleo-earthquakes, Earth Planet. Sc. Lett., 335, 154–166, 2012. a
Rowe, C. D., Ross, C., Swanson, M. T., Pollock, S., Backeberg, N. R., Barshi, N. A., Bate, C. E., Carruthers, S., Coulson, S., Dascher-Cousineau, K., Harrichhausen, N., Peña Castro, A. F., Nisbet, H., Rakoczy, P., Scibek, J., Smith, H., Tarling, M. S., Timofeev, A., and Young, E.: Geometric complexity of earthquake rupture surfaces preserved in pseudotachylyte networks, J. Geophys. Res.-Sol. Ea., 123, 7998–8015, 2018a. a, b, c, d
Rowe, C. D., Ross, C., Swanson, M. T., Pollock, S., Backeberg, N. R., Barshi, N. A., Bate, C. E., Carruthers, S., Coulson, S., Dascher-Cousineau, K., Harrichhausen, N., Peña Castro, A. F., Nisbet, H., Rakoczy, P., Scibek, J., Smith, H., Tarling, M. S., Timofeev, A., and Young, E.: Geometric complexity of earthquake rupture surfaces preserved in pseudotachylyte networks, J. Geophys. Res.-Sol. Ea., 123, 7998–8015, 2018b. a
Savage, H. M. and Brodsky, E. E.: Collateral damage: Evolution with displacement of fracture distribution and secondary fault strands in fault damage zones, J. Geophys. Res.-Sol. Ea., 116, B03405, https://doi.org/10.1029/2010JB007665, 2011. a
Savage, H. M., Keranen, K. M., Schaff, D., and Dieck, C.: Possible precursory signals in damage zone foreshocks, Geophys. Res. Lett., 44, 5411–5417, https://doi.org/10.1002/2017GL073226, 2017. a
Schmalholz, S. M., Schmid, D. W., and Fletcher, R. C.: Evolution of pinch-and-swell structures in a power-law layer, J. Struct. Geol., 30, 649–663, 2008. a
Schulte-Pelkum, V. and Mahan, K. H.: Imaging faults and shear zones using receiver functions, Pure Appl. Geophys., 171, 2967–2991, 2014. a
Shaw, C. A. and Allen, J. L.: Field rheology and structural evolution of the Homestake shear zone, Colorado, Rocky Mountain Geology, 42, 31–56, 2007. a
Shervais, K. A. and Kirkpatrick, J. D.: Smoothing and re-roughening processes: The geometric evolution of a single fault zone, J. Struct. Geol., 91, 130–143, 2016. a, b
Sibson, R.: Fault rocks and fault mechanisms, J. Geol. Soc. London, 133, 191–213, 1977. a, b
Sibson, R.: Transient discontinuities in ductile shear zones, J. Struct. Geol., 2, 165–171, 1980. a, b
Sibson, R. H.: Generation of pseudotachylyte by ancient seismic faulting, Geophys. J. Int., 43, 775–794, 1975. a, b, c, d
Sibson, R. H.: Fault rocks and structure as indicators of shallow earthquake source processes, in: Proc. Conf. VIII on Analysis of Actual Fault Zone in Bedrock, Open-File Rept. 79, vol. 1239, pp. 276–304, 1979. a
Sibson, R. H.: Fault zone models, heat flow, and the depth distribution of earthquakes in the continental crust of the United States, B. Seismol. Soc. Am., 72, 151–163, 1982. a
Sibson, R. H.: Continental fault structure and the shallow earthquake source, J. Geol. Soc. London, 140, 741–767, 1983. a
Sibson, R. H. and Toy, V. G.: The habitat of fault-generated pseudotachylyte: Presence vs. absence of friction-melt, edited by: Abercrombie, R., McGarr, A., Di Toro, G., and Kanamori, H., Geophysical Monograph Series, vol. 170, p. 153, AGU American Geophysical Union, 2006. a
Simpson, C.: Deformation of granitic rocks across the brittle-ductile transition, J. Struct. Geol., 7, 503–511, 1985. a
Spray, J. G.: Frictional melting processes in planetary materials: From hypervelocity impact to earthquakes, Annu. Rev. Earth Pl. Sc., 38, 221–254, 2010. a, b
Swanson, M. T.: Pseudotachlyte-bearing strike-slip duplex structures in the Fort Foster Brittle Zone, S. Maine, J. Struct. Geol., 10, 813–828, 1988. a
Swanson, M. T.: Late Paleozoic strike-slip faults and related vein arrays of Cape Elizabeth, Maine, J. Struct. Geol., 28, 456–473, 2006. a
Takagi, H., Goto, K., and Shigematsu, N.: Ultramylonite bands derived from cataclasite and pseudotachylyte in granites, northeast Japan, J. Struct. Geol., 22, 1325–1339, 2000. a
Tan, Y. J., Waldhauser, F., Ellsworth, W. L., Zhang, M., Zhu, W., Michele, M., Chiaraluce, L., Beroza, G. C., and Segou, M.: Machine-learning-based high-resolution earthquake catalog reveals how complex fault structures were activated during the 2016–2017 Central Italy sequence, Seismic Record, 1, 11–19, 2021. a
Thurber, C., Roecker, S., Zhang, H., Baher, S., and Ellsworth, W.: Fine-scale structure of the San Andreas fault zone and location of the SAFOD target earthquakes, Geophys. Res. Lett., 31, L12S02, https://doi.org/10.1029/2003GL019398, 2004. a
Tobisch, O. T., Barton, M. D., Vernon, R. H., and Paterson, S. R.: Fluid-enhanced deformation: transformation of granitoids to banded mylonites, western Sierra Nevada, California, and southeastern Australia, J. Struct. Geol., 13, 1137–1156, 1991. a
Toogood, D. J.: Structural and metamorphic evolution of a gneiss terrain in the Namaqua Belt near Onseepkans, South West Africa, PhD thesis, University of Cape Town, 1976. a
Ueda, T., Obata, M., Di Toro, G., Kanagawa, K., and Ozawa, K.: Mantle earthquakes frozen in mylonitized ultramafic pseudotachylytes of spinel-lherzolite facies, Geology, 36, 607–610, 2008. a
Walcott, C. R. and Craw, D.: Subsolidus physical and chemical mixing of granite and gabbro during mylonitization, South Victoria Land, Antarctica, J. Struct. Geol., 15, 1433–1441, 1993. a
Wenning, Q. C., Madonna, C., de Haller, A., and Burg, J.-P.: Permeability and seismic velocity anisotropy across a ductile–brittle fault zone in crystalline rock, Solid Earth, 9, 683–698, https://doi.org/10.5194/se-9-683-2018, 2018. a
White, J. C.: Transient discontinuities revisited: pseudotachylyte, plastic instability and the influence of low pore fluid pressure on deformation processes in the mid-crust, J. Struct. Geol., 18, 14711479–14771486, 1996. a, b
White, S., Burrows, S., Carreras, J., Shaw, N., and Humphreys, F.: On mylonites in ductile shear zones, J. Struct. Geol., 2, 175–187, 1980. a
Wibberley, C. A., Yielding, G., and Di Toro, G.: Recent advances in the understanding of fault zone internal structure: a review, Geological Society, London, Special Publications, 299, 5–33, 2008. a
Wintsch, R., Christoffersen, R., and Kronenberg, A.: Fluid-rock reaction weakening of fault zones, J. Geophys. Res.-Sol. Ea., 100, 13021–13032, 1995. a
Yang, H., Zhu, L., and Cochran, E. S.: Seismic structures of the Calico fault zone inferred from local earthquake travel time modelling, Geophys. J. Int., 186, 760–770, 2011. a
Young, E. M.: Fast Fourier transform code and input data, Zenodo [code, data set], https://doi.org/10.5281/zenodo.7230199, 2022. a
- Abstract
- Introduction
- Geological setting
- Composition and structure of the Pofadder Shear Zone core
- Shear zone core mylonite geometry
- Implications of shear zone mesostructure for the geometry of earthquake rupture
- Summary
- Data availability
- Author contributions
- Competing interests
- Disclaimer
- Acknowledgements
- Financial support
- Review statement
- References
- Supplement