the Creative Commons Attribution 4.0 License.
the Creative Commons Attribution 4.0 License.
Effect of structural setting of source volume on rock avalanche mobility and deposit morphology
Zhao Duan
Qing Zhang
Zhen-Yan Li
Lin Yuan
Kai Wang
Yang Liu
Deposit morphologies and sedimentary characteristics are methods for investigating rock avalanches. The characteristics of structural geology of source volume, namely the in-place rock mass structure, will influence these two deposit characteristics and rock avalanche mobility. In this study, a series of experiments were conducted by setting different initial configurations of blocks to simulate different characteristics of structural geology of source volume, specifically including the long axis of the blocks perpendicular to the strike of the inclined plate (EP), parallel to the strike of the inclined plate (LV), perpendicular to the inclined plate (LP), randomly (R) and without the blocks (NB) as a control experiment. The experimental materials comprised both cuboid blocks and granular materials to simulate large blocks and matrixes, respectively, in natural rock avalanches. The results revealed that the mobility of the mass flows was enhanced in LV, LP and R configurations, whereas it was restricted in the EP configuration. The mobility decreased with the increase in slope angles at LV configurations. Strand protrusion of the blocks made the elevation of the deposits at LV configuration larger than that at EP, LP and R configurations. A zigzag structure is created in the blocks resulting from the lateral spreading of the deposits causing the blocks to rotate. Varying degrees of deflection of the blocks demonstrated different levels of collision and friction in the interior of the mass flows; the most intensive collision was observed at EP. In the mass deposits, the blocks' orientation was affected by their initial configurations and the motion process of the mass flows. This research would support studies relating characteristics of structural geology of source volume to landslide mobility and deposit morphology.
- Article
(12772 KB) - Full-text XML
- BibTeX
- EndNote
Rock avalanches are a type of ubiquitous geological phenomenon in mountainous regions. Their motion processes often involve multiple granular materials, ranging from large blocks to tiny particles (Ui et al., 1986; Voight and Pariseau, 1978). Many rock avalanches have large blocks with hypermobility (Dufresne, 2012; Mangeney et al., 2010; Goujon et al., 2003; Phillips et al., 2006; Delannay et al., 2017). In some cases, these huge blocks have a larger runout (Charrière et al., 2016; Schwarzkopf et al., 2005). The deposits of rock avalanches often have particular surface structures, such as transverse ridges and lateral levees (Wang et al., 2019; Shea and Van Wyk De Vries, 2008), and unique sedimentary characteristics, such as the inverse grading of particles (Schwarzkopf et al., 2005; Fisher and Heiken, 1982; Dufresne et al., 2016; Hungr, 2006; Duan et al., 2021) and block orientation and distribution (parallel or perpendicular to the motion direction of rock avalanches) (Pánek et al., 2008; Wang et al., 2019). Several factors affect rock avalanches' motion and sedimentary features and morphologies of the resulting deposit (Manzella and Labiouse, 2009; Phillips et al., 2006; Yang et al., 2011; Li et al., 2021; Duan et al., 2019, 2022). However, the characteristics of structural geology in the source of a rock avalanche are significant controlling factors in modulating rock avalanches' propagation (Huang and Liu, 2009; Lucas and Mangeney, 2007; Bartali et al., 2020; Manzella and Labiouse, 2009; Phillips et al., 2006; Manzella and Labiouse, 2013b; Crosta et al., 2017; Duan et al., 2022). It was stated that the existence of discontinuities could reduce the internal friction and further facilitate the long runout of the sliding mass (Lan et al., 2022; Corominas, 1996). In addition, they pointed out that the matrixes played an important role in controlling the runout of rock avalanches because the matrixes can lead to a large amount of energy dissipation during motion.
Field investigations are one of the fundamental methods for examining rock avalanches. These investigations should consider the characteristics of structural geology of the rock mass in the source volume, as well as the surface structures and sedimentary characteristics of rock avalanches' deposits (Y.-F. Wang et al., 2018; Zhu et al., 2019). Indeed, many rock avalanches involved disaggregated rock masses occurring due to discontinuity sets in the source volume (Mavrouli et al., 2015; Pedrazzini et al., 2013; Jaboyedoff et al., 2009; Brideau et al., 2009). Disaggregated rock structures facilitate the occurrence of a rock avalanche. In some recent cases, the rock avalanches, with initial structures in their source volume where the long axis of blocky rock mass was perpendicular or parallel to the strike of sliding surface or perpendicular to the sliding surface, exhibited greater mobility, but it is unclear whether their hypermobility is connected to their initial structures (Pedrazzini et al., 2013; Jaboyedoff et al., 2009; Brideau et al., 2009). The Sierre rock avalanche in Switzerland was reported with a runout distance of about 14 km and an extremely low apparent friction coefficient (Pedrazzini et al., 2013). In the source volume of the rock avalanche, there are three joint sets that make the rock mass fragmented and blocky before sliding. Similarly, the Randa rockslide in Switzerland (Brideau et al., 2009) and the Frank rock avalanche in Turtle Mountain, Canada (Jaboyedoff et al., 2009), with disaggregated rock mass by joint sets, were also reported with large mobility. It is noted that the disaggregated rock masses in source volume of these rock avalanches have different orientations of the long axis of rock blocks. However, whether the different orientations of the long axis of rock blocks affect the mobility and deposit morphology of rock avalanches is unclear.
In previous studies, the deposits of rock avalanches have been extensively investigated to reveal the kinematics of rock avalanches during motion. For a rock avalanche's deposit, the spatial distribution of particle size (Gray and Hutter, 1997; Zeng et al., 2020; Zhao et al., 2021; Baker et al., 2016; Getahun et al., 2019; Dufresne et al., 2016) and the arrangement of blocks (Pánek et al., 2008; Wang et al., 2019; Moreiras, 2020; Dufresne et al., 2021) are prominent features requiring thorough examination. In fact, the latter has become a hotspot for investigation. An obvious orientation of the long axis of large blocks (Fig. 1) was clearly discerned on the deposits of the Taheman rock avalanche and Nixu rock avalanche on the Tibetan Plateau, China (Wang et al., 2021), the rock avalanche on the Black Rapids Glacier, Alaska, USA, (Shugar and Clague, 2011), and the Jiweishan rock avalanche in Chongqing, China (Zhang et al., 2019). For studying the pyroclastic flow deposits that occurred in the northeastern area of Arequipa, southern Peru, Dufresne et al. (2021) quantified the orientation of large blocks using a statistical method. They stated that the compression of deposits caused the orientation during accumulation. It is plausible that the orientation of large blocks is closely related to the mobility process of rock avalanches. However, it is unclear whether the process is related to the characteristics of structural geology in the source volume of rock avalanches.
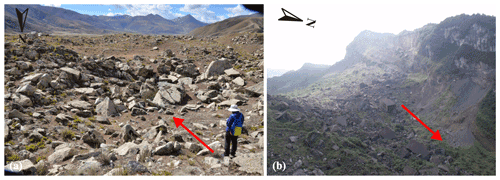
Figure 1Giant blocks and their orientations (the red arrow indicates the motion direction of the rock avalanches): (a) the Nixu rock avalanche on the Tibetan Plateau, China (the base photo was provided by Yufeng Wang and Qiangong Cheng, Wang et al., 2021), and (b) the Jiweishan rock avalanche in Chongqing, China (the base photo was provided by Ming Zhang, Zhang et al., 2019).
In rock avalanches, it is hard to know whether the characteristics of structural geology of the source volume were related to the orientation of large blocks in the deposits by field investigation, due to the role that motion process of rock avalanches played being unknown. In fact, to monitor the motion process of rock avalanches is also hard as we do not know when and where they will occur. Consequently, it is difficult to find a relationship between these rock avalanches' characteristics.
Therefore, physical model experiments, in which the blocks with rectangular shapes were poured into a container either regularly or randomly, were established to study the kinematics and deposit morphologies of rock avalanches (Manzella and Labiouse, 2009; Phillips et al., 2006; Yang et al., 2011; Manzella and Labiouse, 2013b). Manzella and Labiouse (2009) illustrated that the runout of experimental rock avalanches was larger when the long axis of the blocks was adjusted parallel to the strike of the inclined plate than when the blocks were filled randomly. Bowman and Take (2015) also performed model experiments and used different initial configurations of large blocks to examine the mobility of rock avalanches. However, it was noted that the conditions that cause the long axis of blocks pointing toward other directions were absent in their experiments. In addition, for natural rock avalanches, the material components include both large blocks and matrixes with smaller particle sizes (Glicken, 1996), whereas the materials used in the aforementioned experimental studies were all large blocks or granules with small particle sizes. Yang et al. (2011) conducted experiments on the materials simultaneously comprising large blocks and granular matrixes. However, the blocks were cubes; therefore, the researchers could not examine the orientation characteristics of large blocks in deposits. Experiments combining large blocks and granular matrixes were also conducted by Phillips et al. (2006). Based on the experimental results, they clearly interpreted the reasons for hypermobility in the rock avalanches, which was that the granular matrixes lubricated the flow of large blocks by rolling. They briefly discussed the deposit morphologies and sedimentary characteristics, including the preserved initial arrangement of large blocks and zigzag-like arrangement.
The abovementioned experimental studies can provide a firm foundation for the kinematics of rock avalanches. Nevertheless, experiments on the materials comprising both large blocks and granular matrixes should be conducted to study the mobility and deposit morphologies of rock avalanches at different initial structures of the original rock. Moreover, the influencing factors and possible reasons for the long axis orientation of large blocks in rock avalanche deposits should be probed from experimental viewpoints.
Hence, physical model experiments with materials containing large blocks and granular matrixes were performed in this study. The large blocks were set with different initial structures to simulate rock avalanches with a rock mass disaggregated by discontinuity sets to examine rock avalanche propagation and surface morphology and sedimentary characteristics of the resulting deposit. The objectives of this study are (1) to examine the changing mobility of rock avalanches at different block configurations and slope angles, (2) to explore the differences and reasons for the surface structures and sedimentary characteristics of deposits under those two factors, and (3) to determine the orientation of large blocks' long axis in each experimental rock avalanche's deposit and interpret the orientation differences from their motion processes. This research may provide a reference for investigating the mobility of rock avalanches and revealing the reason for large blocks' orientation. This research, which considered different conditions under which rock masses in source volumes were disaggregated by discontinuity sets and where the long axis of blocky rock masses had different orientations, might provide a significant contribution relating characteristics of structural geology of source volumes to landslide mobility and deposit morphology. However, there was a limitation in that we considered the blocks as a regular form, which was not often true in natural conditions and could be improved in future studies.
2.1 Apparatus
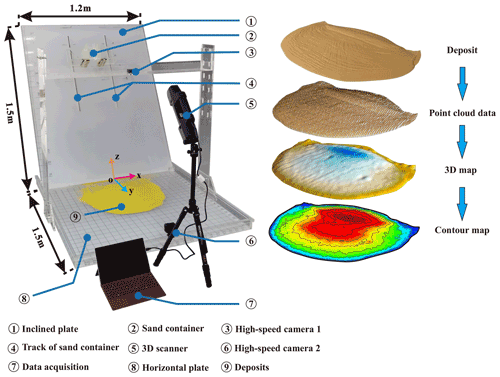
The propagation and deposit morphology of experimental rock avalanches were studied in a sandbox experiment. A plexiglass apparatus comprising five parts, namely an inclined plate, a horizontal plate, a sand container, a 3D scanner and two high-speed cameras, was used to construct the experimental devices. A pair of sandbox tracks were installed in the inclined plate to adjust the sandbox's height. The horizontal and inclined plates were 1.5 m long and 1.2 m wide, respectively (Fig. 2). The specified volume of the sandbox with a side-by-side gate was 3.6 × 10⁻³ m3. A 3D scanner (8 frames per second, 1.3 megapixel resolution) captured the whole process of the experimental rock avalanches in motion and generated 3D coordinate data of the free surface. The accuracy of the 3D scanner was 0.1 mm. It had three lenses: an emitter lens at the bottom and two lenses at the top – one with a near-infrared (NIR) sensor and one that could acquire color images. During scanning, an NIR ray was emitted, reflected from the objects' surfaces and received by the lenses at the top of the 3D scanner. The received NIR data were converted into 3D cloud data and color images. The 3D data were collected according to the principles of stereoscopic parallax and active triangular ranging. The right part of Fig. 2 depicts the data types that the 3D scanner can acquire and subsequently process. Two high-speed cameras (120 frames per second, 0.4 megapixel resolution) were used to collect images at the end of each experiment. One was placed on a camera shelf, which could be adjusted up and down and front to back, to obtain deposit photos with an overhead view. The other one was fixed at the front of the horizontal plate with a front view.
2.2 Materials
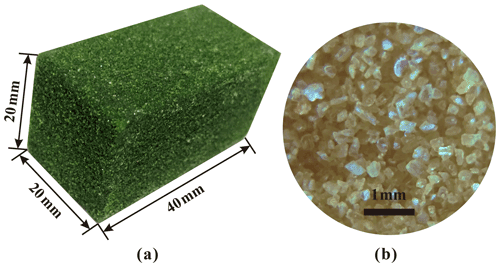
The cuboid blocks (Fig. 3a) were manufactured from quartz sand and cemented with epoxy glue to simulate the large blocks in natural rock avalanches. These cuboid blocks had a mass of 38 ± 0.1 g and dimensions of 20 × 20 × 40 mm. The corresponding equivalent particle size was 31.26 mm. The mass ratio between the epoxy glue and quartz sand is 1:3. A layer of quartz sand was attached to the surface of the cuboid blocks using epoxy glue to produce a rough surface.
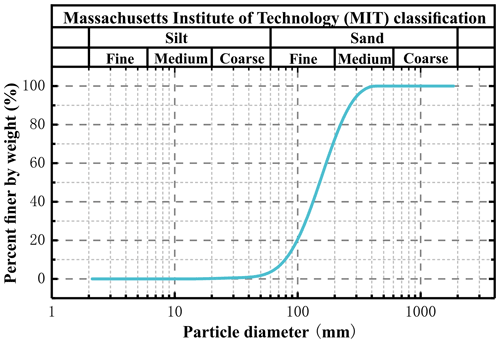
The quartz sand (Fig. 3b) simulated the granular matrixes filled between the blocks. Figure 4 depicts the particle size distribution of the sand. It had an uniformity coefficient of 2.39 (, D60 is the particle size corresponding to the value smaller than 60 % of the mass proportion, and similarly D10 is the particle size corresponding to the value smaller than 10 %), a curvature coefficient of 1.19 (, where D30 is the particle size corresponding to smaller than 30 % of mass proportion), an average diameter of 0.18 mm and a specific surface area of 0.02 m2 kg−4. The internal friction angle ϕ was 36∘, and the cohesion c was 0.
The ratio between the equivalent particle size of the blocks and the average particle size of the sand was 156:1. This ratio was between 167:1 and 45:1, which is the ratio interval of equivalent particle size between large blocks and granular matrixes for natural rock avalanches (Dufresne et al., 2016).
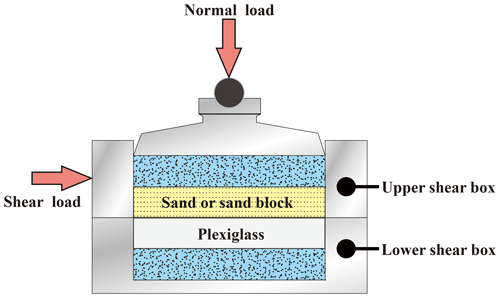
The friction coefficient of the interface between sand and the plexiglass must be obtained. The direct shear tests were performed to determine the internal friction angle of the interface, and the tangent value of the internal friction angle was used as its friction coefficient. During the tests, a customized plexiglass cylinder 61.8 × 10 mm was installed into the lower shear box. The sand or blocks had the exact same specification as the customized plexiglass cylinder and were filled into the upper shear box. Therefore, the shear surface is the interface (Fig. 5). The interface friction parameter of plexiglass and sand was 0.42.
2.3 Experimental method
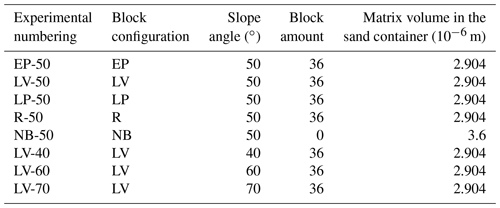
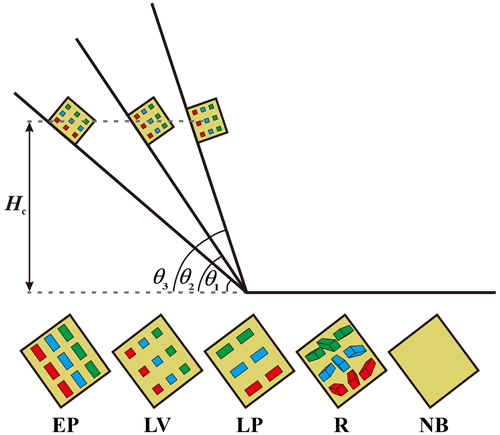
Figure 6 shows the experimental setup of simulated rock avalanches. The blocks are placed in four kinds of configurations when they are filled into the sand container: the long axis of the blocks perpendicular to the strike of the inclined plate (EP), parallel to the strike of the inclined plate (LV), perpendicular to the inclined plate (LP) and randomly (R). In addition, a contrast experiment without blocks (NB) was also designed in this study. Figure 7 shows the variation of block configurations and slope angles. Except for the contrast experiment, the percentage of blocks was 25 % for each experiment group, which was between 10 % and 80 % for natural rock avalanches (Makris et al., 2020; Dufresne and Dunning, 2017; Dufresne et al., 2016). Manzella and Labiouse (2009) revealed that the rock avalanche exhibited greater mobility at the LV configuration. Hence, experiments were also conducted at 40, 50, 60 and 70∘ with the LV configuration to explore the effects of slope angles. Table 1 presents the details of the experimental scheme. The height of the center of gravity for each group of the experiments was 0.7 m. The matrix density for each group of the experiments was 1.5 × 10³ kg m−3.
While preparing for the experiments, the inner surface of the sand container and the inclined and horizontal plates were cleansed with static-proof liquid. After drying these cleaned apparatuses, 180 g of sand was poured in and leveled. Thereafter, 12 blocks were arranged on the even sand layer, and a third layer of 180 g of sand was then poured in to cover the first 12 blocks and leveled. The abovementioned filling procedures were repeated thrice until the sand container was filled completely. After the filling operations were completed, the sand container's gate was opened and the whole mobility process of an experimental rock avalanche was captured using a 3D scanner and two high-speed cameras.
The displacement of experimental rock avalanches was defined as the difference between the front position of the mass flow and the starting point, which was present at the bottom of the overlap surface (displacement = 0) between the sand container and the inclined plate. The duration of the experimental rock avalanches was from the moment the material was released to the moment the front of the sliding mass ended moving forward.
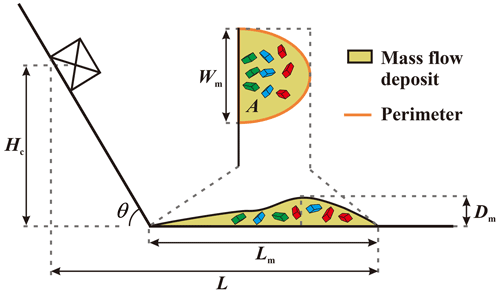
Figure 6Diagram of experimental rock avalanches: Lm is the maximum length of the deposit, Wm is the maximum width of the deposit, Dm is the maximum depth of the deposit, A is the area of the deposit projected on the horizontal plane, P is the perimeter of the deposit, θ is the slope angle, Hc is the height of the sandbox from the center of gravity and L is the runout of the sliding mass.
3.1 Runout and velocity
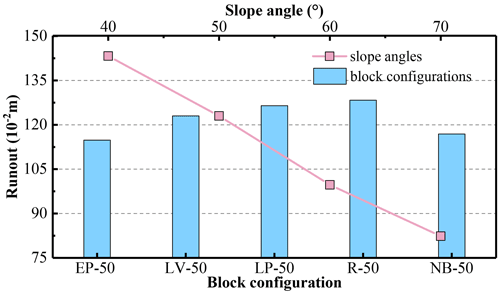
Figure 8 demonstrates the runout of each experimental rock avalanche. At different block configurations, the runout of experimental rock avalanches had a minimum value of 114.81 × 10⁻² m at EP-50 and a maximum value of 128.33 × 10⁻² m at R-50. Notably, the runout at the EP-50 configuration was smaller than that at NB-50 configuration (116.89 × 10⁻² m). At the LV configuration, the runout decreased linearly with the increase in the slope angles.
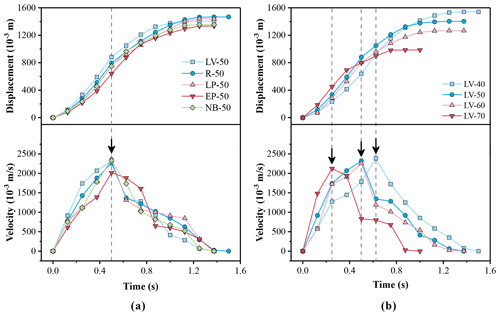
Figure 9a shows that the duration of the mass flows was 1.375 s at EP-50, LV-50, LP-50 and NB-50 but was 1.5 s at R-50. The displacement showed an exponentially increasing trend at the early stage and a logarithmically increasing trend at the later stage. The peak velocity of the mass flows was approximately 2300 × 10−3 m s−1 at LV-50, LP-50, R-50 and NB-50 but was 2016 × 10−3 m s−1 at EP-50, which was apparently smaller than those four conditions. The point of time was 0.5 s when these five mass flows reached their peak velocities.
Figure 9b illustrates that the duration of the mass flows decreased with the increase in slope angles. The durations at LV-40, LV-50, LV-60 and LV-70 were 1.5, 1.375, 1.375 and 1 s, respectively. The displacement of the mass flows at different slope angles demonstrated the same trend as those at different block configurations. With the increase in slope angles, the peak velocity of the mass flows and the time they spent to reach their peak velocity were decreased. The front of the mass flows reached the slope break at the same time at which the mass flows attained their peak velocity. The mass flows would certainly continue to accelerate if the inclined plate was longer because the slope angles were always larger than the internal friction angle of the experimental materials.
3.2 Morphology of deposits
3.2.1 Morphological parameters
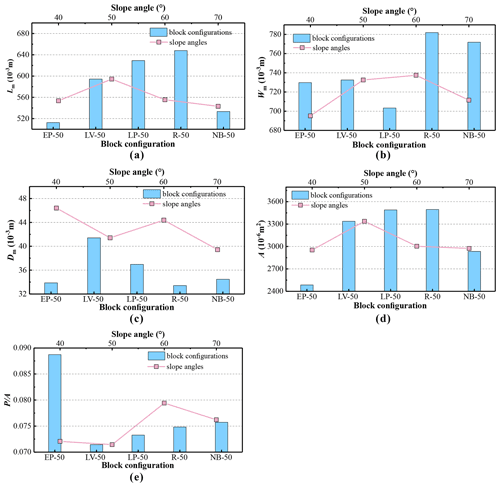
Figure 10a shows the maximum length of the deposits of the mass flows. The histogram of Fig. 10a shows that the length had a maximum value of 647.76 × 10⁻³ m at R-50 but had a minimum value of 512.5 × 10⁻³ m at EP-50, which was smaller than the value at NB-50. The line chart of Fig. 10a revealed that the length increased first and then decreased with the increase in slope angles. It attained a maximum value of 669.83 × 10⁻³ m at LV-50.
The histogram of Fig. 10b shows that the width had a maximum value of m at R-50 but had a minimum value of 703.29 × 10⁻³ m at LP-50. The deposit width at EP-50, LV-50 and LP-50 was smaller than the width at NB-50. The line chart of Fig. 10b shows that the width increased first and then decreased with the increase in slope angles.
The histogram of Fig. 10c shows that the depth had a maximum value of 41.42 × 10⁻³ m at LV-50 but had a minimum value of 33.42 × 10⁻³ m at R-50. The depth at EP-50 and R-50 was smaller than the width at NB-50. The line chart in Fig. 10c shows that the width first decreased but then increased at 60∘.
The histogram in Fig. 10d shows that the deposit area had a maximum value of m2 at R-50 and a minimum value of m2 at EP-50. The line chart of Fig. 10d shows that the area increased first and then decreased with the increase in slope angles.
The histogram of Fig. 10e shows that the perimeter–area ratio had a maximum value of 0.089 at EP-50 but had a minimum value of 0.071 at LV-50. The line chart of Fig. 10e shows that the perimeter–area ratio had a maximum value of 0.089 at LV-60; however, it was smaller than that at EP-50.
A comparison showed that the block configurations exerted a more significant effect on the deposit parameters of the mass flows than slope angles. These deposit parameters had a larger amplitude of variation at different block configurations.
3.2.2 Surface structures and sedimentary characteristics
The digital elevation model of the mass deposits can be established using the point cloud data obtained by the 3D scanner. This model can reflect the elevation characteristics of the deposits (Fig. 11a) resulting from block configurations and slope angles. A thorough comparison reveals that the elevation of the mass flows at EP-50, LP-50, R-50 and NB-50 was apparently smaller than that at LV-40, LV-50, LV-60 and LV-70. At EP-50, LP-50 and R-50, the surface elevation was similar to NB-50. Moreover, the protrusion of blocks was less obvious than that seen for the LV experiments (Fig. 11a), demonstrating that most parts of the blocks emerged in the granular matrixes. At LV-40, LV-50, LV-60 and LV-70, the elevation of granular matrixes was approximately equal to the elevation of the deposits at EP-50, LP-50, R-50 and NB-50. A string of protrusions was observed on the surface of the deposits (Fig. 11a). Figure 11b shows the protrusion of the stranding blocks. At LV-40 and LV-50, some blocks were located away from the main deposit at a different position.
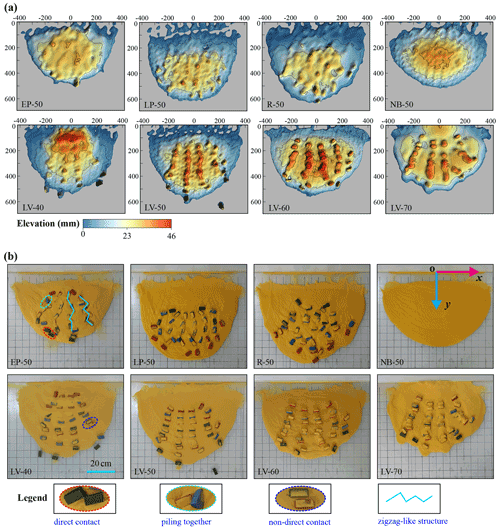
Figure 11The surface morphology of the rock avalanches' deposit shown as (a) contour maps with elevation and (b) images of the rock avalanches.
Figure 11b presents the contact relationship of blocks and arranging characteristics of the mass deposits. At EP-50 and LP-50, the symmetry of the deposits and their inner blocks was relatively low along the y axis (the position of the coordinate is the same for each group of experiments, in which the origin of the coordinate is at the middle of the intersecting line between the inclined and horizontal plate). The spacing between blocks was small. Several forms of contact between blocks, such as direct contact, non-direct contact (the blocks are separated by matrixes to prevent a direct contact) and piling together, were discerned in the mass deposits. The blocks formed a series of zigzag-like structures on the deposit surfaces at EP-50 and LP-50. At R-50, the blocks in the deposit exhibited no symmetry. There was only direct contact and non-direct contact observed in the deposit.
At LV-40, LV-50, LV-60 and LV-70, the deposits and their inner blocks showed good symmetry along the y axis. The long axis of the blocks closed to the y axis had a small angle along the x axis; however, the angle grew larger with the increase in the distance between the blocks and the y axis. In these four conditions, the blocks came into contact through matrixes. In addition, the matrixes covered on the surface of the blocks increased by comparing with those at EP-50, LP-50, and R-50.
Generally, the blocks in these deposits of mass flows showed a good sequence that inherited the initial position sequence (Fig. 7) in the sand container. The initial position sequence was marked by different colored blocks. After releasing the materials, the upper and front part of the sliding mass moved first, after which the subsequent sliding mass moved in sequence. For example, in the experiments using LV conditions, the color of the first layer of blocks in the sand container from top to bottom was green, blue and red in sequence. Correspondingly, the color of front blocks in deposits was green and subsequently blue and red. The same is true for the second and third layers of blocks above the first layer of blocks in the sand container. In addition, we noted that the mass flows with a longer runout often had a more spread out layout of blocks. In most cases, the blocks played an important role in controlling the mobility of rock avalanches.
3.3 Orientation of blocks in deposits
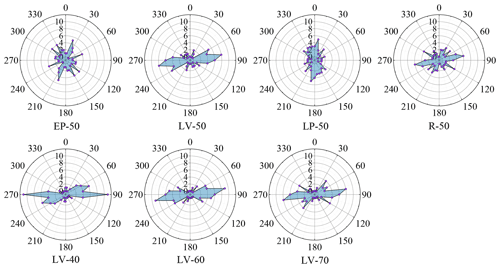
In this study, the direction of the long axis of the blocks was measured to quantitatively examine the orientation of the blocks in the mass deposits. The y axis was defined as 0∘ during the statistical analysis; based on this, the orientation of the blocks was obtained. Figure 12 shows that the blocks still exhibited predominant orientations for each group of experiments despite having a distribution of multiple orientations at EP-50, LP-50 and R-50. The orientation distribution was scattered under the conditions of EP-50, and hence there was no dominant orientation of the blocks. At LP-50, the orientation of the blocks was mainly at intervals of 310–360 and 0–10∘. At R-50, the orientation of the blocks occurred mainly at 80 and 120∘.
At LV-40, LV-50, LV-60 and LV-70, the long axis of the blocks arranged towards a uniform direction increased compared to that at EP-50, LP-50 and R-50. At LV-40, LV-50, LV-60 and LV-70, the orientation of the blocks was mainly observed between 60 and 90∘, but a distribution of 40 and 120∘ was still observed at LV-70.
4.1 Runout of rock avalanches
The blocks' configurations at the source volume exerted a significant influence on the runout of rock avalanches. The runout of the mass flow was largest at R-50, which was attributed to the release of the blocks. These blocks were randomly stacked in the container. Following the release of materials, the blocks stacked at a higher position would lower their center of gravity due to an unstable piling state. As a result, they push the front mass forward, resulting in the mass flow having a maximum runout and the depth and height of the center of gravity of the deposits having minimum values. For LV-50, the energy dissipation caused by collision and friction during motion is thought to be decreased because of a regular arrangement of the blocks (Manzella and Labiouse, 2013a). Nevertheless, the energy dissipation for rolling of blocks during motion is thought to be increased because the blocks can be easier to roll at the configurations of LV. Correspondingly, the runout of the mass flow was smaller than the runout at R-50. At EP-50, the long axis of the blocks was aligned along the direction of the mass flow before its release; therefore, the lateral spreading of the mass flow during motion would change the direction of the blocks to a larger extent. During the motion, the energy of the mass flow dissipated by collision and friction among the blocks was larger; hence, its runout was minimum. The closing contact and change in the blocks' orientation offered direct evidence that a potential interaction of the blocks occurred during the motion. At LP-50, the blocks were perpendicular to the inclined plate before the release, in which they would evolve to the form of EP-50 gradually during the motion and transfer more energy to the front mass. However, the energy loss due to collision and friction of the blocks was thought to be decreased compared with EP-50 according to the difference of deposit structures. Therefore, the mass flow had a relatively long runout. Certainly, though the runout variation between many of the experiments was relatively small, it was plausible to believe that the differences in runout were the result of the changes in block configurations. The runout variation between many of the experiments was larger than the standard deviation of 2.41 × 10⁻³ m (mean runout 116.92 × 10⁻² m) in pre-repeated experiments that were conducted 8 times under the same experimental conditions with sand.
Slope angles also have a noticeable impact on the runout of mass flows. The results demonstrated that the runout was decreased with the increase in the slope angles, which was consistent with previous studies (Fan et al., 2016; Crosta et al., 2015; Crosta et al., 2017; Duan et al., 2020), regardless of the experimental apparatus (with or without side walls). The reason for the decreased runout was that the energy loss of the sliding mass due to colliding at the slope break increased with the increase of the slope angles (Zhang et al., 2015; Ji et al., 2019; Y. Wang et al., 2018).
The existence of matrixes also affects the runout of the mass flows. Manzella and Labiouse (2009) showed a converse trend in the same block configurations of LV and R, which was mainly caused by the difference in experimental materials. Because the matrixes were missing from their block studies, the blocks would collide directly and generate friction throughout the motion. Many interlocked structures were formed when the blocks were poured into the container. After releasing the mass, the constraints from the container disappeared. Following this, the blocks would overcome the interlocked structures and collide and produce friction. This action causes a large amount of energy dissipation during the motion. Moreover, the mass flow had a low runout. At a regular piling of the blocks in Manzella and Labiouse (2009), similar to the configuration of LV in this study, the collision and friction of the blocks decreased significantly, leading to a large runout of the mass flow. In general, the matrixes served as a conduit for transferring the interaction force between blocks to prevent a dramatic direct contact in present study. Because of the matrixes, most of the blocks were in direct contact with each other, and the friction was changed to rolling friction from sliding friction.
In fact, in the source volume of natural rock avalanches, there are disaggregated rock masses (Mavrouli et al., 2015; Carter, 2015; Locat et al., 2006; Welkner et al., 2010; Zhu et al., 2020; Pedrazzini et al., 2013). The rock masses are blocky and have different orientations of their long axes for different rock avalanches (Mavrouli et al., 2015; Jaboyedoff et al., 2009; Brideau et al., 2009; Pedrazzini et al., 2013). It was reported that the existence of discontinuity sets would affect the stability and mobility of rock avalanches (Manzella and Labiouse, 2013a; Manzella and Labiouse, 2009; Mavrouli et al., 2015; Corominas, 1996; Lan et al., 2022). The Sierre rock avalanche in Switzerland was reported with a runout distance of about 14 km and extremely low apparent friction coefficient (Pedrazzini et al., 2013). The rock mass of the rock avalanche has a structural feature in source volume, in which the long axis of the blocky rock mass fragmented by discontinuity sets is parallel to the strike of the sliding surface, showing a similarity with the configuration of LV in this study. Similarly, the Ganluo rock avalanche in China (Zhu et al., 2020), which also has structural features in source volume that are similar to the configuration of EP, has a long axis in the blocky rock mass fragmented by discontinuity sets and perpendicular to the sliding surface. The rock avalanche was reported with a runout of 320 m and an apparent friction coefficient of 0.58. Although these two rock avalanches have different mobility, it is inappropriate to attribute the difference in mobility to the discontinuity sets because the volume and topography of the two rock avalanches are also different. Extensive field investigations or numerical simulations are needed to clarify whether the variation in the discontinuity sets affects the rock avalanches' mobility at an approximate volume and an approximate topography. There is significant scientific debate regarding the physical processes that result in the enhanced mobility of rock avalanches. However, given the limited mobility of the laboratory flows, it is likely that the experiments do not capture the mechanisms leading to the mobility of natural events.
4.2 Morphological differences and corresponding reasons
The protrusion of blocks in the deposit at the LV configuration was clearly distinct from those at the other configurations. At EP-50, LP-50 and R-50, the deposit surface was at a low elevation, which was attributed mainly to the low thickness of the matrixes underlying the blocks. The thickness was approximately 10 mm and even close to 0 mm in some places. At LV configuration, the thickness of the matrixes underlying the blocks was larger than 10 mm and even close to 20 mm in some places. The protrusion of large blocks was often observed on the deposit surface of natural rock avalanches (Shugar and Clague, 2011; Cole et al., 2002; Schwarzkopf et al., 2005). The generation of protrusion because of the stranding of large blocks was related to the inverse grading of particles, i.e., large particles sitting at a higher positions during motion due to dispersive pressure and dynamic sieving (Dasgupta and Manna, 2011; Felix and Thomas, 2004). It was noted that the arrangement of the blocks in the source area is preserved in the deposit in this study when the blocks were placed in the configuration of LV into the sand container. According to the study of Magnarini et al. (2021), the arrangement of fragmented rock in the source area was also well preserved in the deposit of the El Magnifica rock avalanche. These kinds of structures in deposits of rock avalanches, which are also observed in the work of Manzella and Labiouse (2013a), demonstrated a motion process of less energy dissipation due to less interaction of blocks.
The regular arrangement and reduced direct contact of the blocks in the deposits at LV-40, LV-50, LV-60 and LV-70 led to the understanding that the blocks might maintain their original arrangement throughout the mobility process at the LV configurations, preventing direct collision and friction. In fact, the blocks tended to keep their initial arrangement from the structure of a regular piling of the blocks in the deposit at an initial LV configuration (Manzella and Labiouse, 2013a).
In this paper, the collision and friction of the blocks during motion were relatively drastic at EP-50, LP-50 and R-50, especially at EP-50, because there were many direct contacts piling structures of the blocks in the deposit (Fig. 11b). The blocks would deflect throughout the motion, causing the matrixes surrounding them to be pushed aside and leaving space into which the blocks could immerse themselves. As a result, the thickness of the matrixes beneath the blocks was smaller at EP-50, LP-50 and R-50. Correspondingly, the depth of these deposits was smaller.
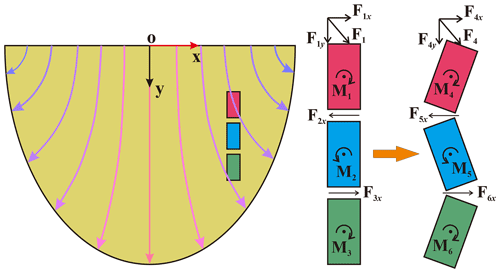
The zigzag structure comprising a string of blocks is a type of unique phenomenon occurring on the deposit surface. Phillips et al. (2006) have also produced similar results. In their study, the rectangular glass slabs were arranged with their long axis vertical and their largest face parallel to the plane of the gate, similar to the configuration in which the rectangular sand blocks were placed parallel with the inclined plate and vertical to its dip. The zigzag structures were also observed in their experiments. The reason for their formation was unknown. Figure 13 shows the process for the formation of the zigzag structures in this study. Because there were no sidewalls in the path of the mass flows, they would spread laterally, subjecting the backside of a block subject to a force F1 at an angle with the y axis. The force can be divided into F1x and F1y along the x axis and y axis, respectively. The F1y would push the block forward, whereas F1x would generate a moment clockwise, deflecting the block under the influence of the moment. Meanwhile, the matrixes on the front side of the blocks would be subjected to a force F2x along the negative x axis, making the blue block on the front of the red block face a moment M2 and consequently deflecting it counterclockwise. By parity of reasoning, the front blocks would deflect clockwise and counterclockwise. As a result, the zigzag structure was formed during this process.
4.3 Orientation of blocks
Naturally, the orientation of large blocks is observed in the deposit rock avalanches (Mcdougall, 2016; Fisher and Heiken, 1982; Zhang et al., 2019; Pánek et al., 2008; Dufresne et al., 2021; Deganutti, 2008; Reznichenko et al., 2011; Jomelli and Bertran, 2001; Dufresne, 2017; Shugar and Clague, 2011). Most researchers investigate this phenomenon through field investigation, and they conclude that the phenomenon is closely related to the motion process of rock avalanches. However, it has been unclear how to determine the relationship between the orientation of blocks in deposits and the motion process under different conditions because the geological environments are different for each rock avalanche. Therefore, seven groups of experiments were conducted at different initial configurations of materials to investigate the orientation of the blocks.
Under EP-50, LP-50 and R-50, the long axis of the blocks was multi-orientation, but there were still predominant orientations for each group of the experiments. The existence of predominant orientation at R-50 demonstrated that the variation of orientation of the blocks, which was due to the interaction of the blocks and matrixes, was from disorderly to orderly. At EP-50 and LP-50, the unconcentrated orientation of the blocks in the deposit demonstrated a more intensive interaction in the interior of the mass flows during the motion because of the lateral spread (Johnson et al., 2012; Mangold et al., 2010; Reznichenko et al., 2011). In these two configurations, the blocks were prone to be affected by the lateral spread because their long axis was along the motion direction of the mass flows. Therefore, the side force due to lateral spread can easily change the blocks' orientation. A more unconcentrated orientation of the blocks at EP-50 compared with LP-50 demonstrated a more intensive interaction of collision and friction in the mass flow. At EP-50, LP-50 and R-50, the sides of the blocks were almost totally buried and the contact area between the blocks and the matrixes became large. Hence, the force of the blocks from the matrixes was large and correspondingly led to a larger number of deflected blocks.
At LV configuration, parts of the sides of the blocks were buried by the matrixes. Correspondingly, there was a limited contact area between the blocks and the matrixes. Therefore, the force of the blocks from the matrixes was small, correspondingly leading to a small deflection of the blocks. The blocks could keep their initial direction well during motion from the approximate direction of 90∘ of the blocks in the deposits at the initial configurations of LV. With the increase in slope angles, the extent to which the blocks had a similar orientation decreased. At LV-40, the predominant orientation of the blocks was almost 90∘, whereas it had a small deflection and some sub-predominant orientation at LV-50, LV-60 and LV-70. The reason was the impact force increased with the increase in the slope angles (Ji et al., 2019; Asteriou et al., 2012; Li et al., 2015). In summary, the orientation of the blocks in the deposits was less influenced by slope angles at the initial configurations of LV.
4.4 Interaction of blocks and matrix
The matrixes perform various functions during the motion of the mass flows. First, the matrixes serve as a medium during the movement of the blocks (Fig. 14a). The matrixes beneath the blocks reduced the resistance of the blocks while moving forward because they exhibit a rolling characteristic. In the absence of matrixes, the blocks would slide forward. Second, the matrixes changed the interaction form of the blocks during motion (Fig. 14b). The presence of the matrixes promoted rolling contact between blocks (Phillips et al., 2006). Third, the matrixes played a buffering role in the blocks at the slope break (Fig. 14c). The matrixes would fill the slope break and make it a smooth transition from a sharp transition, which led to a gentle process when the blocks get from the inclined plate to the horizontal plate. Therefore, the extent of a change in the orientation of the blocks decreased a lot at the slope break. If the matrixes were absent, the orientation of the blocks would change a lot because of the randomness of the blocks after a colliding at the slope break. That was clearly shown in the experiments of Manzella and Labiouse (2013b). Even at LV configuration, in which the blocks tended to keep their initial orientation, the orientation of the blocks changed a lot because of a collision at the slope break. Fourth, the matrixes exerted a constraining effect on the blocks (Fig. 14d). The matrixes at the flanks and front of the mass flows would restrict and avoid the separation of the blocks near the boundary during the motion of the mass flows. In the middle part of the mass flows, the matrixes around the blocks limited the change in position and avoided a substantial deflection of the blocks.
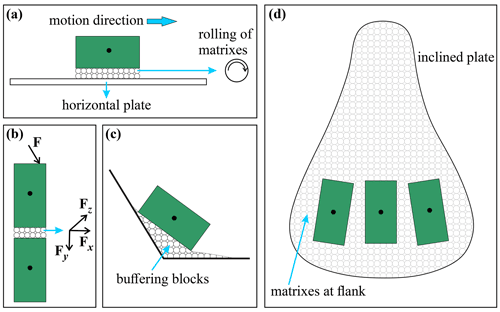
Figure 14The functions of matrixes in experimental rock avalanches: (a) the motion on the horizontal plate, (b) the interaction of blocks, (c) the buffering effect of matrixes, and (d) the constraining effect of matrixes.
To summarize, the matrixes were crucial during the motion of a mass flow. They can avoid a significant change in the blocks' orientation, act as a buffer for the movement of the blocks to the slope break, and change the friction form of the blocks. In this paper, the matrixes are medium-fine sand. As a result, they were used to simulate rock avalanches containing both disaggregated rocks and granular matrixes. However, for some rock avalanches, the matrixes are cohesive; therefore, the experiments considering different types of matrixes are also worth more studying.
4.5 Comparison with previous studies
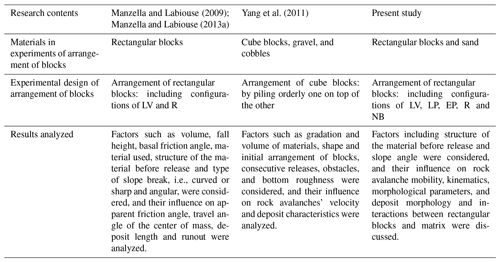
We know that rock avalanches often evolve from disaggregated rock masses via discontinuity sets. The disaggregated rock masses are blocky and with different orientations of their long axes for different rock avalanches (Mavrouli et al., 2015; Pedrazzini et al., 2013; Jaboyedoff et al., 2009; Brideau et al., 2009). In previous studies, Manzella and Labiouse (2009) and Manzella and Labiouse (2013a) performed experimental rock avalanches considering conditions were the long axis of the blocks was adjusted parallel to the strike of the inclined plate (LV configuration in this study) and the blocks were filled randomly. In these two conditions, the experimental material was only the blocks but without fine matrixes. However, the rock structures in the source volume of natural rock avalanches are various, including the long axis of the blocks perpendicular to the strike of the sliding surface, parallel to the strike of the sliding surface and perpendicular to the sliding surface. In addition, the materials of rock avalanches also include fine matrixes. Yang et al. (2011) conducted experiments on the materials comprising simultaneously large blocks and granular matrixes. However, the blocks were cubes; therefore, the research could not examine the orientation characteristics of large blocks in deposits, and it was hard to simulate a more realistic rock structures in source volume.
In this study, we considered different conditions where rock masses in source volumes were disaggregated by discontinuity sets and hence where the long axes of blocky rock masses have different orientations. With the simplified model experiments, the influence on rock avalanche mobility, kinematics, morphological parameters and deposit morphology and interactions between rectangular blocks and matrixes due to differences in the initial structures of the source volume were discussed. A comparison between this study and aforementioned two studies was shown in Table 2. This research might provide a significant contribution relating characteristics of structural geology of source volumes to landslide mobility and deposit morphology. The novelty of this paper is the design of different arrangements of rectangular blocks to simulate the differences in rock structures in the source volumes of rock avalanches.
-
The runout of the mass flows varied at different configurations of the blocks. At the initial LV-50, LP-50 and R-50 configurations, the runout of the mass flows was facilitated, which was larger than that at NB-50 but not at EP-50. The runout decreased with the increase in slope angles at configurations of LV.
-
The elevation of the deposits at configurations of LV was apparently higher than that at EP-50, LP-50 and R-50 due to the strand protrusion of the blocks. The zigzag structures were caused by an alternate deflection of the blocks for the moment that was generated during the lateral spread of the mass flows.
-
At the initial EP configuration, the collision and friction in the mass flow were relatively intensive according to the small runout, numerous direct contacts of blocks and piling structures. The orientation of the blocks was affected by both the initial configurations of mass flows and their mobility processes.
This paper studied the relation between the disaggregated rock mass using discontinuity sets in the source volumes of rock avalanches and their corresponding runout and deposit characteristics. This research might provide a significant contribution relating to the characteristics of the structural geology of source volumes to landslide mobility and deposit morphology, specifically including the interaction between blocks and matrixes during motion. In addition, it might be helpful to studies of sedimentary characteristics in relation to rock avalanche source volumes that have been disaggregated by discontinuity sets.
The experimental data have been uploaded to an open-access repository at: https://doi.org/10.5281/zenodo.7234580 (Duan and Wu, 2022).
This paper was conceptualized by ZD and YBW and funded by ZD. The experiments were conducted by ZD, YBW, QZ, ZYL, LY, KW, and YL. The paper was written by ZD and YBW.
The contact author has declared that none of the authors has any competing interests.
Publisher's note: Copernicus Publications remains neutral with regard to jurisdictional claims in published maps and institutional affiliations.
We thank the team of Native English Editing (http://www.nativeee.com/, last access: 25 April 2022) for performing an English language edit on an earlier version of this paper. We are grateful to Yufeng Wang, Qiangong Cheng, and Ming Zhang for providing the base photos in Fig. 1.
This research has been supported by the National Natural Science Foundation of China (grant no. 42177155, 41790442, and 41702298).
This paper was edited by Kei Ogata and reviewed by Luigi Guerriero and two anonymous referees.
Asteriou, P., Saroglou, H., and Tsiambaos, G.: Geotechnical and kinematic parameters affecting the coefficients of restitution for rock fall analysis, Int. J. Rock Mech. Min., 54, 103–113, https://doi.org/10.1016/j.ijrmms.2012.05.029, 2012.
Baker, J., Gray, N., and Kokelaar, P.: Particle Size-Segregation and Spontaneous Levee Formation in Geophysical Granular Flows, International Journal of Erosion Control Engineering, 9, 174–178, https://doi.org/10.13101/ijece.9.174, 2016.
Bartali, R., Rodríguez Liñán, G. M., Torres-Cisneros, L. A., Pérez-Ángel, G., and Nahmad-Molinari, Y.: Runout transition and clustering instability observed in binary-mixture avalanche deposits, Granul. Matter, 22, 30, https://doi.org/10.1007/s10035-019-0989-0, 2020.
Bowman, E. T. and Take, W. A.: The runout of chalk cliff collapses in England and France – case studies and physical model experiments, Landslides, 12, 225–239, https://doi.org/10.1007/s10346-014-0472-2, 2015.
Brideau, M.-A., Yan, M., and Stead, D.: The role of tectonic damage and brittle rock fracture in the development of large rock slope failures, Geomorphology, 103, 30–49, https://doi.org/10.1016/j.geomorph.2008.04.010, 2009.
Carter, G.: Rock avalanche scars in the geological record: an example from Little Loch Broom, NW Scotland, Proc. Geol. Assoc., 126, 698–711, https://doi.org/10.1016/j.pgeola.2015.09.003, 2015.
Charrière, M., Humair, F., Froese, C., Jaboyedoff, M., Pedrazzini, A., and Longchamp, C.: From the source area to the deposit: Collapse, fragmentation, and propagation of the Frank Slide, GSA Bull., 128, 332–351, https://doi.org/10.1130/B31243.1, 2016.
Cole, P. D., Calder, E. S., Sparks, R. S. J., Clarke, A. B., Druitt, T. H., Young, S. R., Herd, R. A., Harford, C. L., and Norton, G. E.: Deposits from dome-collapse and fountain-collapse pyroclastic flows at Soufrière Hills Volcano, Montserrat, Geological Society, London, Memoirs, 21, 231, https://doi.org/10.1144/GSL.MEM.2002.021.01.11, 2002.
Corominas, J.: The angle of reach as a mobility index for small and large landslides, Can. Geotech. J., 33, 260–271, https://doi.org/10.1139/t96-005, 1996.
Crosta, G. B., Blasio, F. V. D., Locatelli, M., Imposimato, S., and Roddeman, D.: Landslides falling onto a shallow erodible substrate or water layer: an experimental and numerical approach, IOP Conference Series: Earth and Environmental Science, https://doi.org/10.1088/1755-1315/26/1/012004, 2015.
Crosta, G. B., Blasio, F. V. D., Caro, M. D., Volpi, G., Imposimato, S., and Roddeman, D.: Modes of propagation and deposition of granular flows onto an erodible substrate: experimental, analytical, and numerical study, Landslides, 14, 47–68, https://doi.org/10.1007/s10346-016-0697-3, 2017.
Dasgupta, P. and Manna, P.: Geometrical mechanism of inverse grading in grain-flow deposits: An experimental revelation, Earth Sci. Rev., 104, 186–198, https://doi.org/10.1016/j.earscirev.2010.10.002, 2011.
Deganutti, A. M.: The Hypermobility of Rock Avalanches, thesis, Dipartimento di Geoscienze, Università degli Studi di Padova, Dipartimento di Geoscienze, Università degli Studi di Padova, 99 pp., 2008.
Delannay, R., Valance, A., Roche, O., and Richard, P.: Granular and particle-laden flows: from laboratory experiments to field observations, J. Phys. D, 50, 40, https://doi.org/10.1088/1361-6463/50/5/053001, 2017.
Duan, Z. and Wu, Y.-B.: Effect of structural setting of source volume on rock avalanche mobility and deposit morphology, Zenodo [data set], https://doi.org/10.5281/zenodo.7234580, 2022.
Duan, Z., Cheng, W.-C., Peng, J.-B., Wang, Q.-Y., and Chen, W.: Investigation into the triggering mechanism of loess landslides in the south Jingyang platform, Shaanxi province, Bull. Eng. Geol. Environ., 78, 4919–4930, https://doi.org/10.1007/s10064-018-01432-8, 2019.
Duan, Z., Wu, Y. B., Tang, H., Ma, J. Q., and Zhu, X. H.: An Analysis of Factors Affecting Flowslide Deposit Morphology Using Taguchi Method, Adv. Civ. Eng., 2020, 1–14, https://doi.org/10.1155/2020/8844722, 2020.
Duan, Z., Cheng, W.-C., Peng, J.-B., Rahman, M. M., and Tang, H.: Interactions of landslide deposit with terrace sediments: Perspectives from velocity of deposit movement and apparent friction angle, Eng. Geol., 280, 105913, https://doi.org/10.1016/j.enggeo.2020.105913, 2021.
Duan, Z., Wu, Y.-B., Peng, J.-B., and Xue, S.-Z.: Characteristics of sand avalanche motion and deposition influenced by proportion of fine particles, Acta Geotech., https://doi.org/10.1007/s11440-022-01653-y, 2022.
Dufresne, A.: Granular flow experiments on the interaction with stationary runout path materials and comparison to rock avalanche events, Earth Surf. Proc. Landf., 37, 1527–1541, 2012.
Dufresne, A.: Rock Avalanche Sedimentology–Recent Progress, in: Advancing Culture of Living with Landslides, edited by: Mikos, M., Tiwari, B., Yin, Y., and Sassa, K., Springer, Cham, Germany, 117–122, https://doi.org/10.1007/978-3-319-53498-5_14, 2017.
Dufresne, A. and Dunning, S. A.: Process dependence of grain size distributions in rock avalanche deposits, Landslides, 14, 1555–1563, https://doi.org/10.1007/s10346-017-0806-y, 2017.
Dufresne, A., Bösmeier, A., and Prager, C.: Sedimentology of rock avalanche deposits – Case study and review, Earth Sci. Rev., 163, 234–259, https://doi.org/10.1016/j.earscirev.2016.10.002, 2016.
Dufresne, A., Zernack, A., Bernard, K., Thouret, J.-C., and Roverato, M.: Sedimentology of Volcanic Debris Avalanche Deposits, in: Volcanic Debris Avalanches: From Collapse to Hazard, edited by: Roverato, M., Dufresne, A., and Procter, J., Springer International Publishing, Cham, 175–210, https://doi.org/10.1007/978-3-030-57411-6_8, 2021.
Fan, X. y., Tian, S. j., and Zhang, Y. y.: Mass-front velocity of dry granular flows influenced by the angle of the slope to the runout plane and particle size gradation, J. Mountain Sci., 13, 234–245, https://doi.org/10.1007/s11629-014-3396-3, 2016.
Felix, G. and Thomas, N.: Evidence of two effects in the size segregation process in dry granular media, Phys. Rev. E. Stat. Nonlin. Soft. Matter Phys., 70, 051307, https://doi.org/10.1103/PhysRevE.70.051307, 2004.
Fisher, R. V. and Heiken, G.: Mt. Pelée, martinique: may 8 and 20, 1902, pyroclastic flows and surges, J. Volcanol. Geotherm. Res., 13, 339–371, https://doi.org/10.1016/0377-0273(82)90056-7, 1982.
Getahun, E., Qi, S.-W., Guo, S.-f., Zou, Y., and Liang, N.: Characteristics of grain size distribution and the shear strength analysis of Chenjiaba long runout coseismic landslide, J. Mountain Sci., 16, 2110–2125, https://doi.org/10.1007/s11629-019-5535-3, 2019.
Glicken, H. and Survey: Rockslide-debris avalanche of May 18, 1980, Mount St. Helens Volcano, Washington, Open-File Report, 98 pp., https://doi.org/10.3133/ofr96677, 1996.
Goujon, C., Thomas, N., and Dalloz-Dubrujeaud, B.: Monodisperse dry granular flows oninclined planes: Role of roughness, European Phys. J. E, 11, 147–157, https://doi.org/10.1140/epje/i2003-10012-0, 2003.
Gray, J. M. N. T. and Hutter, K.: Pattern formation in granular avalanches, Continuum Mech. Thermodyn., 9, 341–345, https://doi.org/10.1007/s001610050075, 1997.
Huang, R. Q. and Liu, W. H.: In-situ test study of characteristics of rolling rock blocks based on orthogonal design, Chinese Journal of Rock Mechanics Engineering Geology, 28, 882–891, 2009 (in Chinese).
Hungr, O.: Rock avalanche occurrence, process and modelling, in: Landslides from Massive Rock Slope Failure, edited by: Evans, S. G., Mugnozza, G. S., Strom, A., and Hermanns, R. L., NATO Science Series, Springer, Dordrecht, 243–266, https://doi.org/10.1007/978-1-4020-4037-5_14, 2006.
Jaboyedoff, M., Couture, R., and Locat, P.: Structural analysis of Turtle Mountain (Alberta) using digital elevation model: Toward a progressive failure, Geomorphology, 103, 5–16, https://doi.org/10.1016/j.geomorph.2008.04.012, 2009.
Ji, Z.-M., Chen, Z.-J., Niu, Q.-H., Wang, T.-J., Song, H., and Wang, T.-H.: Laboratory study on the influencing factors and their control for the coefficient of restitution during rockfall impacts, Landslides, 16, 1939–1963, https://doi.org/10.1007/s10346-019-01183-x, 2019.
Johnson, C. G., Kokelaar, B. P., Iverson, R. M., Logan, M., LaHusen, R. G., and Gray, J. M. N. T.: Grain-size segregation and levee formation in geophysical mass flows, J. Geophys. Res.-Earth Surf., 117, F01032, https://doi.org/10.1029/2011JF002185, 2012.
Jomelli, V. and Bertran, P.: Wet snow avalanche deposits in the french alps: structure and sedimentology, Geografiska Annaler: Series A, Physical Geography, 83, 15–28, https://doi.org/10.1111/j.0435-3676.2001.00141.x, 2001.
Lan, H., Zhang, Y., Macciotta, R., Li, L., Wu, Y., Bao, H., and Peng, J.: The role of discontinuities in the susceptibility, development, and runout of rock avalanches: a review, Landslides, 19, 1391–1404, https://doi.org/10.1007/s10346-022-01868-w, 2022.
Li, H., Duan, Z., Wu, Y., Dong, C., and Zhao, F.: The Motion and Range of Landslides According to Their Height, Front. Earth Sci., 9, 811, 736280, https://doi.org/10.3389/feart.2021.736280, 2021.
Li, L. P., Sun, S. Q., Li, S. C., Zhang, Q. Q., Hu, C., and Shi, S. S.: Coefficient of restitution and kinetic energy loss of rockfall impacts, KSCE J. Civ. Eng., 20, 2297–2307, https://doi.org/10.1007/s12205-015-0221-7, 2015.
Locat, P., Couture, R., Leroueil, S., Locat, J., and Jaboyedoff, M.: Fragmentation energy in rock avalanches, Can. Geotech. J., 43, 830–851, https://doi.org/10.1139/t06-045, 2006.
Lucas, A. and Mangeney, A.: Mobility and topographic effects for large Valles Marineris landslides on Mars, Geophys. Res. Lett., 34, L10201, https://doi.org/10.1029/2007GL029835, 2007.
Magnarini, G., Mitchell, T. M., Goren, L., Grindrod, P. M., and Browning, J.: Implications of longitudinal ridges for the mechanics of ice-free long runout landslides, Earth Planet. Sci. Lett., 574, 117177, https://doi.org/10.1016/j.epsl.2021.117177, 2021.
Makris, S., Manzella, I., Cole, P., and Roverato, M.: Grain size distribution and sedimentology in volcanic mass-wasting flows: implications for propagation and mobility, Int. J. Earth Sci., 109, 2679–2695, https://doi.org/10.1007/s00531-020-01907-8, 2020.
Mangeney, A., Roche, O., Hungr, O., Mangold, N., Faccanoni, G., and Lucas, A.: Erosion and mobility in granular collapse over sloping beds, J. Geophys. Res., 115, F03040, https://doi.org/10.1029/2009jf001462, 2010.
Mangold, N., Mangeney, A., Migeon, V., Ansan, V., Lucas, A., Baratoux, D., and Bouchut, F.: Sinuous gullies on Mars: Frequency, distribution, and implications for flow properties, J. Geophys. Res., 115, E11001, https://doi.org/10.1029/2009je003540, 2010.
Manzella, I. and Labiouse, V.: Flow experiments with gravel and blocks at small scale to investigate parameters and mechanisms involved in rock avalanches, Eng. Geol., 109, 146–158, 2009.
Manzella, I. and Labiouse, V.: Empirical and analytical analyses of laboratory granular flows to investigate rock avalanche propagation, Landslides, 10, 23–26, https://doi.org/10.1007/s10346-011-0313-5, 2013a.
Manzella, I. and Labiouse, V.: Empirical and analytical analyses of laboratory granular flows to investigate rock avalanche propagation, Landslides, 10, 23–26, https://doi.org/10.1007/s10346-011-0313-5, 2013b.
Mavrouli, O., Corominas, J., and Jaboyedoff, M.: Size Distribution for Potentially Unstable Rock Masses and In Situ Rock Blocks Using LIDAR-Generated Digital Elevation Models, Rock Mech. Rock Eng., 48, 1589–1604, https://doi.org/10.1007/s00603-014-0647-0, 2015.
McDougall, S.: 2014 Canadian Geotechnical Colloquium: Landslide runout analysis – current practice and challenges, Can. Geotech. J., 54, 605–620, https://doi.org/10.1139/cgj-2016-0104, 2016.
Moreiras, S. M.: The Plata Rock Avalanche: Deciphering the Occurrence of This Huge Collapse in a Glacial Valley of the Central Andes (33∘ S), 8, 267, https://doi.org/10.3389/feart.2020.00267, 2020.
Pánek, T., Hradecký, J., Smolková, V., and Šilhán, K.: Gigantic low-gradient landslides in the northern periphery of the Crimean Mountains (Ukraine), Geomorphology, 95, 449–473, https://doi.org/10.1016/j.geomorph.2007.07.007, 2008.
Pedrazzini, A., Jaboyedoff, M., Loye, A., and Derron, M.-H.: From deep seated slope deformation to rock avalanche: Destabilization and transportation models of the Sierre landslide (Switzerland), Tectonophysics, 605, 149–168, https://doi.org/10.1016/j.tecto.2013.04.016, 2013.
Phillips, J. C., Hogg, A. J., Kerswell, R. R., and Thomas, N. H.: Enhanced mobility of granular mixtures of fine and coarse particles, Earth Planet. Sci. Lett., 246, 466–480, https://doi.org/10.1016/j.epsl.2006.04.007, 2006.
Reznichenko, N. V., Davies, T. R. H., and Alexander, D. J.: Effects of rock avalanches on glacier behaviour and moraine formation, Geomorphology, 132, 327–338, https://doi.org/10.1016/j.geomorph.2011.05.019, 2011.
Schwarzkopf, L. M., Schmincke, H.-U., and Cronin, S. J.: A conceptual model for block-and-ash flow basal avalanche transport and deposition, based on deposit architecture of 1998 and 1994 Merapi flows, J. Volcanol. Geotherm. Res., 139, 117–134, https://doi.org/10.1016/j.jvolgeores.2004.06.012, 2005.
Shea, T. and van Wyk de Vries, B.: Structural analysis and analogue modeling of the kinematics and dynamics of rockslide avalanches, Geosphere, 4, 657–686, https://doi.org/10.1130/GES00131.1, 2008.
Shugar, D. H. and Clague, J. J.: The sedimentology and geomorphology of rock avalanche deposits on glaciers, Sedimentology, 58, 1762–1783, https://doi.org/10.1111/j.1365-3091.2011.01238.x, 2011.
Ui, T., Kawachi, S., and Neall, V. E.: Fragmentation of debris avalanche material during flowage – Evidence from the Pungarehu Formation, Mount Egmont, New Zealand, J. Volcanol. Geotherm. Res., 27, 255–264, https://doi.org/10.1016/0377-0273(86)90016-8, 1986.
Voight, B. and Pariseau, W. G.: Rockslides and Avalanches: An Introduction, in: Developments in Geotechnical Engineering, edited by: Voight, B., Elsevier, 67 pp., https://doi.org/10.1016/B978-0-444-41507-3.50008-8, 1978.
Wang, Y., Jiang, W., Cheng, S., Song, P., and Mao, C.: Effects of the impact angle on the coefficient of restitution in rockfall analysis based on a medium-scale laboratory test, Nat. Hazards Earth Syst. Sci., 18, 3045–3061, https://doi.org/10.5194/nhess-18-3045-2018, 2018.
Wang, Y., Cheng, Q., Lin, Q., Li, K., and Shi, A.: Observations on the sedimentary structure of prehistoric rock avalanches on the Tibetan Plateau, China, Earth Science Frontiers, 28, 106–124, 2021 (in Chinese).
Wang, Y. F., Cheng, Q. G., Lin, Q. W., Li, K., and Yang, H. F.: Insights into the kinematics and dynamics of the Luanshibao rock avalanche (Tibetan Plateau, China) based on its complex surface landforms, Geomorphology, 317, 170–183, https://doi.org/10.1016/j.geomorph.2018.05.025, 2018.
Wang, Y.-F., Cheng, Q.-G., Shi, A.-W., Yuan, Y.-Q., Yin, B.-M., and Qiu, Y.-H.: Sedimentary deformation structures in the Nyixoi Chongco rock avalanche: implications on rock avalanche transport mechanisms, Landslides, 16, 523–532, https://doi.org/10.1007/s10346-018-1117-7, 2019.
Welkner, D., Eberhardt, E., and Hermanns, R. L.: Hazard investigation of the Portillo Rock Avalanche site, central Andes, Chile, using an integrated field mapping and numerical modelling approach, Eng. Geol., 114, 278–297, https://doi.org/10.1016/j.enggeo.2010.05.007, 2010.
Yang, Q., Cai, F., Ugai, K., Yamada, M., Su, Z., Ahmed, A., Huang, R., and Xu, Q.: Some factors affecting mass-front velocity of rapid dry granular flows in a large flume, Eng. Geol., 122, 249–260, https://doi.org/10.1016/j.enggeo.2011.06.006, 2011.
Zeng, Q., Wei, R., McSaveney, M., Ma, F., Yuan, G., and Liao, L.: From surface morphologies to inner structures: insights into hypermobility of the Nixu rock avalanche, southern Tibet, China, Landslides, 18, 125–143, https://doi.org/10.1007/s10346-020-01503-6, 2020.
Zhang, G., Tang, H., Xiang, X., Murat, K., and Wu, J.: Theoretical study of rockfall impacts based on logistic curves, Int. J. Rock Mech. Min. Sci., 78, 133–143, https://doi.org/10.1016/j.ijrmms.2015.06.001, 2015.
Zhang, M., Wu, L., Zhang, J., and Li, L.: The 2009 Jiweishan rock avalanche, Wulong, China: deposit characteristics and implications for its fragmentation, Landslides, 16, 893–906, https://doi.org/10.1007/s10346-019-01142-6, 2019.
Zhao, B., Zhao, X., Zeng, L., Wang, S., and Du, Y.: The mechanisms of complex morphological features of a prehistorical landslide on the eastern margin of the Qinghai-Tibetan Plateau, Bull. Eng. Geol. Environ., 80, 3423–3437, https://doi.org/10.1007/s10064-021-02114-8, 2021.
Zhu, L., Liang, H., He, S., Liu, W., Zhang, Q., and Li, G.: Failure mechanism and dynamic processes of rock avalanche occurrence in Chengkun railway, China, on August 14, 2019, Landslides, 17, 943–957, https://doi.org/10.1007/s10346-019-01343-z, 2020.
Zhu, Y., Dai, F., and Yao, X.: Preliminary understanding of the emplacement mechanism for the Tahman rock avalanche based on deposit landforms, Q. J. Eng. Geol. Hydrogeol., 53, 460–465, https://doi.org/10.1144/qjegh2019-079, 2019.


