the Creative Commons Attribution 4.0 License.
the Creative Commons Attribution 4.0 License.
 | 31 Mar 2022
Tectonic Geomorphology and Paleoseismology of the Sharkhai fault: a new source of seismic hazard for Ulaanbaatar (Mongolia)
Abeer Al-Ashkar
Antoine Schlupp
Matthieu Ferry
Ulziibat Munkhuu
We present first constraints from tectonic geomorphology and paleoseismology along the newly discovered Sharkhai fault near the capital city of Mongolia. Detailed observations from high-resolution Pleiades satellite images and field investigations allowed us to map the fault in detail, describe its geometry and segmentation, characterize its kinematics, and document its recent activity and seismic behavior (cumulative displacements and paleoseismicity). The Sharkhai fault displays a surface length of ∼ 40 km with a slightly arcuate geometry, and a strike ranging from N42 to N72∘. It affects numerous drainages that show left-lateral cumulative displacements reaching 94 m. Paleoseismic investigations document faulting and depositional/erosional events for the last ∼ 3000 years and reveal that the most recent event occurred between 775 and 1778 CE and the penultimate earthquake occurred between 1605 and 835 BCE. The resulting time interval of 2496 ± 887 years is the first constraint for the Sharkhai fault for large earthquakes. On the basis of our mapping of the surface rupture and the resulting segmentation analysis, we propose two possible scenarios for large earthquakes with likely magnitudes of 6.7 ± 0.2 or 7.1 ± 0.7. Furthermore, we apply scaling laws to infer coseismic slip values and derive preliminary estimates of long-term slip rates. Finally, these data help build a comprehensive model of active faults in that region and should be considered in the seismic hazard assessment for the city of Ulaanbaatar.
- Article
(27712 KB) - Full-text XML
-
Supplement
(5459 KB) - BibTeX
- EndNote


The tectonics of Mongolia are characterized by the transition between the compressive structures associated with the India–Asia collision to the south and the vast extensive structures of the Baikal Rift to the north. (Fig. 1). This induces important complexity and variability expressed by dominantly strike-slip structures with minor thrust and normal faults (Khilko et al., 1985; Cunningham, 2001; Ritz et al., 2003; Cunningham, 2007; Walker et al., 2008; Parfeevets and Sankov, 2012). In Central Mongolia, the Hangay dome is surrounded by right- and left-lateral faults (Cuningham et al., 1996; Schlupp, 1996; Bayasgalan, 1999; Bayasgalan et al., 1999; Etchebes, 2011). Western Mongolia is dominated by NW–SE-striking right-lateral and thrust faults distributed across the Mongolian Altai ranges, while southern Mongolia shows E–W left-lateral and thrust faults that produce the Gobi Altay restraining-bend topography. Finally, to the north the E–W Bolnay left-lateral strike-slip fault begins the transition with the Baikal rift system. The rate of deformation along faults in western and central Mongolia are relatively low with 1.5 ± 0.26 to 3.8 ± 0.2 mm yr−1 based on geological observations (Ritz et al., 2006; Etchebes, 2011; Rizza et al., 2015) and 2 ± 1.2 to 2.6 ± 0.5 mm yr−1 based on geodetic data (Calais et al., 2003). Presently, the historical seismicity record in the region is short and poorly constrained (Khilko et al., 1985). Since 1905, seismicity has been highlighted by four great earthquakes with Mw ranging from 7.9 to 8.3–8.5 (9 and 23 July 1905, 11 August 1931, and 4 December 1957), which occurred along the strike-slip faults of western and southwestern Mongolia (Fig. 1) with moderate background activity.
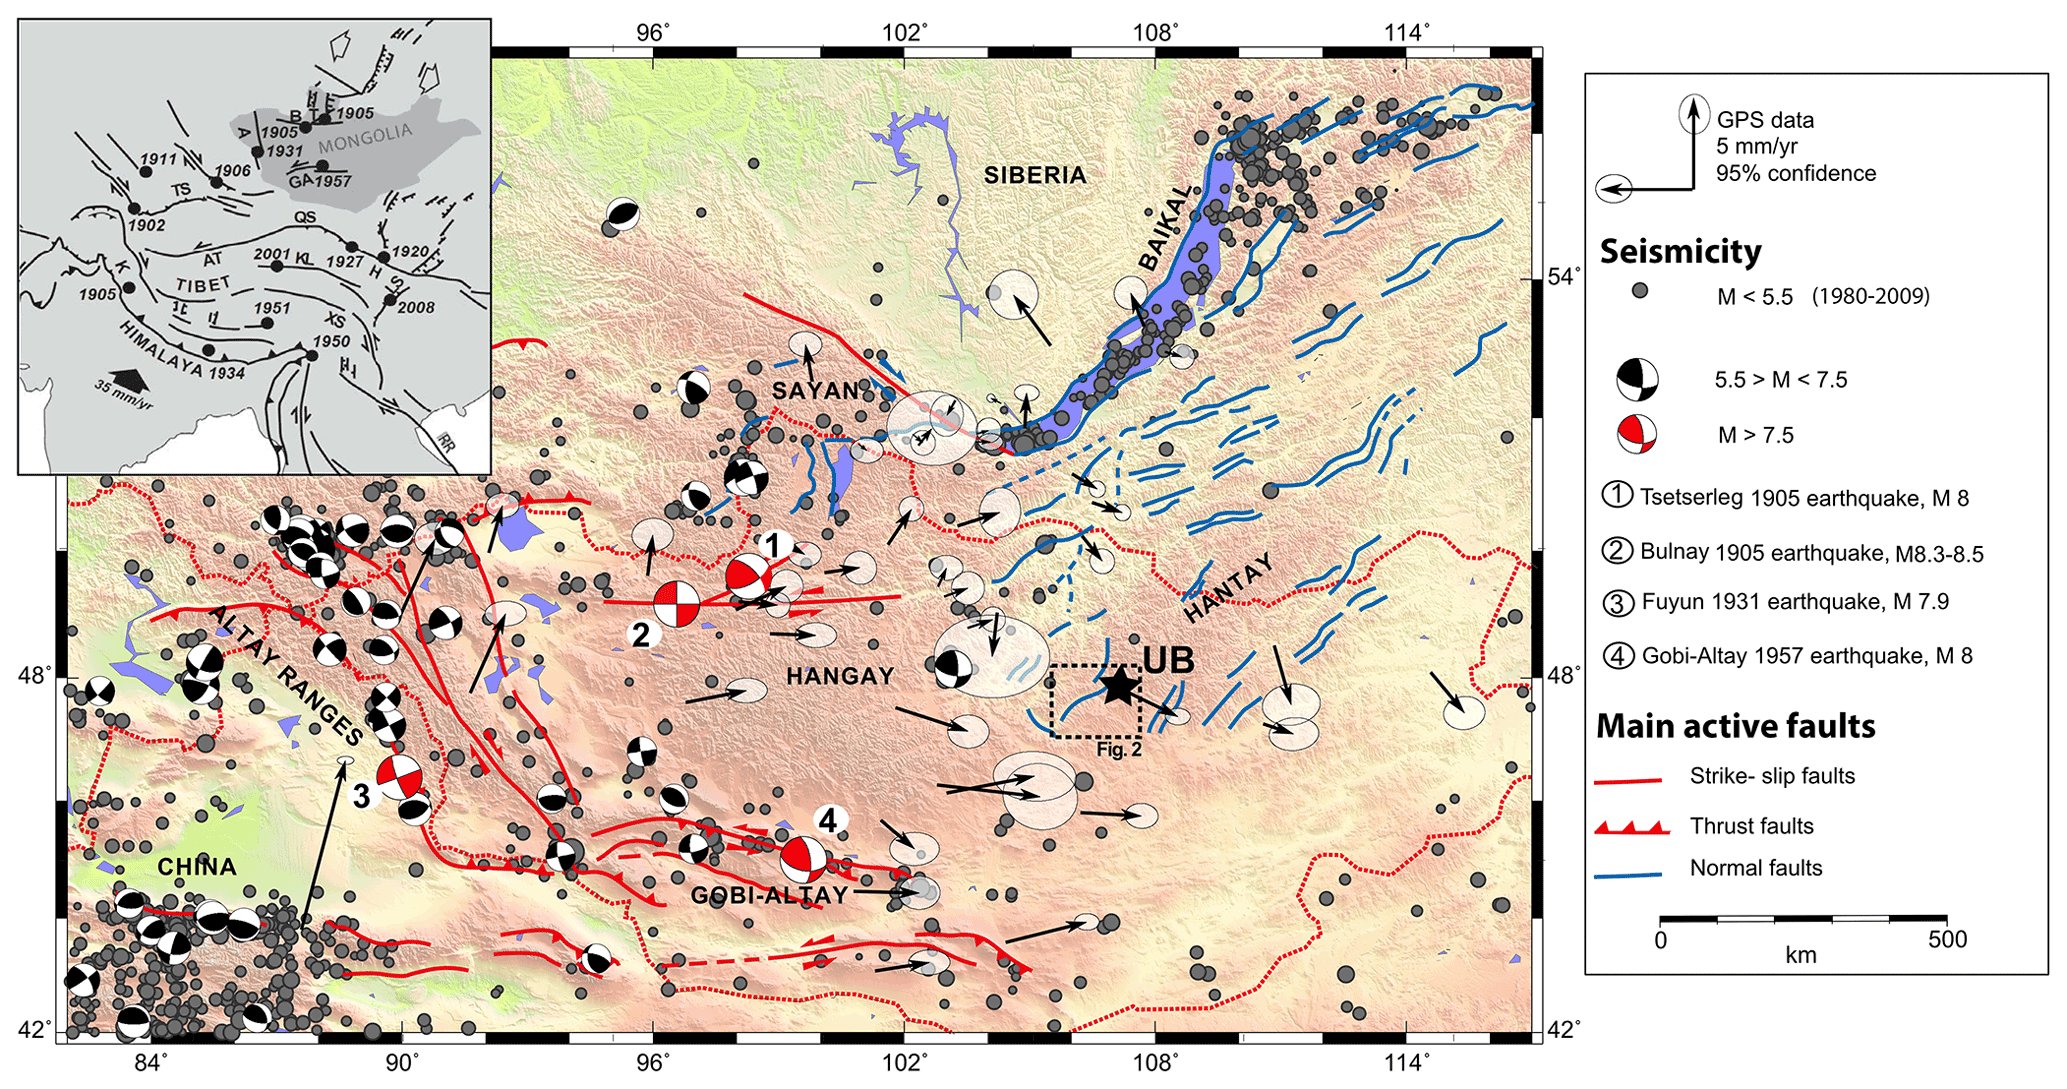
Figure 1Tectonic map of Mongolia (modified from Rizza et al., 2015). The four great earthquakes of magnitude 8+ that occurred since 1905 are labeled 1 to 4. The inset map shows active deformations in Asia with Mongolia between the India–Asia collision to the south and extensive structures of the Baikal Rift to the north. “UB” is Ulaanbaatar, capital of Mongolia, and the rectangle shows the location of Fig. 2.
The region of Ulaanbaatar (capital of Mongolia) is situated in a folded system composed of Lower to Middle Carboniferous and Quaternary deposits (Tomurtogoo et al., 1998; Manandhar et al., 2016) (Fig. 2). The Carboniferous formations are sandstone, mudstone, alternating beds of sandstone and mudstone with limited outcrops of conglomerate, siliceous mudstone, chert, felsic tuff, and basalt (Takeuchi et al., 2013). Compared to western and southwestern Mongolia, the Ulaanbaatar region displays a different seismotectonic situation. Firstly, although several tectonic faults are clearly documented in the geological map (Fig. 2), their potential Quaternary activity remains unknown. Secondly, the level of recorded seismicity is significantly lower, in terms of both event frequency and magnitude (One century of seismicity in Mongolia map, 2000; Dugarmaa and Schlupp, 2000). The historical seismicity is poorly known, and since 1957, when the instrumental period started, the activity has been limited to moderate earthquakes with magnitude less than 4.5 (Adiya, 2016). Nevertheless, several earthquakes were largely felt in Ulaanbaatar during the last century (MSK intensity up to VI) without significant damage (Khilko et al., 1985). Regional deformation characterized by geodesy indicates 2–4 mm yr−1 of ESE horizontal displacement with respect to Eurasia (Miroshnichenko et al., 2018).
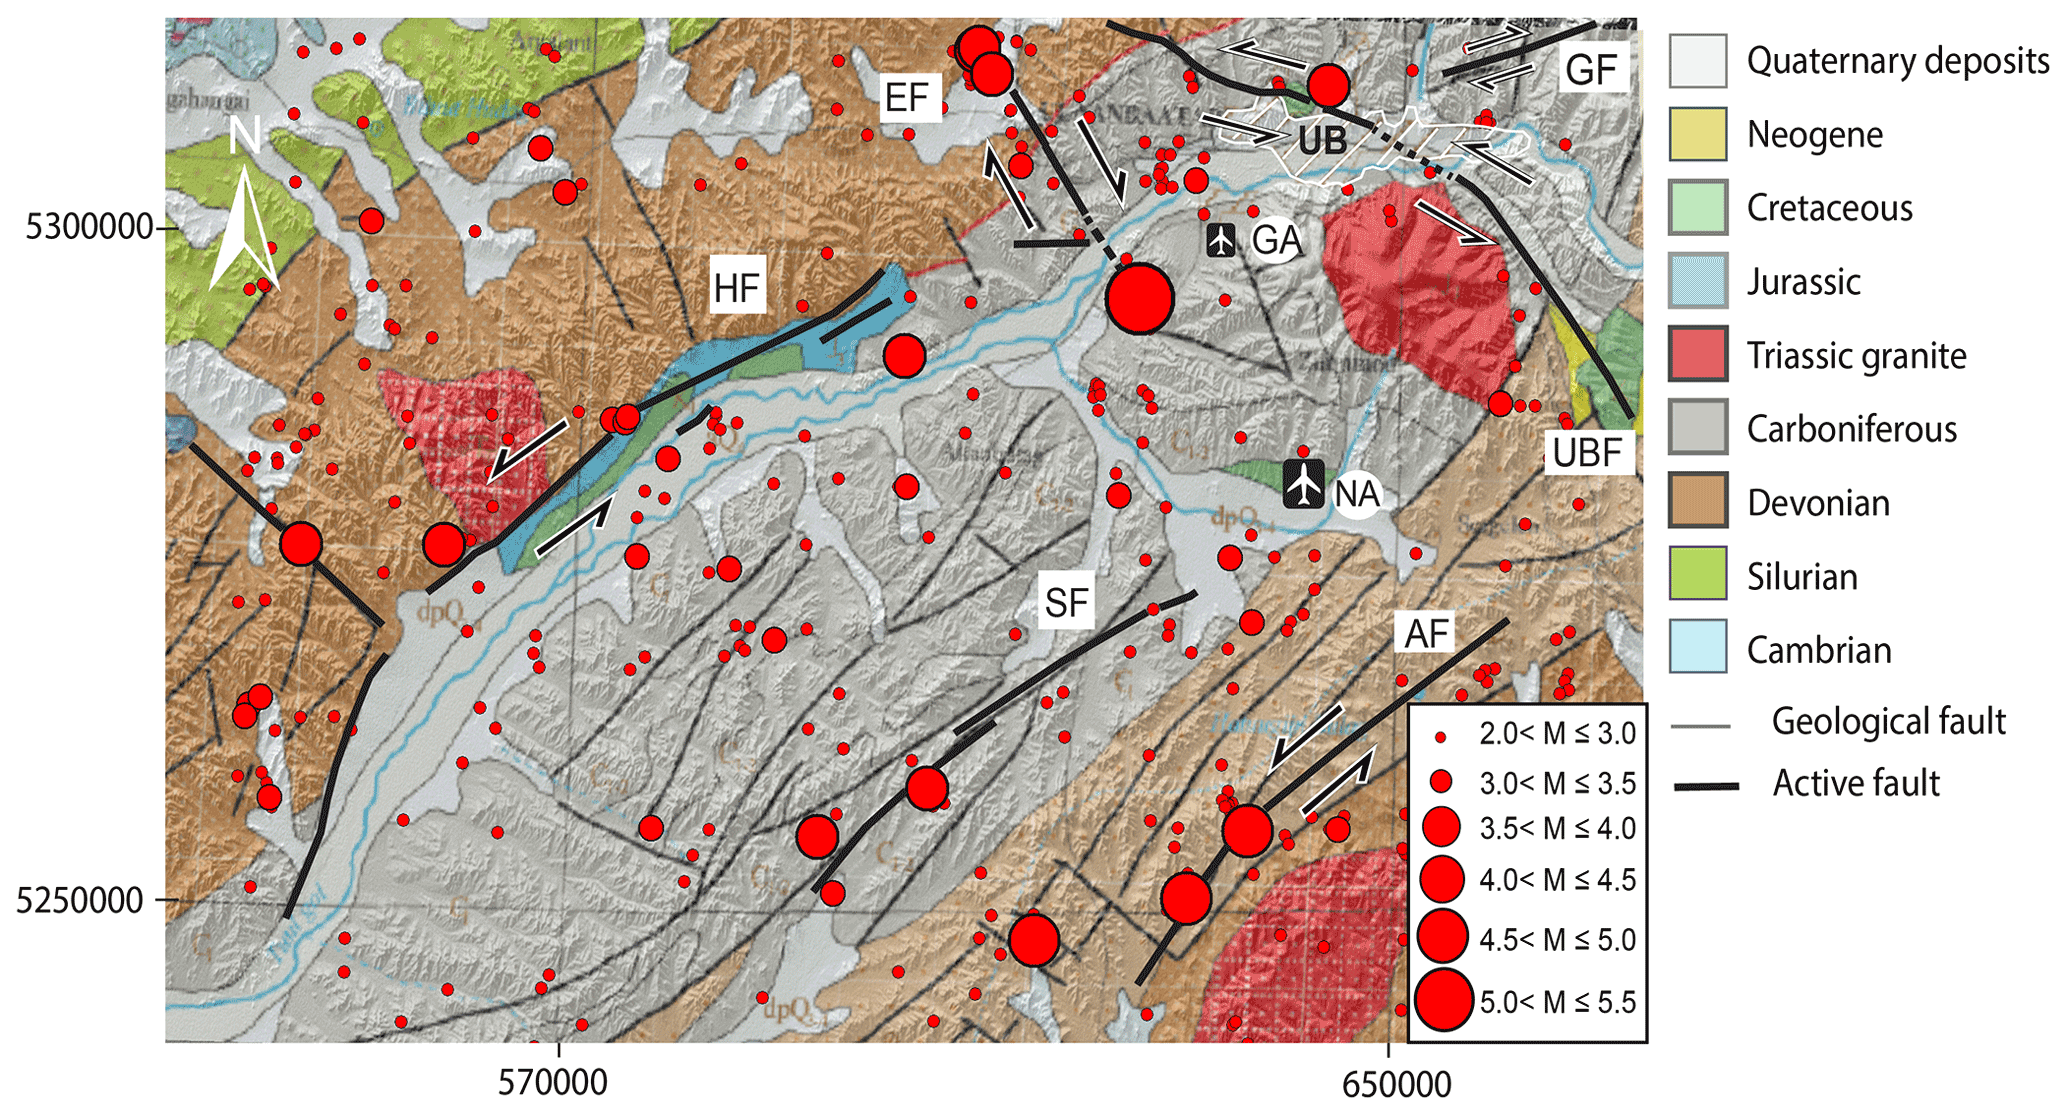
Figure 2Geological and seismo-tectonic context of the Ulaanbaatar region. Red dots are earthquakes recorded between 1994 and 2011 (Institute of Astronomy and Geophysics, Mongolian Academy of Sciences, National Data Center). Black lines represent the active faults (HF: Hustai fault, EF: Emeelt fault, SF: Sharkhai fault, AF: Avdar fault, UBF: Ulaanbaatar fault, GF: Gunj fault). UB: Ulaanbaatar city, GA: Ghingis Khan old international airport, NA: new international airport. The background DEM is from SRTM1 data (see data and resources). Geological map is an extract from the geologic map of Mongolia (scale 1:1 M) (Tomurtogoo et al., 1998).
Between 2005 and 2019, more than 10 swarm episodes of moderate earthquakes (M≤4.5) have been recorded and accurately relocated ∼ 10 km west of the capital (Adiya, 2016). Tectonic geomorphology investigations focused on the swarm area revealed evidence of Quaternary activity along the Emeelt fault (Ferry et al, 2010; Schlupp et al, 2010a; Ferry et al, 2012; Schlupp et al., 2012; Dujardin et al, 2014). This structure is located near the eastern end of the Hustai fault, strikes N140 (Fig. 2) and displays dominantly right-lateral kinematics with a reverse component. Recent studies suggest that it could produce earthquakes of Mw 6–7 (Schlupp et al., 2012). Located ∼ 30 km west of Ulaanbaatar, the Hustai (alternative spelling Khustai) fault exhibits a remarkable morphology that displays recent markers affected by left-lateral and normal faulting and is composed of several segments with a total length of 212 km. It is considered capable of producing earthquakes of Mx 6.5–7.5 (Ferry et al., 2010; Schlupp et al., 2010b; Fleury et al., 2011; Ferry et al., 2012). To the northeast of Ulaanbaatar at ∼ 15 km from the city center, the surface expression of the Gunj Fault is visible along ∼ 20 km; it is oriented N45 and is evidenced by right-lateral displacements affecting gullies and reaching 25 m (Demberel et al., 2011), vertical scarps and flower structures (Imaev et al., 2012). Finally, the Ulaanbaatar Fault has been recently described by Suzuki et al. (2020): it displays scarps, pressure ridges and deformed Pleistocene deposits over a length of ∼ 50 km. Preliminary results suggest the fault could produce earthquakes with Mw ranging from 6.5–7.1 depending on the rupture scenario (surface rupture length from 20 to 50 km).
The most recent addition to the ongoing effort to document active faults within the intensely developing greater Ulaanbaatar region was carried out to the south of the city, where the new international airport is built. There, we combined the analysis of high-resolution satellite images and field investigations and discovered two active faults hereafter called “Sharkhai fault”, located ∼ 35 km south of the capital and only 10 km south of the new airport, and “Avdar fault” (Fig. 2) (Al-Ashkar, 2015). In this study, we present a detailed characterization of the Sharkhai fault based on remote sensing analysis, geomorphological observations and paleoseismological investigations and propose the first results pertaining to its Holocene activity and associated characteristics (segmentation, kinematics and paleoseismicity).
2.1 Surface trace mapping
2.1.1 Methodology
Considering the well-expressed geology (Carboniferous age) combined with slow active deformation rates, and low erosion and sedimentation rates (continental steppe context), our strategy consisted of mapping faults at high spatial resolution and characterizing their subtle cumulative expression within Quaternary deposits. To identify and quantify horizontal and vertical deformation we based our analysis on very high-resolution orthorectified Pleiades satellites images (multispectral RGB-NIR at 2 m resolution and panchromatic at 0.5 m resolution, hereafter referred to as HR images) and high-resolution digital elevation models SRTM 1′′ at 30 m resolution and TanDEM-X at 12 m resolution (hereafter referred to as DEM). Additional images from Google Earth acquired at different seasons provided complementary information. Remote sensing analysis was supplemented by field campaigns to verify, correct and complement these observations; perform detailed geomorphological mapping; and excavate a paleoseismological trench.
2.1.2 Overview
Our observations show that the main trace of the Sharkhai fault, striking ENE–WSW, extends along 40 km (from A1 to A7 in Fig. 3). Along most of its length, the surface rupture corresponds to a documented geological structure (Fig. 2) that was not characterized as active in previous studies (Tomurtogoo et al., 1998). The main geomorphological features observed along the Sharkhai fault are offset drainages connected by faint lineaments that can be followed on HR images. In the field, they are locally expressed as smoothed scarps (less than 50 cm high) and breaks in slope and mark the eroded fault trace. Near the middle of the fault trace, a well-developed 1.4 km wide extensional jog (Fig. 3, between points A3 and A4) accommodates a right step, which suggests that the fault can be segmented into two major sections: the southern section (strike N42 to N55) and the northern section (strike N55 to N72) (Figs. 3 and 5). Below we describe the fault surface trace from the southwest to the northeast and detail the various features documenting recent activity and segmentation.
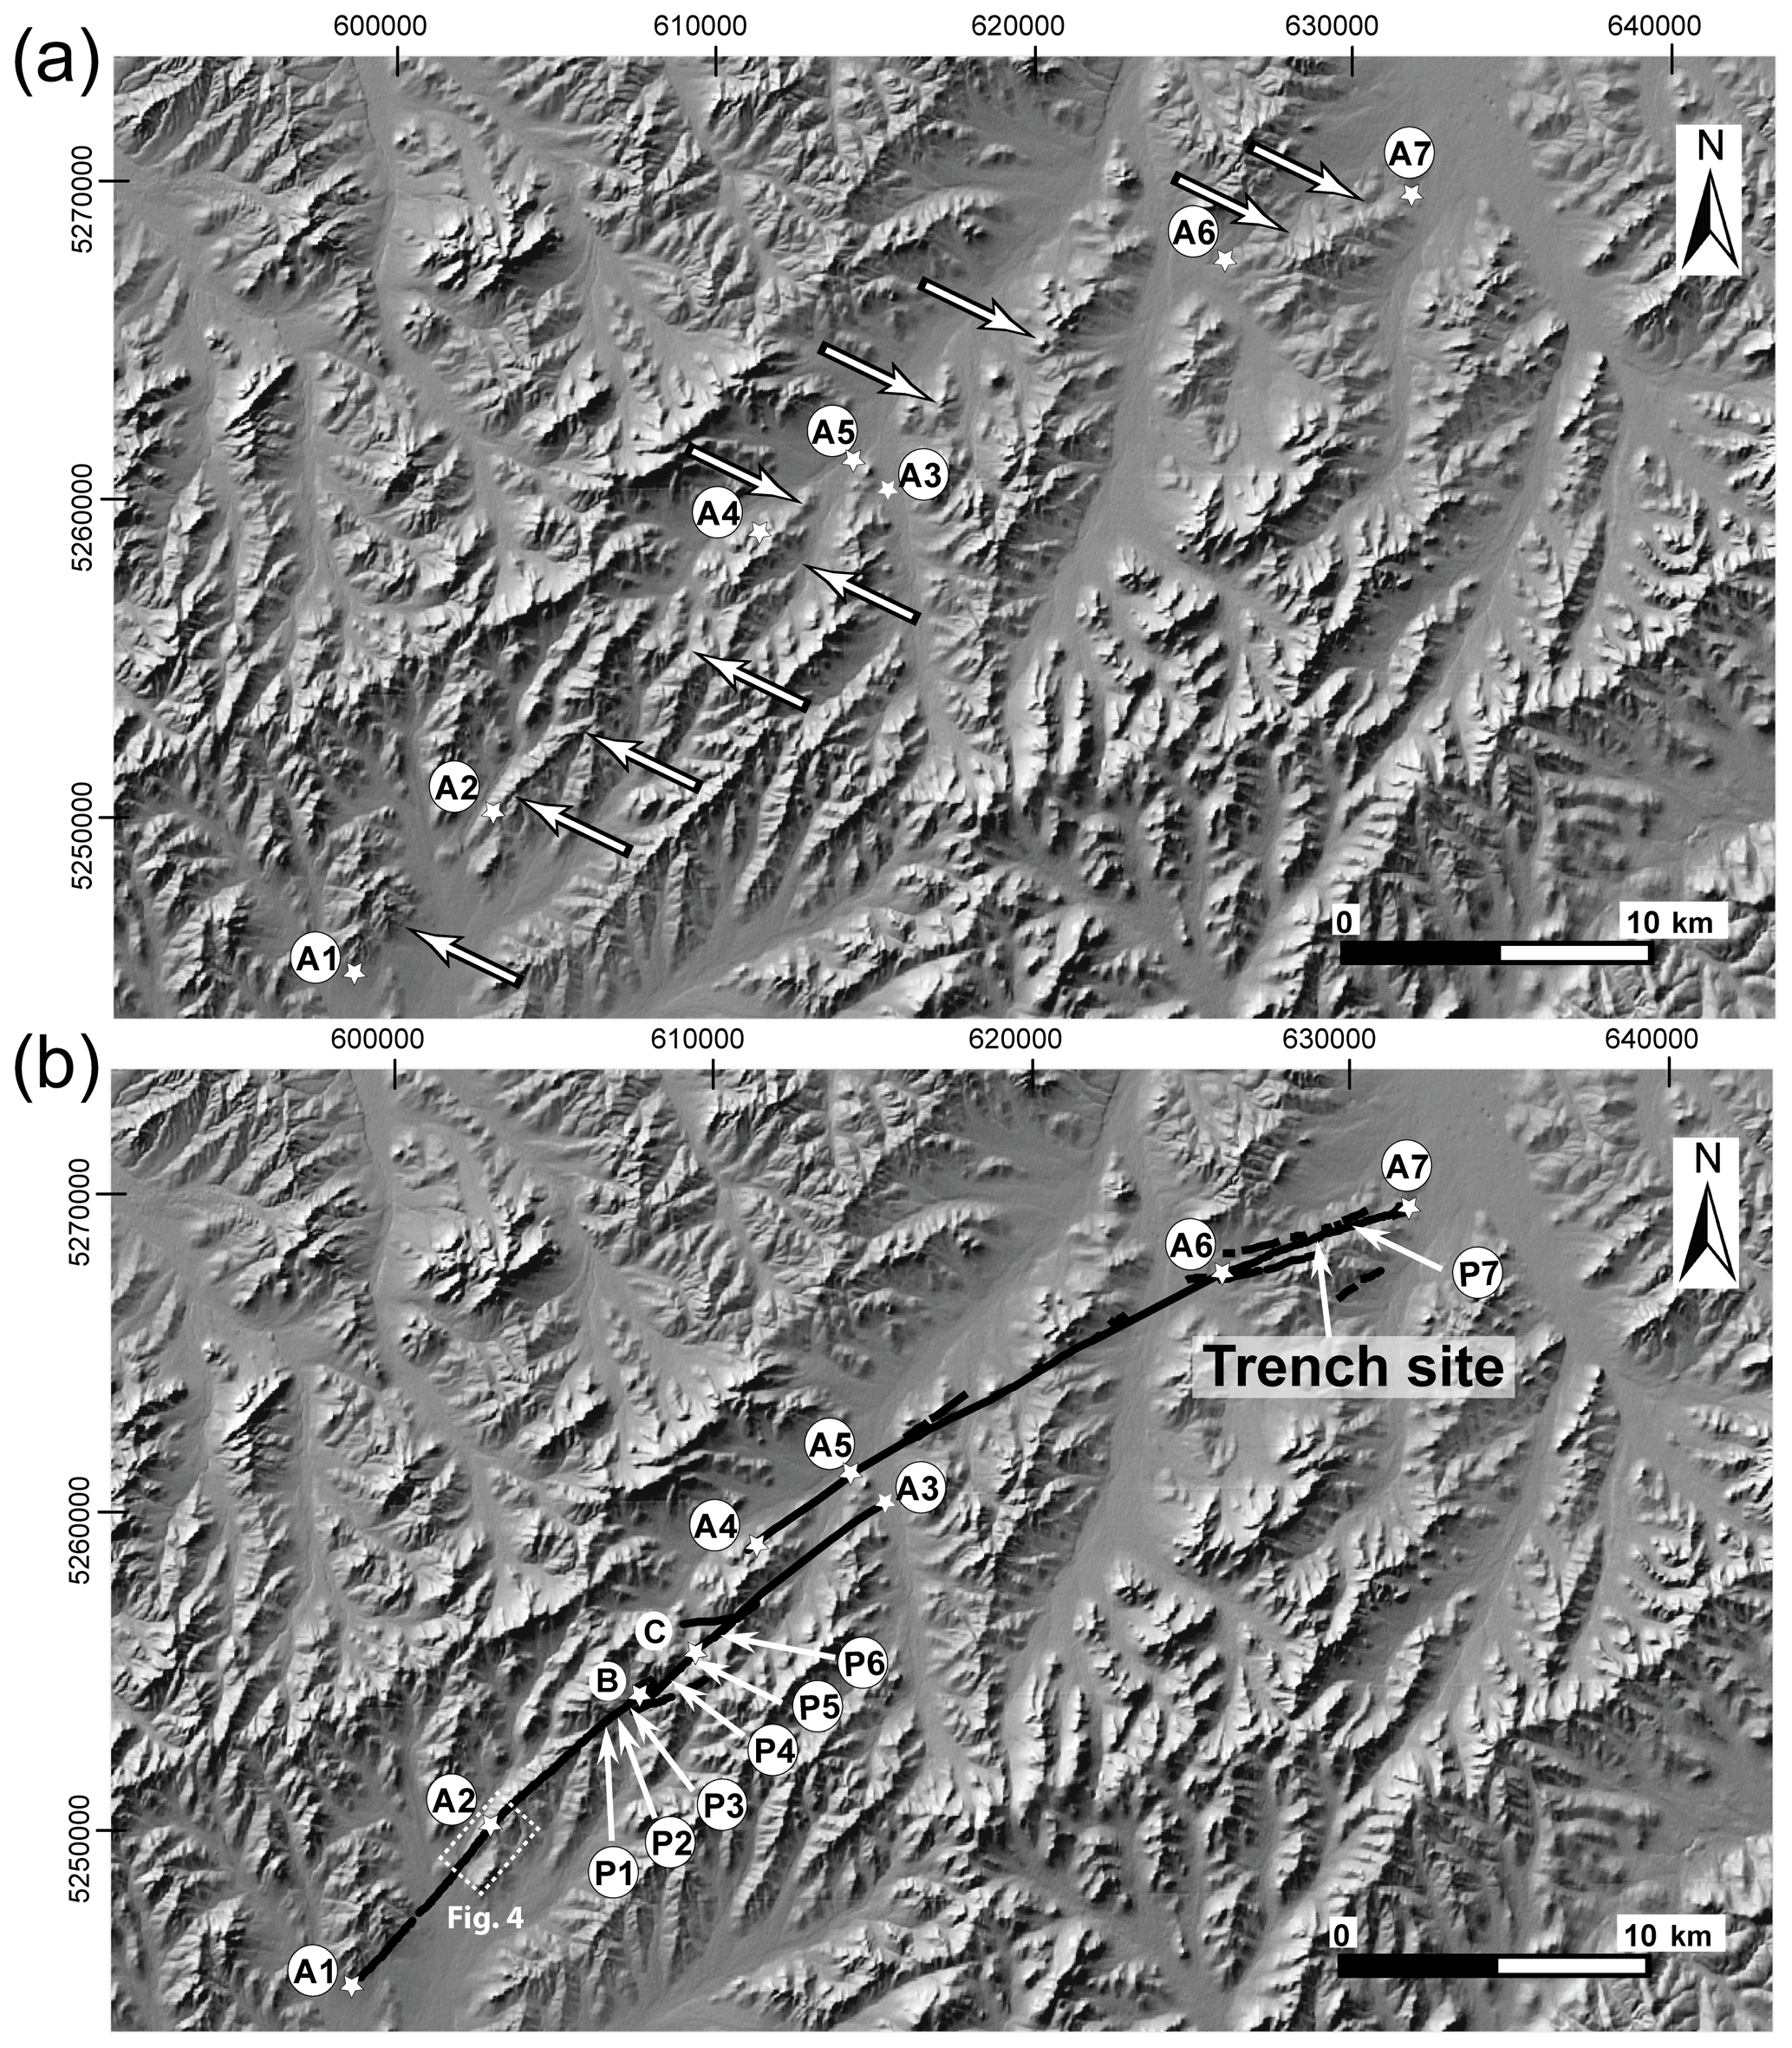
Figure 3(a) SRTM1 DEM (see data and resources) with arrows showing the location of the Sharkhai active fault. (b) Simplified map of the Sharkhai active fault about 40 km long and strikes from N42 at south to N72 at north. Letters A1–A7, B and C indicate the location of sites described in the text. Letters P1 to P7 (see details in Figs. 6–9 and figures in supplementary materials) indicate the locations of documented offset drainages. Note the left step-over which divides the fault into two sections between points A3 and A4. Coordinates are in UTM zone 48N.
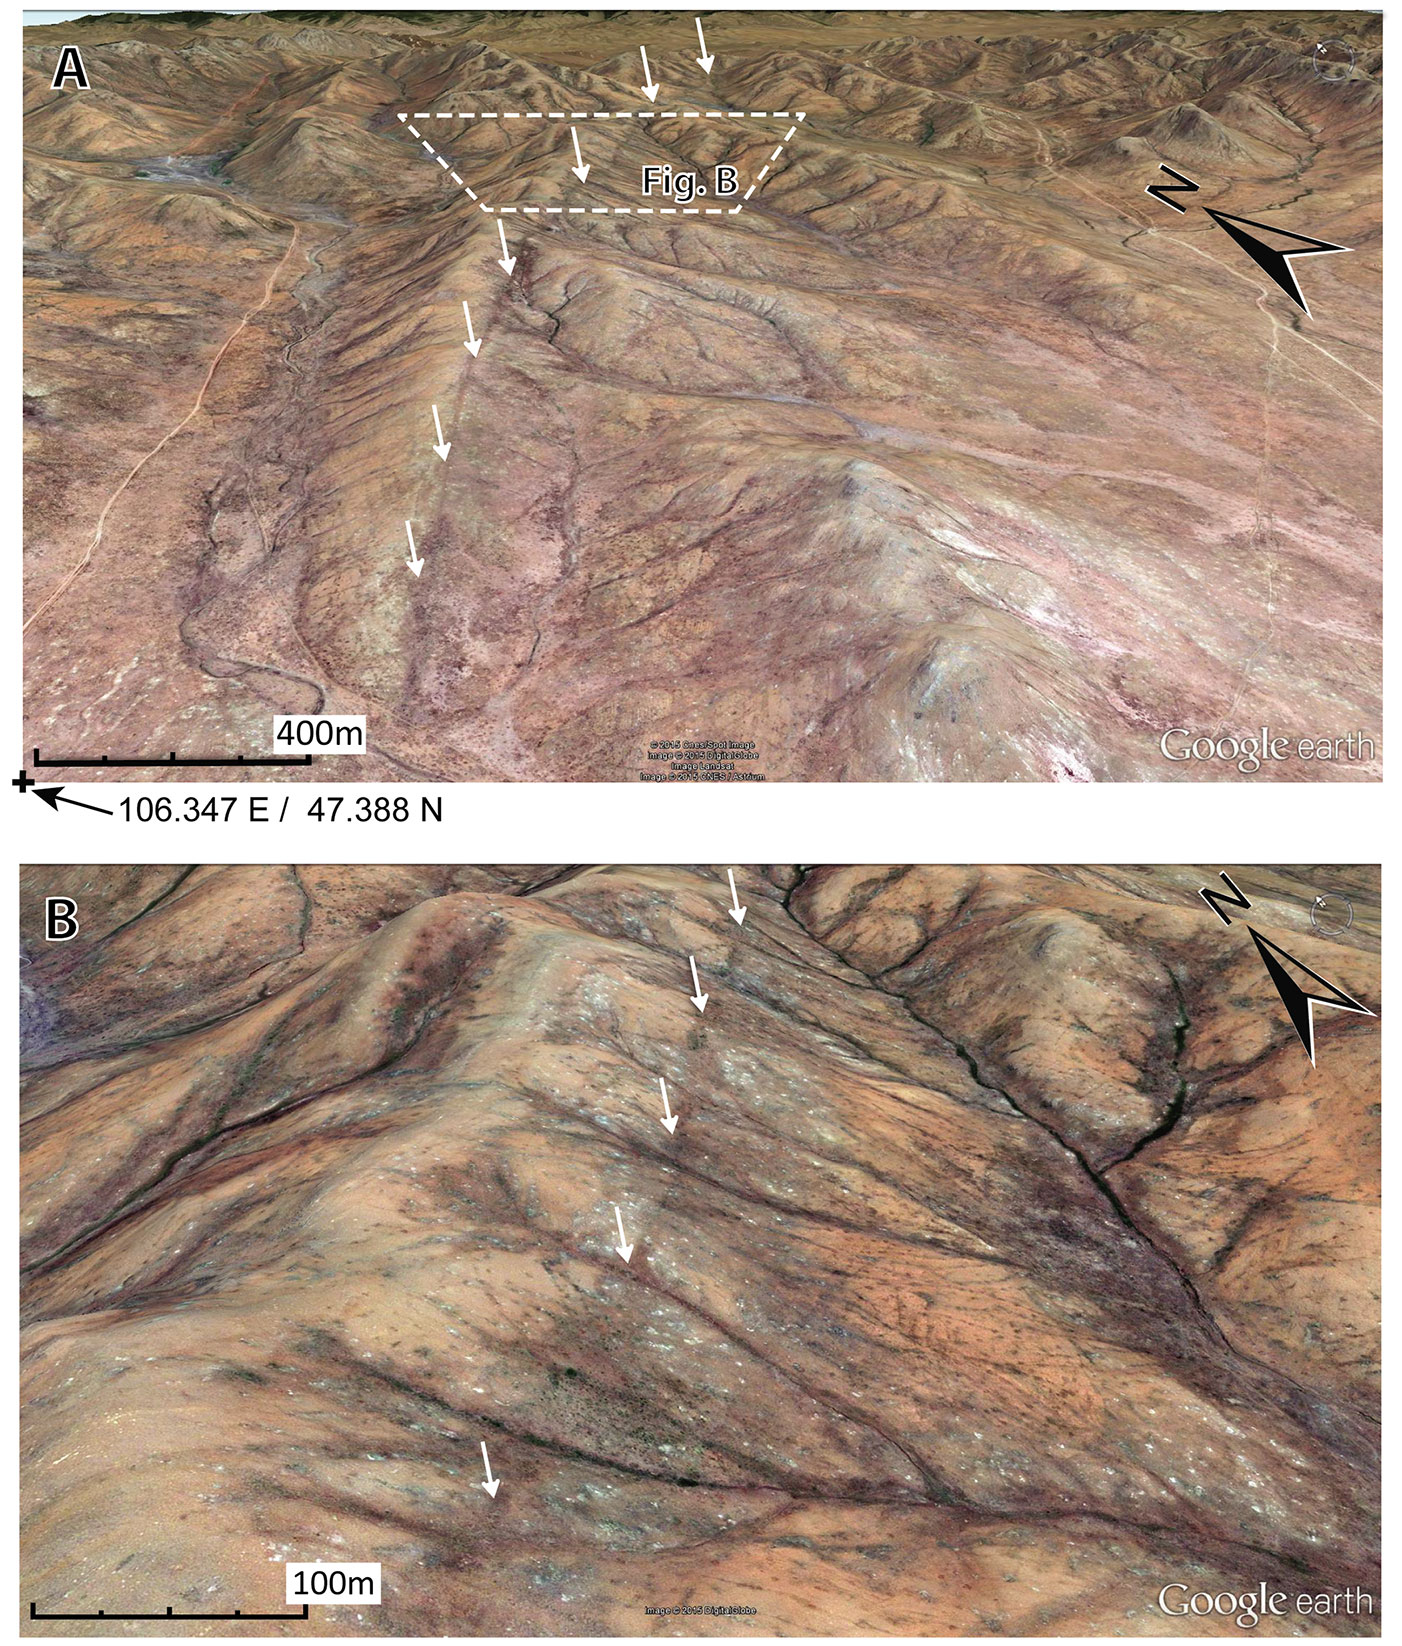
Figure 43D images showing the geomorphology of the Sharkhai fault (white arrows) at its southern end (see Fig. 3 for location). The fault is well identified at regional scale (top image), but the fault trace is smoothed by erosion and shows no clear scarp locally (map data: © Google, © 2015 Cnes/Spot Image, DigitalGlobe, Landsat, Cnes/Astrium).
2.1.3 Southern section
Despite a generally weak morphological expression due to long-term erosion and, locally, recent stream deposits, the surface trace can be followed on HR images and confirmed by field observations (Fig. 4). The southern section runs for ∼ 22 km from points A1 to A3 (Fig. 3) where the fault trace dies out at a large extensional step-over. The main geometric features that we detail hereafter are strike changes and step-overs.
At its southern extremity between points A1 and A2 the fault strikes N42 on average (Figs. 3, 4 and 5). North of A2, the average direction turns from about N42 to N50, which is the largest strike variation along the southern section. In detail, we observe several small step-overs (3, 7 and 70 m width) and locally several changes in strike over short distances (a few hundred meters). Between A2 and B, the fault trace cuts through a Carboniferous hill (1450 to 1645 m elevation) and the top of two successive hills that are oriented N5 and N330 (Figs. 3 and 4). The fault displays an en echelon geometry between (B) and (C) (Fig. 6) with secondary branches parallel or oblique to the main trace. Their lengths range from 190 m to 1.6 km and strike between N58 and N74. Beyond, the fault continues through a valley floor covered with Quaternary alluvial deposits where the trace disappears. Along an 8 km long section where the trace cuts hills and valleys, we identified six cumulative left-lateral offsets (Figs. 3 and 6). The first is drainage shifted by 53 ± 6 m (P1 in Figs. 3 and 7). It corresponds to the maximum offset identified along the southern section of the Sharkhai fault (Table 1). The minimum offsets observed are 6.25 ± 1.65 m (P2 in Figs. 3 and 8) and 6.5 ± 1.5 m (P5 in Figs. 3 and 9). The three other cumulative offsets are 36 ± 5 m (P3 in Figs. 3 and S1 in the Supplement), 30 ± 5 m (P4 in Figs. 3 and S2) and 36 ± 2 m (P6 in Figs. 3 and S3). It should be noted that half of the documented offsets display similar values (30 to 36 m), which suggests the offset features may have a common climatic origin and thus age (i.e., a Late Pleistocene humid period).

Figure 5Map of the fault trace and major strike changes (according to the average direction of every segment). Dashed rectangle is the left step-over which divides the fault into two main segments, southern and northern segments, with a local 5∘ clockwise strike change (from N50 to N55). The average strike change between the southern and northern segments is larger, with 13∘ clockwise (N50 to N63). Secondary branches parallel or oblique to the fault with direction varying between N56 and N83. Coordinates are in UTM zone 48N.
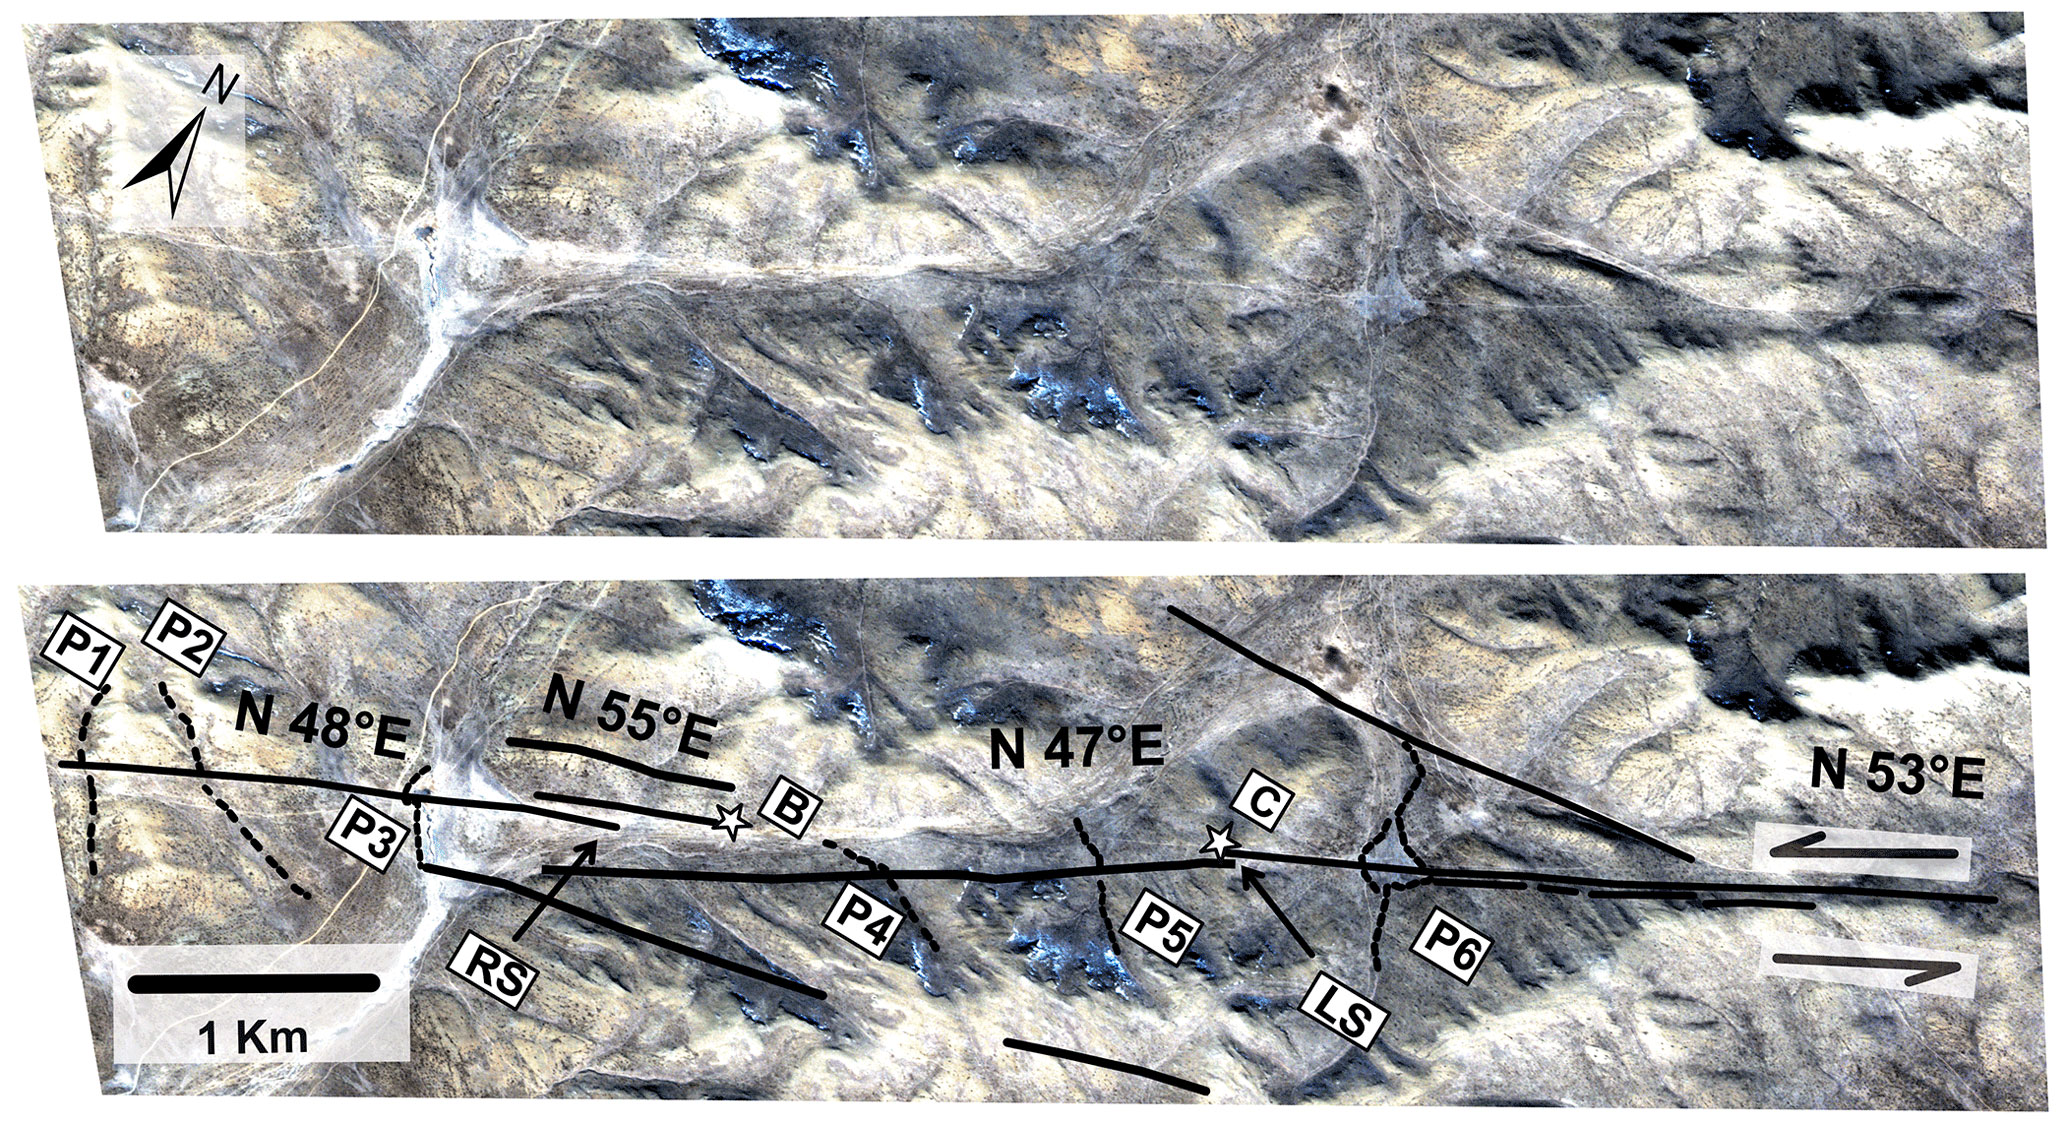
Figure 6Fault map (black lines) covering the central part of the southern section. P1, P2, P3, P4, P5 and P6 are offset drainages. Left step-over (LS) and right step-over (RS) are of 173 and 61 m width respectively. The strike changes locally from N47 to N55∘. Several secondary branches of lengths between 190 m and 1.6 km are either parallel or oblique to the main rupture. Background is a 2 m resolution RGB Pleiades satellite image (PLEIADES © CNES, 2012, distribution Airbus DS). See text for details and Fig. 5 for location.
2.1.4 Northern section
The northern section runs for ∼ 22 km from point A4 to point A7 (Fig. 3). It has a slightly arched shape geometry; its strike turns from N55 to N63 and N72 (Fig. 5). In contrast with the southern section, it shows less in-strike segmentation (no clear step-overs) and more off-fault deformation (10 m long to 1 km long sub-parallel or oblique secondary branches). Locally we also observe changes in the main fault strike over a few hundred meters. This section affects mostly Quaternary deposits (Tomurtogoo et al., 1998) as the trace runs through an area of lower elevation (mainly <1500 m), and the trace frequently disappears, which may suggest limited deformation or high rates of sedimentation. At the northern part of the section we measured 94 ± 3 m of left-lateral horizontal offset affecting a stream (P7 in Figs. 3 and S4), the only one identified along the northern Sharkhai section and the largest along the entire fault. The drainage pattern along the northern section is less complex than that along the southern section but also less developed or preserved, which limits the possible records of displacement. As it reaches the SE part of the Khoshigt Khondii basin where the new international airport of Ulaanbaatar is built (point A7 in Fig. 3), the trace of the Sharkhai fault cannot be observed anymore, neither on remote sensing data nor in the field. It terminates into fluvial plains covered by Quaternary sediments. Hence, the total surface rupture length of the Sharkhai fault could be underestimated by a few kilometers.
Table 1Summary of cumulative left-lateral offsets measured on the Sharkhai fault.

There is only limited information about historical seismicity in the region (catalog duration limited to about three centuries) with the maximum known event reaching magnitude 5 to 5.5. However, possible rupture scenarios and associated magnitudes along the Sharkhai fault are key parameters for estimating seismic hazard levels of the city of Ulaanbaatar and the new airport. Hence, characterizing large earthquakes possibly associated with mapped faults requires applying empirical relationships (Wells and Coppersmith, 1994; Leonard, 2014).
We use the identified discontinuities along the fault to discuss whether the fault could be divided into several segments (Fig. 5) that could break independently or not. Step-overs, secondary branches and fault strike changes can play an important role in the propagation of a rupture (nucleation and barrier) and consequently in the size of expected earthquakes (Poliakov et al., 2002; Wesnousky, 2006; Klinger, 2010; Finzi and Langer, 2012; Biasi and Wesnousky, 2016, 2017). Usually, only kilometer-scale discontinuities are considered for the segmentation (Crone and Hailer, 1991; De Polo et al., 1991; Harris et al., 1991; Wesnousky, 2006, 2008; Carpenter et al., 2012). Therefore, only the central step-over appears wide enough to separate the fault into two potential segments, the southern and the northern. The width of the other step-overs is much more limited, between 3 and 173 m, and is not clearly expressed in the geomorphology. Thus, we do not consider them as potential segment boundaries. Similarly, it has been proposed that changes in strike of more than 5∘ could also play a role in fault segmentation (Lettis et al., 2002; Harris et al., 1991; Wesnousky, 2006; Finzi and Langer, 2012). Nevertheless, recent large earthquakes in Mongolia have shown that even larger changes in orientation had no impact on the fault segmentation (5 January 1967 Mogod earthquake, Mw 7.1, Bayasgalan and Jackson, 1999; 4 December 1957 Bogd earthquake, Mw 8, Rizza et al., 2011). Along the Sharkhai fault, the changes in the orientation are either very local or not exceeding 9∘. Thus, they are not considered as likely segment boundaries.

Figure 7Offset reconstruction for drainage P1 (PLEIADES © CNES, 2012, distribution Airbus DS). (a) Present-day situation: panchromatic Pleiades image displaying the shifted drainage. (b) Present-day situation with drainage and fault. (c, d) Reconstruction of the drainage to its initial position after back-slip along the fault. The maximum cumulative offset measured is 57 ± 2 m (c) and the minimum is 49 ± 2 m (d). Hence the left-lateral offset is estimated at 53 ± 6 m. The uncertainty combines measurement errors (2 m) and data resolution uncertainty (1 m). For location, see Fig. 3..
In conclusion, we propose two possible scenarios for large earthquakes on the Sharkhai fault depending on the role that the central step-over may play in the propagation of the rupture. The first scenario is that the entire fault (40 km) breaks during one earthquake. The second scenario is that the southern segment and the northern segment (22 km each) break independently.
To retrieve the chronology of surface-rupturing paleoearthquakes, we conducted the first paleoseismological study along the Sharkhai Fault at a site called Muka (Figs. 3 and 10). This site was selected based on geomorphological observations performed from high-resolution Pleiades satellite images, high-resolution TanDEM-X DEM and field surveys. Considering an a priori slow rate of deformation, our strategy was to avoid apparently recent deposits found in wide alluvial valleys, as well as associated erosion processes, that could cover the recent deformation in the last 3–4 m or erode the last event records and rather target relatively slow deposition processes such as colluvium on gentle slopes and abandoned or intermittent drainages. The subtle geomorphological expression of the Sharkhai fault combined with high elevation along most of its trace yielded only a few favorable sites where the fault is well expressed and potentially datable deposits are expected. The Muka site is located near the Zuunmod–Buren road and ∼ 10 km SW of the new airport. There, the trace of the fault is clear, enhanced by a small scarp (about 30 cm high) (Fig. 10c) and a striking difference in vegetation type and color, often indicative of a local contrast in lithology and/or hydrology in the shallow sub-surface. This small scarp suggests surface deformation with an apparent vertical offset that could be induced by horizontal slip along slopes. The fault affects here surface colluvium deposited along the flank of a small valley. Local gullies are intermittent and probably only active during important rainfall (Fig. 10a and b). Hence, we consider this site favorable to the accumulation of deposits, the preservation of the fault's paleoseismic history and the determination of paleoearthquake chronology by radiocarbon and/or OSL approaches.
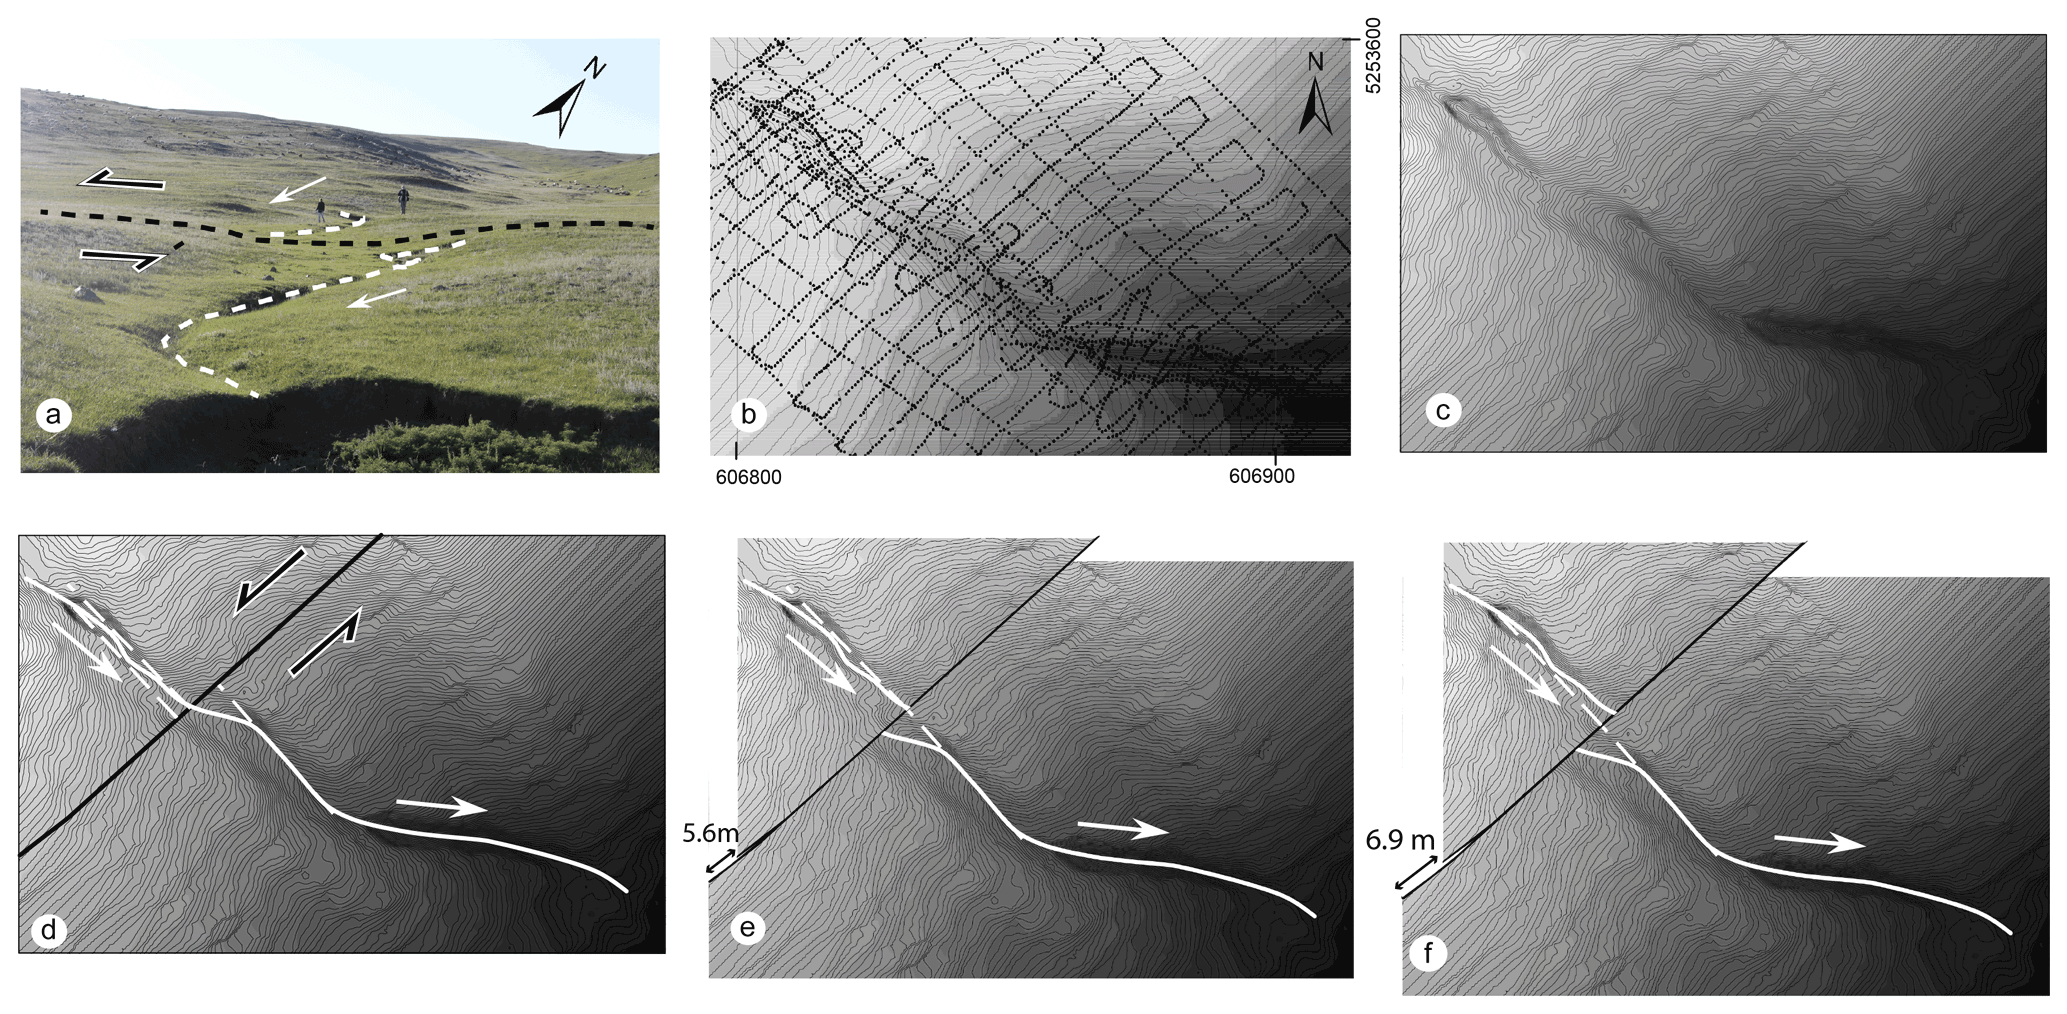
Figure 8Offset reconstruction for drainage P2. (a) Field photograph of P2: the black dashed line indicates the fault trace. The north direction in the photograph is approximate. (b) Differential GPS measurements used to build the digital topographic map. (c) Digital topographic map based on GPS measurements. (d) Present-day situation: the offset is measured on images by projecting the average upstream and the downstream to the fault trace. We consider for the upstream a “wide zone” giving an uncertainty on its piercing position for the back-slip reconstruction. (e) Minimum back-slip reconstruction of 5.6 m. (f) Maximum back-slip reconstruction of 6.9 m. Hence, the left-lateral offset is estimated at 6.25 ± 1.65 m. White arrows: water flow direction. For location, see Fig. 3.
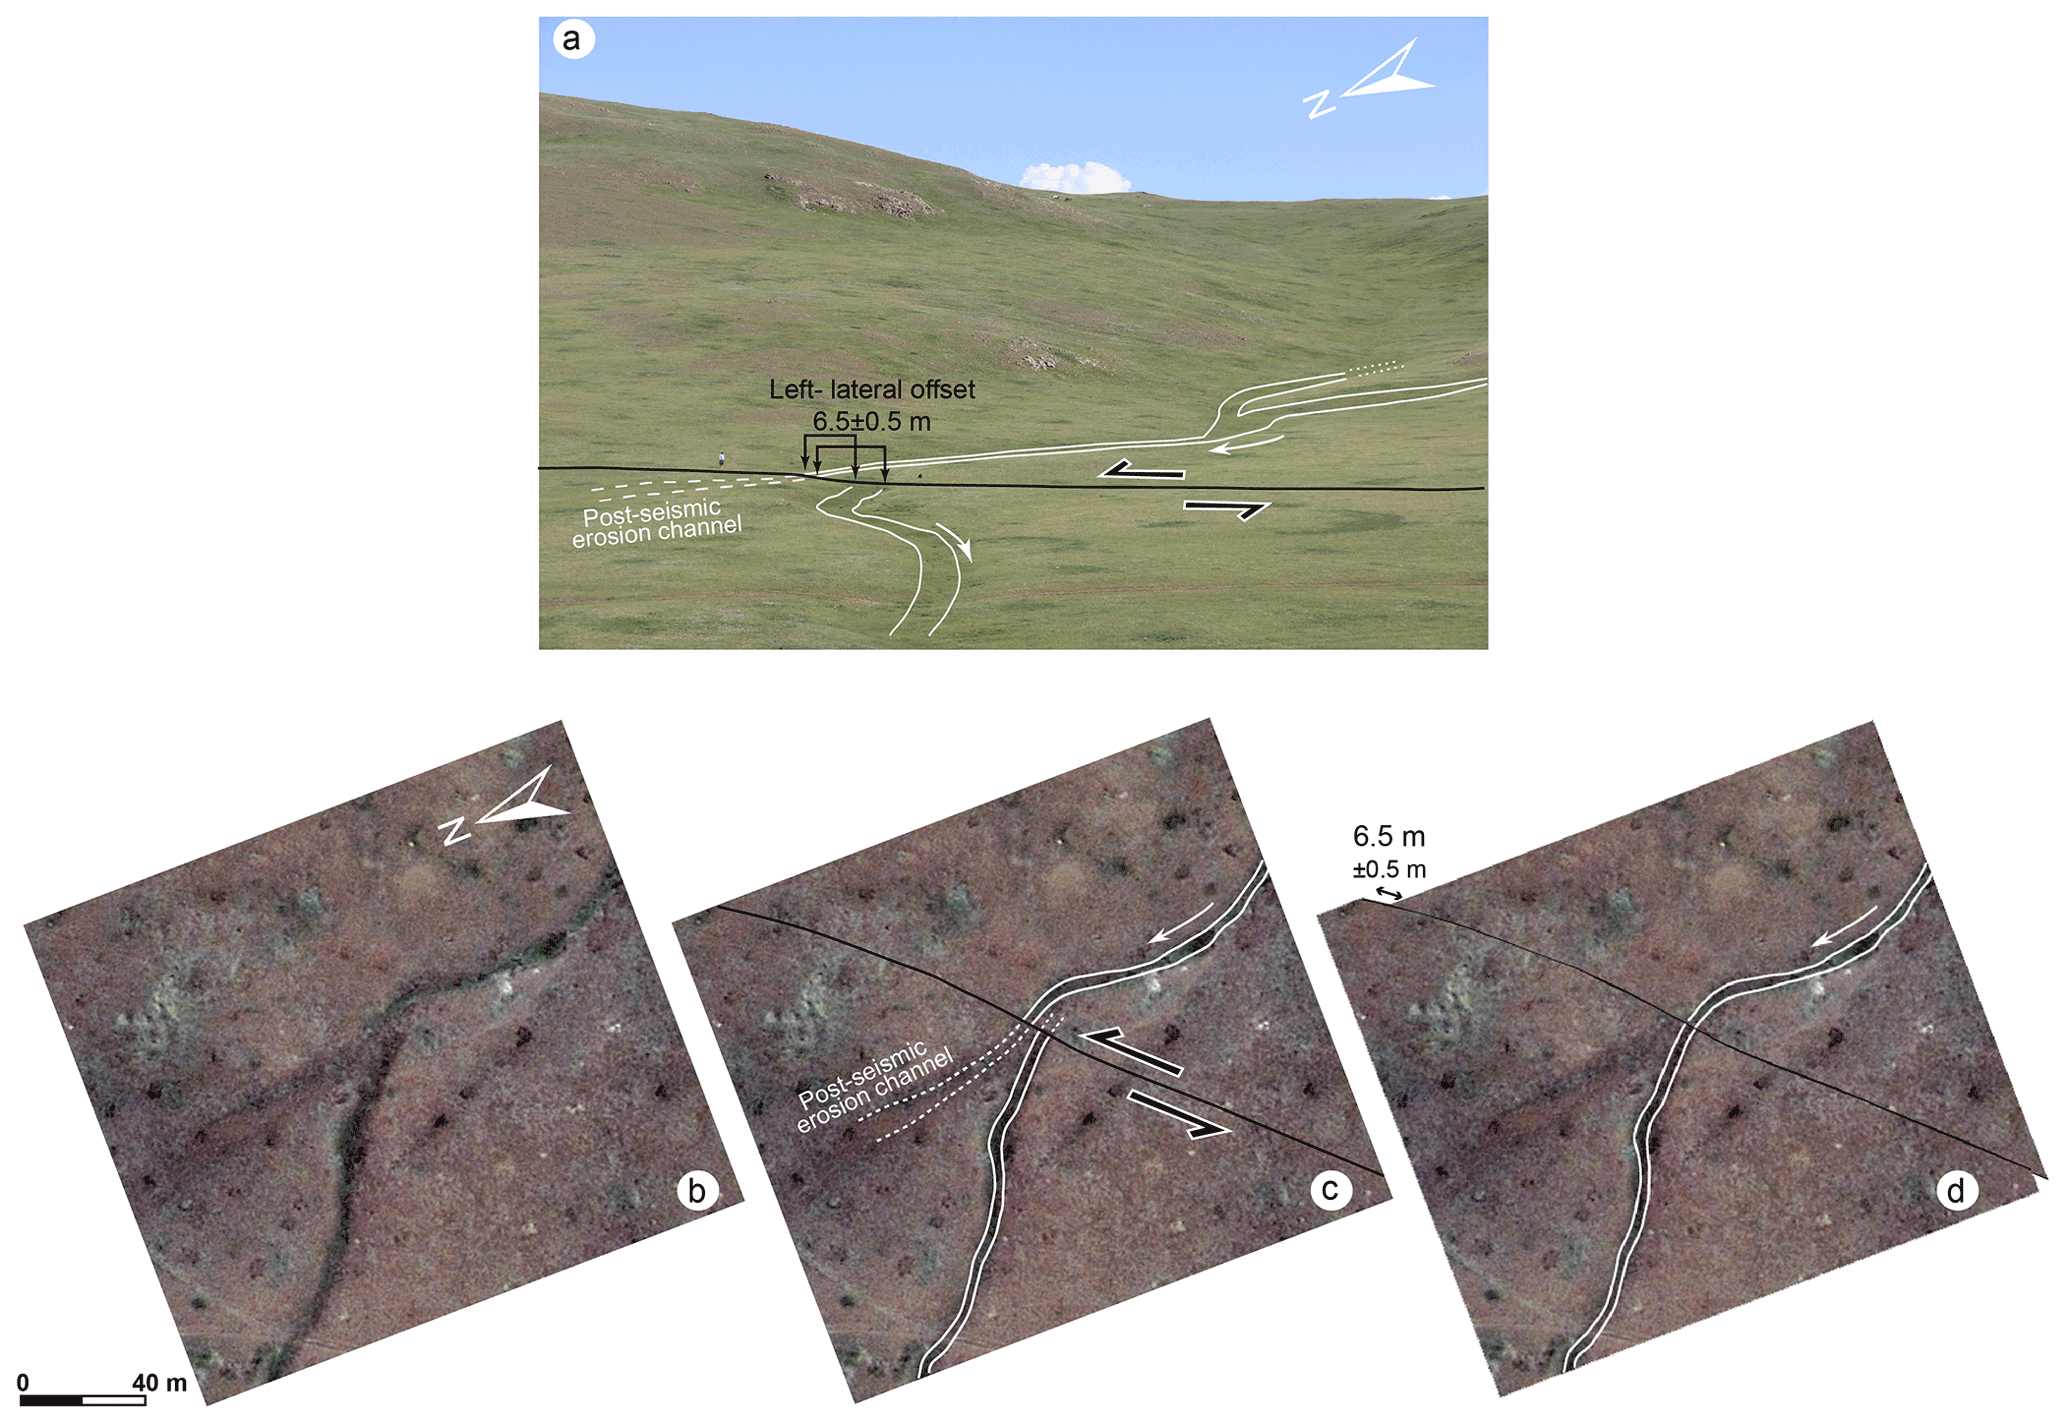
Figure 9Offset reconstruction for drainage P5 (map data: © Google, © 2021 Maxar Technology). (a) Field photograph: the black line indicates the fault trace, and the white lines mark the edges of the P5 channel. The north direction in the photograph is approximate. (b) High-resolution satellite image of P5. (c) Present-day situation with the fault (black line) and the paleoriver (white lines) disconnected across the fault. Note the post-seismic erosion due to the upstream flow that crosses the fault. (d) Reconstruction of the drainage to its initial situation yields 6.5 ± 1.5 m of cumulative left-lateral offset. The uncertainty combines measurement errors (2 m) and data resolution uncertainty (1 m). For location see Fig. 3.
The Muka site is located at 628 253 m E/5 268 367 m N along a straight section of the fault where deformation at the surface appears well-localized (Fig. 10). There, the fault marks a break in slope with a ∼ 30 cm high scarp and is crossed by short (100–500 m in length) shallow gullies. We excavated two trenches called Muka-K and Muka-L (Fig. 10b), ∼ 150 m apart. Both trenches were ∼ 20 m long, 1 m wide and up to 3 m deep as limited by the local permafrost. Heavy rainfall and thawing of the exposed permafrost destabilized overnight the fine deposits (silt and sand) found in Muka-K. Wide sections of the trench collapsed, and it was considered unsafe. Stable substratum crops out at the bottom of Muka-L, which stabilized the whole section and gave time to reinforce the walls with wooden shores. In the following, we present the Muka-L exposure only.
4.1 Trench stratigraphy
Both trench walls were cleaned, gridded, photographed and logged in detail. The Photomosaic of the trench (west and east wall), 15 m long and 3m deep, is built using 210 photographs. Since both walls yield similar information in terms of paleoseismicity, we only present the west wall in detail along with close-ups of the east wall for illustration (Fig. 11). In the following, we describe the stratigraphy, provide age constraints on the basis of radiocarbon-dated sediment samples and analyze abutting relationships to decipher the chronology of surface-rupturing earthquakes at this site.
The base unit visible along the whole trench is composed of massive Carboniferous bedrock (U70). The U70 exhibits widespread fracturation and localized shear zones with thin gouge development (<2 cm). The uppermost 10–50 cm of U70 are composed of deeply weathered, well-sorted unstratified fine clasts (<3 cm) that we interpret as the product of gelifraction. Numerous thin shear zones marked by whitish-to-yellowish clay cut through the whole unit and stop at its top surface. They generally exhibit a relatively steep dip to the south and produce duplexing features within the weathered part of U70. The top surface is very rough with deep troughs and systematically truncates reverse-geometry shear zones; it is interpreted as a well-developed erosion surface. Although the bottom of the trench was still frozen during the excavation done in summer, we did not find clear indication of gelifraction of the erosional surface at the top of U70.
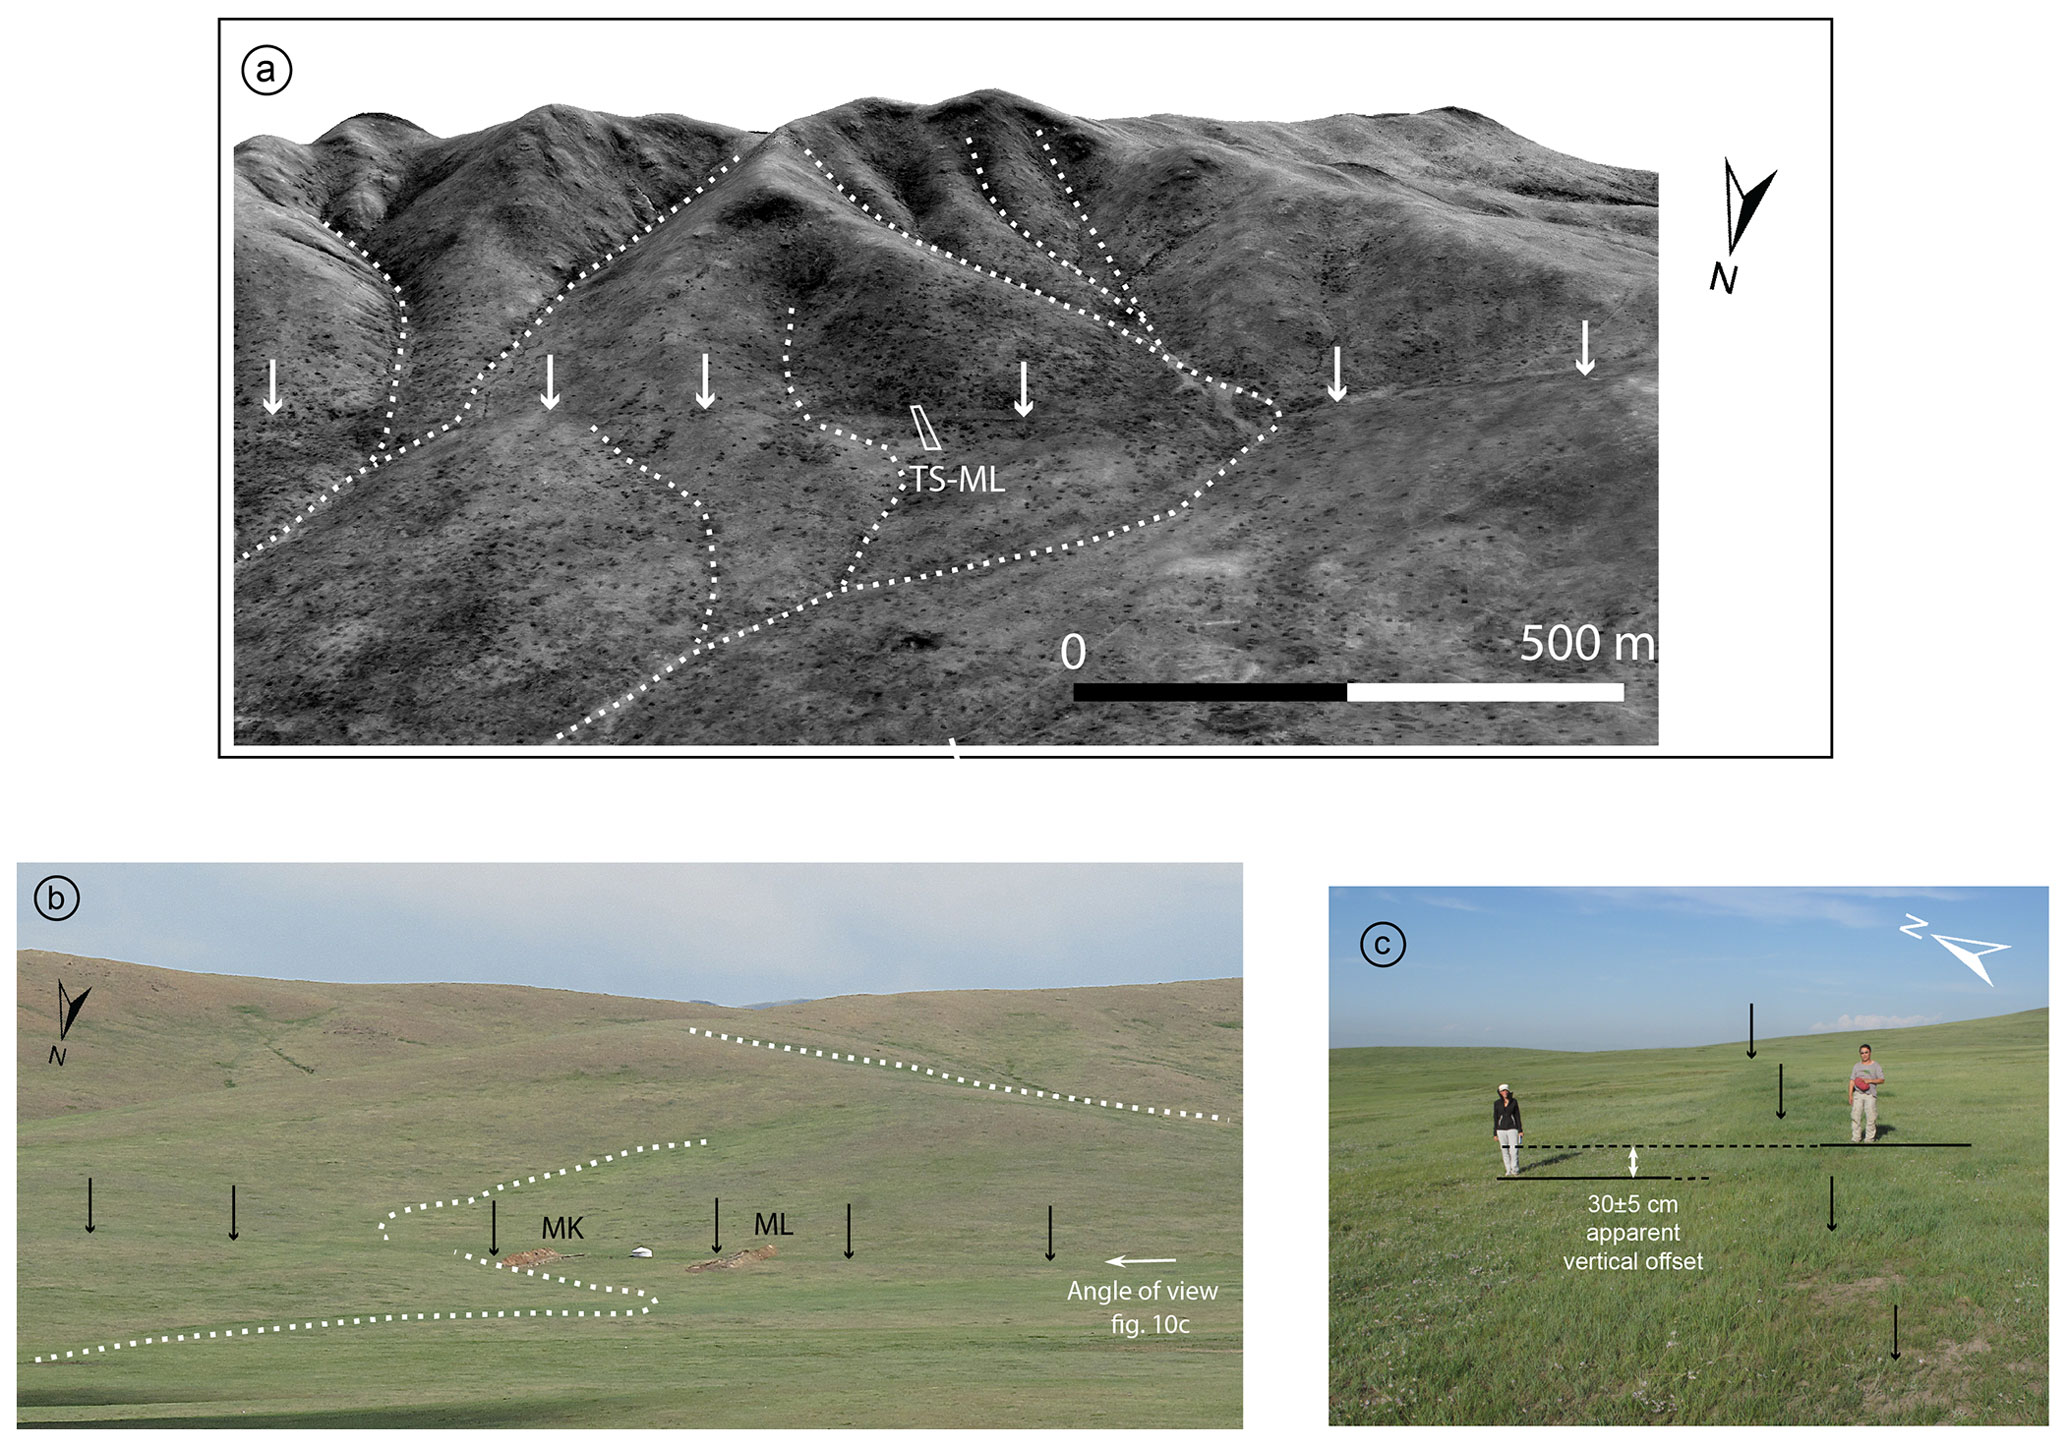
Figure 10(a) 3D perspective view from panchromatic Pleiades image (0.5 m resolution, PLEIADES © CNES, 2012, distribution Airbus DS) draped TanDEM-X DEM (12 m resolution) shows the Muka-L trench site (TS-ML), the fault trace (white arrows) and the temporary drainages (dashed white lines). (b) Field photograph of the trench site (ML shows Muka-L and MK Muka-K excavations). (c) Field photograph looking east along the fault, before excavation, shows the fault trace (dashed line) marked by well-developed vegetation. Note the small component of apparent vertical movement (30 ± 5 cm). For location see Fig. 3.
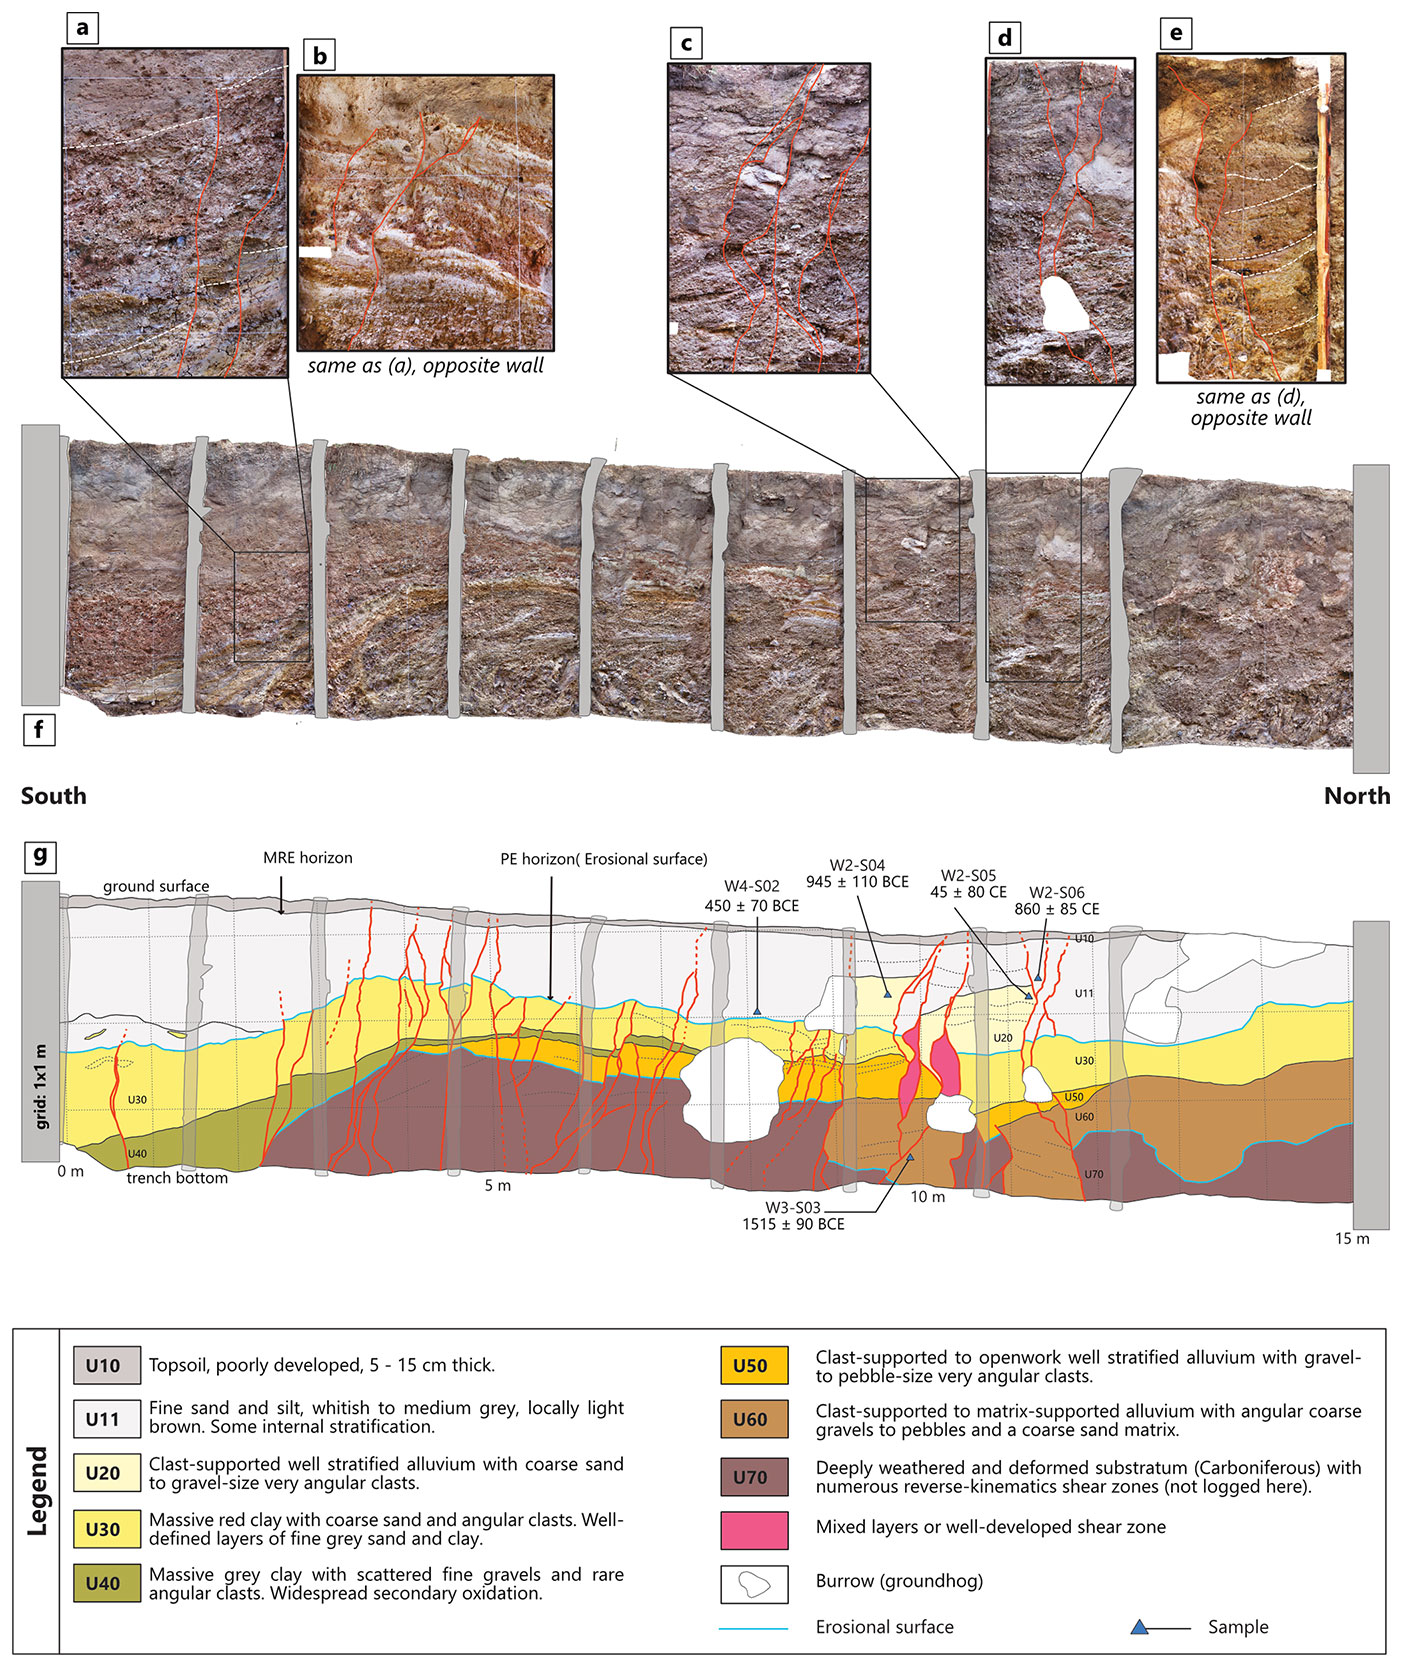
Figure 11Muka-L trench exposure. (a–e) Close-ups showing deformation features (step-like geometry, geometry resembling flower structures, apparent offsets). (f) General orthophoto mosaic of the west wall, originally rendered at 1 mm resolution. (g) Detailed paleoseismic log of the west wall. The ruptures associated with the last two events are in red. Event horizons are shown for the most recent event (MRE) and the penultimate event (PE). See text for details.
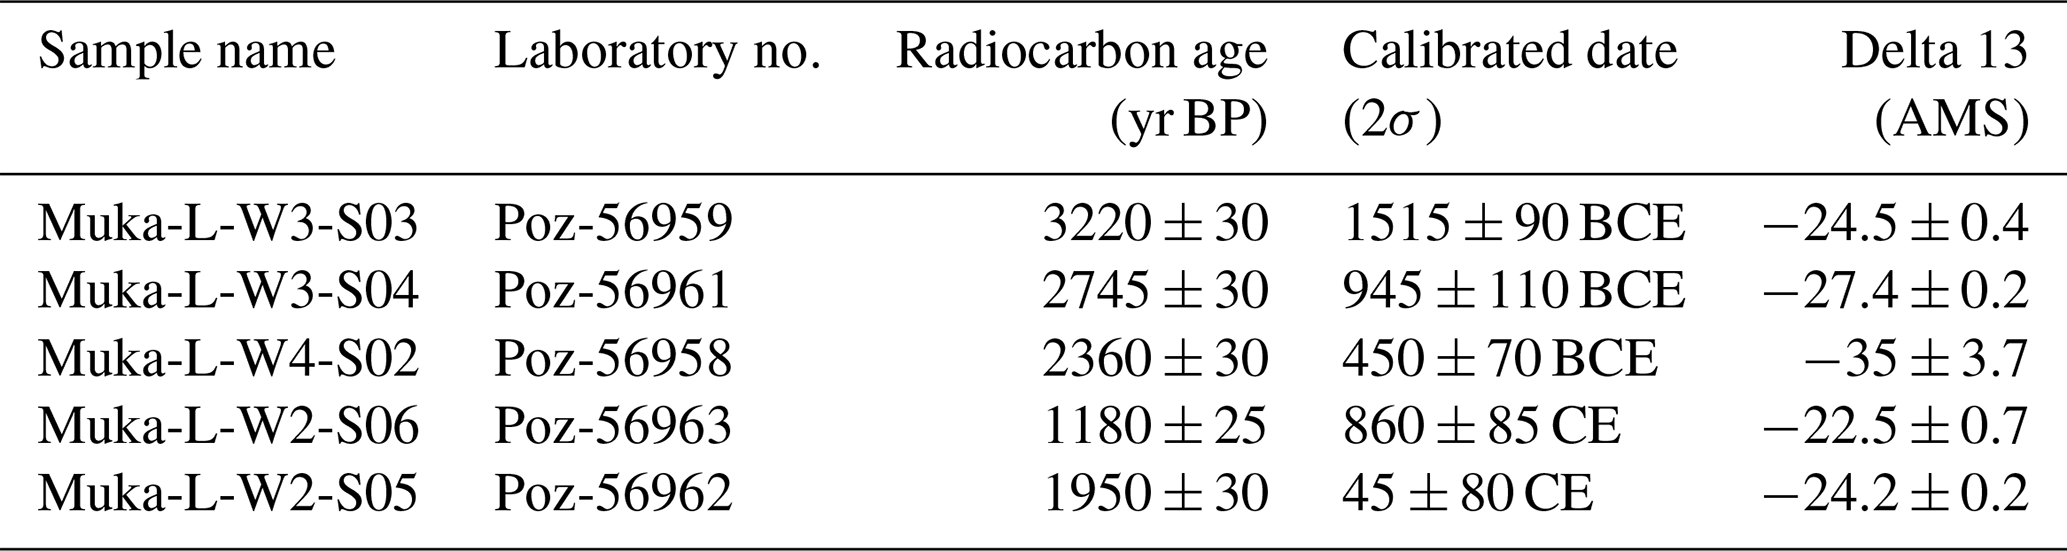
Over the northern section of the trench, U70 is overlain with a ∼ 1 m thick unit of massive clast-supported coarse gravels and pebbles (U60). Clasts present the same lithology as U70 are very angular and well stratified, which suggests they have been transported by water but only over a very short distance. U60 contains a few lenses of dark brown to black fine sand. Combining with the geometry of the lower erosion surface, we interpret U60 as a channel fill. Sample W3-S03 (Fig. 11g and Table 2) was collected within this unit and yields a radiocarbon calibrated age of 1515 ± 90 BCE (3220 ± 30 BP).
Table 2Radiocarbon dating of bulk-sediment samples collected in the Muka-L trench and dated by the Poznań Radiocarbon Laboratory. The software OxCal V2.4 (Ramsey, 2013) with 2-sigma error was used to obtain the calendric ages with an Intcal13 calibration curve (Reimer et al., 2013).
In the central part of the trench, U70 is overlain by a ∼ 8 m wide, 50 cm thick unit that pinches out at both tips (U50). This lens contains similar clasts to those in U60 with a much smaller matrix fraction (clast-supported to openwork). It exhibits well-defined sub-horizontal stratigraphy and is interpreted as a low-energy channel.
The southern half of U50 is itself overlain by a 5–10 cm thick well-sorted fine sand unit (U40) that changes laterally to massive amounts of clay, locally grey but with widespread secondary oxidation. It fills a small basin bounded by U70 at the southernmost end of the trench. There, U40 displays growth strata and contains massive clay with rare scattered angular gravels (Fig. 11a). This marks a change in the depositional environment: a small pond in a rather dry climate with occasional clasts from the surrounding slope.
A higher well-developed layer (U30) crops out over the whole length of the trench. Unit 30 is composed of massive red clay and coarse sand with abundant scattered gravel and some well-sorted grey sand lenses (Fig. 11a). The clay fraction is dominant within the small depression (between x=0 and x=4 m) to the south and diminishes to the north where sand lenses are thicker (5–8 cm) and more continuous. There, the matrix contains numerous pockets of secondary white clay (Fig. 11b). Overall, the stratigraphic facies of U30 resemble red clay formations generally associated with a warm and humid climate (Feng et al., 2007).
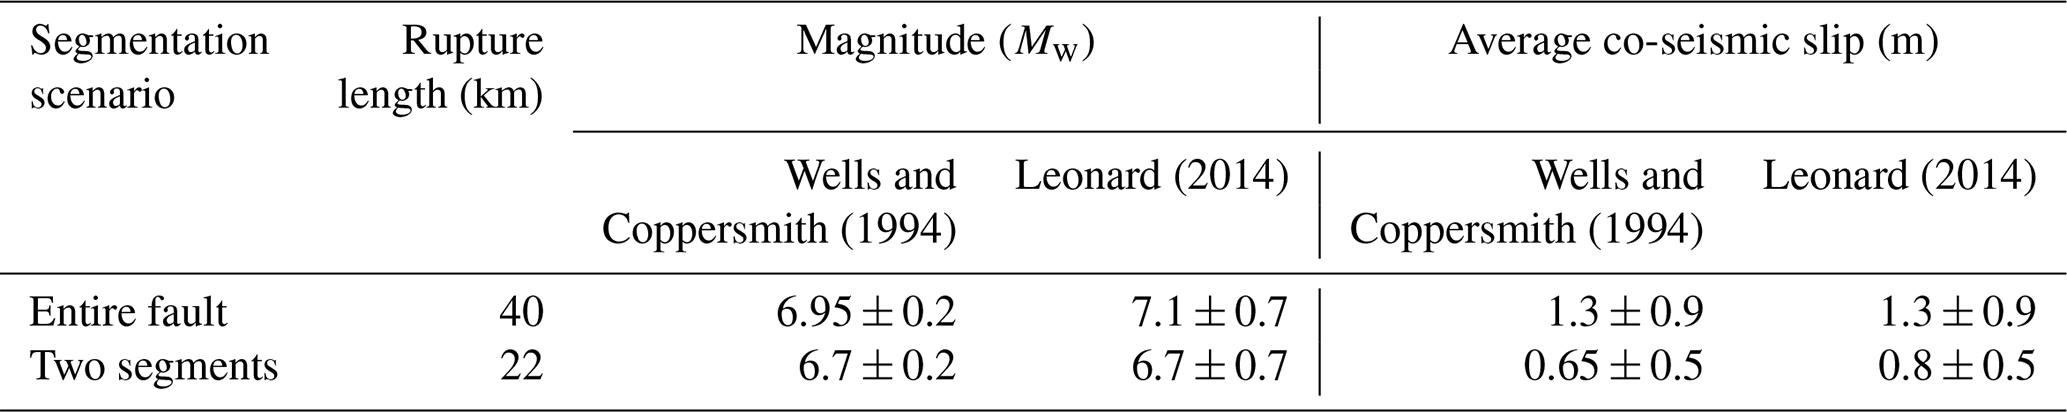
Table 3Estimation of the magnitude and average co-seismic slip using Wells and Coppersmith (1994) and Leonard (2014) regressions. The fault length is determined from the segmentation scenarios.
Between x=9 and x=12 m, three blocks with well-defined edges make up unit U20, composed of well-stratified sand and angular fine gravel with very little matrix-resembling channel fill unit U50. It is considered allochthonous with respect to the rest of the stratigraphic section and interpreted as a small channel that flowed oblique to the fault and was dragged along it. A modern equivalent could be seen in the shallow intermittent stream that flows across the site next to trench Muka-K (Fig. 11b). We collected two samples from the top of U20: W2-S04 yielded a calibrated date 945 ± 110 BCE (2745 ± 30 BP) and W2-S05 a calibrated date 45 ± 80 CE (1950 ± 30 BP). Sample W2-S05 sits very close to a rupture and exhibits dense live rootlets that could have been a guide for contamination. Hence, we interpret W2-S05 as contaminated and rejuvenated with respect to its stratigraphic position and discard it from our analysis.
Finally, the uppermost unit called U11 is a 0.8–1.5 m thick massive fine sand and silt layer. It is overall grey in color, is darker near its base and displays discontinuous brown to black lenses throughout the section. At the southern end of the trench, it contains clasts of U30, which indicates the base of U11 is an erosion surface. Above this local transition, no internal stratigraphy could be observed. Its top is dominated by weak present-day soil development (U10), which is only visible within the first 8–10 cm from the ground surface. We collected two sediment samples from U11 within dark lenses: one at the bottom (sample W4-S02) yielded a calibrated date 450 ± 70 BCE (2360 ± 30 BP) and one in the mid-section (sample W2-S06) with a calibrated date 860 ± 85 CE (1180 ± 25 BP). This is the youngest age constraint found in the Muka-L trench.
4.2 Surface faulting events at the Muka-L site
Trench Muka-L revealed numerous deformation features (Fig. 11a–e): interrupted and offset layers displaying step-like geometry (Fig. 11a), splay structures (Fig. 11b) and grabens (between 6 and 7 m in Fig. 11g), among others.
The Carboniferous bedrock (U70) is intensely deformed by widespread fractures and numerous shear zones dipping 30–50∘ to the south and infiltrated by white to yellow clay. This unit is brittle enough for groundhogs to be able to dig through it (see the large burrow at x=8 m in Fig. 11f–g). This deformation is inconsistent with ruptures observed in upper units and is limited to U70; it is therefore considered representative of an ancient tectonic regime and will not be described any further here.
The sedimentary section (units U60 to U10) is affected by ruptures exhibiting generally near-vertical dips with some dipping slightly to the south and a few to the north. Splays with geometries resembling flower and double flower structures (Fig. 11b–e and g at x=4.5 m) are the cross-section expressions of horizontal movement along en echelon fissures and indicate a strike-slip component. This is confirmed by significant variations in unit thickness across faults as displayed by U60 between x=9 and 12 m. Furthermore, numerous extensional features such as stepping ruptures at the edge of the pond, a graben at x=6–6.5 m, and the collapse of the completely sedimentary section between x=10.5 and 12 m suggest transtensional deformation. The detailed trench log (Fig. 11g) reveals that apparent normal geometry ruptures are dominant south of x=8 m (main burrow) and expressed as distributed minor vertical individual offsets of 5–15 cm (with a possible contribution from strike-slip displacement). Dominantly strike-slip deformation appears to be limited to a narrow band between x=9 and 12 m. There, large vertical apparent displacements (>50 cm) and allochthonous blocks suggest significant horizontal deformation.
Logged ruptures display terminations at different levels. Between x=5 and 7.5 m all ruptures terminate at the top of U30 and are truncated by the upper erosion surface. A few more ruptures between x=8 and 9 m appear to display a similar geometry, though extensive burrowing hinders proper observations. These ruptures would have affected the stratigraphy posterior to the deposition of U30 and prior to the erosion of its top surface; i.e., between 1605 BCE (upper bound of Muka-L-W3-S03) and 835 BCE (lower bound of Muka-L-W3-S0). A second generation of ruptures cuts through the whole section and affects U11 and possibly U10 (soil development renders our observations inconclusive): between x=3 and 5 m, at x=7 m, and between x=9 and 12 m. The event occurred posterior to the deposition of the youngest unit (U11); i.e., it should be noted that a few isolated ruptures located at around x=3 and x=6 m affect the upper erosion surface (top of U30) but do not appear to propagate further upward. Although they could be associated with an intermediate event, we propose they are associated with the most recent one, and their upward continuation could not be observed due to the lack of clear stratigraphy within U11. Furthermore, small vertical offsets affect the top of U30 between x=3 and 5 m with an apparent component (the bottom and top of U30 do not display the same offsets).
In summary, the Muka-L trench documents the erosion and deposition record for the last ∼ 3000 years with varying environments. Abutting relationships reveal at least two deformation events. (1) The first is a most recent event (MRE) after 775 CE (lower bound of W2-S06). Considering that Ulaanbaatar was installed in 1778 (e.g., Majer and Teleki, 2006), a large earthquake after this date along this fault would have been reported in the historical documentation, which is not the case. Thus, the MRE occurred anytime between 775 and 1778 CE. (2) The second is a penultimate event (PE) occurred between 1605 BCE (upper bound of Muka-L-W3-S03) and 775 BCE (lower bound of Muka-L-W3-S6).
Table 4Minimum and maximum inter-event time and slip rate for the Sharkhai fault (WC94: Wells and Coppersmith, 1994; L14: Leonard, 2014).

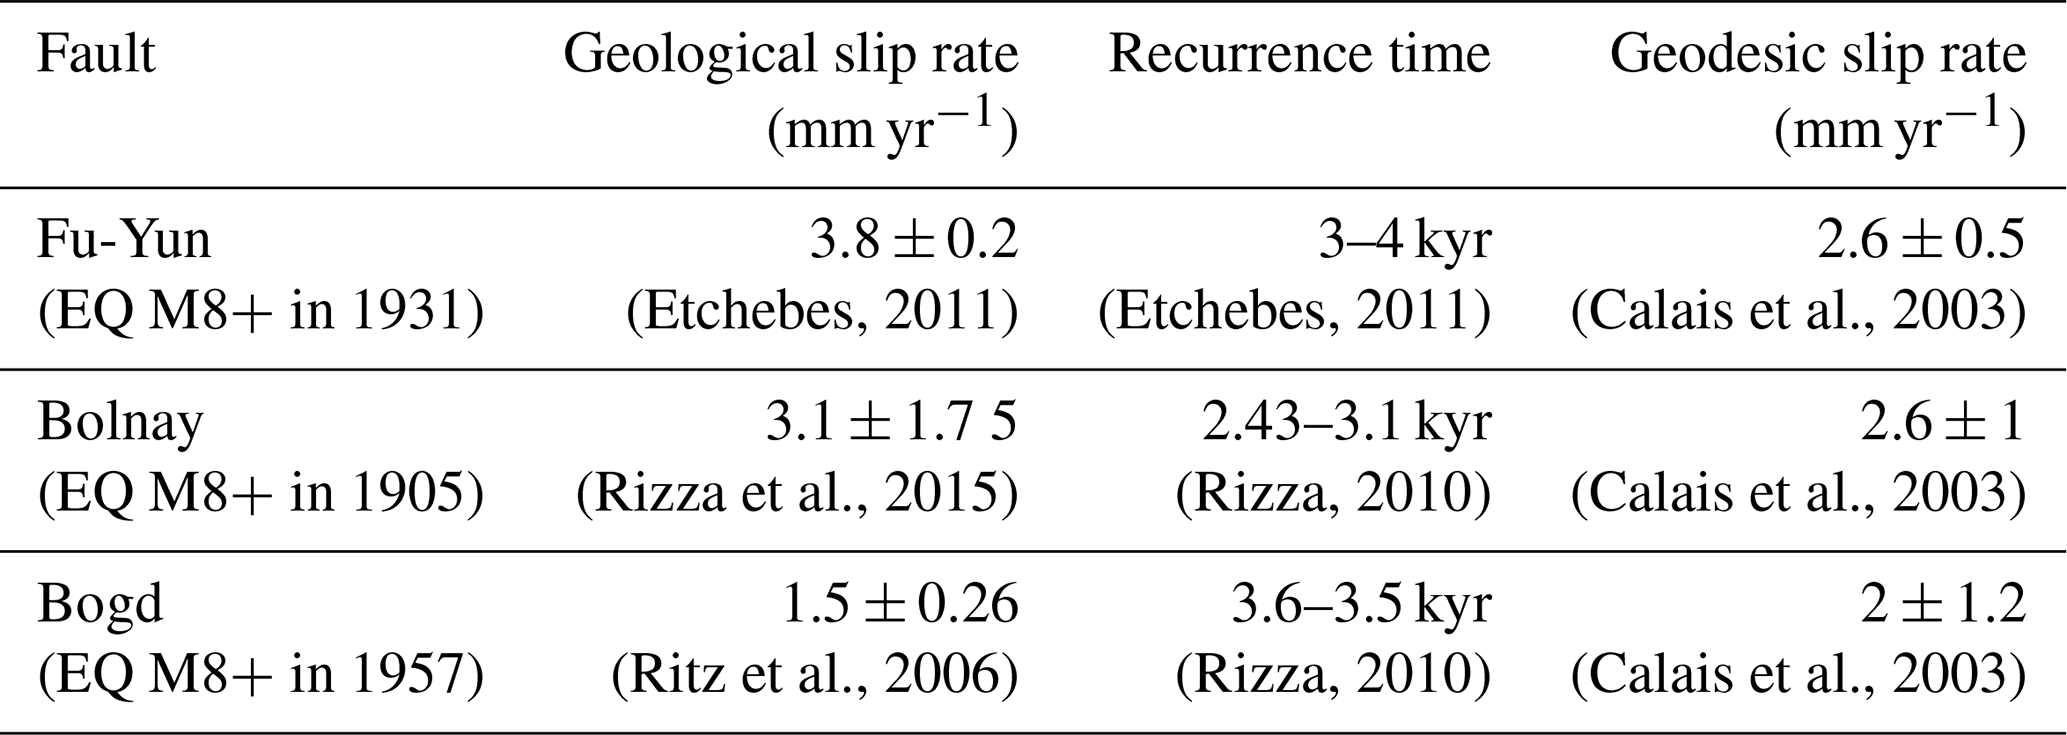
Table 5Synthesis of geological or geodesic slip rates and recurrence time for large events published for large faults in western Mongolia.
5.1 Surface trace geometry and inter-event time
From our morphotectonic analysis based on field observations and HR remote sensing data, we mapped the Sharkhai fault, oriented N57 (N57 ± 15), over a length of ∼ 40 km (Fig. 5). The tips of the surface rupture terminate into wide fluvial plains (a few kilometers wide) where they are covered by sediments. Hence, the total surface rupture length of the Sharkhai fault could be underestimated by a few kilometers. The surface expression of the fault is divided into two main segments displaying a slightly arcuate shape and separated by a large extensional step-over of 1.4 km in width. Both segments are of similar length (∼ 22 km) with a lateral overlap of ∼ 4 km. We also describe internal geometric discontinuities that are typical for large strike-slip faults: strike changes of 5 to 9∘, local step-overs of 3 to 173 m in width, and secondary branches of 10 m to 1.6 km in length (Figs. 5 and 6). Generally, these discontinuities are too small to play an important role in the rupture propagation and total length and related earthquake size (Poliakov et al., 2002). Conversely, the width of the main extensional step-over corresponds to features that may equally stop or promote the propagation of the rupture in similar settings (Wesnousky, 2006).
Along the strike, we documented seven streams affected by left-lateral cumulative offsets ranging from 6.25 to 94 m with two of about 6 m (Figs. 8 and 9) and three of 30–36 m (Figs. S1, S2 and S3 in Supplement, and Table 1). We did not observe systematic vertical deformation, the local vertical displacements being easily explained as apparent and induced by horizontal slip along slopes.
Our work is the first paleoseismological study along the Sharkhai Fault. The Muka trench site is located near the end of the mapped rupture (Fig. 3), which is not the standard strategy for such a study since deformation may be weakly expressed and the resulting record may be less legible and possibly incomplete. However, potential sites are scarce along the Sharkhai Fault, and this site was selected on the basis of remote sensing and field observations for its relatively high sedimentary potential. It delivered well-expressed surface deformation and adequate deposits for age determinations. The Muka-L trench analysis reveals two paleoearthquakes along the Sharkhai fault: the most recent event (MRE) occurred between 775 and 1778 CE and the penultimate earthquake (PE) occurred between 1605 and 775 BCE, which yields an inter-event time of 2496 ± 887 years (between 3383 years and 1610 years). This is the first inter-event time constraint for the Sharkhai fault, and it is comparable to values derived for major active faults elsewhere in Mongolia (e.g., Prentice et al., 2002; Rizza et al., 2015).
5.2 Magnitude, co-seismic displacement and slip rates
The data collected on the Sharkhai fault, although preliminary, allow us to make some considerations on the seismic potential of this fault. Based on the fault geometry and internal organization we may consider two rupture scenarios: (i) the entire fault ruptures into a single event over a length of 40 km and (ii) the two segments rupture independently into two distinct events over lengths of 20 km (Table 3). In the absence of coseismic slip observed along the fault, we used the scaling laws of Wells and Coppersmith (1994) and more recent work done by Leonard (2014) to associate magnitudes and co-seismic slip values to each scenario based on the length of the activated segments. We used the regression to estimate magnitude (M) according to surface rupture length (SRL), and the regression between co-seismic slip or average displacement (AD) according to surface rupture length (SRL).
Wells and Coppersmith (1994) give for strike-slip faults a=5.16 ± 0.13 and b=1.12 ± 0.08. Leonard (2014) gives for strike-slip faults a=4.17 (3.77 to 5.55) and b=1.667.
Wells and Coppersmith (1994) give for strike-slip faults ± 0.23 and b=1.04 ± 0.13. Leonard (2014) gives for strike-slip faults with SRL 3.4 to 40 km (−4.30 to −3.40) and b=0.833.
The deduced magnitudes Mw are 6.7 ± 0.2 and 7.1 ± 0.7 for the two segments and entire fault scenarios respectively (Table 3). It is important to note that we did not observe a single co-seismic offset in the field. Therefore, the co-seismic slip values are estimates based on the length of the rupture, considering the two scenarios, and Wells and Coppersmith (1994) or Leonard (2014) relations (see relations above). The deduced co-seismic slip estimates vary between 0.65 ± 0.5 m and 1.3 ± 0.9 m (Table 3).
For the scenario when the entire fault breaks in one event, the slip rate would be between 0.4 ± 0.3 and 0.8 ± 0.6 mm yr−1, and for the scenario when the two segments break separately, it is between 0.2 ± 0.1 and 0.5 ± 0.2 mm yr−1 (Table 4).
The timing of the last event (between 775 and 1778 CE), the inter-event time (between 1610 and 3383 years) and the slip rate (between 0.2 ± 0.1 and 0.8 ± 0.6 mm yr−1) are consistent with the weakly expressed morphology of the fault. Notice that considering the uncertainties, the lowest slip rate value could be as low as ≈ 0.1 mm yr−1 with the scenario of an event breaking only one segment of the Sharkhai fault every 3383 years on average. The upper bound (0.8 ± 0.6 mm yr−1) appears unrealistically high for a single structure concerning region-wide values.
The first results from a local GPS network deployed in the Ulaanbaatar area since 2010 (Miroshnichenko et al., 2018) show local complexities and a high heterogeneity in direction and velocity. However, most GPS stations moved 3 ± 1 mm yr−1 to ESE, horizontal displacement with respect to Eurasia (Miroshnichenko et al., 2018). However preliminary, this is consistent with our observations and previous studies that the region absorbs part of the deformation along various active faults.
Several slip rates and recurrence times have been estimated and published in western Mongolia (Calais et al., 2003; Ritz et al., 2006; Etchebes, 2011; Rizza et al., 2015), focused on faults where large earthquakes (M8+) occurred (1905, 1931, 1957) and associated with hundreds of kilometers of surface ruptures (Table 5). Their estimated slip rate values, 1.5 to 3.8 mm yr−1 for geological slip rates and 2 to 2.6 mm yr−1 for geodetic slip rates, are about 2 to 10 times faster than those we estimate for the Sharkhai fault. The recurrence times estimated over that region (2.43 to 4 kyr) are of the same order as the inter-time estimated for Sharkhai (1.6 to 3.4 kyr), but the magnitudes considered in western Mongolia are about 8 and more while they are about 7 for the Sharkhai fault. The deformation along the Ulaanbaatar region's active faults is much lower than in western Mongolia.
Our results are therefore consistent with other observations in the region. However, our preliminary findings do not favor a specific rupture scenario and associated magnitude for the Sharkhai fault.
5.3 Implications for the seismic hazard model
Ulaanbaatar is the commercial and industrial center of Mongolia with a concentration of nearly half of the country's total population (about 3.2 million), according to the national statistics office of Mongolia (2018). The growth of the capital in the last two decades has been significant, the population in 1998 being lower than 0.7 million. In terms of seismic risk, the population is spread in buildings with various vulnerability qualities. The majority of structures in Ulaanbaatar are masonry (62 %) then steel structures (18 %), wooden structures and gers (also called yurts) (2 %). Masonry buildings (usually apartments) are considered seismically safe, but the first floor is generally modified without safety considerations to transform them to shops or restaurants, making the building weaker in terms of seismic resistance (Dorjpalam et al., 2004). The stakes and their location are also modified. In the city, new tall buildings have been erected. As the international airport in use since 1957 is too short and too close to the city, a new airport has been constructed 30 km to the south of Ulaanbaatar and has been in operation since mid-2021.
In this work, we identified and mapped the Sharkhai active fault that has to be included as an earthquake scenario affecting Ulaanbaatar and its region and be used in the seismotectonic model for seismic hazard assessment of the region of Ulaanbaatar and especially in the area of the new airport that will be a place of new construction. We suggest considering both scenarios, with the entire fault breaking in one event and the two segments breaking independently. Our results are the first estimates on this fault of magnitude of a large event (6.7 ± 0.2 and 7.1 ± 0.7) depending on the scenario considered, for their inter-event time (2496 ± 88 years), and an attempt for the estimation of the rate of deformation (between 0.2 ± 0.1 and 0.8 ± 0.6 mm yr−1). Although the uncertainties are still substantial, the estimates are consistent with the regional knowledge.
Our work contributes to the construction of the seismotectonic model, the first step of any seismic hazard assessment. But the model still faces several unknowns. This fault is a part of a larger system with several parallel structures, such as the Hustai and Avdar active faults. The question that arises is whether these faults break independently or in a short time sequence followed by a long period of quiescence. Other active faults in the area have been identified as Emeel, Gunj and Ulaanbaatar faults. Are there still other unknown active faults in this area? Are the deformation rates or inter-event time on all these faults consistent with GPS regional deformation that also need to be improved with longer measurements? Another challenge is to confirm, by complementary works, all the estimates recently published, including this work, of some of the active faults in the Ulaanbaatar region. Despite their uncertainties, all these works already strongly improve the knowledge of active faults in the region and the seismic hazard assessment, and they contribute to the seismic risk mitigation.
For a complete seismic hazard assessment, in addition to the seismotectonic model, propagation and sites effects (which amplify the ground motion during earthquakes) are also essential, especially for Ulaanbaatar, located at the Tuul River Valley on a sedimentary basin of alluvial deposits with a thickness up to 120 m (Odonbaatar, 2011; Tumurbaatar et al., 2019). To answer such questions, future complementary works in the area are still necessary, which may improve our ability to assess seismic hazard in the region.
Pleiades high-resolution (2 m Multispectral, 0.5 m Panchromatic) data were acquired by Pleiades satellites and broadcast by Astrium. High-resolution (12 m) topography was taken from DLR's TerraSAR-X/TanDEM-X satellite and Shuttle Radar Topography Mission 1 arcsec Global (https://doi.org/10.5066/F7PR7TFT, Earth Resources Observation and Science (EROS) Center, 2018), last accessed June 2019. Google Earth views were taken from http://www.google.com/earth, last access: July 2017. Radiocarbon dating was carried out in the Poznań Radiocarbon Laboratory-Poland, and the date of the sample acquisition is 16 July 2013.
The supplement related to this article is available online at: https://doi.org/10.5194/se-13-761-2022-supplement.
AAA, AS and MF carried out fieldwork, collected and prepared the data. All authors contributed to analyzing the data and writing the manuscript.
The contact author has declared that neither they nor their co-authors have any competing interests.
Publisher's note: Copernicus Publications remains neutral with regard to jurisdictional claims in published maps and institutional affiliations.
Access to Pleiades images was supported by CNES (Centre National d'Etudes Spatiales). TanDEM-X data were kindly provided by DLR (Deutsches Zentrum für Luft- und Raumfahrt) through the TanDEM-X Science program (project DEM_OTHER1719). The authors would like to thank the many colleagues and students from IAG for their help in the field. We thank Bayarsaikhan Enkhee of IAG for the GPS acquisition used for some 3D reconstructions. The authors thank Michel Granet for his support of this work, especially during the PhD work of Abeer Al-Ashkar. We are thankful to the reviewers Daniela Pantosti and Laurent Bollinger for their thoughtful, constructive and invaluable remarks which improved our paper.
This research has been supported by the EOST (Ecole et Observatoire des Sciences de la Terre) and IPGS (Institut de Physique de Globe de Strasbourg, now ITES – Institut Terre et Environnement de Strasbourg), University of Strasbourg-CNRS, and in Mongolia by IAG (Institute of Astronomy and Geophysics, Academy of Sciences of Mongolia).
This paper was edited by Federico Rossetti and reviewed by Daniela Pantosti and Laurent Bollinger.
Adiya, M.: Seismic activity near Ulaanbaatar: Implication for seismic hazard assessment, Ph.D. thesis, L'Institut Terre et Environnement de Strasbourg (previously: Institut de Physique du Globe de Strasbourg), France, 256 pp., https://hal.archives-ouvertes.fr/tel-01443798 (last access: 21 March 2022), 2016.
Al-Ashkar, A.: Tectonique active de la région d'Oulan Bator, Mongolie: Analyse morpho-tectonique et paléosismologique des failles actives de Sharkhai et Avdar, Ph.D. thesis, L'Institut Terre et Environnement de Strasbourg (previously : Institut de Physique du Globe de Strasbourg), France, 360 pp., https://tel.archives-ouvertes.fr/tel-01282438 (last access: 21 March 2022), 2015.
Bayasgalan, A.: Active tectonics of Mongolia, Ph.D. Thesis, Trinity College Cambridge, 180 pp., https://www.repository.cam.ac.uk/handle/1810/251670 (last access: 21 March 2022), 1999.
Bayasgalan, A., Jackson, J. A., Ritz, J. F., and Cartier, S.: Field examples of strike-slip fault terminations in Mongolia and their tectonic significance, Tectonics, 18, 394–411, 1999a.
Bayasgalan, A. and Jackson, J. A.: A re-assessment of the faulting in the 1967 Mogod earthquakes in Mongolia, Geophys. J. Int., 138, 784–800, 1999b.
Biasi, G. P. and Wesnousky, S. G.: Steps and gaps in ground ruptures: Empirical bounds on rupture propagation, Bull. Seismol. Soc. Am., 96, 1110–1124, 2016.
Biasi, G. P. and Wesnousky, S. G.: Bends and ends of surface ruptures, Bull. Seismol. Soc. Am., 107, 2543–2560, https://doi.org/10.1785/0120160292, 2017.
Calais, E., Vergnolle, M., San'kov, V., Lukhnev, A., Miroshnitchenko, A., Amarjargal, S., and Déverchère, J.: GPS measurements of crustal deformation in the Baikal-Mongolia area (1994–2002): Implications for current kinematics of Asia, J. Geophys. Res., 108, 2501, https://doi.org/10.1029/2002JB002373, 2003.
Carpenter, N. S., Payne, S. J., and Schafer, A. L.: Toward reconciling magnitude discrepancies estimated from paleoearthquake data, Seismol. Res. Lett., 83, 555–565, 2012.
Crone, A. J. and Haler, K. M.: Segmentation and the co-seismic behavior of Basin and Range normal faults: examples from east-central Idaho and southwestern Montana USA, J. Struct. Geol., 13, 151–164, 1991.
Cunningham, W. D.: Cenozoic normal faulting and regional doming in the southern Hangay region, Central Mongolia: implications for the origin of the Baikal rift province, Tectonophysics, 331, 389–411, 2001.
Cunningham, W. D.: Structural and topographic characteristics of restraining-bend mountain ranges of Altai, Gobi Altai and easternmost Tien Shan, in: Tectonics of strike-slip restraining and releasing bends, edited by: Cunningham, W. D. and Mann, P., Geol. Soc., London, Special Publications, 219–237, 2007.
Cunningham, W. D., Windley, B. F., Dorjnamjaa, D., Badamgarov, G., and Saandar, M.: A structural transect across the Mongolian Altai: Active transpressional mountain building in central Asia, Tectonics, 15, 142–156, 1996.
Demberel, S., Batarsuren, G., Imaev, V. S., Strom, A. L., Smekalin, O. P., Chipizubov, A. V., Grib, N. N., Syasko, A. A., and Kachaev, A. V.: Paleoseismology deformations around ulan bator according to geological and geophysical data, Seism. Instr., 47, 314–320, https://doi.org/10.3103/S0747923911040025, 2011.
De Polo, C. M., Clark, D. G., Slemmons, D. B., and Rameli, A. R.: Historical surface faulting in the Basin and Range province, western North America-implication for fault segmentation, J. Struct. Geol., 13, 123–136, 1991.
Dorjpalam, S., Kawase, H., and Ho, N.: Earthquake Disaster Simulation for Ulaanbaatar, Mongolia Based on The Field Survey and Numerical Modeling of Masonry Buildings, 13th World Conference on Earthquake Engineering Vancouver, B.C., Canada, No. 461, 15 pp., https://www.iitk.ac.in/nicee/wcee/article/13_461.pdf (last access: 21 March 2022), 2004.
Dugarmaa, T. and Schlupp, A.: One century of seismicity in Mongolia map (1900–2000), in: Proc. MAS 4, No. 170, Research Centre of Astronomy and Geophysics of the Mongolian Academy of Sciences, Mongolia, and Laboratoire de Télédétection et Risque Sismique, France, 7–14, 2000.
Dujardin, J. R., Bano, M., Schlupp, A., Ferry, M., Ulziibat, M., Tsend-Ayush, N., and Enkhee, B.: GPR measurements to assess the Emeelt active fault's characteristics in a highly smooth topographic context, Mongolia, Geophys. J. Int., 198, 174–186, https://doi.org/10.1093/gji/ggu130, 2014.
Etchebes, M.: Paléosismologie spatiale: segmentation et scénarios de ruptures sismiques La faille de Fuyun et la faille du Kunlun, Chine, Ph.D. thesis, Institut de Physique du Globe de Paris (IPGP), France, 400 pp., https://www.theses.fr/2011PA077039 (last access: 21 March 2022), 2011.
Finzi, Y. and Langer, S.: Damage in stop-overs may enable large cascading earthquakes, Geophys. Res. Lett., 39, L16303, https://doi.org/10.1029/2012GL052436, 2012.
Feng, Z.-D., Zhai, X. W., Ma, Y. Z., Huang, C. Q., Wang, W. G., Zhang, H. C., Khosbayar, P., Narantsetseg, T., Liu, K.-B., and Rutter, N. W.: Eolian environmental changes in the Northern Mongolian Plateau during the past ∼ 35,000 year, Palaeogeogr. Palaeocl., 245, 505–517, https://doi.org/10.1016/j.palaeo.2006.09.009, 2007.
Ferry, M., Schlupp, A., Munkhuur, U., Munschy, M., Fleury, S., Baatarsuren G., Erdenezula, D., Munkhsaikhan, A., and Ankhtsetseg, D.: Tectonic Morphology of the Hustai Fault (Northern Mongolia), A Source of Seismic Hazard for the city of Ulaanbaatar, EGU General Assembly, Vienna, Austria, https://ui.adsabs.harvard.edu/abs/2010EGUGA..1211122F (last access: 21 March 2022), 2010.
Ferry, M., Schlupp, A., Munkhuur, U., Munschy, M., and Fleury, S.: Tectonic morphology of the Hustai Fault (Northern Mongolia), EGU General Assembly, Vienna, Austria, https://ui.adsabs.harvard.edu/abs/2012EGUGA..14.5803F/abstract (last access: 21 March 2022), 2012.
Fleury, S., Munschy, M., Schlupp, A., Ferry, M., Bano, M., and Munkhuu, U.: High-resolution magnetic survey to study Hustai Fault (northern Mongolia), AGU Fall Meeting, San Francisco, California, USA, https://ui.adsabs.harvard.edu/abs/2011AGUFMNS11B..02F/abstract (last access: 21 March 2022), 2011.
Harris, R. A., Archuleta, R. J., and Day, M.: Fault steps and the dynamic rupture process: 2-D digital simulations of a spontaneously propagating shear fracture, Geophys. J. Int., 18, 893–896, 1991.
Imaev, V. S., Smekalin, O. P., Strom, A. L., Chipizubov, A. V., and Syas'ko, A. A.: Seismic-hazard assessment for Ulaanbaatar (Mongolia) on the basis of seismogeological studies, Russ. Geol. Geophys., 53, 906–915, 2012.
Khilko, S. D., Kurushin, R. A., Kochetkov, V. M., Misharina, L. A., Melnikova, V. I., Gilyova, N. A., Lastochkin, S. V., Baljinnyam, I., and Monhoo, D.: Earthquakes and the base of the seismic zoning of Mongolia, The joint Soviet-Mongolian scientific – Research Geological Expedition, Nauka, Moscow, 41, 225 pp., 1985.
Klinger, Y.: Relation between continental strike-slip earthquake segmentation and thickness of the crust, J. Geophys. Res, 115, B07306, https://doi.org/10.1029/2009jb006550, 2010.
Leonard, M.: Self-consistent earthquake fault scaling relations: Update and extension to stable continental strike slip faults, Bull. Seismol. Soc. Am., 104, 2953–2965, 2014.
Lettis, W., Bachhuber, J., Witter, R., Brankman, C., Randolph, C. E., Barka, A., Page, W. D., and Kaya, A.: Influence of Releasing Step-Overs on Surface Fault Rupture and Fault Segmentation: Examples from the 17 August 1999 Izmit earthquake on the North Anatolian Fault, Turkey, Bull. Seismol. Soc. Am., 92, 19–42, 2002.
Majer, Z. and Teleki, K.: Monasteries and Temples of Bogdiin Khüree, Ikh Khüree or Urga, the Old Capital City of Mongolian in the First Part of the Twentieth Century, Ulaanbaatar, https://www.academia.edu/3131654 (last access: 21 March 2022), 2006
Manandhar, S., Hino, T., and Kitag, K.: Influences of Long-Term Tectonic and Geo-Climatic Effects on Geotechnical Problems of Soft Ground – Ulaanbaatar, Mongolia, Lowland Technology International, International Association of Lowland Technology (IALT), 18, 51–58, ISSN 1344-9656, 2016.
Miroshnichenko, A. I., Radziminovich, N.A., Lukhnev, A.V., Zuev, F.L., Demberel, S., Erdenezul, D., and Ulziibat, M.: First results of GPS measurements on the Ulaanbaatar geodynamic testing area, Russ. Geol. Geophys., 59, 1049–1059, 2018.
One century of seismicity in Mongolia map (1900–2000): Coordinators: Dugarmaa, T. and Schlupp, A., authors: Adiya, M., Ankhtsetseg, D., Baasanbat, T., Bayar, G., Bayarsaikhan, C., Erdenezul, D., Möngönsüren, D., Mönkhsaikhan, A., Mönkhöö, D., Narantsetseg, R., Odonbaatar, C., Selenge, L., Tsembel, B., Ölziibat, M., Urtnasan, K., and in collaboration with DASE and (RCAG), 2000.
Odonbaatar, C.: Site effects characterization in the basin of Ulaanbaatar, Ph.D. thesis, Université de Strasbourg, France, 184 pp., https://tel.archives-ouvertes.fr/tel-00785708 (last access: 21 March 2022), 2011.
Parfeevets, A. V. and Sankov, V. A.: Late Cenozoic tectonic stress fields of the Mongolian microplate Champs de contraintes tectoniques fini-cénozoïques dans la microplaque de Mongolie, Comptes Rendus Géoscience, 344, 227–238, 2012.
Poliakov, A. N. B., Dmowska, R., and Rice, J. R.: Dynamic shear rupture interactions with fault bends and off-axis secondary faulting, J. Geophys. Res., 107, 2295, https://doi.org/10.1029/2001JB000572, 2002.
Prentice, C. S., Kendrick, K. J., Berryman, K., Bayasgalan, A., Ritz, J. F., and Spencer, J. Q.: Prehistoric ruptures of the Gurvan Bulag fault, Gobi Altay, Mongolia, J. Geophys. Res., 107, 2321, https://doi.org/10.1029/2001JB000803, 2002.
Ramsey, B. C. and Lee, S.: Recent and Planned Developments of the Program OxCal, Radiocarbon, Vol. 55, Proceedings of the 21st International Radiocarbon Conference (Part 1 of 2), 9 to 13 July 2012, Paris, 720–730, https://doi.org/10.1017/S0033822200057878, 2013.
Reimer, P., Bard, E., Bayliss, A., Beck, J., Blackwell, P., Ramsey, C., Buck C., Cheng H., Edwards, R., Friedrich, M., Grootes, P., Guilderson, T., Haflidason, H., Hajdas, I., Hatté, C., Heaton, T., Hoffmann, D., Hogg, A., Hughen, K., Kaiser, K., Kromer, B., Manning, S., Niu, M., Reimer, R., Richards, D., Scott, E., Southon, J., Staff, R., Turney, C., and Van der Plicht, J.: IntCal13 and Marine13 Radiocarbon Age Calibration Curves 0–50,000 Years cal BP, Radiocarbon, 55, 1869–1887, https://doi.org/10.2458/azu_js_rc.55.16947, 2013.
Ritz, J.-F., Bourle's, D., Brown, E. T., Carretier, S., Chery, J., Enhtuvshin, B., Galsan, P., Finkel, R. C., Hanks, T. C., Kendrick, K. J., Philip, H., Raisbeck, G., Schlupp, A., Schwartz, D. P., and Yiou, F.: Late Pleistocene to Holocene slip rates for the Gurvan Bulag thrust fault (Gobi-Altay, Mongolia) estimated with 10Be dates, J. Geophys. Res., 108, 2162, https://doi.org/10.1029/2001JB000553, 2003.
Ritz, J. F., Braucher, R., Brouw, E. T., Carretier, S., and Bourlès, D. L.: Using in situ-produced 10Be to quantify active tectonics in the Gurvan Bogd mountain range (Gobi-Altay, Mongolia), Geological, 415, 87–110, 2006.
Rizza, M.: Analyses des vitesses et des déplacements co-sismiques sur des failles décrochantes en Mongolie et en Iran, Ph.D. thesis, université Montpellier II, France, 408 pp., https://tel.archives-ouvertes.fr/tel-00591794 (last access: 21 March 2022), 2010.
Rizza, M., Ritz, J.-F., Braucher, R., Vassallo, R., Prentice, C., Mahan, S., McGill, S., Chauvet, A., Marco, S., Todbileg, M., Demberel, S., and Bourlès D.: Slip rate and slip magnitudes of past earthquakes along the Bogd left-lateral strike-slip fault (Mongolia), Geophys. J. Int., 186, 897–927, 2011.
Rizza, M., Ritz, J.-F., Prentice, C., Vassallo, R., Braucher, R., Larroque, C., Arzhannikova, A., Arzhannikov, S., Mahan, S., Massault, M., Michelot, J.-L., Todbileg, M., and ASTER Team: Earthquake Geology of the Bulnay Fault (Mongolia), Bull. Seis. Soc. Am., 105, 72–93, https://doi.org/10.1785/0120140119, 2015.
Schlupp, A.: Néotectonique de la Mongolie Occidentale analysée à partir de données de terrain, sismologiques et satellitaires, Ph.D. Thesis, Louis Pasteur university, Strasbourg, France, 256 pp., https://tel.archives-ouvertes.fr/tel-00155858 (last access: 21 March 2022), 1996.
Schlupp, A., Ferry M., Munkhuu, U., Munschy, M., Fleury, S., Adiya, M., Bano, M., and Baatarsuren, G.: The Emeelt active fault, revealed by the outbreak of micro seismicity, and its impact on the PSHA of Ulaanbaatar, capital of Mongolia, Part I: seismotectonic analysis, ESC General Assembly, Montpellier, France, Proceedings of the ESC 32nd General Assembly, Montpellier, 6–10 September 2010, France, 2010a.
Schlupp, A., Ferry, M., Munkhuu, U., Munschy, M., and Fleury, S.: Tectonic Morphology of the Hustai Fault (Northern Mongolia): Implications for Regional Geodynamics, AGU Fall Meeting, San Francisco, USA, https://ui.adsabs.harvard.edu/abs/2010AGUFM.T23D..08S (last access: 21 March 2022), 2010b.
Schlupp, A., Ferry, M., Ulziibat, M., Baatarsuren, G., Munkhsaikhan, A., Bano, M., Dujardin, J-M., Nyambayar, Ts., Sarantsetseg, L., Munschy, M., Fleury, S., Mungunshagai, M., Tserendug, Sh., Nasan-Ochi, T., Erdenezul, D., Bayarsaikhan, E., batsaikhan, T., and Demberel, S.: Investigation of active faults near Ulaanbaatar, Implication for seismic hazard assessment, ASC General Assembly of Asian Seismological Commission, Ulaanbaatar, Mongolia, in: Proceedings of ASC General Assembly of Asian Seismological Commission, 17–20 September 2012, 2012.
Suzuki, Y., Nakata, T., Watanabe, M., Battulga, S., Enkhtaivan, D., Demberel, S., Odonbaatar, C., Bayasgalan, A., and Badral, T.: Discovery of Ulaanbaatar Fault: A New Earthquake Threat to the Capital of Mongolia, Seismol. Res. Lett., 92, 437–447, https://doi.org/10.1785/0220200109, 2020.
Takeuchi, M., Tsukada, K., Suzuki, T., Nakane, Y., Sersmaa, G., Manchuk, N., Kondo, T., Matsuzawa, N., Bacht, N., Khishigsuren, S., Onon, G., Katsurada, Y., Hashimoto, M., Yamasaki, S., Matsumoto, A., Oyu-Erdene, B., Bulgantsetseg, M., Kundyz, S., Enkhchimeg, L., Ganzorig, R., Myagmarsuren, G., Jamiyandagva, O., and Molomjamts, M.: Stratigraphy and geological structure of the Palaeozoic system around Ulaanbaatar, Mongolia, Bulletin of the Nagoya University Museum, 28, 1–18, 2013.
Tomurtogoo, O., Byamba, J., Badarch, G., Minjin, Ch., Orolmaa, D., Khosbayar, P., and Chuluun, D.: Geologic map of Mongolia, Scale 1:1 000 000, Mineral Resources Authority of Mongolia, Ulaanbaatar, 1998.
Tumurbaatar, Z., Miura, H., and Tsamba, T.: Site Effect Assessment in Ulaanbaatar, Mongolia through Inversion Analysis of Microtremor H/V Spectral Ratios, Geosciences, 9, 228, https://doi.org/10.3390/geosciences9050228, 2019.
Walker, R. T., Molor, E., Fox, M., and Bayasgalan, A.: Active tectonics of an apparently aseismic region: distributed active strike-slip faulting in the Hangay Mountains of central Mongolia, Geophys. J. Int., 174, 1121–1137, 2008.
Wells, D. L. and Coppersmith, K. J.: New Empirical Relationships among Magnitude, Rupture Length, Rupture Width, Rupture Area, and Surface Displacement, Bull. Seismol. Soc. Am., 84, 974–1002, 1994.
Wesnousky, S. G.: Predicting the endpoints of earthquake ruptures, Nature, 444, 358–360, https://doi.org/10.1038/nature05275, 2006.
Wesnousky, S. G.: Displacement and geometrical characteristics of earthquake surface ruptures: Issues and implications for seismic-hazard analysis and the process of earthquake rupture, Bull. Seismol. Soc. Am., 98, 1600–1632, 2008.