the Creative Commons Attribution 4.0 License.
the Creative Commons Attribution 4.0 License.
 | 07 Mar 2023
Development of multi-field rock resistivity test system for THMC
Jianwei Ren
Lei Song
Qirui Wang
Haipeng Li
Junqi Fan
Jianhua Yue
Honglei Shen
To study the relationship between rock mechanical properties and resistivity under deep-underground environmental conditions, a rock resistivity test system, which can realize the simultaneous control of temperature, pressure, seepage, and the chemical environment, was developed; further, a corresponding specimen-sealing method was explored. The system primarily comprises a triaxial system, chemical permeation system, temperature control system, and test control system. The reliability of the system was verified through tests and preliminary experiments. The resistivity of fractured granite specimens under coupling of seepage and temperature and the resistivity of unfrozen and freeze–thawed coals during triaxial compression were tested with this test system. The test results show that the temperature-induced resistivity change is greater at low seepage pressures for fractured granites, and the effect of seepage on rock resistivity is greater at lower temperatures. The resistivity change patterns of unfrozen and freeze–thawed coals during triaxial compression differ quite significantly. The resistivity of unfrozen coal specimens exhibits a decreasing trend in the initial compression stage and then gradually increases with rises in the deviatoric stress. After freezing and thawing, the electrical resistivity of coal decreases during the entire compression process.
- Article
(6429 KB) - Full-text XML
- BibTeX
- EndNote


There is a close relationship between a rock's mechanical properties and resistivity. Understanding the changes in rock mechanical properties by measuring the resistivity is of great value in the field of engineering (Yaramanci, 2000; Sun et al., 2015; Hao et al., 2022). Wang et al. (2012) obtained the regression equation between the resistivity and elastic modulus of rocks in various damage states through uniaxial compression tests. Yin and Xu (2021) established the relationship between the damage variables and resistivity of sandstone by cyclic uniaxial compression tests; Kahraman (2021) studied the relationship between tensile strength, compressive strength, and resistivity of volcanic clastic rocks through experimental statistics. The relationship between the mechanical properties of rocks and resistivity anisotropy during loading has also been studied (Chen et al., 2003; Jia et al., 2020). This research has provided a positive impetus to the implementation of resistivity for engineering rock monitoring.
As underground excavation is reaching greater depths, the environment of engineering rocks is becoming more complex. Deep-underground rocks are often subject to high temperatures, high ground pressures, high seepage pressures, and mineralized-water corrosion, and they even undergo freeze–thaw action in artificial freezing projects (such as liquid nitrogen fracturing and freezing-method plugging). These factors affect the mechanical properties and resistivity of the rock (Ye et al., 2015; Zhang et al., 2015; Ma et al., 2020; Gong et al., 2021; Tao et al., 2022; Singalreddy et al., 2022). Therefore, it is necessary to study the relationship between rock mechanical properties and resistivity under multi-field action. At present, a variety of devices are available for analysing rock mechanical properties in thermo–hydro–mechanical (THM) environments. Ranjith and Perera (2011) developed a high-temperature and high-pressure triaxial test system for CO2 storage research; Zhao et al. (2012) developed a high-temperature and high-pressure triaxial system where the confining pressure reached 250 MPa, the axial pressure reached 20 MN, and the temperature reached 600 ∘C. Huang et al. (2020) designed a thermo–hydro–mechanical coupled triaxial device compatible with X-ray CT, with a confining pressure, axial force, seepage pressure, and temperature of up to 20 MPa, 400 kN, 10 MPa, and 100 ∘C, respectively. Bai et al. (2021) designed a triaxial cell with a low-temperature loading function and a confining pressure up to 30 MPa, an axial force up to 500 kN, and a minimum temperature of −30 ∘C. The application of these devices has greatly promoted research on the mechanical properties of deep rocks, but they still do not have the functionality of testing rock resistivity under multi-field conditions.
To meet different research needs, researchers have developed a variety of triaxial devices with resistivity-testing functionality. Alemu et al. (2013) developed a resistivity test system based on the background of CO2 flooding that can control the confining pressure and seepage, which also has the function of real-time X-ray CT scanning. Bosch et al. (2016) used resistivity tomography (ERT) as a resistivity test method to test the rock resistivity under confining pressure, axial pressure, and seepage. However, these two devices do not have the functionality of temperature control. Zhong et al. (2010) designed a combined test system for rock wave velocity and resistivity that can control the confining pressure, temperature, and seepage based on a conventional rock triaxial instrument. However, the control mode and range of seepage pressures are not given in their paper, so it is impossible to ascertain whether it can simulate the requirements of deep environmental conditions. Falcon-Suarez et al. (2014) developed a high-temperature triaxial seepage system with resistivity test functionality considering the seepage of brine–CO2 in carbon storage – its maximum axial pressure is only 64 MPa, which cannot meet the triaxial-loading demand of dense rock. These devices are all based on high-temperature environments and use heating belts to control the temperature, yielding high heating efficiencies; however, they do not have the functions of rapid cooling and sub-zero temperature control.
This paper introduces a new multi-field rock resistivity test system that has the functions of rock triaxial tests and resistivity tests under the conditions of high and low temperature, high pressure, and high-salinity water seepage. Its temperature control range is −40 to 80 ∘C, and the maximum confining pressure, seepage pressure, and axial pressure are 30 MPa, 20 MPa, and 400 kN respectively. The device is suitable for studying the relationship between rock mechanical properties and resistivity in complex environments.
The thermo–hydro–mechanical–chemical (THMC) multi-field rock resistivity test system proposed herein is used to simulate a deep-underground thermal–hydrological–chemical environment and to obtain the resistivity of specimens during loading. This experimental system aims to solve the following issues: (1) the cooperative fine control of multi-physical quantities under high pressure. The axial pressure, confining pressure, and seepage pressure are required to reach high loading capacity (an axial pressure up to 400 kN, confining pressure up to 30 MPa, and seepage pressure up to 20 MPa) and to have a wide temperature regulation range (−40 to 80 ∘C). The aforementioned conditions need to be finely controlled and must remain stable for a long time (not less than 48 h). (2) The real-time acquisition of multi-source information. It is also necessary to obtain the change of the resistivity of the sample in addition to collecting the conventional information of axial pressure, confining pressure, pore pressure, axial deformation, and hoop deformation. (3) Anti-corrosion measures are required to ensure the durability of parts in contact with chemical solutions. Further, there should be enough insulation resistance between the resistivity test line and other parts to ensure the test accuracy.
The technical scheme shown in Fig. 1a is adopted in this paper to solve the aforementioned difficulties. The test system includes a triaxial system, chemical penetration system, temperature control system, and test control system.
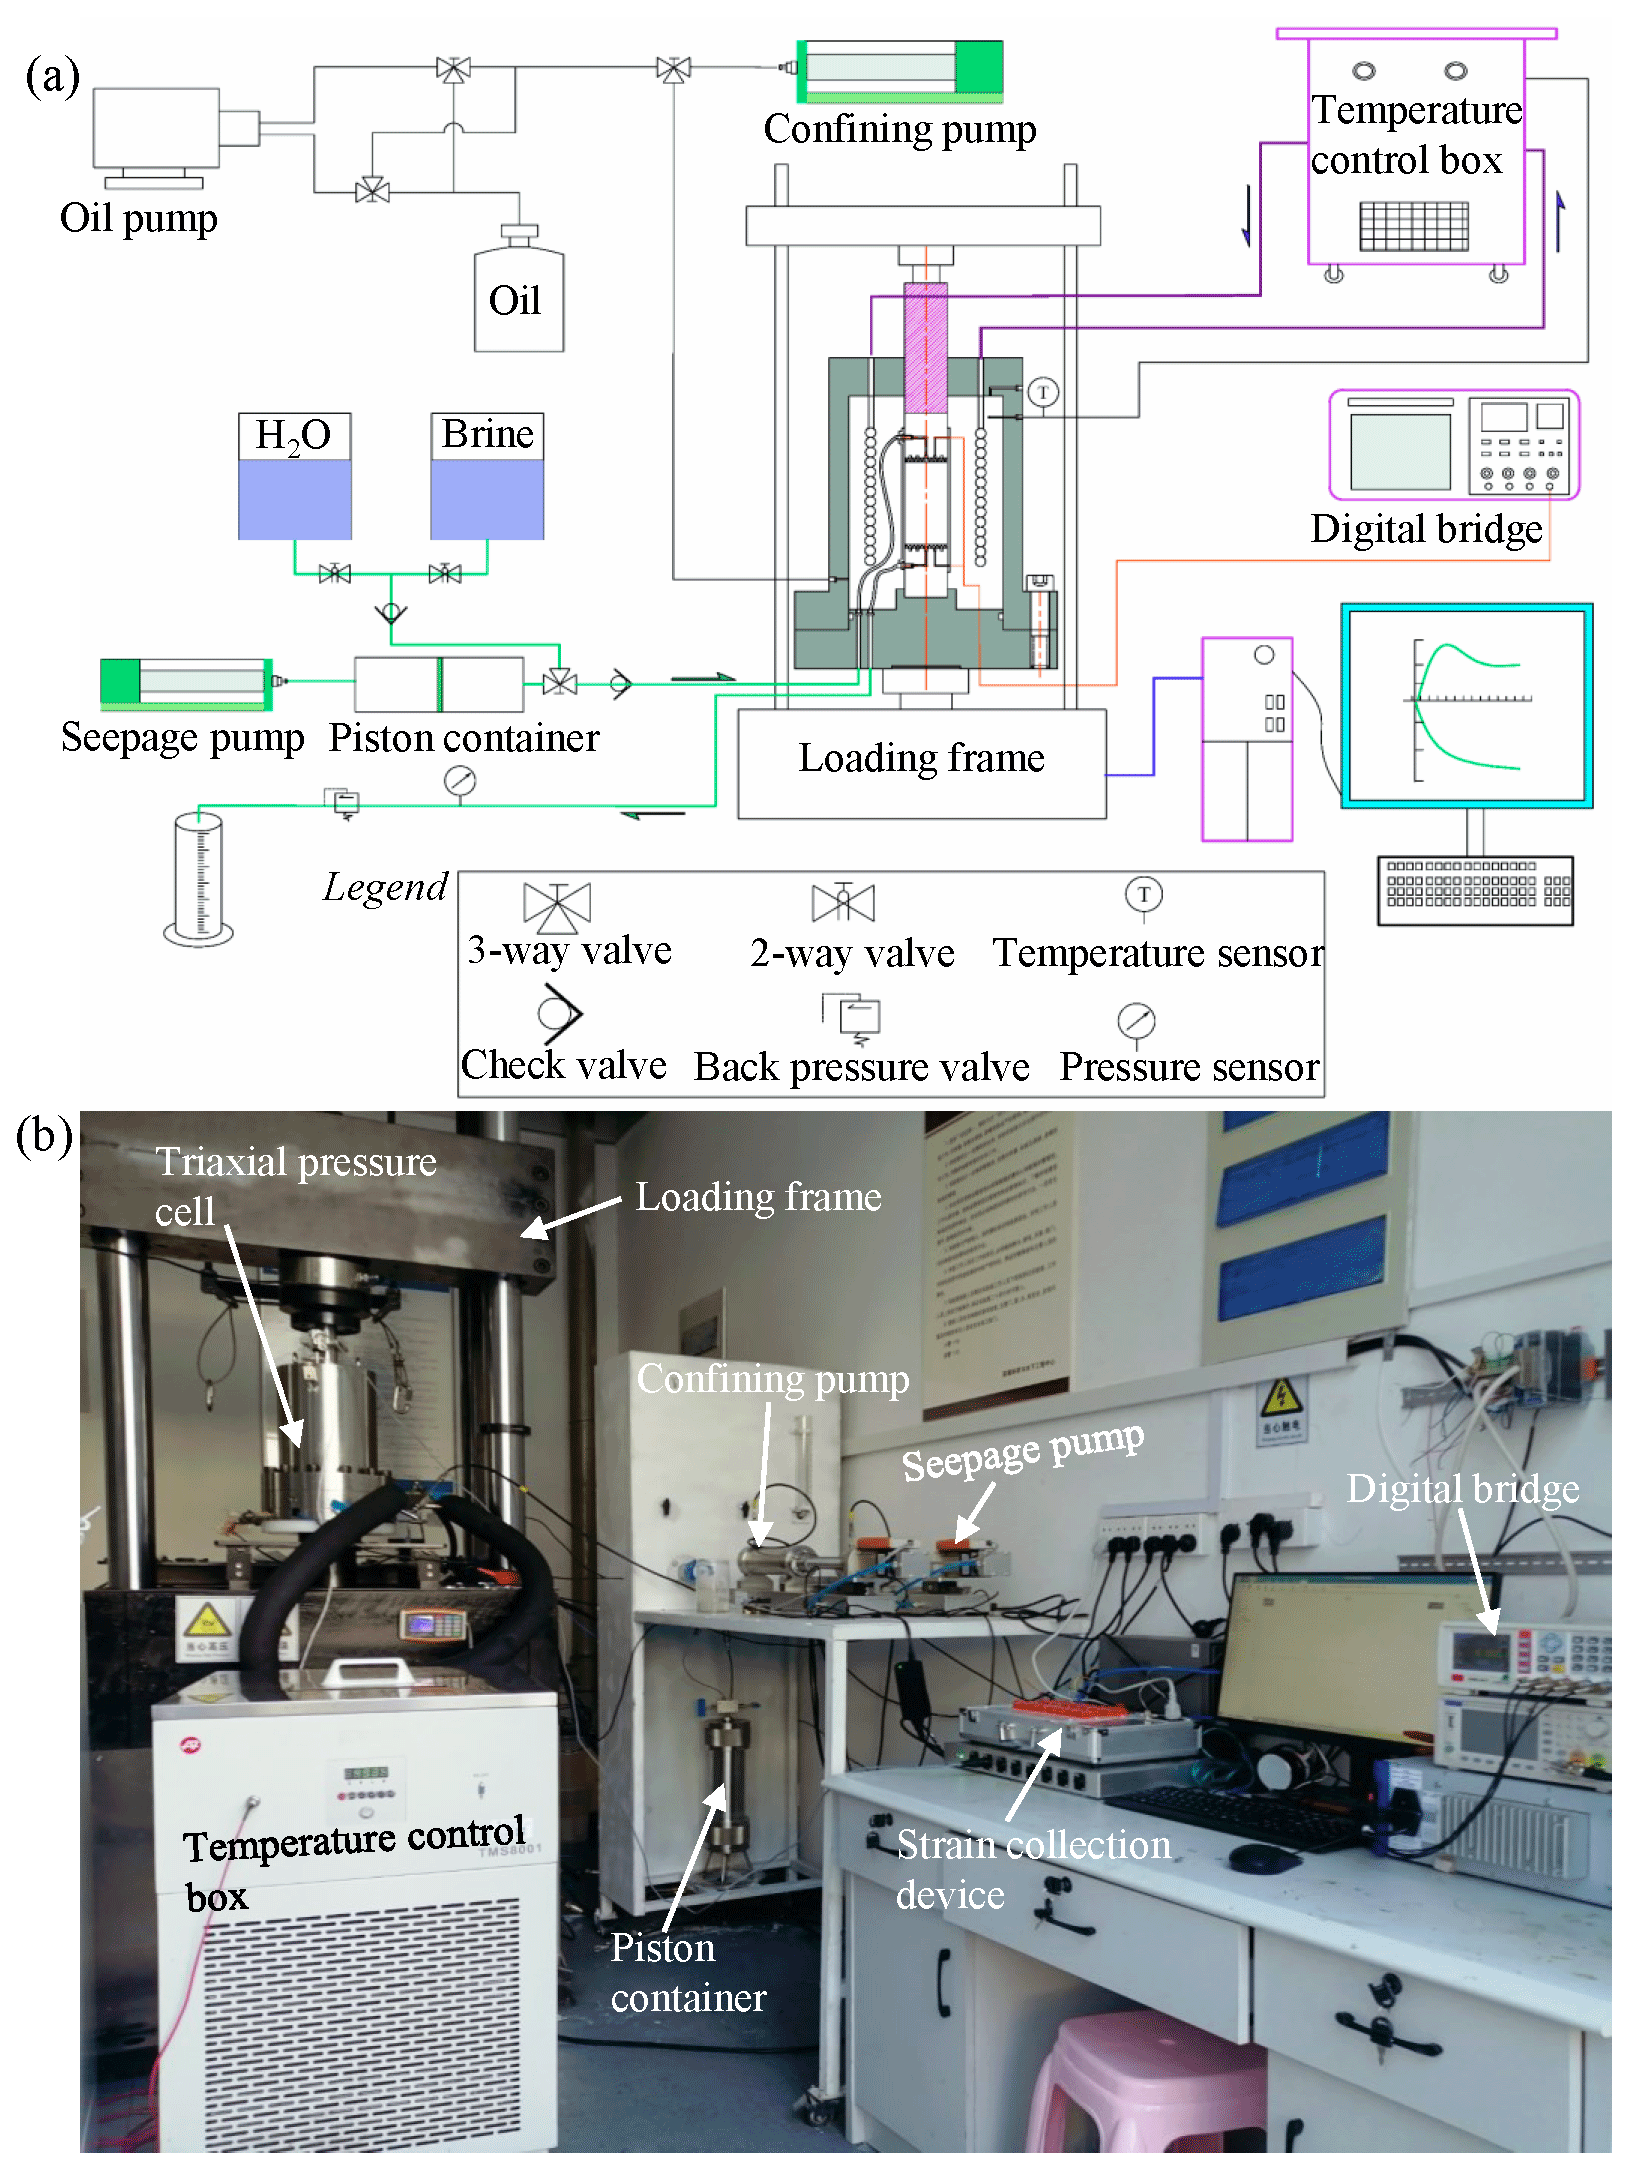
Figure 1THMC multi-field rock resistivity test system. (a) Schematic diagram. (b) Photo of the equipment.
2.1 Triaxial system
The triaxial system consists of a triaxial pressure cell, loading frame, confining-pressure pump, and oil-filling device.
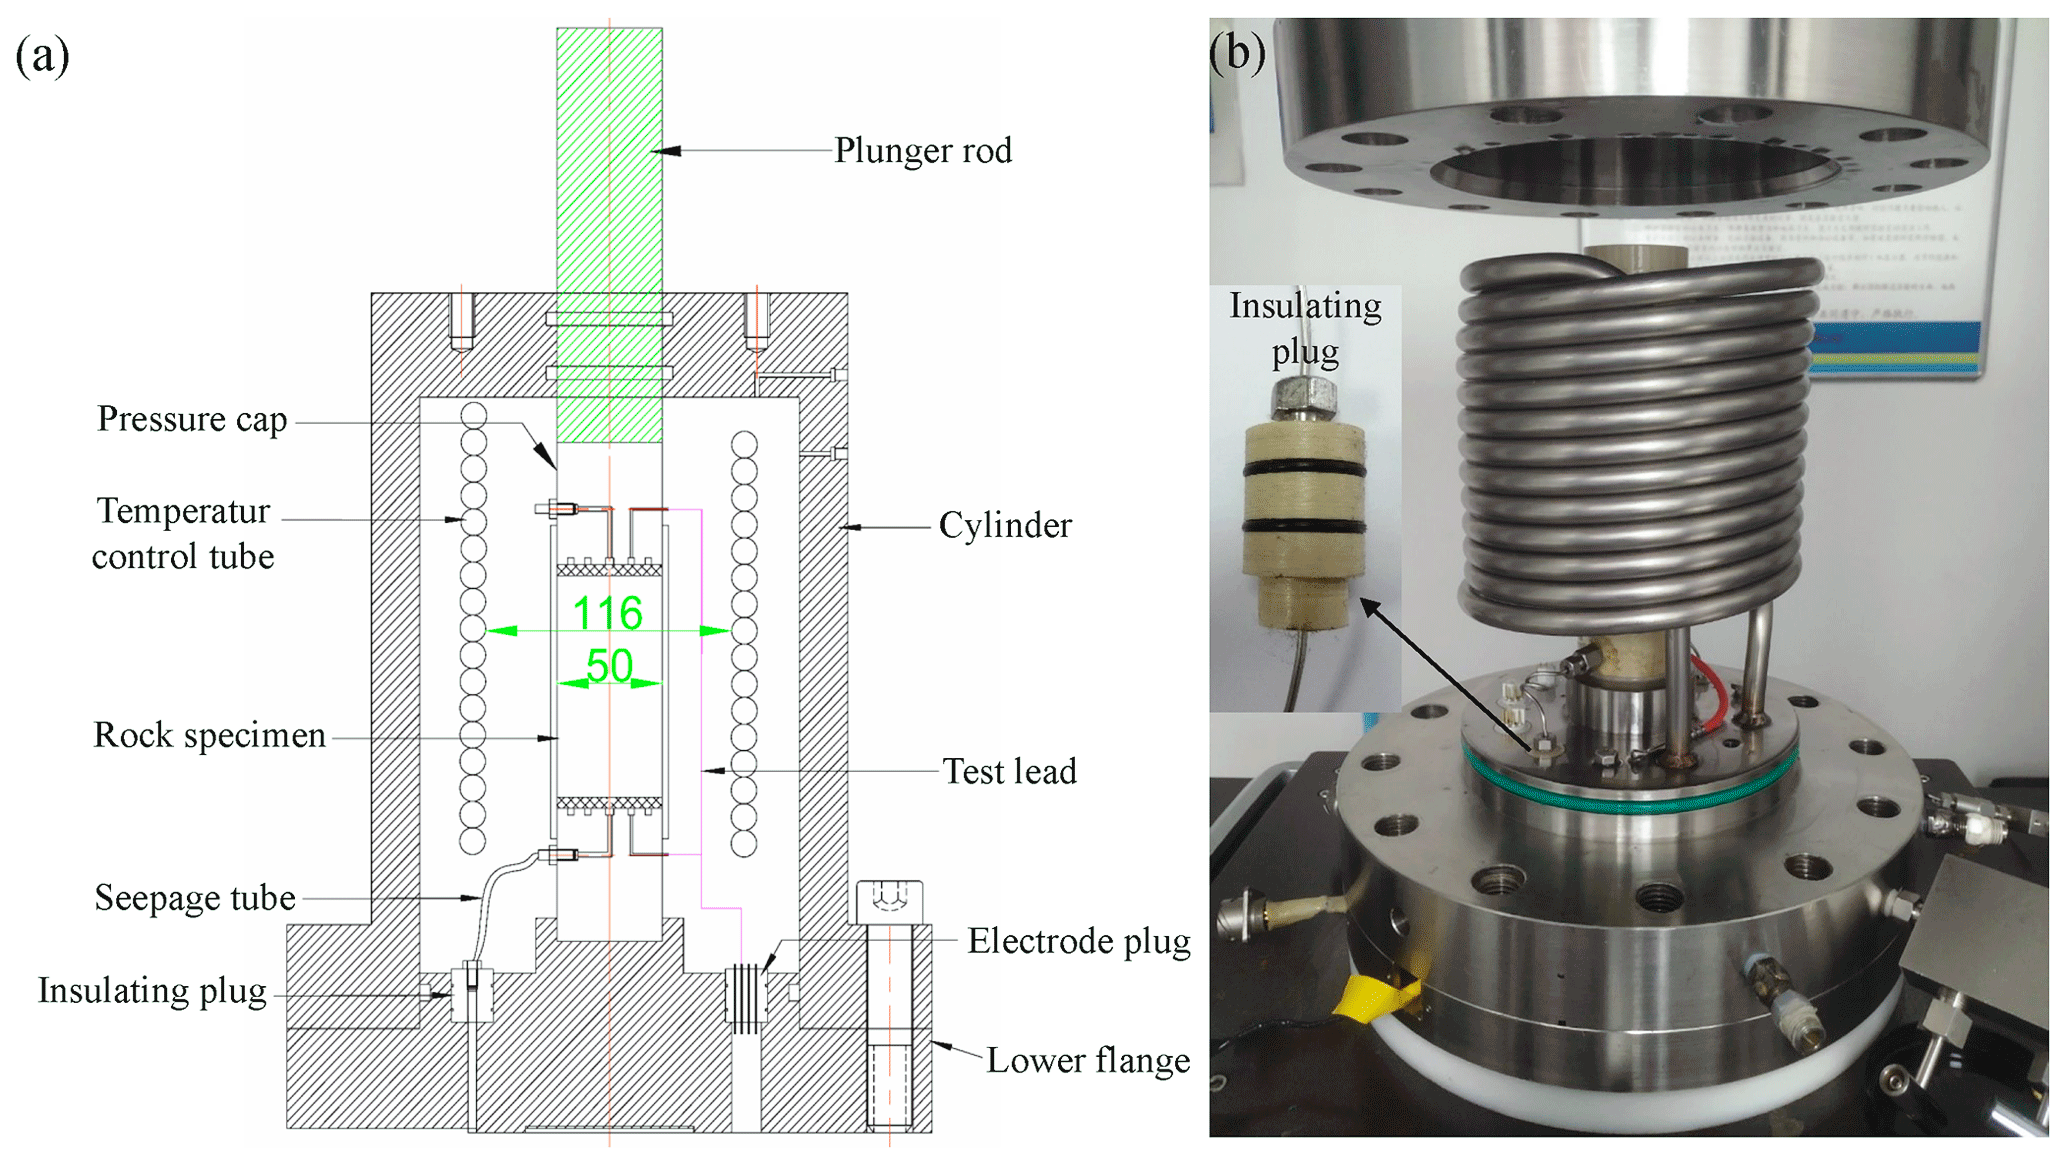
The triaxial pressure cell is the core component of the system; it must organically integrate the functions of temperature control, resistivity tests, and chemical penetration to simultaneously meet the requirements of stress loading, high- and low-temperature control, chemical solution seepage, and resistivity testing of the sample. The structure of the triaxial pressure cell is as shown in Fig. 2. The triaxial pressure cell mainly comprises a cylinder, base, plunger rod, upper pressure cap, lower pressure cap, temperature control tube, and seepage tube. The cylinder and the base are connected through flanges, which play the role of an overall enclosure and provide a reaction force, withstanding 400 kN axial pressure, 30 MPa confining pressure, and 100 ∘C temperature. Considering the existence of a chemical solution in the test, the cylinder and base are made of rust-resistant 304 stainless steel. The plunger rod is located in the centre of the top of the cylinder and transmits the axial pressure provided by the reaction frame to the sample. The upper pressure cap and the lower pressure cap have the same structure and are composed of cylindrical insulating spacers and electrode plates. The insulating cushion block is made of high-strength polyetheretherketone (PEEK) material, with a seepage channel and wire interface. There are small holes on the electrode plate for seepage. The temperature control tube is made of spiral-shaped 304 stainless steel piping, which controls the temperature of the specimen by circulating the hot and cold media inside. Considering the convenience of assembling and disassembling the sample, all pipeline and wire interfaces are arranged on the base. The permeation tube is made of stainless steel with a high pressure-bearing capacity. To avoid the short circuit of the test circuit caused by the contact between the seepage tube and the triaxial cell, a pair of PEEK material sealing plugs are set on the lower flange as the seepage tube channel. Non-conductive silicone oil was selected as the perimeter pressure-loading medium because the triaxial pressure cell has resistivity test leads.
The loading frame is used to provide axial loading for the three-axis system, with a 400 kN loading capacity and 100 mm loading range, and the speed control is from 0.00001 to 7.0 mm min−1. It can realize loading methods such as stress-controlled loading, strain-controlled variable loading, and stress path loading.
The confining pressure is controlled by the constant current stabilized pressure pump, which is pressurized by the piston driven by the stepper motor and adjusted by the feedback of the closed circuit. The volume change can be measured by calculating the number of steps of the stepping motor. Its pressure range is 0–32 MPa, with an accuracy of 0.3 MPa. The capacity and accuracy are 200 and 0.01 mL, respectively.
The volume of the triaxial pressure cells is about 6000 mL, while the volume of the confining pump is only 200 mL. The efficiency of oil injection into the triaxial pressure cell by the confining pump is too low; therefore, an individual oil-filling device is designed. It comprises an oil pump and pipes with valves; the oil pump is a one-way oil delivery device, which can realize the oil injection and drainage of triaxial pressure cells through valve adjustment. The filling device and confining-pressure pump are connected to the triaxial pressure cell through the three-way valve. After the triaxial pressure cell is assembled, the valve is adjusted to connect the oil-filling device with the triaxial pressure cell, allowing oil to be injected into the triaxial pressure cell through the oil-filling pump. When the triaxial pressure cell is full of oil, the valve is adjusted to connect the confining-pressure pump with the triaxial pressure cell, and confining pressure is applied to the specimen.
2.2 Chemical seepage system
The chemical seepage system is used to simulate a deep-underground chemical environment. It primarily includes a constant-current-stabilized pump, piston container, back-pressure valve, and liquid storage tank. The constant-flow-stabilized pressure pump is used to provide the required seepage pressure for the system, which has the same parameters as the confining-pressure loading pump. The piston container is located between the constant-current-stabilized pump and the liquid storage tank, which separates the chemical solution from the pump body to avoid the corrosion of the constant-current-stabilized pump by the chemical solution. The back-pressure valve is installed on the side of the water outlet hole of the rock sample to maintain the stability of the pore pressure.
The piston container is a hollow cylindrical container separated by a piston. When a liquid under pressure is introduced on one side, the pressure can be transferred to the liquid on the other side by pushing the piston. The piston container is made of 2205 stainless steel, which has a volume of 1000 mL and a pressure resistance of 40 MPa.
2.3 Temperature control system
The temperature control is regulated by the high- and low-temperature circulation box, which is connected to the temperature control tube in the triaxial pressure cell through the pipeline. Silicone oil is used as a circulating medium to take into account high- and low-temperature control. The high- and low-temperature circulation box includes a refrigeration system and a heating system that can work independently or in coordination. Further, it can be feedback adjusted according to the temperature in the triaxial pressure cell. The temperature adjustment range of the high- and low-temperature circulation box is −40 to 200 ∘C, with an accuracy of 0.5 ∘C. Through feedback adjustment, the temperature fluctuation of the triaxial pressure cell does not exceed 0.1 ∘C when the test target temperature is reached.
2.4 Acquisition control system
The acquisition control system includes strain acquisition and resistivity acquisition, and the loading rack and constant-current-stabilized pump can be controlled through software. The axial and radial strain of the specimen are measured by the temperature self-compensated foil strain gauge. Two strain gauges are pasted on the middle of the specimen side: one of the strain gauges is parallel to the axis of the specimen to measure the axial strain of the specimen, and the other is perpendicular to the axis of the specimen to measure the radial strain of the specimen. The axial and radial deformation of the specimen can be displayed in real-time through the acquisition software.
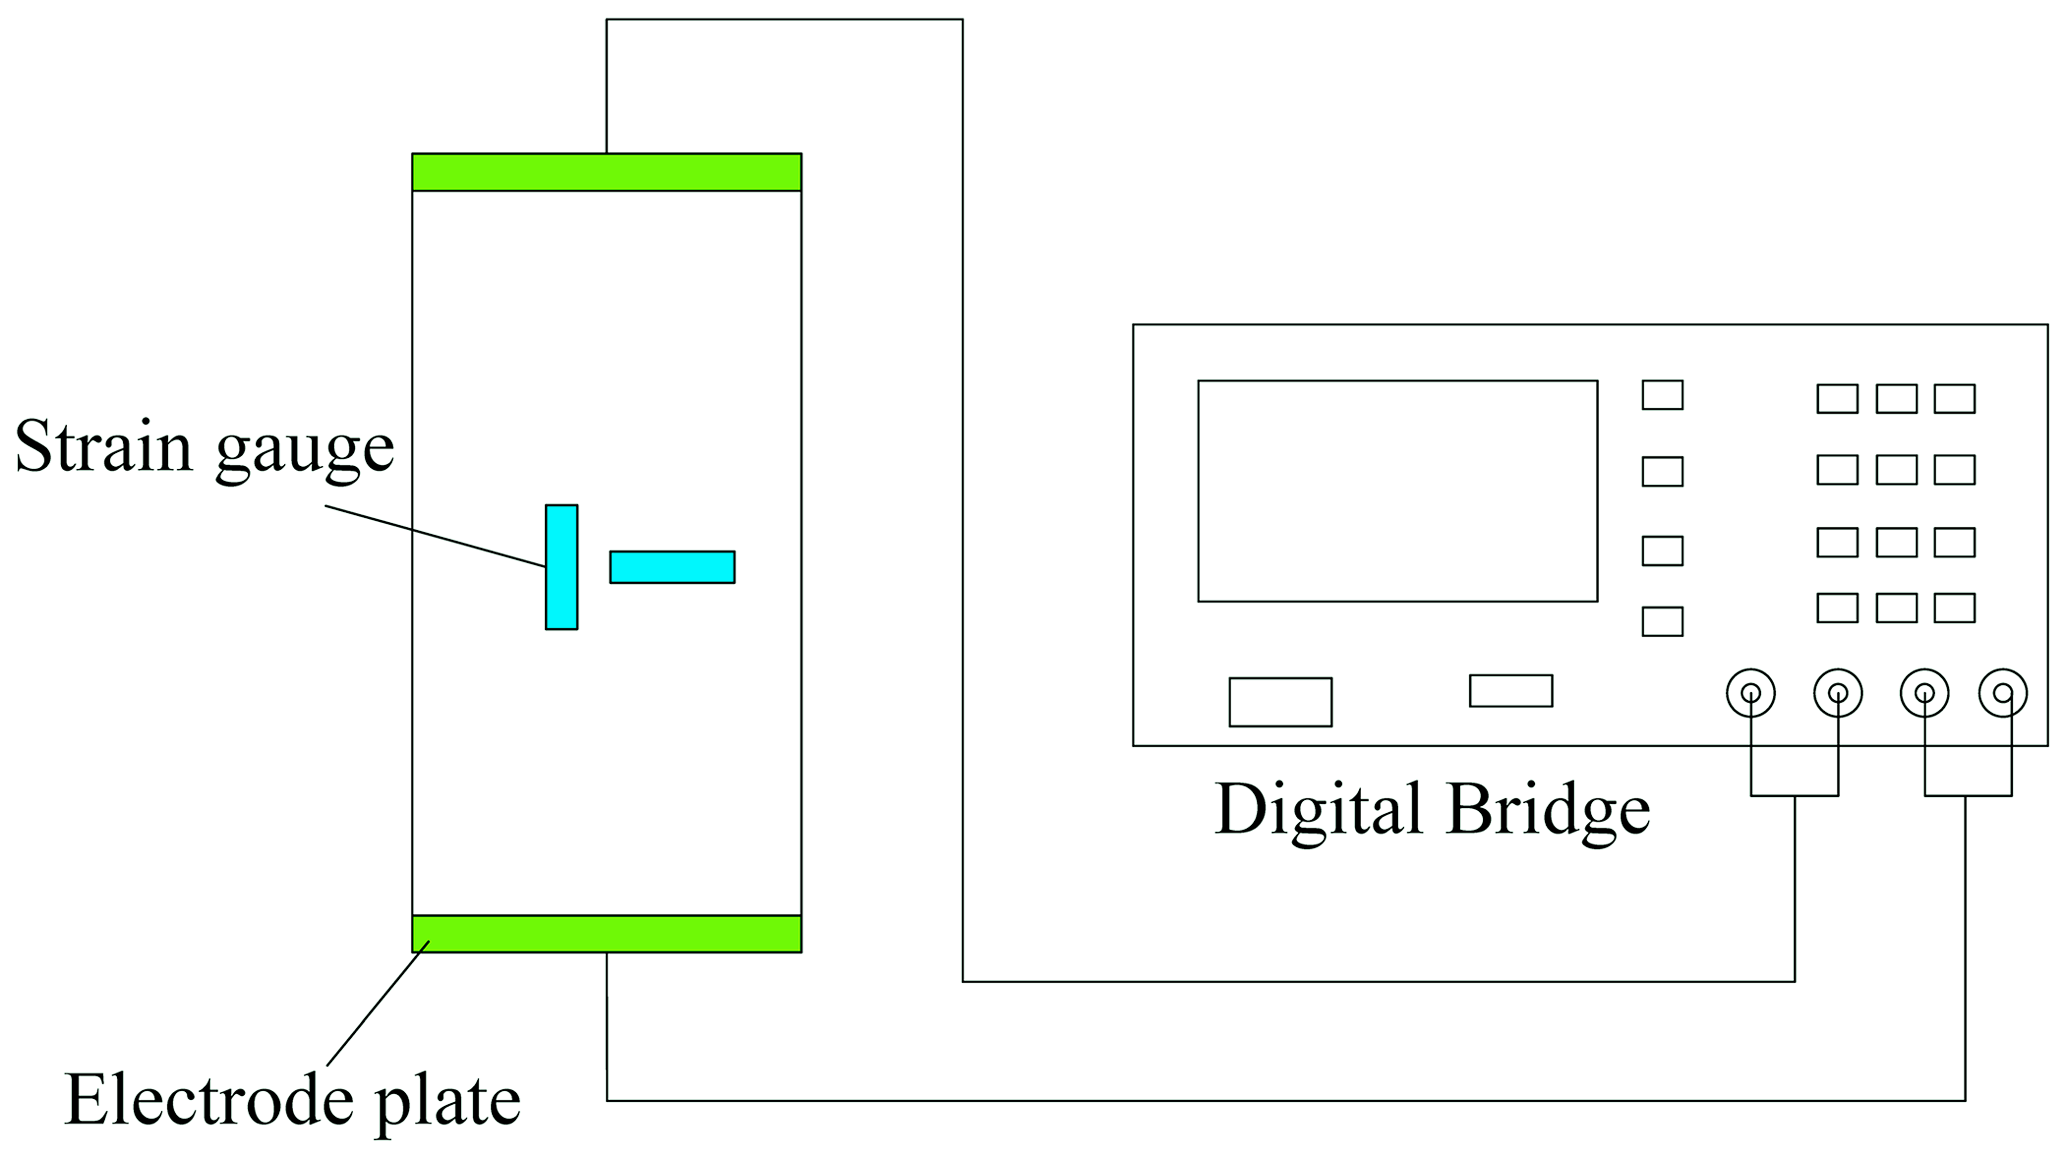
Resistivity measurements were performed following the two-phase electrode method shown in Fig. 3. The overall resistance of the rock specimen is measured by a digital bridge, and the average resistivity of the rock specimen between the two electrodes is calculated according to Eq. (1) (Song et al., 2022; Ran et al., 2022):
where ρ0 is the average resistivity of the specimen, Ω m; R is the resistance value of the test piece, Ω; S is the cross-sectional area of the test piece, m2; and L is the length of the test piece between the two electrodes, m. To prevent the electrode from being polarized during the test, the electrode is made of a thin copper plate, and the test frequency is set to 100 Hz according to a method proposed by Zhong et al. (2010).
When conducting rock resistivity measurements under triaxial conditions, a flexible protective film (heat-shrinkable film or latex film) is often coated on the surface of the specimen to prevent the immersion into the confining fluid from affecting the mechanical properties and resistance tests of the specimen. However, the surface of the specimen is not completely smooth, and the protective film may not fit the sample tightly. When the specimen is saturated or supplied with pore water, a water film will be formed on the specimen surface, causing the current path to change. At this time, the measured resistance is the specimen resistance and the water film resistance in parallel, which may lead to errors in resistivity measurement. To evaluate the influence of the water film on the resistivity measurement, the resistivity of specimens with different water film thicknesses was measured.
3.1 Water film impact test
The test steps were as follows: first, the specimen was dried and weighed, and then the specimen was saturated with 20 g L−1 of sodium sulfate solution and weighed again. The excess water on the surface of the saturated specimen was wiped off before weighing. Finally, the specimen was coated with conductive paste at both ends and connected to the test electrode and placed on the electronic balance to test the weight and resistance of the rock at different evaporation times. The test system is shown in Fig. 4. The specimen used was limestone with a porosity of 0.66 %, and the ambient temperature of the test was 26.8 ∘C, and the humidity was 44.1 %. Figure 5 shows the experimental results.
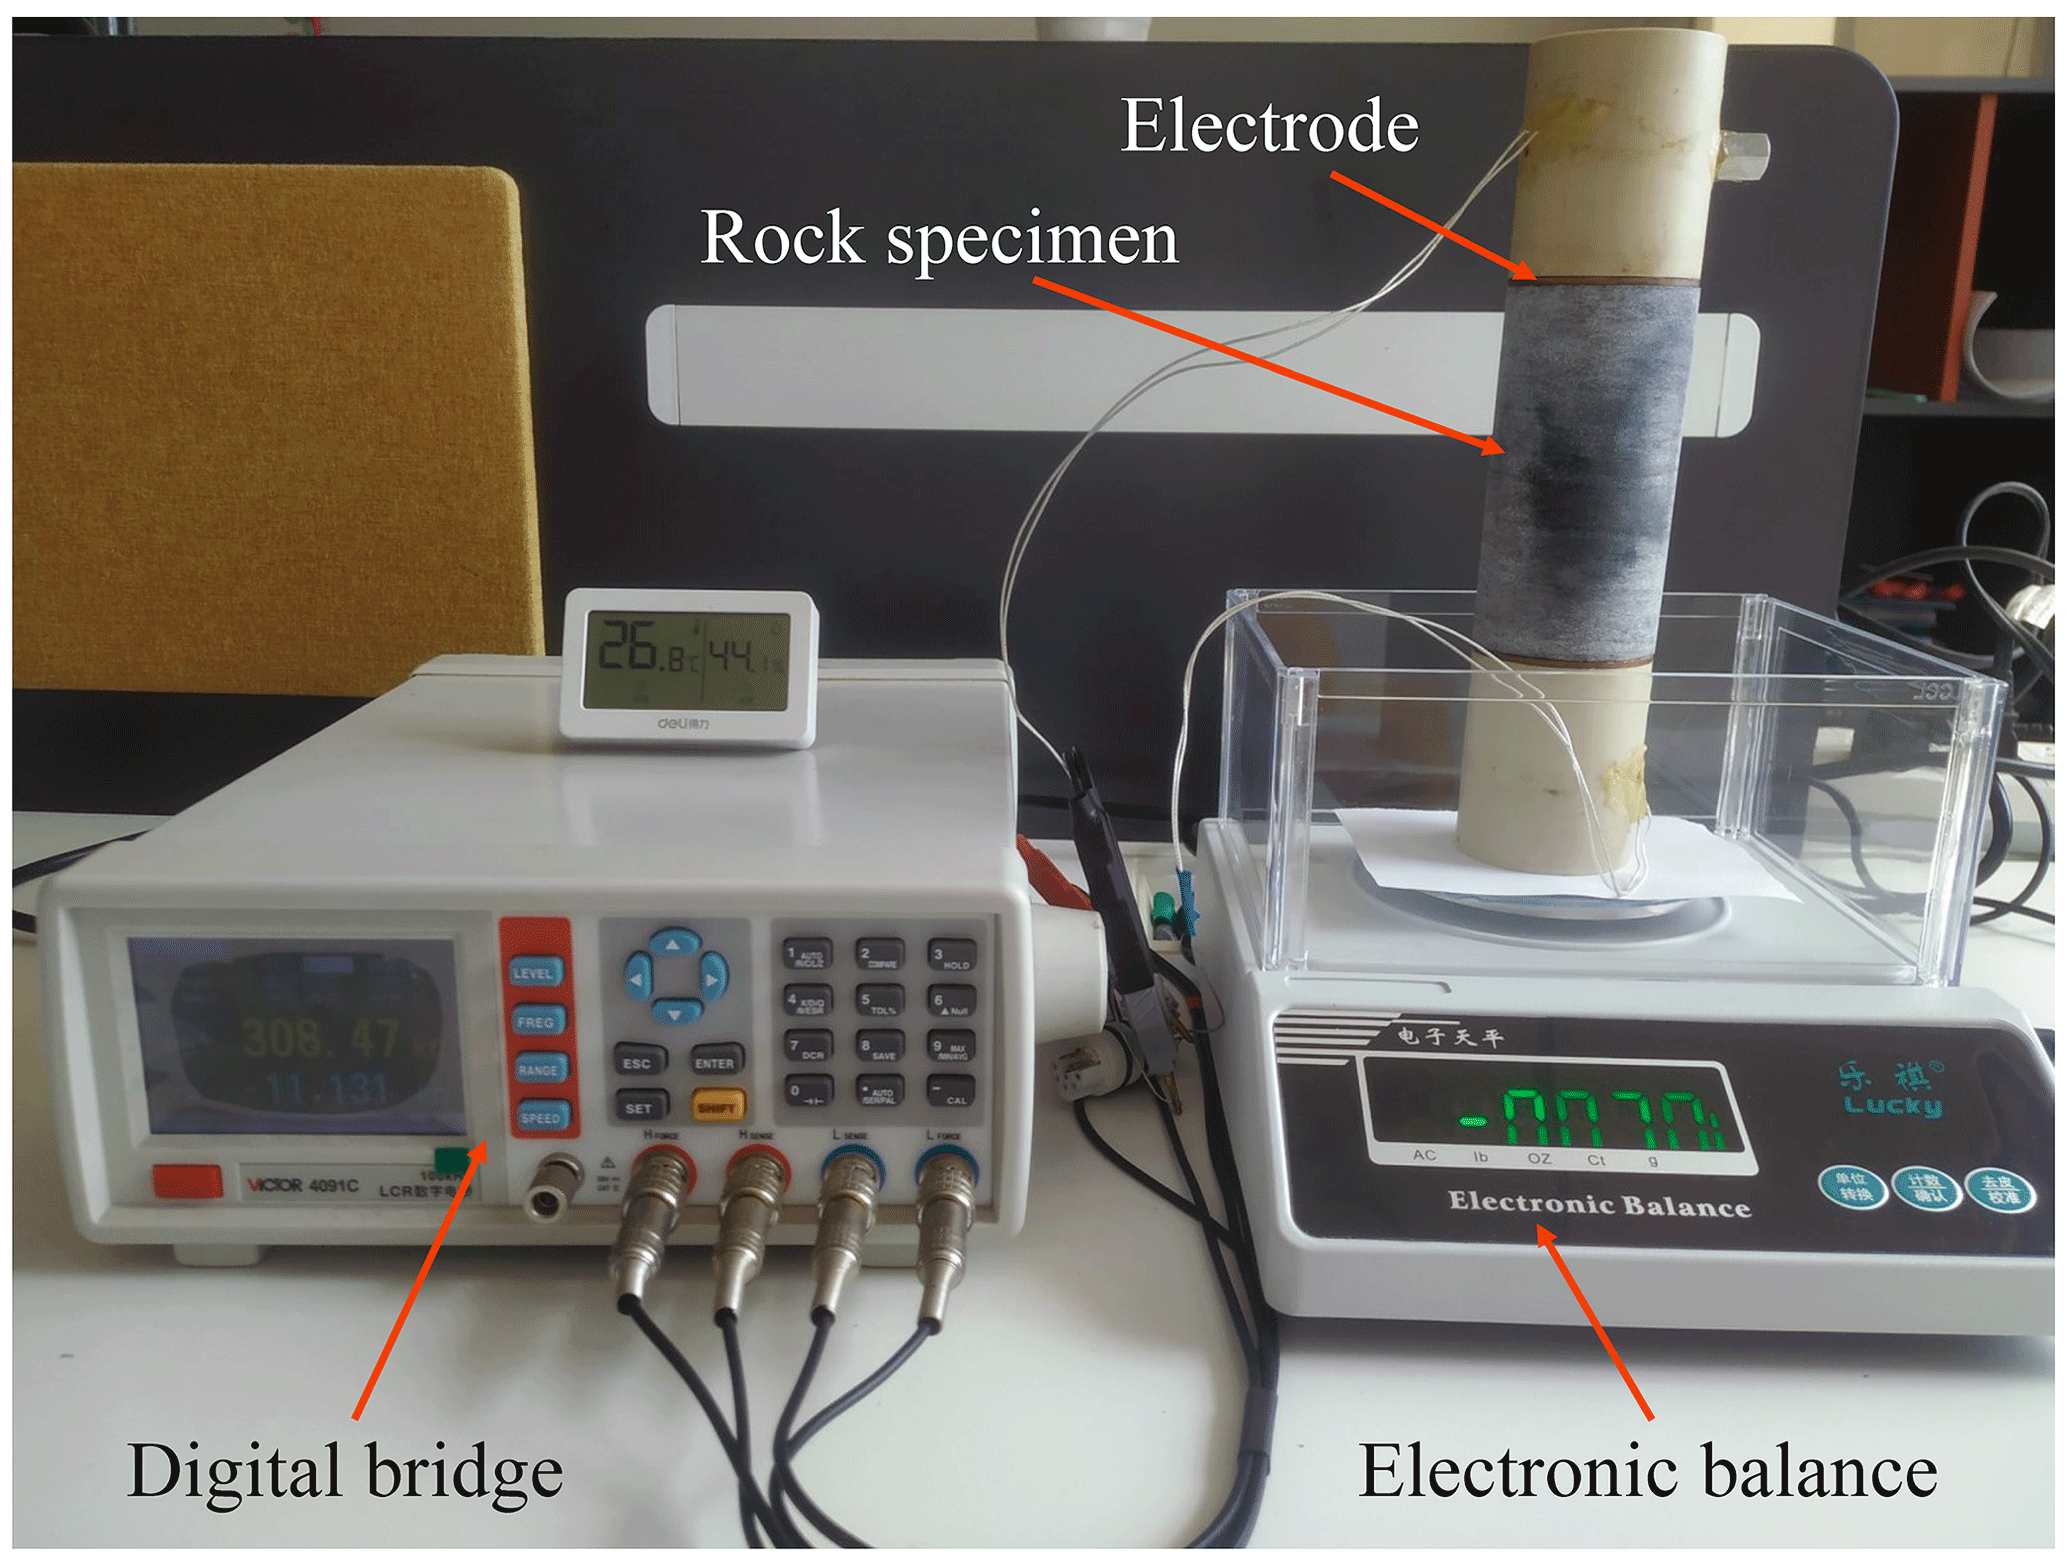
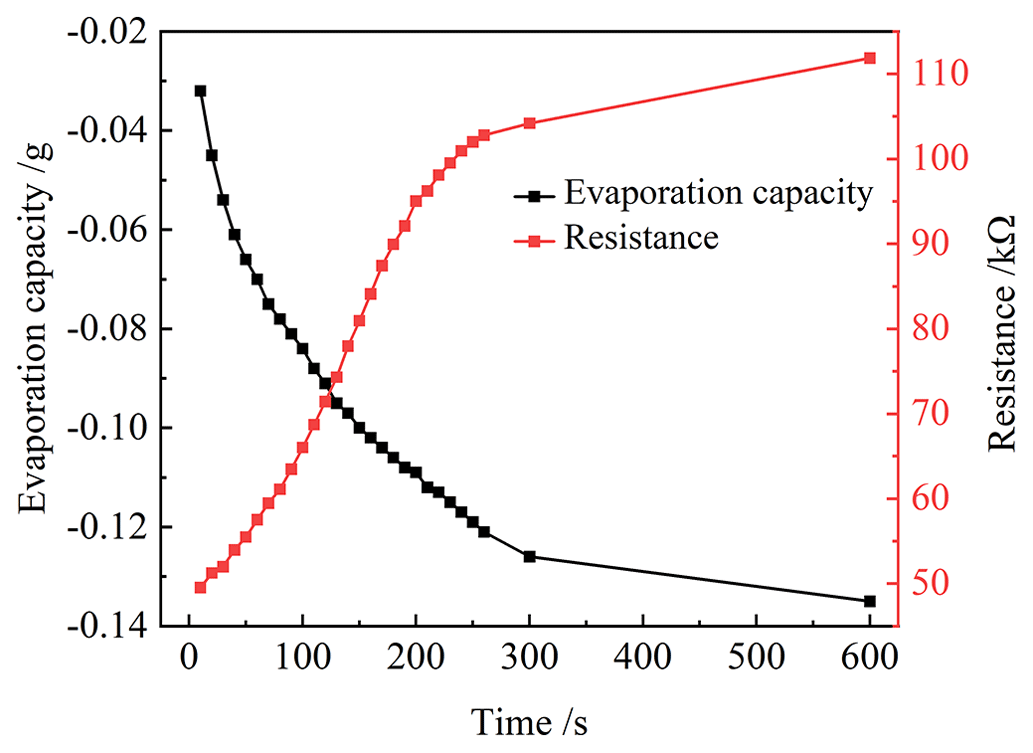
It can be seen from Fig. 5 that the rock weight gradually decreases with time; the rate of this decrease gradually decreases. The rock resistance gradually increases, and the rate of increase exhibits a trend of first increasing and then decreasing. This is mainly due to the large area and good connectivity of the water film on the surface of the specimen in the initial stages, which leads to a good current conduction capacity; with the evaporation of water and water film area contraction, the current conduction path changes sharply such that the specimen resistance changes more; finally, the water film is distributed in isolation, and the influence of the surface water film change on current conduction is reduced. Due to the short evaporation time, it can be considered that the reduced weight of the specimen within 5 min comes from the moisture on the surface of the specimen. Within 5 min, the weight of the specimen decreased by 0.12 g, the resistance doubled, and the mass of water remaining in the specimen was 0.40 g. It can be seen that, although the surface water film accounted for a small proportion of the total, it plays a comparable role with the conductivity of the water inside the specimen; therefore, measures need to be taken to avoid the formation of a water film on the side of the specimen.
3.2 Specimen-sealing method
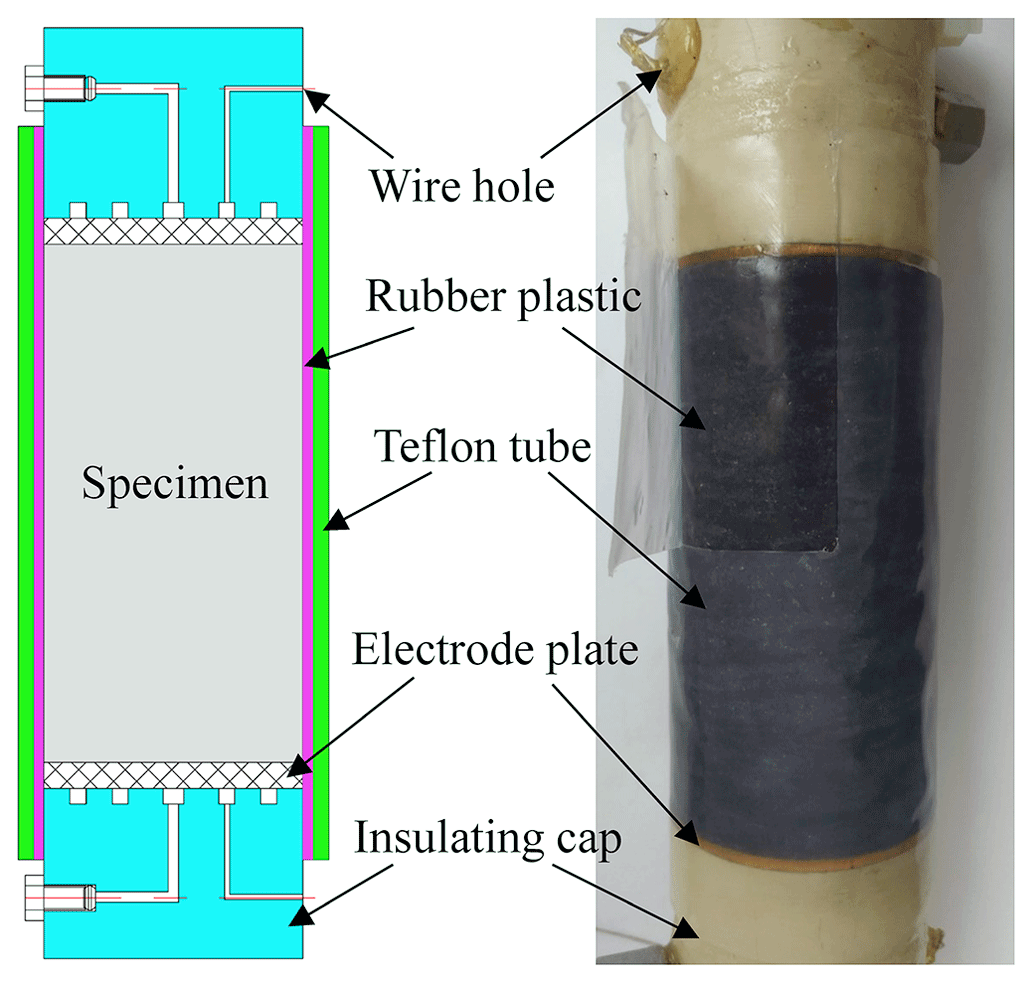
To prevent the water film on the side of the specimen from affecting the resistivity measurement, a new specimen-sealing method is proposed. The specific steps are as follows: (1) dry the sample at 105–110 ∘C; (2) apply a layer of liquid rubber plastic to the side surface of the sample at a thickness of 1–2 mm; (3) when the rubber plastic is about to solidify, cover the Teflon heat-shrinkable tube outside the upper and lower cap and the specimen, and heat it with a hot air gun to make the heat-shrinkable tube fully fit the specimen surface; (4) keep it for 24 h to ensure that the rubber plastic adhesive is completely cured, and then saturate the sealed specimen. The sealed specimen is shown in Fig. 6.
4.1 Sealability test
To test the effect of the new sealing method of the test piece, a comparison was conducted against two other sealing methods (heat-shrink film sealing and latex film sealing). The resistivities of the specimens sealed by the three methods were measured under different confining-pressure conditions. Before the test, specimens were saturated with 20 g L−1 Na2SO4 solution. The results are shown in Fig. 7. It can be seen that the resistivity of the specimen sealed by the new method increases linearly with the confining pressure, and the resistivity of the specimen sealed by the other two methods first increases rapidly and then slowly with the confining pressure and finally tends to be consistent with the resistivity of the specimen sealed by the new method. The resistivity of the samples sealed by different methods varies greatly under low confining pressures, which may be caused by the water film on the side of the sample. Therefore, the initial resistivities of saturated specimens sealed by different methods were compared with the resistivity of the evaporated specimen. It was found that the initial resistivity of the specimen sealed by the new method was close to that of the specimen after 10 min of evaporation, while the initial resistivities measured by the other two sealing methods were lower than the initial resistivity of the evaporated specimen. This indicates that the new specimen-sealing method can play a role in preventing the formation of a water film on the side of the specimen, which is more significant when the confining pressure is low.
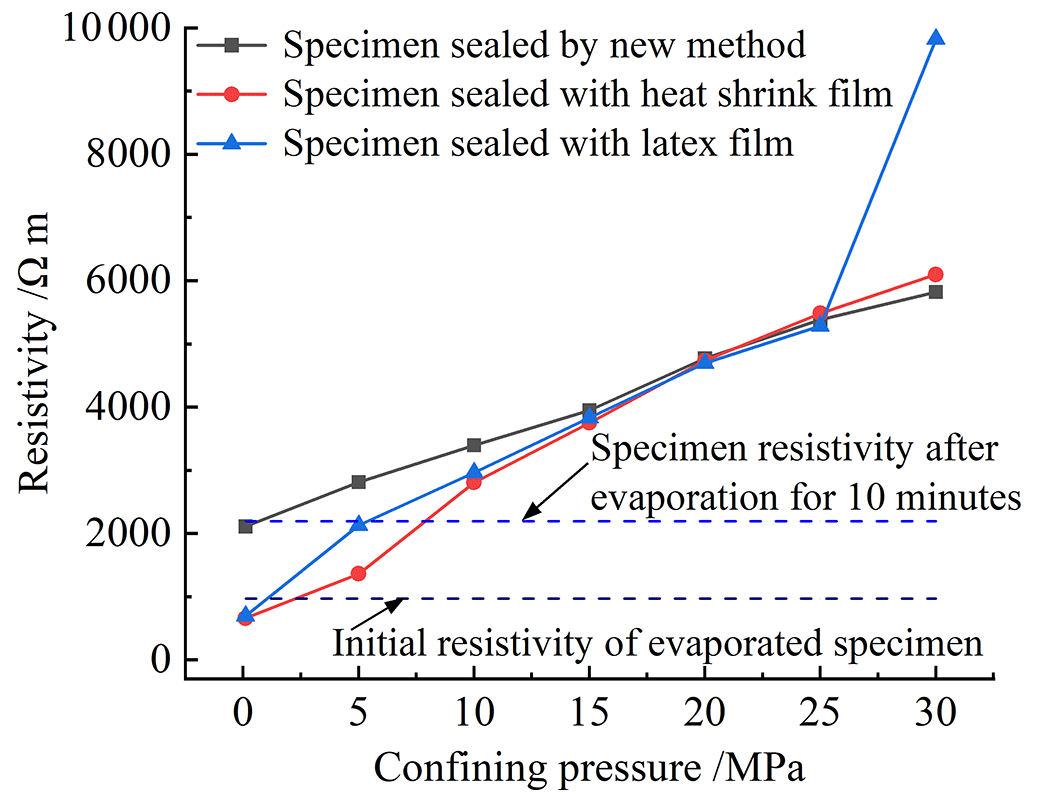
Figure 7Changes in the resistivity of sealed specimens by different methods under confining pressure.
4.2 Resistance measurement accuracy test
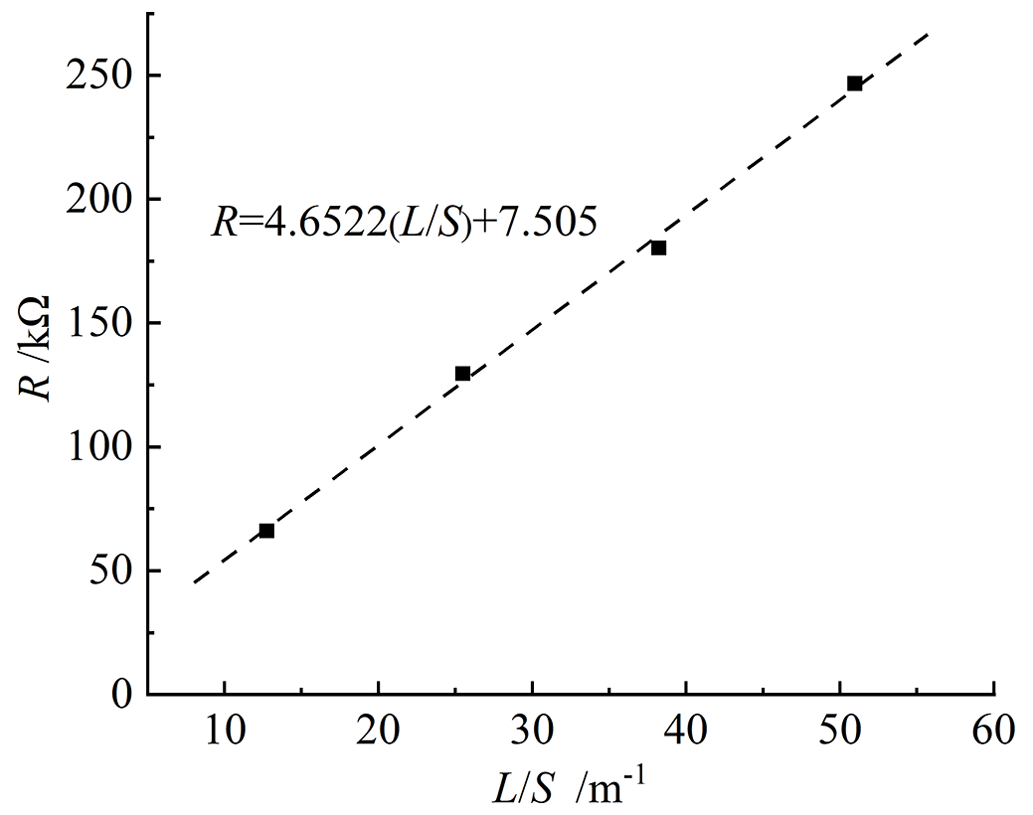
To avoid large additional impedances (such as contact resistances, wire resistances, etc.) in the resistivity measurement results, the variable-length method was used to verify the accuracy of the measurement. This method involves measuring the resistance of the specimen with different lengths and analysing their relationship. The specimens were taken from the same piece of granite to reduce the deviation caused by different samples. The diameter of the specimens was 50 mm, and the lengths were 25, 50, 75, and 100 mm. The specimens were saturated with 10 g L−1 sodium sulfate solution. Figure 8 shows the relationship of resistance R to the ratio of length L to area S. The square point represents the measured value, and the dotted line represents the fitting of the measured value. According to the analysis of the test circuit, the fitting curve can be expressed by the following Eq. (2):
where ρ0 is the average resistivity of the specimen, and Re is the additional resistance of the test line. It can be seen that the resistance values of different lengths are approximately on a straight line, indicating that the specimens have similar structures. The intercept of the straight line on the y axis is Re, and its value is 7.505 kΩ. The resistance of the rocks is often in the 105 Ω level, and the additional resistance of the line is often lower than 1 % of its resistance, so it can be considered that the influence of the additional resistance on the test results can be ignored.
5.1 Analysis of the effect of temperature and seepage pressure on resistivity
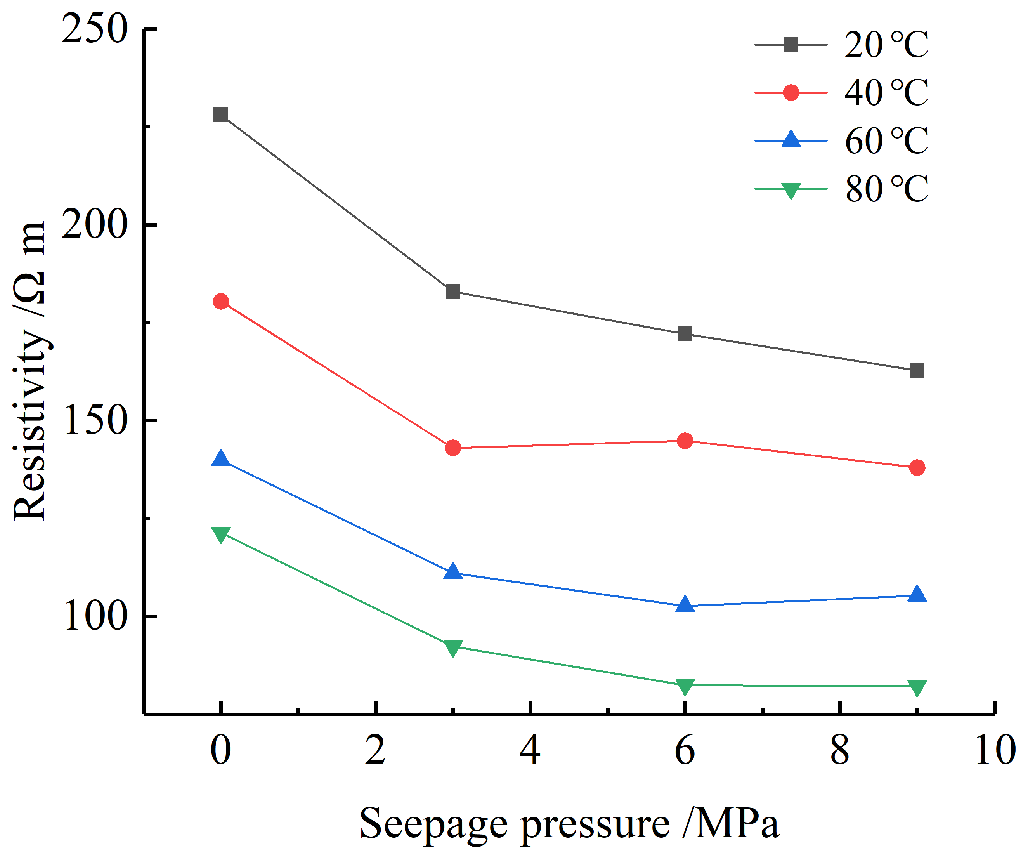
In this section, the resistivity of fractured granite specimens was tested under different temperature and permeability pressure conditions. To ensure the consistency of fracture between different specimens, rock specimens were made by the engraving method – a photograph of the specimen is shown in Fig. 9. The fracture penetrates along the axial direction of the specimen, which is basically in the middle of the specimen section, and the initial average opening of the fracture is 0.1 mm. In the test, the confining pressure was kept constant at 30 MPa; the temperature was taken as 20, 40, 60, and 80 ∘C; and the seepage pressure was taken as 0, 3, 6, and 9 MPa. The specimens were saturated with 10 g L−1 of Na2SO4 solution before the test.

Figure 9Photo of fractured granite specimen. (a) End of specimen. (b) Side of specimen. (c) Fracture surface.
The variation curve of resistivity with seepage pressure is shown in Fig. 10. Overall, the resistivity gradually decreases with increases in the seepage pressure, and the coupling effect of temperature and seepage pressure is obvious. The temperature-induced resistivity change is greater at low seepage pressures. When the seepage pressure is 0, the temperature-induced resistivity change can reach a maximum of 106.6 Ω m, and the maximum resistivity change caused by temperature is only 80.6 Ω m when the seepage pressure is 9 MPa. The effect of seepage on rock resistivity is greater at lower temperatures, with a maximum resistivity change of 65.1 Ω m caused by seepage pressure at 20 ∘C and 39.2 Ω m caused by seepage pressure at 80 ∘C.
5.2 Analysis of the effect of freezing and thawing on coal resistivity
To further verify the coordinated working performance of the test system's functions, triaxial tests were conducted on coal specimens under high-temperature conditions and high- and low-temperature-cycling conditions; the resistivity was also tested during the experiments, where two sets of tests were conducted for each condition.
The high-temperature triaxial test programme was as follows: first, the specimen was sealed as described above and saturated with 10 g L−1 of Na2SO4 solution by evacuation. Then, the specimen was loaded into triaxial cells and subjected to a 5 MPa confining pressure, 1 MPa seepage pressure, and 50 ∘C temperature. The triaxial test was performed after each condition reached stability for 2 h. The loading rate of the test was 0.02 mm min−1; and the temperature, confining pressure, and seepage pressure were kept constant during the test.
The high- and low-temperature-cycling test programme was as follows: first, the saturated specimen was maintained at a 5 MPa confining pressure, 1 MPa seepage pressure, and 50 ∘C for 2 h. Then, the confining pressure and seepage pressure were kept constant, and the temperature was reduced to −30 ∘C at a rate of 0.2 ∘C min−1 and maintained for 2 h. Finally, the temperature was raised to 50 ∘C at a rate of 0.3 ∘C min−1 and loaded at a constant rate of 0.02 mm min−1 for triaxial testing.
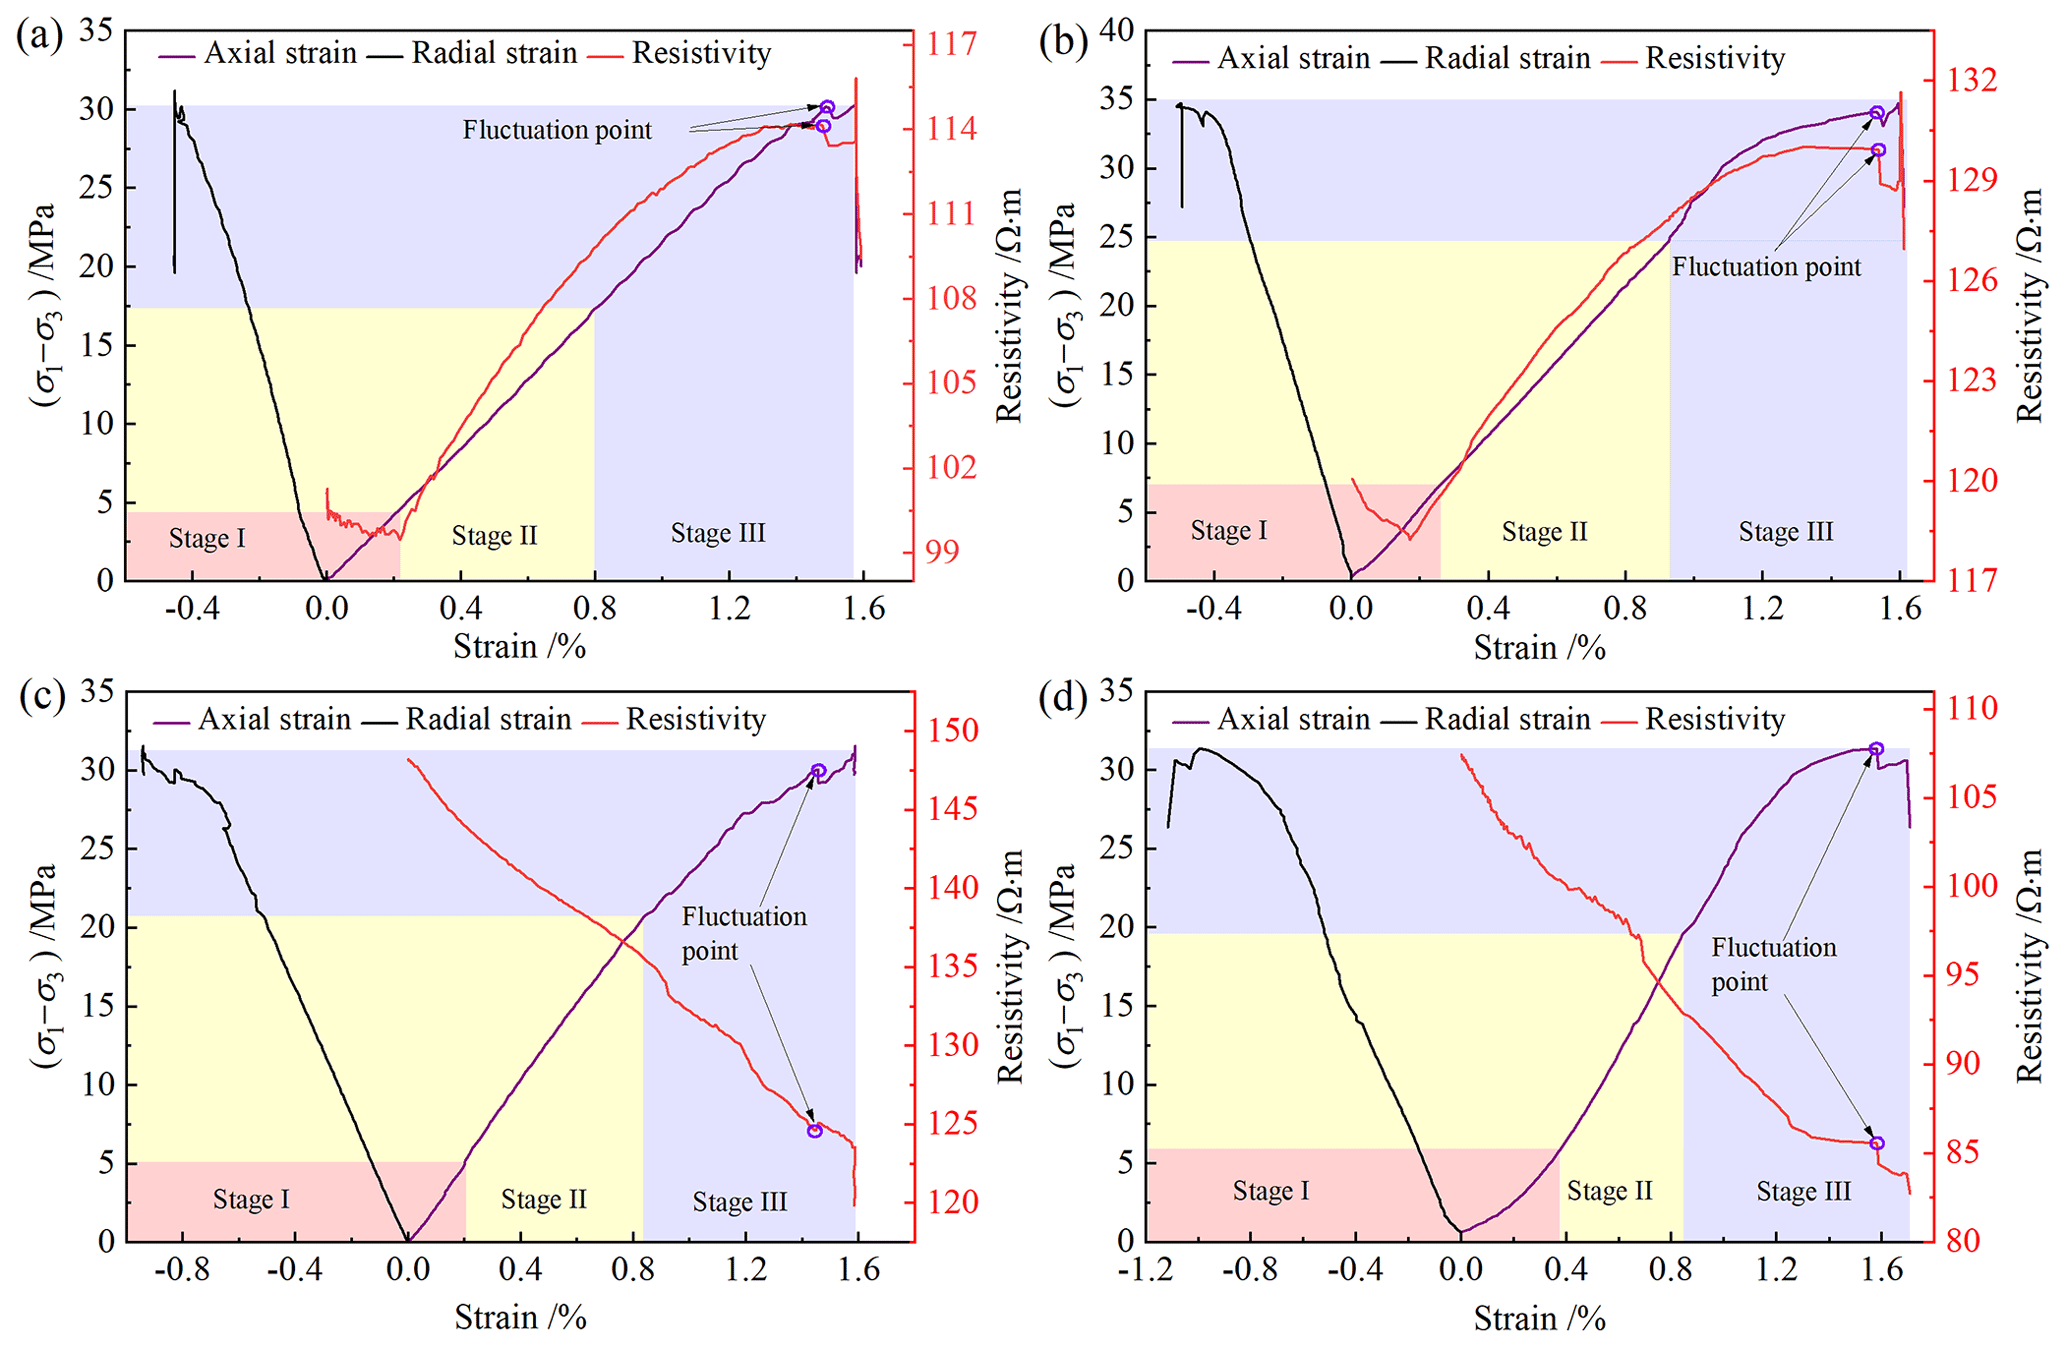
Figure 11Stress–strain and resistivity curves. (a, b) Unfrozen coal specimen. (c, d) Freeze–thawed coal specimen.

Figure 12Fracture shapes of specimens. (a, b) Unfrozen specimen. (c, d) Freeze–thawed specimen.
It can be seen from Fig. 11 that the deviatoric stress–axial strain curves of the unfrozen and freeze–thawed coal specimens are similar, exhibiting three stages of compaction, elasticity, and yield, and the axial strain values at damage are close. However, the radial deformation of the coal specimen after freezing and thawing is larger than that of the unfrozen specimen. The resistivity change patterns of unfrozen and frozen–thawed coals during triaxial compression differ significantly. The resistivity of the unfrozen coal specimen exhibits a decreasing trend in the initial compression stage and then gradually increases with rises in the deviatoric stress; however, the increased amplitude gradually became smaller, and the resistivity was almost stable when it was close to the damage point. When the specimen becomes damaged, the resistivity first increases suddenly and then decreases rapidly. After freezing and thawing, the electrical resistivity of coal decreases during the entire compression process, and the resistivity decreases rapidly when the specimen becomes damaged. It can also be seen that the resistivity changes significantly when the stress–strain curve of both unfrozen and freeze–thawed specimens exhibits large fluctuations, indicating that the resistivity changes are closely related to the strain.
Figure 12 shows the fracture shape of unfrozen and freeze–thawed specimens after destruction. The unfrozen and freeze–thawed specimens exhibit different fracture patterns. The fracture of the unfrozen specimen is crossed oblique fractures, while the specimen after freezing and thawing has multiple axially penetrating fractures and a higher degree of specimen fragmentation. It can also be seen that there are more micro-cracks on the end face of the freeze–thawed specimen, which not only increases the content of pore water but may also become a potential expansion channel for the specimen cracks.
-
A THMC multi-field rock resistivity test system is developed herein. The system comprises a triaxial system, chemical permeation system, temperature control system, and test control system. It can simulate the thermo, hydro, mechanical, and chemical environment of deep-underground rock, providing an experimental means to study the rock resistivity characteristics and mechanical properties under different deep-underground environmental conditions.
-
A sealing method to prevent the formation of a water film on the side of the specimen is proposed based on the characteristics of the device. After testing, the good stability and test accuracy of the system can meet the measurement of rock resistivity under complex conditions.
-
Test results show that the temperature and seepage pressure have significant effects on rock resistivity and have a strong coupling effect. The temperature-induced resistivity change is greater at low seepage pressures, and the effect of seepage on rock resistivity is greater at lower temperatures.
-
The deviatoric stress–axial strain curves of unfrozen and freeze–thawed coal specimens are similar, but the radial deformation of coal specimens after freezing and thawing is larger than that of unfrozen specimens. The resistivity change patterns of unfrozen and freeze–thawed coals during triaxial compression differ quite significantly. The resistivity of unfrozen coal specimens exhibits a decreasing trend in the initial compression stage and then gradually increases with rises in the deviatoric stress. After freezing and thawing, the electrical resistivity of coal decreases during the entire compression process.
All the datasets presented in this study are available on request to the corresponding authors.
LS and JY conceived and conducted the study. JR, LS, and HL designed the test system. JR, QW, and JF tested the system and proposed the new sealing method. HS and JY prepared the figures. JR wrote the main content and together with LS performed the data processing. All authors contributed to the discussions and interpretation of the results.
The contact author has declared that none of the authors has any competing interests.
Publisher's note: Copernicus Publications remains neutral with regard to jurisdictional claims in published maps and institutional affiliations.
We would like to thank the people who helped during the development of the test system (Zhang Xiangxiang, Zhou Zhi, and He Yameng from China University of Mining and Technology). We also would like to express our gratitude to Peng Jia and an anonymous referee who helped to improve this article with their helpful remarks and suggestions. We also thank Ulrike Werban for his suggestions on an early draft that improved the manuscript.
The work described in this paper was fully supported by National Natural Science Foundation of China (41974164), Special Funds for Jiangsu Science and Technology Plan (BE2022709).
This paper was edited by Ulrike Werban and reviewed by Peng Jia and one anonymous referee.
Alemu, B. L., Aker, E., Soldal, M., Johnsen, O., and Aagaard, P.: Effect of sub-core scale heterogeneities on acoustic and electrical properties of a reservoir rock: a CO2 flooding experiment of brine saturated sandstone in a computed tomography scanner, Geophys. Prospect., 61, 235–250, https://doi.org/10.1111/j.1365-2478.2012.01061.x, 2013.
Bai, Y., Shan, R. L., Wu, Y. X., and Sun, P. F.: Development and Application of a New Triaxial Testing System for Subzero Rocks, Geotech. Test. J., 44, 1327–1349, https://doi.org/10.1520/GTJ20200054, 2021.
Bosch, D., Ledo, J., Queralt, P., Bellmunt, F., Luquot, L., and Gouze, P.: Core-scale electrical resistivity tomography (ERT) monitoring of CO2-brine mixture in Fontainebleau sandstone, J. Appl. Geophys., 130, 23–36, https://doi.org/10.1016/j.jappgeo.2016.03.039, 2016.
Chen, F., An, J. Z., and Liao, C. T.: Directional characteristic of resistivity changes in rock of original resistivity anisotropy, Chin. J. Geophys., 46, 271–280, https://doi.org/10.3321/j.issn:0001-5733.2003.02.023, 2003 (in Chinese).
Falcon-Suarez, I., North, L., and Best, A.: Experimental Rig to Improve the Geophysical and Geomechanical Understanding of CO2 Reservoirs, Enrgy. Proced., 59, 75–81, https://doi.org/10.1016/j.egypro.2014.10.351, 2014.
Gong, C. G., Wang, W., Shao, J. F., Wang, R. B., and Feng, X. W.: Effect of water chemical corrosion on mechanical properties and failure modes of pre-fissured sandstone under uniaxial compression, Acta Geotech., 16, 1083–1099, https://doi.org/10.1007/s11440-020-01071-y, 2021.
Hao, S., Lei, S., Zhang, H. Q., Chen, W. L., Lin, H. S., Li, D. Q., Wang, G. Z., and Zhao, H. Y.: Experimental and numerical studies on progressive debonding of grouted rock bolts, Int. J. Min. Sci. Technol., 32, 63–74, https://doi.org/10.1016/j.ijmst.2021.10.002, 2022.
Huang, J., Song, Z. L., Liao, Z. W., Zhao, W. C., and Wang, D.: Quantification of cracks and the evolution of permeability for reservoir rock under coupled THM: equipment development and experimental research. Geomech. Geophys. Geo., 6, 63, https://doi.org/10.1007/s40948-020-00187-5, 2020.
Jia, P., Lei, L. I., Liu, D. Q., Wang, X. S., and Wang, D. C.: Insight into Rock Crack Propagation from Resistivity and Ultrasonic Wave Variation, Theor. Appl. Fract. Mech., 109, 102758, https://doi.org/10.1016/j.tafmec.2020.102758, 2020.
Kahraman, S.: Estimating the Physico-Mechanical Properties of Pyroclastic Rocks from Electrical Resistivity, Pure Appl. Geophys., 179, 301–309, https://doi.org/10.1007/s00024-021-02898-6, 2021.
Ma, X., Wang, G. L., Hu, D. W., Liu, Y.G., Zhou, H., and Liu, F.: Mechanical properties of granite under real-time high temperature and three-dimensional stress, Int. J. Rock Mech. Min., 136, 104521, https://doi.org/10.1016/j.ijrmms.2020.104521, 2020.
Ran, H. Y., Guo, Y. X., Feng, G. R., Qi, T. Y., Du, X. J.: Creep properties and resistivity-ultrasonic-AE responses of cemented gangue backfill column under high-stress area, Int. J. Min. Sci. Technol., 31, 401–412, https://doi.org/10.1016/j.ijmst.2022.06.004, 2022.
Ranjith, P. G. and Perera, M.: A new triaxial apparatus to study the mechanical and fluid flow aspects of carbon dioxide sequestration in geological formations, Fuel, 90, 2751–2759, https://doi.org/10.1016/j.fuel.2011.04.004, 2011.
Singalreddy, S. P., Liang, C., and Fang, K.: Spatiotemporal evolution of thermo-hydro-mechanical-chemical processes in cemented paste backfill under interfacial loading, Int. J. Min. Sci. Technol., 32, 1207–1217, https://doi.org/10.1016/j.ijmst.2022.10.002, 2022.
Song, M. Y., Li, Q., Hu, Q. G., Wu, Y. G., Ni, G. H., Xu, Y. C., Zhang, Y. B., Hu, L. P., Shi, J. L., Liu, J. C., and Deng, Y. Z.: Resistivity response of coal under hydraulic fracturing with different injection rates: A laboratory study, Int. J. Min. Sci. Technol., 32, 807–819, https://doi.org/10.1016/j.ijmst.2022.06.004, 2022.
Sun, Q., Zhu, S. Y., and Xue, L.: Electrical resistivity variation in uniaxial rock compression, Arab. J. Geosci., 8, 1869–1880, https://doi.org/10.1007/s12517-014-1381-3, 2015.
Tao, M., Pei, J. L., Gan, F., Hu, Y. Q., Zhang, Z. J., and Zhang, D. K.: Permeability and porosity in damaged salt interlayers under coupled THMC conditions, J. Petrol. Sci. Eng., 211, 110218, https://doi.org/10.1016/j.petrol.2022.110218, 2022.
Wang, Y, H., Liu, Y. F., and Ma H. T.: Changing regularity of rock damage variable and resistivity under loading condition, Safety Sci., 50, 718–722, https://doi.org/10.1016/j.ssci.2011.08.046, 2012.
Yaramanci, U.: Geoelectric exploration and monitoring in rock salt for the safety assessment of underground waste disposal sites, J. Appl. Geophys., 44, 181–196, https://doi.org/10.1016/S0926-9851(99)00013-0, 2000.
Ye, G. L., Nishimura, T., and Zhang, F.: Experimental study on shear and creep behaviour of green tuff at high temperatures, Int. J. Rock Mech. Min., 79, 19–28, https://doi.org/10.1016/j.ijrmms.2015.08.005, 2015.
Yin, D. H. and Xu, Q. J.: Investigating the damage evolution of sandstone using electrical impedance spectroscopy, Int. J. Rock Mech. Min., 144, 104817, https://doi.org/10.1016/j.ijrmms.2021.104817, 2021.
Zhang, P., Mishra, B., and Heasley, K. A.: Experimental Investigation on the Influence of High Pressure and High Temperature on the Mechanical Properties of Deep Reservoir Rocks, Rock Mech. Rock Eng., 48, 2197–2211, https://doi.org/10.1007/s00603-015-0718-x, 2015.
Zhao, Y. S., Wan, Z. J., Feng, Z. J., Yang, D., Zhang, Y., and Qu, F.: Triaxial compression system for rock testing under high temperature and high pressure, Int J. Rock Mech. Min., 52, 132–138, https://doi.org/10.1016/j.ijrmms.2012.02.011, 2012.
Zhong, W., Gelius, L. J., and Kong F. N.: Simultaneous core sample measurements of elastic properties and resistivity at reservoir conditions employing a modified triaxial cell – a feasibility study, Geophys. Prospect., 57, 1009–1026, https://doi.org/10.1111/j.1365-2478.2009.00792.x, 2010.