the Creative Commons Attribution 4.0 License.
the Creative Commons Attribution 4.0 License.
 | 20 Mar 2023
Plume–ridge interactions: ridgeward versus plate-drag plume flow
Fengping Pang
Jie Liao
Maxim D. Ballmer
Lun Li
The analysis of mid-ocean ridges and hotspots that are sourced by deep-rooted mantle plumes allows us to get a glimpse of mantle structure and dynamics. Dynamical interaction between ridge and plume processes have been widely proposed and studied, particularly in terms of ridgeward plume flow. However, the effects of plate drag on plume–lithosphere and plume–ridge interaction remain poorly understood. In particular, the mechanisms that control plume flow towards vs. away from the ridge have not yet been systematically studied. Here, we use 2D thermomechanical numerical models of plume–ridge interaction to systematically explore the effects of (i) ridge-spreading rate, (ii) initial plume head radius and (iii) plume–ridge distance. Our numerical experiments suggest two different geodynamic regimes: (1) plume flow towards the ridge is favored by strong buoyant mantle plumes, slow spreading rates and small plume–ridge distances; (2) plume drag away from the ridge is in turn promoted by fast ridge spreading for small-to-intermediate plumes and large plume–ridge distances. We find that the pressure gradient between the buoyant plume and spreading ridge at first drives ridgeward flow, but eventually the competition between plate drag and the gravitational force of plume flow along the base of the sloping lithosphere controls the fate of plume (spreading towards vs. away from the ridge). Our results highlight that fast-spreading ridges exert strong plate-dragging force, which sheds new light on natural observations of largely absent plume–lithosphere interaction along fast-spreading ridges, such as the East Pacific Rise.
- Article
(10195 KB) - Full-text XML
-
Supplement
(1260 KB) - BibTeX
- EndNote


Mid-ocean ridges (MORs) and hotspots are two main regions for deep-material recycling to the surface of the Earth. However, these two units are not always isolated; rather, they show strong interactions in some cases, termed as plume–ridge interaction (Morgan, 1978). Of up to 50 mantle plumes revealed by seismic tomography (French and Romanowicz, 2015; Montelli et al., 2004), more than 20 plumes are found to be associated with nearby ridges (Fig. 1a; Ito et al., 2003). Plume–ridge interaction is manifested by geophysical and geochemical anomalies along the ridge axis, e.g., high mantle potential temperature (Dalton et al., 2014), enriched radiogenic isotope anomalies (Cushman et al., 2004; Douglass et al., 1999; Yang et al., 2017) and adjacent lineations of seamounts (Ballmer et al., 2013b; Geissler et al., 2020; Lénat et al., 2009). Furthermore, plumes may promote migration of MOR spreading centers (Müller et al., 1998; Mittelstaedt et al., 2008, 2011; Whittaker et al., 2015), as evidenced by successive ridge jumps towards mantle plumes, e.g., at Iceland, Amsterdam–Saint Paul and Galapagos hotspots (Hardarson et al., 1997; Maia et al., 2011; Mittelstaedt et al., 2012). The interaction dynamics of a ridge with a ridge-centered and off-ridge plume has been widely studied and modeled in analogue and numerical experiments, revealing that the major controlling factors involve the ridge-spreading rate, plume buoyancy flux and their spatial distance (François et al., 2018; Ito et al., 1997; Kincaid et al., 1996; Ribe et al., 1995; Ribe, 1996; Sleep, 1997). Indeed, most plume–ridge interaction systems are associated with slow-spreading ridges, small mantle plumes and short plume–ridge distances (Fig. 1b). However, numerical studies systematically investigating the effects of these parameters on plume–ridge interaction and quantifying the controlling forces remain scarce.
As has been noted previously, buoyant plumes tend to spread ridgeward along the sloping base of the lithosphere (Morgan, 1978; Schilling, 1991; Small, 1995). Regions of divergent mantle flow beneath MORs represent the lowest dynamic-pressure regions in the oceanic asthenosphere and thus tend to suck ambient asthenospheric and plume materials towards the spreading center (Niu and Hekinian, 2004). On the other hand, the viscous drag at the base of the plate tends to convey the spreading plume material away from the MOR (Ribe and Christensen, 1994, 1999). Indeed, plume spreading at the base of the lithosphere is governed by the competition of trenchward viscous plate drag vs. ridgeward gravitational and pressure-driven forces (Kincaid et al., 1996). These gravitational and tectonic forces compete with each other to control the regime of plume–ridge interaction, but their balance remains to be quantified.
The different distribution of hotspots with classified plume–ridge interaction (ridgeward spreading) vs. no interaction (plate-drag spreading) also still remains enigmatic. Plume–ridge interaction is much more common near the Mid-Atlantic Ridge (MAR) than near the East Pacific Rise (EPR; Fig. 1a). Near the EPR, only the Pukapuka and Sojourn ridges display clear evidence of ridgeward flow of the magmatic source, but these volcanic ridges have been attributed to horizontally viscous differences or small-scale convection in the uppermost mantle and not to a mantle plume (Ballmer et al., 2013b; Clouard and Bonneville, 2005; Harmon et al., 2011). A previous study (Jellinek et al., 2003) proposed that fast-spreading ridges guide upwelling mantle flow towards the spreading center to convey the surrounding plumes from deep depths entirely into the MOR melting zone (Fig. 1c), resulting in the absence of hotspots adjacent to the EPR (see also Rowley et al., 2016; Rowley and Forte, 2022). However, fast plate spreading also tends to drag mantle plumes away from the MOR (Kincaid et al., 1995, 1996), leading to the typically parabolic shapes of hotspot swells, such as near Hawaii (Ribe and Christensen, 1994). Whether the increased spreading rates in the Pacific vs. Atlantic promote ridgeward vs. plate-drag plume flow remains an intriguing question.
The principal goal of this study is to investigate the process of plume–ridge interaction, with an emphasis on the effects of model parameters on the ridgeward vs. plate-drag plume spreading. We explore the effects of various model parameters, such as the size of the plume, ridge-spreading rate, and plume–ridge distance. Finally, we use our model results to interpret the differences between natural plume–ridge interaction systems in different oceans, particularly the striking difference between the East Pacific and Atlantic in this regard.
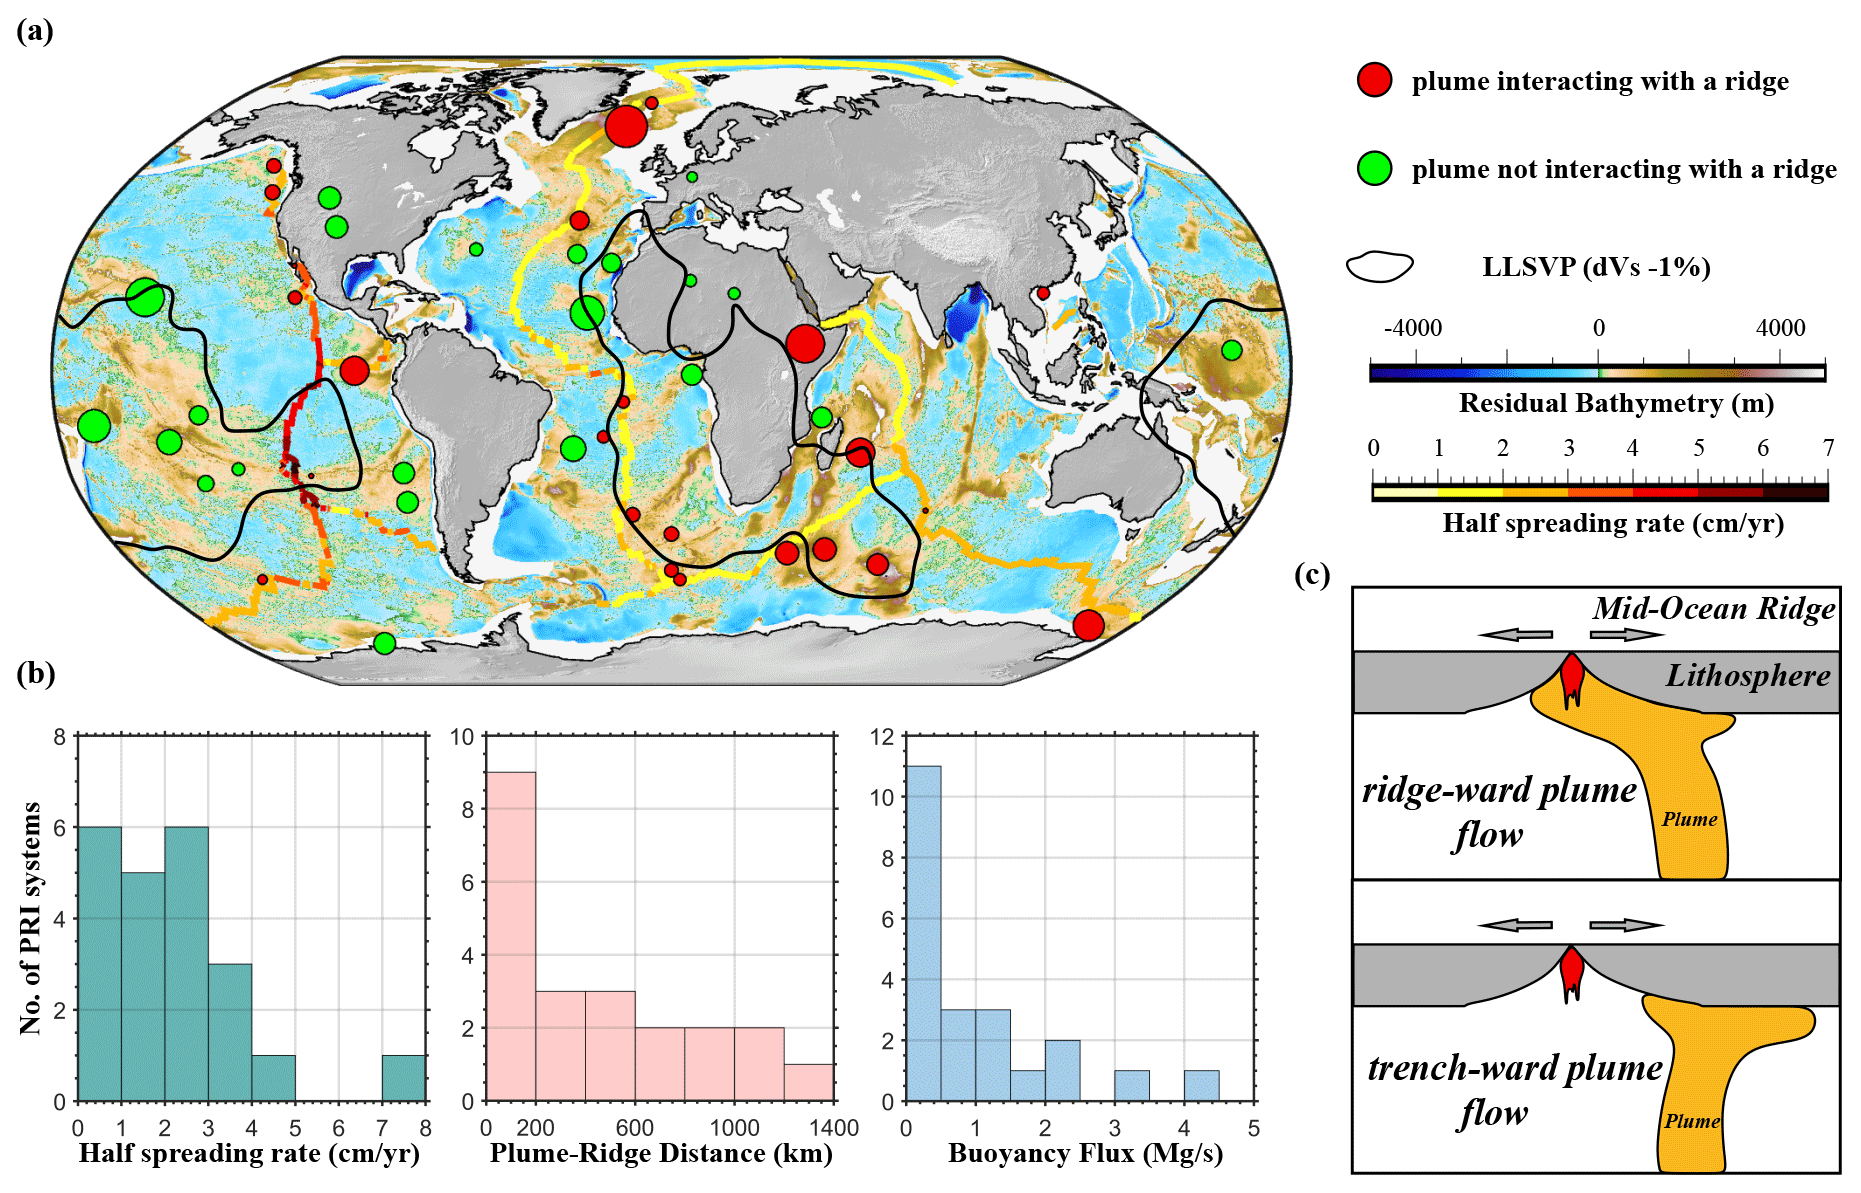
Figure 1Global plume–ridge interaction systems. (a) Global distribution of mid-ocean ridges and mantle plumes. Residual bathymetry of the ocean basins comes from Straume et al. (2019). Mid-ocean ridges are painted in solid colored lines corresponding to half-spreading rate. Plumes not interacting with a ridge are shown by green circles, and hotspots linked to ridges are in red dots (Ito et al., 2003); size refers to the plume buoyancy flux from Hoggard et al. (2020). Black lines denote the regions of two LLSVPs (large low-shear velocity provinces) under South Africa and the Pacific Ocean (Torsvik et al., 2006). (b) Histograms of influential factors of plume–ridge interaction systems. Half the spreading rate and plume–ridge distance are taken from GPlates (Müller et al., 2016; Whittaker et al., 2015). Plume–ridge interaction systems link to slow-spreading ridges, small mantle plumes and short plume–ridge distances. (c) Sketches of ridgeward (top panel) and plate-drag plume flow (bottom panel) mode proposed, respectively.
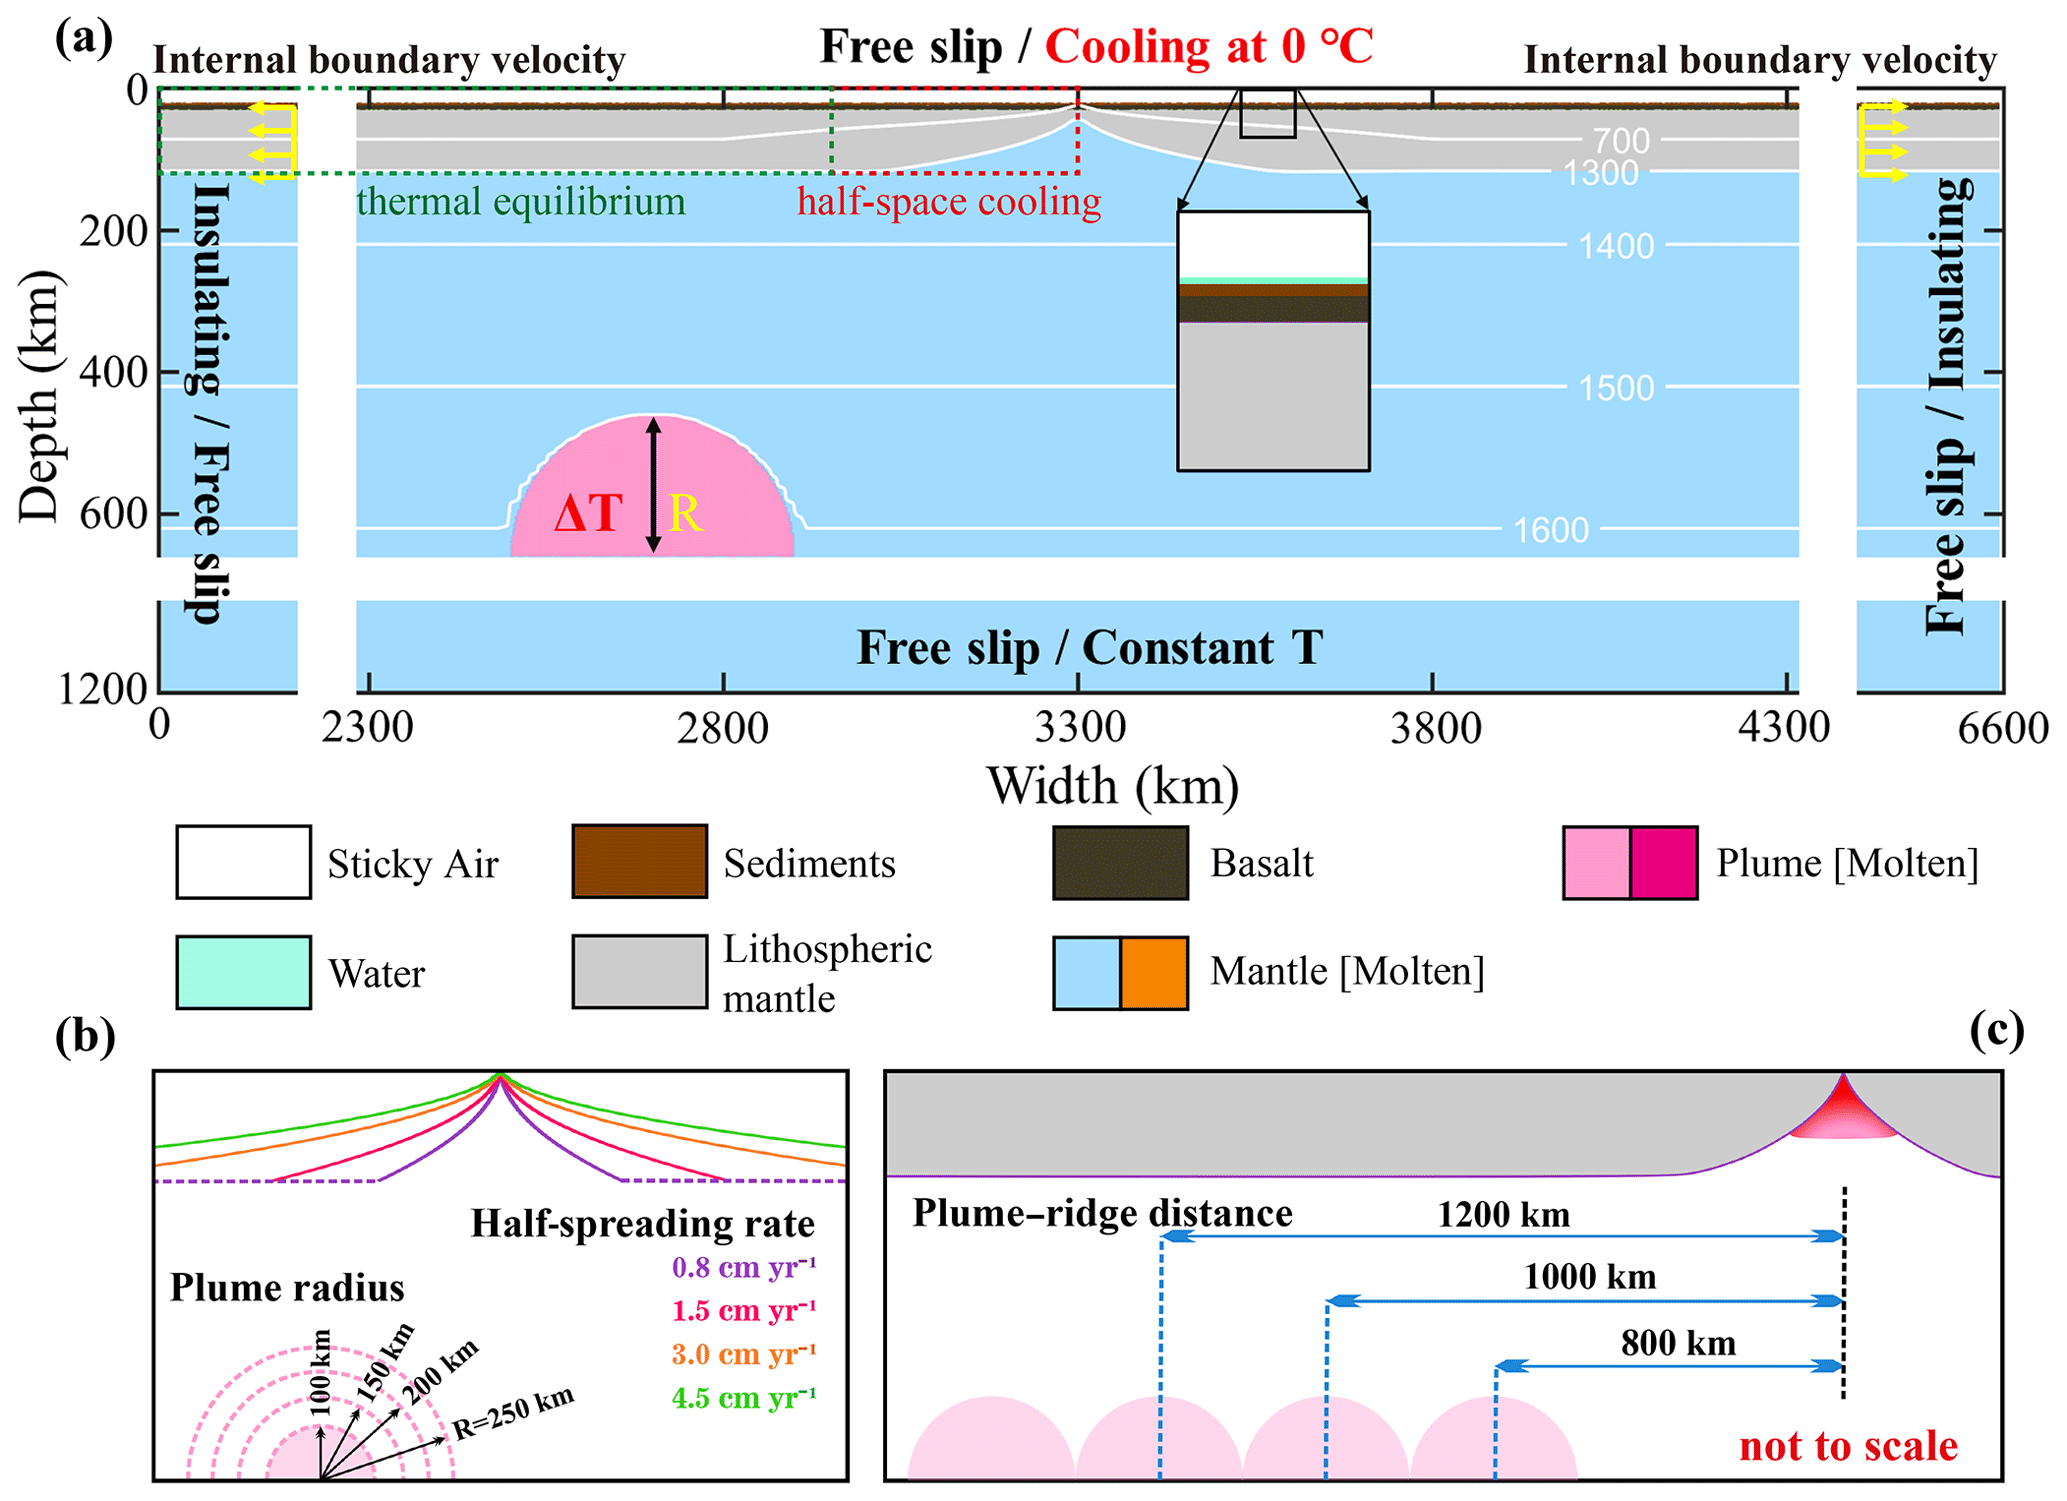
Figure 2Model setup. (a) Initial composition and boundary conditions. The oceanic plate consists of half-space cooling part and the thermal equilibrium part. A 50 Myr old mid-ocean ridge is set in the middle of the model based on half-space cooling-temperature structure. A thermal and chemical anormal mantle plume is located at 660 km. Different colors indicate the initial rock types and corresponding newly formed molten-rock types. Yellow arrows are the half-spreading rates imposed internally in the lithosphere (i.e., from 20 to 120 km in depth) to simulate ridge spreading. (b) Initial tested ridge and plume configurations. (c) Initial tested plume–ridge distances.
2.1 Modeling methods
To explore plume–lithosphere and plume–ridge interaction, we conduct numerical simulations utilizing the 2D thermo-mechanical code I2VIS, which is based on the staggered finite-difference method combined with marker-in-cell techniques (Gerya and Yuen, 2003, 2007). The equations of conservation of mass, momentum and energy (Eqs. 1–3, respectively) are solved in a fully staggered grid assuming an incompressible media:
where v refers to the velocity, σij′ refers to the deviatoric stress tensor, P refers to the pressure, ρ refers to the density, g refers to the gravity acceleration, refers to the Lagrangian time derivative, Cp refers to the heat capacity, and q refers to the heat flux. Additionally, Hr, Ha, Hs and Hl are the radioactive, adiabatic, shear and latent heat productions, respectively.
We employ a non-Newtonian visco-plastic rheology (Gerya and Yuen, 2007) in the models. The viscous rheology depends on stress, temperature and pressure. The appropriate viscosity is expressed as that of a composite diffusion and dislocation-creep material (Eq. 4):
in which ηdiff and ηdisl are the diffusion- and dislocation-creep viscosity, respectively, and can be further computed using Eqs. (5) and (6):
where P is the pressure, T is the temperature; is the second invariant of the strain rate tensor; σcrit is the diffusion- and/or dislocation-creep transition stress; and A, Ea, Va and n are the strain rate pre-exponential factor, activation energy, activation volume and stress exponent, respectively. The plastic behavior ηpla is described by the Drucker–Prager yield criterion (Byerlee, 1978; Ranalli, 1995) according to Eqs. (7) and (8):
in which σy is the yield stress, C is the rock cohesion, and φ is the effective friction coefficient. The effective viscosity ηeff of rocks is thus constrained by both viscous and plastic deformation, where the rheological behavior depends on the minimum viscosity attained between ductile and brittle fields:
Partial melting, melt extraction and percolation are also considered in the model in a simplified way (Gerya, 2013). The melt fraction (M0) of the crust is assumed to increase with temperature and is calculated according to Eq. (10):
where Tsolidus and Tliquidus are the solidus and liquidus temperature of different rock types, respectively, taken from Katz et al. (2003).
In our model, melt extraction is modeled indirectly and is considered to be an instantaneous process (Gerya et al., 2015). The extracted melt is assumed to move vertically from the molten source and then gets added to the bottom of the crust. Partial melt is extracted from the mantle and instantaneously displaced to the bottom of the crust and converted into hot mafic magma, obeying the conservation of material. The amount of extracted melt during the evolution of each experiment is traced by the Lagrangian markers (Gerya, 2013). The total amount of melt, M, for every marker excludes the amount of previously extracted melt according to Eq. (11):
where ΣnMext refers to the total melt fraction extracted during the previous n melt extraction time steps.
The effective density of mafic magma and molten crust depends on its melt fraction and is calculated as follows (Gerya et al., 2015; Gülcher et al., 2020):
where ρ0,molten and ρ0,solid are the reference densities of the molten and solid crust. ρsolid is the crust density at a given pressure and temperature, which can be computed as follows:
with thermal expansion K−1 and compressibility Pa−1.
Surface processes, such as erosion and sedimentation, are considered by solving the transport equation on the Eulerian nodes at each time step (Gerya and Yuen, 2003). Our erosion–sedimentation model uses gross-scale erosion–sedimentation rates which are independent of local elevation and topography (Burov and Cloetingh, 1997). We use constant and moderate rates of erosion (0.315 mm yr−1) and sedimentation (0.0315 mm yr−1), respectively, which fall within naturally observed ranges.
2.2 Model setup
The size of the model box is 6600×1200 km, with a nonuniform grid of 501×301 computational nodes in length and depth, respectively (Fig. 2). The densest grid is located in the center of the model domain (i.e., grid size decreases linearly from 20 km at the edges to 2 km at the ridge axis and increases linearly from 1 km at the top to 7 km at the bottom), where plume–ridge interaction would happen. The model consists of a 20 km thick sticky-air layer to accommodate crustal surface deformation. To reproduce the oceanic lithosphere, we choose a typical layered model, where the crust is composed of a water level (2 km), a sediment layer (1.5 km) and a basalt layer (7.5 km). The oceanic lithosphere and asthenosphere in the model are both modeled as dry olivine (the different colors for the mantle lithosphere and asthenosphere in the figures of this paper are only for better visualization). Besides, a 50 Myr old mid-ocean ridge is set on the central part of the lithosphere, splitting the model domain into two parts. At the depth of 660 km, a 200 km wide semicircular plume is located on the left of the model domain, corresponding to the onset of plume–ridge interaction from the mantle transition zone. Detailed rock parameters are listed in Table 1.
The thermal conditions at the top and bottom boundaries are fixed at 273 and 2513 K, respectively. The left and right boundaries are both insulating, with no external heat flow across them. The initial temperature structure of the mantle is adiabatic (0.5 K km−1), which results in a temperature at 660 km depth of 1843 K. The initial temperature structure of the oceanic plate consists of a half-space cooling part and a thermal-equilibrium part (Fig. 2a). The half-space cooling model is used to describe the oceanic plate younger than 50 Myr, and the thermal-equilibrium structure is used to describe older oceanic parts. In other words, the thermal age of the lithosphere far away from the ridge is fixed at 50 Myr, with a constant plate thickness (i.e., ∼100 km). The hot plume is set a circular thermal and compositional (see Table 1) anomaly with an excess temperature of 250 K to trigger a rising thermochemical plume. All the velocity boundaries are free-slip boundaries. Additional internal boundary velocities are imposed at 500 km from each side boundary in the lithosphere to maintain the imposed half-spreading rate (Fig. 2a).
Table 1Rock physical properties used in the numerical models.
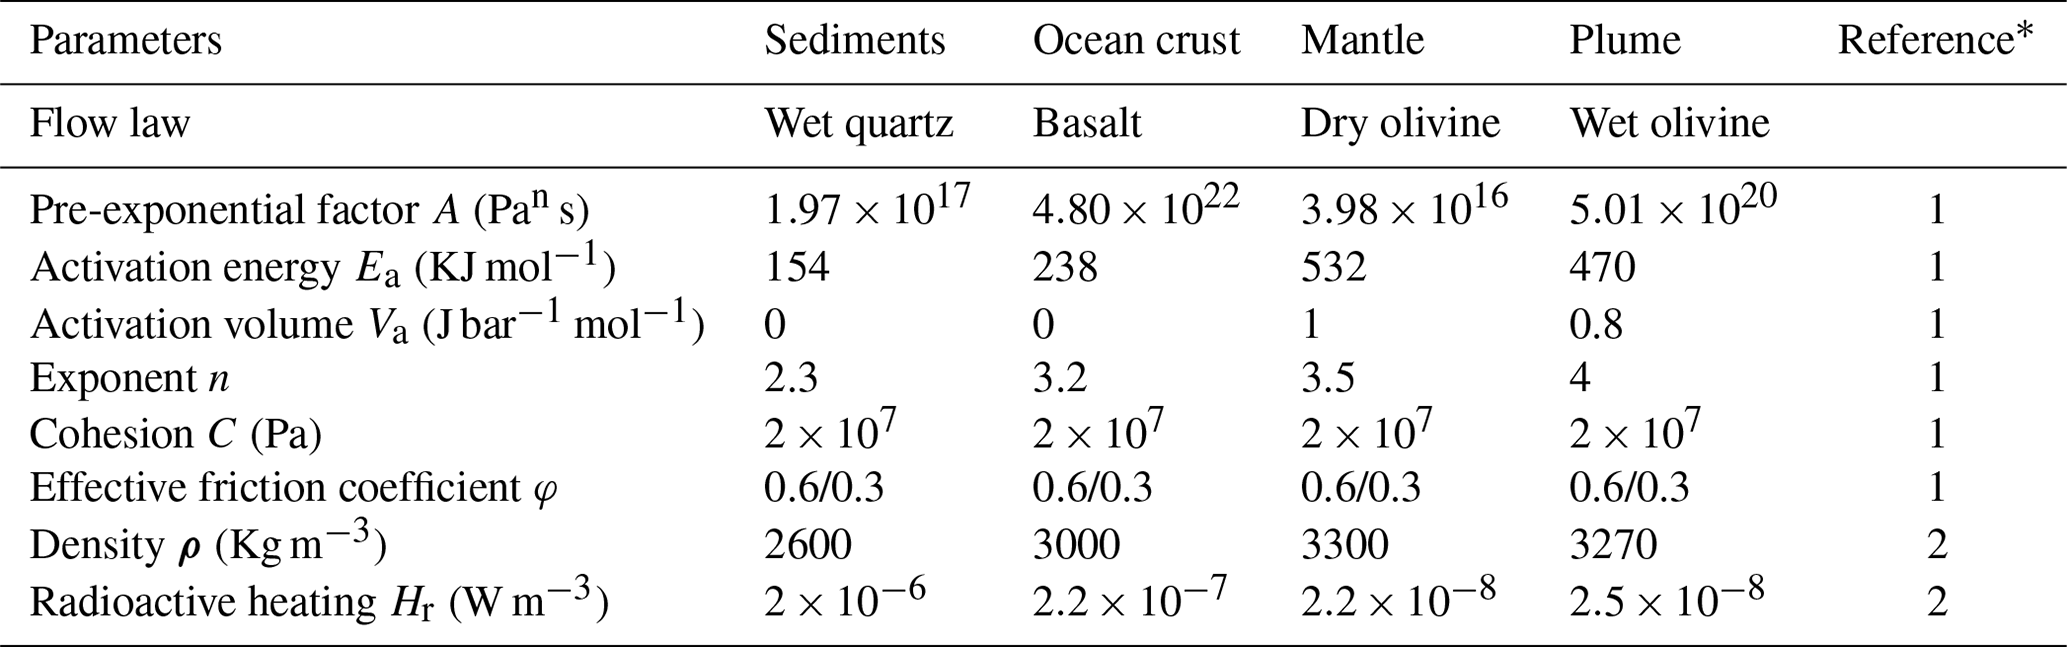
* 1 – Ranalli (1995); 2 – Turcotte and Schubert (2014). Other physical parameters used for all rocks include gas constant R=8.314 J K−1 mol−1, thermal expansion K−1, compressibility Pa−1 and heat capacity Cp=1000 J kg−1 K−1.
We conduct a series of numerical experiments to investigate ridge suction versus plate-drag acts on plumes. The effects of three major model parameters (i.e., the spreading rate of mid-ocean ridge, the initial plume head radius and the plume–ridge distance) are systematically studied. The typical dynamic evolution of models with ridgeward vs. plate-drag plume flow are demonstrated.
3.1 Model evolution with ridgeward plume flow
For models with dominant ridgeward flow, the typical model evolution is shown in Fig. 3 (the major model parameters used in this case are as follows: the half-spreading rate of 8 mm yr−1, the initial plume head radius of 200 km and the off-axis distance of 800 km). In the early plume head stage, the buoyant mantle plume rises up rapidly in a mushroom-like shape and imposes dynamic stresses at the base of the overriding oceanic plate, leading to significant surface uplift (Fig. 3a, b). The ascending plume experiences extensive decompression melting at the base of the overriding plate and, due to the dynamic overpressure, spreads laterally, forming two branches that flow in opposite directions (Fig. 3c). A large amount of plume material is eventually entrained towards the spreading center, ponding underneath the ridge axis and significantly affecting the ridge dynamics. The entrainment of hot plume material promotes decompression melting (Fig. 3d, e) and increases the temperature beneath the ridge (Fig. S2 in the Supplement). Within the overlying lithosphere, the buoyant mantle plume leads to stress localization and strongly weakens the oceanic plate (Figs. S1, S3). As the plume eventually flows upward along the base of the gradually sloping plate near MOR, melting and crust production occurs (Fig. S1), forming an oceanic plateau of thickened crust. In addition to this gravitational force that guides plume material of the right branch ridgeward, plate spreading drags both branches in the opposite direction. Moreover, convective and tectonic stresses (“plume push” and “ridge suction”) affect both branches of the plume in a different way. As a consequence, the two branches evolve asymmetrically: the right branch that flows towards the ridge axis is more vigorous than the left branch, and the plume tail is also tilted towards the spreading center (Fig. 3c–e).
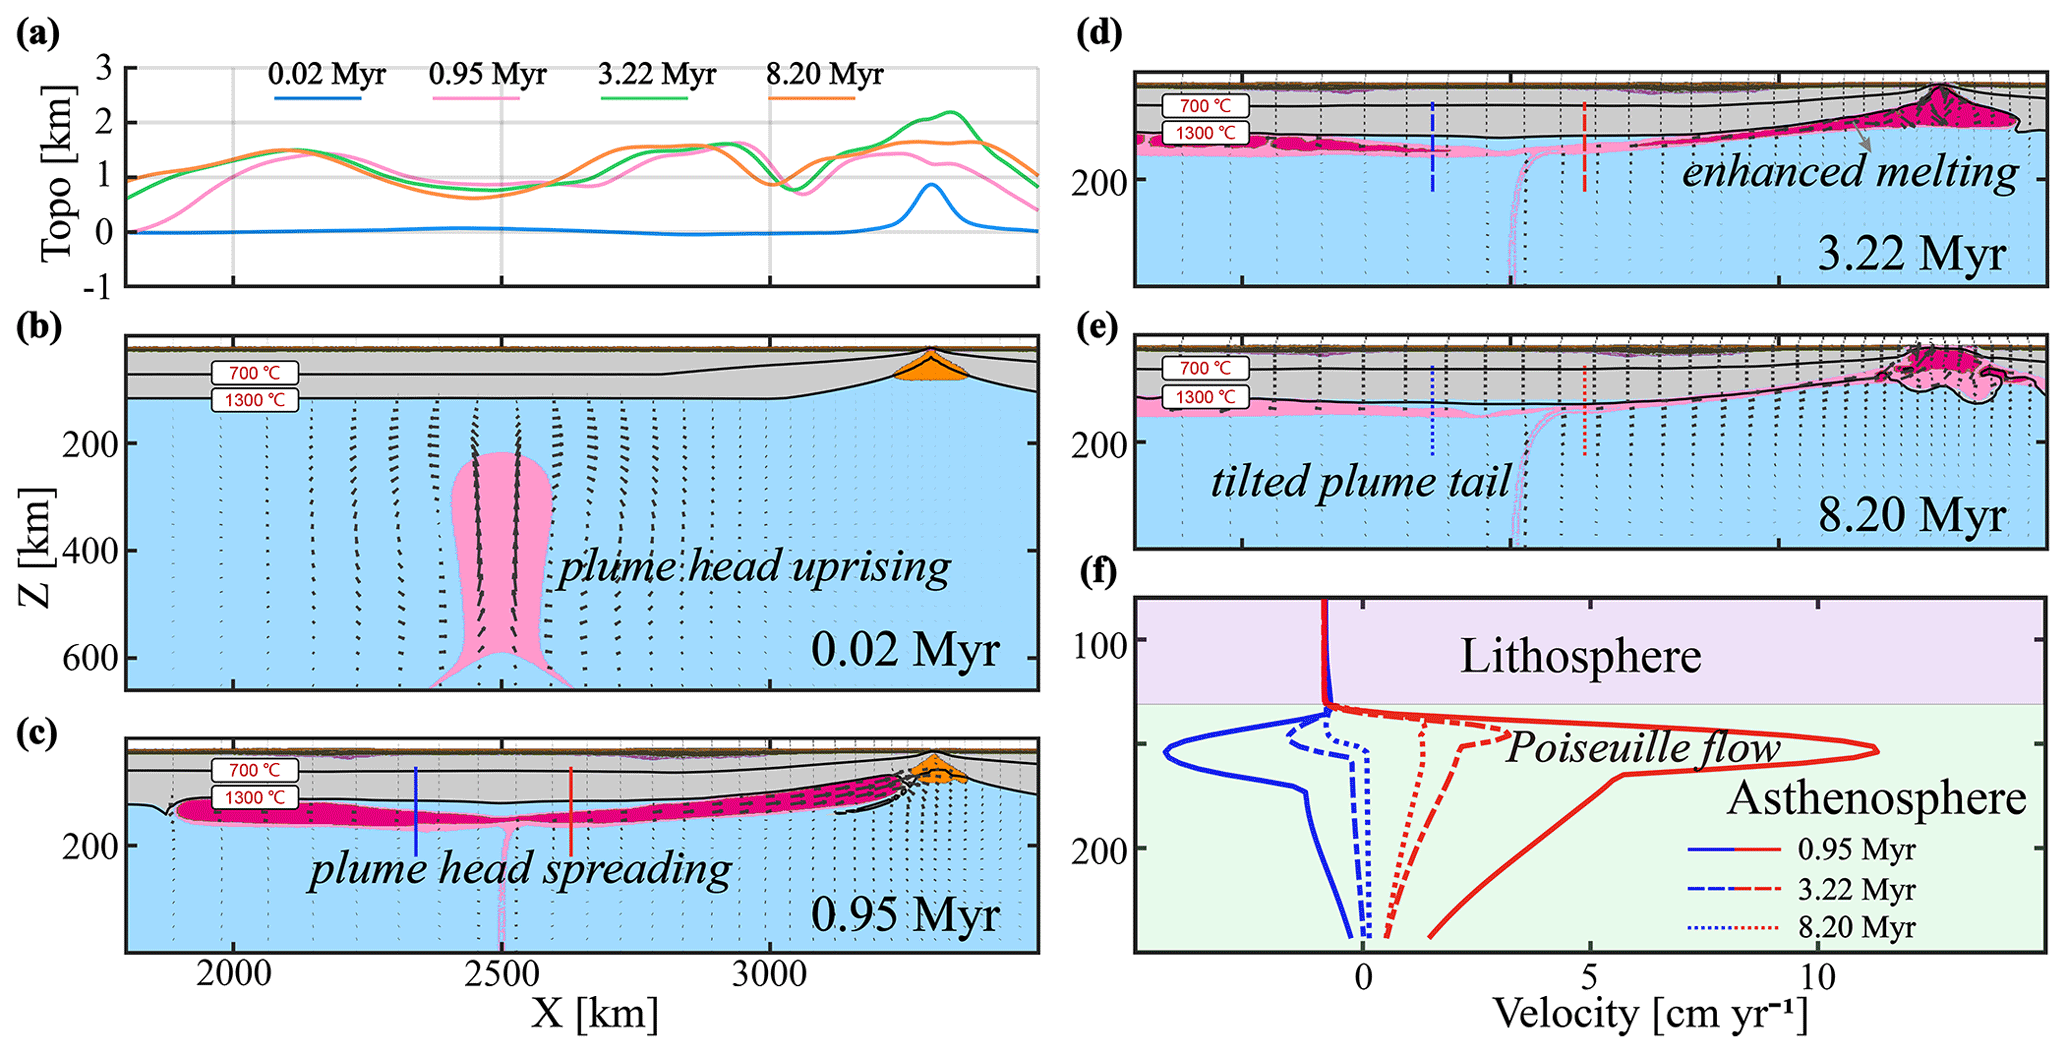
Figure 3The evolution of the reference model M12 (see Table S1 in Supplement) with dominant ridgeward plume flow. The main model parameters employed in this case are as follows: half-spreading rate of 8 mm yr−1, an initial plume head radius of 200 km and an off-axis distance of 800 km. (a) Surface topography over time along the flow path. (b–e) Snapshots of composition for the reference model (M12). (f) Profiles of the horizontal velocity component over time at the sections, as indicated (color-coded) in panel (c–e).
The mantle flow horizontal velocity profiles (Fig. 3f) further demonstrate the dominance of ridgeward plume flow, showing that plume flow is faster towards the spreading ridge than away from it. The velocity profiles elucidate dominant Poiseuille flow, with the maximum flow velocities in the middle of the asthenospheric channel. Such velocity profiles are well consistent with observations of seismic anisotropy at the Reunion plume (Barruol et al., 2019). The branches of the spreading plume head move significantly faster than the overriding plate. Because of the asymmetrical spreading of the plume head, the buoyancy flux carried by the right branch of the plume (density anomaly multiplied by horizontal velocity from Fig. 3f) is also much larger than that carried by the left branch.
3.2 Model evolution with plate-drag plume flow
For models with dominant plume flow away from the ridge (“plate-drag flow”), the typical model evolution is shown in Fig. 4. The controlling parameters of the representative model shown in Fig. 4 are the same as for the model shown in Fig. 3, except for a smaller radius (100 km) and faster spreading ridge (half-spreading rate: 45 mm yr−1). At first, the ascending plume head spreads out similarly to the case described above and interacts with the overriding oceanic lithosphere. The largest surface uplift is sustained just above the plume head (Fig. 4a), slightly differently from the previous model, in which the highest surface elevation is observed on both sides of the plume conduit (Fig. 3a). Related to this spreading and uplift, the mantle plume changes the stress state of the overlying oceanic plate (Fig. S4), resulting in a slight weakening (Fig. S6). The plume head undergoes significant decompression melting near the deflection point (Fig. 4c). However, it is difficult for the small plume to extract molten plume due to the low melt flux (Fig. S4). As the plume cools, partially molten plume gets solidified speedily (Figs. 4d–e and S5). In contrast to the reference model from Sect. 3.1, this model displays most plume material flowing away from the ridge, likely due to dominant plate drag (Fig. 4c–e). Indeed, the left branch of the plume consistently displays larger buoyancy fluxes and maximum velocities than the right side over time (Fig. 4f).
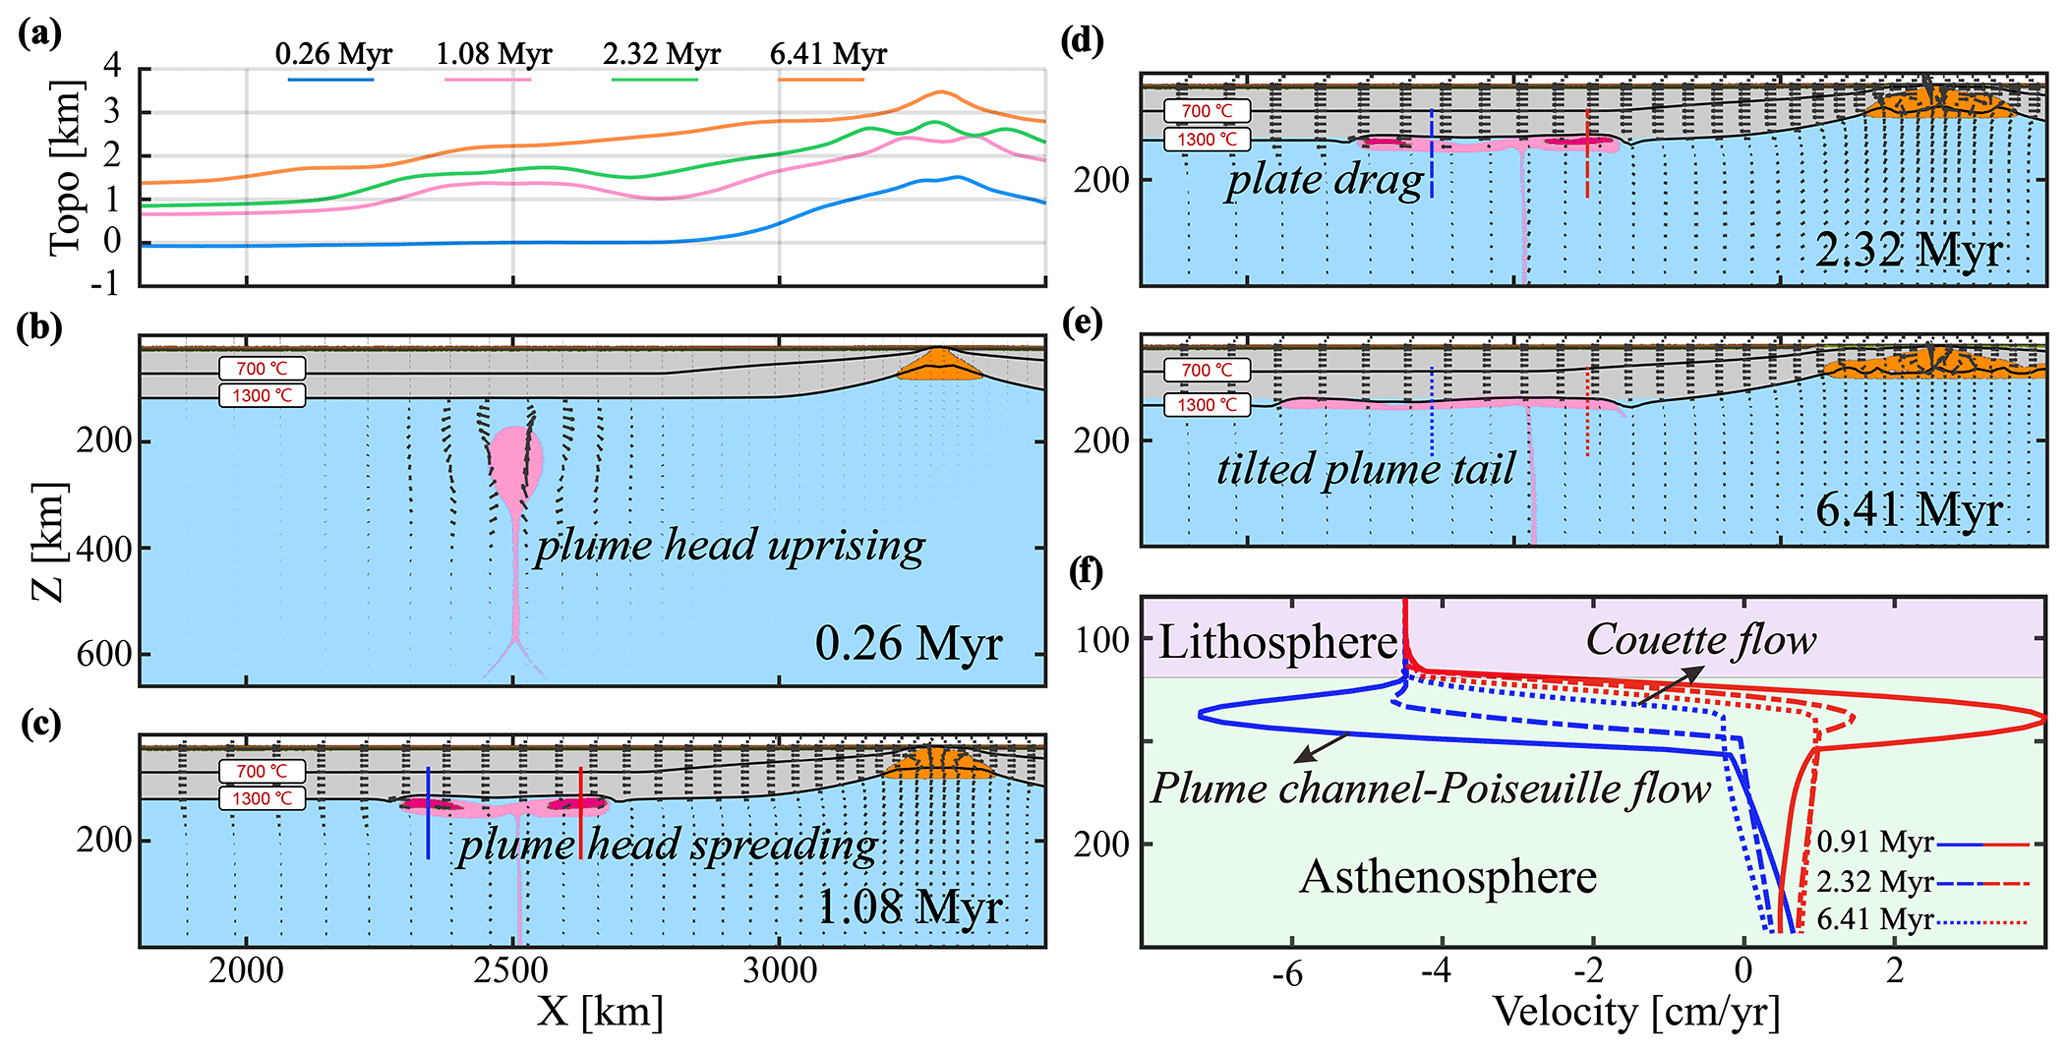
Figure 4Same as Fig. 3 for case M77 (i.e., the reference model for the plate-drag plume flow regime). The main model parameters employed in this case are as follows: half-spreading rate of 45 mm yr−1, an initial plume head radius of 100 km and an off-axis distance of 800 km.
The underlying mechanism for dominant plate-drag plume flow is the frictional shear force of the moving plate, which is further demonstrated by the plume flow velocity profiles (Fig. 4f). In the early plume head stage (∼1.08 Myr), the plume spreads out faster than the plate velocity, which is primarily driven by the overpressure of the ponding plume head at this stage. After a short amount of time (∼2.32 Myr), however, plume spreading becomes significantly slower than plate velocity; hence, plate drag drives and controls the plume flow. Indeed, the flow mode in the asthenosphere rapidly shifts from Poiseuille flow (i.e., active plume flow) to Couette flow (i.e., passive plume flow; Fig. 4f), indicating the increasing role of plate drag in plume flow, soon after an initial plume head spreading.
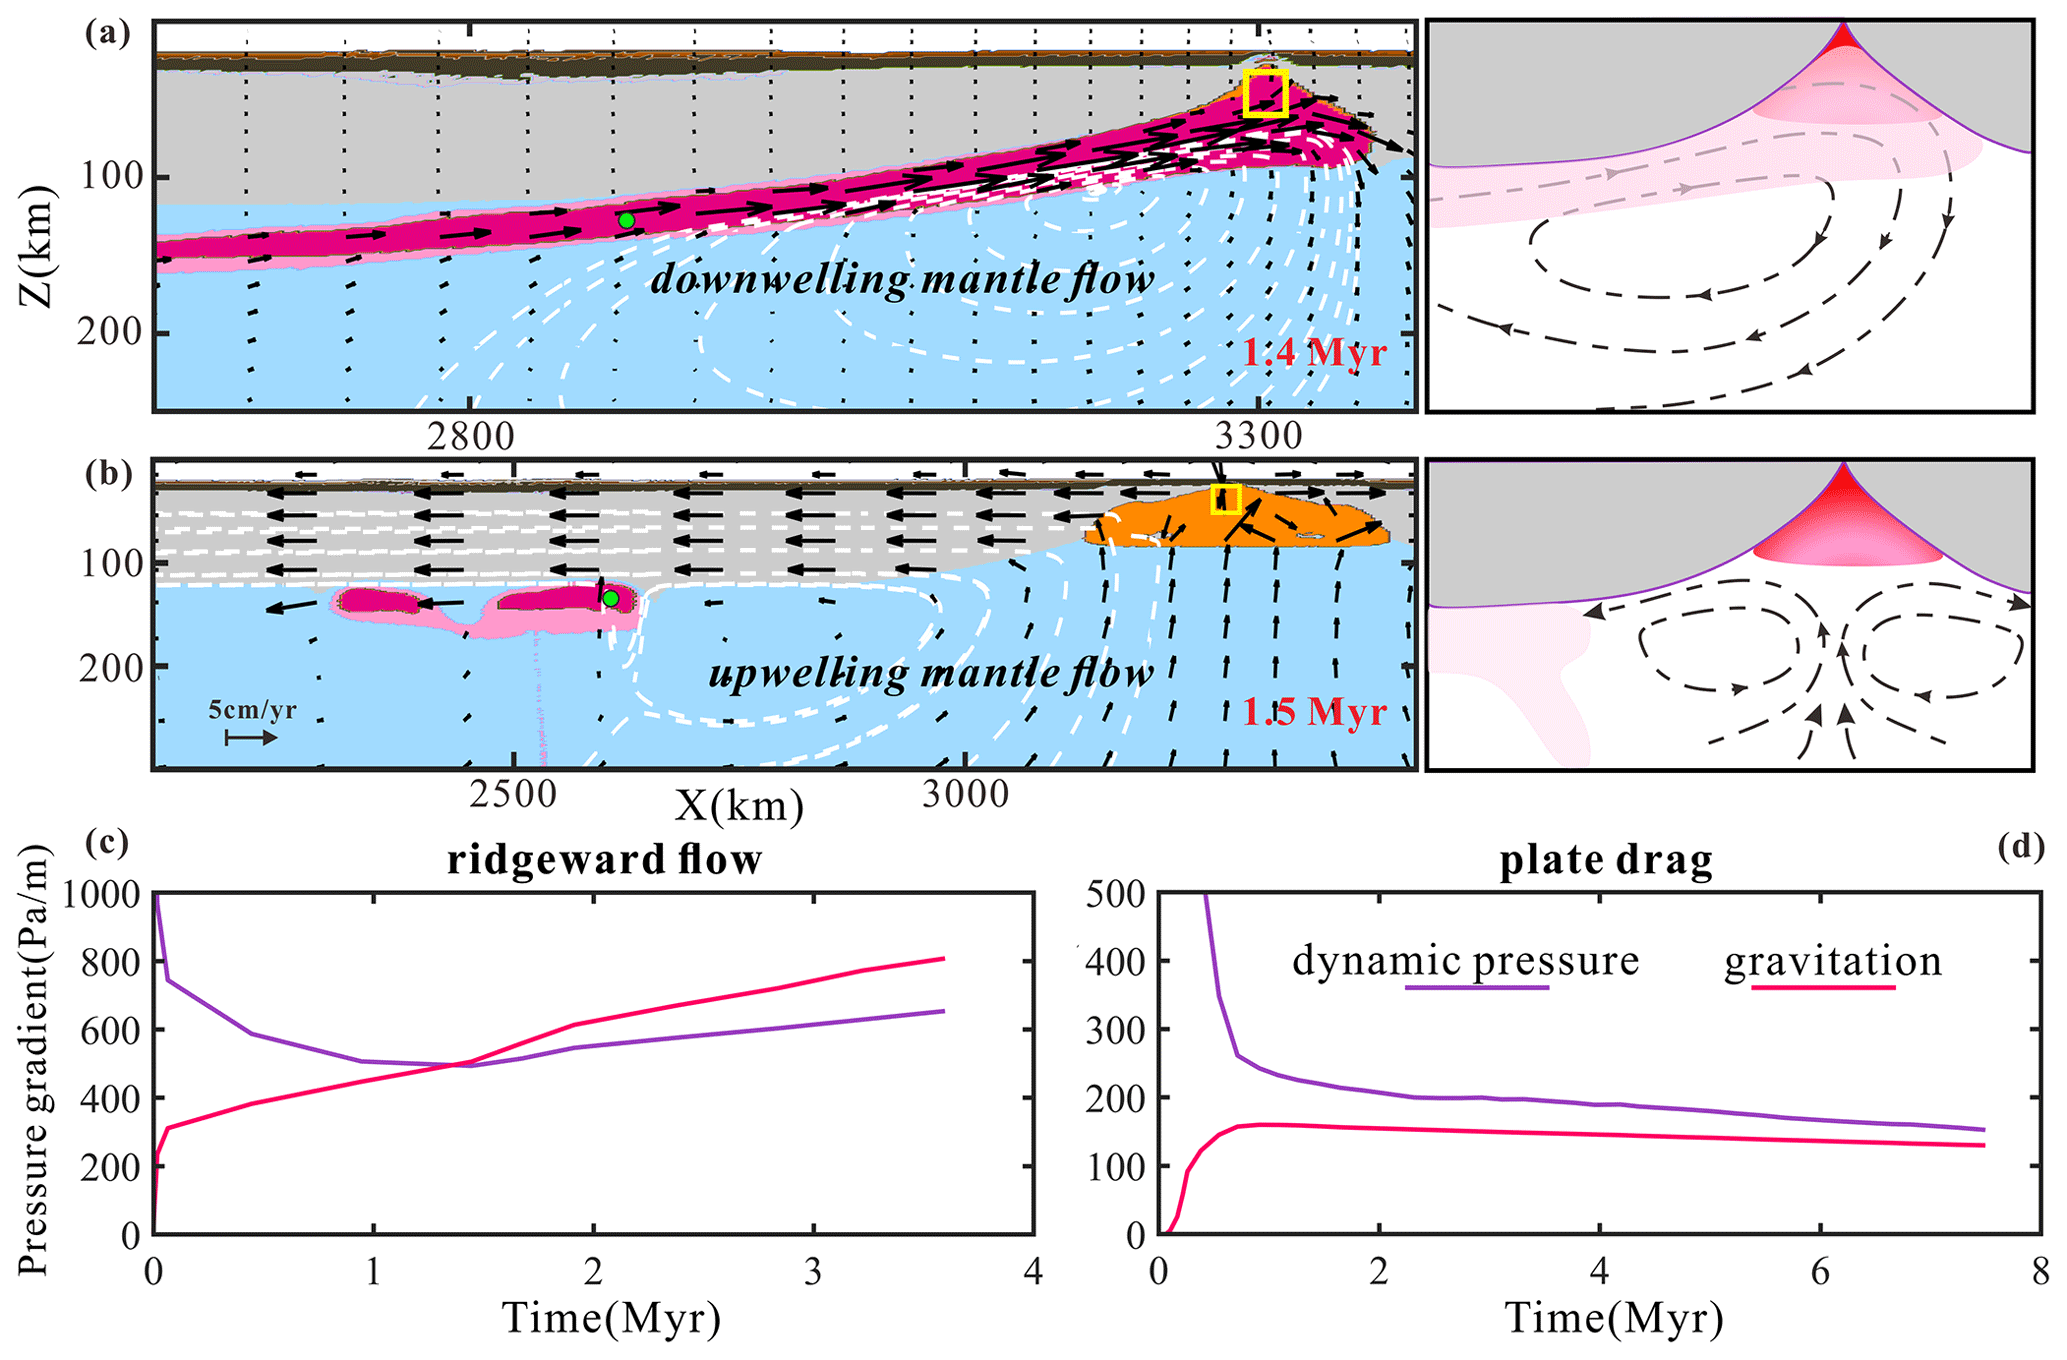
Figure 5Comparison between models with ridgeward vs. plate-drag plume flow. (a) Ridgeward flow with downwelling beneath the MOR (results from case M12, as in Fig. 3). Dashed white lines are streamlines; black arrows visualize the flow field. A schematic of flow is in the sub-panel on the right-hand side. (b) Plate-drag flow with upwelling mantle corner flow beneath the MOR (results from case M77, as in Fig. 4). (c) The dynamic-pressure and gravitational gradient of the plume marker (i.e., green circle in a) over time. (d) The dynamic-pressure and gravitational gradient of the plume marker (i.e., green circle in b) over time. The yellow box marks the location for the computation of average dynamic pressure at the ridge, needed for the calculation of the dynamic-pressure gradient (see text). The (c) and (d) represent the results of ridgeward and plate-drag flow, respectively.
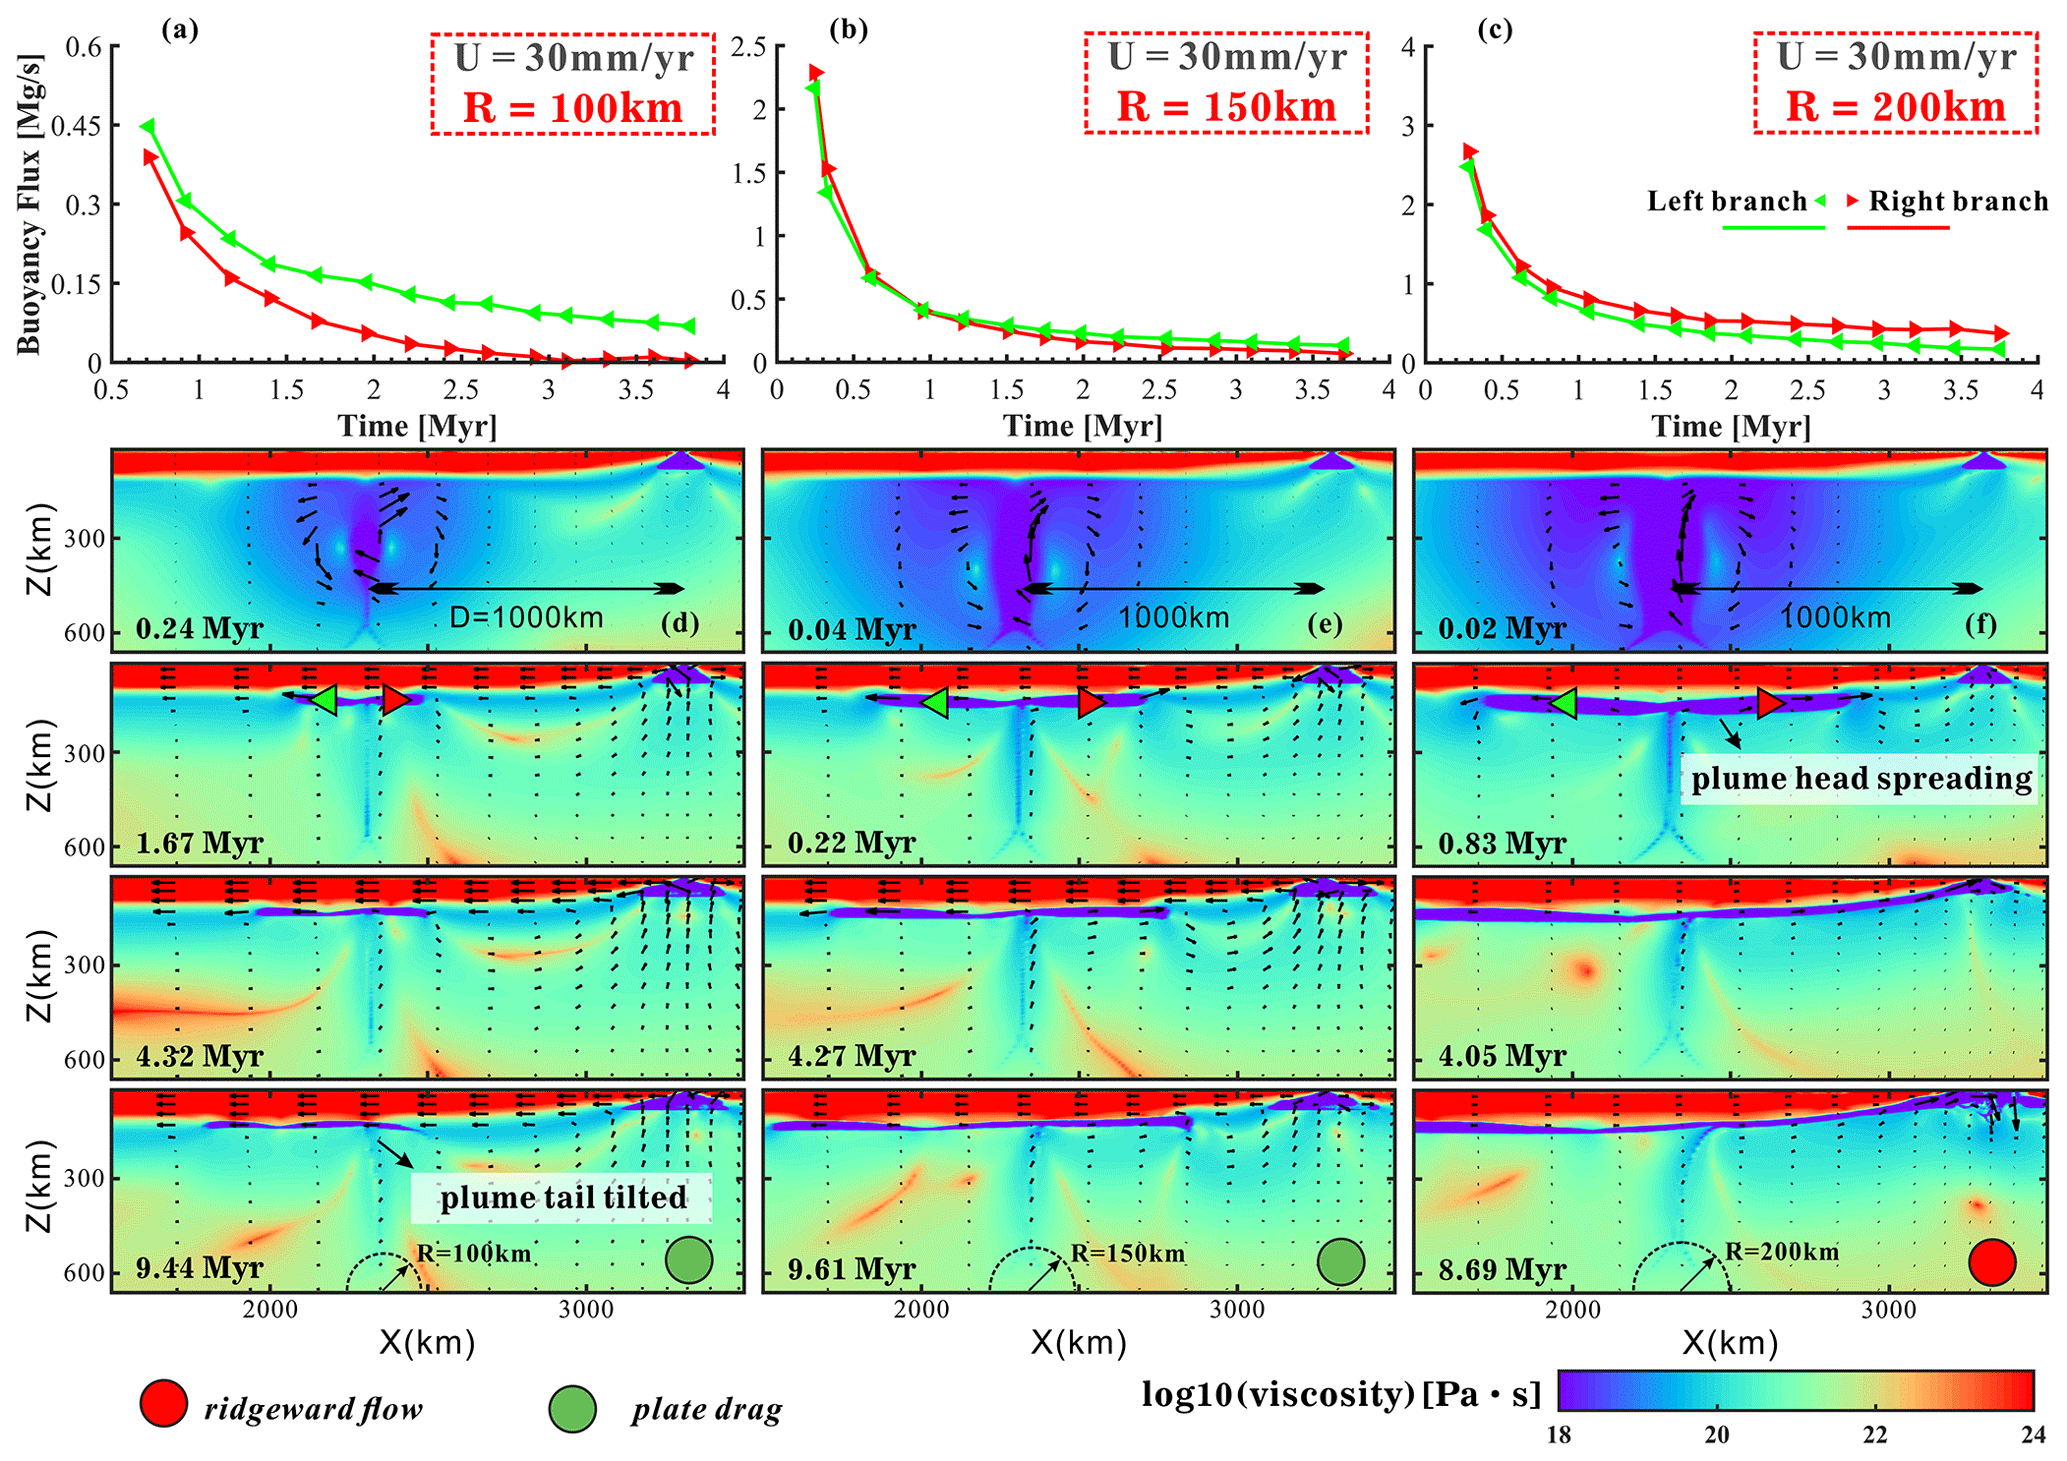
Figure 6Models varying initial plume head radii (model M53, M58 and M63; Table S1) shown by buoyancy flux and viscosity. (a–c) Buoyancy flux in spreading plume branches over time. Green and red triangles are markers used for buoyancy flux calculations for the left and right plume branches, respectively. U and R stand for half of the spreading rate and plume radius. (d–f) Viscosity snapshots of models with different plume head radii. Models with green circles represent plate-drag plume flow, and ridgeward plume flow is represented in red.
3.3 Two modes of plume–lithosphere interaction
The dominant ridgeward and dominant plate-drag plume flow regimes are two distinct modes of plume–plate interaction. The differences between these two regimes are further demonstrated in terms of mantle flow (Fig. 5a, b) and driving forces (Fig. 5c, d).
In the ridgeward-dominated models, a clockwise mantle develops from the plume to the spreading ridge (Fig. 5a). Molten plume material flows to the spreading ridge and occupies the space underneath the ridge axis, sustaining significant asymmetry of mid-ocean ridge melting (Conder et al., 2002). As a consequence of the continuous supply of the plume material, downward mantle flow forms beneath the ridge axis. This flow pattern dramatically differs from that shown in the plate-drag-dominated models, which show upward mantle flow underneath the ridge axis (Fig. 5b), as is typical for the flow beneath a MOR without the influence of a plume.
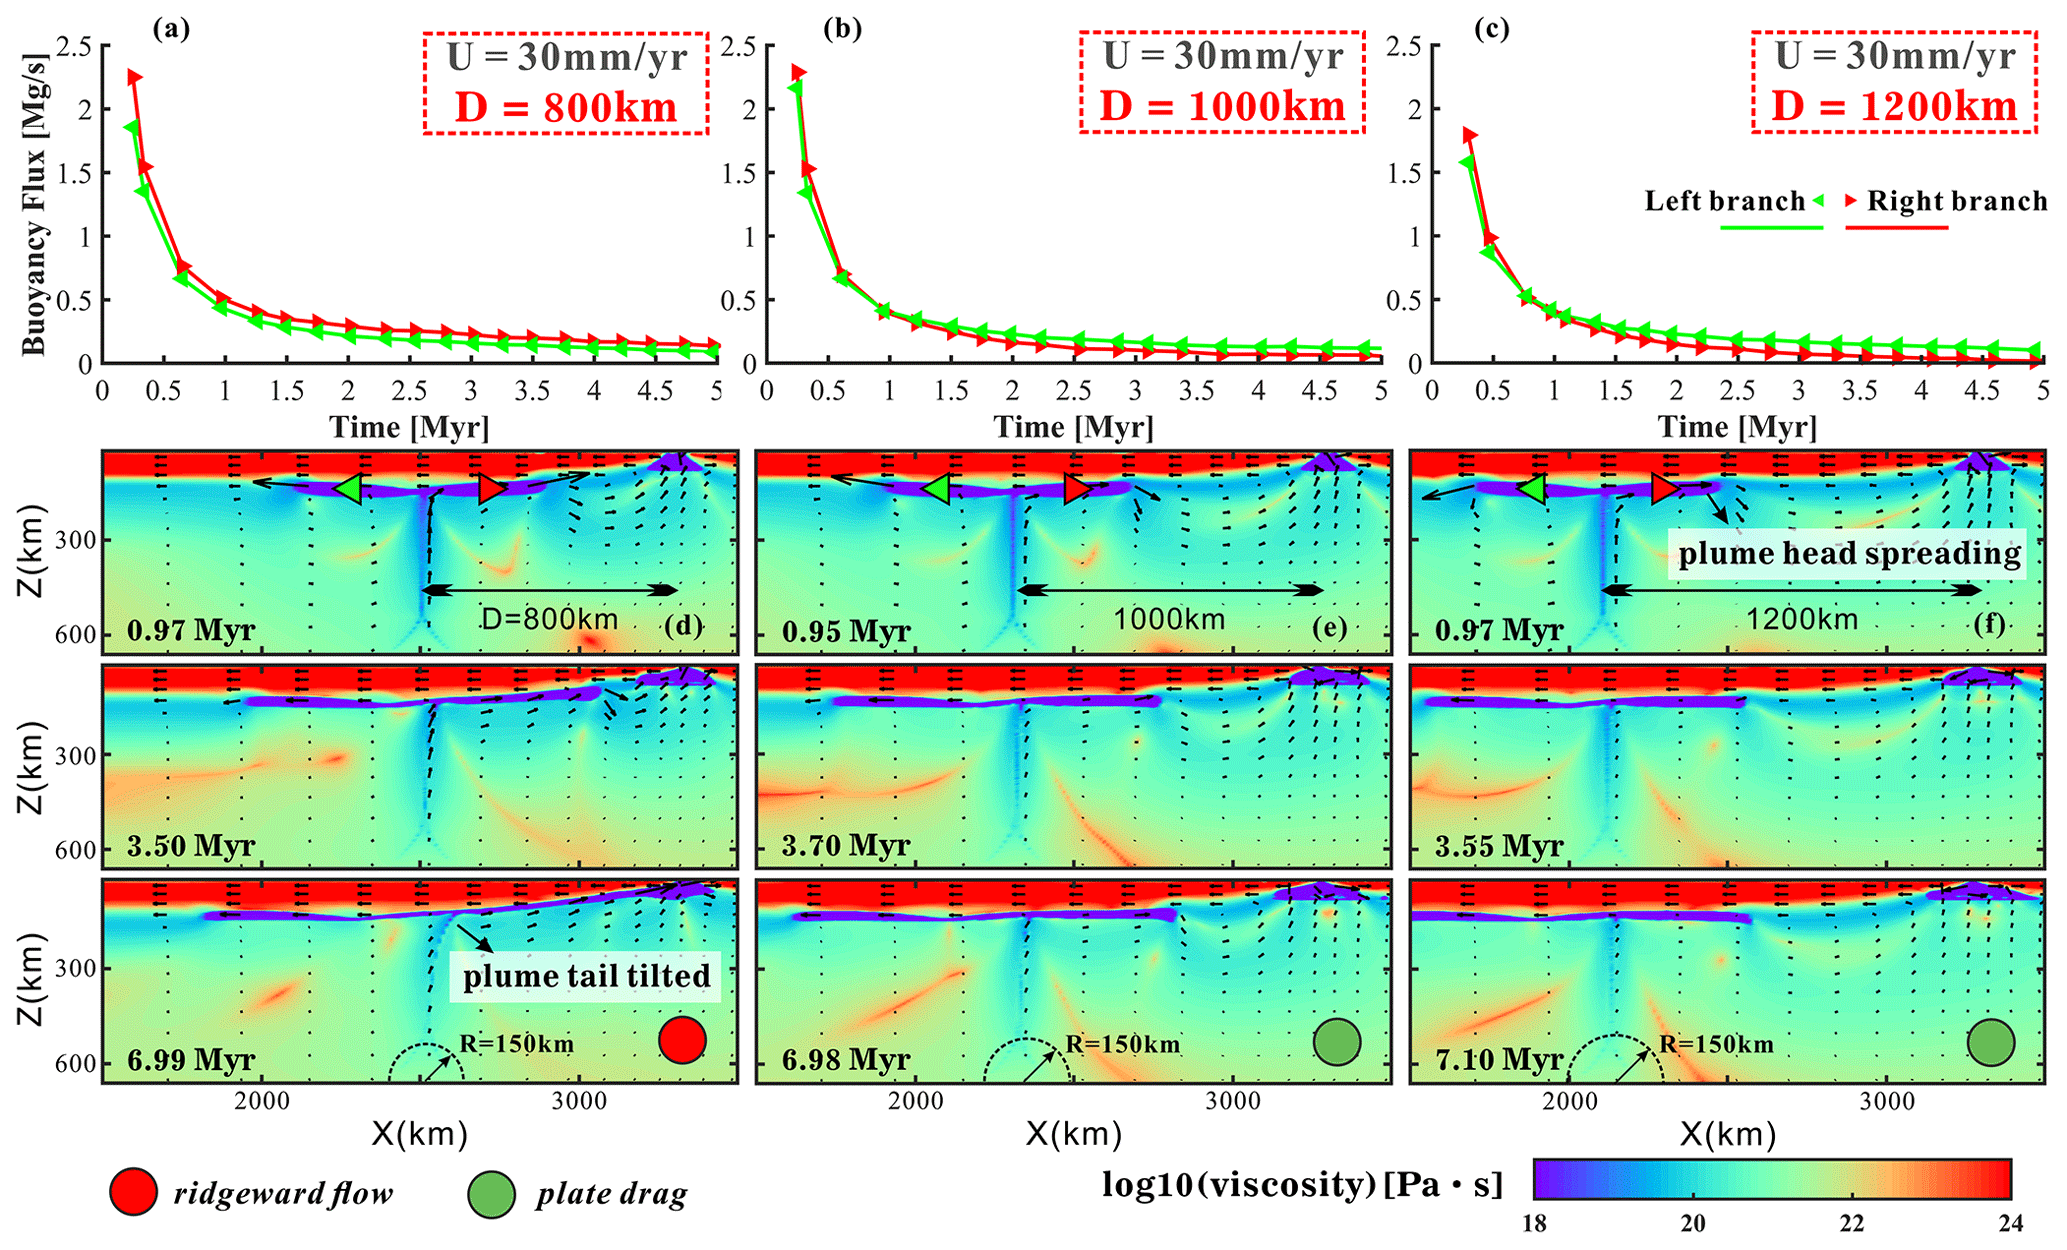
Figure 7Models varying plume–ridge distances (model M57–M59; Table S1) shown by buoyancy flux and viscosity. (a–c) Buoyancy flux in spreading plume branches over time. Green and red triangles are markers used for buoyancy flux calculations for the left and right plume branches, respectively. U and D stand for half of the spreading rate and plume–ridge distance. (d–f) Viscosity snapshots of models with different plume–ridge distances. Models with green circles represent plate-drag plume flow, and the ridgeward plume flow is represented in red.
The distinct modes of plume–ridge interaction (ridgeward vs. plate-drag flow) are controlled by the competition of the tectonic (plate drag, ridge suction) and gravitational (plume buoyancy) driving forces. On the one hand, the moving plate drags sub-lithospheric plume material away from the ridge. On the other hand, the mechanism of ridgeward flow is twofold. First, the buoyant plume material flows along the sloping base of the lithosphere towards the shallow ridge along the gravitational gradient. Second, the plume is driven along the dynamic-pressure gradient from the pressure maximum (e.g., where the plume sustains dynamic topography) towards the pressure minimum beneath the diverging ridge. These gravitational (Ggv) and pressure-driven (Gdp) gradients are calculated by tracing plume markers (Fig. 5c, d) as follows:
where Pmk is the dynamic pressure of the plume marker, and Pr is the averaged pressure in a 50 km box at the ridge center (Fig. 5b); L is the horizontal distance from the plume marker to the ridge axis; ρmk and ρ0 are the plume marker density and initial density, respectively; g is the gravitational acceleration; k is the local slope of the base of the lithosphere.
In the early stage of model evolution, the plume head's dynamic overpressure is dominant, driving plume spreading in both directions (Fig. 5c, d), particularly in the direction of the low-pressure ridge. However, this pressure gradient systematically diminishes over time as the plume (head) spreads. Once the spreading plume approaches the ridge, the lithospheric slope increases. At some point, the gravitational gradient exceeds the dynamic-pressure gradient, taking over as the major driving force of guiding plume material towards the ridge. However, for low-flux plumes, the dynamic pressure and gravitation are not enough to support the flow to the ridge. Consequently, one of the essential conditions for plume–ridge interaction is that the plume must be able to reach the critical zone near the ridge, where the slope is sufficiently steep to take over for the ever-diminishing pressure gradient. This implies (1) that the plume buoyancy must overcome the shearing force of plate drag and (2) that the pressure gradient must be sustained long enough to reach the critical zone, in which the gravitational gradient can take over. It is noted that (1) shearing force scales with the rate of ridge spreading, and (2) the plume with high buoyancy flux is more likely to reach the critical region at a given plume–ridge distance.
3.4 Influence of model parameters
We have systematically investigated the effect of the three main model parameters (i.e., the spreading rate of the mid-ocean ridge, initial plume head radius and plume–ridge distance) on plume–ridge interaction. We explored half-spreading rates of the ridge of 8, 15, 30 and 45 mm yr−1, corresponding to ultra-slow-, slow-, medium- and fast-spreading mid-ocean ridges, respectively (Gerya, 2012). We varied initial plume head radii in the range of 100 to 300 km. Further, we tested plume–ridge distance in the range of 600 to 1400 km.
3.4.1 Plume head radius
The size of the buoyant plume exerts an important control over plume–ridge interaction. Small plumes tend to be dragged away from the ridge, with typically larger lateral fluxes of the spreading plume in the left branch than in the right branch (Fig. 6a, b). The buoyancy flux, defined as the integral over a horizontal plane of the product of the vertical velocity and the density deficit within the plume, in each branch is calculated by multiplying the velocity of the markers in the plume pipe (Fig. 6d–f) by the density. The dynamic pressure decreases with decreasing plume size (Fig. S8a), and the pressures gradient is thus not strong enough for small plumes to reach the ridge. Plate shearing dominates plume flow soon after plume head spreading, and the moving plate then drags plume head material, leaving a tilted plume tail (Fig. 6d). In contrast, with larger initial plume head radius or buoyancy flux, the ponding plume spreads more vigorously (Fig. 6c) and sustains much higher overpressures at the base of the plate (Fig. S8a). This vigorous spreading can overcome plate drag to drive Poiseuille flow in both directions. Once the right plume branch approaches the spreading center, it is attracted and further accelerated by ridge suction. The plume tail is also markedly tilted towards the ridge axis due to asymmetric spreading (Fig. 6f). The larger the plume is, the more plume material gets entrained by the spreading center.
3.4.2 Plume–ridge distance
Plume–ridge distance also controls the regime of plume–ridge interaction. A plume at large distances spreads similarly to a plume at a small distance but is less likely to get affected by ridge suction (Fig. 7). The pressure gradient between the plume and ridge drives the ridgeward plume flow. However, the larger the plume–ridge distance, the smaller the pressure gradient would be (Fig. S8b), resulting in a lower buoyancy flux across the plume pipe (Fig. 7a–c). In the cases of distant plumes, the spreading of the plume head is strongly affected by plate drag (Fig. 7b, c).
3.4.3 Half-spreading rate of ridge
Another parameter that is worth investigating is the spreading rate of the ridge. The modeling results indicate that fast-spreading ridges promote plume flow away from the ridge due to the friction (Figs. 8 and 9a). With increasing spreading rate, the effect of plate shearing on plume–lithosphere interaction increases, as quantified by the spreading fraction. The spreading fraction γ (Eq. 14) is defined here as the ratio of ridgeward vs. plate-drag plume volume fluxes. We integrated the ridgeward plume volume flux (right branch), Vrw, and the plate-drag plume volume flux (left branch), Vtw. Vp is the total plume volume flux in the model. Ridgeward plume spreading is dominant for positive γ; plate-drag plume spreading is dominant for negative γ.
In the early stage (∼1 Myr), pressure-driven flow dominates in all models, and spreading fractions are positive, mainly driven by the expansion of the overpressured plume heads along the pressure gradient. After a certain time, the spreading fractions decrease dramatically with the decay of the mantle plume activity, representing the transition from the ridgeward to the plate-drag regime in some cases. The characteristic spreading fractions after an 8 Myr model time as a function of our model parameters are shown in Fig. 8. This compilation of our results reveals that the dominance of ridgeward flow decreases with increasing spreading rate and off-axis distance but significantly increases with plume size. For models with fast-spreading ridges, the parameter range of plate-drag flow-dominated models is expanded, indicating the critical role of plate drag in restricting ridgeward flow and plume–ridge interaction.
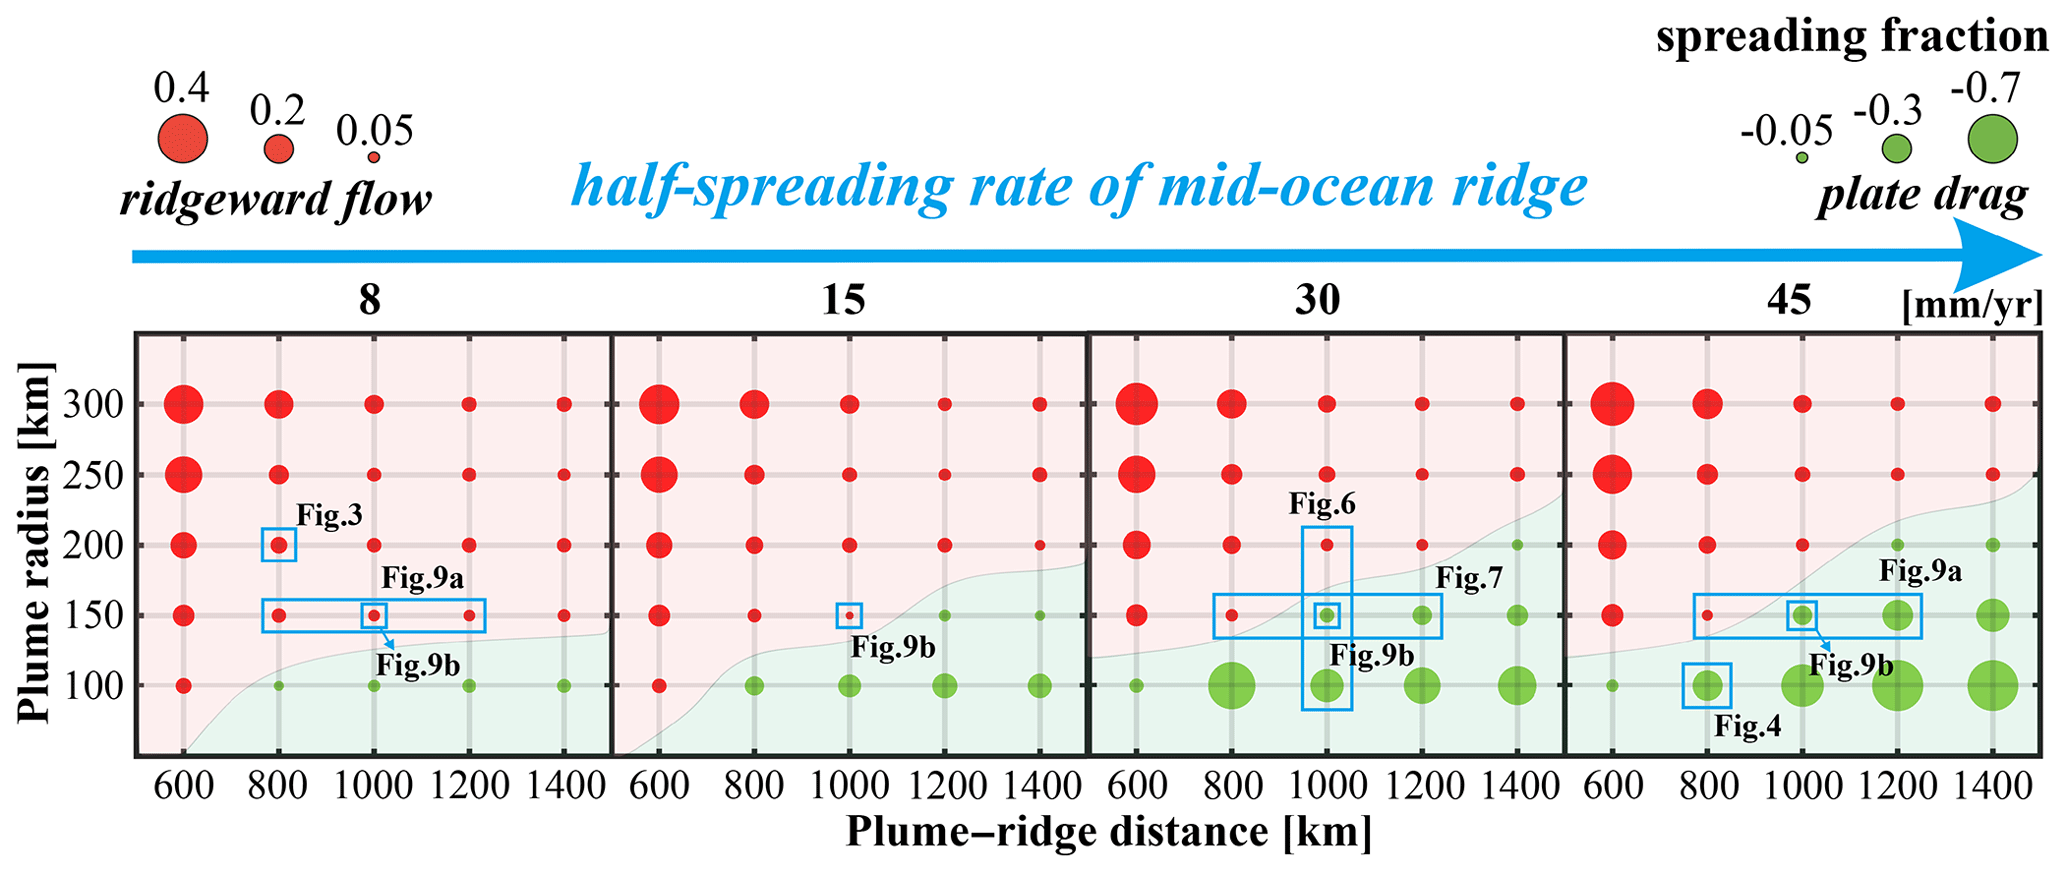
Figure 8Parameter regime diagram of the contrasting modes of plume–ridge interaction. Spreading fractions γ (Eq. 14) at an ∼8 Myr model time. Each of the circles represents one of the numerical experiments, and sizes refer to γ. Circles in red and green represent models with dominant ridgeward plume flow and plate drag, respectively.
The transition from ridgeward (positive γ) to plate-drag (negative γ) flow in some of our cases is mainly determined by the competition between the effects of pressure-driven plume head spreading and plate shearing. The overpressure in the plume head drives plume materials towards the lower-pressure spreading center, while the moving plate shears plume away. Hence, we quantify the shear force of the overriding oceanic plate on the plume head using an integral approach:
Equation (15) is employed to calculate the shear force, where Fs is the total shear force the spreading oceanic plate exerts on the uppermost part of the plume. σxz is the shear stress on each mantle plume grid cell, and A refers to the area of each grid cell. The pressure gradients, both gravitational and dynamic pressure, are calculated by tracing the plume markers according to Eqs. (12)–(13). As the plume material rises to the base of the lithosphere, the shear force exerted by the plate increases over time. We find that the integrated shear force between the spreading plate and the plume increases significantly as half-spreading rate increases (Fig. 9c).
Conversely, ridge-spreading rates control gravitational and pressure-driven plume driving forces (Fig. 9d). Increasing the spreading rate of the ridge implies a smaller dynamic-pressure gradient because the pressure gradient is related to the plate thickness difference at the ridge and plume, which is dependent on the spreading rate. A fast-spreading ridge also implies a smaller gravitational gradient because it leaves a more shallowly dipping lithospheric base. Thus, relatively strong plate shearing combined with relatively small pressure and gravitational gradients tend to advance plate-drag plume flow for high spreading rates.
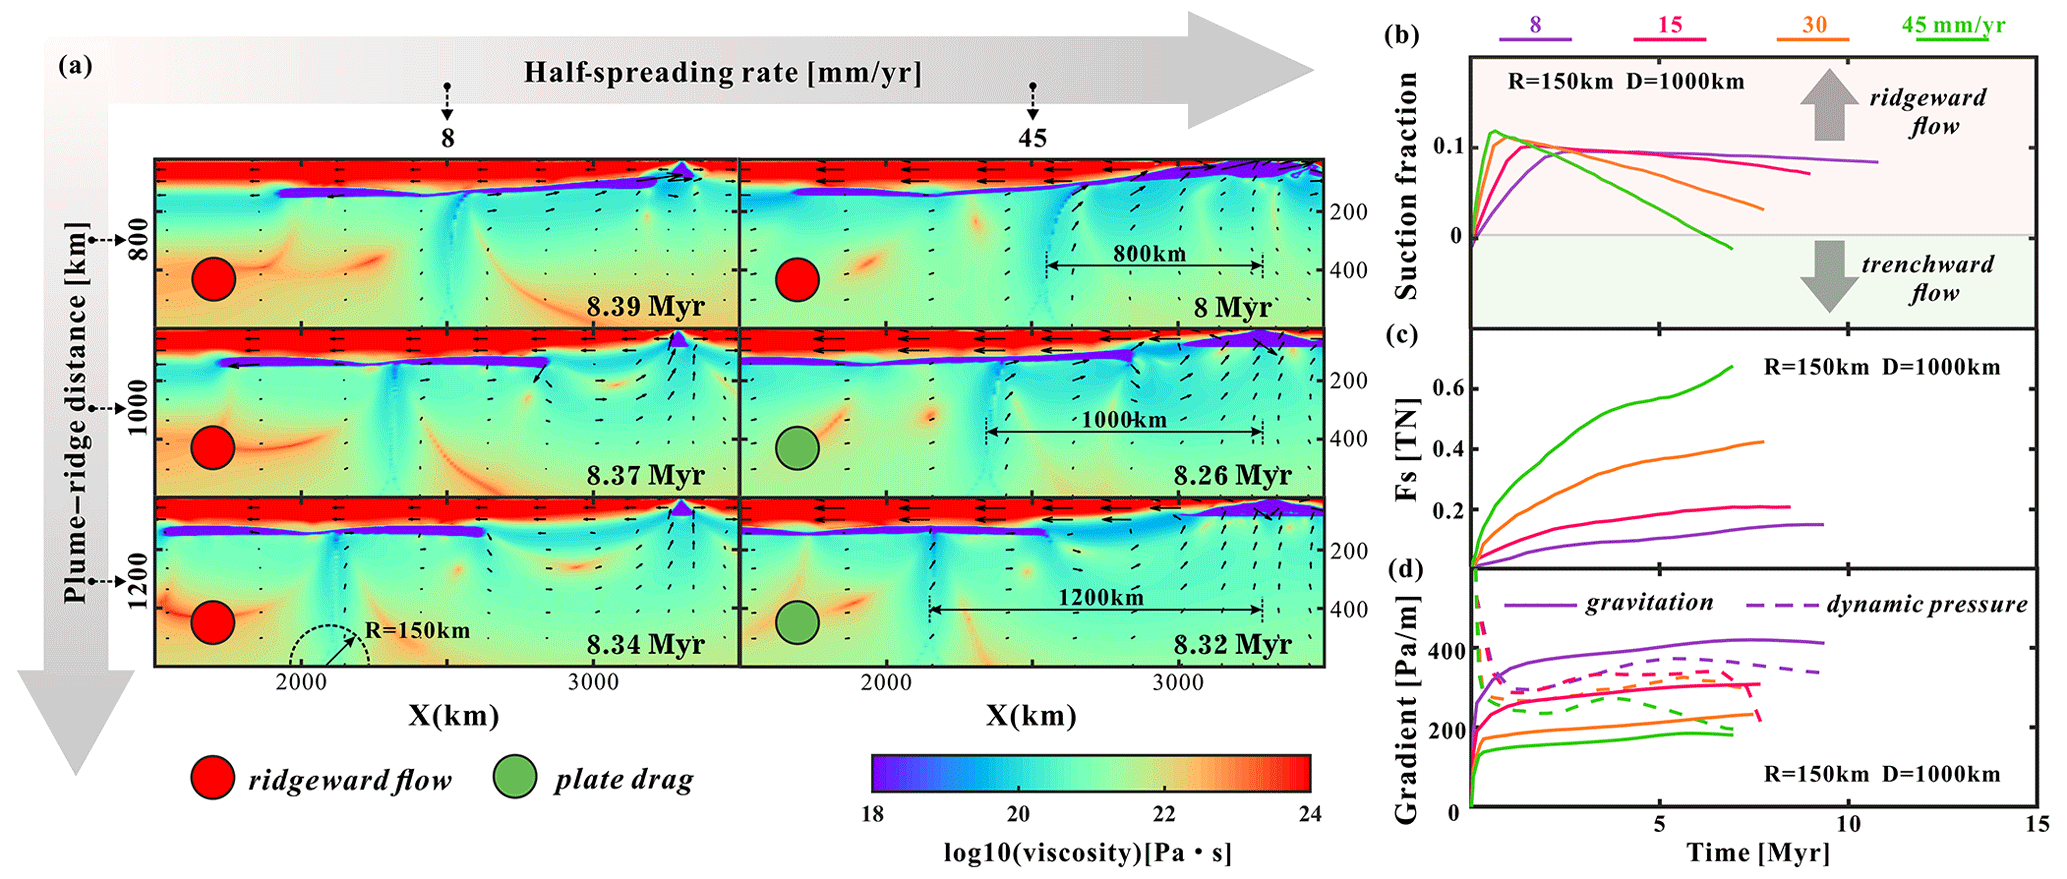
Figure 9Model results influenced by different half-spreading rates. (a) Effect of half-spreading rate and plume–ridge distance on ridgeward vs plate-drag. Viscosity snapshots are shown (models M7–M9, M82–M84; Table S1). The fast-spreading ridge promotes the dragging of plume material near the ridge. Models with green circles represent plate-drag plume flow, and ridgeward plume flow is represented in red. (b) Dynamic evolutions of ridgeward and plate-drag plume flow, revealed by defined ridge-spreading fraction (Eq. 14). (c) Shear force (Fs) between moving-plate and plume material under different spreading rates. (d) Pressure gradient between plume head and ridge center in different half-spreading rate models. The solid and dashed lines are the plume gravitation and dynamic-pressure gradient, respectively. R and D stand for half of the plume radius and plume–ridge distance.
Natural observations show that there are only very few hotspots indicative of ridgeward plume flow close to the East Pacific Rise (EPR; Fig. 10a) in contrast to many such hotspots in the Atlantic and Indian oceans. A previous study (Jellinek et al., 2003) proposed that fast-spreading ridges such as the EPR efficiently convey any surrounding plumes into the spreading center from the deep mantle (Fig. 1c), which leads to fewer hotspots nearby fast-spreading ridges. However, based on our modeling results, fast-spreading ridges tend to promote plate-drag flow of the spreading plume material, providing an alternative explanation to the relative absence of hotspots along the EPR. We discuss the possibility of this potential explanation combined with geological and geophysical observations (Fig. 10).
Firstly, the plate-drag effect of fast-spreading ridges on plumes is evidenced by geophysical observations. We locate the positions of the mantle plumes at the core-mantle boundary (CMB) and the associated hotspots on the surface based on global seismic tomography (Jackson et al., 2021; Koppers et al., 2021). A lateral offset between the deep and surface positions of plumes is a common feature, indicating the deflection of plumes due to mantle flow. Specifically, a large portion of (7 of 14) plumes located in the Atlantic are tilted towards the mid-ocean ridge. However, only very few plumes (6 of 16) in the Pacific are tilted towards the mid-ocean ridge. Indeed, the majority of plumes are tilted away from the ridges, indicating the significant effect of plate drag on plumes beneath fast plates. Such observations are consistent with the predictions of our models with dominant plate-drag plume spreading.
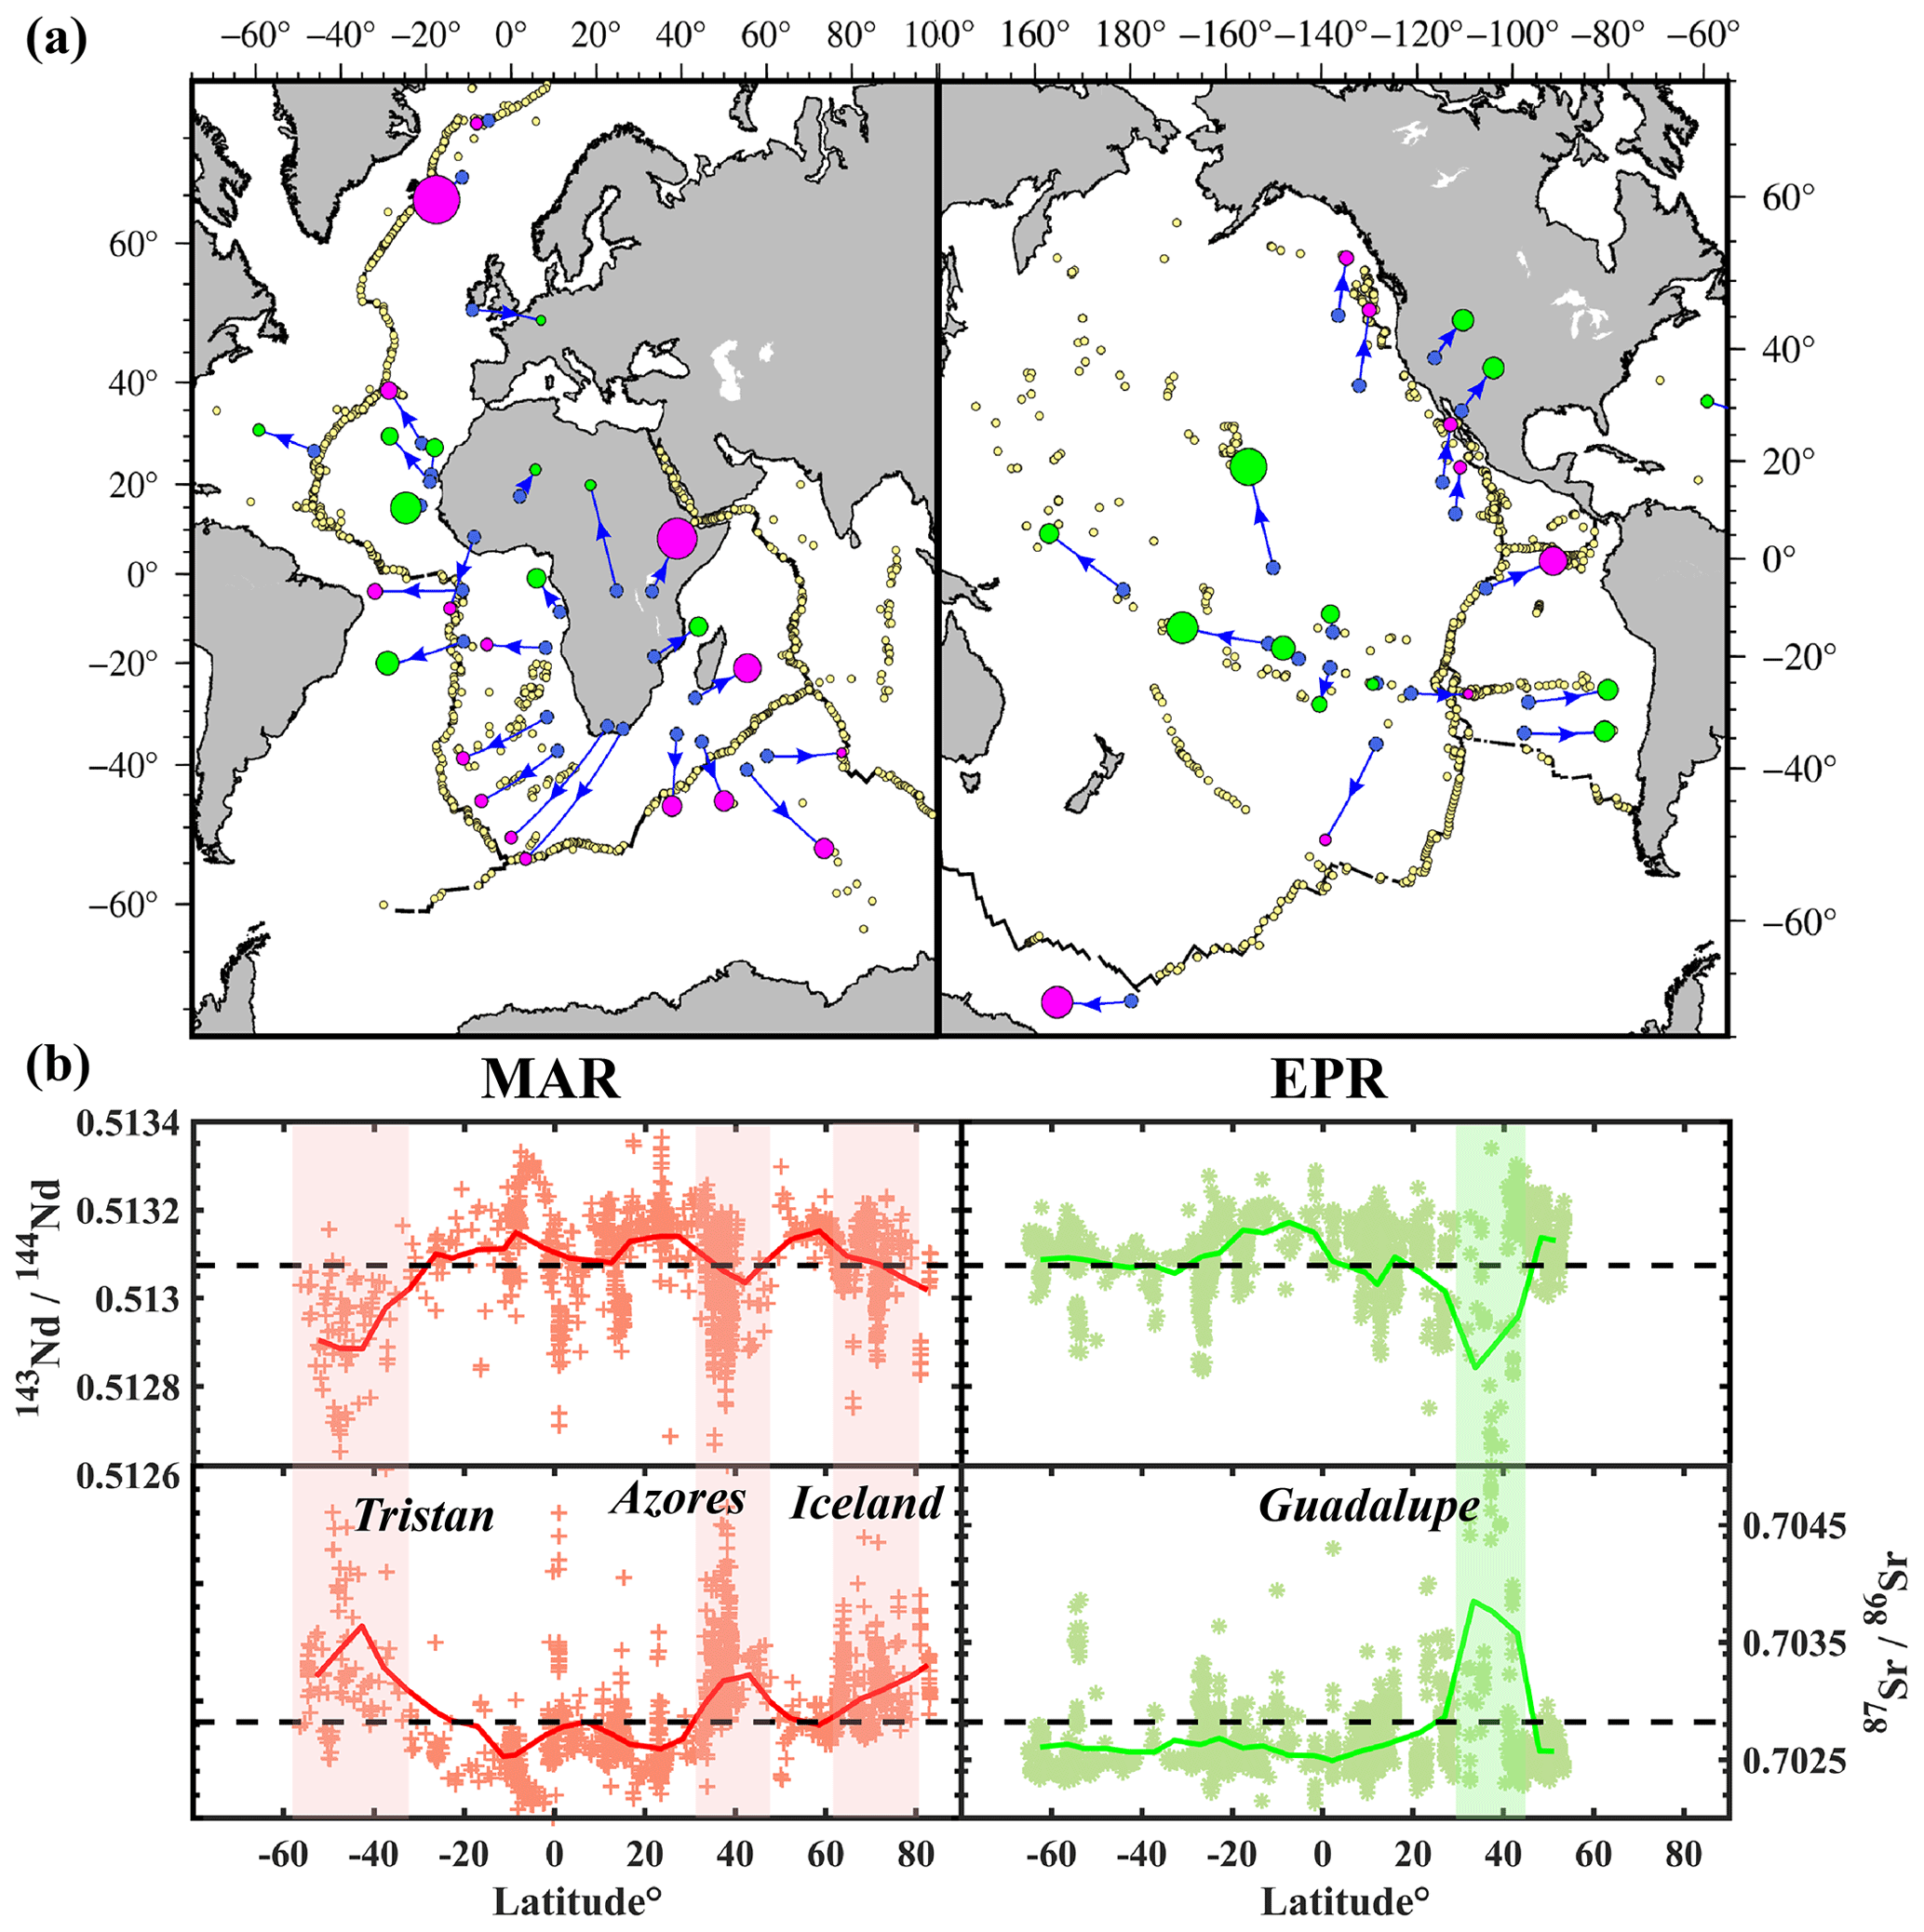
Figure 10A compilation of hotspots along with spreading ridges in the Atlantic and the Pacific. (a) Distribution of surface hotspots (circles) together with depth-projected source locations at CMB (blue dots) of the plumes based on Jackson et al. (2021). Plumes in magenta circles are mantle plumes interacting with ridges (Ito et al., 2003), and plumes not interacting with ridges are shown as green circles, whose size refers to the plume buoyancy flux (Hoggard et al., 2020). Blue arrows indicate the changes in the position of the plume at the top and bottom of the mantle. Yellow dots are MORB samples mapped in (b). (b) Plot of radioactive isotope ratios along ridge MORB samples. The data are downloaded from the PetDB database (http://portal.earthchem.org/, last access: 23 August 2021). The colored symbols refer to samples in different mid-ocean ridges. Main hotspots influencing MORBs are labeled with shaded bands. The dashed black lines are the mean MORB isotopes ratio from Gale (2013). Red and green lines are the mean ratios of the samples in the Mid-Atlantic Ridge and EPR, respectively.
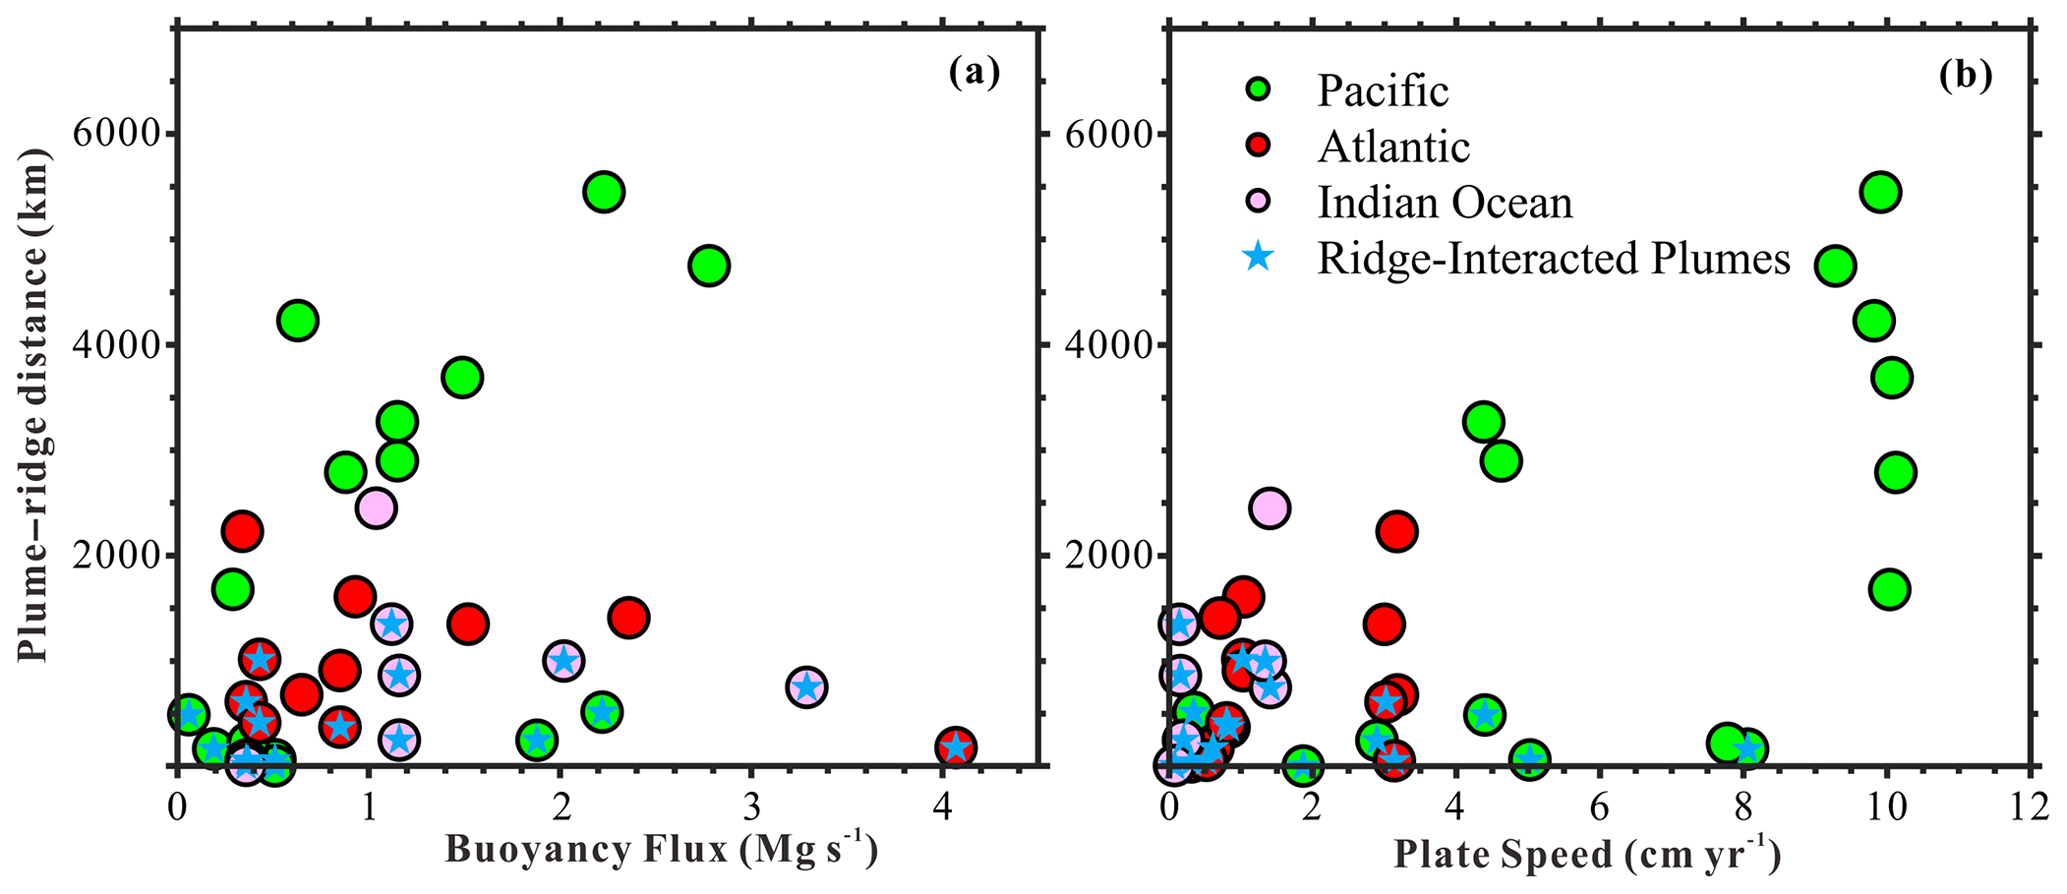
Figure 11Buoyancy flux, plate speed and plume–ridge distance of mantle plumes in different oceans. Mantle plumes in the Pacific, Atlantic and Indian oceans are shown in green, red and pink circles, respectively. Blue stars mark the ridge-interacted plumes according to Ito et al. (2003). (a) Plot of plume–ridge distance and plume buoyancy flux. Data are from Hoggard et al. (2020). (b) Plot of plume–ridge distance and plate speed at the location of plumes. Plume–ridge distance comes from GPlates (Müller et al., 2016; Whittaker et al., 2015), and plate speed data come from Becker et al. (2015).
Geochemical studies suggest that mantle plumes are enriched in light rare-earth elements (LREEs) and radiogenic isotopes of Sr and Pb but depleted in Nd isotopes. These geochemical anomalies are evident in MORB (mid-ocean-ridge basalt) at the sites of active plume–ridge interaction (Cushman et al., 2004; Douglass et al., 1999; Yang et al., 2017). We find that MORB sampled along both the Mid-Atlantic Ridge and the EPR indeed display geochemical anomalies (Fig. 10b), indicating ridgeward flow of plume material at specific locations. However, the Mid-Atlantic MORB dataset is slightly more heterogeneous than the East Pacific Rise in terms of geochemical isotopes. The EPR is basically characterized as normal oceanic basalt, along which only very few regions showing composition associated with nearby plumes. This contradicts the view (Jellinek et al., 2003) that mantle plumes are fully entrained into the central MOR melting zone at fast-spreading ridges.
Based on our modeling results, initial plume head radius and plume–ridge distance also control the mode of plume–ridge interaction. However, for different buoyancy fluxes B, there is only a small difference in the proportion of interacting plumes to non-interacting plumes. A small majority of major plumes (5 out of 8 with B>1.6 Mg s−1) and a small minority of small-to-intermediate plumes (11 out of 25 for B<1.6 Mg s−1) display interaction with the ridge (Fig. 11a). The underlying cause for this observation remains unclear but may be related to the distribution of large plumes globally, with many of them being located very far from MORs. Also note that our 2D models are limited in that plume material cannot spread in the out-of-plane direction, hence somewhat exaggerating the effects of buoyancy flux. In any case, the distribution of observed plume buoyancy fluxes (Hoggard et al., 2020) varies little across different oceans (Fig. 11a). Therefore, the effects of plume size are not a good candidate to explain the notable difference between the Atlantic and Pacific in terms of plume–ridge interaction mode.
On the other hand, compared with the Atlantic and Indian oceans, Pacific plumes are located significantly further from the mid-ocean ridge (Fig. 11b). Plume–ridge distances in the Pacific are mostly >2000 km, which exceeds the maximum plume–ridge interaction distance of 1400 km (Schilling, 1991). Most plumes in the Pacific exhibit the typical signatures of plume flow away from the ridge, such as parabolic swell shapes (e.g., Society, Marquesas and Hawaii plumes; Ballmer et al., 2013a; Ballmer et al., 2015; Cheng et al., 2015; Wolfe et al., 2009) and linear volcanic chains (Buff et al., 2021; Clouard and Bonneville, 2005; Jackson et al., 2010). Age-progressive hotspot trails indicate an absence of dominant ridgeward flow. By contrast, most plumes in the Atlantic have been close to the ridge since the opening of the ocean. These mantle plumes (e.g., Discovery, Iceland and Tristan–Gough plumes; O'Connor et al., 2012) have not moved much since the breakup of the Atlantic. One factor may be that the underlying plume-generation zone (i.e., the edge of the African LLSVP) round largely parallel to the Mid-Atlantic Ridge (Fig. 1) (Torsvik et al., 2006). In this case, plume–ridge distance may play a critical role in the plume–ridge interaction and could explain the striking difference between the Pacific and Atlantic in terms of the proportion of plume–ridge-interacting vs. non-interacting systems. In addition, the rapid movement of the Pacific plate tends to inhibit ridgeward plume flow at a given plume–ridge distance. The distribution of interacting (stars) vs non-interacting systems in Fig. 11b is almost exactly as predicted by our models for the coupled effects of plume–ridge distance and plate velocity. For example, we note that fast-spreading ridges can still interact with adjacent plumes under the appropriate conditions. In the case of very short plume–ridge distances, there is good evidence of plume–ridge interaction in the southern Pacific Ocean (e.g., Louisville plume; Conder et al., 2002; Toomey et al., 2002; Vlastélic and Dosso, 2005). Based on a series of numerical modeling, as well as geological and geophysical observations, we conclude that mantle plumes in the Pacific are more likely to spread away from the ridge and into the direction of plate motion than in the Atlantic and Indian oceans. However, the tendency of fast plate velocities to promote plume spreading away from the MOR through viscous drag may depend on the details of lithosphere–asthenosphere rheological coupling, such as the presence of a weak decoupling (e.g., melt) layer (Rychert et al., 2020). Further studies of plume spreading and plume–ridge interaction are needed to shed light on the coupling of the plate-mantle system.
In this study, we explore the evolution of plume–ridge interaction with 2D thermomechanical numerical models. Based on model results, we find the following:
-
Plume–ridge interaction is mainly governed by the competition between the effects of plume spreading (overpressure in the plume head stage), upward gravitationally driven flow of the plume along the base of the sloping lithosphere and plate shearing. These driving forces are controlled by plume size, plume–ridge distance and the spreading rate of the mid-ocean ridge.
-
MOR spreading does not only draw upwelling plumes into the spreading center but also tends to drag mantle plumes away from the ridge. Plume flow away from the ridge is favored by small and/or distant plumes, as well as by fast spreading rates, whereas plume flow towards the ridge is promoted by large and/or nearby plumes, as well as by slow spreading rates.
-
Considering the high plate velocity and typically large plume–ridge distances, mantle plumes in the Pacific are more likely to be dragged away from the EPR than they are to be drawn towards the ridge center.
The source numerical modeling code in this study is available from the corresponding author upon reasonable request. Requests for the numerical code I2VIS should be sent to the main developer (taras.gerya@erdw.ethz.ch).
All related data of the numerical models are provided in Zenodo (https://doi.org/10.5281/zenodo.7688200, Pang and Liao, 2023).
The supplement related to this article is available online at: https://doi.org/10.5194/se-14-353-2023-supplement.
FP performed all numerical models, interpreted results and wrote the paper. JL proposed the study, modified the code and contributed to the rewriting and scientific discussion. MDB contributed with significant help in the rewriting and scientific discussion. LL participated in the discussion and interpretations. All authors have read and edited draft versions of the paper and have approved the final version.
The contact author has declared that none of the authors has any competing interests.
Publisher’s note: Copernicus Publications remains neutral with regard to jurisdictional claims in published maps and institutional affiliations.
This research is financially supported by NSFC projects (project nos. U1901214, 41974104 and 91855208) and Guangdong project no. 2017ZT07Z066. We are grateful to Taras Gerya for his long-lasting guidance on our geodynamical modeling. We gratefully acknowledge Hongjian Fang for the insightful discussions. Numerical simulations were performed on the clusters of the National Supercomputer Center in Guangzhou (Tianhe-II).
This research has been supported by the NSFC (project nos. U1901214, 41974104, and 91855208) and Guangdong project no. 2017ZT07Z066.
This paper was edited by Taras Gerya and reviewed by three anonymous referees.
Ballmer, M. D., Ito, G., Wolfe, C. J., and Solomon, S. C.: Double layering of a thermochemical plume in the upper mantle beneath Hawaii, Earth Planet. Sc. Lett., 376, 155–164, https://doi.org/10.1016/j.epsl.2013.06.022, 2013a.
Ballmer, M. D., Conrad, C. P., Smith, E. I., and Harmon, N.: Non-hotspot volcano chains produced by migration of shear-driven upwelling toward the East Pacific Rise, Geology, 41, 479–482, https://doi.org/10.1130/G33804.1, 2013b.
Ballmer, M. D., Ito, G., and Cheng, C.: Asymmetric dynamical behavior of thermochemical plumes and implications for hawaiian lava composition, Geophys. Monogr. Ser., 208, 35–57, https://doi.org/10.1002/9781118872079.ch3, 2015.
Barruol, G., Sigloch, K., Scholz, J. R., Mazzullo, A., Stutzmann, E., Montagner, J. P., Kiselev, S., Fontaine, F. R., Michon, L., Deplus, C., and Dyment, J.: Large-scale flow of Indian Ocean asthenosphere driven by Réunion plume, Nat. Geosci., 12, 1043–1049, https://doi.org/10.1038/s41561-019-0479-3, 2019.
Becker, T. W., Schaeffer, A. J., Lebedev, S., and Conrad, C. P.: Toward a generalized plate motion reference frame, Geophys. Res. Lett., 42, 3188–3196, https://doi.org/10.1002/2015GL063695, 2015.
Buff, L., Jackson, M. G., Konrad, K., Konter, J. G., Bizimis, M., Price, A., Rose-Koga, E. F., Blusztajn, J., Koppers, A. A. P., and Herrera, S.: “Missing Links” for the Long-lived Macdonald and Arago Hotspots, South Pacific Ocean, Geology, 49, 541–544, https://doi.org/10.1130/G48276.1, 2021.
Burov, E. and Cloetingh, S.: Erosion and rift dynamics: New thermomechanical aspects of post-rift evolution of extensional basins, Earth Planet. Sc. Lett., 150, 7–26, https://doi.org/10.1016/s0012-821x(97)00069-1, 1997.
Byerlee, J.: Friction of rocks, Pure Appl. Geophys., 116, 615–626, https://doi.org/10.1007/BF00876528, 1978.
Cheng, C., Allen, R. M., Porritt, R. W., and Ballmer, M. D.: Seismic constraints on a double-layered asymmetric whole-mantle plume beneath Hawai'i, Hawaiian Volcanoes From Source to Surf, edited by: Carey, R., Poland, M., Cayol, V., and Weis, D., John Wiley & Sons Inc., Hoboken, NJ, 2015, 19–34, https://doi.org/10.1002/9781118872079.ch2, 2015.
Clouard, V. and Bonneville, A.: Ages of seamounts, islands, and plateaus on the Pacific plate, Spec. Pap. Geol. Soc. Am., 388, 71–90, https://doi.org/10.1130/0-8137-2388-4.71, 2005.
Conder, J. A., Forsyth, D. W., and Parmentier, E. M.: Asthenospheric flow and asymmetry of the East Pacific Rise, MELT area, J. Geophys. Res.-Sol. Ea., 107, ETG 8-1–ETG 8-13, https://doi.org/10.1029/2001jb000807, 2002.
Cushman, B., Sinton, J., Ito, G., and Dixon, J. E.: Glass compositions, plume-ridge interaction, and hydrous melting along the Galapagos spreading center, 90.5 ∘ wto 98 ∘ W, Geochem. Geophy. Geosy., 5, 1525–2027, https://doi.org/10.1029/2004GC000709, 2004.
Dalton, C. A., Langmuir, C. H., and Gale, A.: Geophysical and geochemical evidence for deep temperature variations beneath mid-ocean ridges, Science, 344, 80–83, https://doi.org/10.1126/science.1249466, 2014.
Douglass, J., Schilling, J. G., and Fontignie, D.: Plume-ridge interactions of the Discovery and Shona mantle plumes with the southern Mid-Atlantic Ridge (40∘–55∘ S), J. Geophys. Res.-Sol. Ea., 104, 2941–2962, https://doi.org/10.1029/98jb02642, 1999.
François, T., Koptev, A., Cloetingh, S., Burov, E., and Gerya, T.: Plume-lithosphere interactions in rifted margin tectonic settings: Inferences from thermo-mechanical modelling, Tectonophysics, 746, 138–154, https://doi.org/10.1016/j.tecto.2017.11.027, 2018.
French, S. W. and Romanowicz, B.: Broad plumes rooted at the base of the Earth's mantle beneath major hotspots, Nature, 525, 95–99, https://doi.org/10.1038/nature14876, 2015.
Gale, A., Dalton, C. A., Langmuir, C. H., Su, Y., and Schilling, J. G.: The mean composition of ocean ridge basalts, Geochem. Geophy. Geosy., 14, 489–518, https://doi.org/10.1029/2012GC004334, 2013.
Geissler, W. H., Wintersteller, P., Maia, M., Strack, A., Kammann, J., Eagles, G., Jegen, M., Schloemer, A., and Jokat, W.: Seafloor evidence for pre-shield volcanism above the Tristan da Cunha mantle plume, Nat. Commun., 4543, https://doi.org/10.1038/s41467-020-18361-4, 2020.
Gerya, T.: Origin and models of oceanic transform faults, Tectonophysics, 522–523, 34–54, https://doi.org/10.1016/j.tecto.2011.07.006, 2012.
Gerya, T. V.: Three-dimensional thermomechanical modeling of oceanic spreading initiation and evolution, Phys. Earth Planet. Int., 214, 35–52, https://doi.org/10.1016/j.pepi.2012.10.007, 2013.
Gerya, T. V. and Yuen, D. A.: Characteristics-based marker-in-cell method with conservative finite-differences schemes for modeling geological flows with strongly variable transport properties, Phys. Earth Planet. Int., 140, 293–318, https://doi.org/10.1016/j.pepi.2003.09.006, 2003.
Gerya, T. V. and Yuen, D. A.: Robust characteristics method for modelling multiphase visco-elasto-plastic thermo-mechanical problems, Phys. Earth Planet. Int., 163, 83–105, https://doi.org/10.1016/j.pepi.2007.04.015, 2007.
Gerya, T. V., Stern, R. J., Baes, M., Sobolev, S. V., and Whattam, S. A.: Plate tectonics on the Earth triggered by plume-induced subduction initiation, Nature, 527, 221–225, https://doi.org/10.1038/nature15752, 2015.
Gülcher, A. J. P., Gerya, T. V., Montési, L. G. J., and Munch, J.: Corona structures driven by plume–lithosphere interactions and evidence for ongoing plume activity on Venus, Nat. Geosci., 13, 547–554, https://doi.org/10.1038/s41561-020-0606-1, 2020.
Hardarson, B. S., Fitton, J. G., Ellam, R. M., and Pringle, M. S.: Rift relocation – A geochemical and geochronological investigation of a palaeo-rift in northwest Iceland, Earth Planet. Sc. Lett., 153, 181–196, https://doi.org/10.1016/s0012-821x(97)00145-3, 1997.
Harmon, N., Forsyth, D. W., Weeraratne, D. S., Yang, Y., and Webb, S. C.: Mantle heterogeneity and off axis volcanism on young Pacific lithosphere, Earth Planet. Sc. Lett., 311, 306–315, https://doi.org/10.1016/j.epsl.2011.09.038, 2011.
Hoggard, M. J., Parnell-turner, R., and White, N.: Hotspots and mantle plumes revisited: Towards reconciling the mantle heat transfer discrepancy, Earth Planet. Sc. Lett., 542, 116317, https://doi.org/10.1016/j.epsl.2020.116317, 2020.
Ito, G., Lin, J., and Gable, C. W.: Interaction of mantle plumes and migrating mid-ocean ridges: Implications for the Galfipagos plume-ridge system, J. Geophys. Res., 102, 15403–15417, https://doi.org/10.1029/97JB01049, 1997.
Ito, G., Lin, J., and Graham, D.: Observational and theoretical studies of the dynamics of mantle plume-mid-ocean ridge interaction, Rev. Geophys., 41, 1017, https://doi.org/10.1029/2002RG000117, 2003.
Jackson, M. G., Hart, S. R., Konter, J. G., Koppers, A. A. P., Staudigel, H., Kurz, M. D., Blusztajn, J., and Sinton, J. M.: Samoan hot spot track on a “hot spot highway”: Implications for mantle plumes and a deep Samoan mantle source, Geochem. Geophy. Geosy., 11, Q12009, https://doi.org/10.1029/2010GC003232, 2010.
Jackson, M. G., Becker, T. W., and Steinberger, B.: Spatial Characteristics of Recycled and Primordial Reservoirs in the Deep Mantle, Geochem. Geophy. Geosy., 22, e2020GC009525, https://doi.org/10.1029/2020GC009525, 2021.
Jellinek, A. M., Gonnermann, H. M., and Richards, M. A.: Plume capture by divergent plate motions: Implications for the distribution of hotspots, geochemistry of mid-ocean ridge basalts, and estimates of the heat flux at the core-mantle boundary, Earth Planet. Sc. Lett., 205, 361–378, https://doi.org/10.1016/S0012-821X(02)01070-1, 2003.
Kincaid, C., Ito, G., and Gable, C.: Laboratory investigation of the interaction of off-axis mantle plumes and spreading centres, Nature, 376, 758–761, https://doi.org/10.1038/376758a0, 1995.
Kincaid, C., Schilling, J.-G., and Gable, C.: The dynamics of off-axis plume-ridge interaction in the uppermost mantle, Earth Planet. Sc. Lett., 137, 29–43, https://doi.org/10.1016/0012-821X(95)00201-M, 1996.
Koppers, A. A. P., Becker, T. W., Jackson, M. G., Konrad, K., Müller, R. D., Romanowicz, B., Steinberger, B., and Whittaker, J. M.: Mantle plumes and their role in Earth processes, Nat. Rev. Earth Environ., 2, 382–401, https://doi.org/10.1038/s43017-021-00168-6, 2021.
Lénat, J. F., Merle, O., and Lespagnol, L.: La réunion: An example of channeled hot spot plume, J. Volcanol. Geoth. Res., 184, 1–13, https://doi.org/10.1016/j.jvolgeores.2008.12.001, 2009.
Maia, M., Pessanha, I., Courrges, E., Patriat, M., Gente, P., Hémond, C., Janin, M., Johnson, K., Roest, W., Royer, J. Y., and Vatteville, J.: Building of the Amsterdam-Saint Paul plateau: A 10 Myr history of a ridge-hot spot interaction and variations in the strength of the hot spot source, J. Geophys. Res.-Sol. Ea., 116, B09104, https://doi.org/10.1029/2010JB007768, 2011.
Mittelstaedt, E., Ito, G., and Behn, M. D.: Mid-ocean ridge jumps associated with hotspot magmatism, Earth Planet. Sc. Lett., 266, 256–270, https://doi.org/10.1016/j.epsl.2007.10.055, 2008.
Mittelstaedt, E., Ito, G., and Van Hunen, J.: Repeat ridge jumps associated with plume-ridge interaction, melt transport, and ridge migration, J. Geophys. Res.-Sol. Ea., 116, B01102, https://doi.org/10.1029/2010JB007504, 2011.
Mittelstaedt, E., Soule, S., Harpp, K., Fornari, D., McKee, C., Tivey, M., Geist, D., Kurz, M. D., Sinton, C., and Mello, C.: Multiple expressions of plume-ridge interaction in the Galápagos: Volcanic lineaments and ridge jumps, Geochem. Geophy. Geosy., 13, Q05018, https://doi.org/10.1029/2012GC004093, 2012.
Montelli, R., Nolet, G., Dahlen, F. A., Masters, G., Engdahl, E. R., and Hung, S. H.: Supporting OnlineMaterial Timing, Science, 303, 338–343, https://doi.org/10.1126/science.1092485, 2004.
Morgan, W. J.: Rodriguez, Darwin, Amsterdam, A second type of Hotspot Island, J. Geophys. Res.-Sol. Ea., 83, 5355–5360, 1978.
Müller, R. D., Roest, W. R., and Royer, J.-Y.: Asymmetric sea-floor spreading caused by ridge–plume interactions, Nature, 396, 455–459, https://doi.org/10.1038/24850, 1998.
Müller, R. D., Seton, M., Zahirovic, S., Williams, S. E., Matthews, K. J., Wright, N. M., Shephard, G. E., Maloney, K. T., Barnett-Moore, N., Hosseinpour, M., Bower, D. J., and Cannon, J.: Ocean Basin Evolution and Global-Scale Plate Reorganization Events since Pangea Breakup, Annu. Rev. Earth Planet. Sc., 44, 107–138, https://doi.org/10.1146/annurev-earth-060115-012211, 2016.
Niu, Y. and Hekinian, R.: Ridge suction drives plume-ridge interactions (Chapter 9), in: Oceanic Hotspots, 285–307, Chapter: Mantle plumes are not from ancient oceanic crust, Springer-Verlag, edited by: Hékinian, R. and Stoffers, P., https://doi.org/10.13140/2.1.4728.0961, 2004.
O'Connor, J. M., Jokat, W., Le Roex, A. P., Class, C., Wijbrans, J. R., Keßling, S., Kuiper, K. F., and Nebel, O.: Hotspot trails in the South Atlantic controlled by plume and plate tectonic processes, Nat. Geosci., 5, 735–738, https://doi.org/10.1038/ngeo1583, 2012.
Pang, F. and Liao J.: Dataset for plume–ridge interactions: ridgeward versus plate-drag plume flow, Zenodo [data set], https://doi.org/10.5281/zenodo.7688200, 2023.
Ranalli, G.: Rheology of the Earth, Springer Science & Business Media, 1995.
Ribe, N. M.: The dynamics of plume-ridge interaction: 2. Off-ridge plumes, J. Geophys. Res., 101, 16195–16204, https://doi.org/10.1029/96JB01187, 1996.
Ribe, N. M. and Christensen, U. R.: Three-dimensional modeling of plume-lithosphere interaction, ,J. Geophys. Res., 99, 669–682, https://doi.org/10.1029/93JB02386, 1994.
Ribe, N. M. and Christensen, U. R.: The dynamical origin of Hawaiian volcanism, Earth Planet. Sc. Lett., 171, 517–531, https://doi.org/10.1016/S0012-821X(99)00179-X, 1999.
Ribe, N. M., Christensen, U. R., and Theißing, J.: The dynamics of plume-ridge interaction, 1: Ridge-centered plumes, Earth Planet. Sc. Lett., 134, 155–168, https://doi.org/10.1016/0012-821X(95)00116-T, 1995.
Rowley, D. B. and Forte, A. M.: Kinematics of the East Pacific Rise Retrodicted From Pacific and Farallon/Nazca Subduction-Related Torques: Support for Significant Deep Mantle Buoyancy Controlling EPR Spreading, J. Geophys. Res.-Sol. Ea., 127, e2020JB021638, https://doi.org/10.1029/2020JB021638, 2022.
Rowley, D. B., Forte, A. M., Rowan, C. J., Glišović, P., Moucha, R., Grand, S. P., and Simmons, N. A.: Kinematics and dynamics of the east pacific rise linked to a stable, deep-mantle upwelling, Sci. Adv., 2, e1601107, https://doi.org/10.1126/sciadv.1601107, 2016.
Rychert, C. A., Harmon, N., Constable, S., and Wang, S.: The Nature of the Lithosphere-Asthenosphere Boundary, J. Geophys. Res.-Sol. Ea., 125, e2018JB016463, https://doi.org/10.1029/2018JB016463, 2020.
Schilling, J. G.: Fluxes and excess temperatures of mantle plumes inferred from their interaction with migrating mid-ocean ridges, Nature, 352, 397–403, https://doi.org/10.1038/352397a0, 1991.
Sleep, N. H.: Lateral flow and ponding of starting plume material, J. Geophys. Res.-Sol. Ea., 102, 10001–10012, https://doi.org/10.1029/97jb00551, 1997.
Small, C.: Observations of ridge-hotspot interactions in the Southern Ocean, J. Geophys. Res., 100, 17931–17946, https://doi.org/10.1029/95jb01377, 1995.
Straume, E. O., Gaina, C., Medvedev, S., Hochmuth, K., Gohl, K., Whittaker, J. M., Abdul Fattah, R., Doornenbal, J. C., and Hopper, J. R.: GlobSed: Updated Total Sediment Thickness in the World's Oceans, Geochem. Geophy. Geosy., 20, 1756–1772, https://doi.org/10.1029/2018GC008115, 2019.
Toomey, D. R., Wilcock, W. S. D., Conder, J. A., Forsyth, D. W., Blundy, J. D., Parmentier, E. M., and Hammond, W. C.: Asymmetric mantle dynamics in the MELT region of the East Pacific Rise, Earth Planet. Sc. Lett., 200, 287–295, https://doi.org/10.1016/S0012-821X(02)00655-6, 2002.
Torsvik, T. H., Smethurst, M. A., Burke, K., and Steinberger, B.: Large igneous provinces generated from the margins of the large low-velocity provinces in the deep mantle, Geophys. J. Int., 167, 1447–1460, https://doi.org/10.1111/j.1365-246X.2006.03158.x, 2006.
Turcotte, D. and Schubert, G.: Geodynamics, Cambridge University Press, https://doi.org/10.1017/CBO9780511843877, 2014.
Vlastélic, I. and Dosso, L.: Initiation of a plume-ridge interaction in the South Pacific recorded by high-precision Pb isotopes along Hollister Ridge, Geochem. Geophy. Geosy., 6, Q05011, https://doi.org/10.1029/2004GC000902, 2005.
Whittaker, J. M., Afonso, J. C., Masterton, S., Müller, R. D., Wessel, P., Williams, S. E., and Seton, M.: Long-term interaction between mid-ocean ridges and mantle plumes, Nat. Geosci., 8, 479–483, https://doi.org/10.1038/NGEO2437, 2015.
Wolfe, C. J., Solomon, S. C., Laske, G., Collins, J. A., Detrick, R. S., Orcutt, J. A., Bercovici, D., and Hauri, E. H.: Mantle shear-wave velocity structure beneath the Hawaiian hot spot, Science, 326, 1388–1390, https://doi.org/10.1126/science.1180165, 2009.
Yang, A. Y., Zhao, T. P., Zhou, M. F., and Deng, X. G.: Isotopically enriched N-MORB: A new geochemical signature of off-axis plume-ridge interaction–A case study at 50∘ 28'E, Southwest Indian Ridge, J. Geophys. Res.-Sol. Ea., 122, 191–213, https://doi.org/10.1002/2016JB013284, 2017.