the Creative Commons Attribution 4.0 License.
the Creative Commons Attribution 4.0 License.
 | 27 Apr 2023
Magnetic fabric analyses of basin inversion: a sandbox modelling approach
Thorben Schöfisch
Hemin Koyi
Bjarne Almqvist
A magnetic fabric analysis is a useful tool to display deformation in nature and in models. In this study, three sandbox models represent basin inversion above a velocity discontinuity (base plate). After complete deformation of each model, samples were taken in different parts of the models (along faults and areas away from faults) for magnetic fabric analysis. Model I, which simulates basin formation during extension, shows two kinds of magnetic fabric: an “undeformed”/initial fabric in areas away from faults and a normal fault-induced fabric with a magnetic foliation that tends to align with the fault surface. Models II and III were extended to the same stage as Model I but were subsequently shortened/inverted by 1.5 cm (Model II) and 4 cm (Model III). Both inverted models developed “thrusts” during inversion. The thrusts show an alignment of magnetic foliation parallel to the fault surfaces that depends on the maturity of the thrust. Our results highlight that thrusting is more efficient in aligning the magnetic fabric along them compared to normal faults. Moreover, models II and III reveal a magnetic fabric overprint towards a penetrative strain-induced fabric (magnetic lineation perpendicular to shortening direction) with increasing strain in areas away from thrusts. Such overprint shows a gradual transition of a magnetic fabric to a penetrative strain-induced fabric and further into a thrust-induced fabric during shortening/inversion. In contrast, extension (Model I) developed distinct magnetic fabrics without gradual overprint. In addition, pre-existing normal faults are also overprinted to a penetrative strain-induced fabric during model inversion. They define weak zones within the main pop-up imbricate and steepen during model inversion. Steepening influences the magnetic fabric at the faults and, in general, the strain propagation through the model during inversion.
The magnetic fabric extracted from the models presented here reflect the different stages of basin development and inversion. This study is a first attempt of applying magnetic fabric analyses on models simulating inverted basins. This study illustrates the possibility of applying a robust tool, i.e. magnetic fabric analyses, to sandbox models, whose initial, intermediate, and final stages are well documented, to understand fabric development in inverted tectonic regimes.
- Article
(6930 KB) - Full-text XML
-
Supplement
(31929 KB) - BibTeX
- EndNote


Anisotropy of magnetic susceptibility (AMS or magnetic fabric) is a useful strain indicator in analogue models simulating compressional tectonic regimes (García-Lasanta et al., 2017; Almqvist and Koyi, 2018; Schöfisch et al., 2020, 2022). The AMS measurements provide information about the bulk orientation of the magnetized grains within a collected sample. From the AMS measurements, a magnetic susceptibility ellipsoid with three principal axes of susceptibility () is described. Analyses of the susceptibility ellipsoid is similar to the strain ellipsoid, and changes of the magnetic ellipsoid can be related to strain changes (e.g. Hrouda and Janák, 1976; Jelinek, 1981; Kligfield et al., 1981; Hrouda, 1982; Hirt et al., 1988; Borradaile, 1988, 1991; Rochette et al., 1992; Housen et al., 1993; Borradaile and Henry, 1997; Bakhtari et al., 1998; Parés et al., 1999; Parés and Van Der Pluijm, 2002; Borradaile and Jackson, 2004; Burmeister et al., 2009; Parés, 2015).
Several publications summarize the magnetic fabric development of a basin and basin inversion derived from analyses of natural examples (e.g. Sagnotti et al., 1994; Mattei et al., 1997, 1999; Cifelli et al., 2005; Soto et al., 2007, 2008, 2012, 2016; Oliva-Urcia et al., 2010, 2013, 2016; García-Lasanta et al., 2014, 2015, 2018; Marcén et al., 2019; Burgin et al., 2021).
Relating the magnetic fabric observed in extensional settings reveals an overprint of a sedimentary fabric by an extension-related fabric, which shows a magnetic lineation (kmax axes clustering) parallel to extension (Sagnotti et al., 1994; Mattei et al., 1997; Borradaile and Hamilton, 2004; Cifelli et al., 2005). With the development of normal faults, the magnetic lineation develops in parallel (i.e. a shear-related fabric) or perpendicularly to the transport direction (i.e. as an intersection fabric) along the fault surface (Marcén et al., 2019). Extensional magnetic fabrics can be preserved during basin inversion when either shortening is not significant enough or thrust development accommodates shortening and a passive displacement of the basin prevents overprinting of the magnetic fabric. Where magnetic fabric is overprinted during inversion, the development of the magnetic fabric depends on the inversion style (García-Lasanta et al., 2018). According to observations by Averbuch et al. (1992), Bakhtari et al. (1998), Parés et al. (1999), and Parés and Van Der Pluijm (2002), the magnetic fabric (i.e. magnetic foliation defined by a girdle distribution of the kmax and kint axes) becomes parallel to the developed tectonic foliation. Also, a magnetic lineation develops in parallel to an intersection lineation that later changes into a stretching lineation with increasing deformation.
The effect of overprinting of an existing “sedimentary” magnetic fabric by a tectonic fabric is supported by results of analogue sandbox models (Almqvist and Koyi, 2018; Schöfisch et al., 2020, 2022). Even though the effects of grain deformation, fluid flow, or recrystallization (i.e. changes in magnetic mineralogy and development of sub-fabrics) on the development of magnetic fabric in crustal tectonic settings are not represented in sandbox models simulating upper crustal deformation, analogue modelling highlights the importance of grain reorientation during deformation (e.g. Schöfisch et al., 2022). The non-cohesive granular material used in sandbox experiments accommodates deformation by grain rotation and hence change/initiation of magnetic fabric which can be investigated in order to better understand fabric evolution in natural prototypes.
The current study evaluates the potential of AMS as a strain gauge in sandbox models simulating the development of a basin and basin inversion. Furthermore, the study aims to understand the development of magnetic fabric in extensional settings and its overprint during basin inversion.
2.1 Model preparation
For this study, three models (I, II, III) were prepared with a similar base plate setup (Fig. 1) at room temperature (22 ∘C and humidity of 50 %–60 %). Models were initially 8.3 cm thick, 30 cm wide, and 40 cm long. A basal metal plate was attached to the moveable backstop that created a velocity discontinuity in the middle of the model (20 cm from the backstop) beneath the layers of a sand–magnetite mixture (Fig. 1). The sand–magnetite mixture was used to simulate the brittle behaviour of sedimentary rocks in the upper crust and consist of loose sand and magnetite (< 0.1 vol %), both with similar subangular shape and grain size (0.124–0.356 mm). The average bulk susceptibility of the sand–magnetite mixture is 1.9 × 10⁻³ [SI]. This indicates that the artificial high content of ferromagnetic multi-domain magnetite in the models (compared to natural examples) governs the bulk signal of the AMS and the influence of the diamagnetic sand can effectively be neglected. Single layers of the sand–magnetite mixture were carefully sieved from a height ranging between 30–50 cm above the model. The layers, which were sieved to varying thicknesses (0.9–1.5 cm) due to manual sieving, were separated by thin layers of coloured sand acting as passive markers. The rationale behind sieving the sand–magnetite granular mixture into the sandbox and accepting irregularities in layer thickness throughout the model was to avoid scraping, which has proven to create an artificial initial magnetic fabric (e.g. Schöfisch et al., 2022). The uppermost layer of each model consisted of sand only and was scraped after sieving to create an even model surface with the same model height for all three models. No samples were taken from this uppermost layer for the AMS analysis. On the surface of the models, coffee powder was sieved, and point markers (coloured sand) were set for monitoring surface deformation. Monitoring surface deformation is used for comparing the models and their development but is less crucial for the outcome of this study. The sidewalls of the sandbox model were transparent glass walls that allowed the monitoring of the model evolution during extension and inversion from the sides.
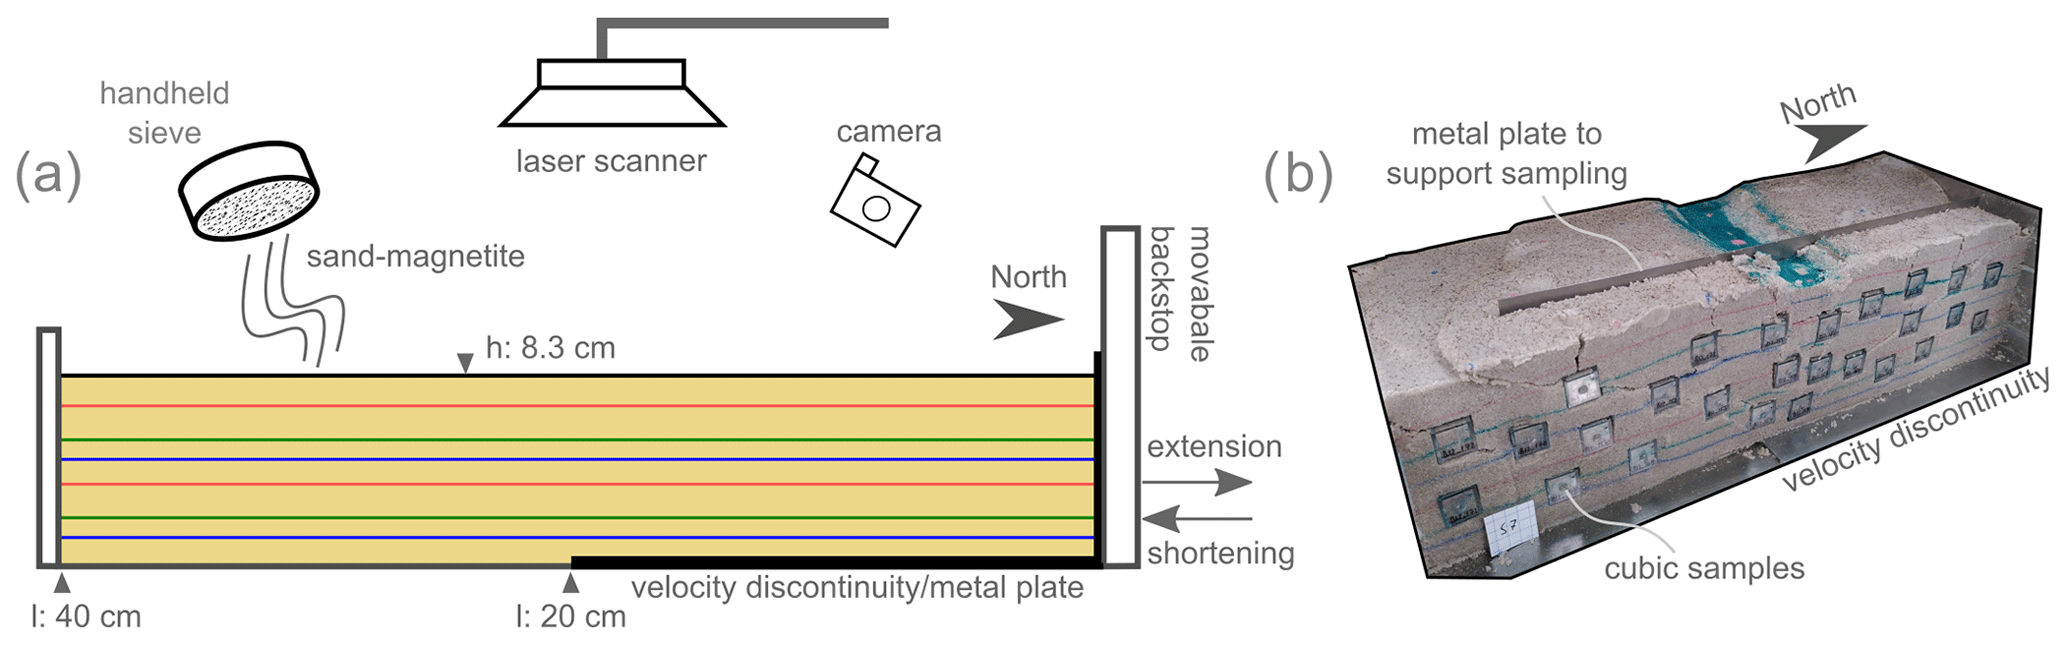
Figure 1(a) Sketch of model setup. Sieved layers of the sand–magnetite mixture are separated by coloured sand layers. A basal metal plate was used as velocity discontinuity and attached to the backstop that moved backwards for extension and forwards for shortening the model. The models were monitored by taking pictures from different angles with a camera, and model surfaces were monitored by laser scanning during deformation. (b) Photo of section number 7, which is an oblique view of Model III with inserted sample cubes, showing the procedure of sampling of the models.
2.2 Model run, sectioning, and sampling
All three models (I, II, III), which were identical in setup, were extended up to 1 cm in total. However, only models II and III were inverted. During extension, the model runs were paused after 0.5 cm of extension to fill the developed basin. After the extension phase, models II and III were shortened by different amounts of bulk shortening to simulate basin inversion at different stages. Extension and shortening of the models were initiated by a constant moving backstop with a velocity of 3 cm h−1, to which a velocity discontinuity was attached. To describe orientation clearly, the backstop of the model was labelled as the geographic model, North. Model I simulated extension only. Model II was shortened by 1.5 cm after extension and stopped when the first kinks developed (i.e. when sand layers showed millimetres of offset monitored through the transparent sidewalls of the sandbox), before any thrust forms with larger displacement. Model III was shortened by 4 cm after the initial extension. This 4 cm amount of shortening represents the stage when the backthrust of Model III showed a similar amount of displacement as the pre-existing normal fault. Moreover, the differences in the amount of bulk shortening between models II and III allow a comparison of (i) magnetic fabric of inverted basins with that of the extensional stage, i.e. prior to shortening, (ii) basin development and inversion with the same amount of bulk extension and shortening, and (iii) magnetic fabric at normal faults and thrusts with similar displacement.
During deformation, the models were monitored by a series of photos from all sides. After the final stage of deformation, models were carefully wetted for vertical sectioning parallel to the extension and shortening direction, as well as for allowing model sampling for the AMS analysis (Fig. 1b). Each section was taken individually and had a width of 2–2.5 cm. Before sampling a section, the next section was prepared and a stable plate was placed between the two sections. This stable plate supported sampling of the outer section without exerting pressure on the rest of the model (i.e. where the next section would be taken; see Fig. 1b). During the sampling of a section, oriented plastic cubes (internal volume of 1.7 cm3) were carefully pressed horizontally into the cohesive material. Afterwards, the cohesive and wetted AMS samples were stored in semidry conditions (fridge with 7 ∘C and humidity of 75 %), allowing for AMS measurements over a few weeks before the material inside the plastic cube lost cohesion.
In total, 721 samples (Model I: 217, Model II: 241, Model III: 263) were taken across the models targeting the different structures. The focus of sampling was to acquire magnetic fabrics of different parts of the models (e.g. normal faults, thrusts, graben, footwalls, hanging wall blocks). This exercise eliminated the effect of measuring a bulk mixed AMS fabric, which may be created due to a small structure-to-sample-size ratio. However, it is not possible to entirely diminish this effect at faults. Sampling at faults covers the narrow fault zone and the vicinity of a fault. The vicinity of a fault might have a different magnetic fabric than observed directly at a fault plane. Consequently, a mixed fabric is represented by the bulk measurement of samples from fault zones. Such an effect needs to be considered during magnetic fabric interpretation of fault-associated datasets. Therefore, a structure-to-sample-size ratio is calculated (see Fig. S1 in the Supplement).
2.3 AMS measurement and analysis
The bulk susceptibility and magnitude of AMS samples were measured with a MFK1-FA Kappabridge (Agico Inc.) in a low field (976 Hz) with an AC field strength of 200 A m−1 at room temperature. The grains within a sample respond to an applied external magnetic field, and the directional variation of the “response” (magnetic susceptibility) is described through a symmetric second-rank tensor with six independent matrix elements. The eigenvalues and eigenvectors of the matrix are the principal axes of susceptibility () that describe the magnitude, orientation, and shape of a magnetic susceptibility ellipsoid. The maximum axis (kmax) describes the magnetic lineation, whereas the plane containing the maximum and intermediate axes (kmax and kint) describes the magnetic foliation. Orientation of the principal axes was plotted in equal-area lower-hemisphere projections with north assigned towards the backstop of the model and the primitive circle (outer circle of projection) being parallel to the initial horizontal layering/bedding. The corrected degree of anisotropy, Pj, can be written as follows:
where , nint=ln (kint), , and . Pj reveals information about the sorting of grains within a sample, with a high degree of anisotropy corresponding to a preferred alignment of grains, whereas a low degree of anisotropy indicates a variation of grain orientations (Hrouda, 1982). Additionally, the shape of the susceptibility ellipsoid is described by T,
where T=1 represents an oblate shape, T=0 is a neutral triaxial shape, and is a rotational prolate shape. The principal axes, the corrected degree of anisotropy (Pj), or the shape of anisotropy (T) were statistically interpreted and visualized with the help of graphical tools, MATLAB, and ArcGIS. The centre of each AMS sample defined the distance to a fault or the model surface (i.e. depth). Samples that were not perfectly located with their centres on a fault were still assigned to the fault-induced AMS dataset. Therefore, we introduced a threshold with a range of 0.8 cm (centre to corner of a sample) between their centre to a fault. Samples located within this threshold were labelled to be fault-induced.
2.4 Uncertainty in AMS measurements
In section view, the area of a sample was compared to the area of the fault zone, and a structure-to-sample-size ratio is calculated (Fig. S1). This ratio allows specifying the amount of the AMS signal induced by a fault relative to that induced by the unfaulted area within the sample. Moreover, this ratio can explain a broad scattering in the magnetic foliation (i.e. girdle distribution of kmax and kint axes) from data collected along the faults (Fig. S2).
Further uncertainties in the AMS datasets can be related to the sampling procedure, sample handling during measurements, and the instrument itself. The signal sensitivity of the instrument is 2 × 10⁻⁸ [SI], which is well below the signal of samples in this study. Using a relatively high content of ferromagnetic minerals produces a clear signal with narrow confidence ellipses and high F values (see dataset in Schöfisch, 2022). The F values provide information about the anisotropy of the measured material and show a relation between measured principal susceptibility axes and measurement errors (Jelínek, 1977). Confidence ellipses and measurement errors are not shown in the figures, as the symbols in the figures would overlap the uncertainty estimated from measurements. Additional variations in orientation in the principal axes can derive from sampling or by adjusting the samples in the instrument. In both cases, the sample can deviate from alignment with the reference/modelling north. However, the large amount of data from the different areas across the models provide a basis for statistical analysis and average out outliers in the dataset. Further scattering in the datasets/figures is addressed in the Discussion section. Note that interpretations of the magnetic fabric within the grabens are limited to the small number of samples and no solid statistical interpretation can be taken for internal graben changes.
3.1 Model I: basin formation (extension only)
Model I developed an east–west-striking graben bounded by two normal faults that dip 60–70∘ (Fig. 2). The northern fault (Normal Fault B) shows a displacement of ∼ 1.4 cm. With progressive extension, a couple of synthetic and antithetic faults form in the centre of the graben (Fig. 2). The AMS analysis of different parts of this model reveals that there is no sign of deformation in the footwalls on either side of the graben; they only show the oblate initial fabric produced by sieving, with kmin axes clustering vertically, as the pole to bedding, and kint and kmax axes spread in the horizontal plane along a primitive circle (Fig. 2). The principal axes in Footwall B show more scattered orientation and have wider confidence ellipses (Figs. 2 and S3). However, they display a comparable distribution in the degree of anisotropy similar to that observed in Footwall A (Fig. 3b). Within the graben, the magnetic fabric is similar to the fabric observed in the footwalls and shows the initial fabric (Fig. 2). Along the normal faults, kmax and kint axes form a sub-horizontal (10–20∘) magnetic foliation with the same dip direction as that of the normal faults; dipping north along Normal Faults A and south along Normal Fault B (Fig. 2). However, the magnetic foliation and inclination of the normal faults are oblique to each other (∼ 50∘). The kmin axes display rotation away from its vertical position into the opposite direction of the fault dip, as it is perpendicular to the magnetic foliation (Fig. 2). Moreover, the magnetic fabric is mostly oblate, but the degree of anisotropy is on average lower along the normal faults (1.14 < Pj < 1.40) compared to the fabric in the graben and its footwalls (1.15 < Pj < 1.51) (Fig. 3a and c).
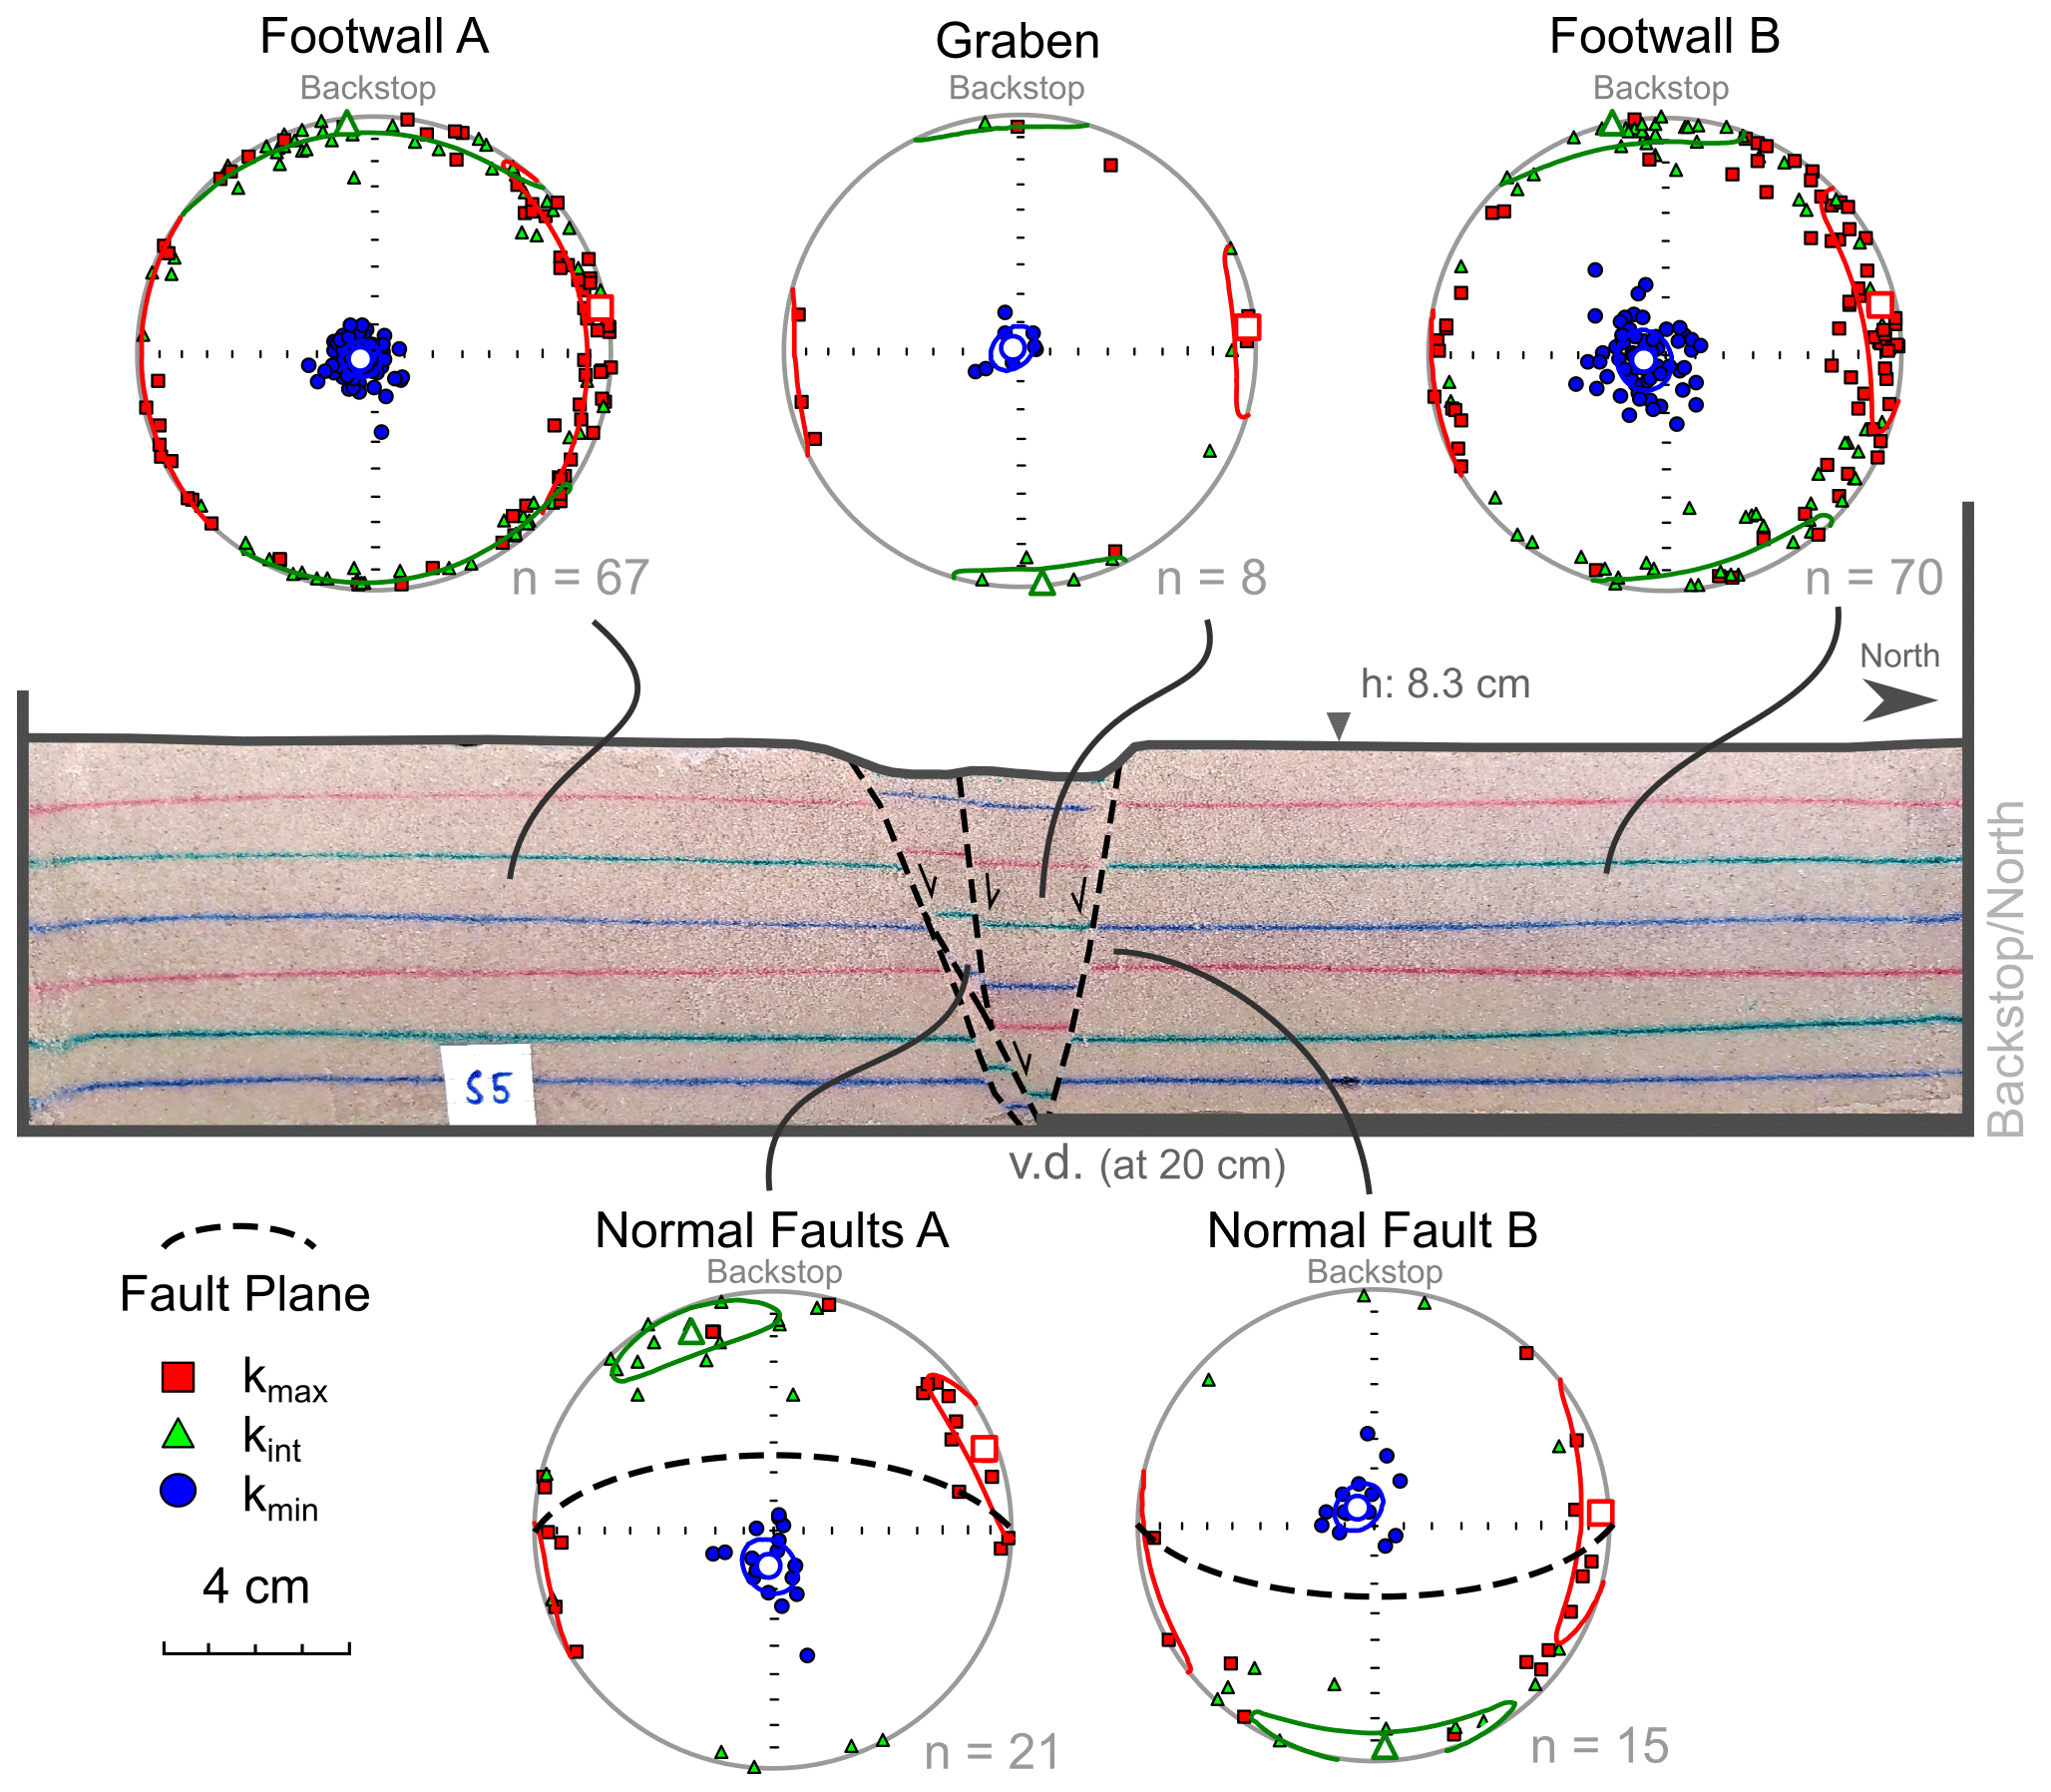
Figure 2Representative section of Model I shows a graben that is bounded by normal faults (orange lines). The magnetic fabric for each structure/area is plotted on equal-area lower-hemisphere projections with the confidence ellipses and mean of each principal axis.
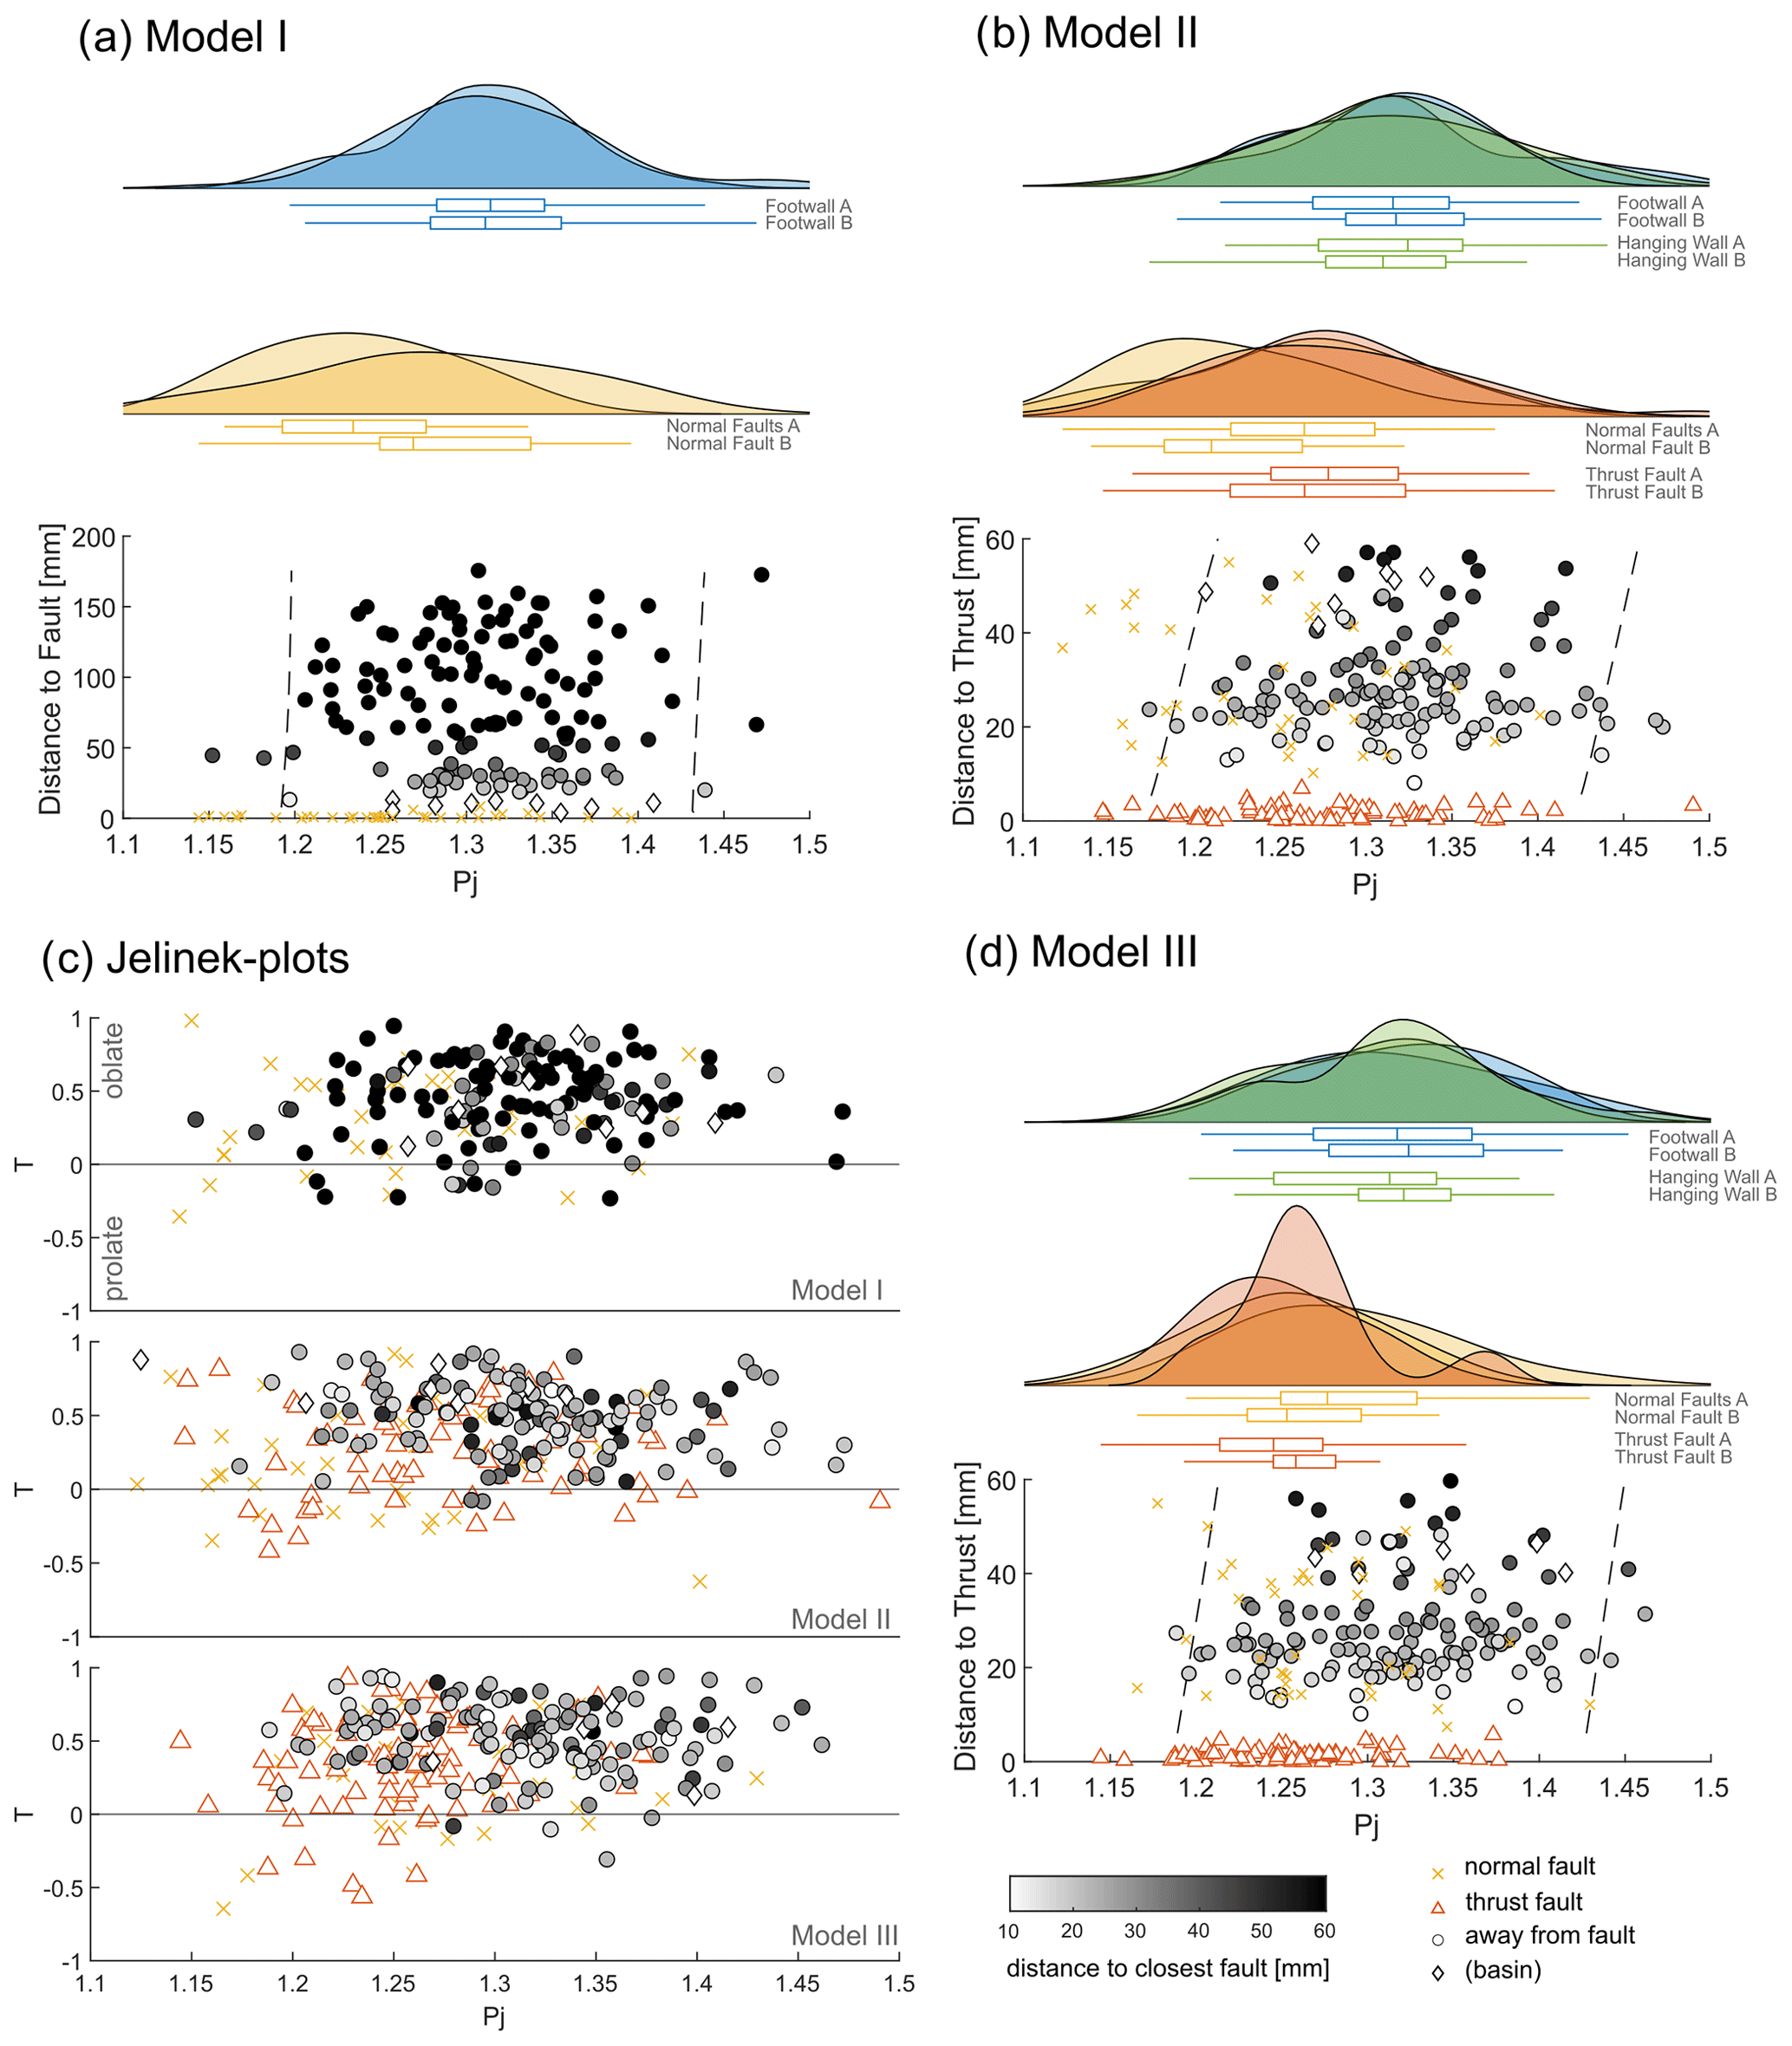
Figure 3Distribution of the degree of anisotropy (Pj) is plotted as density distribution for each structure against the distance to the closest normal fault or thrust for (a) Model I, (b) Model II, and (d) Model III. Panel (c) shows Jelinek plots (degree of anisotropy Pj against the shape of anisotropy T) for each model. Note that the greyscale colour map is defined by the distance towards the closest fault (normal fault or thrust). The dashed lines show the 95 % confidence interval of the data away from the faults. The figure is using a modified MATLAB script of a raincloud plot by Allen et al. (2021).
3.2 Model II: basin inversion
The second model (Model II) was extended 1 cm before it was later shortened 1.5 cm (V1 in the Supplement). Similar to Model I, an east–west-striking graben developed during the extension phase (Fig. 4). With the onset of subsequent shortening (i.e. beginning of inversion) of the model, the normal faults steepened by ∼ 2–3∘, which led to a slight narrowing of the graben (Fig. S1). The final dip of the normal faults in this shortened model is steeper (70–85∘) than that of the normal faults of Model I, which underwent only an extension phase. However, the normal faults did not display any significant inversion during the subsequent shortening. Instead, precursors of gently dipping thrusts (25–35∘) developed as kinks, which offset footwall markers by a few millimetres. These thrusts are less mature than the normal faults as they developed less displacement. The thrusts divided footwalls A and B of the graben (Fig. 2) into footwalls and hanging walls (Fig. 4). Moreover, hanging walls A and B of the graben developed into a large pop-up structure (including the graben structure) that was uplifted along the thrusts during inversion. For comparison of the magnetic fabric and its development in the different areas, we labelled the different blocks based on their relation to the thrust faults (Footwall A, Hanging Wall A, etc.).
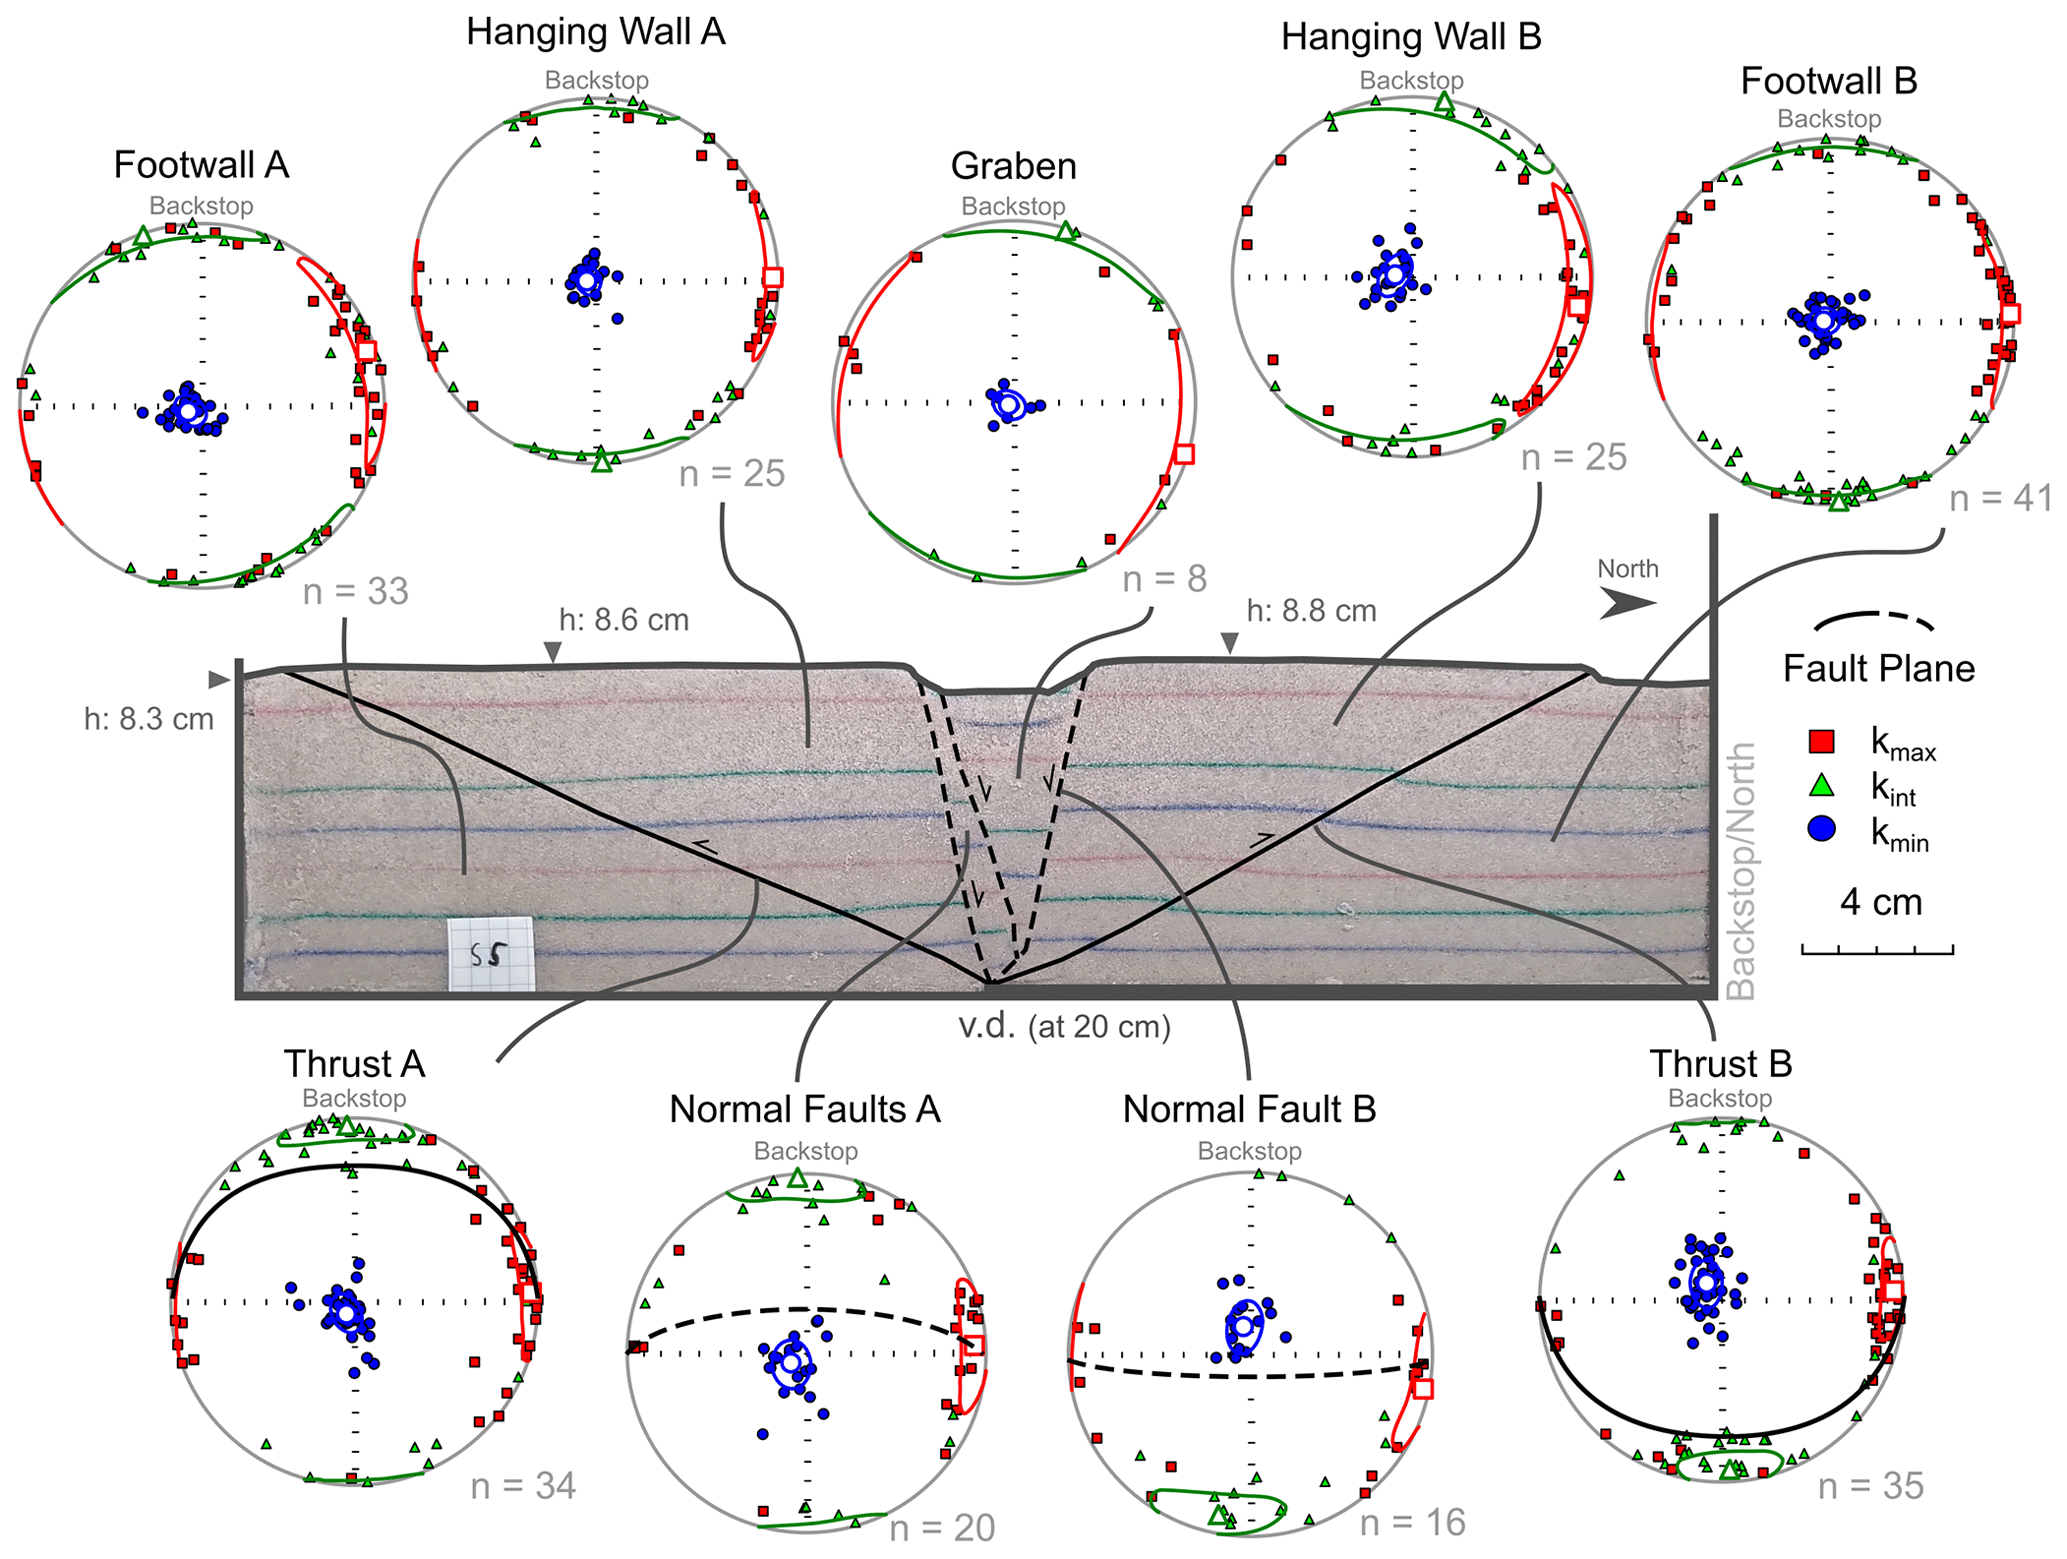
Figure 4Representative section of Model II showing extensional and compressional structures. The magnetic fabric of each structure/area is plotted on equal-area lower-hemisphere projections with confidence ellipses and mean of each principal axis.
The magnetic fabric of footwalls A and B, as well as of the hanging wall blocks A and B, show an oblate magnetic fabric that is similar to the initial fabric with a vertical kmin axis and a horizontal spread of kmax and kint axes (Fig. 4). It is noted that the kmax distribution creates a subtle magnetic lineation parallel to the east–west axis in these areas away from the faults, and the confidence ellipses are narrower compared to the same areas in Model I. Furthermore, there is no clear distinction between the degree of anisotropy between the footwall (1.19 < Pj < 1.48) and hanging wall areas (1.17 < Pj < 1.45) of Model II (Fig. 3b). Additionally, the central graben reveals similar magnetic fabrics as those in footwall and hanging wall blocks (Fig. 4). The magnetic fabrics at the normal faults A and B display a distribution of subvertical kmin axes. The mean of the subvertical kmin axes is tilted opposite to the dip direction of the normal faults and points steeply to the south for Normal Faults A and to the north for Normal Fault B. The kmax and kint axes are mostly plunging gently (< 30∘) with a dominant east–west orientation for kmax axis and north–south for kint axis (Fig. 4). The principal axes are similarly clustered at the normal faults of Model II compared to Model I, in particular for the kmax orientations. However, the plane created by kmax and kmin axes (i.e. magnetic foliation) shows little to no inclination with regards to that along the normal faults in Model I. The AMS data from the thrusts in Model II show a distribution of principal axes similar to the normal faults of the same model (Fig. 4). However, the kmax and kint axes for each thrust tend to define a magnetic foliation subparallel to the thrusts. In Model II, the magnetic fabric along both the normal faults and the thrusts is mainly oblate with some occurrences of the prolate shape (Fig. 3c). The degree of anisotropy is comparable between the normal faults (1.12 < Pj < 1.38) and thrusts (1.14 < Pj < 1.41), but on average, it is lower than in areas away from the faults (Fig. 3b).
3.3 Model III: inverted basin model (advanced shortening)
Model III shows similar structures to those in Model II (V2 in the Supplement). However, the thrusts in Model III, which was subjected to a larger amount of bulk shortening (+2.5 cm more than Model II), are more mature and display a larger displacement than those in Model II (Fig. 5). The normal faults dip 70–80∘ and show a displacement of ∼ 1.4 cm on average. During inversion, Normal Fault B steepened by ∼ 5∘, whereas Normal Faults A maintained the same dip as that prior to shortening (Fig. S1). Similar to Model II, with the subsequent shortening of Model III, the pre-existing graben narrowed with rotation of the normal faults by a few degrees (Fig. S1). Moreover, Hanging Wall A shows a minor block rotation (∼ 10∘) along Thrust A during the development of the main pop-up structure, which involves folding of the layers in the vicinity of the thrust. Both thrusts dip in a range between 25–40∘. However, Thrust A developed a splay at deeper parts of the model and shows less displacement than Thrust B due to a different accommodation of strain in this area (Fig. 5). Thrust B shows a displacement of ∼ 1.4 cm, which is similar to that along the normal faults. Similar to Model II, we divided and labelled the different blocks of Model III individually based on their relation to the thrusts (Footwall A, Hanging Wall A, etc.).
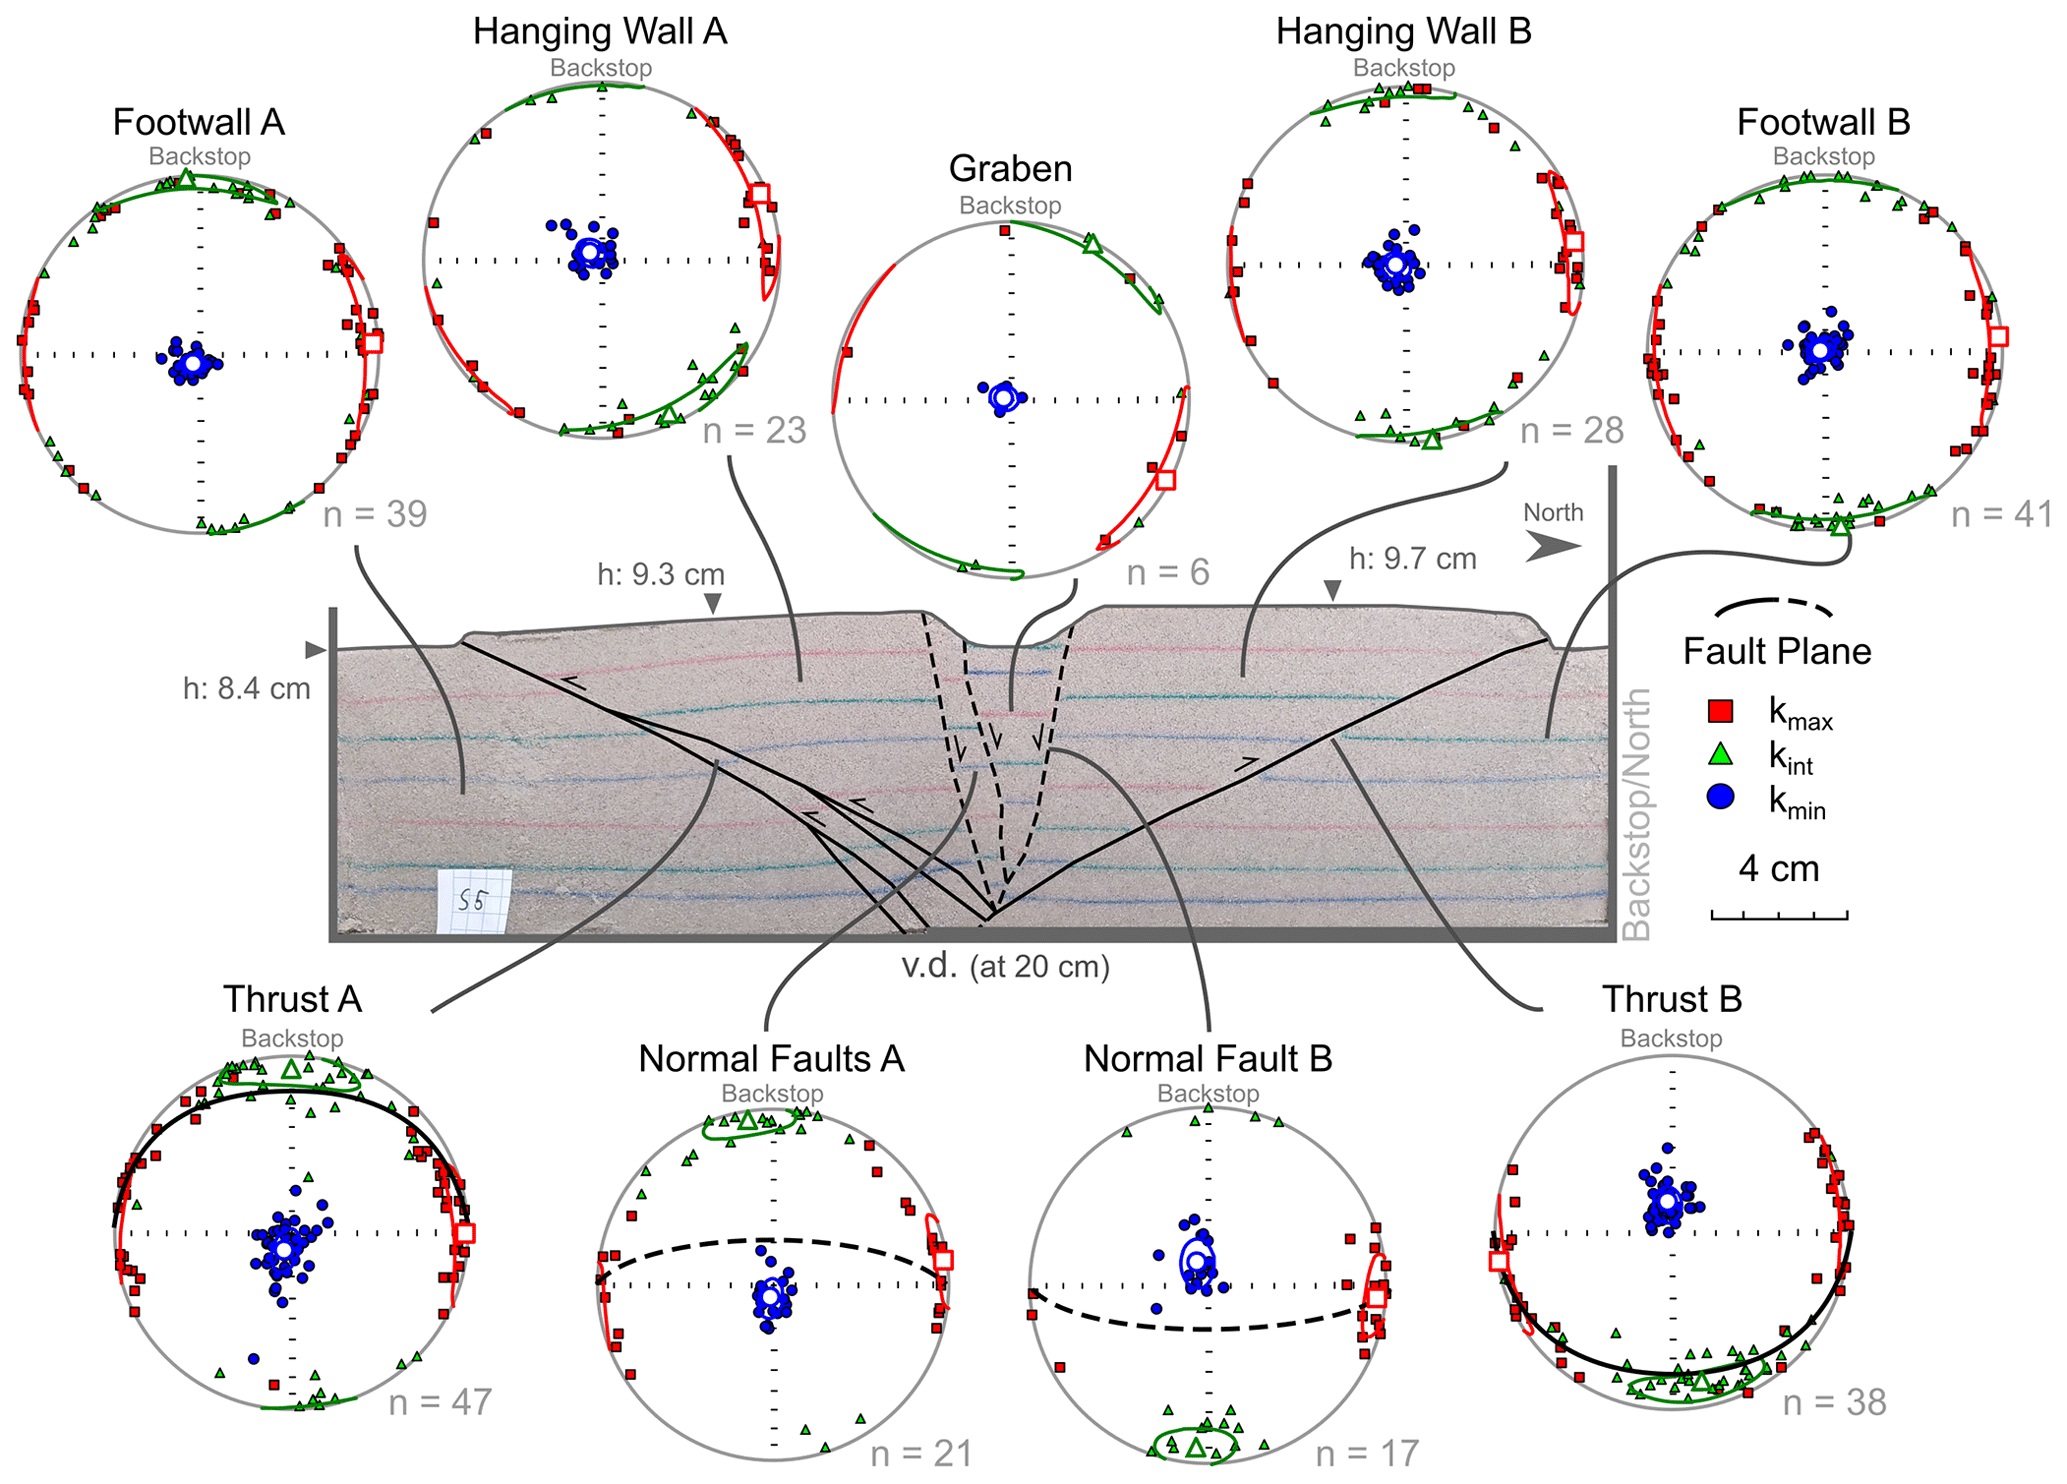
Figure 5Representative section of Model III showing the main structures and corresponding magnetic fabric plots.
In Model III, the magnetic fabric in footwalls A and B, the hanging wall blocks A and B, and the graben developed similar magnetic fabrics as those observed in equivalent areas of the other two models (i.e. models I and II). However, there are minor deviations from the initial fabric in certain areas, particularly when comparing the clustering of the principal axes and their confidence ellipses. For example, Hanging Wall A developed a slight tilt in the magnetic foliation plane (∼ 10∘) that corresponds with the slight rotation of bedding during uplift of this block (Fig. 5). Furthermore, in footwalls A and B, and in Hanging Wall B, the kmax axes are clustering horizontally (i.e. creating a magnetic lineation) along east or west directions instead of spreading around the primitive circle. Furthermore, kint axes also cluster mainly in a north and/or south direction (Figs. 5 and 6).
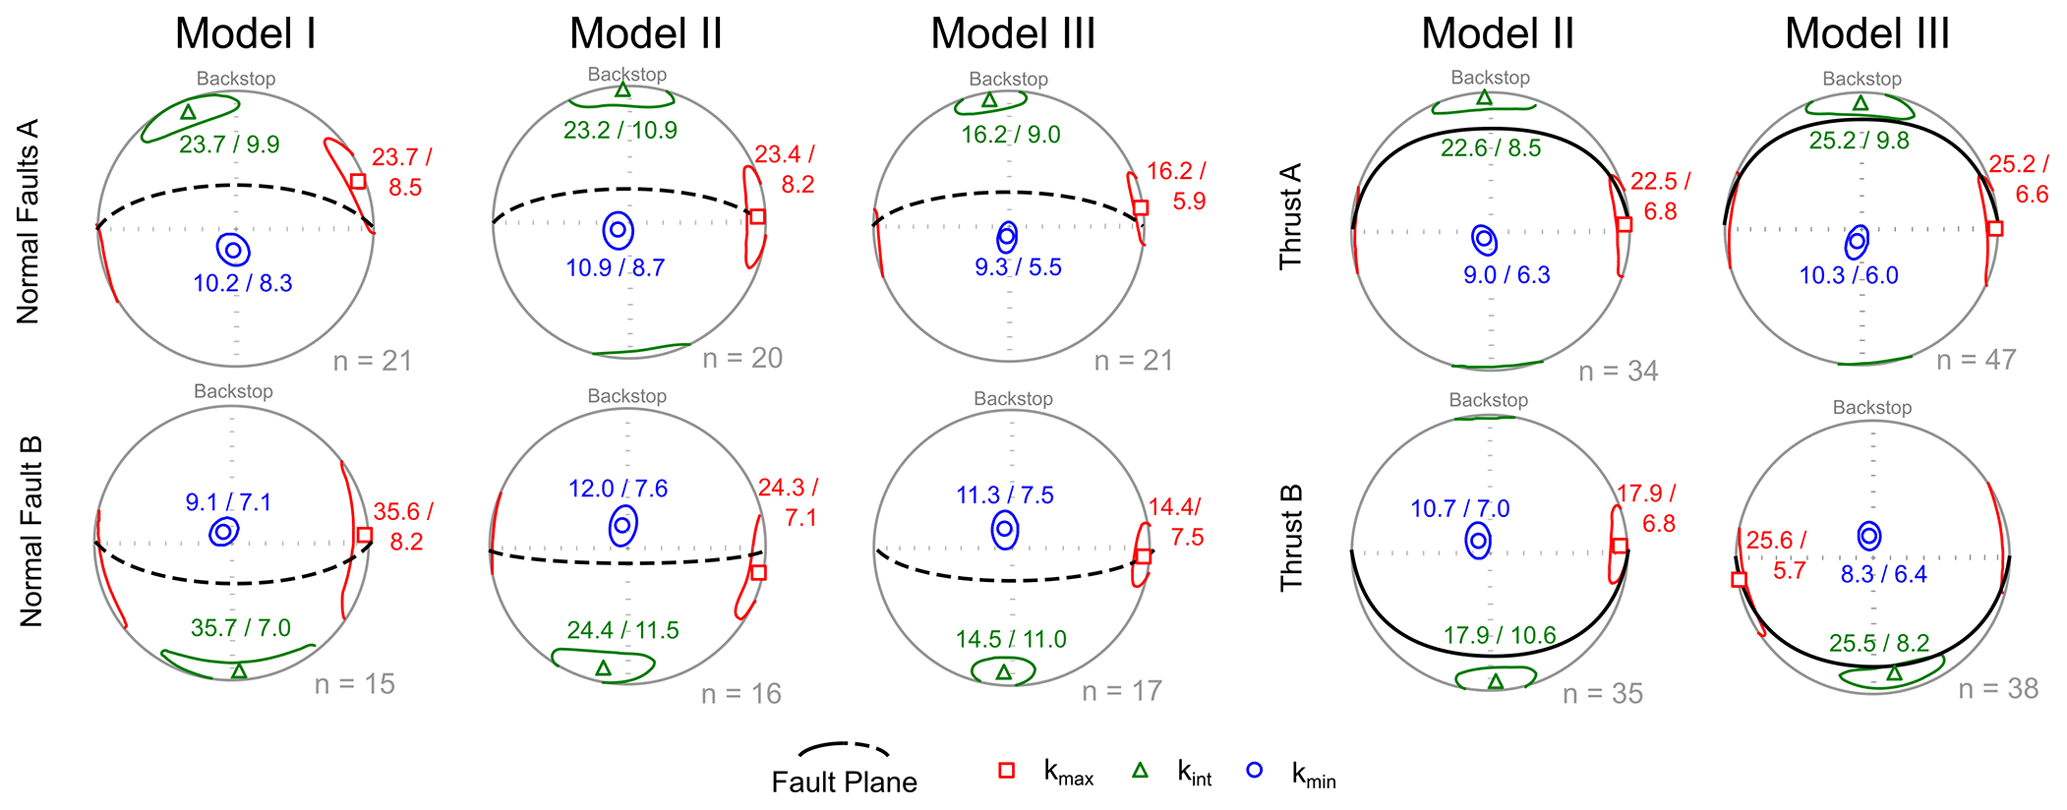
Figure 6Comparison of orientation of the mean principal axes with confidence ellipses for normal faults and thrusts. The numbers next to each confidence ellipse are the angles of the ellipse itself, which give information on the length and width of the ellipse in degrees (Jelínek, 1977). A comparison of the areas away from the faults is given in Fig. S3.
The distribution of the principal axes (kmax, kint, and kmin axes) along the normal faults in Model III is comparable to that along the normal faults of Model II (Fig. 6). The cluster of kmin axes (i.e. mean of kmin axes orientations) rotates slightly away from its vertical orientation to subvertical orientation, dipping south for the north-dipping Normal Faults A and dipping north for the south-dipping Normal Fault B. The AMS analysis does not show a clear girdle distribution of kmax and kint axes (i.e. magnetic foliation) parallel to the normal faults. Instead, kmax and kint axes are more clustered than the axes in models I and II (i.e. less stretched confidence ellipses), and the plane described by both axes (i.e. magnetic foliation) is almost not inclined at Normal Faults A and slightly inclined (∼ 10∘) at Normal Fault B (Figs. 5 and 6). However, kmax axes cluster horizontally towards the east or west (i.e. perpendicular to the extension and shortening directions), whereas kint axes distribute along a north to south axis (i.e. parallel to extension and shortening directions). Moreover, the magnetic foliation has similar orientation as the fault surfaces themselves, although both planes are oblique (50–60∘) to each other (Fig. 5). In contrast, the magnetic foliation is parallel to the thrust in Model III. Even though displacement along the thrusts is comparable to that along the normal faults, the magnetic foliation associated with thrusting is distinct (cf. Schöfisch et al., 2022). The degree of anisotropy of the normal faults (1.16 < Pj < 1.43) is distributed similarly to that of the thrusts (1.14 < Pj < 1.38) (Fig. 3d). The shape of anisotropy along the normal faults and thrusts plots mainly in the oblate field with some degree of prolate signature (Fig. 3c). The degree and shape of anisotropy along the structures in Model III are similar to that in the other two models (Fig. 3c). Moreover, the degree of anisotropy along the faults is on average lower than that observed in the footwalls (1.2 < Pj < 1.46) and hanging walls (1.18 < Pj < 1.47) (Fig. 3d).
4.1 Initial magnetic fabric
The initial fabric of the models was created by sieving, where kmin axes cluster as the pole to bedding, and kmax and kint axes orient randomly in the horizontal plane parallel to bedding. This initial fabric is the reference and changes from this initial fabric are attributed to deformation. Sieving the initial magnetic fabric is a novelty, tested in this study. The sieved fabric differs from the scraped fabric; a scraped initial fabric shows horizontal alignments of kmax axes parallel and kint perpendicular to the scraping direction (Almqvist and Koyi, 2018; Schöfisch et al., 2020, 2022), whereas kmax and kint axes in a sieved magnetic fabric distribute randomly in different horizontal directions. Such a sieved magnetic fabric is similar to a sedimentary fabric that is observed in nature (cf. Borradaile and Henry, 1997; Bakhtari et al., 1998; Parés et al., 1999) and allows an improved interpretation and comparison between models and natural prototypes (e.g. Figs. 6 and S3).
The footwalls A and B of Model I are undeformed and still reveal the initial fabric after extension. It can be noted that the magnetic fabric in Footwall B of Model I has a relatively larger scatter compared to Footwall A of the same model (Figs. 2 and S3). Footwall B is resting and carried on the basal plate that moves during extension, whereas Hanging Wall A is resting on a stationary base. We assume that the deviation in magnetic fabric is due to grain reorientation/bulk compaction of sand due to vibration during movement of the underlying plate. An undeformed pile of sand is more prone to vibration than a pile that is under compression. Therefore, we assume that an influence of a vibration is more obvious during the phase of extension compared to shortening. The slight vibration could be because of a minor gap between the table and the metal plate. However, the weight of the model above the plate was removing this gap, but still, such a gap could be an explanation for a potential source of vibration. The modelling setup was reworked during the preparation of models II and III, and the gap between the table and metal plate was removed. Models II and III also retain the initial fabric in some locations even after model inversion, but both models also developed a clustering of principal axes with narrower confidence ellipses that is attributed to penetrative strain (Fig. 6). Consequently, the magnetic fabric in models II and III away from faults represent a mixed fabric between the initial and penetrative strain-induced fabric. These locations with initial fabric in models II and III indicate undeformed areas. Such undeformed areas during basin development are also known from natural examples (Oliva-Urcia et al., 2013; García-Lasanta et al., 2018).
4.2 Extensional fabric in basin model
In a natural sedimentary basin, a magnetic lineation (i.e. kmax clustering) develops parallel to the axis of extension. This observation derives from studying the reorientation of phyllosilicates in clay-rich sediments (e.g. Mattei et al., 1997, 1999; Cifelli et al., 2005). However, the surface markers of the models of this study indicate movement of the individual developed hanging wall and footwall (i.e. graben and Footwall B) without noticeable internal deformation (i.e. stretching) of the lithology during extension of the models. The magnetic fabric within the hanging wall and footwall of Model I has not developed a clear magnetic lineation parallel to stretching (Figs. 2 and S3). It rather indicates localized deformation, where the normal faults are developed (Fig. 2). The lack of pervasive extensional fabric in the model is likely a consequence of the granular material used in the model that has very low cohesion (cf. Eisenstadt and Withjack, 1995; Eisenstadt and Sims, 2005). However, our results underscore that there is minimal to no layer-parallel deformation/extension within the different hanging walls and footwalls during extension in such a brittle deformation environment (i.e. using a ridged velocity discontinuity/basal plate for initiating deformation).
The normal faults of Model I show a magnetic foliation that vaguely align parallel to the fault surface (note: normal faults of models II and III are discussed in Sect. 4.3.2). However, this alignment is oblique and there is a large difference of ∼ 40–50∘ between the inclinations of magnetic foliation and the fault surface (Figs. 2 and 6). Nevertheless, the dip direction of the magnetic foliation and fault surface are identical. Dilation is involved in the formation of normal faults in granular material. Dilation on the one hand forms a weak zone that is important during later basin inversion, but on the other hand, it is responsible for developing the observed magnetic fabric at the normal fault. The subangular non-cohesive grains rotate with their kmax axis along the normal faults into a clustering in the east or west direction that is parallel to the fault plane but perpendicular to the direction of model extension. The clustering is also reflected by the lower degree of anisotropy that is observed at the normal faults compared to the rest of Model I, where initial fabric dominates (Fig. 3a). The lower degree of anisotropy reflects a greater alignment of the magnetic grains at the normal faults compared to the grains away from the faults. However, the described oblate magnetic ellipsoid is not aligned with the fault surface (Fig. 3c), as the kint axes and, in general, the magnetic foliation are oblique to the fault plane (Figs. 2 and 6). It can be interpreted that the grains are sliding along the fault and rotate, with a tendency of being tilted along dip direction of the fault but not being aligned completely with the fault surface.
Overall, the magnetic fabric of the normal faults differs in the degree of anisotropy and clustering of principal axes to the initial fabric that is observed in the rest of the model. These differences in magnetic fabric in Model I are results of extensional deformation. Although there is no presence of a layer-parallel extensional fabric, an “extensional fault-induced fabric” (i.e. normal fault-induced fabric) developed in Model I as consequence of localized deformation during basin development.
4.3 Overprint of magnetic fabric in models during inversion
4.3.1 Thrust overprint
Models II and III simulate basin inversion at different stages. Model II developed kinks along the thrust surfaces that offset the layers by a few millimetres, whereas Model III developed more mature thrusts that offset the layers in the model by the same amount as the pre-existing normal faults (Figs. 4 and 5). It has been reported that compaction and folding (i.e. kinking) takes place prior to thrusting (e.g. Mulugeta and Koyi, 1992; Koyi, 1995; Koyi et al., 2003). The different thrusts in the models follow the same deformation path and reveal a magnetic fabric that is associated with their development. Model I shows an initial fabric at the same location/area where the thrusts developed in models II and III. The kinks in Model II developed a magnetic lineation (i.e. cluster of kmax axes) towards the east and west, which is perpendicular to the shortening direction. Such orientation is also related to penetrative strain as it represents a penetrative strain-induced fabric. Moreover, the confidence ellipses of the kmax and kint axes define a magnetic foliation that is slightly tilted. This tilt is attributed to the onset of kinking and development of a thrust. With further evolution of a thrust, the confidence ellipses are stretching and defining a magnetic foliation that aligns with the thrust surface (Fig. 6). Meanwhile, the degree of anisotropy is decreasing with increasing displacement along a thrust (Fig. 3), which indicates a better sorting and greater alignment of the grains. Thrust B in Model III shows such alignment of magnetic foliation with the thrust surface, whereas Thrust A in the same model diverges slightly from such alignment. This difference in alignment can be related to the structural complexity and structure-to-sample size ratio, where Thrust B is a well-defined single thrust, whereas Thrust A represents a splayed fault system. However, the development of the thrust-induced fabric in the models follows a similar evolution of fabric development as observed in a recent study by Schöfisch et al. (2022); the initial fabric is first overprinted by penetrative strain before thrusting aligns the magnetic foliation parallel to the fault surface. Moreover, Schöfisch et al. (2022) related the alignment of magnetic foliation parallel to the thrust surface with maturity of a thrust. Similar observations are made in the current models; magnetic foliation shows a closer alignment with thrusts of Model III than with the thrust surfaces (i.e. kinks) in Model II (Fig. 6).
The overprint of magnetic fabric during thrusting differs from that observed along the normal faults. The alignment of fabric to the thrust surfaces is displayed by kmax and kint axes defining a broad girdle distribution (i.e. magnetic foliation) parallel to the thrust surface. In contrast, the normal faults developed a magnetic foliation oblique to its fault surface. Comparing the magnetic fabric along the normal faults to that along the thrusts with similar displacement along the fault surface (Fig. 6), it is apparent that thrusting is more efficient in aligning grains parallel to a fault.
4.3.2 Magnetic fabric overprint at normal faults
Normal faults of models II and III show no or very minor reactivation during inversion, which is in agreement with observations of pure-dry-sand models by Eisenstadt and Sims (2005) and Deng et al. (2019). However, the grabens in models II and III become narrower during inversion and the normal faults rotate slightly to steeper angles (Fig. S1). Such basin narrowing and fault rotation are consequences of the development of the main pop-up imbricate that is bounded by the thrusts in models II and III. As penetrative strain precedes thrusting, the sand package, including the graben and normal faults, experiences layer-parallel shortening. Similar to what has been reported in previous studies (cf. Eisenstadt and Withjack, 1995; Bonini et al., 2012; Deng et al., 2019), this layer-parallel shortening reworks the pre-existing extensional structures and the associated grain alignment without reverse displacement along the faults. The magnetic fabrics at the normal faults of models II and III are rearranged from a normal fault-induced fabric towards a penetrative strain-induced fabric during subsequent inversion/shortening of the models. In more detail, the overprinted normal faults of models II and III show a clustering of kmax axes to the east and the west and of kint axes to the north and the south (Fig. 6). The clustering of kmax and kint axes is classified as penetrative strain-induced fabric that becomes more distinct (narrowing of confidence ellipses) with higher bulk shortening (Fig. 6). This clustering in magnetic fabric differs from the distribution of kmax and kint axes with elongated confidence ellipses of the normal faults in Model I. Additionally, the magnetic foliation rotates towards the horizontal, which is parallel to the direction of model shortening (Fig. 6). In conclusion, the normal faults are not kinematically reactivated (i.e. no inversion) but show an overprint towards a penetrative strain-induced fabric that is accompanied by the geometrical change of the fault during superimposed shortening.
4.3.3 Penetrative strain distribution during inversion
With the onset of model shortening (i.e. inversion), models II and III were horizontally compacted before the thrusts developed. The models accommodated the penetrative strain by grain rearrangement, which is reflected by the change in magnetic fabric. Early signs of basin inversion in nature have been reported to be recognized by the reorientation and development of magnetic lineation perpendicular to shortening the direction in a basin (e.g. De Lamotte et al., 2002; Soto et al., 2016). Such development of magnetic lineation perpendicular to shortening direction can be observed in models II and III; kmax axes cluster horizontally along an east–west axis (penetrative strain-induced fabric) in the areas away from the thrusts (Figs. 4, 5, and S3). For example, Footwall B of models II and III shows a narrowing of the confidence ellipses and east–west magnetic lineation, which is more pronounced compared to the same area in Model I (Fig. S3). With increasing strain, other areas, such as the hanging walls, also show a magnetic fabric change towards a penetrative strain-induced fabric. However, depicting deviations of the initial fabric in the models and referring this to penetrative strain, especially when rotation and clustering of a magnetic lineation are parallel to bedding, needs careful interpretation. Some kmax orientations differ from the penetrative strain-induced fabric within the footwalls and hanging wall blocks of the models. This means a mixture is detected between a penetrative strain-induced fabric (kmax cluster/magnetic lineation perpendicular to the shortening direction) and the initial fabric (kmax axes spread around the primitive circle) in these areas away from thrusts (Figs. 4 and 5). It is common that the initial fabric prevails in some locations even after basin inversion in nature (Oliva-Urcia et al., 2013) and in sandbox models simulating shortening only (Schöfisch et al., 2022). An observation of a mixture between initial fabric and penetrative strain-induced fabric, or a prevailing initial fabric after deformation, indicates that penetrative strain is heterogeneously distributed within the model, and further, deformation within a single block (hanging wall/footwall) occurs heterogeneously.
Heterogenous penetration of strain within the model occurs due to the accommodation of strain during inversion by pre-existing structures like normal faults (cf. Sassi et al., 1993; Eisenstadt and Withjack, 1995; Bonini et al., 2012; Tong et al., 2014). The pre-existing normal faults create weak zones within the main pop-up structure, which develops during inversion. These weak zones accommodate most of the penetrative strain within the pop-up imbricate during model inversion and therefore deform internally, as seen by the geometric reorientation of the normal faults. Normal faults in models II and III develop a magnetic lineation during inversion that is similar to the magnetic fabric induced by layer-parallel shortening (kmax axes cluster perpendicular to shortening direction) (see Sect. 4.3.2). Consequently, the normal faults accommodate strain, and the geometric changes of the normal faults are signs of internal, penetrative deformation within a pop-up imbricate during inversion. Strain accommodation by pre-exiting faults contributes to a heterogenous internal deformation and, consequently, results in a mixed magnetic fabric within the footwalls and hanging walls.
4.3.4 Gradient in magnetic fabric with increasing bulk shortening
Shortening in the models is driven by the backstop and the velocity discontinuity from one direction (i.e. from the model North). Therefore, areas closer to the backstop and velocity discontinuity compact before deformation penetrates farther into the model (Mulugeta and Koyi, 1992; Koyi, 1995). This is seen by a clear and distinct magnetic lineation (i.e. a penetrative strain-induced fabric) in Footwall B of models II and III, which is the footwall next to the backstop. Areas farther from the backstop (e.g. Footwall A and hanging wall blocks of Model III) are also affected by penetrative strain but show a mixture between a penetrative strain-induced fabric and the initial fabric (as discussed earlier in Sect. 4.3.3). Nevertheless, there is a gradient in clustering of the principal axis with increasing bulk shortening. When Model II shows a clear penetrative strain-induced fabric in Footwall B and partially in the hanging walls, Model III shows a narrowing of the confidence ellipses in almost all areas of the model (Fig. S3). Consequently, it could be argued that there is a general gradient in the amount of penetrative strain from model North to model South in the inverted models. However, such a general gradient is not linear, because strain is also increasing with decreasing distance towards a thrust within a thrust imbricate (Fig. 3) (cf. Schöfisch et al., 2022).
The magnetic fabric changes with increasing strain (e.g. Borradaile and Henry, 1997; Bakhtari et al., 1998; Parés et al., 1999), and analysing the degree of anisotropy is a useful approach to illustrate changes in magnetic fabric in analogue models (Almqvist and Koyi, 2018; Schöfisch et al., 2020, 2022). For example, Schöfisch et al. (2022) showed that a decrease in the degree of anisotropy occurs with decreasing distance to a thrust. Generally, AMS data from faults in shortened models show a lower degree of anisotropy compared to the data from areas away from faults. This is also the case in extensional settings, e.g. in Model I, where AMS data from the normal faults highlight this observation, but it is apparent that the change in the degree of anisotropy is abrupt between normal faults and farther away from the faults (Fig. 3). As discussed above (Sect. 4.1), there is almost no penetrative strain developing within the footwall and hanging wall during extension. Normal faults develop from the onset of model extension (V1–V2 in the Supplement), illustrating a distinct difference between magnetic fabric away from faults and within/along faults. In contrast, in a compressional regime, penetrative strain (and kinking) precedes thrusting, which needs a larger amount of model shortening before a thrust is created, compared to the amount of model extension that is needed for the formation of a normal fault (V1–V2 in the Supplement). Penetrative strain is an important factor in changing the magnetic fabric and describes the transition of changes in magnetic fabric between the initial fabric to a thrust-induced fabric. In summary, unlike models II and III, which show a gradual transition in the degree of anisotropy across the models, Model I developed no gradual but distinct change in the degree of anisotropy with distance to a fault (comparing the slope of dashed lines from Model I with models II and III in Fig. 3a, b, and d). In addition, comparing models II and III, the gradient in the degree of anisotropy becomes clearer with increasing bulk shortening (i.e. a larger difference in Pj between faults and areas away from faults), which is similar to observations by Schöfisch et al. (2022). The decreasing gradient in the degree of anisotropy and, in general, the change in magnetic fabric with distance to faults (including principal axes orientations with confidence ellipses, shape, and degree of anisotropy of magnetic ellipsoid) are distinct features that describe the difference between extensional and compressional tectonic regimes.
5.1 Depicting deformation and changes in deformation by AMS
Applying AMS allows visualizing deformation in sandbox models (Almqvist and Koyi, 2018; Schöfisch et al., 2020, 2022). In the models of this study, the magnetic fabric also reflects deformation and the development of structures. In addition, this study reveals an overprint of magnetic fabric due to inversion; specifically, differences are monitored between extensional to compressional tectonic environments. Extension did not result in penetrative strain in the models, which is indicated by a persistent initial fabric throughout the hanging wall (i.e. graben) and footwalls of Model I as well as the sharp change in the degree of anisotropy between normal faults and in areas away from the faults. In contrast, in shortened models (e.g. Schöfisch et al., 2022) or inverted models (models II and III of this study), shortening leads to the development of penetrative strain in areas away from the faults. Consequently, the magnetic fabric is sensitive to strain changes in compressional regimes, but further studies are required for depicting extensional fabrics in more detail in sandbox models.
As the models simulate brittle behaviour of upper crustal rocks without taking into account processes like crystal–plastic deformation, fluid migration, and recrystallization of magnetic contributors (i.e. changes in magnetic mineralogy and development of sub-fabrics), changes to the initial fabric in the models are solely related to grain reorientation. Such a modelling setup and the combination of sandbox modelling with magnetic fabric analyses enables investigation, visualization, and highlighting the importance of grain reorientation in natural analogues.
5.2 Outlook: from limitations towards future models
As Eisenstadt and Sims (2005) and Deng et al. (2019) documented, there is no or very limited reactivation of pre-existing normal faults during the inversion of such a model setup using loose sand above a ridged basal plate. In addition, an extensional fabric away from normal faults as observed in nature (e.g. Sagnotti et al., 1994; Mattei et al., 1997; Borradaile and Hamilton, 2004; Cifelli et al., 2005) is not displayed in these models. Therefore, it may be necessary to prepare similar experiments simulating the development of a basin and its inversion with higher complexity, e.g. testing syntectonic basin sedimentation to create magnetic lineation in basin fill or using different materials (e.g. wet clay) to produce extensional structures (e.g. roll-over anticlines; cf. Eisenstadt and Withjack, 1995; Eisenstadt and Sims, 2005). Moreover, different materials (Eisenstadt and Sims, 2005), oblique inversion (Nalpas et al., 1995; Brun and Nalpas, 1996; Dubois et al., 2002; Deng et al., 2019), or different modelling setups with viscous décollement (e.g. Roca et al., 2006; Del Ventisette et al., 2006, and references therein) lead to a reactivation of normal faults within the models. In such cases, investigating a magnetic fabric overprint due to fault reactivation is of great interest.
Three sandbox models were created to investigate the magnetic fabric in similar structures at different stages of basin inversion. Two distinct magnetic fabrics are observed in the extension model (Model I): an initial fabric away from the faults and a fabric affected by normal faulting. In models which underwent inversion (i.e. models II and III), the magnetic fabric is overprinted by layer-parallel shortening (i.e. penetrative strain), developing a penetrative strain-induced fabric.
During inversion of models II and III, thrusts formed with different stages of thrust maturity. This different thrust maturity is also reflected in the magnetic fabric and shows a different degree of alignment of the magnetic foliation parallel to the thrust surface. Although normal faults and thrusts showed a similar amount of displacement, their magnetic fabric differs from each other; thrusting is more efficient in aligning the magnetic fabric along the fault surface compared to normal faults.
During inversion, the pre-existing normal faults define weak zones within a developing pop-up structure and passively rotate even though they show very little sign of inverted kinematics. This deformation is manifested by fault steepening that affects the magnetic fabric to become similar to a penetrative strain-induced fabric.
Irrespective of the orientations of the principal axes, changes and gradients in the degree of anisotropy are identified depicting changes in the deformation pattern in the models. In extended models (Model I), the magnetic fabrics from different parts of the model are distinct from each other. However, the magnetic fabric in the inverted models shows an overprint from initial fabric towards penetrative strain-induced fabric, which develops into a fault-induced fabric along the thrusts.
The AMS data from the three models of this study are published at the open-source online data repository hosted by Mendeley Data with the following DOI: https://doi.org/10.17632/bcxzzyrzj3.1 (Schöfisch, 2022).
Additional figures with explanation for this study are summarized in the Supplement. The Supplement includes figures and tables analysing the narrowing of the basin during inversion (Fig. S1) as well as an advanced analysis of the structure-to-sample-size ratio for AMS data at the faults (Fig. S2). The Supplement also includes a figure comparing the mean of the principal axes with the size of confidence ellipses for the areas away from faults (Fig. S3). Additionally, two GIF files show the structural development of models II and III as short time-lapsed videos (V1 and V2 in the Supplement). The supplement related to this article is available online at: https://doi.org/10.5194/se-14-447-2023-supplement.
TS: conceptualization, methodology, formal analysis, interpretation, writing – original draft, writing – review & editing, visualization; HK and BA: interpretation, writing – review & editing, supervision, funding acquisition.
The contact author has declared that none of the authors has any competing interests.
Publisher’s note: Copernicus Publications remains neutral with regard to jurisdictional claims in published maps and institutional affiliations.
This article is part of the special issue “Analogue modelling of basin inversion”. It is not associated with a conference.
Thanks are due to LKAB Minerals Luleå (Sweden) for providing the magnetite for modelling. Moreover, we thank Frank Zwaan for editorial handling and comments. We are grateful for the reviews by Michele Cooke, Kenneth Kodama, and Cristina García-Lasanta.
This research has been supported by the Vetenskapsrådet (grant no. 2017-04519).
This paper was edited by Frank Zwaan and reviewed by Kenneth Kodama, Michele Cooke, and Cristina García-Lasanta.
Allen, M., Poggiali, D., Whitaker, K., Marshall, T. R., van Langen, J., and Kievit, R. A.: Raincloud plots: a multi-platform tool for robust data visualization, Wellcome Open Res., 4, 63, https://doi.org/10.12688/wellcomeopenres.15191.2, 2021.
Almqvist, B. S. G. and Koyi, H.: Bulk strain in orogenic wedges based on insights from magnetic fabrics in sandbox models, Geology, 46, 483–486, https://doi.org/10.1130/G39998.1, 2018.
Averbuch, O., Frizon de Lamotte, D., and Kissel, C.: Magnetic fabric as a structural indicator of the deformation path within a fold-thrust structure: a test case from the Corbières (NE Pyrenees, France), J. Struct. Geol., 14, 461–474, https://doi.org/10.1016/0191-8141(92)90106-7, 1992.
Bakhtari, H. R., Frizon de Lamotte, D., Aubourg, C., and Hassanzadeh, J.: Magnetic fabrics of Tertiary sandstones from the Arc of Fars (Eastern Zagros, Iran), Tectonophysics, 284, 299–316, https://doi.org/10.1016/S0040-1951(97)00179-0, 1998.
Bonini, M., Sani, F., and Antonielli, B.: Basin inversion and contractional reactivation of inherited normal faults: A review based on previous and new experimental models, Tectonophysics, 522–523, 55–88, https://doi.org/10.1016/j.tecto.2011.11.014, 2012.
Borradaile, G. J.: Magnetic susceptibility, petrofabrics and strain, Tectonophysics, 156, 1–20, https://doi.org/10.1016/0040-1951(88)90279-X, 1988.
Borradaile, G. J.: Correlation of strain with anisotropy of magnetic susceptibility (AMS), Pure Appl. Geophys., 135, 15–29, https://doi.org/10.1007/BF00877006, 1991.
Borradaile, G. J. and Hamilton, T.: Magnetic fabrics may proxy as neotectonic stress trajectories, Polis rift, Cyprus, Tectonics, 23, TC1001, https://doi.org/10.1029/2002TC001434, 2004.
Borradaile, G. J. and Henry, B.: Tectonic applications of magnetic susceptibility and its anisotropy, Earth-Sci. Rev., 42, 49–93, https://doi.org/10.1016/S0012-8252(96)00044-X, 1997.
Borradaile, G. J. and Jackson, M.: Anisotropy of magnetic susceptibility (AMS); magnetic petrofabrics of deformed rocks, Geol. Soc. Spec. Publ., 238, 299–360, 2004.
Brun, J.-P. and Nalpas, T.: Graben inversion in nature and experiments, Tectonics, 15, 677–687, https://doi.org/10.1029/95TC03853, 1996.
Burgin, H. B., Robion, P., and Amrouch, K.: Layer parallel stretching? Characterising magnetic and pore-fabric styles at a rifted continental margin: New insights from the Otway Ranges, Australia, Tectonophysics, 815, 228975, https://doi.org/10.1016/j.tecto.2021.228975, 2021.
Burmeister, K. C., Harrison, M. J., Marshak, S., Ferré, E. C., Bannister, R. A., and Kodama, K. P.: Comparison of Fry strain ellipse and AMS ellipsoid trends to tectonic fabric trends in very low-strain sandstone of the Appalachian fold-thrust belt, J. Struct. Geol., 31, 1028–1038, 2009.
Cifelli, F., Mattei, M., Chadima, M., Hirt, A. M., and Hansen, A.: The origin of tectonic lineation in extensional basins: Combined neutron texture and magnetic analyses on “undeformed” clays, Earth Planet. Sc. Lett., 235, 62–78, https://doi.org/10.1016/j.epsl.2005.02.042, 2005.
De Lamotte Frizon, D., Souque, C., Grelaud, S., and Robion, P.: Early record of tectonic magnetic fabric during inversion of a sedimentary basin – short review and examples from the Corbières transfer zone (France), B. Soc. Geol. Fr., 173, 461–469, https://doi.org/10.2113/173.5.461, 2002.
Del Ventisette, C., Montanari, D., Sani, F., and Bonini, M.: Basin inversion and fault reactivation in laboratory experiments, J. Struct. Geol., 28, 2067–2083, https://doi.org/10.1016/j.jsg.2006.07.012, 2006.
Deng, H., Koyi, H. A., and Zhang, J.: Modelling oblique inversion of pre-existing grabens, Geol. Soc. Spec. Publ., 487, 263–290, https://doi.org/10.1144/SP487.5, 2019.
Dubois, A., Odonne, F., Massonnat, G., Lebourg, T., and Fabre, R.: Analogue modelling of fault reactivation: tectonic inversion and oblique remobilisation of grabens, J. Struct. Geol., 24, 1741–1752, https://doi.org/10.1016/S0191-8141(01)00129-8, 2002.
Eisenstadt, G. and Sims, D.: Evaluating sand and clay models: Do rheological differences matter?, J. Struct. Geol., 27, 1399–1412, https://doi.org/10.1016/j.jsg.2005.04.010, 2005.
Eisenstadt, G. and Withjack, M. O.: Estimating inversion: Results from clay models, Geol. Soc. Spec. Publ., 88, 119–136, https://doi.org/10.1144/GSL.SP.1995.088.01.08, 1995.
García-Lasanta, C., Oliva-Urcia, B., Román-Berdiel, T., Casas, A. M., and Hirt, A. M.: Understanding the Mesozoic kinematic evolution in the Cameros basin (Iberian Range, NE Spain) from magnetic subfabrics and mesostructures, J. Struct. Geol., 66, 84–101, https://doi.org/10.1016/j.jsg.2014.05.013, 2014.
García-Lasanta, C., Oliva-Urcia, B., Román-Berdiel, T., Casas, A. M., Gil-Peña, I., Sánchez-Moya, Y., Sopeña, A., Hirt, A. M., and Mattei, M.: Evidence for the Permo-Triassic transten- sional rifting in the Iberian Range (NE Spain) according to magnetic fabrics results, Tectonophysics, 651–652, 216–231, https://doi.org/10.1016/j.tecto.2015.03.023, 2015.
García-Lasanta, C., Izquierdo-llavall, E., and Román-Berdiel, T.: Análisis de la fábrica magnética en modelos analógicos de arcillas (Magnetic fabric analysis in analogue models of clays), Geogaceta, 61, 103–106, 2017.
García-Lasanta, C., Oliva-Urcia, B., Casas-Sainz, A. M., Román-Berdiel, T., Izquierdo-Llavall, E., Soto, R., Calvín, P., Moussaid, B., El Ouardi, H., Kullberg, J. C., and Villalaín, J. J.: Inversion tectonics and magnetic fabrics in Mesozoic basins of the Western Tethys: A review, Tectonophysics, 745, 1–23, https://doi.org/10.1016/j.tecto.2018.08.005, 2018.
Hirt, A. M., Lowrie, W., Clendenen, W. S., and Kligfield, R.: The correlation of magnetic anisotropy with strain in the Chelmsford Formation of the Sudbury Basin, Ontario, Tectonophysics, 145, 177–189, https://doi.org/10.1016/0040-1951(88)90194-1, 1988.
Housen, B. A., Richter, C., and van der Pluijm, B. A.: Composite magnetic anisotropy fabrics: experiments, numerical models and implications for the quantification of rock fabrics, Tectonophysics, 220, 1–12, https://doi.org/10.1016/0040-1951(93)90219-A, 1993.
Hrouda, F.: Magnetic anisotropy of rocks and its application in geology and geophysics, Geophys. Surv., 5, 37–82, https://doi.org/10.1007/BF01450244, 1982.
Hrouda, F. and Janák, F.: The changes in shape of the magnetic susceptibility ellipsoid during progressive metamorphism and deformation, Tectonophysics, 34, 135–148, https://doi.org/10.1016/0040-1951(76)90181-5, 1976.
Jelínek, V.: The statistical theory of measuring anisotropy of magnetic susceptibility of rocks and its application, Geofyzika Brno, 87, 88 pp., https://www.agico.com/downloads/documents/agicoprints/statistical_theory.pdf (last access: 25 April 2023), 1977.
Jelinek, V.: Characterization of the magnetic fabric of rocks, Tectonophysics, 79, T63–T67, https://doi.org/10.1016/0040-1951(81)90110-4, 1981.
Kligfield, R., Owens, W. H., and Lowrie, W.: Magnetic susceptibility anisotropy, strain, and progressive deformation in Permian sediments from the Maritime Alps (France), Earth Planet. Sc. Lett., 55, 181–189, https://doi.org/10.1016/0012-821X(81)90097-2, 1981.
Koyi, H.: Mode of internal deformation in sand wedges, J. Struct. Geol., 17, 293–300, https://doi.org/10.1016/0191-8141(94)00050-A, 1995.
Koyi, H. A., Sans, M., Teixell, A., and Zeyen, H.: The Significance of Penetrative Strain in the Restoration of Shortened Layers-Insights from Sand Models and the Spanish Pyrenees, Thrust Tectonics and Hydrocarbon Systems: AAPG Memoir, American Association of Petroleum Geologists, 82, 1–16, https://doi.org/10.1306/M82813C11, 2003.
Marcén, M., Román-Berdiel, T., Casas-Sainz, A. M., Soto, R., Oliva-Urcia, B., and Castro, J.: Strain variations in a seismogenic normal fault (Baza Sub-basin, Betic Chain): Insights from magnetic fabrics (AMS), Tectonophysics, 765, 64–82, https://doi.org/10.1016/j.tecto.2019.05.014, 2019.
Mattei, M., Sagnotti, L., Faccena, C., and Funiciello, R.: Magnetic fabric of weakly deformed clay-rich sediments in the extensional tectonics, Tectonophysics, 271, 107–122, 1997.
Mattei, M., Speranza, F., Argentieri, A., Rossetti, F., Sagnotti, L., and Funiciello, R.: Extensional tectonics in the Amantea basin (Calabria, Italy): A comparison between structural and magnetic anisotropy data, Tectonophysics, 307, 33–49, https://doi.org/10.1016/S0040-1951(99)00117-1, 1999.
Mulugeta, G. and Koyi, H.: Episodic accretion and strain partitioning in a model sand wedge, Tectonophysics, 202, 319–333, https://doi.org/10.1016/0040-1951(92)90117-O, 1992.
Nalpas, T., Le Douaran, S., Brun, J.-P., Unternehr, P., and Richert, J.-P.: Inversion of the Broad Fourteens Basin (offshore Netherlands), a small-scale model investigation, Sediment. Geol., 95, 237–250, https://doi.org/10.1016/0037-0738(94)00113-9, 1995.
Oliva-Urcia, B., Casas, A. M., Soto, R., Villalaín, J. J., and Kodama, K.: A transtensional basin model for the Organyà basin (central southern Pyrenees) based on magnetic fabric and brittle structures, Geophys. J. Int., 184, 111–130, https://doi.org/10.1111/j.1365-246X.2010.04865.x, 2010.
Oliva-Urcia, B., Román-Berdiel, T., Casas, A. M., Bogalo, M. F., Osácar, M. C., and García-Lasanta, C.: Transition from extensional to compressional magnetic fabrics in the cretaceous Cabuérniga basin (North Spain), J. Struct. Geol., 46, 220–234, https://doi.org/10.1016/j.jsg.2012.09.001, 2013.
Oliva-Urcia, B., Casas, A. M., Moussaid, B., Villalaín, J. J., El Ouardi, H., Soto, R., Torres-López, S., and Román-Berdiel, T.: Tectonic fabrics vs. mineralogical artifacts in AMS analysis: a case study of the Western Morocco extensional Triassic basins, J. Geodynam., 94–95, 13–33, https://doi.org/10.1016/j.jog.2016.01.004, 2016.
Parés, J. M.: Sixty years of anisotropy of magnetic susceptibility in deformed sedimentary rocks, Front. Earth Sci., 3, 1–13, https://doi.org/10.3389/feart.2015.00004, 2015.
Parés, J. M. and Van Der Pluijm, B. A.: Evaluating magnetic lineations (AMS) in deformed rocks, Tectonophysics, 350, 283–298, https://doi.org/10.1016/S0040-1951(02)00119-1, 2002.
Parés, J. M., Van der Pluijm, B. A., and Dinarès-Turell, J.: Evolution of magnetic fabrics during incipient deformation of mudrocks (Pyrenees, northern Spain), Tectonophysics, 307, 1–14, https://doi.org/10.1016/S0040-1951(99)00115-8, 1999.
Roca, E., Sans, M., and Koyi, H. A.: Polyphase deformation of diapiric areas in models and in the eastern Prebetics (Spain), AAPG Bull., 90, 115–136, https://doi.org/10.1306/07260504096, 2006.
Rochette, P., Jackson, M., and Aubourg, C.: Rock magnetism and the interpretation of anisotropy of magnetic susceptibility, Rev. Geophys., 30, 209–226, https://doi.org/10.1029/92RG00733, 1992.
Sagnotti, L., Faccenna, C., Funiciello, R., and Mattei, M.: Magnetic fabric and structural setting of Plio-Pleistocene clayey units in an extensional regime: the Tyrrhenian margin of central Italy, J. Struct. Geol., 16, 1243–1257, https://doi.org/10.1016/0191-8141(94)90067-1, 1994.
Sassi, W., Colletta, B., Balé, P., and Paquereau, T.: Modelling of structural complexity in sedimentary basins: The role of pre-existing faults in thrust tectonics, Tectonophysics, 226, 97–112, https://doi.org/10.1016/0040-1951(93)90113-X, 1993.
Schöfisch, T.: Magnetic Fabric Distribution in inverted Basin Sandbox Models, Mendeley Data, V1 [data set], https://doi.org/10.17632/bcxzzyrzj3.1, 2022.
Schöfisch, T., Koyi, H., and Almqvist, B.: Influence of décollement friction on anisotropy of magnetic susceptibility in a fold-and-thrust belt model, J. Struct. Geol., 144, 104274, https://doi.org/10.1016/j.jsg.2020.104274, 2020.
Schöfisch, T., Koyi, H., and Almqvist, B.: Magnetic Fabric Signature Within a Thrust Imbricate; an Analog Modeling Approach, Tectonics, 41, 1–18, https://doi.org/10.1029/2021TC007054, 2022.
Soto, R., Casas-Sainz, A. M., Villalaín, J. J., and Oliva-Urcia, B.: Mesozoic extension in the Basque-Cantabrian basin (N Spain). Contributions from AMS and brittle mesostructures, Tectonophysics, 445, 373–394, https://doi.org/10.1016/j.tecto.2007.09.007, 2007.
Soto, R., Casas-Sainz, A. M., Villalaín, J. J., Gil-Imaz, A., Fernández-González, G., Del Río, P., Calvo, M., and Mochales, T.: Characterizing the Mesozoic extension direction in the northern Iberian plate margin by anisotropy of magnetic susceptibility (AMS), J. Geol. Soc., 165, 1007–1018, https://doi.org/10.1144/0016-76492007-163, 2008.
Soto, R., Kullberg, J. C., Oliva-Urcia, B., Casas-Sainz, A. M., and Villalaín, J. J.: Switch of Mesozoic extensional tectonic style in the Lusitanian basin (Portugal): Insights from magnetic fabrics, Tectonophysics, 536-537, 122–135, https://doi.org/10.1016/j.tecto.2012.03.010, 2012.
Soto, R., Larrasoaña, J. C., Beamud, E., and Garcés, M.: Early-Middle Miocene subtle compressional deformation in the Ebro foreland basin (northern Spain); insights from magnetic fabrics, C. R. Geosci., 348, 213–223, https://doi.org/10.1016/j.crte.2015.10.009, 2016.
Tong, H., Koyi, H., Huang, S., and Zhao, H.: The effect of multiple pre-existing weaknesses on formation and evolution of faults in extended sandbox models, Tectonophysics, 626, 197–212, https://doi.org/10.1016/j.tecto.2014.04.046, 2014.
- Abstract
- Introduction
- Methods
- Results
- Discussion
- Advantages, limitations, and future perspectives of applying AMS to a basin and basin inversion models
- Conclusions
- Data availability
- Author contributions
- Competing interests
- Disclaimer
- Special issue statement
- Acknowledgements
- Financial support
- Review statement
- References
- Supplement