the Creative Commons Attribution 4.0 License.
the Creative Commons Attribution 4.0 License.
 | 14 Jul 2023
Does the syn- versus post-rift thickness ratio have an impact on the inversion-related structural style?
Alexandra Tamas
Gabor Tari
Csaba Krezsek
Alexandru Lapadat
Zsolt Schleder
Many extensional basins worldwide are modified by subsequent compressional episodes, which lead to inverted structures. The structures associated with the reactivation of pre-existing faults are critically important in the formation of suitable subsurface traps for hydrocarbons. Major concerns regarding inverted structures are the trap integrity and fault seal. In general, the preferred structures have simple four-way closures due to the minor forced folding of the post-rift cover, as opposed to (reverse) fault-related structures, which have a higher risk of breaching. Such reverse-fault-bounded structures have been generally observed in basins with a thick syn-rift fill and a relatively thin post-rift sequence at the time of inversion (Mode I). In contrast, gentle/open forced folds have been described in basins with thicker post-rift sequences than the syn-rift basin fill (Mode II).
Five physical sandbox models, coupled with particle image velocimetry (PIV) analysis, have been performed to address the influence of the syn- versus post-rift thickness ratio on the inversion-related structural style of the post-rift cover.
The main control on the development of Mode I or Mode II inversion structures within the post-rift sequence appears to be different due to the amount of compressional displacement accommodated by the inherited listric fault and the thickness of the post-rift cover.
These observations do have a direct impact on the understanding of the geo-energy systems associated with inverted structures and are broadly comparable with natural data examples from Aotearoa/New Zealand, Israel, Romania, and the Republic of Türkiye.
- Article
(22705 KB) - Full-text XML
- BibTeX
- EndNote


The concept of structural inversion is more than a century old (e.g. Lamplugh, 1919); however, the first generalized description of inversion was offered by Bally (1984). Since then, the inversion tectonics plays an important role both in scientific research but more importantly for socioeconomic purposes (see Zwaan et al., 2022, and references therein).
To understand the structures and the factors controlling the structural style, inversion tectonics has been intensively studied in outcrops (Krzywiec et al., 2009; Uzkeda et al., 2018; Dichiarante et al., 2021; Tamas et al., 2022a), interpreted in the subsurface (Badley et al., 1989; Roberts, 1989; Krzywiec et al., 2009, 2018; Bosworth and Tari, 2021; Tamas et al., 2022b), and modelled physically and numerically (e.g. McClay, 1989, 1995; Buchanan and McClay, 1991; Mitra and Islam, 1994; Yamada and McClay, 2004; Panien et al., 2005; Buiter et al., 2009; Bonini et al., 2012; Granado and Ruh, 2019; Zwaan et al., 2022, and references therein).
The term “inversion” has a broad meaning in geoscience; in this study, we focus on positive structural inversion, which characterizes sedimentary basins that have changed during their evolution from subsidence to uplift (Harding, 1985). Hence, the term inversion in this paper is referring exclusively to this type of inversion.
The structural styles associated with (positive) inversion are generally well studied and understood and characterized by high angle out-of-graben thrusts, footwall shortcut thrusts, back thrusts, forced folds, or growth anticlines, among others (McClay and Buchanan, 1992).
Moreover, several factors controlling the structural style of the basin inversion have been invoked, which include the strike and dip of the precursor faults (Gillcrist et al., 1987), pre-existing extensional fault plane geometries (planar, listric, and stepped; Gillcrist et al., 1987; McClay and Buchanan, 1992; Ferrer et al., 2017; Phillips et al., 2020), the architecture of the basin before inversion (Sieberer et al., 2023), the time interval since extension (e.g. Cooper and Warren, 2020), the amount of shortening relative to extension (e.g. Gillcrist et al., 1987; see also Mattioni et al., 2007, and references therein), the presence of salt/mechanical layering (e.g. Ferrer et al., 2017; Roma et al., 2018; Dooley and Hudec, 2020), and syn-tectonic erosion and sedimentation (e.g. Pinto et al., 2010).
In addition, Tari et al. (2020) observed a broad variation in the ratio between the thickness of the syn- versus post-rift successions in inverted structures, which seemed to correlate with the development of different inversion-related structures. Therefore, they suggested the subdivision of inversion tectonics into two modes. Mode I inversion structures are characterized by reverse-fault-bounded structures and developed when the syn-rift succession is thicker than the post-rift sequence. Mode II inversion structures are characterized by gentle-to-open forced folds occurring when the syn-rift strata are thinner than the post-rift ones. The majority of modelling efforts to date have addressed Mode I structures, even though there are numerous examples in nature where the inversion occurred in Mode II (Tari et al., 2020).
Based on numerous worldwide examples, mild-to-moderate inversion structures (Mode II; gentle-to-open forced folds) are mostly preferred as petroleum exploration targets (Bevan and Moustafa, 2012). Their closures have a relatively small vertical amplitude, are simple in a map view sense, and are well defined on seismic reflection data. These four-way closures typically cluster above extensional depocentres, which tend to contain source rocks that provide petroleum charge during and after inversion (Macgregor, 1995; Turner and Williams, 2004; Cooper and Warren, 2010, 2020; Bosworth and Tari, 2021). Reverse-fault-bounded inversion structures are generally not considered to be ideal exploration prospects, mainly due to the risk of breaching and also the associated seismic imaging challenges (Bevan and Moustafa, 2012). Migration also may pose a challenge due to structural complexity or the source rocks being uplifted above the hydrocarbon generation window (Tari et al., 2020, and references therein). In this paper, we described a set of analogue modelling experiments, with the original set-ups inspired by Ellis and McClay (1988) and Buchanan and McClay (1991), with the objective of improving our understanding regarding the control of syn- versus post-rift thickness ratios (Modes I and II proposed by Tari et al., 2020), in addition to the amount of shortening on fault propagation into the post-rift cover and structural style exerted by the inherited fault. Note that for the purpose of this paper, we strictly refer to “post-rift” as being the sequence up to the syn-inversion, and we do not include the post-inversion cover.
2.1 Experiment design and working hypothesis
A series of five analogue modelling experiments were conducted to test the Mode I and Mode II inversion categories by Tari et al. (2020; Fig. 1). The experiments were designed to test one parameter at a time and be comparable. The experiments were conducted with an initial phase of extension, followed by a shortening phase (positive inversion). The modelling rig and set-up (Fig. 2a) were inspired by the set-ups of Ellis and McClay (1988) and Buchanan and McClay (1991) and consist of a fixed-basement listric fault (footwall block), with a plastic sheet placed between the block and the (brittle only) modelling materials. The plastic sheet (Alkor foil) is mobile during extension (outward motion of the sidewall) because it is connected to the mobile wall. Prior to the compressional/inversion phase (inward motion of the wall), the plastic sheet is detached from the wall and fixed to a static part of the deformation rig, so that it would not become involved in the hanging wall deformation during the contractional phase (Fig. 2a).
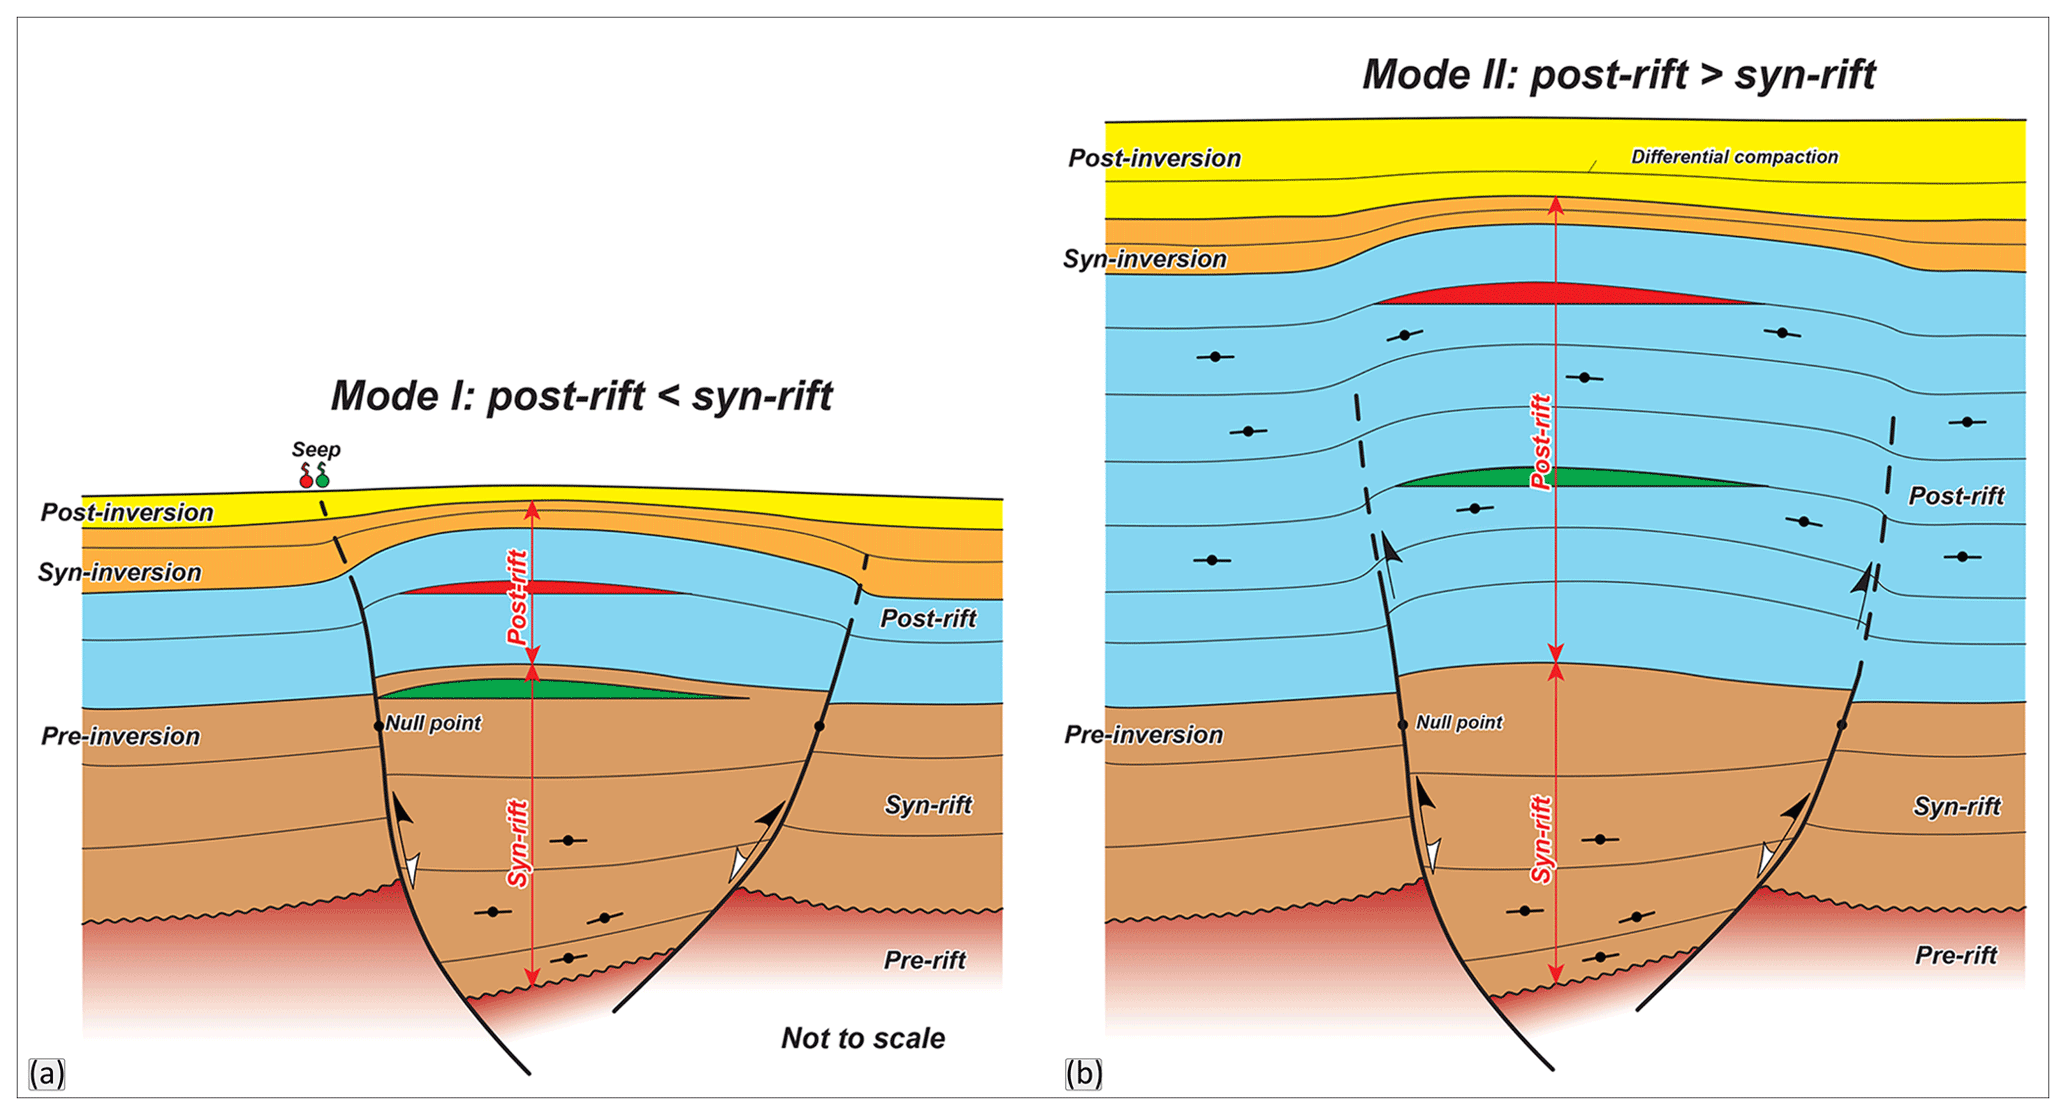
Figure 1Conceptual models showing Mode I and Mode II inversion (after Tari et al., 2020).
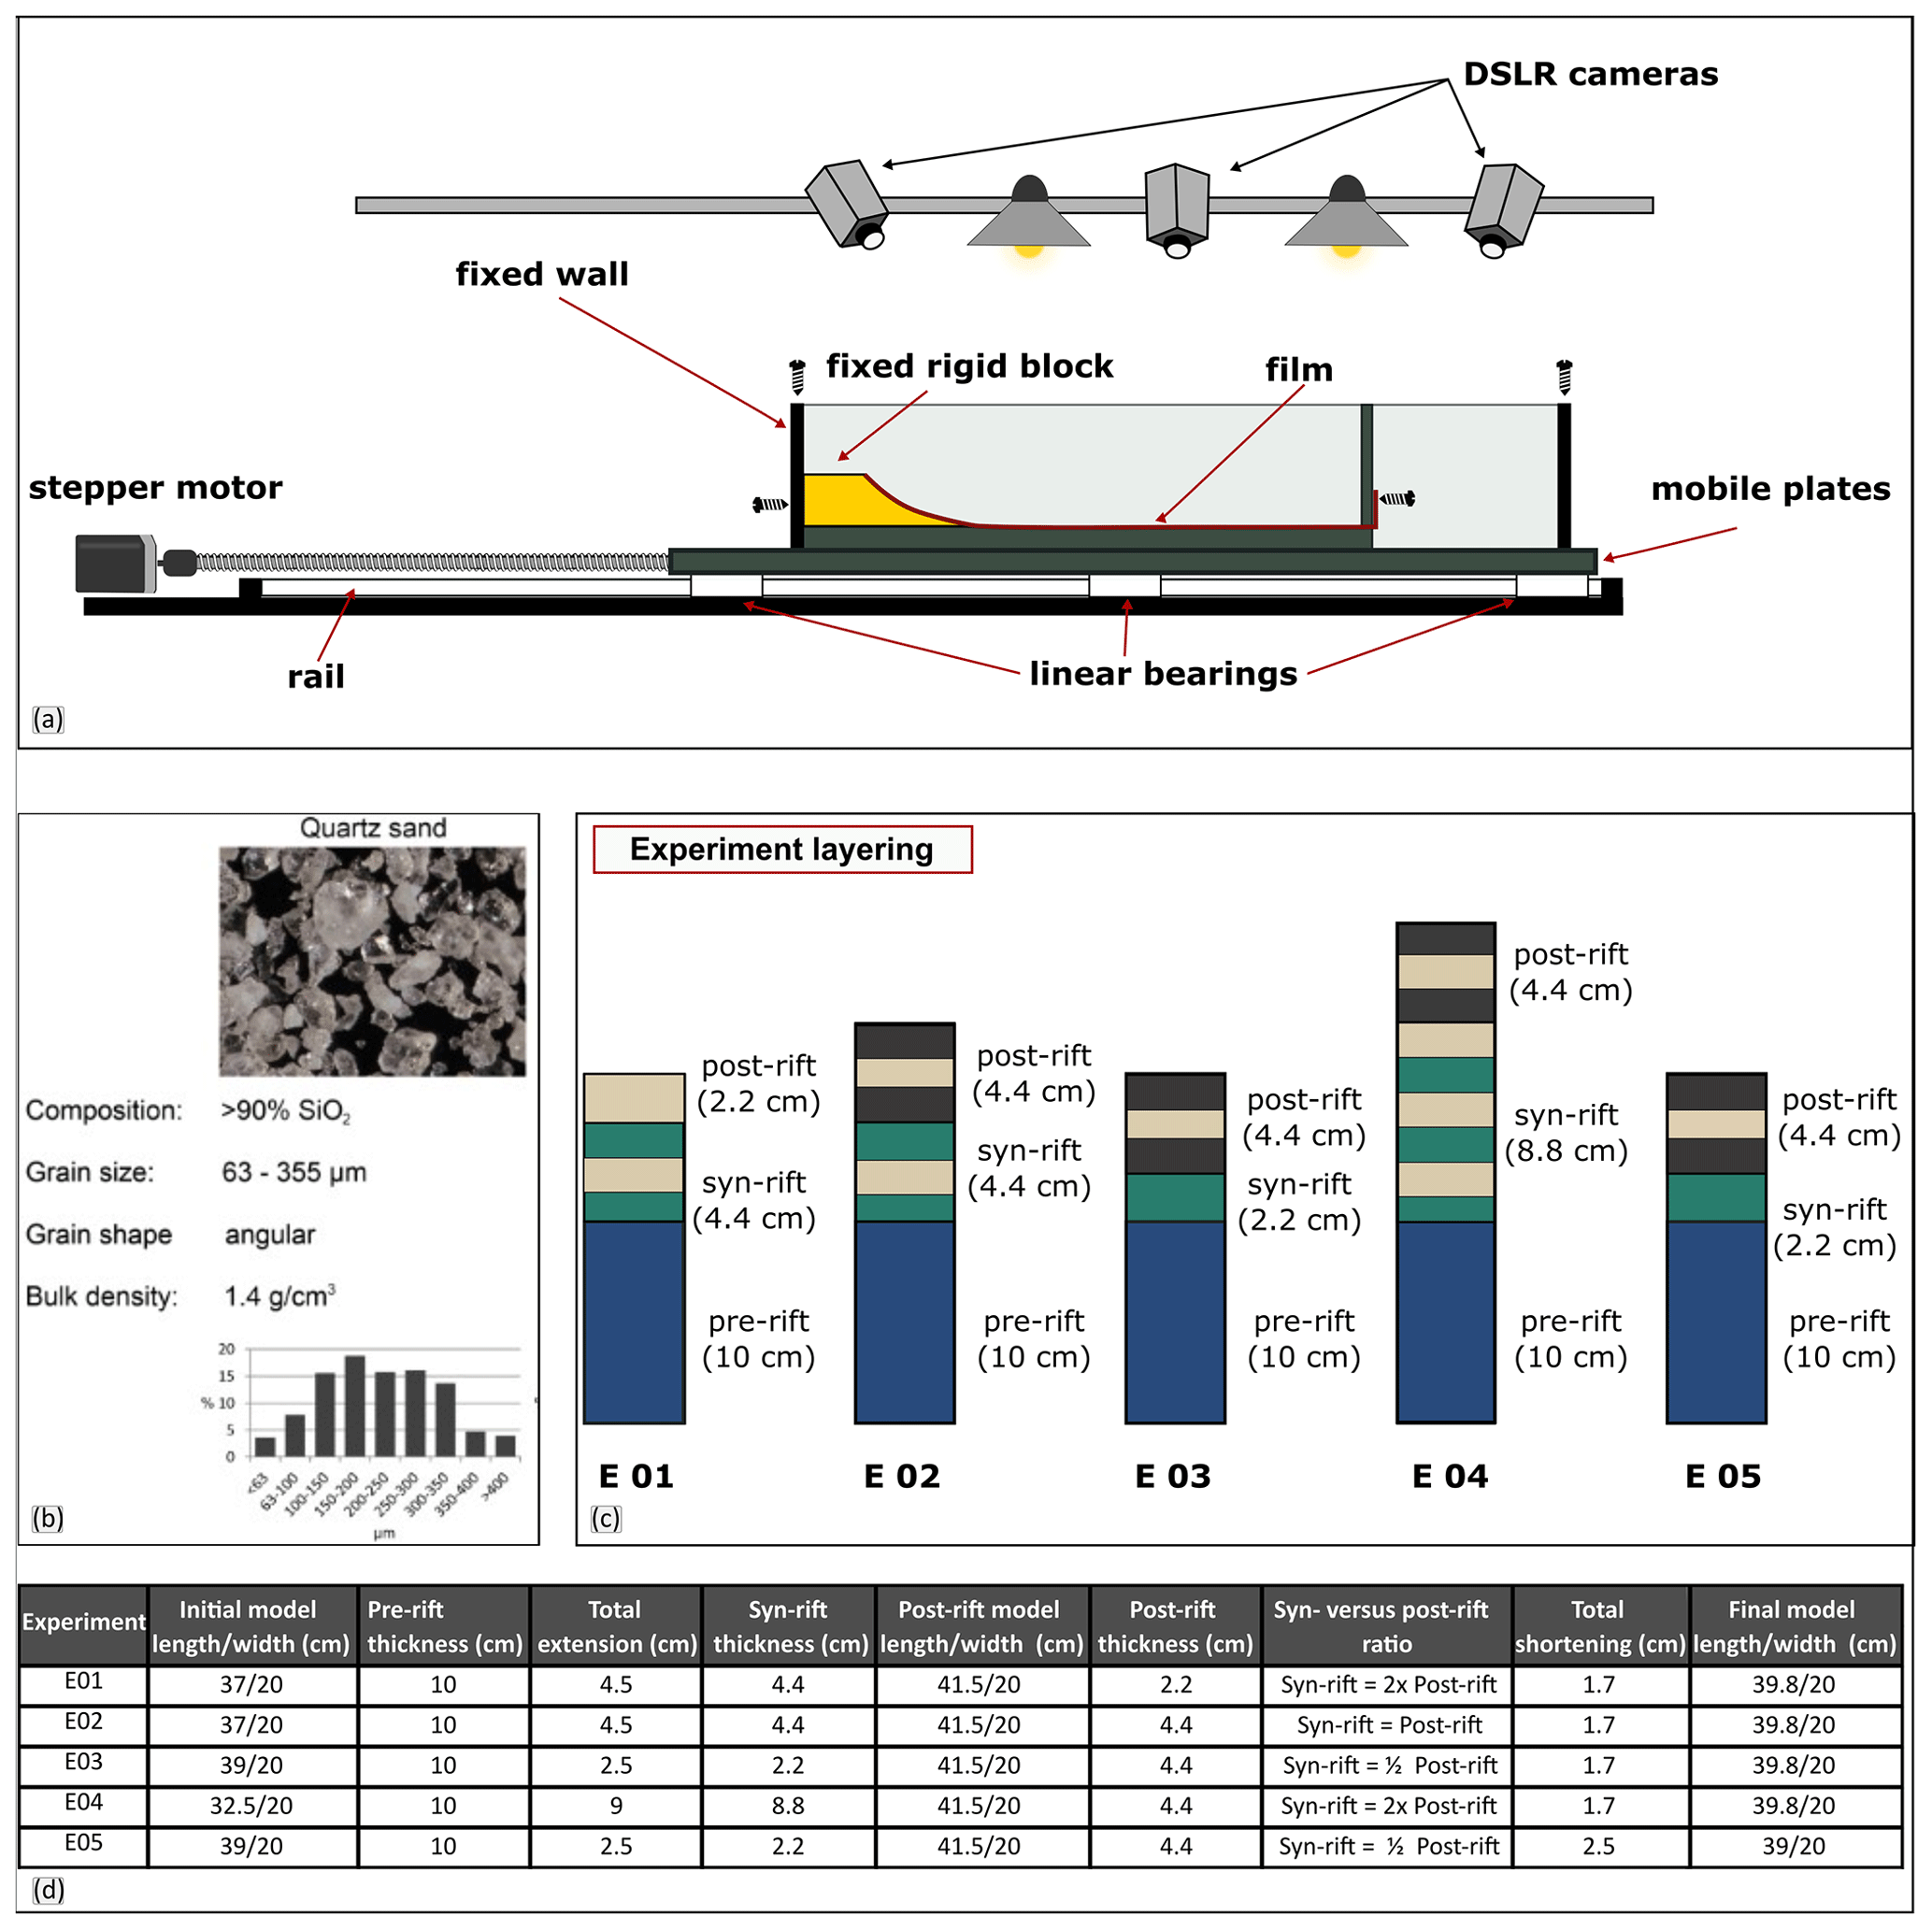
Figure 2Side view of experimental box and monitoring. (b) Properties of the granular material used for the experiments (Tamas et al., 2020). (c) Experiment layering. (d) Summary of the experimental set-up.
The fixed-footwall (basement) block was 3D printed to be 10 cm deep and 20 cm wide, with a listric geometry (cut-off angle of 60∘) similar to that of Buchanan and McClay (1991). The deformation was driven by a stepper motor, with an extension/compression rate of 5 mm min−1 All of the deformation was orthogonal, and there are no lateral variations in the set-up or materials within the models.
All of the experiments start with the same pre-extensional set-up that consists of a 10 cm thick stack of coloured sand layers (yellow–blue) in the hanging wall of a major listric fault (Fig. 2c and d). The applied extension is 2.5 cm in Experiments 3 and 5, 4.5 cm in Experiments 1 and 2, and 9 cm in Experiment 4 (Fig. 2d). Thus, the description of the development of the extensional geometries will be similar, as we have only three different extensional set-ups. All of the experiments were designed in such a way that the pre-inversion length of the experiments is the same and is, respectively, 41.5 cm (Fig. 2d). The results of such extensional set-ups and the development of such geometries have been described in great detail by other authors (e.g. Ellis and McClay, 1988; McClay, 1989; Yamada and McClay, 2004) and are not the main focus of this paper. The focus area will be the inversion part of the experiments, where the first four experiments describe a different syn- vs. post-rift thickness ratio set-up, and in the case of Experiment 5, a different amount of total inversion is applied.
2.2 Materials, scaling, and monitoring
The model layering is brittle only and is made out of dry, coloured, and cohesionless quartz sand, with an average grain size of 0.19 mm (Fig. 2b). Dry quartz sand has been proven as a suitable material and has often been used to model brittle inversion tectonics (e.g. Koopman et al., 1987; Buchanan and McClay, 1991; McClay and Buchanan, 1992; Yamada and McClay, 2004; Gomes et al., 2010; Molnar and Buiter, 2023). For a more detailed review of the inversion model set-ups and materials, see Zwaan et al. (2022). The models were constructed from alternating layers of yellow (light brown) and coloured sand that were sieved into the apparatus and scraped to the desired thickness. Pre-rift strata consisted of alternating blue–yellow sand layers, whereas syn-extensional strata were green–yellow sand layers. A thin layer of black sand was sieved between each coloured layer in order to increase the contrast and facilitate interpretation. At the end of extension, an alternating sequence of black–yellow sand was added. No syn-kinematic layers were added during inversion.
The length scaling ratio of the models to natural structures is approximately 10–5; thus, 1 cm in the model scales to approximately 1 km in nature (Ellis and McClay, 1988; Buchanan and McClay, 1991; Yamada and McClay, 2004).
Deformation within the models was recorded by several techniques. The surface (top view) strain was recorded by time-lapse photography taken with two DSLR (digital single-lens reflex) cameras placed at an angle at the top of the experiment. These photos were later processed in StrainMaster (LaVision) to perform 3D particle image velocimetry (PIV), which is a 3D digital image correlation technique used to extract information regarding, for example, the total or incremental shortening, velocity, displacement vectors, and strain (e.g. Adam et al., 2005).
The temperature and humidity laboratory conditions are maintained constant (23 ∘C ± 3, 45 % ± 5).
At the final stage of the experiments, the models were wetted and consolidated with a 10 % gelatine–water solution. Serial vertical sections were cut every 2 cm, photographed, and interpreted.
2.3 Experimental limitations
One of the limitations of analogue modelling experiments is represented by the edge effects generated by the friction with the side walls, and these effects are visible in the top-view PIV data. These effects were reduced, but not eliminated, by coating the walls with a hydrophobic silicone polymer (Rain-X; Cubas et al., 2013; Tamas et al., 2020). The sections on which the results of this paper were based are further away from the side walls (at least 4 cm).
Determining the presence of faults in small offset areas within the models was sometimes difficult because the faults are not always represented by a single shear plane but by a series of shear bands/shear zones. This is due to the relatively large grain size of the modelling materials as compared to nature.
3.1 Experiment 1
This experiment (Fig. 3) consisted of an extensional part, with 4.5 cm total extension, with the addition of successive growth layers of sand (green–yellow) for every 1.5 cm of extension. The maximum thickness of the growth strata is 4.4 cm at the end of extension (Fig. 2c and d).
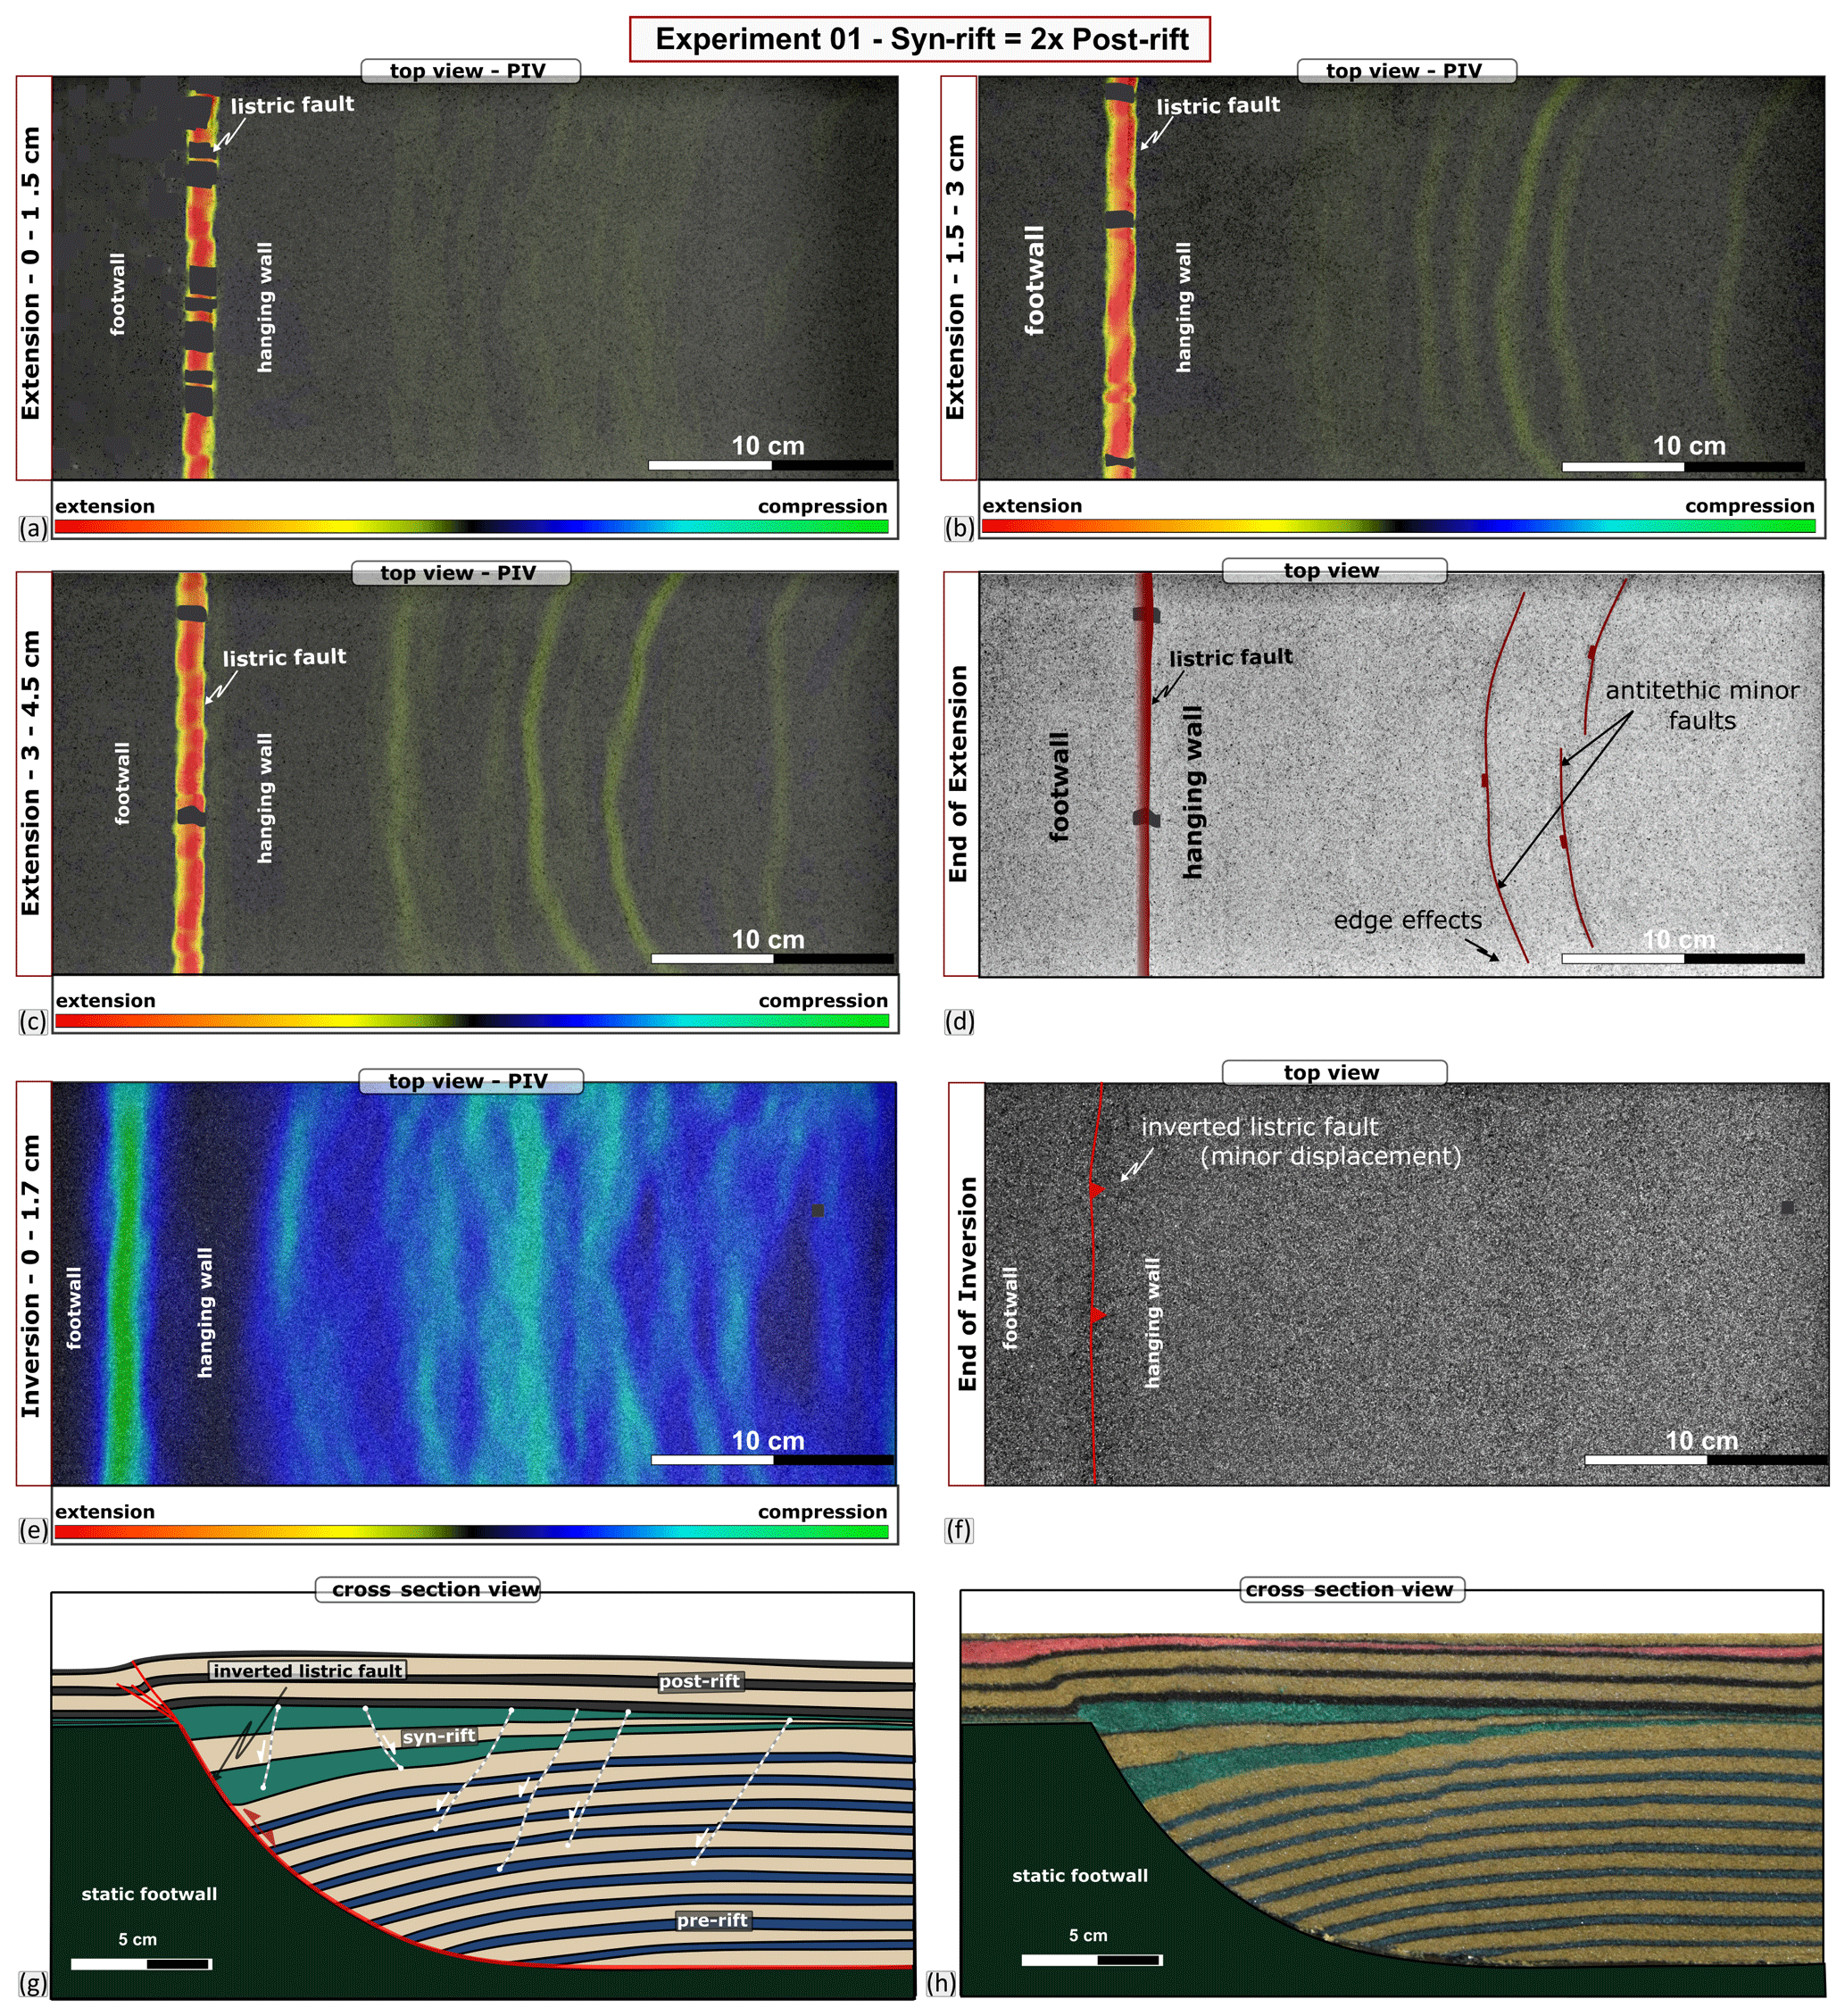
Figure 3Results of Experiment 1. (a–c) The PIV map during the syn-sedimentary phase displaying the high extensional strain associated with the listric fault (bright red) and areas with (a) diffuse extensional strain (yellow) and (b, c) localized extensional strain in the hanging wall block. (d) Top view of Experiment 1 at the end of the extension. (e) PIV map during the inversion phase displaying the high compressional strain above the inverted listric fault (bright green) and areas with diffuse-to-localized compressional strain (green). (f) Top view of Experiment 1 at the end of the inversion. (g) Interpreted and (h) uninterpreted cross section through the experiment.
In the first phase of the extension, the deformation started with the development of a roll-over anticline and block rotation. This led to areas with diffuse extensional strain forming in the area separating the non-rotational zone of the hanging wall from the zone of predominant rotation (above the listric fault; Fig. 3a). During the second stage of the extension, with an additional 1.5 cm of the extension, the areas of diffuse extensional strain become more localized (Fig. 3b). The first faults bounding the crestal collapse graben start to develop, with most of them being antithetic faults.
At the end of the third extensional phase, with a further 1.5 cm of the extension, very clear areas of localized extension could be identified in the PIV data (Fig. 3c). In addition, several clear antithetic faults are visible in the top view of the experiment (Fig. 3d). After inverting and cutting the experiment, more antithetic and synthetic faults were later identified in the cross section and were mainly localized in the crestal collapse block (Fig. 3g and h). However, the total amount of applied extension did not lead to the formation of major fault systems (Fig. 3d and g).
After the extension, a 2.2 cm thick post-rift succession of sand layers (black–yellow) was added on top of the experiment (Fig. 2). This represents half of the thickness of the syn-rift sand added during extension.
To achieve inversion, the extended model was then exposed to 1.7 cm of a horizontal compression. This compression led to the inversion of the listric fault and the development of several small footwall shortcut splay thrust faults in the post-rift sediments (Fig. 3e–h). The main reverse fault extends throughout the post-rift cover and just reaches the surface, forming a well-defined hanging wall anticline (Fig. 3f–h), while the frontal splay faults tip within the post-rift stratigraphy just above the second black layer (Fig. 3g). Except for the main listric fault, no visible reactivation was identified in any of the syn- and antithetic normal faults in the cross section. Some localized areas of compressional strain above the pre-existing minor extensional faults are visible in the PIV map (Fig. 3e; in teal). These zones are wider, and the strain is more diffuse than the one associated with the inverted listric fault; however, they could indicate a minor inversion of the pre-existing minor extensional faults.
3.2 Experiment 2
This experiment (Fig. 4) consisted of 4.5 cm total extension, with the addition of successive growth layers of sand (green–yellow) for every 1.5 cm of the extension. The extension part of this experiment is identical to Experiment 1; hence, the experiment develops in a very similar manner. In the first phase of the extension, the deformation started with the development of a roll-over anticline and block rotation, which led to areas with diffuse extensional strain (Fig. 4a). Strain become more localized with an additional extension (Fig. 4b and c). At the end of the extensional stage, and apart from the listric fault, several small antithetic faults developed in the crestal collapse block both in the map view (Fig. 4d) and in the cross section after inverting and cutting the experiment (Fig. 4g and h).
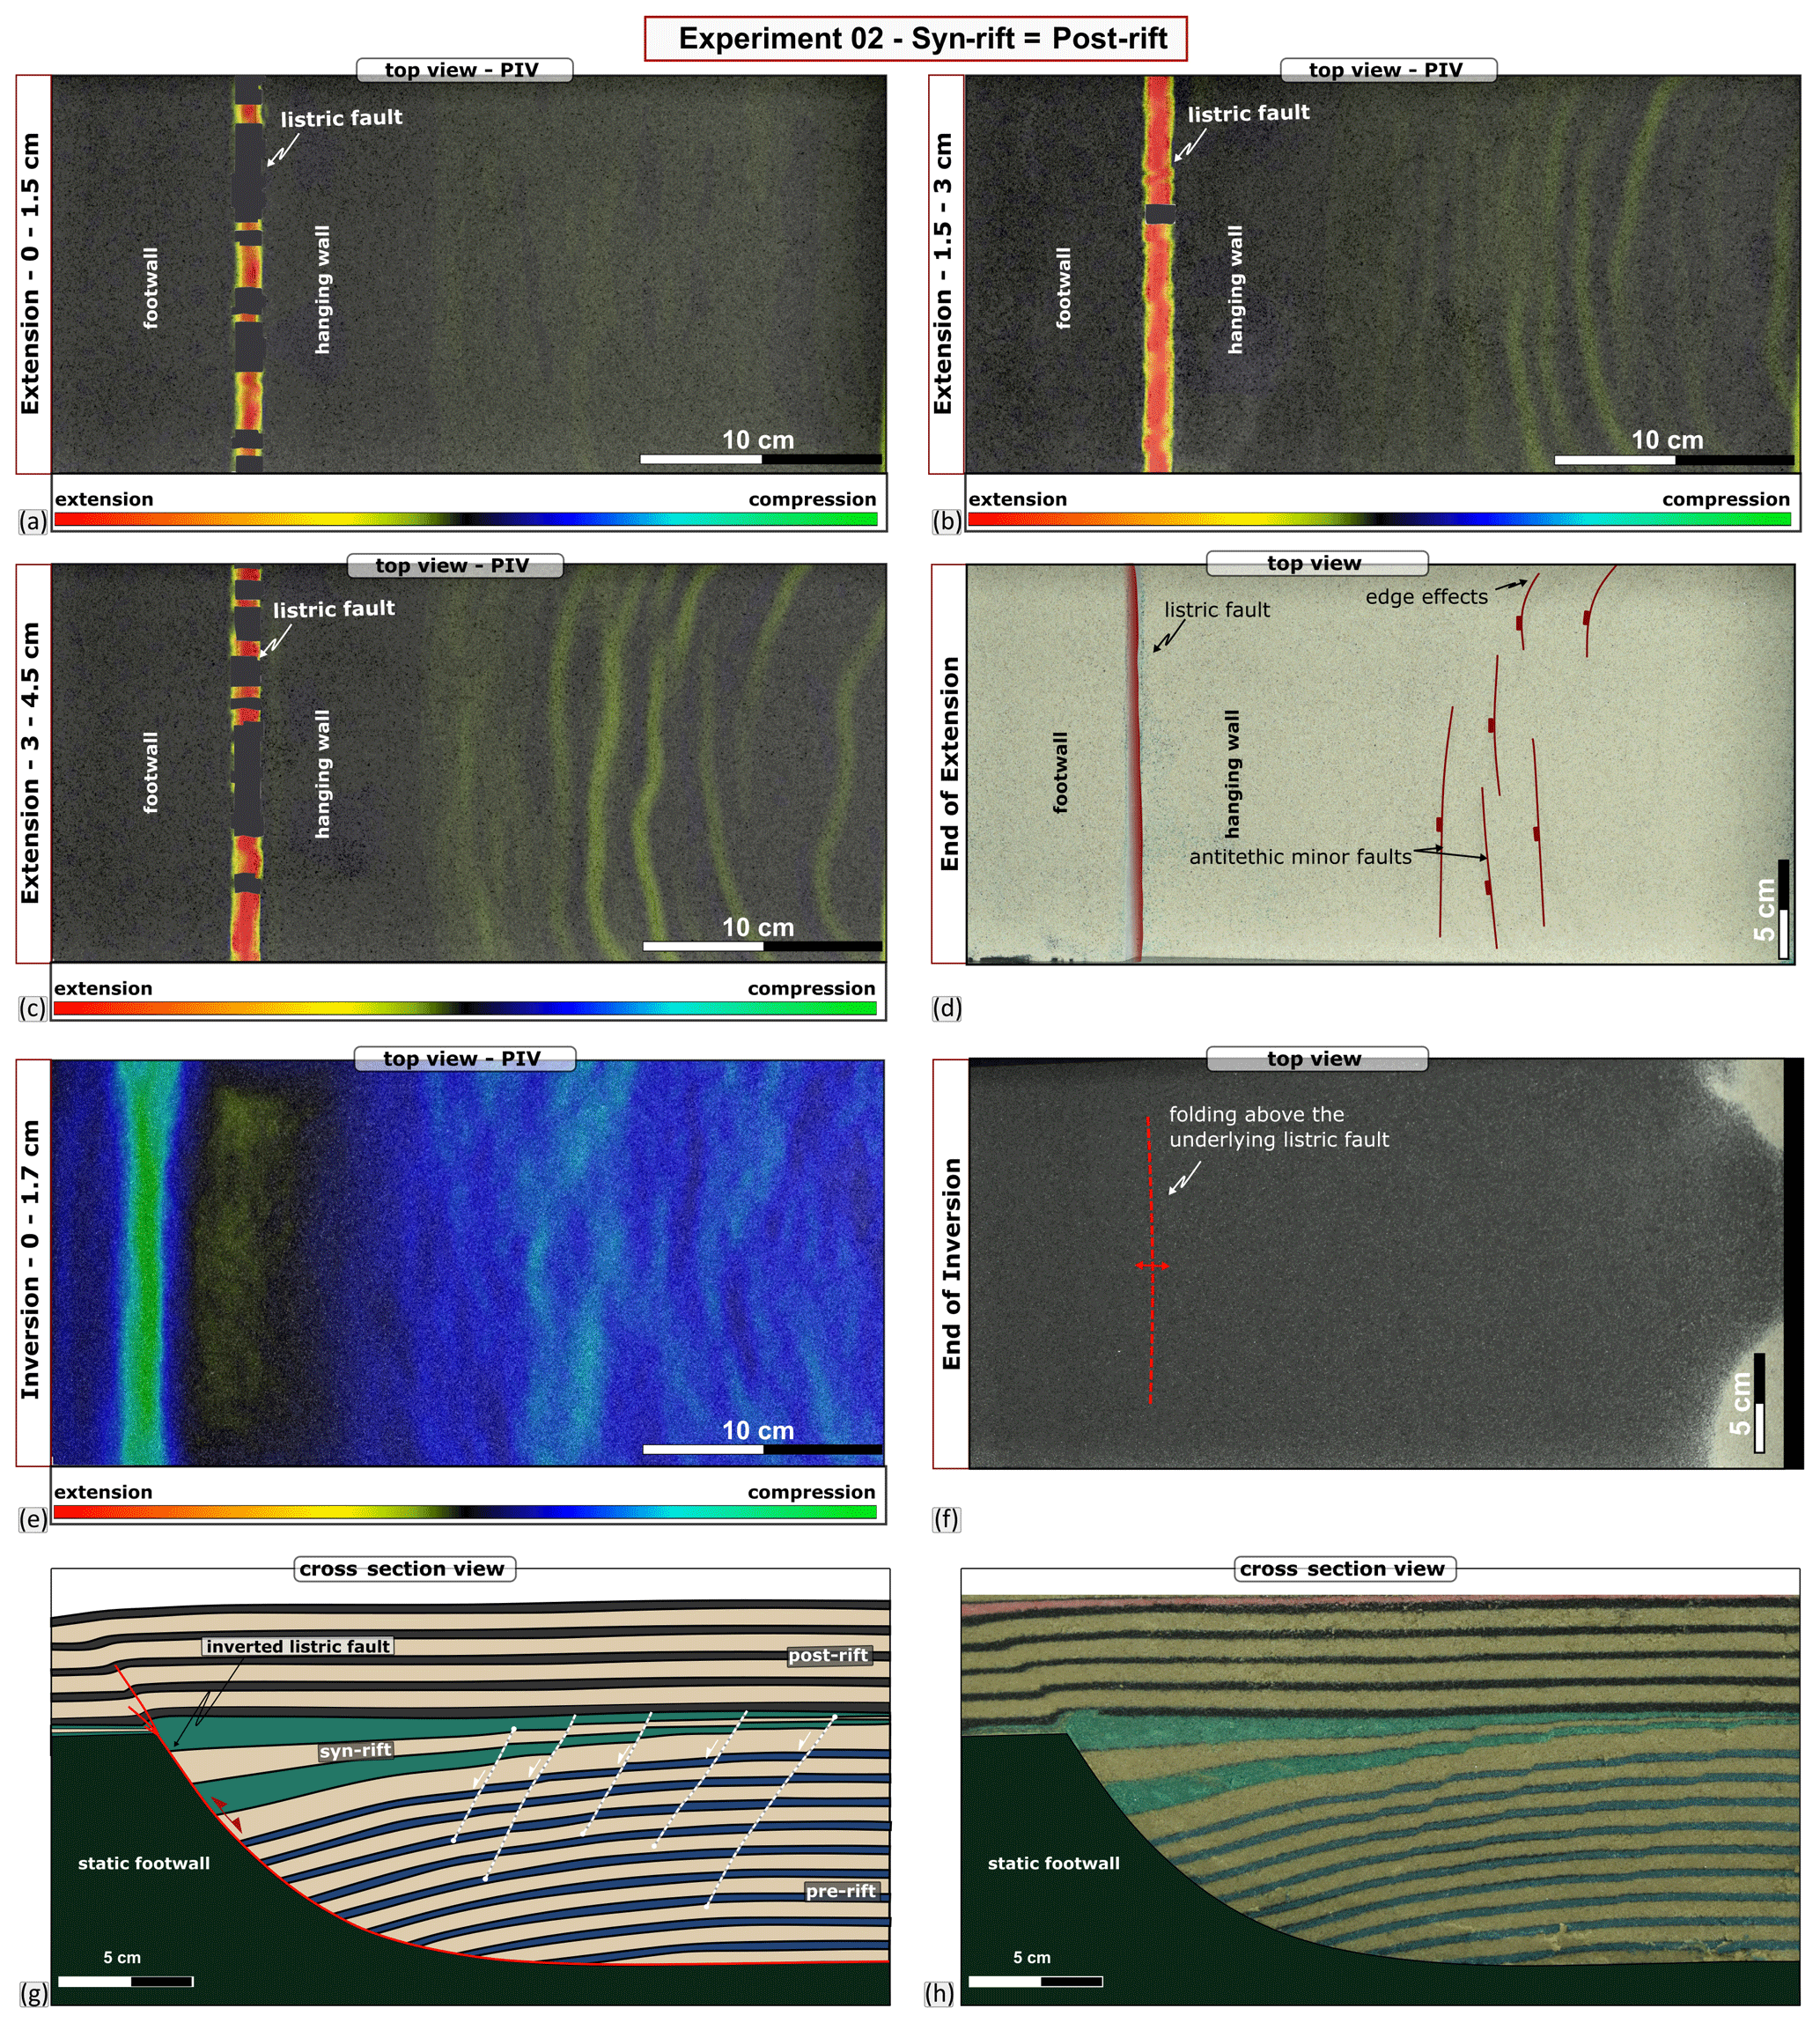
Figure 4Results of Experiment 2. (a–c) The PIV map during the syn-sedimentary phase displaying the high extensional strain associated with the listric fault (bright red) and areas with (a) diffuse extensional strain (yellow) and (b, c) localized extensional strain in the crestal collapse block. (d) Top view of Experiment 2 at the end of extension. (e) PIV map during the inversion phase displaying the high compressional strain above the inverted listric fault (bright green) and areas with diffuse compressional strain (teal). (f) Top view of Experiment 2 at the end of the inversion. (g) Interpreted and (h) uninterpreted cross section through the experiment.
After the extension, a 4.4 cm thick post-rift succession of sand layers (black–yellow) was added on top of the experiment (Fig. 2c and d). This represents the same thickness as the syn-rift sand added during the extension.
Similar to Experiment 1, a 1.7 cm layer of horizontal compression was applied to the extended model. This compression led to the inversion of the listric fault and the development of a small splay fault in the post-rift sediments (Fig. 4e–h). In this case, the main reverse fault only seems to extend halfway through the post-rift cover and tip within the third black layer, without reaching the surface (Fig. 4g). Above the reverse fault, the surface expression of this structure is characterized by minor bulging (Fig. 4f–h), which is barely visible in the top view (Fig. 4f). Like Experiment 1, only the listric fault was reactivated, and no visible reactivation was identified in any of the syn- and antithetic normal faults in the cross section. In the PIV map, a wide zone (ca. 1 cm wide) of compressional strain formed above the inverted listric fault (in green), while only a diffuse zone of compressional strain is visible above the pre-existing extensional faults (Fig. 4e).
3.3 Experiment 3
This experiment (Fig. 5) consists of 2.5 cm total extension, with the addition of successive growth layers of sand (green–yellow) for every 1.25 cm of the extension. The maximum thickness of the growth strata is 2.2 cm at the end of the extension (Fig. 2c and d).
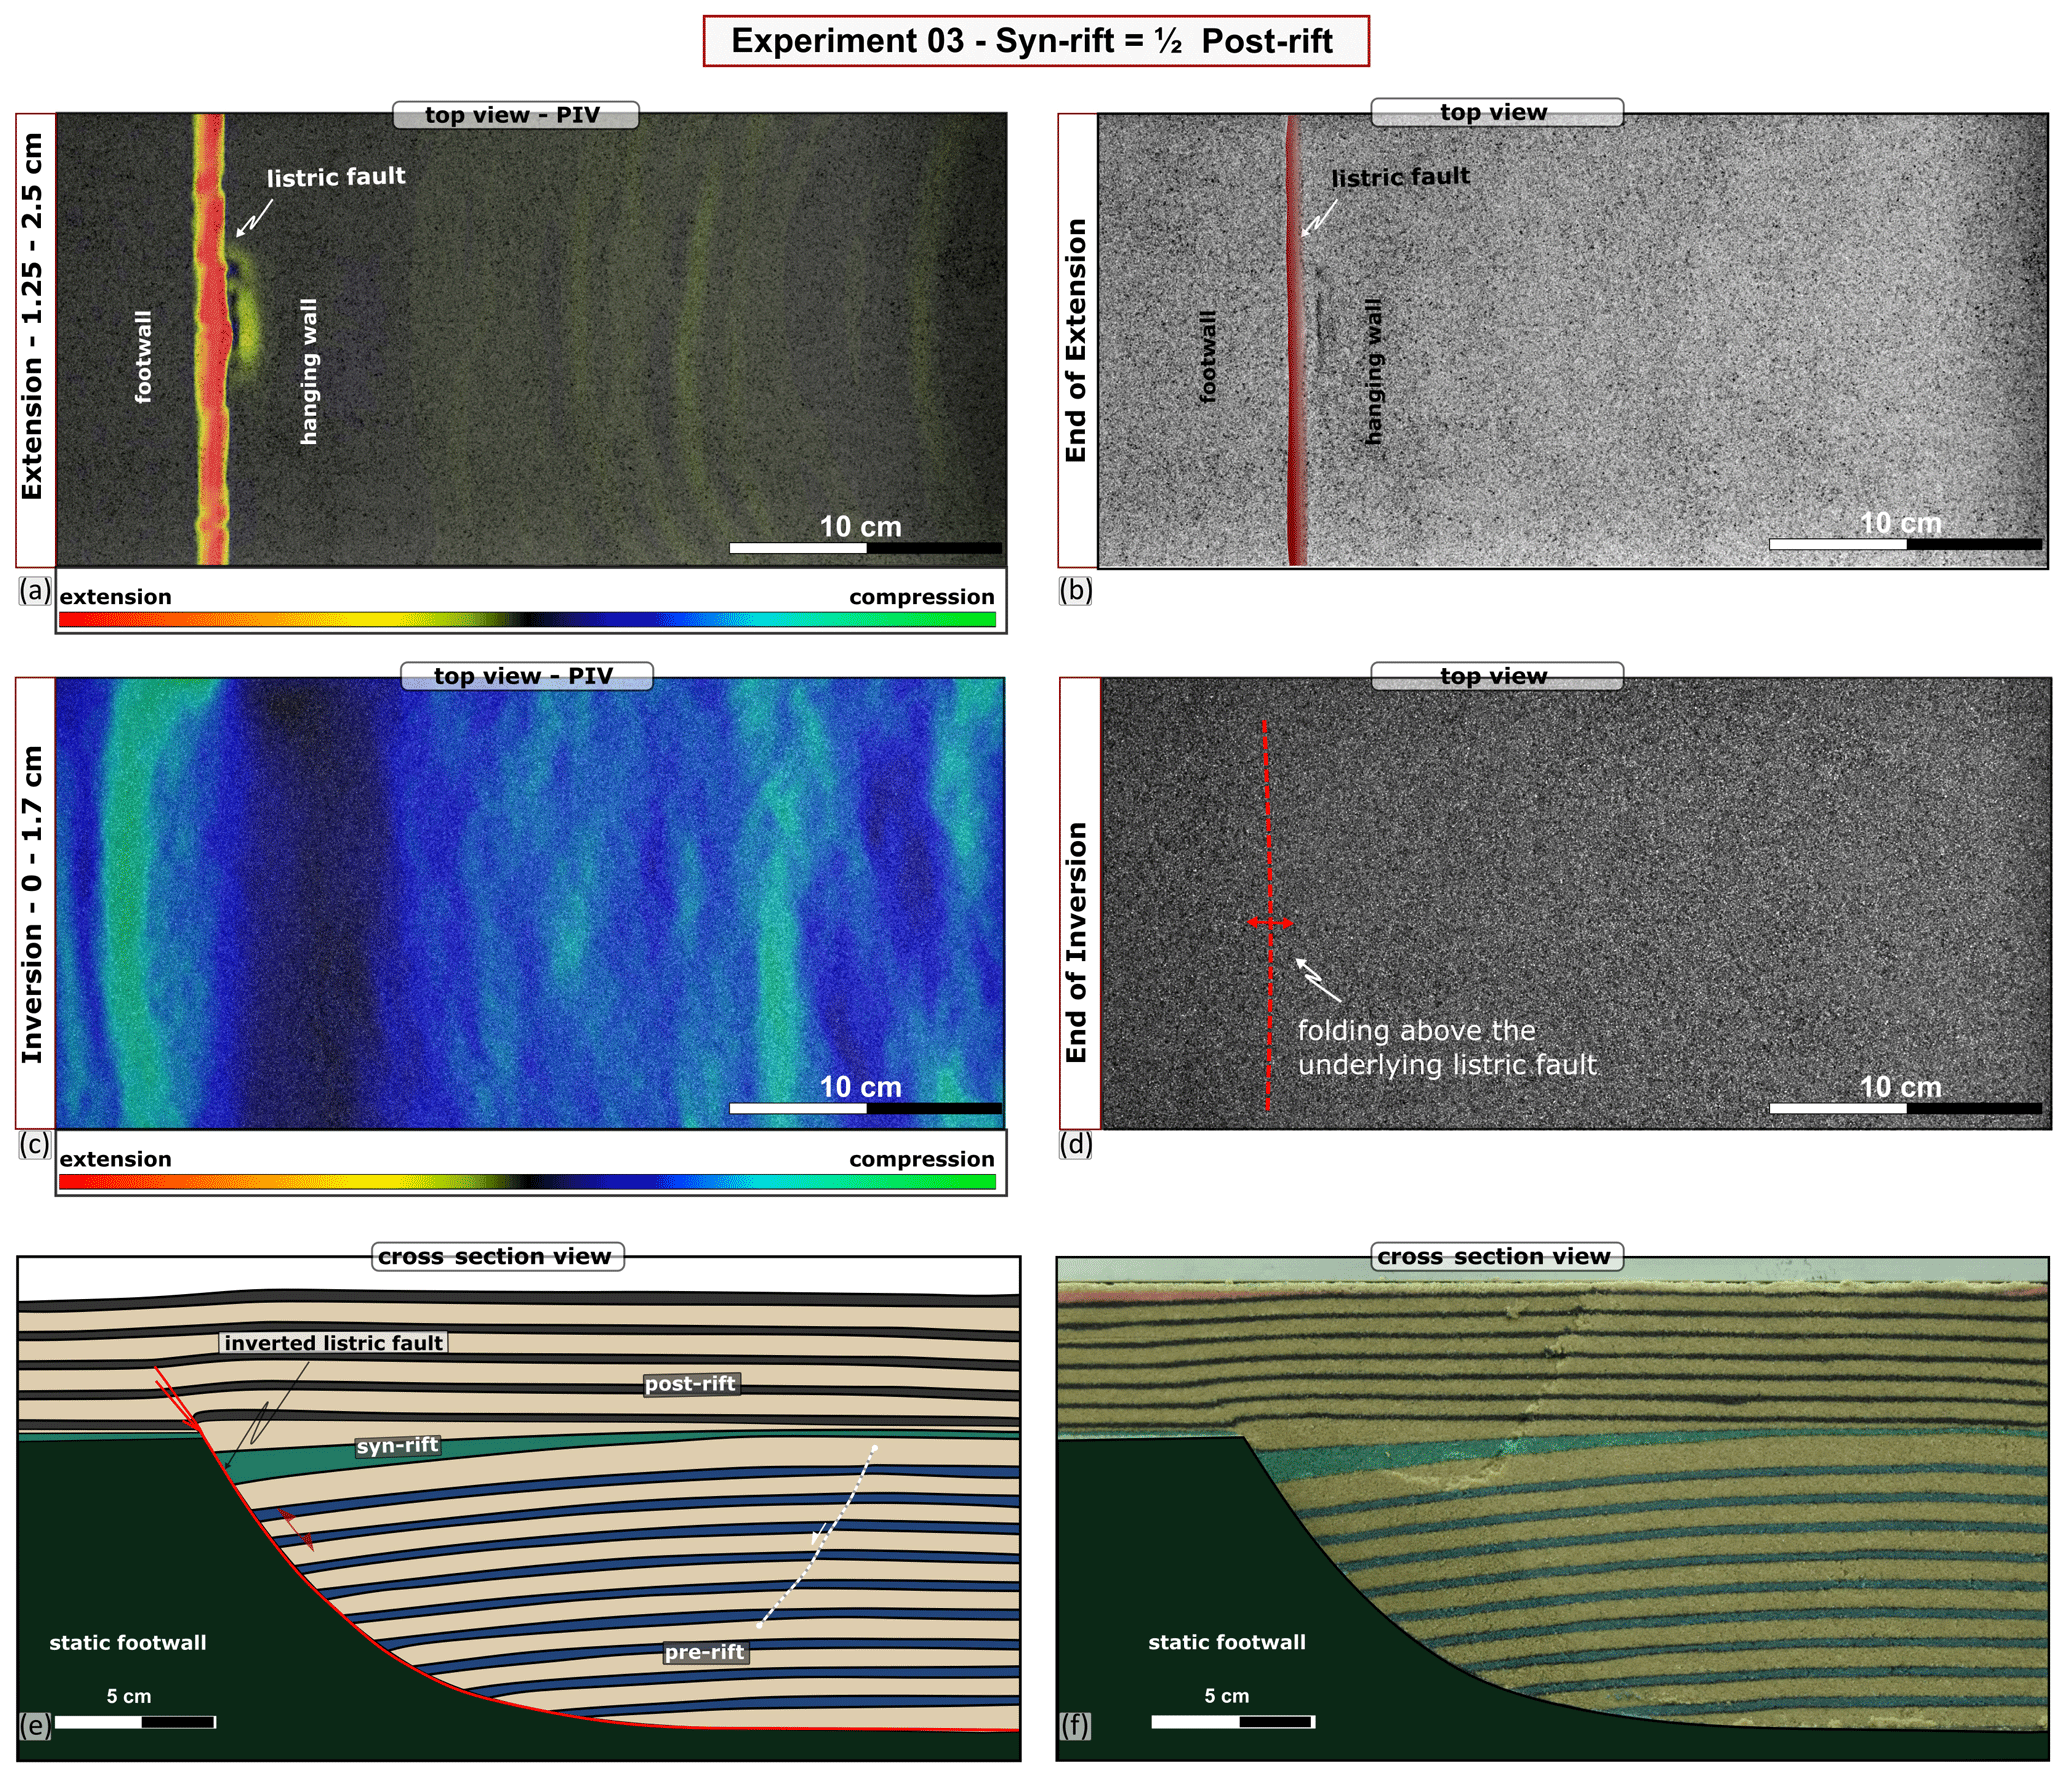
Figure 5Results of Experiment 3. (a) The PIV map during the syn-sedimentary phase displaying the high extensional strain associated with the listric fault (bright red) and areas with diffuse to more localized extensional strain (yellow) in the crestal collapse block. (b) Top view of Experiment 3 at the end of extension. (c) PIV map during the inversion phase displaying the high compressional strain above the inverted listric fault (bright green) and areas with diffuse to more localized compressional strain (teal). (d) Top view of Experiment 3 at the end of the inversion. (e) Interpreted and (f) uninterpreted cross section through the experiment.
Similar to Experiments 1 and 2, in the first phase of extension, the deformation started with the development of a roll-over anticline and block rotation, which led to areas with diffuse extensional strain. The deformation localizes with an additional 1.25 cm of the extension (Fig. 5a). These small total amounts of applied extension did not lead to the formation of major fault systems, and apart from the listric normal fault, only a minor antithetic fault is visible in the cross section after inverting and cutting the experiment (Fig. 5e and f).
After the extension, a 4.4 cm thick post-rift succession of sand layers (black–yellow) was added on top of the experiment (Fig. 2). This represents double the thickness of the syn-rift sand added during the extension (2.2 cm).
Following the addition of the post-rift sequence, we applied 1.7 cm of the horizontal compression to invert the model. This compression led to the inversion of the listric fault and the development of small splay thrust faults in the post-rift sediments (Fig. 5e and f). Similar to Experiment 2, the main reverse fault only seems to extend halfway through the post-rift cover and tip within the third black layer, without reaching the surface (Fig. 5e and f). At the surface, only minor bulging can be observed, which is barely visible in the top view (Fig. 5d). In the PIV map, a wide zone (ca. 1–1.5 cm) of compressional strain formed above the inverted listric fault (in green), while only a diffuse zone of compressional strain is visible away from the listric fault (Fig. 5c).
3.4 Experiment 4
This experiment (Fig. 6) consists of 9 cm total for the extension, with the addition of successive growth layers of sand (green–yellow) for every 1.5 cm of the extension. The maximum thickness of the growth strata is 8.8 cm at the end of the extension (Fig. 2c and d).
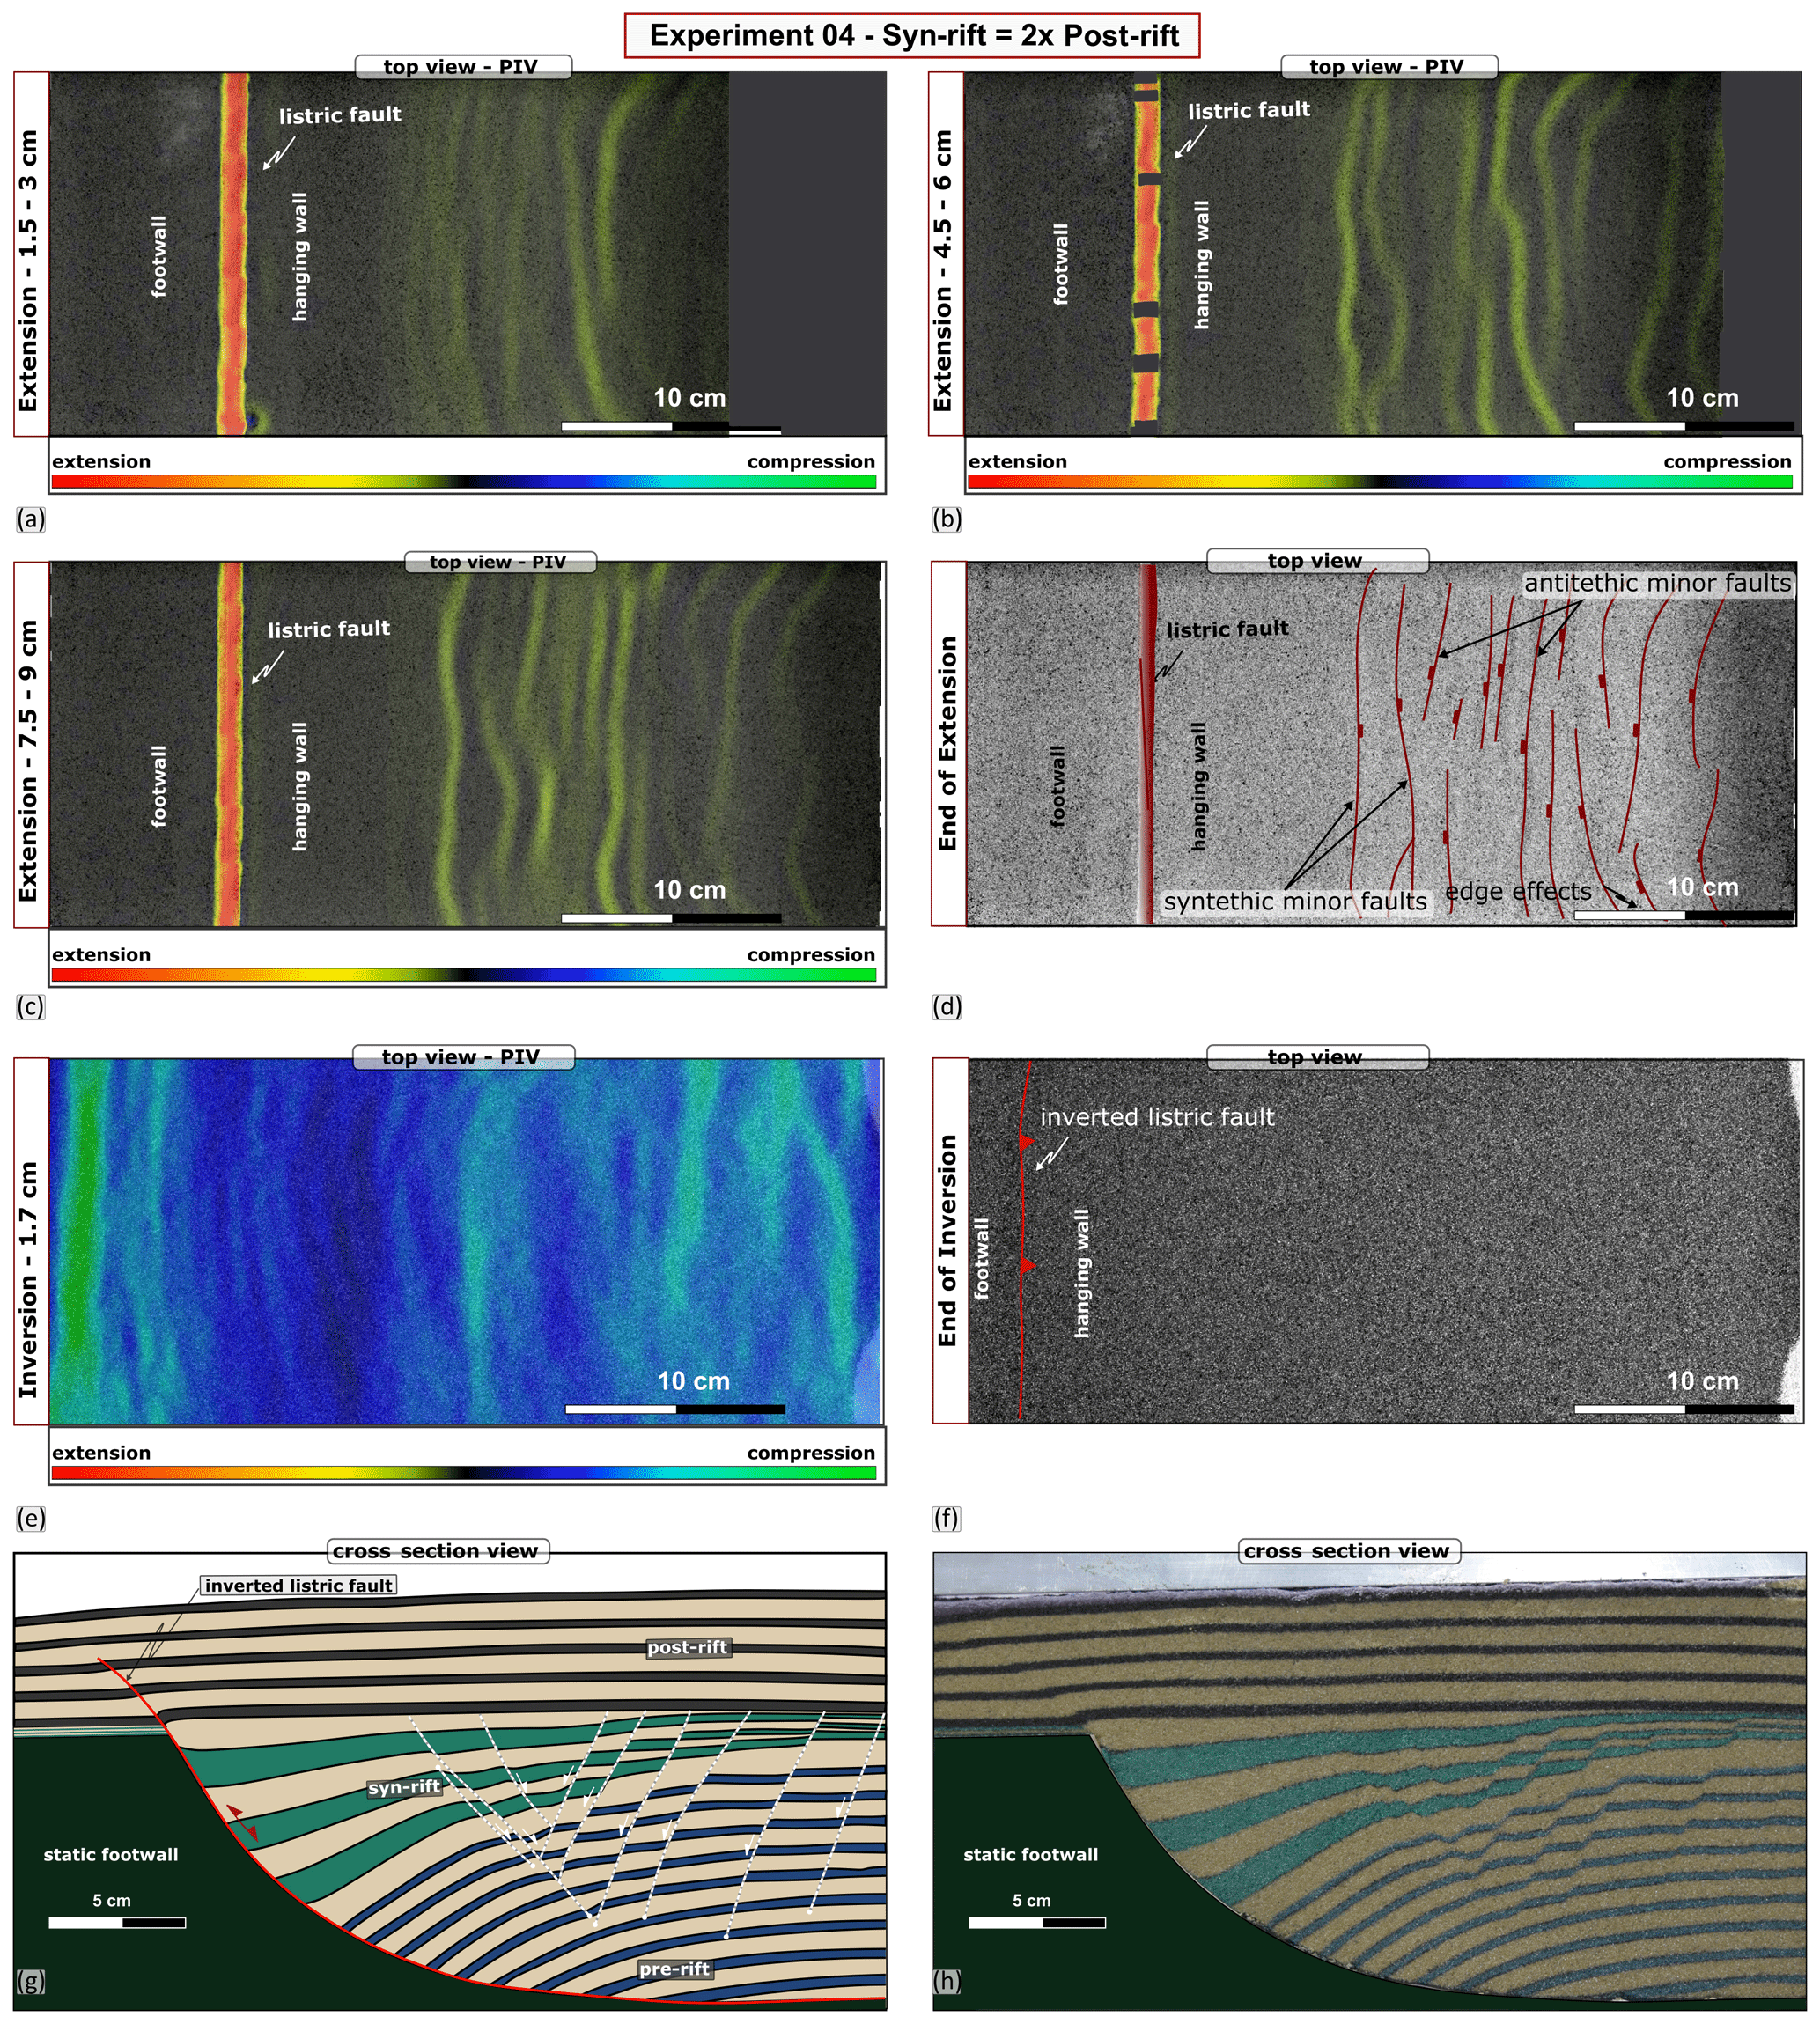
Figure 6Results of Experiment 4. (a–c) The PIV map during the syn-sedimentary phase displaying the high extensional strain associated with the listric fault (bright red) and areas with (a) diffuse extensional strain (yellow) and (b, c) localized extensional strain in the crestal collapse block. (d) Top view of Experiment 4 at the end of the extension. (e) PIV map during the inversion phase displaying the high compressional strain above the inverted listric fault (bright green) and areas with diffuse compressional strain (teal). (f) Top view of Experiment 4 at the end of the inversion. (g) Interpreted and (h) uninterpreted cross section through the experiment.
The first 4.5 cm of the extension of this experiment evolve similarly to Experiments 1 and 2. The deformation started with the development of a roll-over anticline and block rotation, which led to areas with diffuse extensional strain. These zones become more localized with an additional 1.5 cm of extension (Fig. 6a). During the third and fourth stages of the extension, with an additional 3 cm of extension, the areas of extensional strain become more numerous and localized (Fig. 6b). As the extension is continued with further two steps of 1.5 cm each, very clear areas of localized extension could be identified in the PIV data (Fig. 6c). Also, numerous clear synthetic and antithetic faults are visible in the top view of the experiment (Fig. 6d). After inverting and cutting the experiment, more antithetic and synthetic faults were identified in the cross section and were mainly localized in the crestal collapse block (Fig. 6g and h). Compared with the previous experiment, this 9 cm of the total extension led to the formation of more synthetic and antithetic faults (Fig. 6g and h).
After the extension, a 4.4 cm thick post-rift succession of sand layers (black–yellow) was added on top of the experiment (Fig. 2). This represents half of the thickness of the syn-rift sand added during extension.
Similar to Experiments 1–3, to achieve inversion, the extended model was exposed to 1.7 cm of horizontal compression. This compression led to the inversion and propagation of the reverse fault halfway through the post-rift sediments (Fig. 6e–h). Except for the main listric fault, no visible reactivation was identified in any of the syn- and antithetic normal faults in the cross section or top view (Fig. 6f–h). Some localized areas of compressional strain above the pre-existing minor extensional faults are visible in the PIV map (Fig. 6e; in teal). These zones are wide and diffuse; however, they could indicate a minor inversion of the pre-existing minor extensional faults.
3.5 Experiment 5
This experiment (Fig. 7) consisted of 2.5 cm in total of the extension, with the addition of successive growth layers of sand (green–yellow) for every 1.25 cm of the extension. The maximum thickness of the growth strata is 2.2 cm at the end of the extension (Fig. 2).
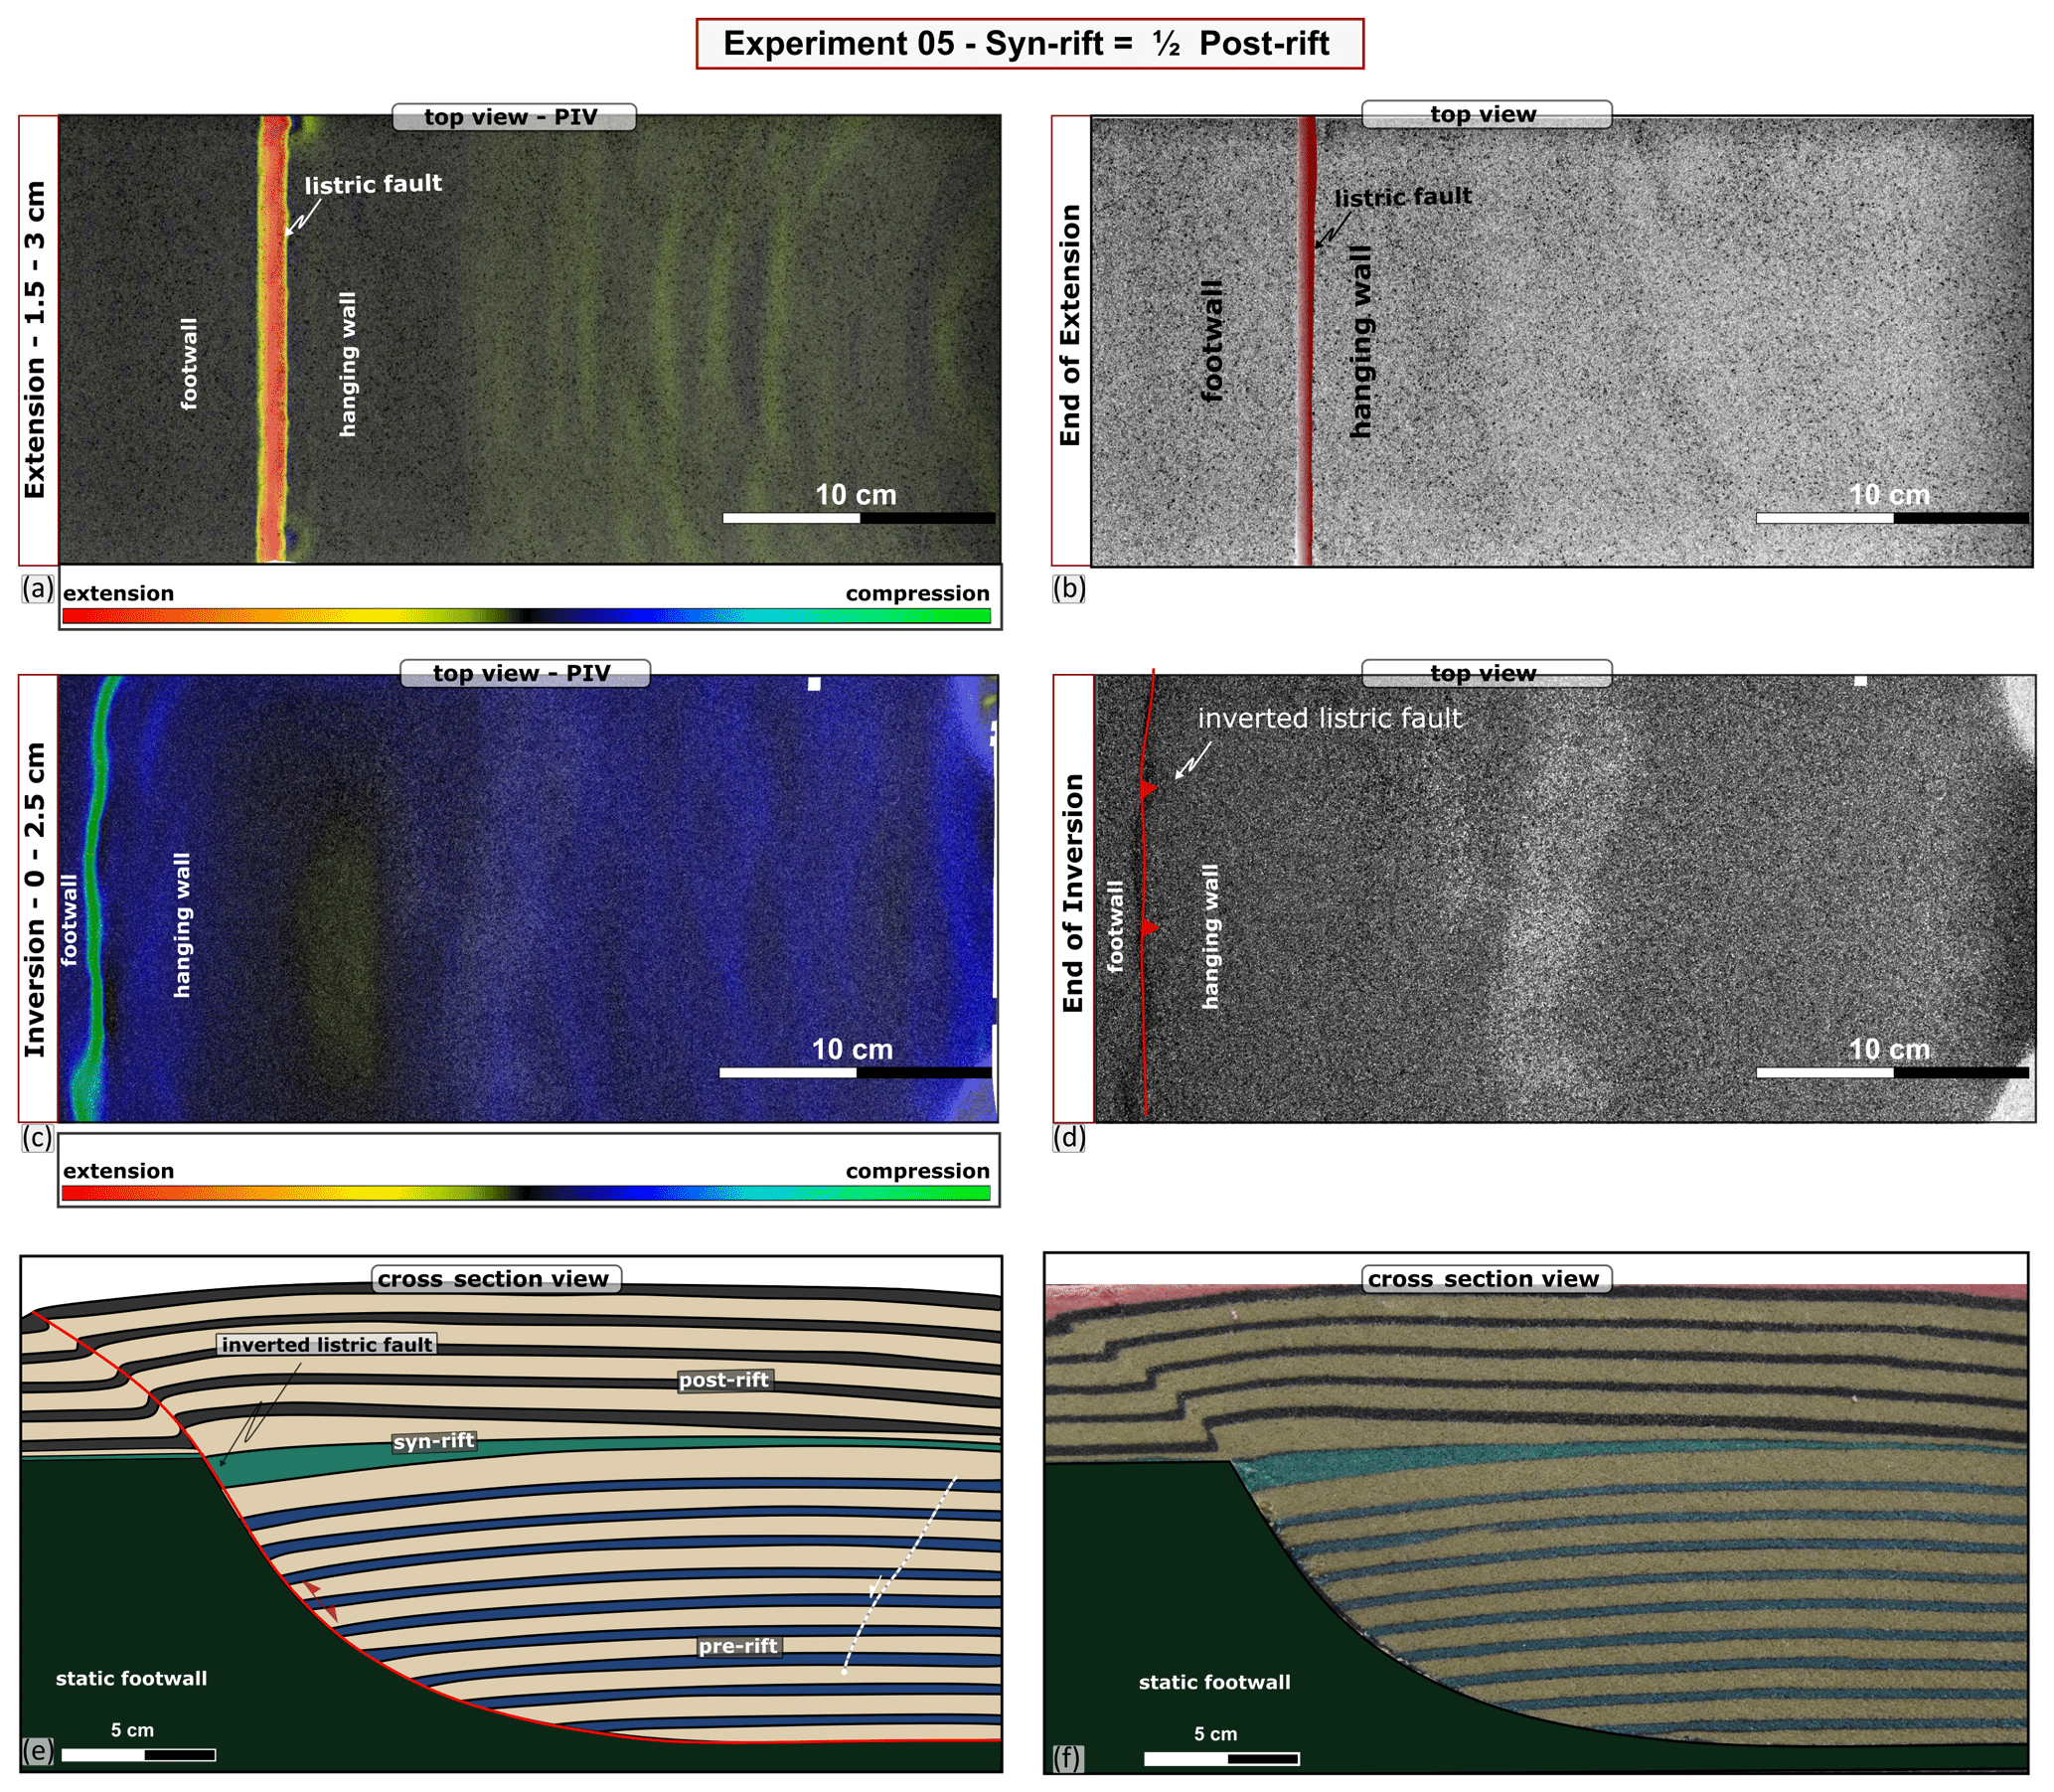
Figure 7Results of Experiment 5. (a) The PIV map during the syn-sedimentary phase displaying the high extensional strain associated with the listric fault (bright red) and areas with diffuse to more localized extensional strain (yellow) in the crestal collapse block. (b) Top view of Experiment 5 at the end of the extension. (c) PIV map during the inversion phase displaying the high compressional strain above the inverted listric fault (bright green) and areas with diffuse to more localized compressional strain (teal). (d) Top view of Experiment 5 at the end of the inversion. (e) Interpreted and (f) uninterpreted cross section through the experiment.
Similar to Experiment 3, in the first phase of the extension, the deformation started with the development of a roll-over anticline and block rotation, which led to areas with diffuse extensional strain. These zones become more localized, with an additional 1.25 cm of the extension (Fig. 6a). These small total amounts of the applied extension did not lead to the formation of major fault systems, and apart from the listric normal fault, only a minor antithetic fault is visible in the cross section after inverting and cutting the experiment (Fig. 5e and f).
After the extension, a 4.4 cm thick post-rift succession of sand layers (black–yellow) was added on top of the experiment (Fig. 2). This represents double the thickness of the syn-rift sand added during the extension (2.2 cm).
Following the addition of the post-rift sequence, we applied 2.5 cm of a horizontal compression to invert the model. This applied compression led to the inversion of the listric fault, which extended throughout the post-rift cover and reached the surface, forming a well-defined hanging wall anticline (Fig. 7e and f). As the thrust fault accommodated more displacement compared with previous experiments, the thrust fault is clearly visible at the surface (Fig. 7d), while the PIV map is characterized by a well-defined, narrow zone of compressional strain (Fig. 7c; in green). Away from the listric fault, only a diffuse zone of compressional strain is visible (Fig. 7c; in blue), in addition to a diffuse zone of extensional strain (Fig. 7c; in yellow), which can indicate minor extension in the crest of the anticline.
In the following sections, we summarize the experimental results (Fig. 8) in the context of the Mode I/Mode II inversion (Tari et al., 2020) and then compare them with natural examples, with implications for surface and subsurface interpretation.
4.1 Summary of model results
We present five experiments, of which all had the same geometry of a listric fault block and 10 cm of pre-kinematic layers (Fig. 2c and d).
From an extension point of view, Experiments 3 and 5 are similar and experienced 2.5 cm of extension. This led to a maximum thickness of 2.2 cm for growth strata being accommodated in the hanging wall of the listric fault and the development of a minor antithetic fault with sub-millimetre displacement (Fig. 8).
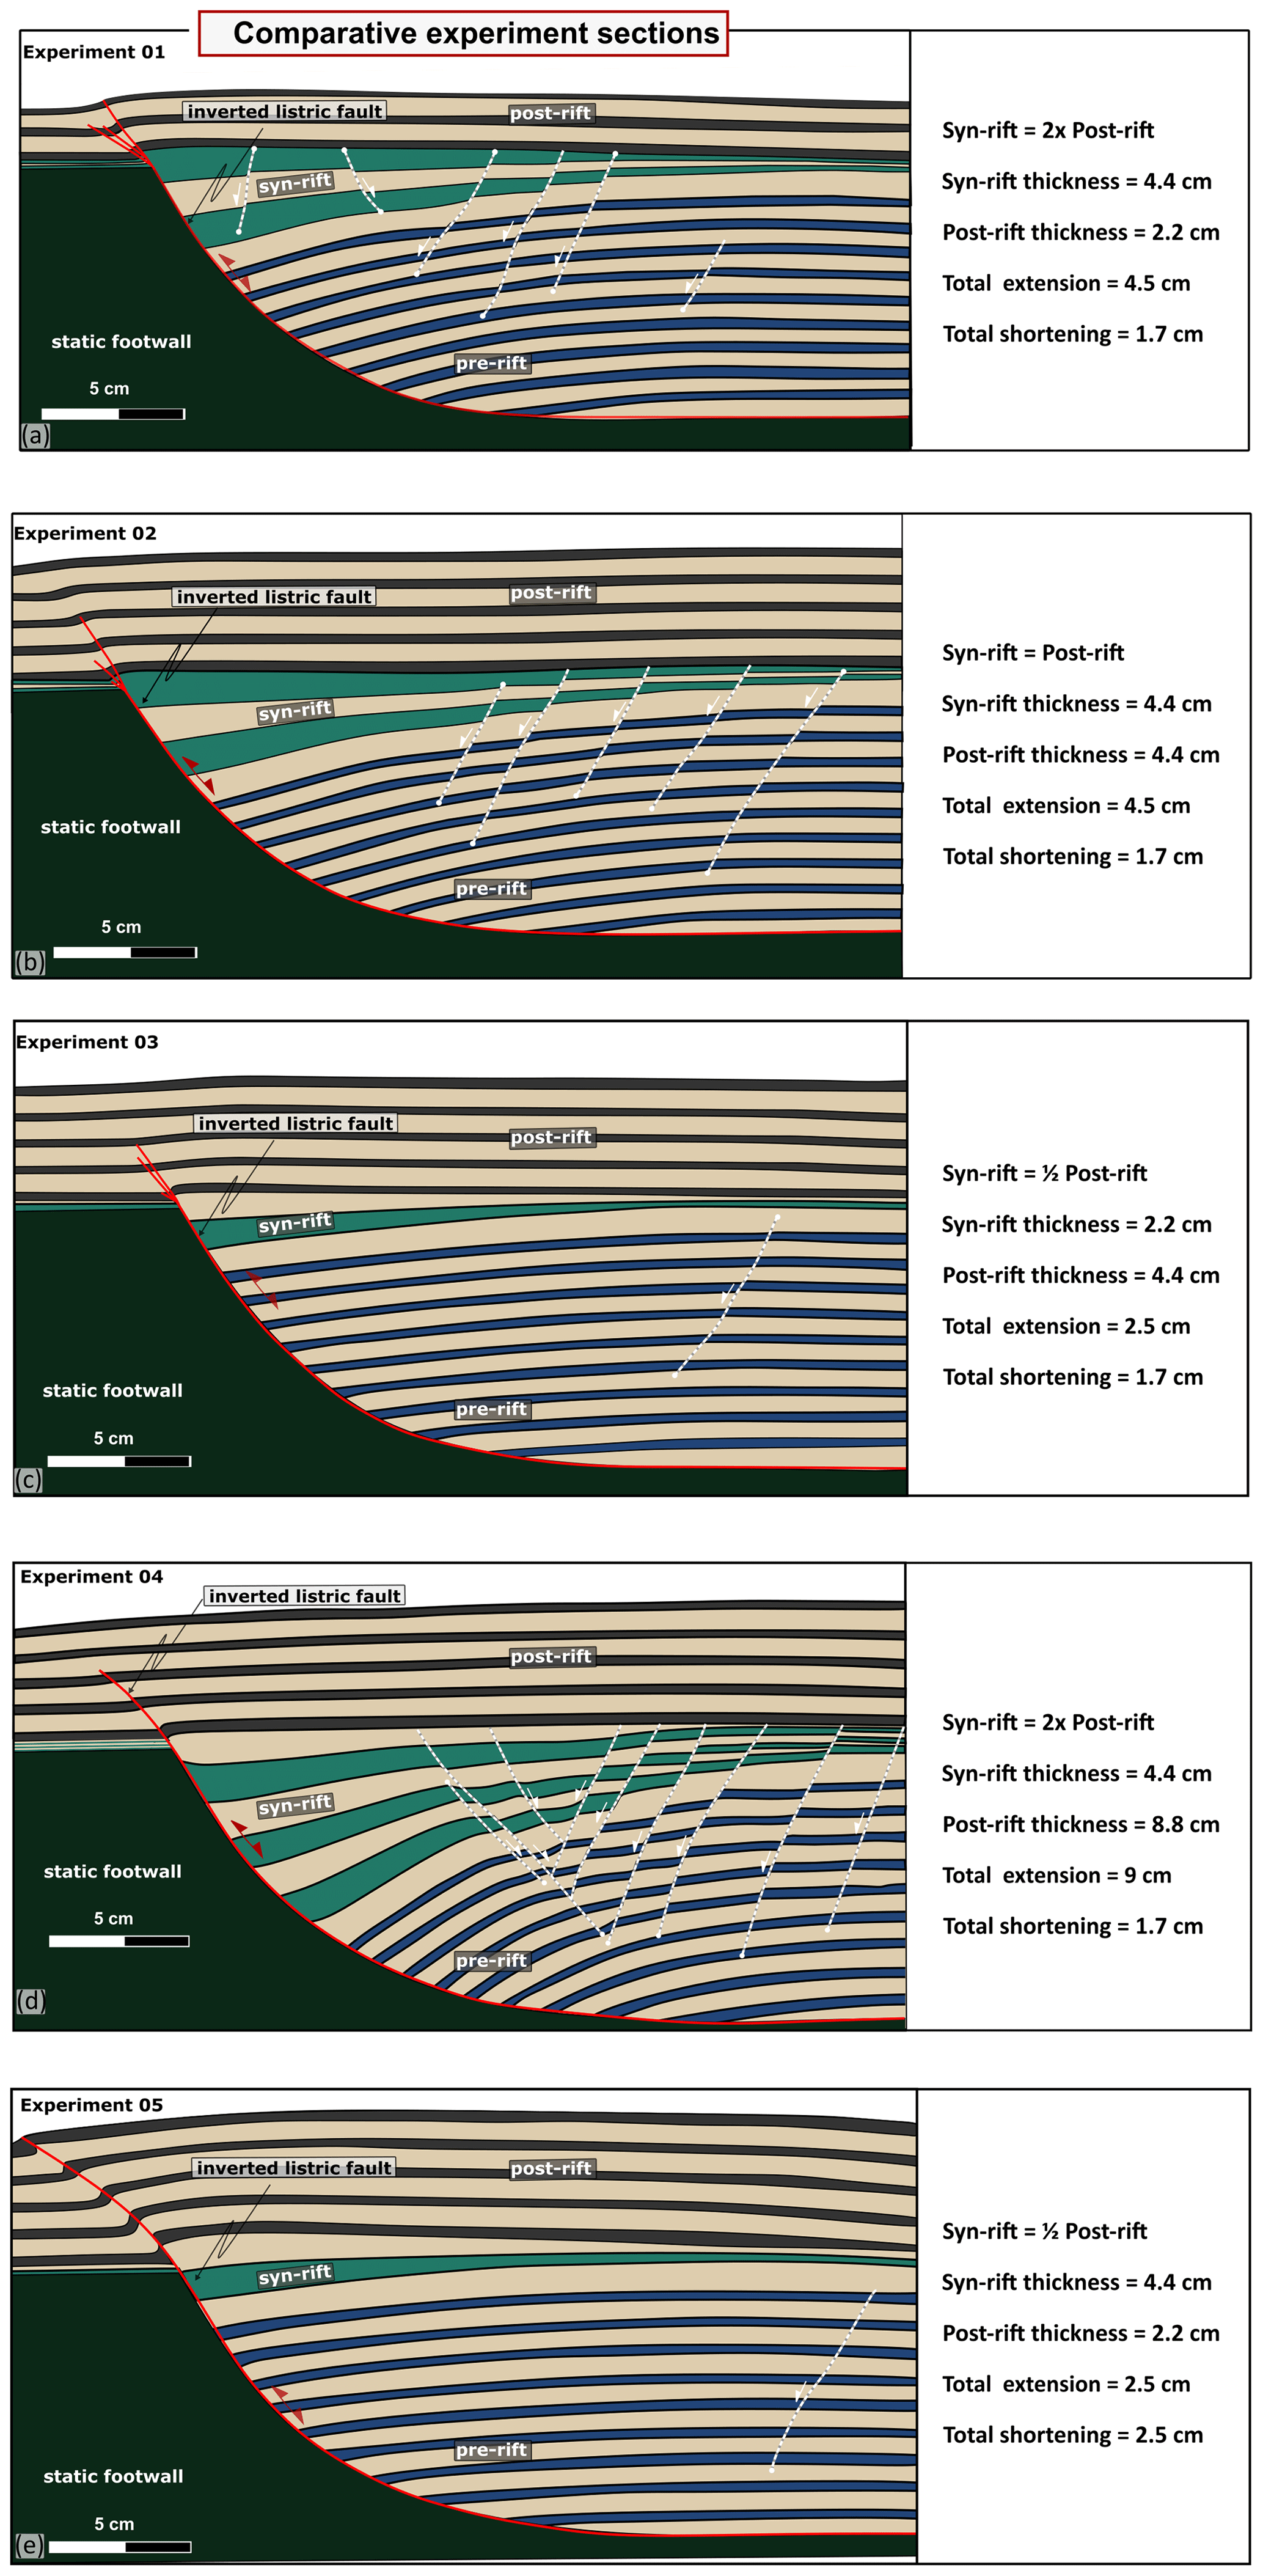
Experiments 1 and 2 experienced 4.5 cm of the extension, which led to a maximum thickness of 4.4 cm for the growth strata accommodated in the hanging wall of the listric fault and the development of five–six minor antithetic and synthetic faults with minor displacements (Fig. 8).
Experiment 4 had the most displacement (9 cm), which led to the development of numerous (ca. 9–10 faults) minor antithetic and synthetic faults (Fig. 8).
After extension, Experiment 1 was covered by 2.2 cm of post-rift cover, while Experiments 2 to 5 had 4.4 cm thick post-rift.
The amount of shortening for Experiments 1 to 4 was 1.7 cm. This led to the propagation of the reverse fault just near the surface for Experiment 1, which only had 2.2 cm of post-rift cover. However, for Experiments 2 to 4, which had 4.4 cm of post-rift cover, the reverse fault propagated only halfway through the post-rift cover (Fig. 8). Experiment 5 experienced 2.5 cm of inversion, which led to the propagation of the inverted fault through the entire 4.4 cm of the post-rift cover and formed a well-defined thrust fault (Fig. 8). For all experiments (1 to 5) the final inverted geometry shows that the post-rift unit is, though slightly but almost uniformly, uplifted above its footwall's regional elevation. There is a slightly more pronounced uplift above the concave segment of the listric fault, which is most evident in Experiment 5, where the reverse slip is the largest. The reason for this uniform hanging wall uplift above the footwall regional is the horizontal compaction and related thickening of the whole sand pack ahead of the leftward-moving backstop that facilitates the reverse slip.
According to the Mode I/Mode II classification of Tari et al. (2020), Experiments 1 and 4 have the post-rift cover half of the syn-rift (Mode I), Experiment 2 has the post-rift equal to the syn-rift, while Experiments 3 and 5 have post-rift cover double that of the syn-rift (Mode II; Figs. 2c, d and 8).
4.2 Discussions
In order to answer the question with respect to whether the inversion-related structures are influenced by the syn-rift-to-post-rift ratios, we can first compare Experiments 1 and 4, which both have a Mode I set-up. The inversion structures in Experiment 1 can be characterized as being reverse fault bounded (Tari et al., 2020), which are considered to be typical for Mode I (Fig. 1). However, in the case of Experiment 4, the structures that develop in the uppermost layers of the post-rift sequence are characterized by gentle folds, which is a typical Mode II structure (Fig. 1).
If we look further at Experiments 2, 3, and 4, they all show similar inversion-related structures. The contractionally reactivated listric fault does not propagate through the entire post-rift sequence but stops somewhere in the mid-section and forms a gentle anticline in the uppermost layers, regardless of the syn-rift-to-post-rift ratios. Note that Experiment 2 has a post-rift cover equal to the syn-rift, Experiment 3 has a Mode II set-up, while Experiment 4 had a Mode I set-up.
Nonetheless, it is clear that if we compare Experiments 3 and 5, which both have a Mode II set-up and an identical extension amount and syn-tectonic cover thickness, then the inversion-related structures are different (Fig. 8). This is because the compression amount in Experiment 3 is 1.7 cm, compared to 2.5 cm in Experiment 5.
Based on our experimental observations, we suggest that the syn-rift-to-post-rift ratios do not seem to have a primary influence on the inversion-related structures; instead, the amount of shortening does. The style and propagation of the inverted structures are mostly affected by the amount of compressional displacement accommodated by the inherited listric fault and the thickness of the post-rift cover.
Apart from the inversion of the listric fault, no inversion of the antithetic or synthetic crestal collapse graben faults (e.g. Gillcrist et al., 1987; Buchanan and McClay, 1991) is visible in our experiments in the cross sections. However, the PIV analysis shows localized areas of compression, which can indicate the mild reactivation of the crestal collapse graben faults, which are below the visible scale of the experiment. This also highlights the need to improve the resolution limitations of analogue models and use it as a direct example to understand the subsurface structures which are below the seismic resolution.
4.3 Examples from nature
The examples in this section were gathered from specific case studies in which the inversion structures form petroleum traps. These are generally gentle/open folds with four-way closures (Mode II inversion structures), but some examples of reverse-fault-bounded are also given (Mode I inversion structures).
4.3.1 Taranaki Basin, Aotearoa/New Zealand
The Taranaki Basin is considered to be a classic location for inverted structures (Nicol et al., 2007; Giba et al., 2010; Reilly et al., 2017). This basin saw continental rifting during the Senonian, when several half-graben systems developed with clear Upper Cretaceous growth strata. Rifting was replaced by a passive margin stage spanning the entire Paleogene. There is no growth pattern associated with the Paleogene sequence. During the early Miocene, prominent elongated anticlinal structures were formed due to positive inversion. The pre-T85 (i.e. pre-Upper Miocene) sequence was folded into slightly asymmetric anticlines during the late Miocene, which is between about 10–7.6 Ma ago. There is evidence for the slight positive inversion after the formation of the major angular unconformity postdating the bulk of the deformation, but it contributed very little to the structural relief (Fig. 9).
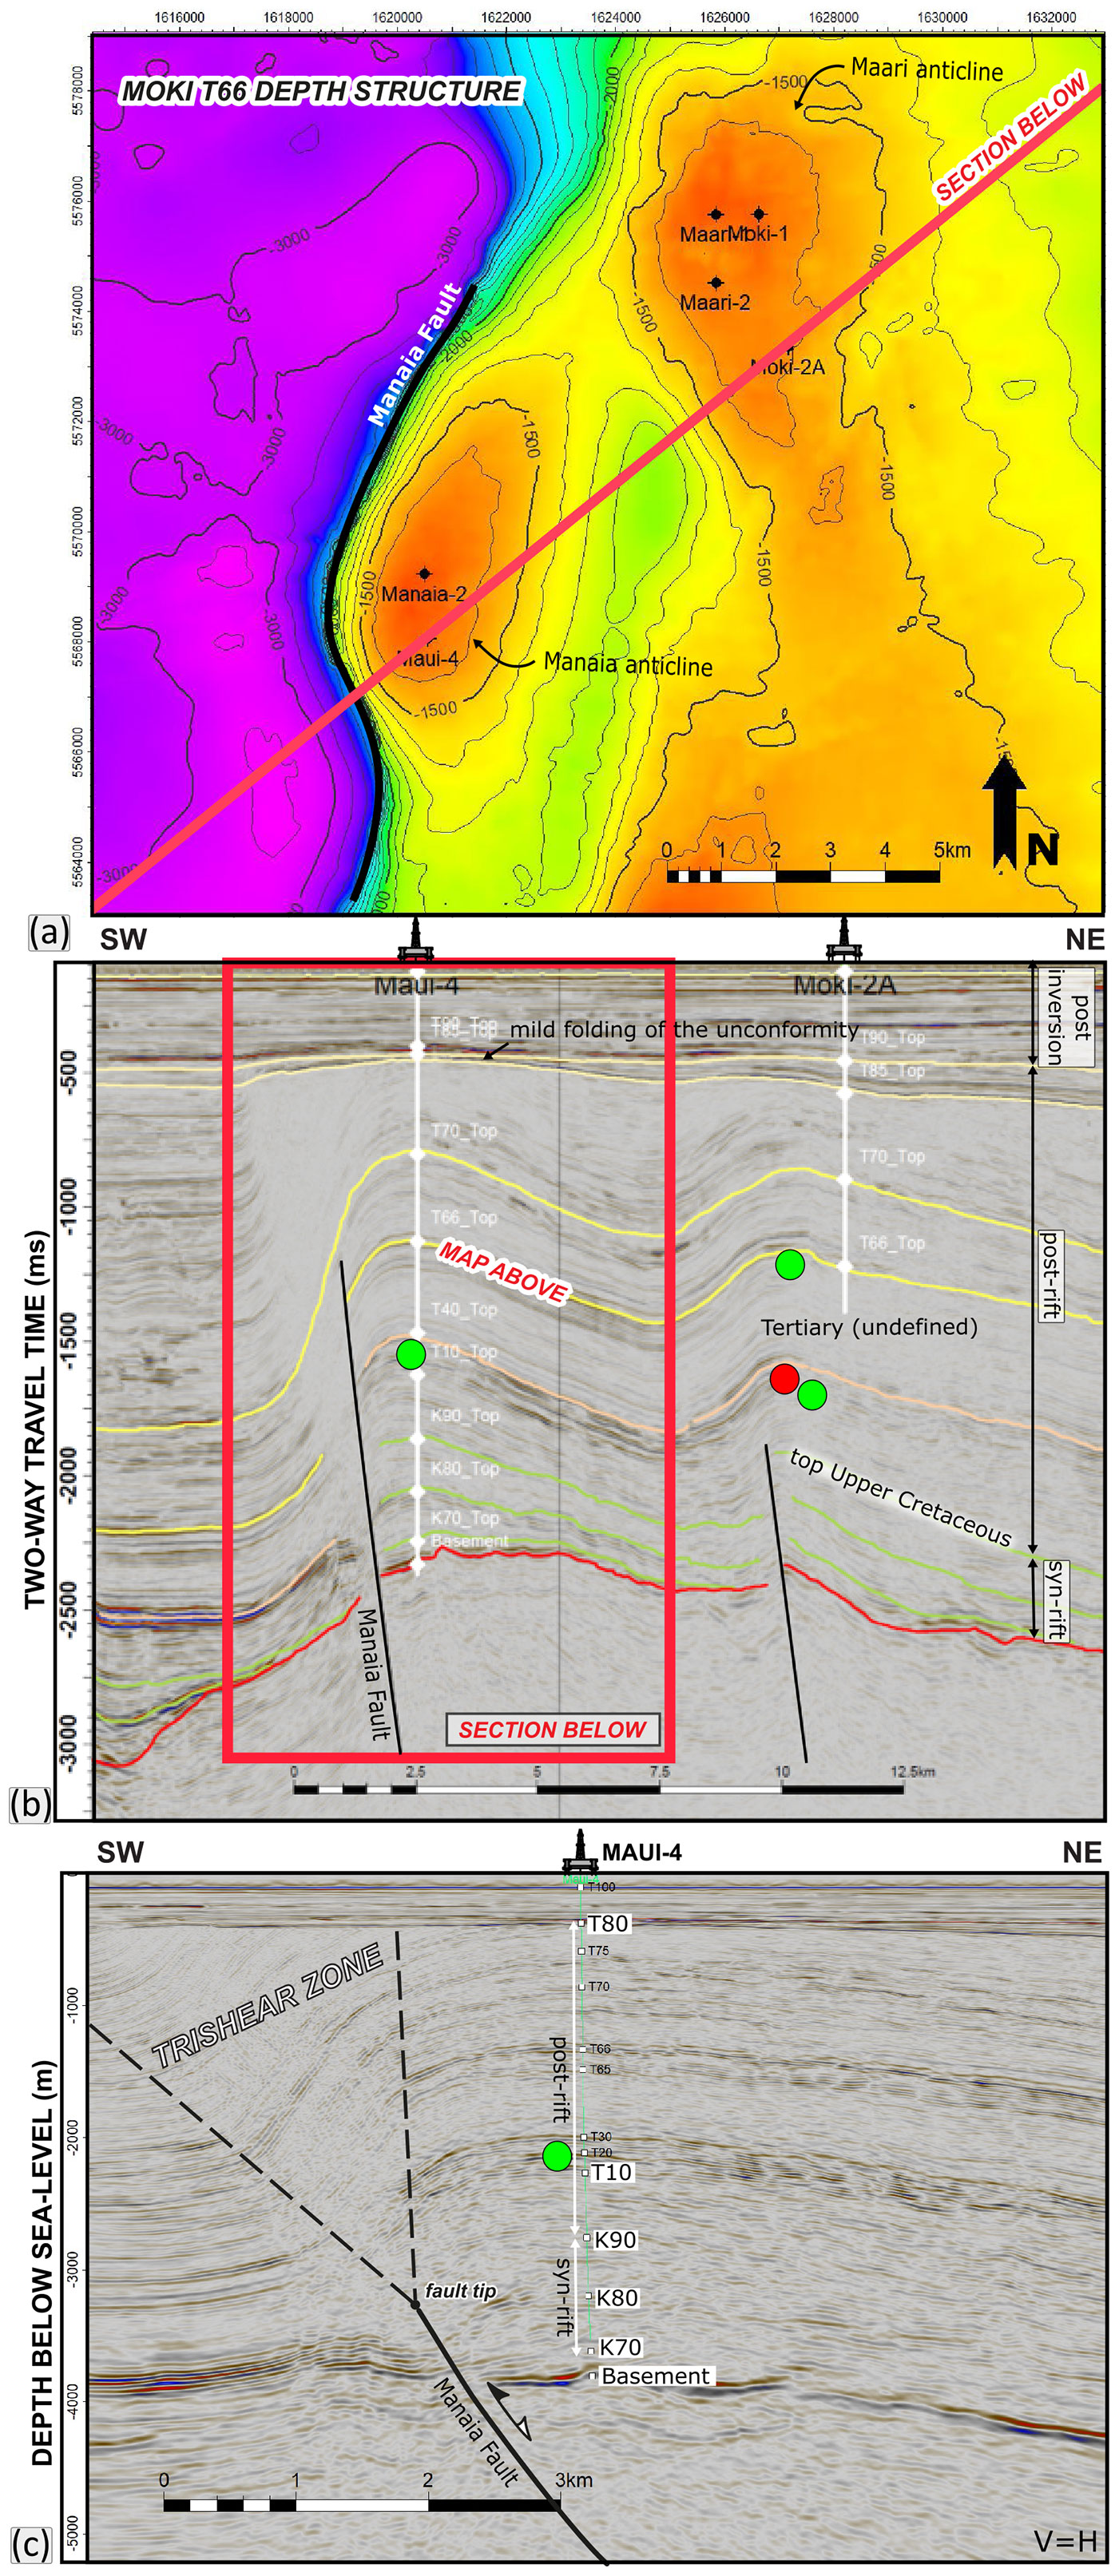
Figure 9(a) Depth structure map of a Miocene stratigraphic horizon in the offshore Taranaki Basin, Aotearoa/New Zealand. (b) Time domain seismic reflection example from a 3D data set of the inverted Manaia and Maari productive structures (modified from Wunderlich et al., 2019). Green and red circles represent oil and gas pay zones, respectively. The Upper Cretaceous strata above the basement (K−70 to K00) is the syn-rift sequence, and the overlying Cenozoic (T horizons) is the post-rift succession. These anticlines were formed by Mode II inversion, as their inverted post-rift sequence is thicker than the underlying syn-rift part. (c) Depth domain seismic reflection example from a 3D data set of the inverted Manaia anticline, showing a tipping master fault as an alternative interpretation to that shown in panel (b) and also a trishear deformation zone above absorbing the inversion in the post-rift sequence.
Two of the inversion structures form gas–oil fields (Manaia and Maari) and are illustrated here using a reflection seismic section (Fig. 9b) from a 3D seismic data set (Wunderlich et al., 2019; Wunderlich and Mayer, 2019). The hydrocarbons and trapped in four-way robust closures along the crests of these inversion structures (Fig. 9a).
Similar to Experiments 2 or 3 (Figs. 4, 5, and 8), the master faults did not propagate up and offset the thick post-rift basin fill (Fig. 9b), even though the reverse movement on the master faults restored the former extensional offset on the Manaia fault entirely (and even more so for the Maari structure). Therefore, both structures manifest themselves as gentle folds (Mode II inversion structures; see Tari et al., 2020), with a subtle asymmetry observable in the geometry of the post-T70 sediments. Although the inversion-related vertical reverse movement was about 600–800 m, given the offset seen on the T10 seismic marker (Fig. 9b), the fault did not break through across the entire sedimentary sequence. As per our analogue models, this is partially due to the thick post-rift sequence and also due to the possible trishear deformation (Erslev, 1991; Hardy and Ford, 1997; Allmendinger, 1998) interpreted on the western limb of the Manaia anticline. With our current set-up, none of our physical experiments (Figs. 2–8) reproduced the trishear deformation.
4.3.2 Eastern Mediterranean, Israel
The broader Levant area in the eastern Mediterranean is also considered to be a classic area for inversion tectonics (Walley, 1998; Bosworth et al., 1999). There are a large number of structures, both offshore and onshore in Egypt (Bevan and Moustafa, 2012; Moustafa, 2010, 2020; Bosworth and Tari, 2021) and in Israel (Gardosh et al., 2010; Gardosh and Tannenbaum, 2014; Needham et al., 2017) which have been well documented and provide useful exploration templates for analogue structures elsewhere (see Tari et al., 2020, for an overview).
The very large gas fields discovered in the deepwater Levant in the last 2 decades are, for all but one, trapped in inverted structures. At the level of the gas discoveries high in the apex of these anticlines, there are no faults present, which would correspond to the upward propagation of the syn-rift boundary faults from beneath (Needham et al., 2017). Generally, the reverse faulting caused by the inversion did not break through the uppermost 2–3 km thick part of the post-rift succession (Roberts and Peace, 2007), but instead, the basin fill deformed into large open folds.
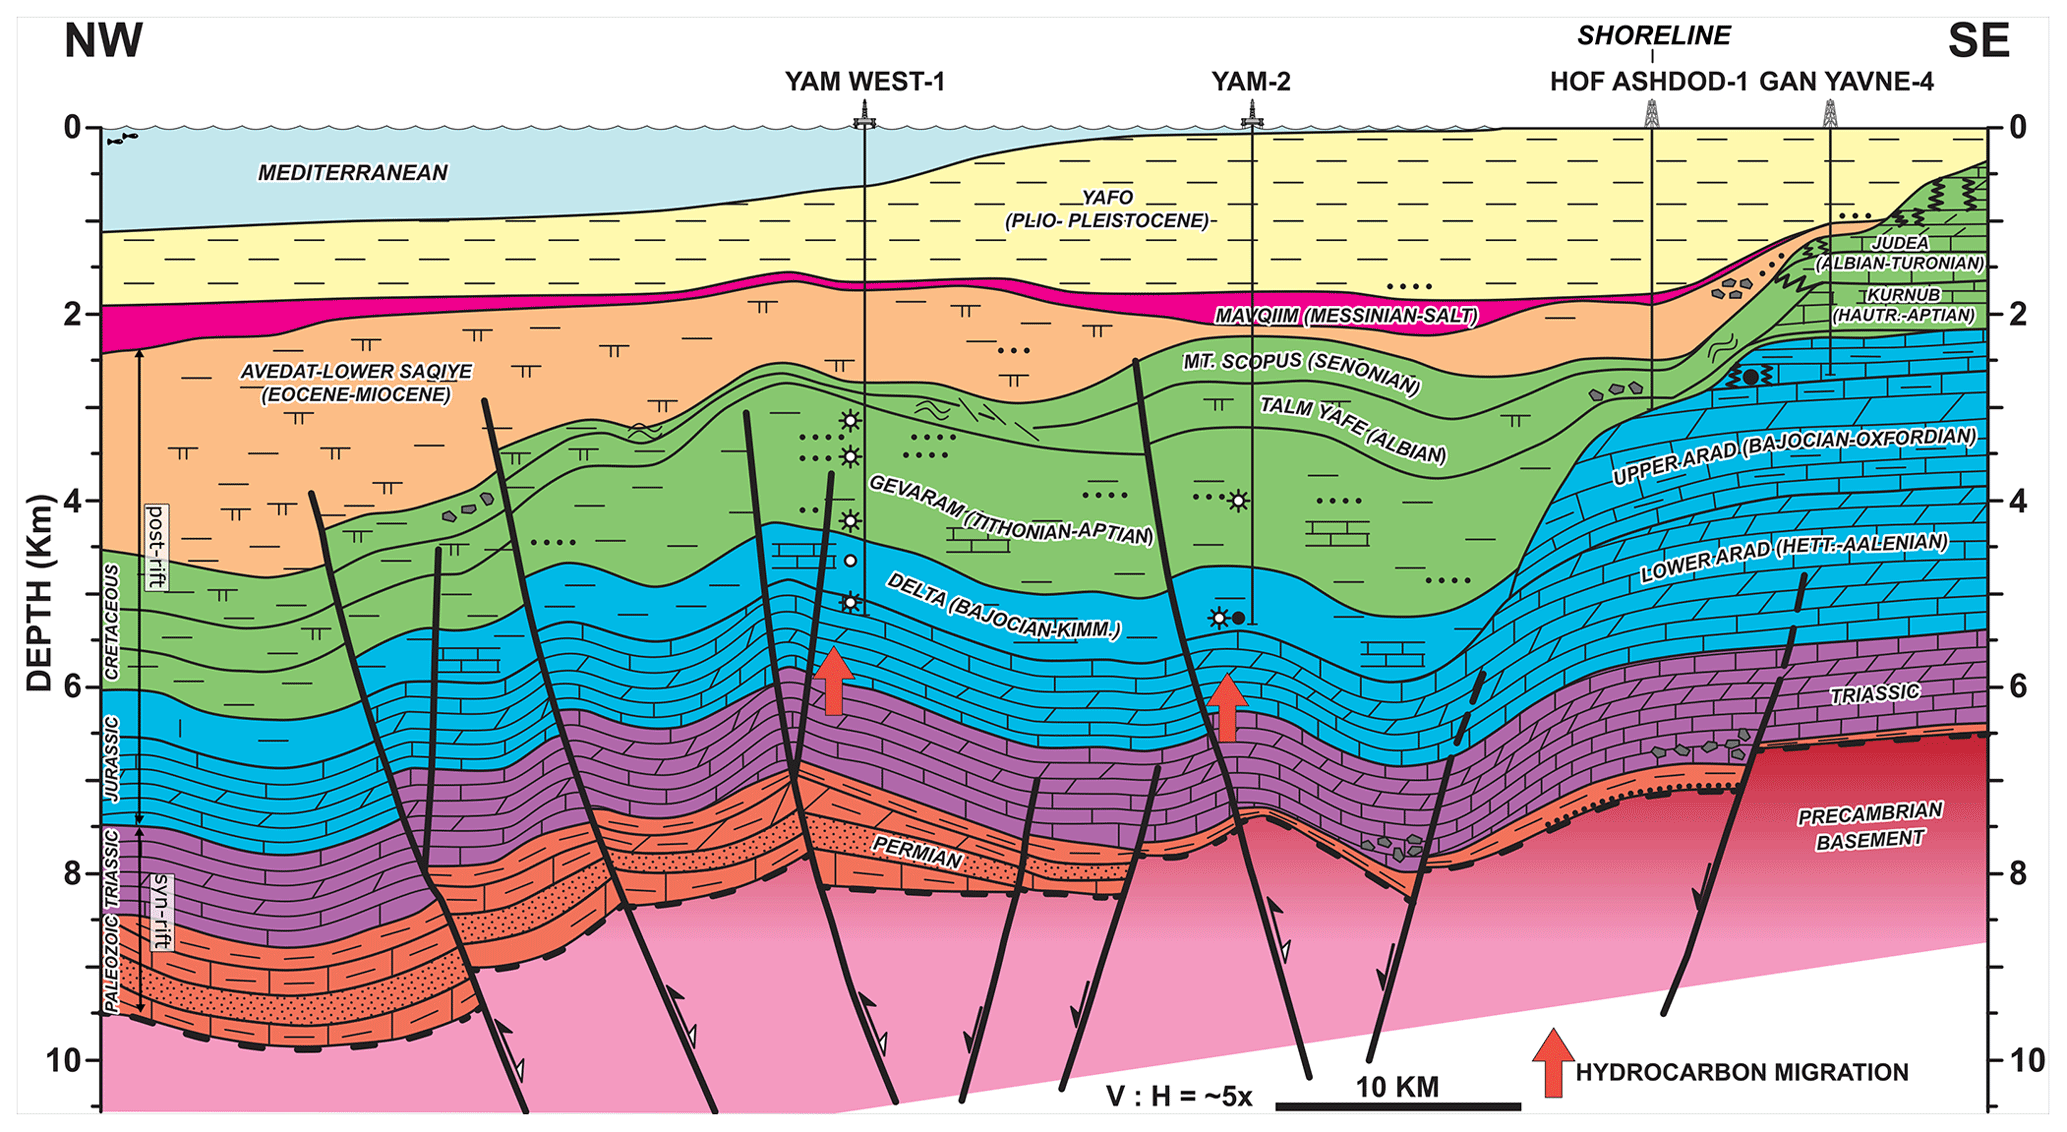
Figure 10Sub-regional cross section across the Israeli sector of the eastern Mediterranean (redrafted after Gardosh et al., 2014).
Here we present just one additional example from the Israeli sector of the eastern Mediterranean (Gardosh and Tannenbaum, 2014; Fig. 10). The cross section is well constrained up to ca. 5 km depth (Yam West-1 and Yam-2) and relies only on seismic interpretation below this depth (Gardosh et al., 2010; Gardosh and Tannenbaum, 2014). These deep wells targeted the inversion structures (Fig. 10). Both the Yam West and Yam anticline are formed due to ca. 100 m compressional displacement of the inverted syn-rift succession (Permo-Triassic; Gardosh et al., 2010). In the case of the Yam anticline, the fault propagates upwards up through the entire Cretaceous stratigraphy (Fig. 10). In the case of the Yam West anticline, the fault tips within the Cretaceous post-rift stratigraphy; however, in this situation, the displacement is accommodated by an antithetic fault which tips halfway through the Cretaceous (Fig. 10). Further to the northwest, two southeast-dipping inverted faults accommodated ca. 300–500 m reverse displacement and propagate across the entire post-rift Cretaceous sequence and tip within the Eocene–Miocene syn-inversion stratigraphy (Fig. 10). One should notice that, in this section, the inverted faults are planar instead of listric, as per our experiment; however, the fault propagating into the post-rift cover should not differ much (if at all).
4.3.3 Black Sea
The Black Sea Basin is a superimposed basin on the northern margin of the Tethys/southern margin of Laurussia with a complex structural history characterized by subsequent rifting and inversion events (see Bosworth and Tari, 2021, and references therein for an overview). For the purpose of this paper, we will only focus on the latest Cenozoic inversion of the Cretaceous syn-rift structures. Such inverted structures form many hydrocarbon fields in the Black Sea, with some being discovered in the early days of Black Sea hydrocarbon exploration (i.e. Golitsyna structure, the first offshore discovery in the Gulf of Odesa (Ukraine), Akçakoca biogenic gas field in the Turkish sector or Lebada field in the Romanian sector; see Bosworth and Tari, 2021, and references therein). Below we describe two examples of inversion structures from the Turkish and Romanian sector in detail.
To illustrate the Eocene inversion in the central part of the Turkish Black Sea Region, we reproduced a seismic section across the Akçakoca field (Fig. 11a) by Korucu et al. (2013). Additional seismic examples of the Akçakoca structure were published by Robinson et al. (1995) and Önal and Demirbağ (2019). The Akçakoca anticlinal trend is the outboard one among a few other inverted anticlines striking E–W to WNW–ESE in the offshore. The discovery well, Akçakoca-1, and two subsequent wells all documented a thick (> 1000 m) Paleocene–Eocene sequence above an at least 300 m thick Upper Cretaceous post-rift succession (Fig. 11b; Önal and Demirbağ, 2019). These post-rift strata are folded into an asymmetric anticline and truncated by an angular unconformity overlain by Pliocene post-kinematic shales. The major reverse fault controlling the structure is considered to be a reactivated early Cretaceous syn-rift fault corresponding to the syn-rift period in the opening of the Black Sea (Okay et al., 2018). Note that the upper segment of the reverse fault has not offset the Eocene strata; instead, it has just produced a kink in it, which has led to an asymmetric anticline structure (Fig. 11a) that is similar to the one produced in our Experiment 2 (Fig. 4).
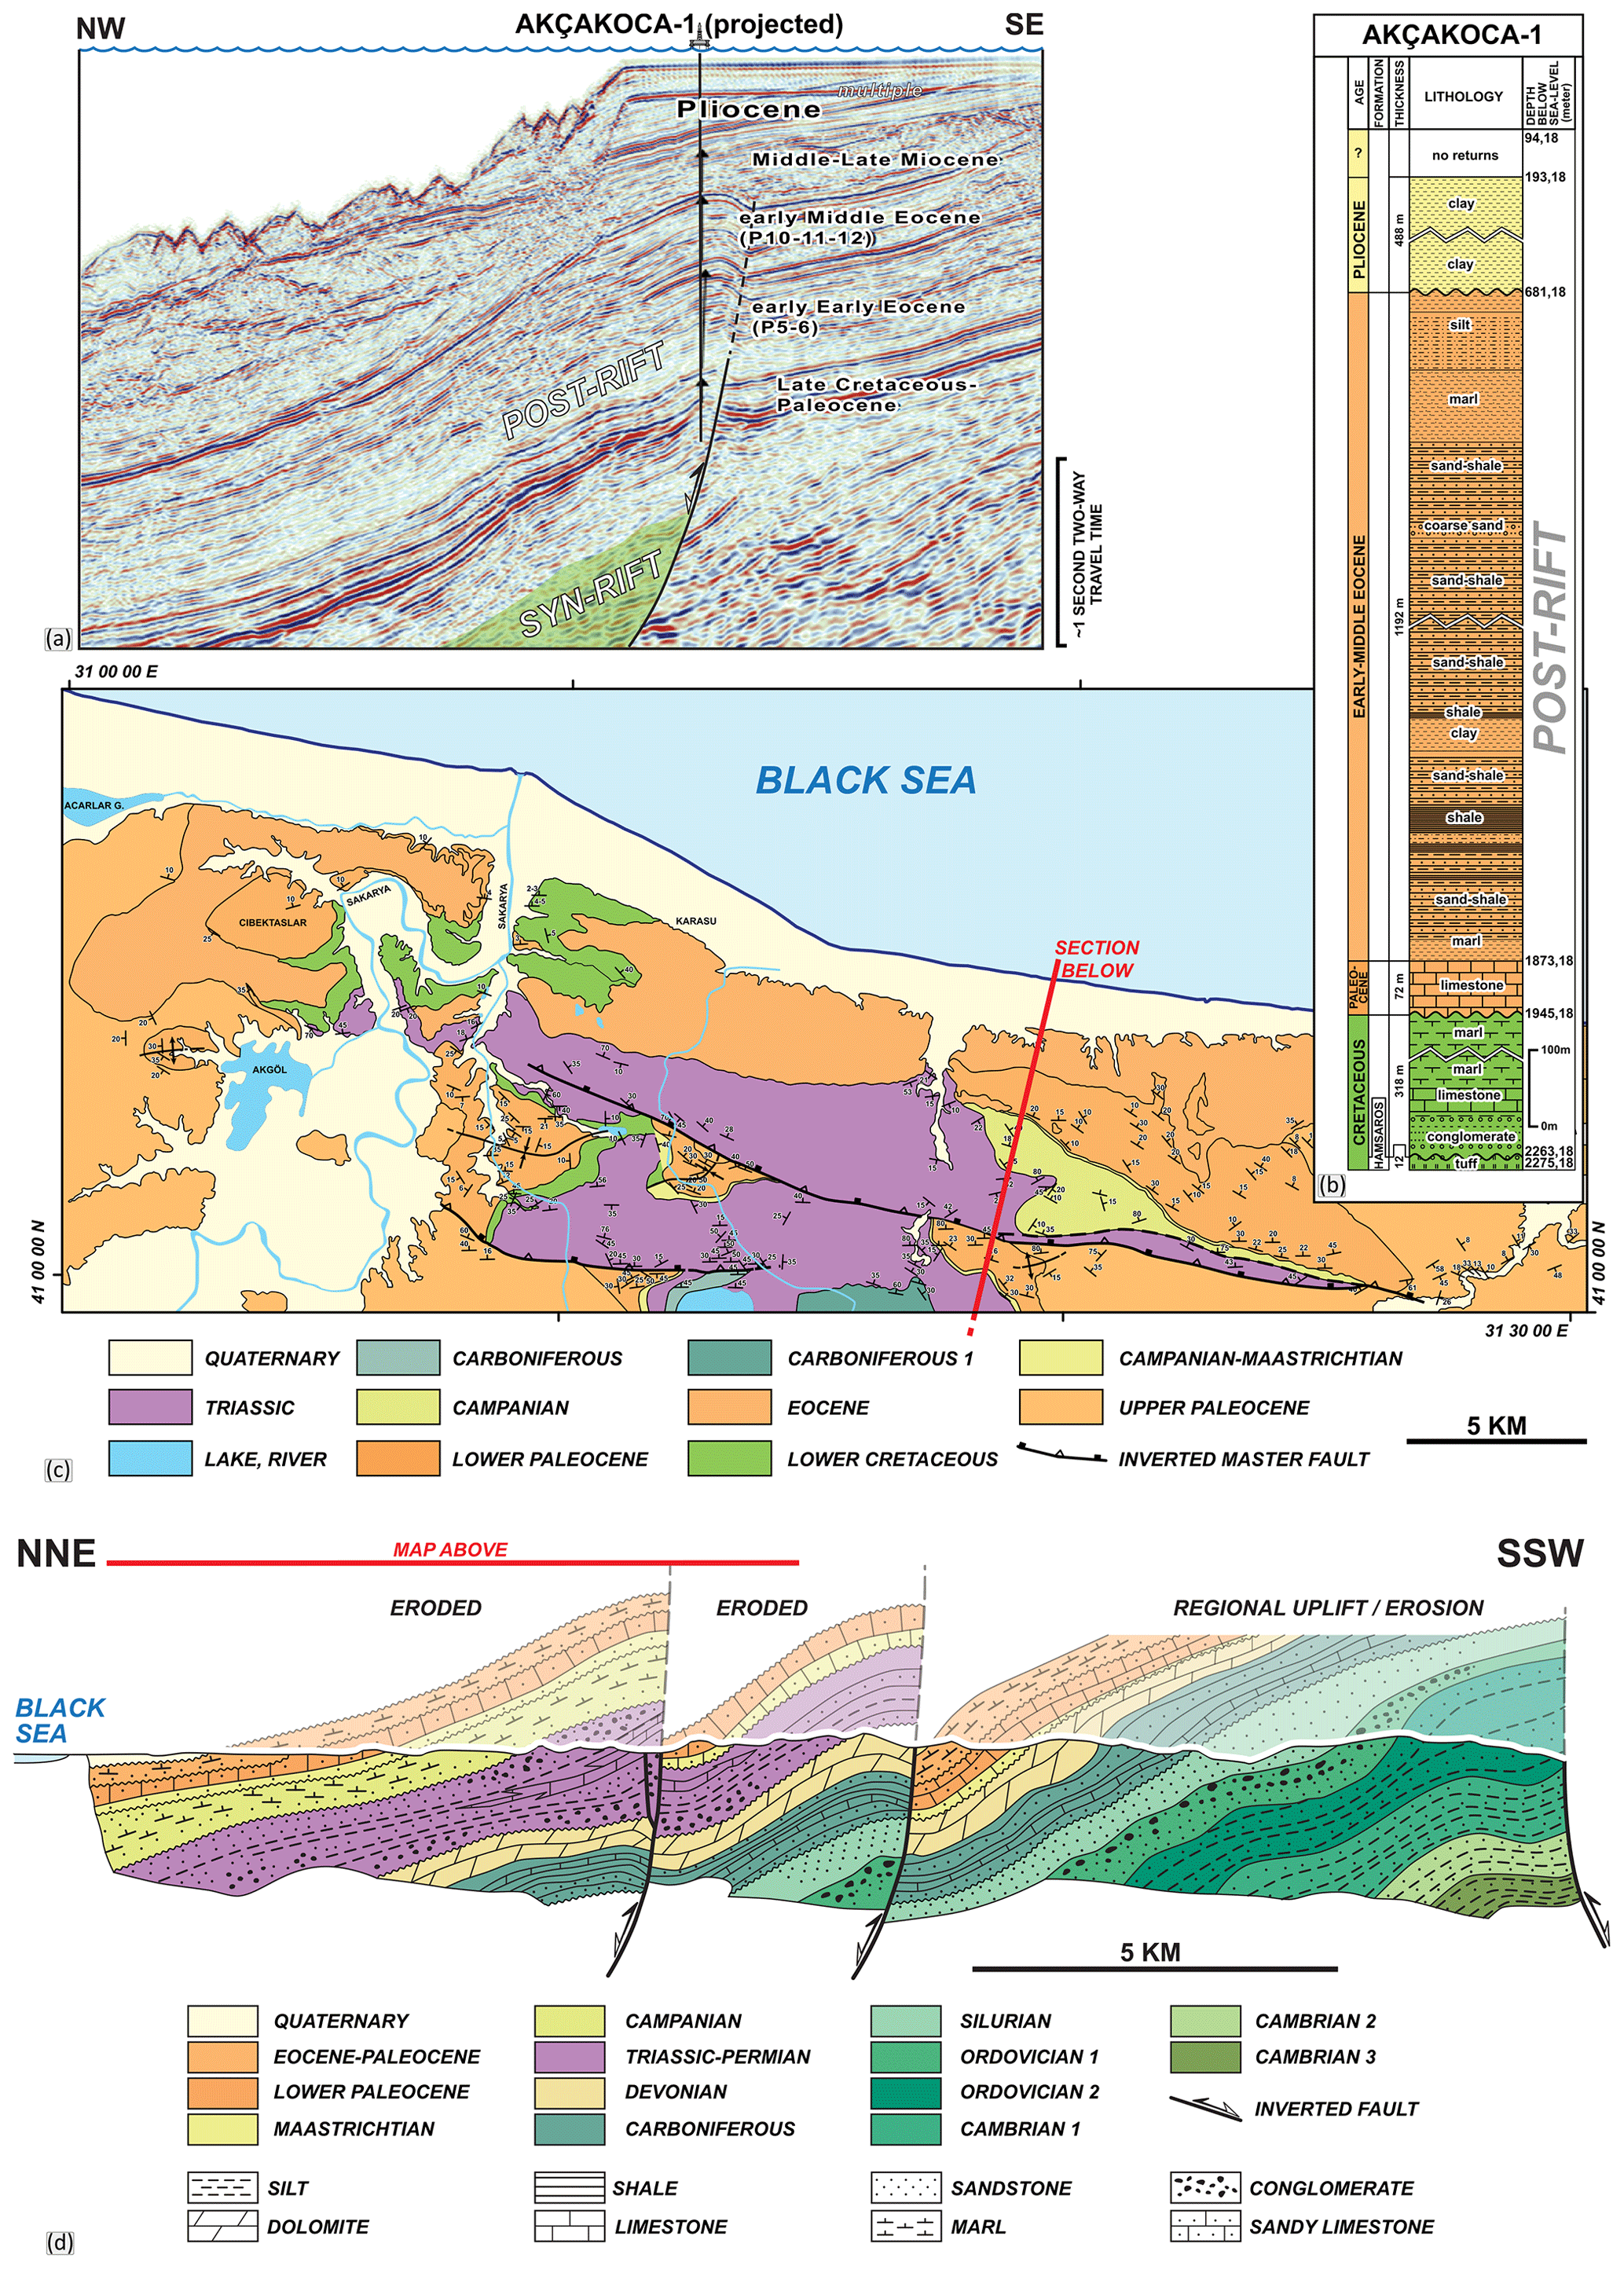
Figure 11Inversion structures along the Turkish Black Sea coastline in the Akçakoca segment. (a) Time domain 2D reflection seismic line across the Akçakoca gas discovery trend (Korucu et al., 2013). (b) Lithostratigraphic summary of the Akçakoca-1 well (adapted from Önal and Demirbag, 2019). (c) Geologic map of the coastal area near Sakarya and Akçakoca. (d) Geological cross section adopted from Aydın et al. (1987) and amended by the interpreted shape of the two inversion structures.
Interestingly, there are structures in the nearby onshore area which we also consider to be inversion features. The geologic map and the corresponding transect (Aydın et al., 1987) in the onshore Sakarya–Akçakoca area (Fig. 11c and d) were reproduced here to argue that at least two outcropping WNW–ESE structures may represent inversion structures which were severely eroded down to their core after the middle Eocene uplift of the Central Pontides. We have conceptually added the eroded hanging wall anticlines to the transect of Aydın et al. (1987) to show what these structures might have looked like prior to the regional erosion (Fig. 11d). The onshore examples suggest that the pre-existing extensional fabric required for the reverse reactivation during inversion may be older than early Cretaceous. In fact, the section of Aydın et al. (1987) suggests growth for the Triassic sequence for the outboard structure (Fig. 11d). If correct, perhaps the offshore inversion anticlines, striking in the same way and having the same polarity, may have an older syn-rift core than the inferred Lower Cretaceous strata do.
In the deepwater segment of offshore Romania, there is a large biogenic gas find associated with an inversion structure. The discovery on a NE–SW-trending four-way anticline was made by the Domino-1 well in 2012, some 170 km offshore, at 930 m water depth. The Domino play concept (Fig. 12) was described pre-drill by Bega and Ionescu (2009) and post-drill by Tari and Simmons (2018), although the play and the prospect itself were already defined in the early 2000s. As for the hydrocarbon exploration, the gas reservoirs of the Domino discovery are Miocene to Pliocene deepwater clastic systems (Bega and Ionescu, 2009; Routh et al., 2017) located within the upper part of the post-rift sequence of the inversion structure. The source for the biogenic gas in the pay intervals is believed to be within post-rift Miocene shales, just like in the nearby small gas fields located at the shelf edge (e.g. Duley and Fogg, 2009; Olaru et al., 2018).
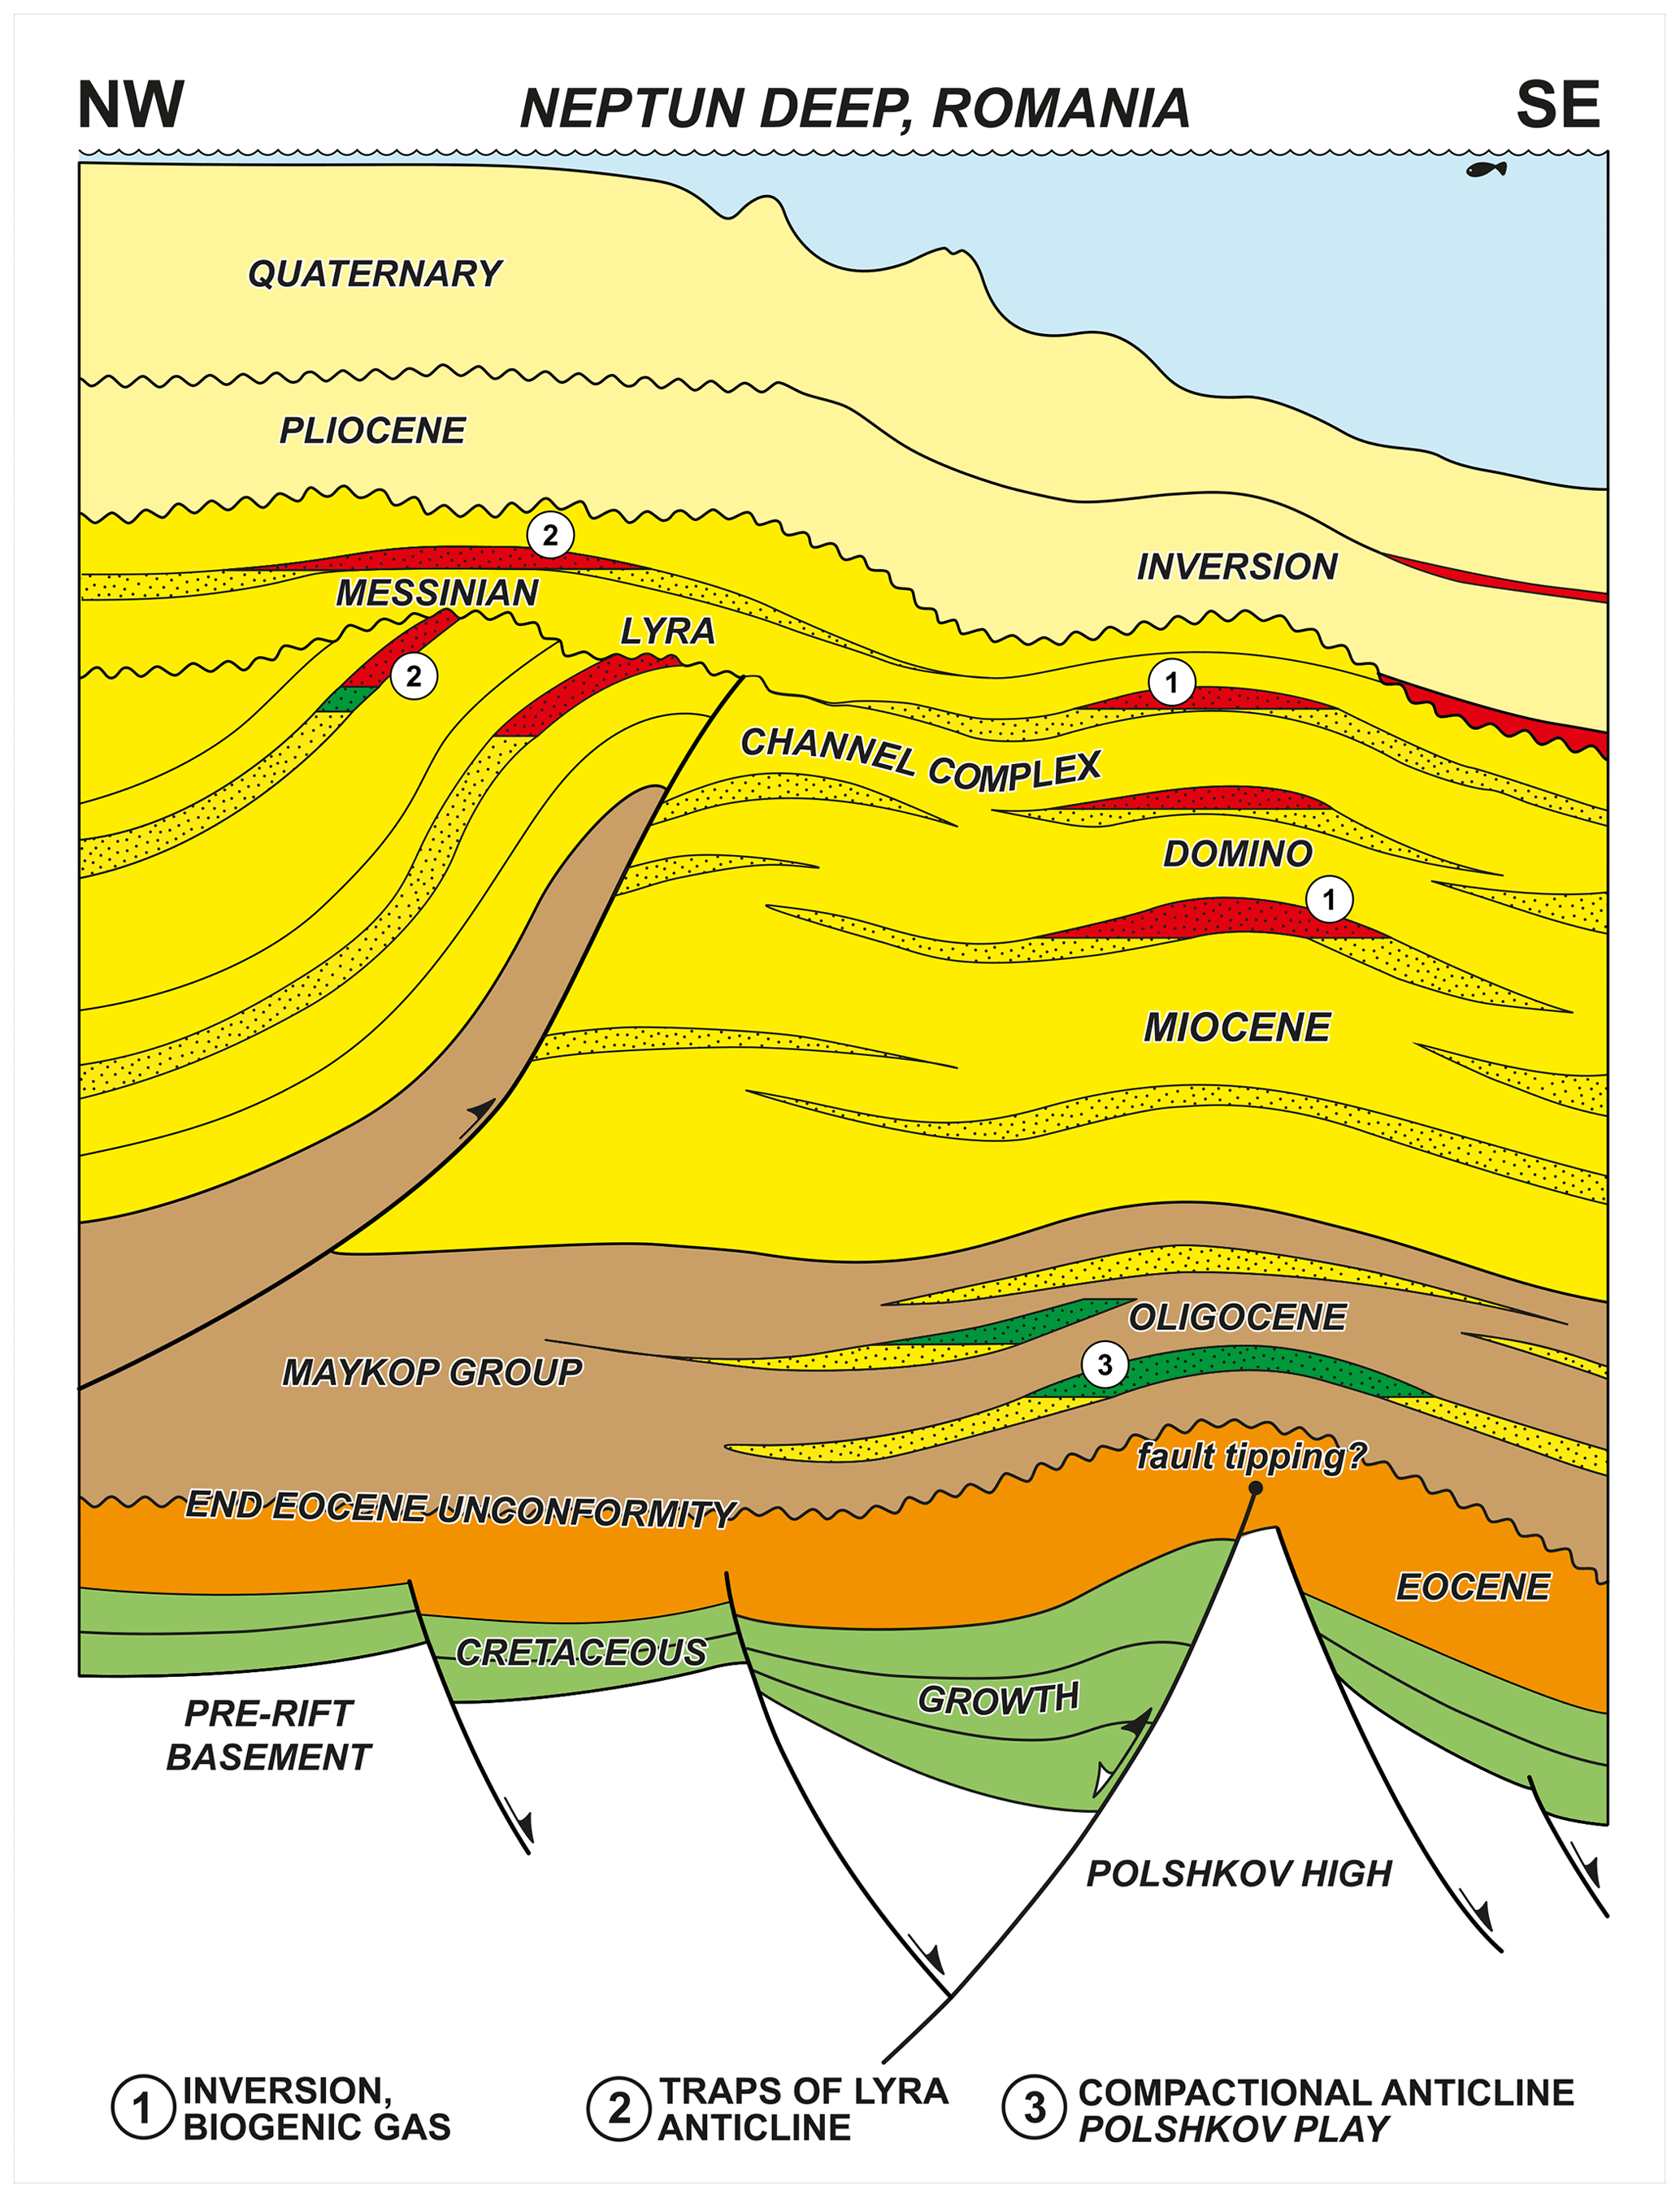
Figure 12Play concept cartoon of the Domino-1 well drilled in the Romanian sector of the western Black Sea (modified from Tari and Simmons 2018). Note the dominance of the unfaulted Paleogene-to-Neogene post-rift sequence over the underlying Cretaceous syn-rift strata, suggesting that there is a Mode II positive inversion.
The robust closure for the multiple pay zones within the Miocene post-rift sequence is the result of a latest Neogene-to-Pliocene inversion period above a deep-seated pre-rift basement high (Fig. 12). The apex of the regional Polshkov syn-rift basement high (Robinson et al., 1995; Tari et al., 2009) beneath the Domino anticline is located at 7–8 km depth, based on the depth-migrated regional 2D reflection seismic data (Nikishin et al., 2015) and therefore poorly imaged due to the thick and complex overburden. Therefore, the exact structural relationship between the Polshkov High and the overlying Domino structure is not easy to interpret with confidence.
Here we show a more specific conceptual structural interpretation of the Domino anticline, assuming that the Cretaceous syn-rift master fault is located on the inboard flank of the Polshkov High, dipping towards the coastline in the NW (Fig. 12). The reversal of movement on this regional fault plane during the Pliocene may have caused the slightly asymmetric folding of the entire ca. 6–7 km thick post-rift strata. The reverse fault itself tips out within the Paleogene sequence (Fig. 12), as there is no sign of a major fault propagating up into the folded Neogene sequence (Nikishin et al., 2015).
It is difficult to tell how much compressional displacement the underlying pre-existing rift fault accommodated; however, as the structural style is dominated by gentle forced folds in the post-rift sequence (typical Mode II structures) similar to, for example, our Experiment 2, we can assume it was minor.
Based on our physical experiments performed to address the influence of the syn- versus post-rift thickness ratio in relation to the development of Mode I and Mode II structures, we observe that this ratio does not seem to have a major influence on the inversion-related structures.
The structural patterns show that the style and propagation of contractional structures into the post-rift cover sequence are primarily affected by the amount of reverse movement along the inherited listric fault and the thickness of the post-tectonic cover. With larger shortening/compression, the inverted listric fault propagates all the way to the free surface. However, a thicker syn-rift succession driven by more normal fault displacement can lead to the development of multiple antithetic or synthetic faults in the hanging wall, which in the subsurface might be under the seismic resolution. These structures can also be reactivated and contribute to the folding of the post-rift.
Although this set of experiments has not been specifically tailored or scaled to the presented natural examples, there are many similarities in addition to some differences that should be noted.
Based on both analogue modelling observations and natural examples, a thicker post-rift cover tends to inhibit the propagation of thrust faults up-section (if the displacements are small), causing the reverse fault to tip out and form symmetric to slightly asymmetric large, gentle folds at higher post-rift stratigraphic levels (Mode II structures). Such folds have been described in Aotearoa/New Zealand, Israel, the Republic of Türkiye, and Romania, where the reverse fault tipped out in the lower part of the post-rift sequence, and the Mode II inversion produced very large and only slightly asymmetric folds several kilometres above the underlying inverted fault.
Regarding the differences, one should notice that, in some natural examples, the inverted faults are planar instead of listric, as per our experiment; however, the fault propagating into the post-rift cover should not differ much (if at all). Also, in the Aotearoa/New Zealand example, the reactivated fault tips out, with a trishear deformation zone ahead of it generating an asymmetric anticline in the upper section. Although we can observe similar structures in Experiment 2, which can suggest trishear deformation, a new set of physical experiments should be done to specifically address trishear deformation in the inverted basins.
The observations presented in this paper have a direct impact on the understanding of the geo-energy systems associated with inverted structures. We hope that, in future, we will be able to shed more light on the faulting-to-folding transition as a function of post-rift thickness and (reactivated) fault displacement, validate it against clear subsurface seismic profile, and create an interpretation template in regions where this transition in not clear in seismic data.
Any seismic or well data in this paper (Sect. 4.3) have been from cited publications. The top view and section images provided in this paper and other raw data related to this study can be requested by contacting the corresponding author.
GT conceptualized the project. AT and DMT designed and carried out the experiments. GT provided and interpreted the natural examples. CK, AL, and ZS contributed to discussions and the revision of the paper. AT, DMT, and GT wrote the original draft and prepared the paper, with contributions from all co-authors.
The contact author has declared that none of the authors has any competing interests.
Publisher's note: Copernicus Publications remains neutral with regard to jurisdictional claims in published maps and institutional affiliations.
This article is part of the special issue “Analogue modelling of basin inversion”. It is not associated with a conference.
We thank Frank Zwaan for inviting us to contribute this paper to the special issue of Solid Earth and for his and the editorial board's efforts in the editorial process. We would also like to thank our reviewers Hamed Fazlikhani and Piotr Krzywiec for their constructive comments, which significantly improved this paper. Discussions concerning inversion tectonics with the late Albert Bally, Bill Bosworth, Troy Collier, Dana-Stefania Constandache, Kia Fallah, Callum Kennedy, Jan Mayer, Aral Okay, Andrew Robinson, and Alexander Wunderlich are greatly appreciated.
This paper was edited by Michael Rudolf and reviewed by Piotr Krzywiec and Hamed Fazlikhani.
Adam, J., Urai, J. L., Wieneke, B., Oncken, O., Pfeiffer, K., Kukowski, N., Lohrmann, J., Hoth, S., van der Zee, W., and Schmatz, J.: Shear localisation and strain distribution during tectonic faulting – new insights from granular-flow experiments and high-resolution optical image correlation techniques, J. Struct. Geol., 27, 283–301, https://doi.org/10.1016/j.jsg.2004.08.008, 2005.
Allmendinger, R. W.: Inverse and forward numerical modeling of trishear fault-propagation folds, Tectonics, 17, 640–656, https://doi.org/10.1029/98TC01907, 1998.
Aydın, M., Serdar, H. S., Şahintürk, Ö., Yazman, M., Çokuğraş, R., Demir, O., and Özçelik, Y.: The geology of the Çamdağ (Sakarya)-Sünnicedağ (Bolu) region, Bull. Geol. Soc. Turk., 30, 1–14, 1987.
Badley, M. E., Price, J. D., and Backshall, L. C.: Inversion, reactivated faults and related structures: seismic examples from the southern North Sea, Geol. Soc. Lond. Spec. Publ., 44, 201–219, https://doi.org/10.1144/GSL.SP.1989.044.01.12, 1989.
Bally, A. W.: Tectogénèse et sismique réflexion, Bull. Société Géologique Fr., 29, 279–285, 1984.
Bega, Z. and Ionescu, G.: Neogene structural styles of the NW Black Sea region, offshore Romania, Lead. Edge, 28, 1082–1089, https://doi.org/10.1190/1.3236378, 2009.
Bevan, T. G. and Moustafa, A. R.: Inverted rift-basins of northern Egypt, in: Regional Geology and Tectonics: Phanerozoic Rift Systems and Sedimentary Basins, Elsevier, 482–507, https://doi.org/10.1016/B978-0-444-56356-9.00018-3, 2012.
Bonini, M., Sani, F., and Antonielli, B.: Basin inversion and contractional reactivation of inherited normal faults: A review based on previous and new experimental models, Tectonophysics, 522–523, 55–88, https://doi.org/10.1016/j.tecto.2011.11.014, 2012.
Bosworth, W. and Tari, G.: Hydrocarbon accumulation in basins with multiple phases of extension and inversion: examples from the Western Desert (Egypt) and the western Black Sea, Solid Earth, 12, 59–77, https://doi.org/10.5194/se-12-59-2021, 2021.
Bosworth, W., Guiraud, R., and Kessler, L. G.: Late Cretaceous (ca. 84 Ma) compressive deformation of the stable platform of northeast Africa (Egypt): Far-field stress effects of the “Santonian event” and origin of the Syrian arc deformation belt, Geology, 27, 633, https://doi.org/10.1130/0091-7613(1999)027<0633:LCCMCD>2.3.CO;2, 1999.
Buchanan, P. G. and McClay, K. R.: Sandbox experiments of inverted listric and planar fault systems, Tectonophysics, 188, 97–115, https://doi.org/10.1016/0040-1951(91)90317-L, 1991.
Buiter, S. J. H., Pfiffner, O. A., and Beaumont, C.: Inversion of extensional sedimentary basins: A numerical evaluation of the localisation of shortening, Earth Planet. Sc. Lett., 288, 492–504, https://doi.org/10.1016/j.epsl.2009.10.011, 2009.
Cooper, M. and Warren, M. J.: The geometric characteristics, genesis and petroleum significance of inversion structures, Geol. Soc. Lond. Spec. Publ., 335, 827–846, https://doi.org/10.1144/SP335.33, 2010.
Cooper, M. and Warren, M. J.: Inverted fault systems and inversion tectonic settings, in: Regional Geology and Tectonics: Principles of Geologic Analysis, Elsevier, 169–204, https://doi.org/10.1016/B978-0-444-64134-2.00009-2, 2020.
Cubas, N., Barnes, C., and Maillot, B.: Inverse method applied to a sand wedge: Estimation of friction parameters and uncertainty analysis, J. Struct. Geol., 55, 101–113, https://doi.org/10.1016/j.jsg.2013.07.003, 2013.
Dichiarante, A. M., Holdsworth, R. E., Dempsey, E. D., McCaffrey, K. J. W., and Utley, T. A. G.: Outcrop-scale manifestations of reactivation during multiple superimposed rifting and basin inversion events: the Devonian Orcadian Basin, northern Scotland, J. Geol. Soc., 178, jgs2020-089, https://doi.org/10.1144/jgs2020-089, 2021.
Dooley, T. P. and Hudec, M. R.: Extension and inversion of salt-bearing rift systems, Solid Earth, 11, 1187–1204, https://doi.org/10.5194/se-11-1187-2020, 2020.
Duley, P. and Fogg, A.: Old dogs and new tricks; unlocking the hydrocarbon potential of the Romanian Black Sea: Ana and Doina gas fields and the role of inversion in derisking, Lead. Edge, 28, 1091–1096, 2009.
Ellis, P. G. and McClay, K. R.: Listric extensional fault systems – results of analogue model experiments, Basin Res., 1, 55–70, https://doi.org/10.1111/j.1365-2117.1988.tb00005.x, 1988.
Erslev, E. A.: Trishear fault-propagation folding, Geology, 19, 617, https://doi.org/10.1130/0091-7613(1991)019<0617:TFPF>2.3.CO;2, 1991.
Ferrer, O., McClay, K., and Sellier, N. C.: Influence of fault geometries and mechanical anisotropies on the growth and inversion of hangingwall synclinal basins: insights from sandbox models and natural examples, Geol. Soc. Lond. Spec. Publ., 439, 487–509, https://doi.org/10.1144/SP439.8, 2017.
Gardosh, M. A. and Tannenbaum, E.: The Petroleum Systems of Israel, in: Memoir 106: Petroleum Systems of the Tethyan Region, edited by: Marlow, L., Kendall, C. C. G., and Rose, L. A., AAPG, https://doi.org/10.1306/13431857M106298, 2014.
Gardosh, M. A., Garfunkel, Z., Druckman, Y., and Buchbinder, B.: Tethyan rifting in the Levant Region and its role in Early Mesozoic crustal evolution, Geol. Soc. Lond. Spec. Publ., 341, 9–36, https://doi.org/10.1144/SP341.2, 2010.
Giba, M., Nicol, A., and Walsh, J. J.: Evolution of faulting and volcanism in a back-arc basin and its implications for subduction processes: TARANAKI BASIN EVOLUTION, Tectonics, 29, TC4020, https://doi.org/10.1029/2009TC002634, 2010.
Gillcrist, R., Coward, M., and Mugnier, J.-L.: Structural inversion and its controls: examples from the Alpine foreland and the French Alps, Geodin. Acta, 1, 5–34, https://doi.org/10.1080/09853111.1987.11105122, 1987.
Gomes, C. J. S., Danderfer Filho, A., Posada, A. M. A., and da Silva, A. C.: The role of backstop shape during inversion tectonics physical models, An. Acad. Bras. Ciênc., 82, 997–1012, https://doi.org/10.1590/S0001-37652010000400021, 2010.
Granado, P. and Ruh, J. B.: Numerical modelling of inversion tectonics in fold-and-thrust belts, Tectonophysics, 763, 14–29, https://doi.org/10.1016/j.tecto.2019.04.033, 2019.
Harding, T. P.: Seismic Characteristics and Identification of Negative Flower Structures, Positive Flower Structures, and Positive Structural Inversion, AAPG Bull., 69, 582–600, https://doi.org/10.1306/AD462538-16F7-11D7-8645000102C1865D, 1985.
Hardy, S. and Ford, M.: Numerical modeling of trishear fault propagation folding, Tectonics, 16, 841–854, https://doi.org/10.1029/97TC01171, 1997.
Koopman, A., Speksnijder, A., and Horsfield, W. T.: Sandbox model studies of inversion tectonics, Tectonophysics, 137, 379–388, https://doi.org/10.1016/0040-1951(87)90329-5, 1987.
Korucu, Ö., Sipahioğlu, N. Ö., Aktepe, S., and Bengü, E.: Correlation and determination of Neogene sequences employing recent ultra-deep wells in Western-Central part of Turkish Black Sea, AAPG Europe Regional Conference, Tbilisi, 12–19, 2013.
Krzywiec, P., Gutowski, J., Walaszczyk, I., Wróbel, G., and Wybraniec, S.: Tectonostratigraphic model of the late cretaceous inversion along the Nowe Miasto-Zawichost fault zone, SE Mid-Polish trough, Geol. Q., 53, 27–48, 2009.
Krzywiec, P., Stachowska, A., and Stypa, A.: The only way is up – on Mesozoic uplifts and basin inversion events in SE Poland, Geol. Soc. Lond. Spec. Publ., 469, 33–57, https://doi.org/10.1144/SP469.14, 2018.
Lamplugh, G. W.: Structure of the Weald and analogous tracts, Q. J. Geol. Soc. Lond., 75, 73–95, 1919.
Macgregor, D. S.: Hydrocarbon habitat and classification of inverted rift basins, Geol. Soc. Lond. Spec. Publ., 88, 83–93, https://doi.org/10.1144/GSL.SP.1995.088.01.06, 1995.
Mattioni, L., Sassi, W., and Callot, J.-P.: Analogue models of basin inversion by transpression: role of structural heterogeneity, Geol. Soc. Lond. Spec. Publ., 272, 397–417, https://doi.org/10.1144/GSL.SP.2007.272.01.20, 2007.
McClay, K. R.: Analogue models of inversion tectonics, Geol. Soc. Lond. Spec. Publ., 44, 41–59, https://doi.org/10.1144/GSL.SP.1989.044.01.04, 1989.
McClay, K. R.: The geometries and kinematics of inverted fault systems: a review of analogue model studies, Geol. Soc. Lond. Spec. Publ., 88, 97–118, https://doi.org/10.1144/GSL.SP.1995.088.01.07, 1995.
McClay, K. R. and Buchanan, P. G.: Thrust faults in inverted extensional basins, in: Thrust Tectonics, edited by: McClay, K. R., Springer Netherlands, Dordrecht, 93–104, https://doi.org/10.1007/978-94-011-3066-0_8, 1992.
Mitra, S. and Islam, Q. T.: Experimental (clay) models of inversion structures, Tectonophysics, 230, 211–222, https://doi.org/10.1016/0040-1951(94)90136-8, 1994.
Molnar, N. and Buiter, S.: Analogue modelling of the inversion of multiple extensional basins in foreland fold-and-thrust belts, Solid Earth, 14, 213–235, https://doi.org/10.5194/se-14-213-2023, 2023.
Moustafa, A.: Structural setting and tectonic evolution of North Sinai folds, Egypt, Geol. Soc. Lond. Spec. Publ., 341, 37–63, https://doi.org/10.1144/SP341, 2010.
Moustafa, A. R.: Mesozoic-Cenozoic Deformation History of Egypt, in: The Geology of Egypt, Regional Geology Reviews, edited by: Hamimi, Z., El-Barkooky, A., Martínez Frías, J., Fritz, H., and Abd El-Rahman, Y., Springer, Cham, https://doi.org/10.1007/978-3-030-15265-9_7, 2020.
Needham, D. L., Pettingill, H. S., Christensen, C. J., ffrench, J., and Karcz, Z. (Kul): The Tamar Giant Gas Field: Opening the Subsalt Miocene Gas Play in the Levant Basin, in: Giant Fields of the Decade 2000–2010, The American Association of Petroleum Geologists, https://doi.org/10.1306/13572009M1133688, 2017.
Nicol, A., Mazengarb, C., Chanier, F., Rait, G., Uruski, C., and Wallace, L.: Tectonic evolution of the active Hikurangi subduction margin, New Zealand, since the Oligocene: Hikurangi subduction margin tectonics, Tectonics, 26, TC4002, https://doi.org/10.1029/2006TC002090, 2007.
Nikishin, A. M., Okay, A. I., Tüysüz, O., Demirer, A., Amelin, N., and Petrov, E.: The Black Sea basins structure and history: New model based on new deep penetration regional seismic data. Part 1: Basins structure and fill, Mar. Pet. Geol., 59, 638–655, https://doi.org/10.1016/j.marpetgeo.2014.08.017, 2015.
Okay, A. I., Altiner, D., Sunal, G., Aygül, M., Akdoğan, R., Altiner, S., and Simmons, M.: Geological evolution of the Central Pontides, Geol. Soc. Lond. Spec. Publ., 464, 33–67, https://doi.org/10.1144/SP464.3, 2018.
Olaru, R., Krézsek, C., Rainer, T. M., Ungureanu, C., Turi, V., Ionescu, G., and Tari, G.: 3D basin modelling of oligocene – miocene maikop source rocks offshore romania and in the western black sea, J. Petrol. Geol., 41, 351–365, https://doi.org/10.1111/jpg.12707, 2018.
Önal, K. M. and Demirbag, E.: New evidences of compressional tectonic regime at the southern part of the Western Black Sea Basin offshore Akçakoca-Cide, Istanb. J. Geosci., 30, 27–51, 2019.
Panien, M., Schreurs, G., and Pfiffner, A.: Sandbox experiments on basin inversion: testing the influence of basin orientation and basin fill, J. Struct. Geol., 27, 433–445, https://doi.org/10.1016/j.jsg.2004.11.001, 2005.
Phillips, T. B., Jackson, C. A.-L., and Norcliffe, J. R.: Pre-inversion normal fault geometry controls inversion style and magnitude, Farsund Basin, offshore southern Norway, Solid Earth, 11, 1489–1510, https://doi.org/10.5194/se-11-1489-2020, 2020.
Pinto, L., Munoz, C., Nalpas, T., and Charrier, R.: Role of sedimentation during basin inversion in analogue modelling, J. Struct. Geol. 32, 554–565, https://doi.org/10.1016/j.jsg.2010.03.001, 2010.
Reilly, C., Nicol, A., and Walsh, J.: Importance of preexisting fault size for the evolution of an inverted fault system, Geol. Soc. Lond. Spec. Publ., 439, 447–463, https://doi.org/10.1144/SP439.2, 2017.
Roberts, D. G.: Basin inversion in and around the British Isles, Geol. Soc. Lond. Spec. Publ., 44, 131–150, https://doi.org/10.1144/GSL.SP.1989.044.01.09, 1989.
Roberts, G. and Peace, D.: Hydrocarbon plays and prospectivity of the Levantine Basin, offshore Lebanon and Syria from modern seismic data, GeoArabia, 12, 99–124, https://doi.org/10.2113/geoarabia120399, 2007.
Robinson, A., Spadini, G., Cloetingh, S., and Rudat, J.: Stratigraphic evolution of the Black Sea: inferences from basin modelling, Mar. Petrol. Geol., 12, 821–835, https://doi.org/10.1016/0264-8172(95)98850-5, 1995.
Roma, M., Ferrer, O., McClay, K. R., Munoz, J. A., Roca, E., Gratacos, O., and Cabello, P.: Weld kinematics of syn-rift salt during basement-involved extension and subsequent inversion: Results from analog models, Geol. Acta, 16, 391–410, https://doi.org/10.1344/GeologicaActa2018.16.4.4, 2018.
Routh, P., Neelamani, R., Lu, R., Lazaratos, S., Braaksma, H., Hughes, S., Saltzer, R., Stewart, J., Naidu, K., Averill, H., Gottumukkula, V., Homonko, P., Reilly, J., and Leslie, D.: Impact of high-resolution FWI in the Western Black Sea: Revealing overburden and reservoir complexity, Lead. Edge, 36, 60–66, https://doi.org/10.1190/tle36010060.1, 2017.
Sieberer, A.-K., Willingshofer, E., Klotz, T., Ortner, H., and Pomella, H.: Inversion of extensional basins parallel and oblique to their boundaries: Inferences from analogue models and field observations from the Dolomites Indenter, eastern Southern Alps, EGUsphere [preprint], https://doi.org/10.5194/egusphere-2022-1530, 2023.
Tamas, A., Holdsworth, R. E., Underhill, J. R., Tamas, D. M., Dempsey, E. D., Hardman, K., Bird, A., McCarthy, D., McCaffrey, K. J. W., and Selby, D.: New onshore insights into the role of structural inheritance during Mesozoic opening of the Inner Moray Firth Basin, Scotland, J. Geol. Soc., 179, jgs2021-066, https://doi.org/10.1144/jgs2021-066, 2022a.
Tamas, A., Holdsworth, R. E., Underhill, J. R., Tamas, D. M., Dempsey, E. D., McCarthy, D. J., McCaffrey, K. J. W., and Selby, D.: Correlating deformation events onshore and offshore in superimposed rift basins: The Lossiemouth Fault Zone, Inner Moray Firth Basin, Scotland, Basin Res., 34, 1314–1340, https://doi.org/10.1111/bre.12661, 2022b.
Tamas, D. M., Schléder, Z., Tămaş, A., Krézsek, C., Copot, B., and Filipescu, S.: Middle Miocene evolution and structural style of the Diapir Fold Zone, Eastern Carpathian Bend Zone, Romania: insights from scaled analogue modelling, Geol. Soc. Lond. Spec. Publ., SP490-2019–091, https://doi.org/10.1144/SP490-2019-091, 2020.
Tari, G., Davies, J., Dellmour, R., Larratt, E., Novotny, B., and Kozhuharov, E.: Play types and hydrocarbon potential of the deepwater Black Sea, NE Bulgaria, Lead. Edge, 28, 1076–1081, https://doi.org/10.1190/1.3236377, 2009.
Tari, G., Arbouille, D., Schléder, Z., and Tóth, T.: Inversion tectonics: a brief petroleum industry perspective, Solid Earth, 11, 1865–1889, https://doi.org/10.5194/se-11-1865-2020, 2020.
Tari, G. C. and Simmons, M. D.: History of deepwater exploration in the Black Sea and an overview of deepwater petroleum play types, Geol. Soc. Lond. Spec. Publ., 464, 439–475, https://doi.org/10.1144/SP464.16, 2018.
Turner, J. P. and Williams, G. A.: Sedimentary basin inversion and intra-plate shortening, Earth-Sci. Rev., 65, 277–304, https://doi.org/10.1016/j.earscirev.2003.10.002, 2004.
Uzkeda, H., Poblet, J., Bulnes, M., and Martín, S.: Effects of inherited structures on inversion tectonics: Examples from the Asturian Basin (NW Iberian Peninsula) interpreted in a Computer Assisted Virtual Environment (CAVE), Geosphere, 14, 1635–1656, https://doi.org/10.1130/GES01609.1, 2018.
Walley, C. D.: Some outstanding issues in the geology of Lebanon and their importance in the tectonic evolution of the Levantine region, Tectonophysics, 298, 37–62, https://doi.org/10.1016/S0040-1951(98)00177-2, 1998.
Wunderlich, A. and Mayer, J.: Sequential fault movement and sequence stratigraphic implications on linked depositional systems in a multi-phase rift, Central and Southern Taranaki Basin, New Zealand, in: EAGE/AAPG Workshop on Reducing Exploration Risk in Rift Basins, EAGE/AAPG Workshop on Reducing Exploration Risk in Rift Basins, Kuala Lumpur, Malaysia, 1–2, https://doi.org/10.3997/2214-4609.202076007, 2019.
Wunderlich, A., Fohrmann, M., Mayer, J., Clare, A., and Howlett, A.: Depositional Architecture, Sequence Stratigraphy and the Quantification of Hydrodynamic Fractionation as a Tool for the Prediction of Reservoir Quality in a Deep Marine System: An Example from the Miocene Moki Formation in the Maari/Manaia Field Area, Southern Taranaki Basin, New Zealand, in: Proceedings of the 2019 South East Asia Petroleum Exploration Society (SEAPEX) Conference, Southeast Asia Petroleum Exploration Society (SEAPEX), 35a, 2019.
Yamada, Y. and McClay, K. R.: 3-D Analog Modeling of Inversion Thrust Structures, in: Thrust Tectonics and Hydrocarbon Systems, Am. Assoc. Petr. Geol., 82, 281–306, https://doi.org/10.1306/M82813C16, 2004.
Zwaan, F., Schreurs, G., Buiter, S. J. H., Ferrer, O., Reitano, R., Rudolf, M., and Willingshofer, E.: Analogue modelling of basin inversion: a review and future perspectives, Solid Earth, 13, 1859–1905, https://doi.org/10.5194/se-13-1859-2022, 2022.