the Creative Commons Attribution 4.0 License.
the Creative Commons Attribution 4.0 License.
 | 15 Aug 2023
Electrical conductivity of anhydrous and hydrous gabbroic melt under high temperature and high pressure: implications for the high-conductivity anomalies in the mid-ocean ridge region
Mengqi Wang
Haiying Hu
Ziming Hu
Chenxin Jing
Chuanyu Yin
Song Luo
Jinhua Lai
The electrical conductivity of gabbroic melt with four different water contents (i.e., 0 %, 2.59 wt %, 5.92 wt %, and 8.32 wt %) was measured at temperatures of 873–1373 K and pressures of 1.0–3.0 GPa using a YJ-3000t multi-anvil high-pressure apparatus and Solartron-1260 impedance spectroscopy analyzer. At a fixed water content of 2.59 wt %, the electrical conductivity of the sample slightly decreased with increasing pressure in the temperature range of 873–1373 K, and its corresponding activation energy and activation volume were determined as 0.87 ± 0.04 eV and −1.98 ± 0.02 cm3 molec.−1, respectively. Under the certain conditions of 873–1373 K and 1.0 GPa, the electrical conductivity of the gabbroic melts tends to gradually increase with a rise in water content from 0 wt % to 8.32 wt %, and the activation enthalpy decreases from 0.93 to 0.63 eV accordingly. Furthermore, functional relation models for the electrical conductivity of gabbroic melts with variations of temperature, pressure, and water content were constructed at high-temperature and high-pressure conditions. In addition, the dependence relation of the electrical conductivity of melts with the degree of depolymerization was explored under conditions of four different water contents at 1373 K and 1.0 GPa, and three previously available reported results on those of representative calc-alkaline igneous rock melts (i.e., dacitic melt, basaltic melt, and andesitic melt) were compared in detail. In combination with our presently acquired electrical conductivity data on gabbroic melt with four different water contents and the available data on polycrystalline olivine, the electrical conductivity of a gabbroic melt–olivine system with variation of the volume percentage of anhydrous and hydrous melts was successfully constructed by using the typical Hashin–Shtrikman upper-bound model. In light of the electrical conductivity of the gabbroic melt–olivine system with previous magnetotelluric (MT) results, we find that anhydrous and hydrous gabbroic melts can be employed to reasonably interpret the high-conductivity anomalies in the Mohns Ridge of the Arctic Ocean.
- Article
(2790 KB) - Full-text XML
- BibTeX
- EndNote


Hydrous melt for various rocks and minerals widely exists at active plate tectonic boundaries such as mid-ocean ridges, subduction zones, and orogenic belts (Shen and Forsyth, 1995; White et al., 2001; Wallace, 2005; Wu et al., 2018; Sim et al., 2020; Förster and Selway, 2021; Li et al., 2022; Turner and Langmuir, 2022). For the Mohns Ridge in the Arctic Ocean, there are a large number of high-conductivity anomaly phenomena with corresponding magnitudes of 0.08–0.32 S m−1 for the gabbro-rich regions, which have been revealed on the basis of previous magnetotelluric (MT) controlled-source electromagnetic (CSEM) results (Johansen et al., 2019).
Previously available research has indicated that gabbroic and basaltic melts contain a large amount of water, and the water content for a certain type of melt may differ within the different depth ranges of the oceanic crust (Dixon et al., 1995; Almeev et al., 2008; Shaw et al., 2010; Leuthold et al., 2018). Meanwhile, water content is also considered to be a crucial ingredient to possibly affect the electrical conductivity of melt, and a large number of reported results for the effects of the variation of water content on the electrical conductivity of some representative calc-alkaline igneous rock melts at high temperature and high pressure have become available in recent years (Ni et al., 2011; Laumonier et al., 2015; Guo et al., 2017; Chen et al., 2018). For example, Ni et al. (2011) measured the electrical conductivity of hydrous basaltic melt within a water content range of 0 wt %–6.3 wt % at conditions of 1473–1923 K and 2.0 GPa, and they found that the electrical conductivity of basaltic melt with a fixed water content of 6.3 wt % was roughly 1 order of magnitude higher than that of the anhydrous sample. The electrical conductivity of dacitic melt within the water content range of 0 wt %–12 wt % was systematically investigated by Laumonier et al. (2015) within a temperature range of 673–1623 K and pressure of 0.3–3.0 GPa. As pointed out by Laumonier et al. (2015), the high-conductivity anomalies in the Uturuncu volcano could be explained by the presence of hydrous dacitic melt. By using a piston cylinder high-pressure apparatus and sweeping-frequency impedance spectroscopy, Guo et al. (2017) obtained electrical conductivity data on andesitic melt within the water content range of 0.01 wt %–5.90 wt % at conditions of 1164–1573 K and 0.5–1.0 GPa. Their experimental results indicated that the presence of less than 20 vol % of hydrous andesitic melt within the water content range of 6 wt %–9 wt % can be used to interpret the high-conductivity anomalies beneath the surface of the Uturuncu volcano. Electrical conductivity measurements of hydrous leucogranitic melt by Chen et al. (2018) at conditions of 739–1680 K and 0.36–2.52 GPa were systematically carried out within the water content range of 2.73 wt %–11.97 wt %. In combination with previous magnetotelluric data from the northwestern Himalaya, they considered water-rich leucogranitic melts with a volume percentage range of 4 vol %–16 vol % able to be applied to reasonably explain the high-conductivity anomalies in these regions.
For natural gabbroic rock, some previously available electrical conductivity results were obtained using a piston cylinder and multi-anvil high-pressure apparatus at high temperature and high pressure. Sato and Ida (1984) measured the electrical conductivity of olivine–gabbro containing gabbroic melt at the temperature range from 1123 to 1473 K and atmospheric pressure, and the effects of ionic diffusion of charge carriers (i.e., sodium, iron, magnesium, and/or calcium ions) and geometric structure of melt on the electrical conductivity of olivine–gabbro samples were explored in detail. Measurements of electrical conductivity for natural gabbro were carried out at conditions of 1023–1423 K and room pressure by Schilling et al. (1997), and they proposed that the electrical conductivity of samples can be enhanced by increasing the volume percentage of gabbroic melt. As for natural Oman gabbro, the electrical conductivity of gabbroic melt with the volume percentage proportion of 34 % was ∼ 1.0–2.0 orders of magnitude higher than that of a melt-free sample within the temperature range from 1073 to 1523 K and pressures of 0.3–1.0 GPa (Maumus et al., 2005). However, the influence of water content on the electrical conductivity of gabbroic melt at high temperature and high pressure was not investigated in detail. Consequently, it is crucial to make a systematic investigation of the electrical conductivity of gabbroic melt with different water contents under high-temperature and high-pressure conditions.
In the present study, a series of electrical conductivity tests on gabbroic melts were systematically performed under conditions of 873–1373 K, 1.0–3.0 GPa, and the variation of the water content range from 0 wt % to 8.32 wt %. The effects of temperature, pressure, and water content on the electrical conductivity of gabbroic melt are deeply explored, and functional relation models have been successfully established under high-temperature and high-pressure conditions. In conjunction with the degree of depolymerization, the electrical conductivity of gabbroic melt with different water contents is compared with that of three representative calc-alkaline igneous rock melts (i.e., dacitic melt, andesitic melt, and basaltic melt). Based on the calculated electrical conductivity of a gabbroic melt–olivine system, its potential geophysical implications are discussed in detail for the Mohns Ridge of the Arctic Ocean.
2.1 Sample preparation
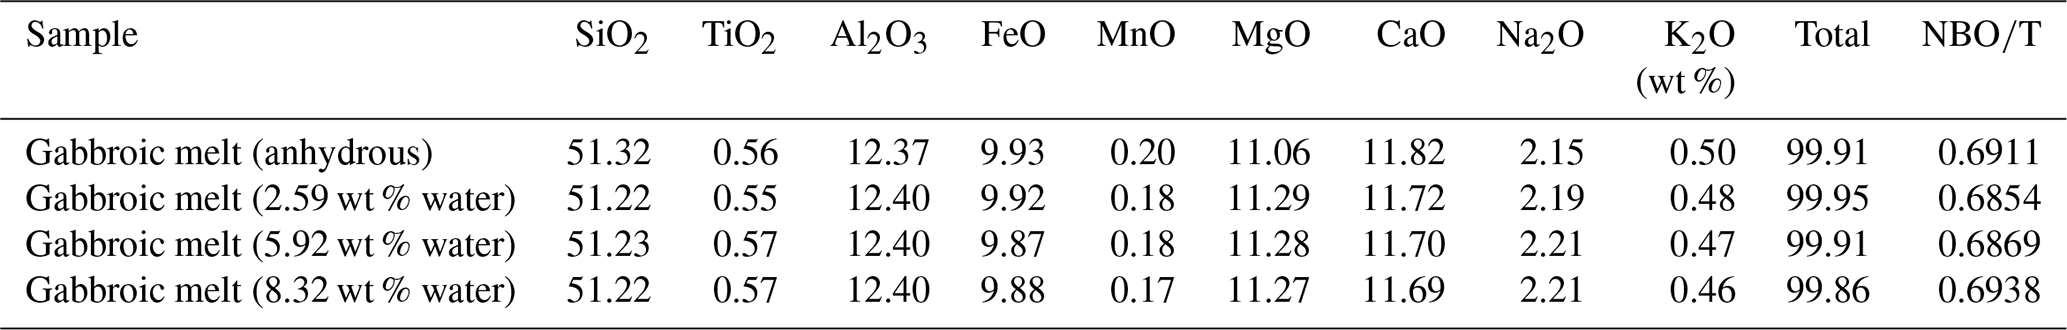
The natural gabbroic rock used in this study was collected from the ophiolite suite in the region of the Ganzi Tibetan autonomous prefecture, Sichuan province, China. Using high-temperature quenched melt for the natural rock powder, anhydrous and hydrous gabbroic melts are successfully obtained. Firstly, fresh natural gabbro was finely crushed and ground into the sample powder with a grain size of less than 50 µm in an agate mortar. Then, the sample powder was kept in the furnace at 473 K to remove the absorbed water. To obtain homogeneous initial materials for the subsequent electrical conductivity measurement, the powder of gabbroic rock was melted at a temperature of 1473 K for 1.5 h and rapidly quenched in a high-temperature muffle furnace. Further, gabbroic melt was crushed and ground again into powder with a grain size less than 50 µm and stored in a vacuum drying furnace at 373 K. To synthesize the hydrous gabbroic melt, the desired amount of deionized water was added to the powder, and subsequently, the sample was encapsulated in a gold tube using a Lampert PUK precise welding device. After that, the starting hydrous gabbroic melts with different water contents were synthesized at conditions of 1373 K and 1.0–3.0 GPa for 12 h in the YJ-3000t multi-anvil high-pressure apparatus, and all of these obtained samples are homogeneous without any available crystals or bubbles. The detailed hot-pressed sintering assemblage was similar to that previously described by Hu et al. (2022a). Lastly, all of the gabbroic melts were polished into cylinders with diameters of ∼ 4.0–5.0 mm and heights of ∼ 4.0–6.0 mm, and they were kept in a muffle furnace at 423 K for 10 h to eliminate the absorbed water for subsequent electrical conductivity measurements. The chemical compositions of anhydrous and hydrous gabbroic melts were analyzed via electronic probe microscopy analysis (EPMA) at the State Key Laboratory of Ore Deposit Geochemistry, Institute of Geochemistry, Chinese Academy of Sciences, Guiyang, China, as shown in Table 1.
Table 1The chemical composition of the gabbroic melts as measured by electronic probe microscopy analysis (EPMA).
2.2 High-pressure cell and impedance measurements
High-pressure complex impedance measurements for gabbroic melt were performed by using a Solartron-1260 impedance spectroscopy analyzer in the YJ-3000t multi-anvil high-pressure apparatus. The cross-sectional diagram of sample assembly for electrical conductivity measurements is shown in Fig. 1. Before the high-pressure cell was assembled, the cubic pressure medium of pyrophyllite with dimensions of 32.5 × 32.5 × 32.5 mm3 and insulation sleeves were baked at 1073 K in a muffle furnace for 5 h to remove the absorbed water. The sample was placed at the middle of the aluminum and magnesium insulation sleeves and sandwiched with two symmetric nickel electrodes. The electrode was connected with a Ni97Al3 wire to a Solartron-1260 impedance spectroscopy analyzer. To shield against external electromagnetism and spurious signal interference, the nickel foil with a thickness of 0.025 mm was installed between the aluminum and magnesium sleeves and linked to the Earth line. Three-layer stainless-steel sheets with a total thickness of 0.5 mm were adopted as the heater, which was installed between the cubic pressure medium of pyrophyllite and the aluminum sleeve. After that, the sample assembly was stored in the vacuum drying furnace at 423 K for at least 12 h before the electrical conductivity measurements.
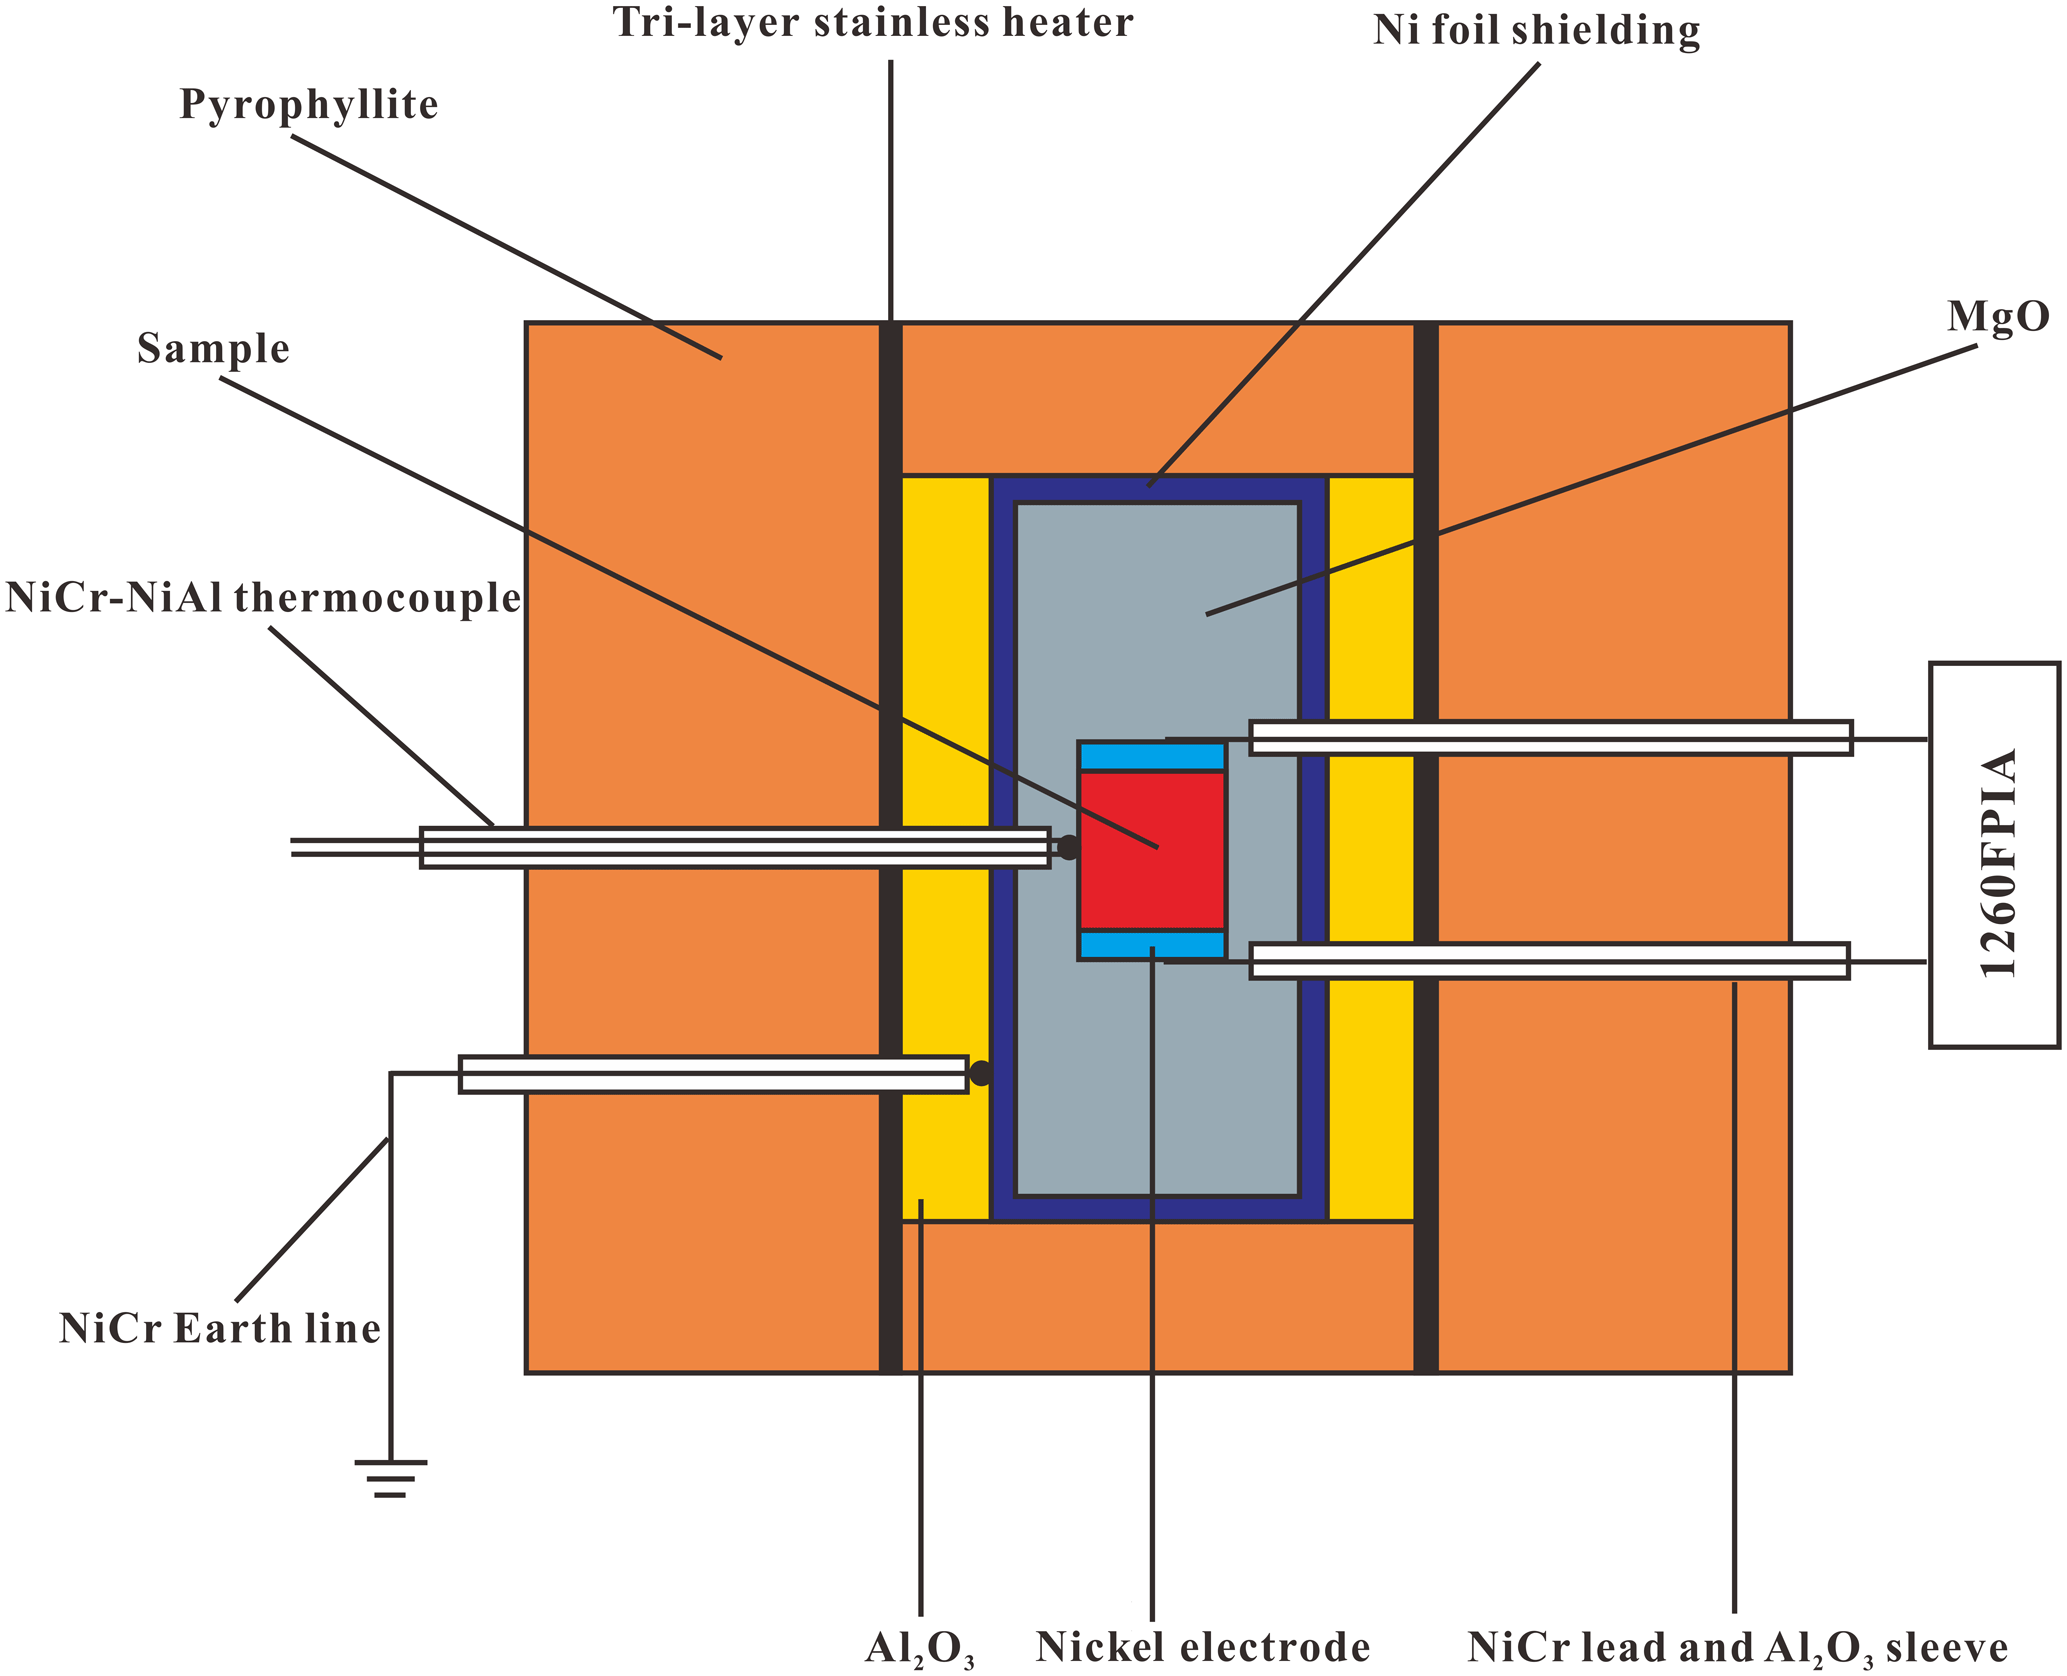
Figure 1The experimental setup for the electrical conductivity measurements of gabbroic melt at high temperature and high pressure.
During the experiment, the pressure was slowly raised at a rate of 1.0 GPa h−1 until it reached the desired value, and then the temperature was gradually increased at a speed of 5.0 K min−1. Under predesignated high-temperature and high-pressure conditions, impedance spectra of samples were collected in the frequency range of 100–106 Hz and the applied signal voltage of 1.0 V. To obtain reproducible data, impedance spectra of samples were measured during at least two continuous heating–cooling cycles under conditions of 873–1373 K and 1.0–3.0 GPa. The uncertainties of temperature and pressure were less than 5.0 K and 0.1 GPa, respectively. The detailed experimental principles and measurement procedures are described by Dai et al. (2008) and Hu et al. (2022b).
2.3 Determination of the water content
The water content of gabbroic melt before and after the electrical conductivity measurements was obtained by using the Vertex-70V and Hyperion-1000 vacuum Fourier transform infrared (FT-IR) spectroscopy analyzer. The samples were double-polished up to a thickness of ∼ 50 µm. At least five spectra were conducted on the different regions of transparent sample surfaces, and an average value was made in order to avoid the heterogeneity effect of water distribution. The detailed experimental method and procedure for the FT-IR measurement are presented in detail by Hong et al. (2022) and Hu et al. (2022b). For the hydrous gabbroic melts, the signal of the fundamental stretching H2O vibrational spectroscopy at the peak position of ∼ 3530 cm−1 of the hydroxyl band was revealed to be oversaturated, which was similar to the previously obtained results for hydrous dacitic melts reported by Laumonier et al. (2015). The absorbance of gabbroic melt according to water-bearing FT-IR spectroscopy at the wavenumber of the ∼ 3530 cm−1 band is possibly related to the charge carrier species of hydrogen-related defects, such as hydroxyl (OH) and free protons, which is similar to previously reported hydrous electrical conductivity results for many nominally anhydrous minerals (Huang et al., 2005; Dai and Karato, 2009a, 2014a, 2020). For water-rich samples, two clearly characteristic peaks appeared at the corresponding wavenumbers of ∼ 4500 and ∼ 5200 cm−1, which represent the hydroxyl band and molecular water band with an available oversaturated state for gabbroic melts (Stolper, 1982; Dixon et al., 1995; Guo et al., 2017). Thus, we make the integration at the wavenumber ranges of 3000–4000 and 4000–5800 cm−1 for the anhydrous and hydrous samples to precisely determine the water content of gabbroic melts, respectively. The typical FT-IR spectra of gabbroic melt within the wavenumber range of 2500–5800 cm−1 are shown in Fig. 2. The water content of gabbroic melt (Cmelt) can be worked out by the Beer–Lambert law:
Here, the signal of ω stands for the molar mass of H2O (18.02 g molec.−1), A stands for the integrated area of absorption spectra (cm−2), ρ stands for the density (g cm−3), d stands for the thickness of a thin section (cm), and ε stands for the integral molar absorption coefficient (L molec.−1 cm−2). As presented in the calculated melt density method by Luhr (2001), our density of gabbroic melt is determined as 2.764 × 10³ g L−1. Molar absorption coefficients of εOH and were adopted from Dixon et al. (1995). According to Eqs. (1) and (2), the water contents for three obtained hydrous gabbroic melts were calculated as 2.59 wt %, 5.92 wt %, and 8.32 wt % at the wavenumber range from 4000 to 5800 cm−1. From Fig. 2, it is clear that the absorptions of gabbroic melts according to water-rich FT-IR spectroscopy at the wavenumber of the ∼ 3530 cm−1 band spanning a wide range of water contents looks identical. Clearly, the intensity of FT-IR spectra will decrease from water-rich (i.e., its corresponding water content is higher than 2.59 wt %) to water-poor (i.e., anhydrous) gabbroic melts. As displayed in Table 2, there is no significant loss of water for hydrous gabbroic melt during the electrical conductivity experiment. At the same time, the corresponding error bars for each water content for the initial and recovered gabbroic melts are included in Table 2 in detail.
Table 2Fitted parameters of the Arrhenius relation for the electrical conductivity of hydrous and anhydrous gabbroic melts under conditions of 873–1373 K and 1.0–3.0 GPa.
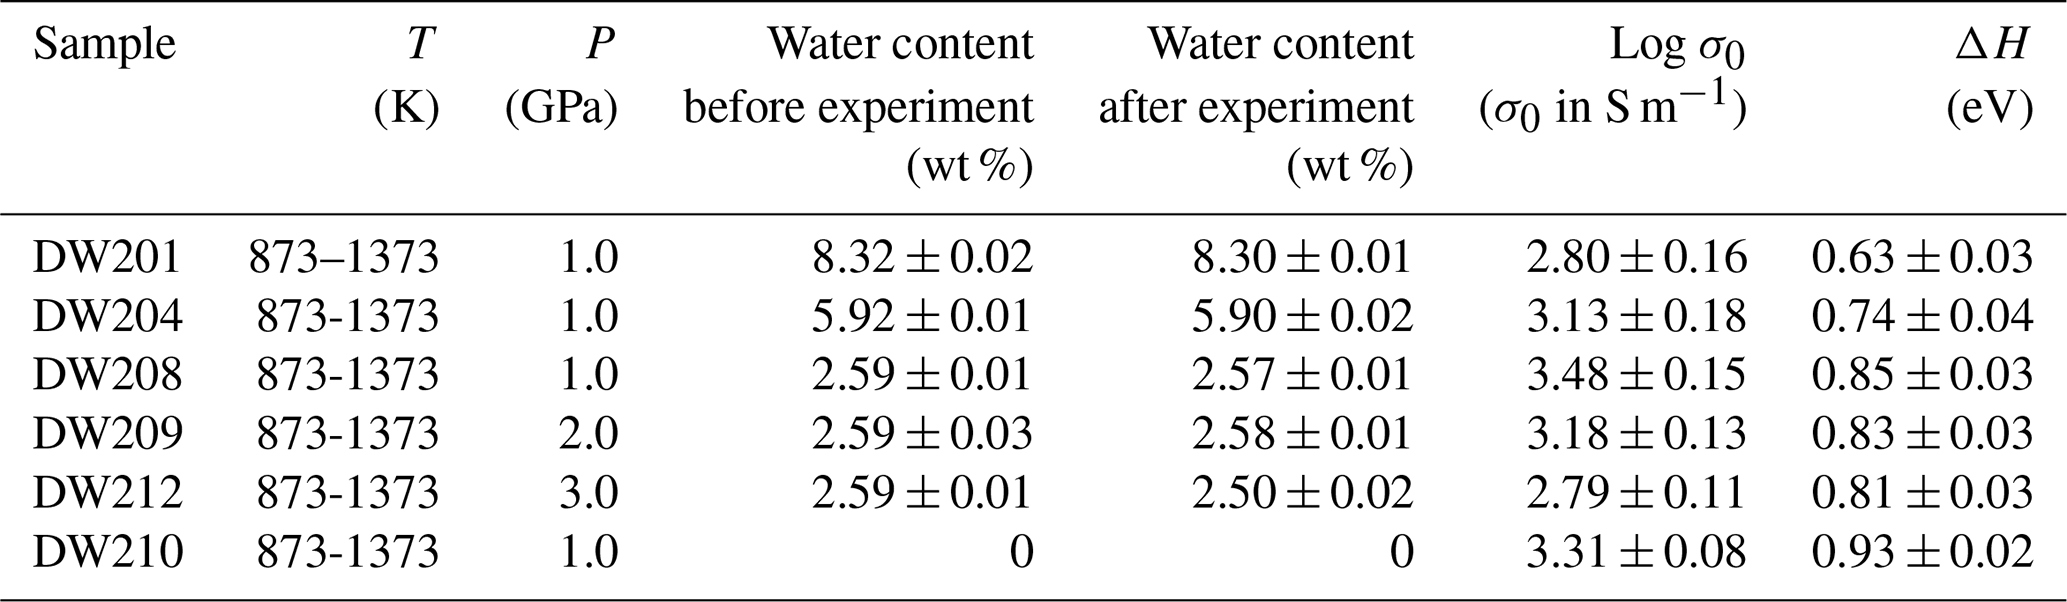
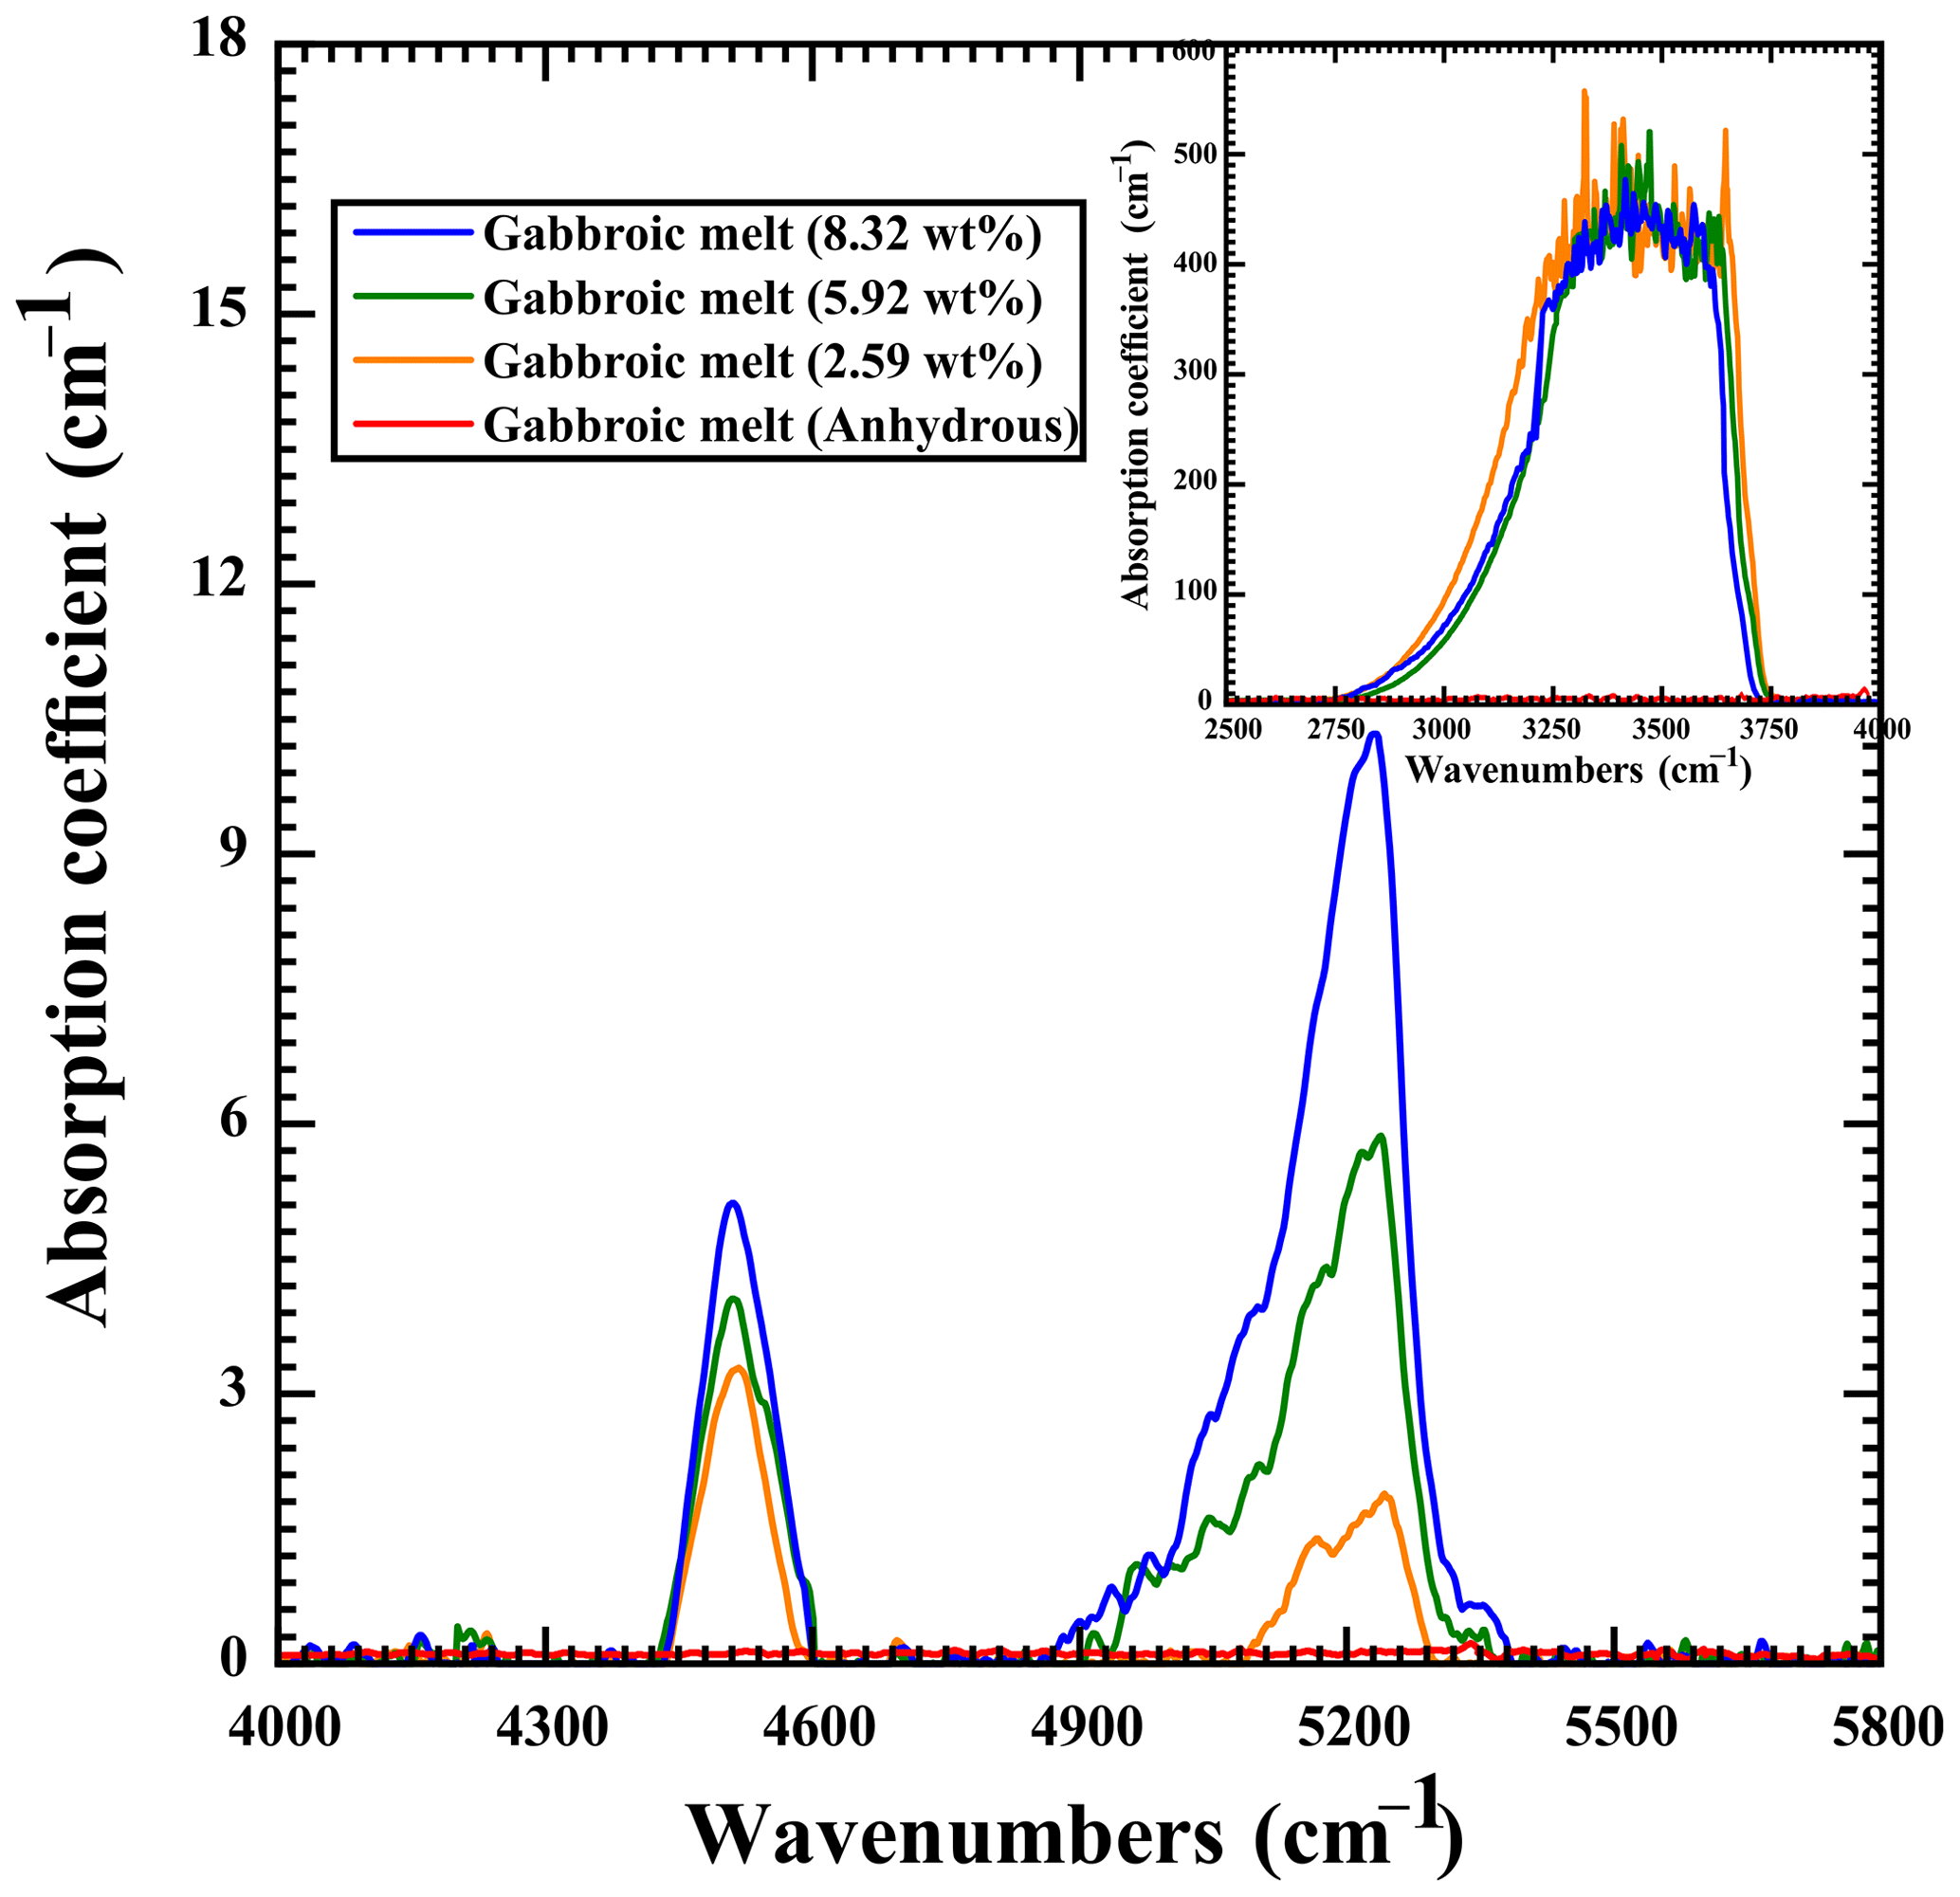
Figure 2The representative FT-IR spectra of the gabbroic melt with various water contents in the wavenumber ranges of 4000–5800 cm−1 and 2500–4000 cm−1.
In the present experiments, the electrical conductivity of gabbroic melt with four different water contents (i.e., 0 %, 2.59 wt %, 5.92 wt %, and 8.32 wt %) was measured at a temperature range of 873–1373 K and pressure of 1.0–3.0 GPa. The representative complex impedance spectra of gabbroic melt with 2.59 wt % water at conditions of 873–1373 K and 2.0 GPa are shown in Fig. 3. According to the theory of alternating current (AC) complex impedance spectra, the impedance spectra of gabbroic melts within the high-frequency range from ∼ 102–103 to 106 Hz can be interpreted as the bulk conduction mechanism (i.e., grain interior), whereas the impedance spectra of a sample within the low-frequency range from 100 to ∼ 102–103 Hz represent the grain boundary conduction mechanism or the polarization process at the sample–electrode interface (Tyburczy and Roberts, 1990; Dai et al., 2008, 2012, 2013, 2014, 2016; Dai and Karato, 2009a, b, c, 2020). Thus, a series connection of RS–CPES (RS and CPES represent the resistance and constant-phase element of the gabbroic melt, respectively) and RE–CPEE (RE and CPEE represent the interface resistance and constant-phase element for electrode effect, respectively) was employed as the equivalent circuit within a relatively lower temperature range of 873–1123 K. For the higher temperature ranges of 1173–1373 K, the equivalent circuit consisted of the series connection of one resistance and one parallel resistance with the constant-phase element (CPE). The electrical conductivity of sample can be calculated as
Here, L, S, and R stand for the length of the sample (m), the cross-sectional area of the electrode (m2), and the electrical resistance of the sample (Ω), respectively. The electrical conductivity of gabbroic melt and temperatures conformed to the Arrhenius relation:
Here, σ0 stands for the pre-exponential factor (S m−1), k stands for the Boltzmann constant (eV K−1), and T stands for the absolute temperature (K). All of these fitted parameters for the electrical conductivity of anhydrous and hydrous gabbroic melt under conditions of 873–1373 K and 1.0–3.0 GPa are listed in Table 2.
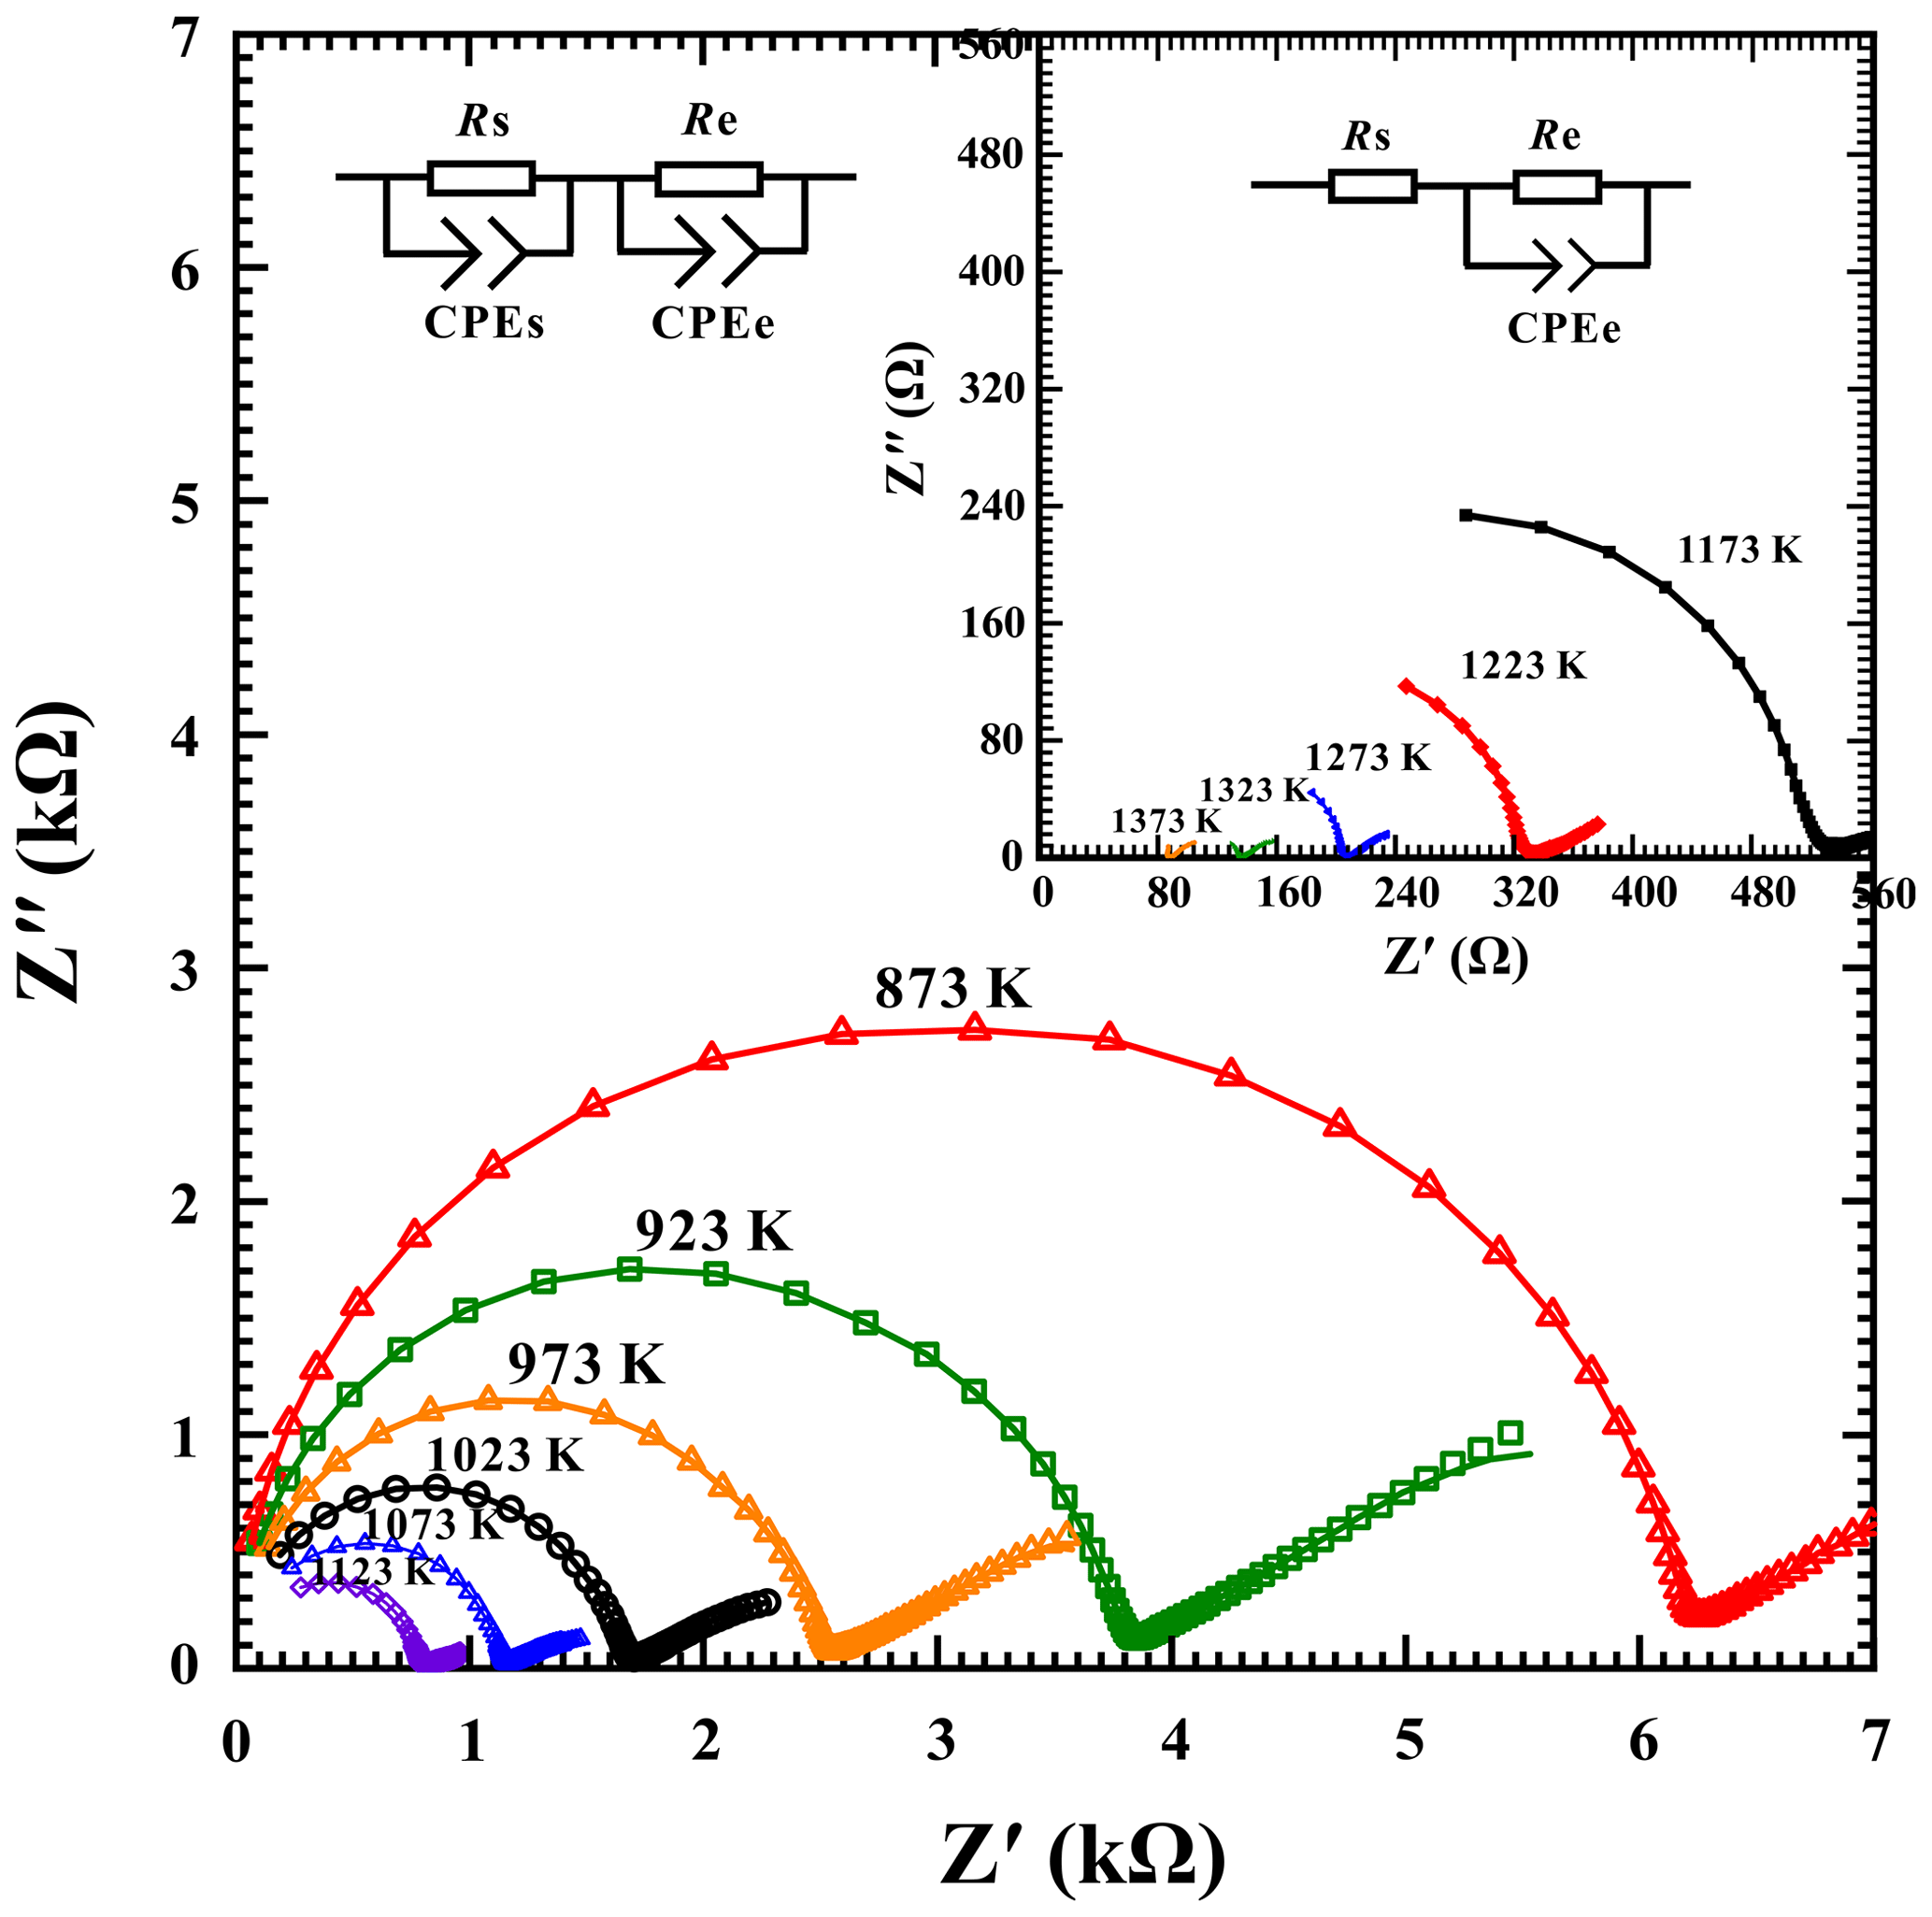
Figure 3Typical complex impedance spectra for gabbroic melt (DW209) with a fixed water content of 2.59 wt % at temperatures of 873–1373 K and pressure of 2.0 GPa in the frequency range from 100 to 106 Hz. The fitting results for the experimental data are displayed by the solid line.
For the gabbroic melt with a fixed water content of 2.59 wt %, the electrical conductivity results for two continuous heating–cooling cycles at 873–1373 K and 3.0 GPa are shown in Fig. 4. In the first heating cycle within the temperature range of 923–1073 K, the electrical conductivity of the sample slightly deviated from those of subsequent results in the first cooling and second heating–cooling cycles. However, the deviation degree became smaller and finally overlapped at a much higher temperature range of 1123–1373 K. As a whole, the electrical conductivity of the sample was almost reproducible in the first cooling and second heating–cooling cycles. Therefore, the electrical conductivity results were acquired by using fitting experimental data during the process of the first cooling and second heating–cooling cycles.
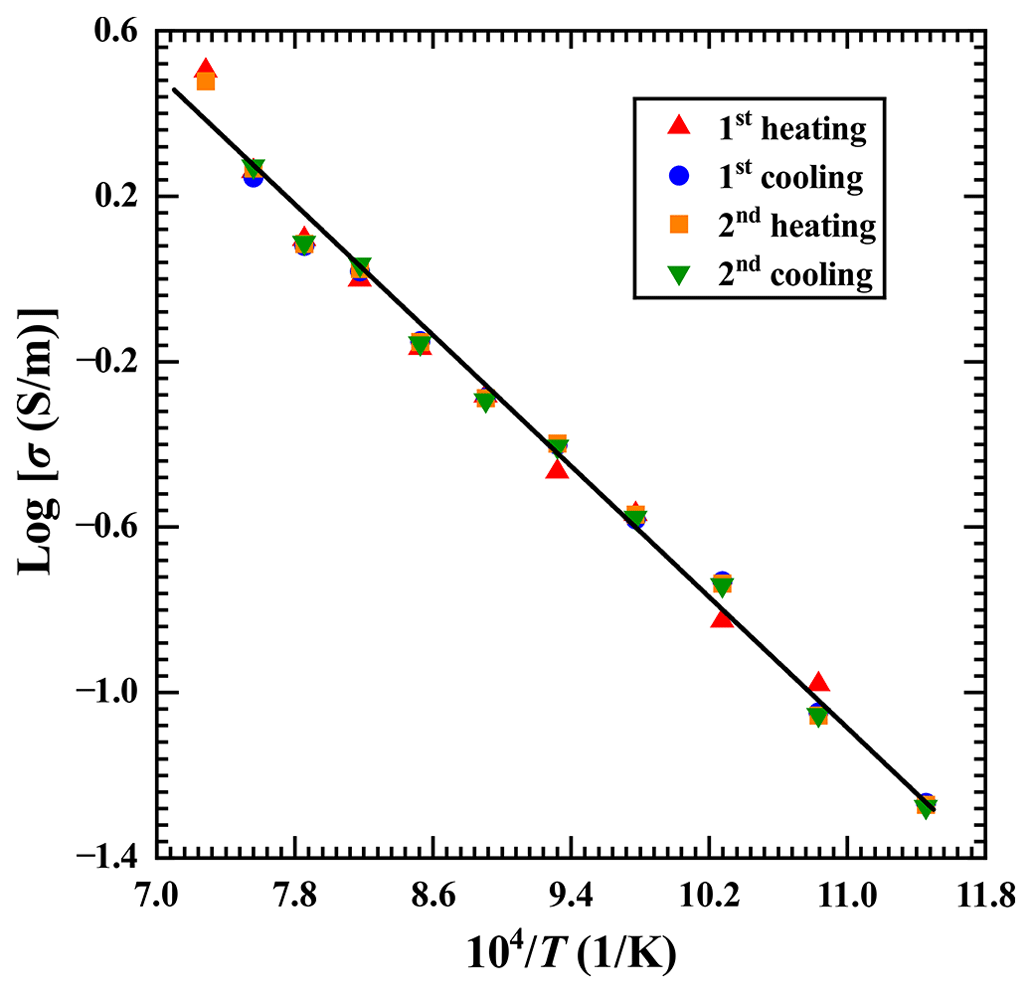
Figure 4The electrical conductivity of gabbroic melt (DW212) with a fixed water content of 2.59 wt % among two heating–cooling cycles at a pressure of 3.0 GPa.
4.1 Influence of pressure on electrical conductivity
To identify the effect of pressure on the electrical conductivity of a sample, the electrical conductivity of hydrous gabbroic melt was acquired under conditions of 873–1373 K, 1.0–3.0 GPa, and a fixed water content of 2.59 wt %. As illustrated in Fig. 5, the electrical conductivity of the sample and temperature conformed to the Arrhenius relation at a certain water content and pressure condition. In the present study, a slightly negative dependence for the electrical conductivity of hydrous gabbroic melt with a fixed water content of 2.59 wt % on the pressure was observed. The electrical conductivity of the sample slightly decreases by around 1.6 times as pressure is increased from 1.0 to 3.0 GPa in a temperature range of 873–1373 K. Accordingly, the pre-exponential factor is reduced from 3.02 × 10³ to 6.17 × 10² S m−1, and the activation enthalpy value decreases from 0.85 to 0.81 eV, respectively.
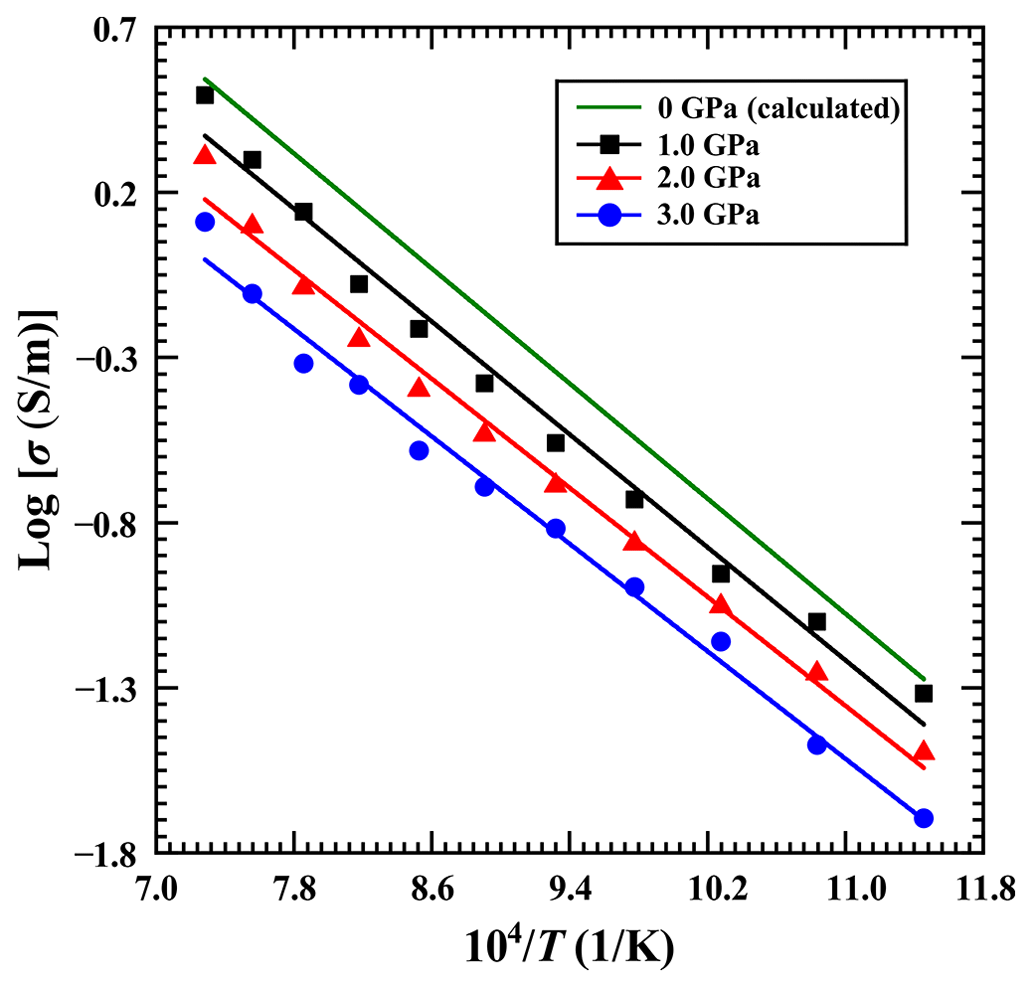
Figure 5Influence of pressure on the electrical conductivity of gabbroic melt with a fixed water content of 2.59 wt % in the temperature range of 873–1373 K.
Furthermore, the influence of pressure on the electrical conductivity of gabbroic melt can be depicted as
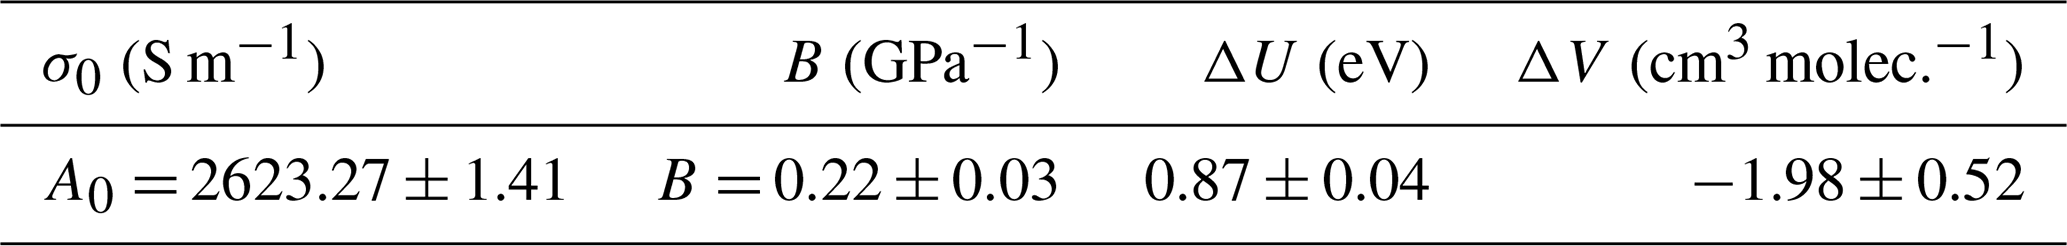
Here, the pre-exponential factor (σ0) and activation enthalpy (ΔH) of pressure dependence can be illustrated as the relations of ) and . The listed parameters including ΔU, ΔV, and P stand for the activation energy (eV), the activation volume (cm3 molec.−1), and pressure (GPa), and B represents a constant. Furthermore, the electrical conductivity of gabbroic melt, along with the variations of temperature, pressure, and water content, is fitted accordingly and the detailed fitting results are displayed in Table 3. The logarithmic electrical conductivity of gabbroic melt with a fixed water content of 2.59 wt % and the inverse temperature follows a good linear relation, which reveals only one main conduction mechanism operating the electrical transport within our experimental temperature and pressure ranges. With available pressure-dependent electrical conductivity, we can also extrapolate the relationship between the electrical conductivity of gabbroic melt with a fixed water content of 2.59 wt % and temperature at atmospheric pressure. Then the pre-exponential factor and activation enthalpy at room pressure are calculated as 5177 S m−1 and 0.87 eV, respectively. According to Eq. (5) and Table 3, the activation energy and activation volume of gabbroic melt with a fixed water content of 2.59 wt % can be determined as 0.87 ± 0.04 eV and −1.98 ± 0.52 cm3 molec.−1.
Table 3Parameter values for the electrical conductivity of gabbroic melt with water content of 2.59 wt % at pressures of 1.0–3.0 GPa. The equation is adopted for the global fitting of electrical conductivity data. In consideration of a strong dependence of the pre-exponential factor (σ0) on the pressure, we used the relation ).
4.2 Influence of water content on electrical conductivity
For a fixed pressure of 1.0 GPa, the influence of water content on the electrical conductivity of gabbroic melt in a temperature range of 873–1373 K is shown in Fig. 6 in detail. The electrical conductivity of gabbroic melt with four different water contents gradually increases with the rise of temperature. For each corresponding water content (i.e., 0 wt %, 2.59 wt %, 5.92 wt %, and 8.32 wt %), the logarithm of the electrical conductivity of the sample and reciprocal temperature follows a good linear relation. On the other hand, when the water content of gabbroic melt is increased from 0 wt % to 8.32 wt %, the electrical conductivity of gabbroic melts tends to visibly increase, whereas the activation enthalpy is gradually reduced from 0.93 to 0.63 eV accordingly. In short, our presently acquired electrical conductivity results show a substantial increase in the water effect on the electrical conductivity of gabbroic melt, which has also been observed for the electrical conductivity of other representative calc-alkaline igneous rock melts in recent years (Ni et al., 2011; Laumonier et al., 2015; Guo et al., 2017; Chen et al., 2018).
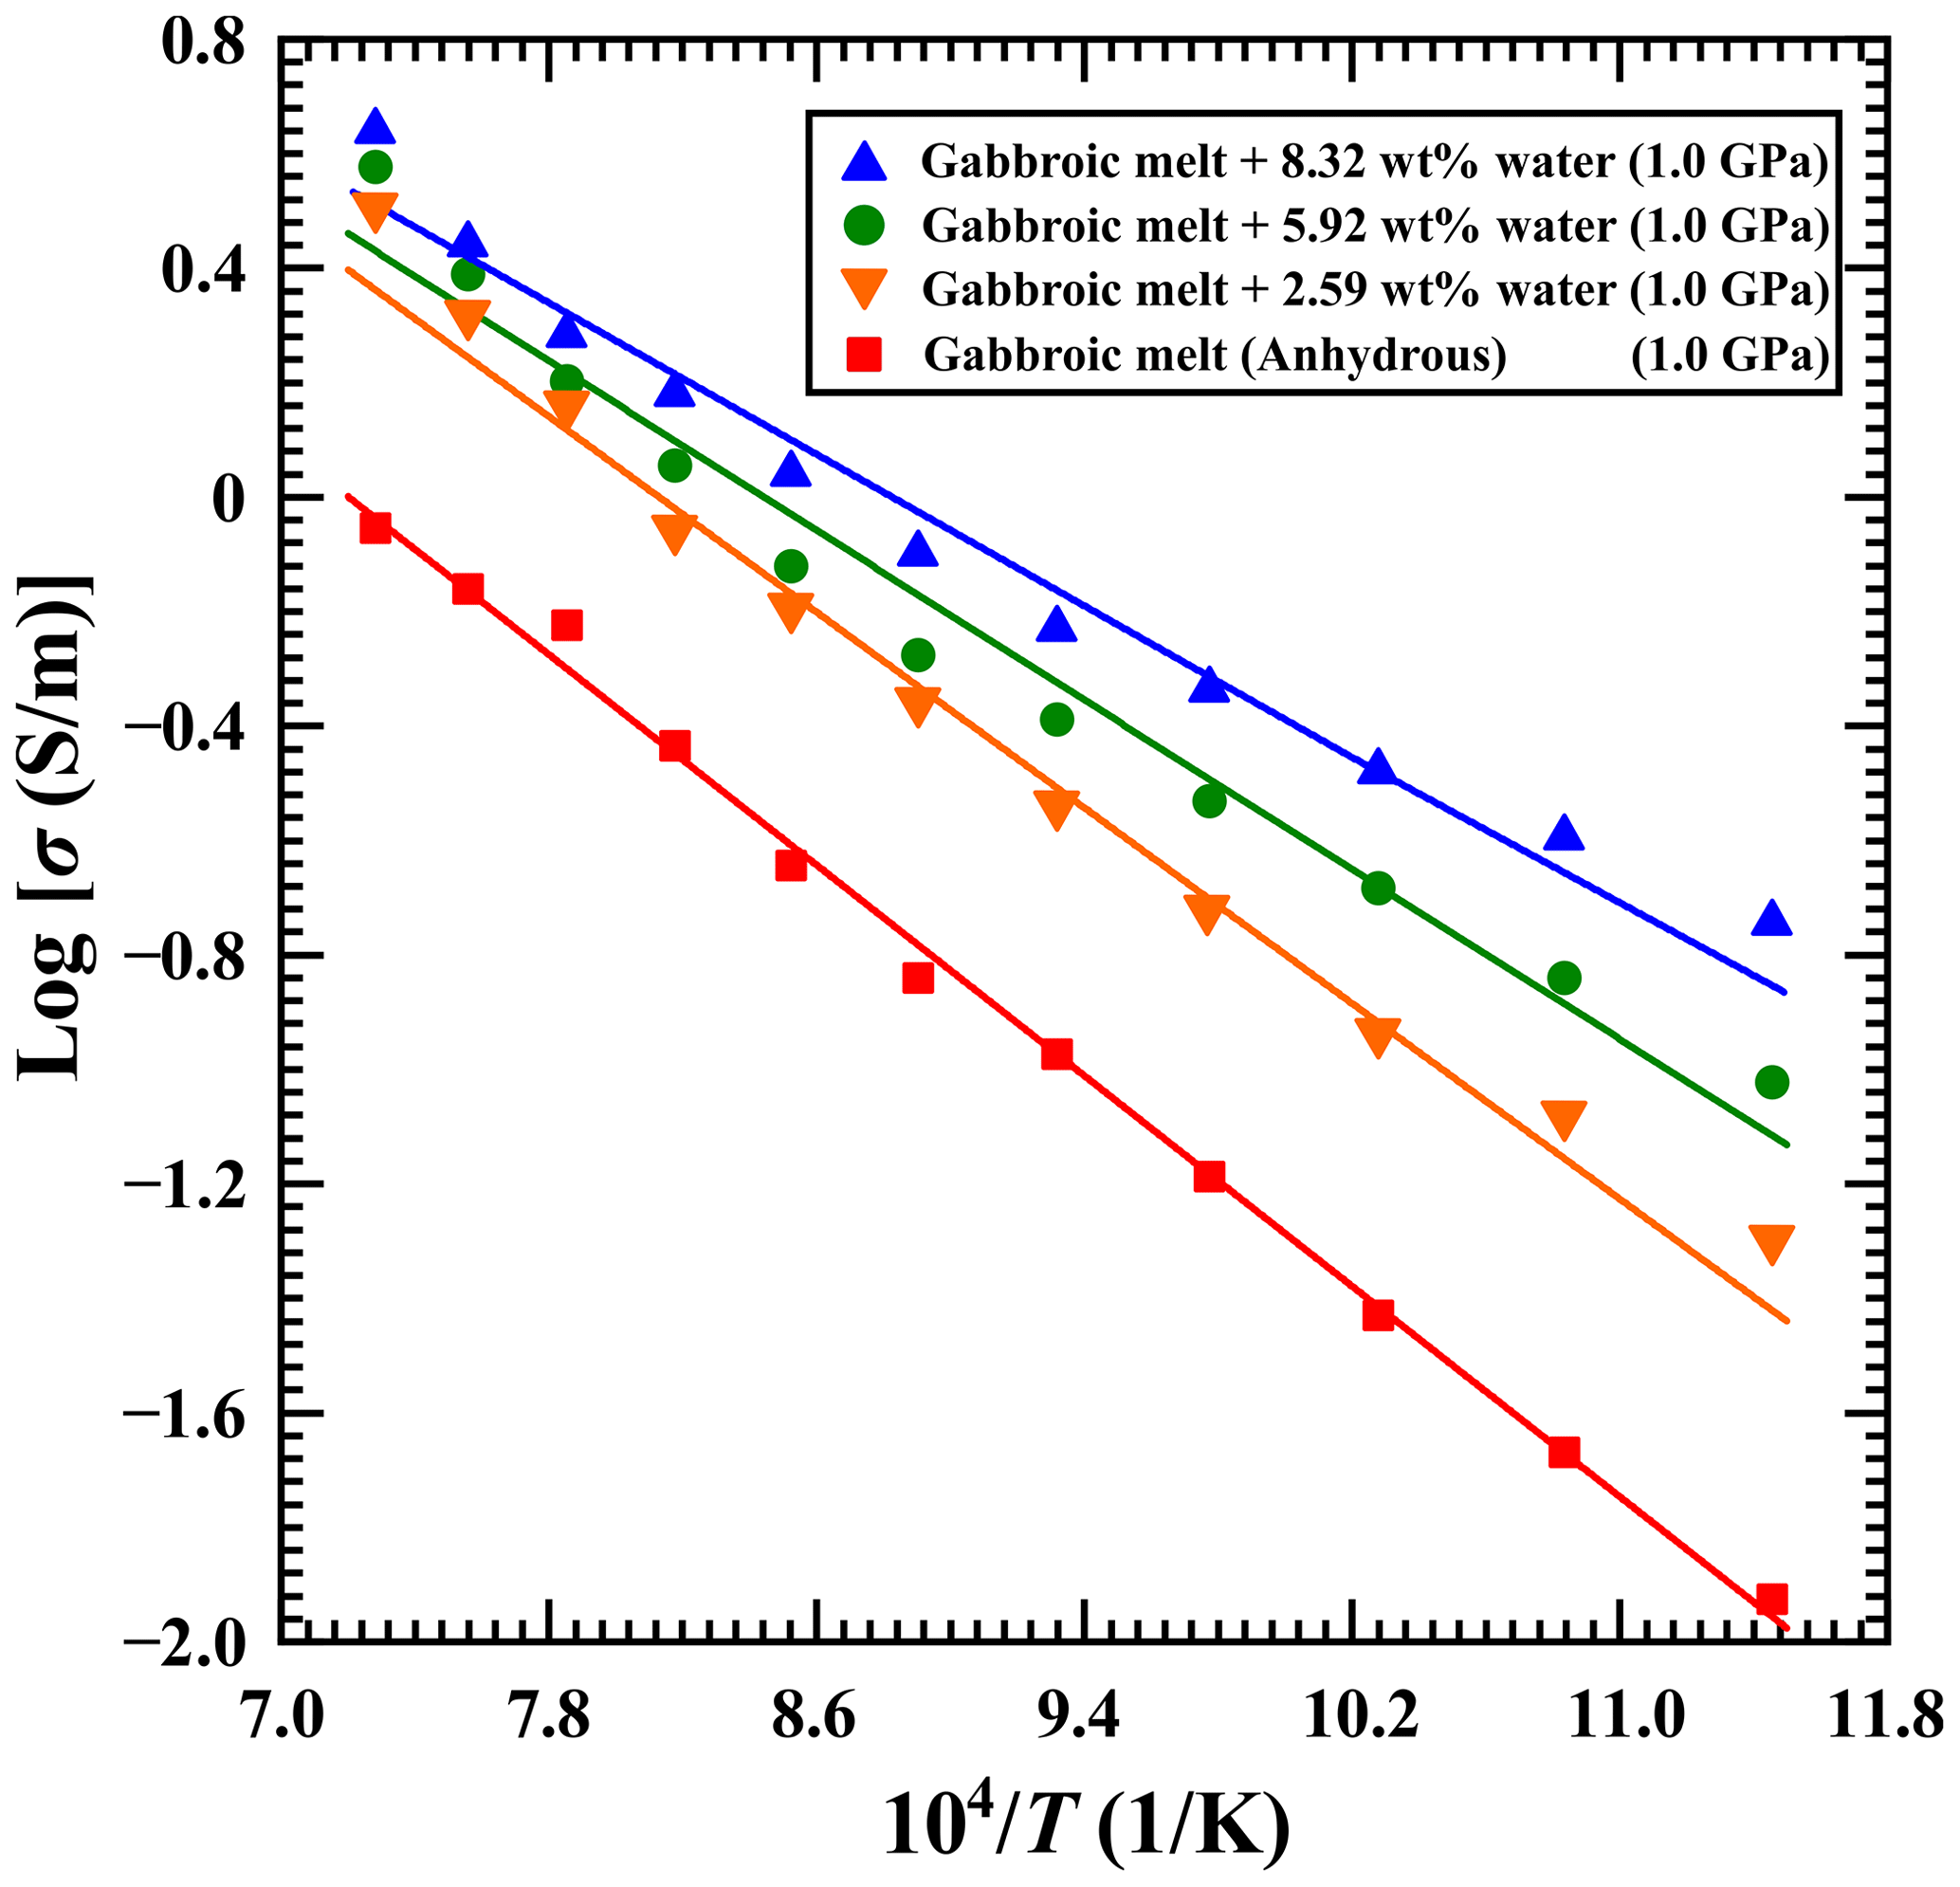
Figure 6Logarithmic electrical conductivity of gabbroic melts with four different water contents as a function of reciprocal temperature under conditions of 873–1373 K and 1.0 GPa.
The electrical conductivity of hydrous gabbroic melt can be expressed in terms of the charge species concentration dependence of the pre-exponential factor (A), which behaves in an Arrhenius relation:
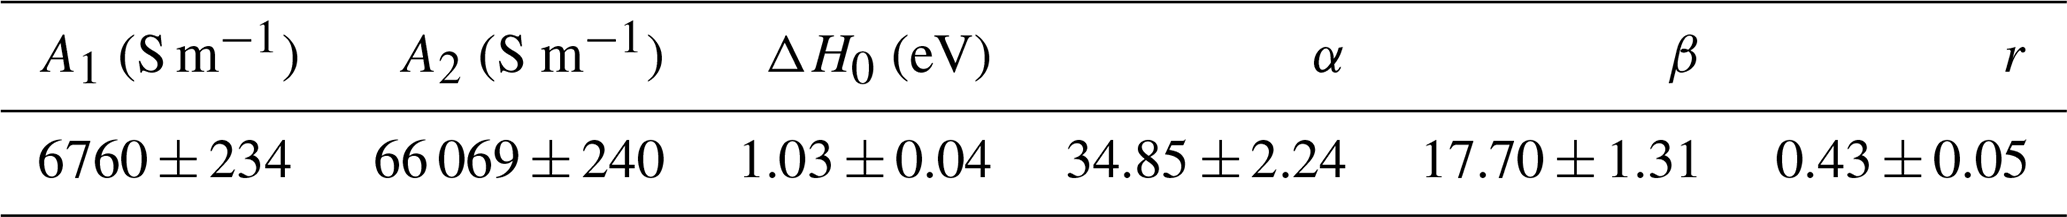
Here, Cw is the water content of the sample (wt %), ΔH0 stands for the activation enthalpy, and α, β, and r stand for empirical power-law constants. With a nonlinear global least-squares method, the electrical conductivity of gabbroic melt with different water contents was fitted, and the fitted parameter results are listed in Table 4. For the magnitude of the water-dependent relation of r (0.43 ± 0.05), it is clear that water can dramatically enhance the electrical conductivity of gabbroic melt under conditions of 873–1373 K and 1.0 GPa.
Table 4Parameter values for the electrical conductivity of gabbroic melts with different water contents under conditions of 873–1373 K and 1.0 GPa. The equation is adopted for the global fitting of electrical conductivity data.
4.3 Comparisons with previous studies
As displayed in Fig. 7, five previously reported results on the electrical conductivity of natural gabbro samples were employed to compare with our new results for the electrical conductivity of gabbroic melt (Sato and Ida, 1984; Schilling et al., 1997; Maumus et al., 2005; Dai et al., 2015; Saito and Bagdassarov, 2018). As a whole, our acquired electrical conductivity results for gabbroic melts are obviously higher than those of natural gabbro in a temperature range of 873–1373 K and at a pressure of 1.0 GPa. Both Sato and Ida (1984) and Schilling et al. (1997) have already performed electrical conductivity measurements on natural gabbro at high temperature and atmospheric pressure. In the case of the occurrence of temperature-induced partial melting, the electrical conductivity of a sample will be rapidly increased by several orders of magnitude. However, we find that there is no relevant information on the water content for previously reported electrical conductivity results with the listed melt-bearing natural gabbro samples. The electrical conductivity results of natural gabbro containing 34 vol % melt from Maumus et al. (2005) are much lower than those of our present gabbroic melt, and the obvious discrepancy is possibly caused by the differentiation of the chemical composition and water content of gabbroic melt. In comparison with Saito and Bagdassarov (2018), there is a jump of 3 orders of magnitude in the electrical conductivity of the sample, which possibly originates from a relatively larger influence of melt volume percentage. Regarding the previously reported electrical conductivity of natural gabbro with a relatively lower water content of ∼ 610 ppm and free of any melt by Dai et al. (2015) at pressures of 0.5–2.0 GPa, there is an approximate electrical conductivity result for the anhydrous gabbroic melt to be observed in the present study. However, studies on the dependence of the electrical conductivity of anhydrous and hydrous gabbroic melts on the temperature, pressure, and water content have still been scarce under high-temperature and high-pressure conditions until now.
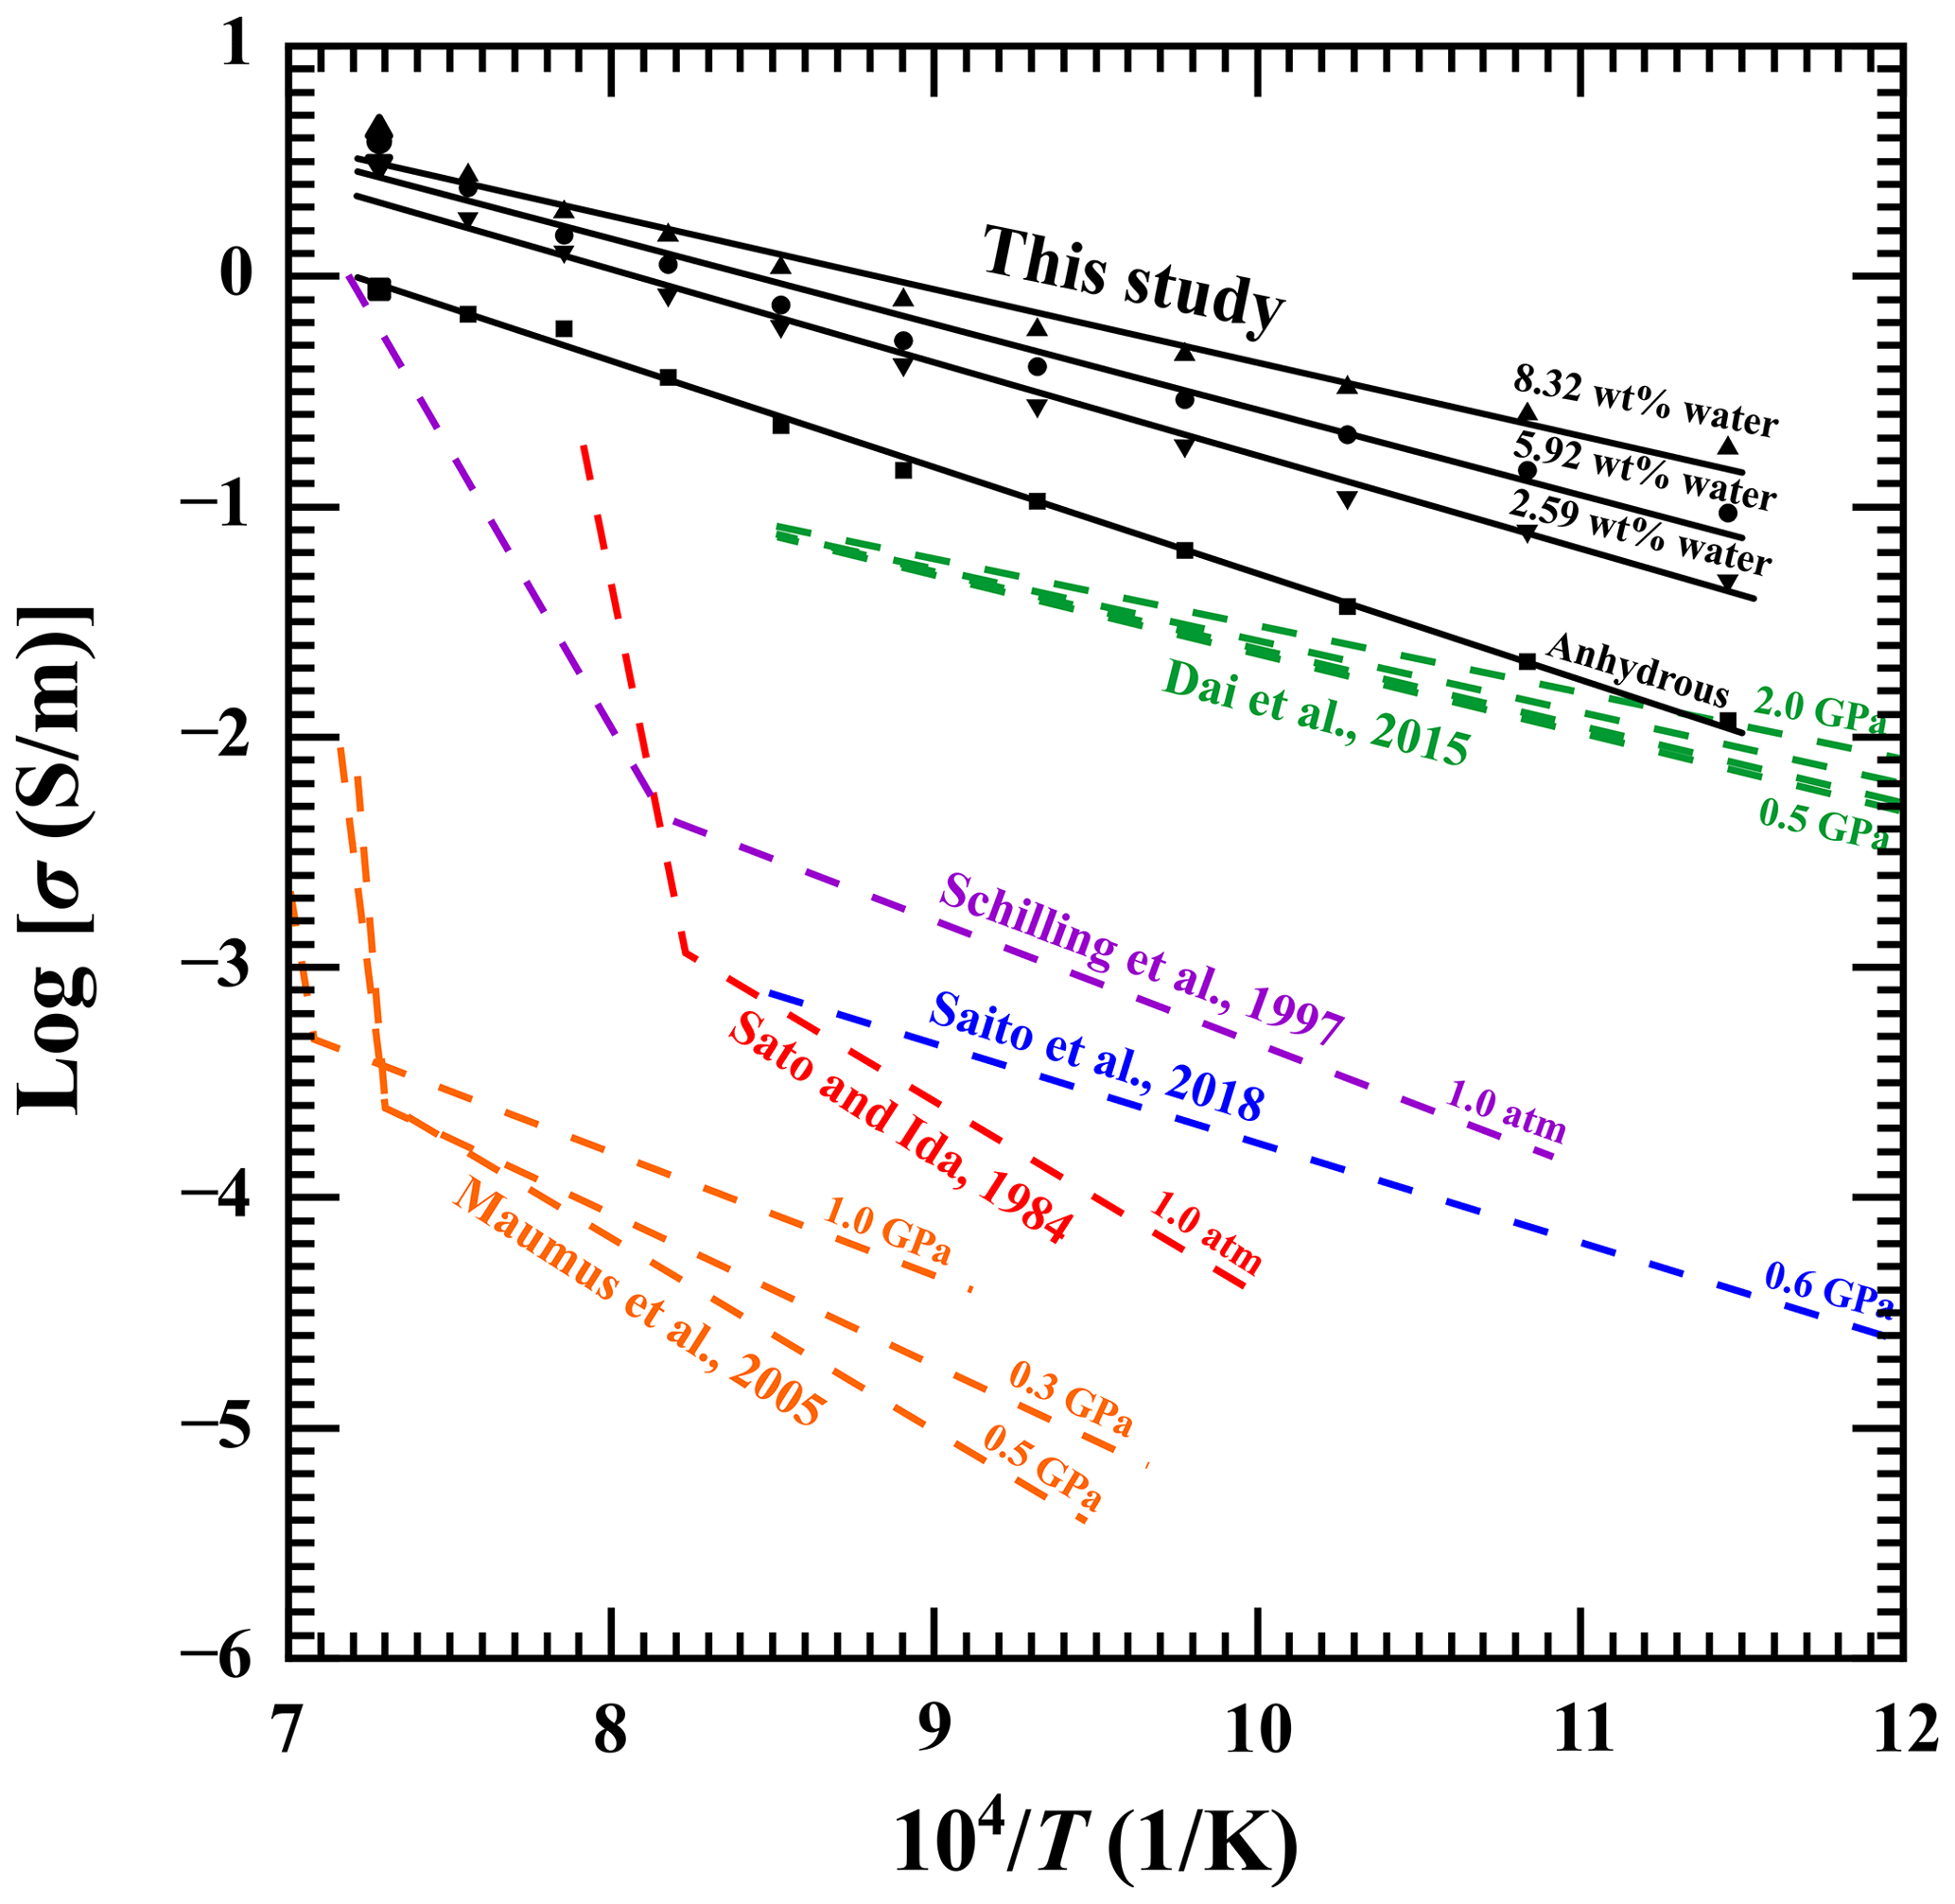
Figure 7Comparison of the electrical conductivity of gabbroic melts with the previously reported results from five natural gabbro samples under high-temperature and high-pressure conditions.
It is well known that a gabbroic melt represents one type of calc-alkaline igneous rock. Previously reported conductivity results have confirmed that the electrical conductivity of calc-alkaline igneous rock melts (i.e., dacitic melt, andesitic melt, and basaltic melt) is also highly sensitive to the influential factor of the degree of depolymerization at high temperature and high pressure (Ni et al., 2011; Laumonier et al., 2015; Guo et al., 2017). The degree of depolymerization can be characterized by the ratio of non-bridging oxygen ions per tetrahedrally coordinated cation (). As pointed out by Mysen et al. (1982), the magnitude of the degree of depolymerization in gabbroic melt can be worked out by our abovementioned EPMA results in Table 1. The dependence relation of the electrical conductivity of gabbroic melts and the degree of depolymerization is clearly displayed in Fig. 8 under conditions of four different water contents (i.e., 0 wt %, 2.59 wt %, 5.92 wt %, and 8.32 wt %) at 1373 K and 1.0 GPa. Under a constant degree of depolymerization, it is clear that a relatively lower electrical conductivity is observed in the anhydrous gabbroic melt under conditions of 1373 K and 1.0 GPa. With the rise of water content, the electrical conductivity of gabbroic melts dramatically increases, whereas the variation degree for the electrical conductivity is gradually reduced. At the same time, we also compared the presently obtained electrical conductivity results for anhydrous and hydrous gabbroic melts with three other representative calc-alkaline igneous melts reported by Ni et al. (2011), Laumonier et al. (2015), and Guo et al. (2017), as illustrated in Fig. 8 in detail. On the basis of the previous calculation method for the degree of depolymerization () of melt in transforming detailed EPMA data, the magnitudes of the degree of depolymerization for our present gabbroic melt and three other representative calc-alkaline igneous rock melts (i.e., dacitic melt, andesitic melt, and basaltic melt) are 0.65, 0.07, 0.35, and 0.81, respectively. As a whole, the electrical conductivity of four typical calc-alkaline igneous rock melts will increase with a rise in the degree of depolymerization at a fixed water content. As the water content is increased from 0 wt % to 8.32 wt %, the electrical conductivity of each calc-alkaline igneous rock melt will dramatically increase. It is observed that the corresponding variations in the electrical conductivity of calc-alkaline igneous rock melts in the order of dacitic melt to andesitic melt to gabbroic melt to basaltic melt tend to be gradually reduced and become more and more convergent accordingly. To our best knowledge, the magnitude of the degree of depolymerization () for the melt sample represents a highly positive relation with content variations of alkali-bearing and alkaline-earth-bearing cations (i.e., Na+, K+, Ca2+, Mg2+) (Mysen et al., 1982; Lee et al., 2003; Di Genova et al., 2015). Like the EPMA results, the total contents of alkali cations and alkaline earth cations are determined as 11.54 wt % of dacitic melt reported by Laumonier et al. (2015), 20.41 wt % of andesitic melt reported by Guo et al. (2017), 30.23 wt % of basaltic melt reported by Ni et al. (2011), and 25.53 wt % of gabbroic melt reported in this study. Thus, the degree of depolymerization for the calc-alkaline igneous rock melts in the order of dacitic melt to andesitic melt to gabbroic melt to basaltic melt will gradually increases accordingly. On the other hand, previous electrical conductivity results have confirmed that the main charge carriers of the calc-alkaline igneous melts are alkali cations and alkaline earth cations at high temperature and high pressure (Ni et al., 2011; Laumonier et al., 2015; Guo et al., 2017; Chen et al., 2018). Thus, the influence of the degree of depolymerization on the electrical conductivity of melt is possibly caused by the concentration of the alkali cations and alkaline earth cations. Accordingly, the electrical conductivity of calc-alkaline igneous melts will gradually increase with a rise in alkali cations and alkaline earth cations in the order of dacitic melt to andesitic melt to gabbroic melt to basaltic melt. In summary, following the order of dacitic melt to andesitic melt to gabbroic melt to basaltic melt, it is very reasonable that the electrical conductivity of calc-alkaline igneous melts will be gradually enhanced with a rise in degree of depolymerization () under conditions of 1373 K and 1.0 GPa.
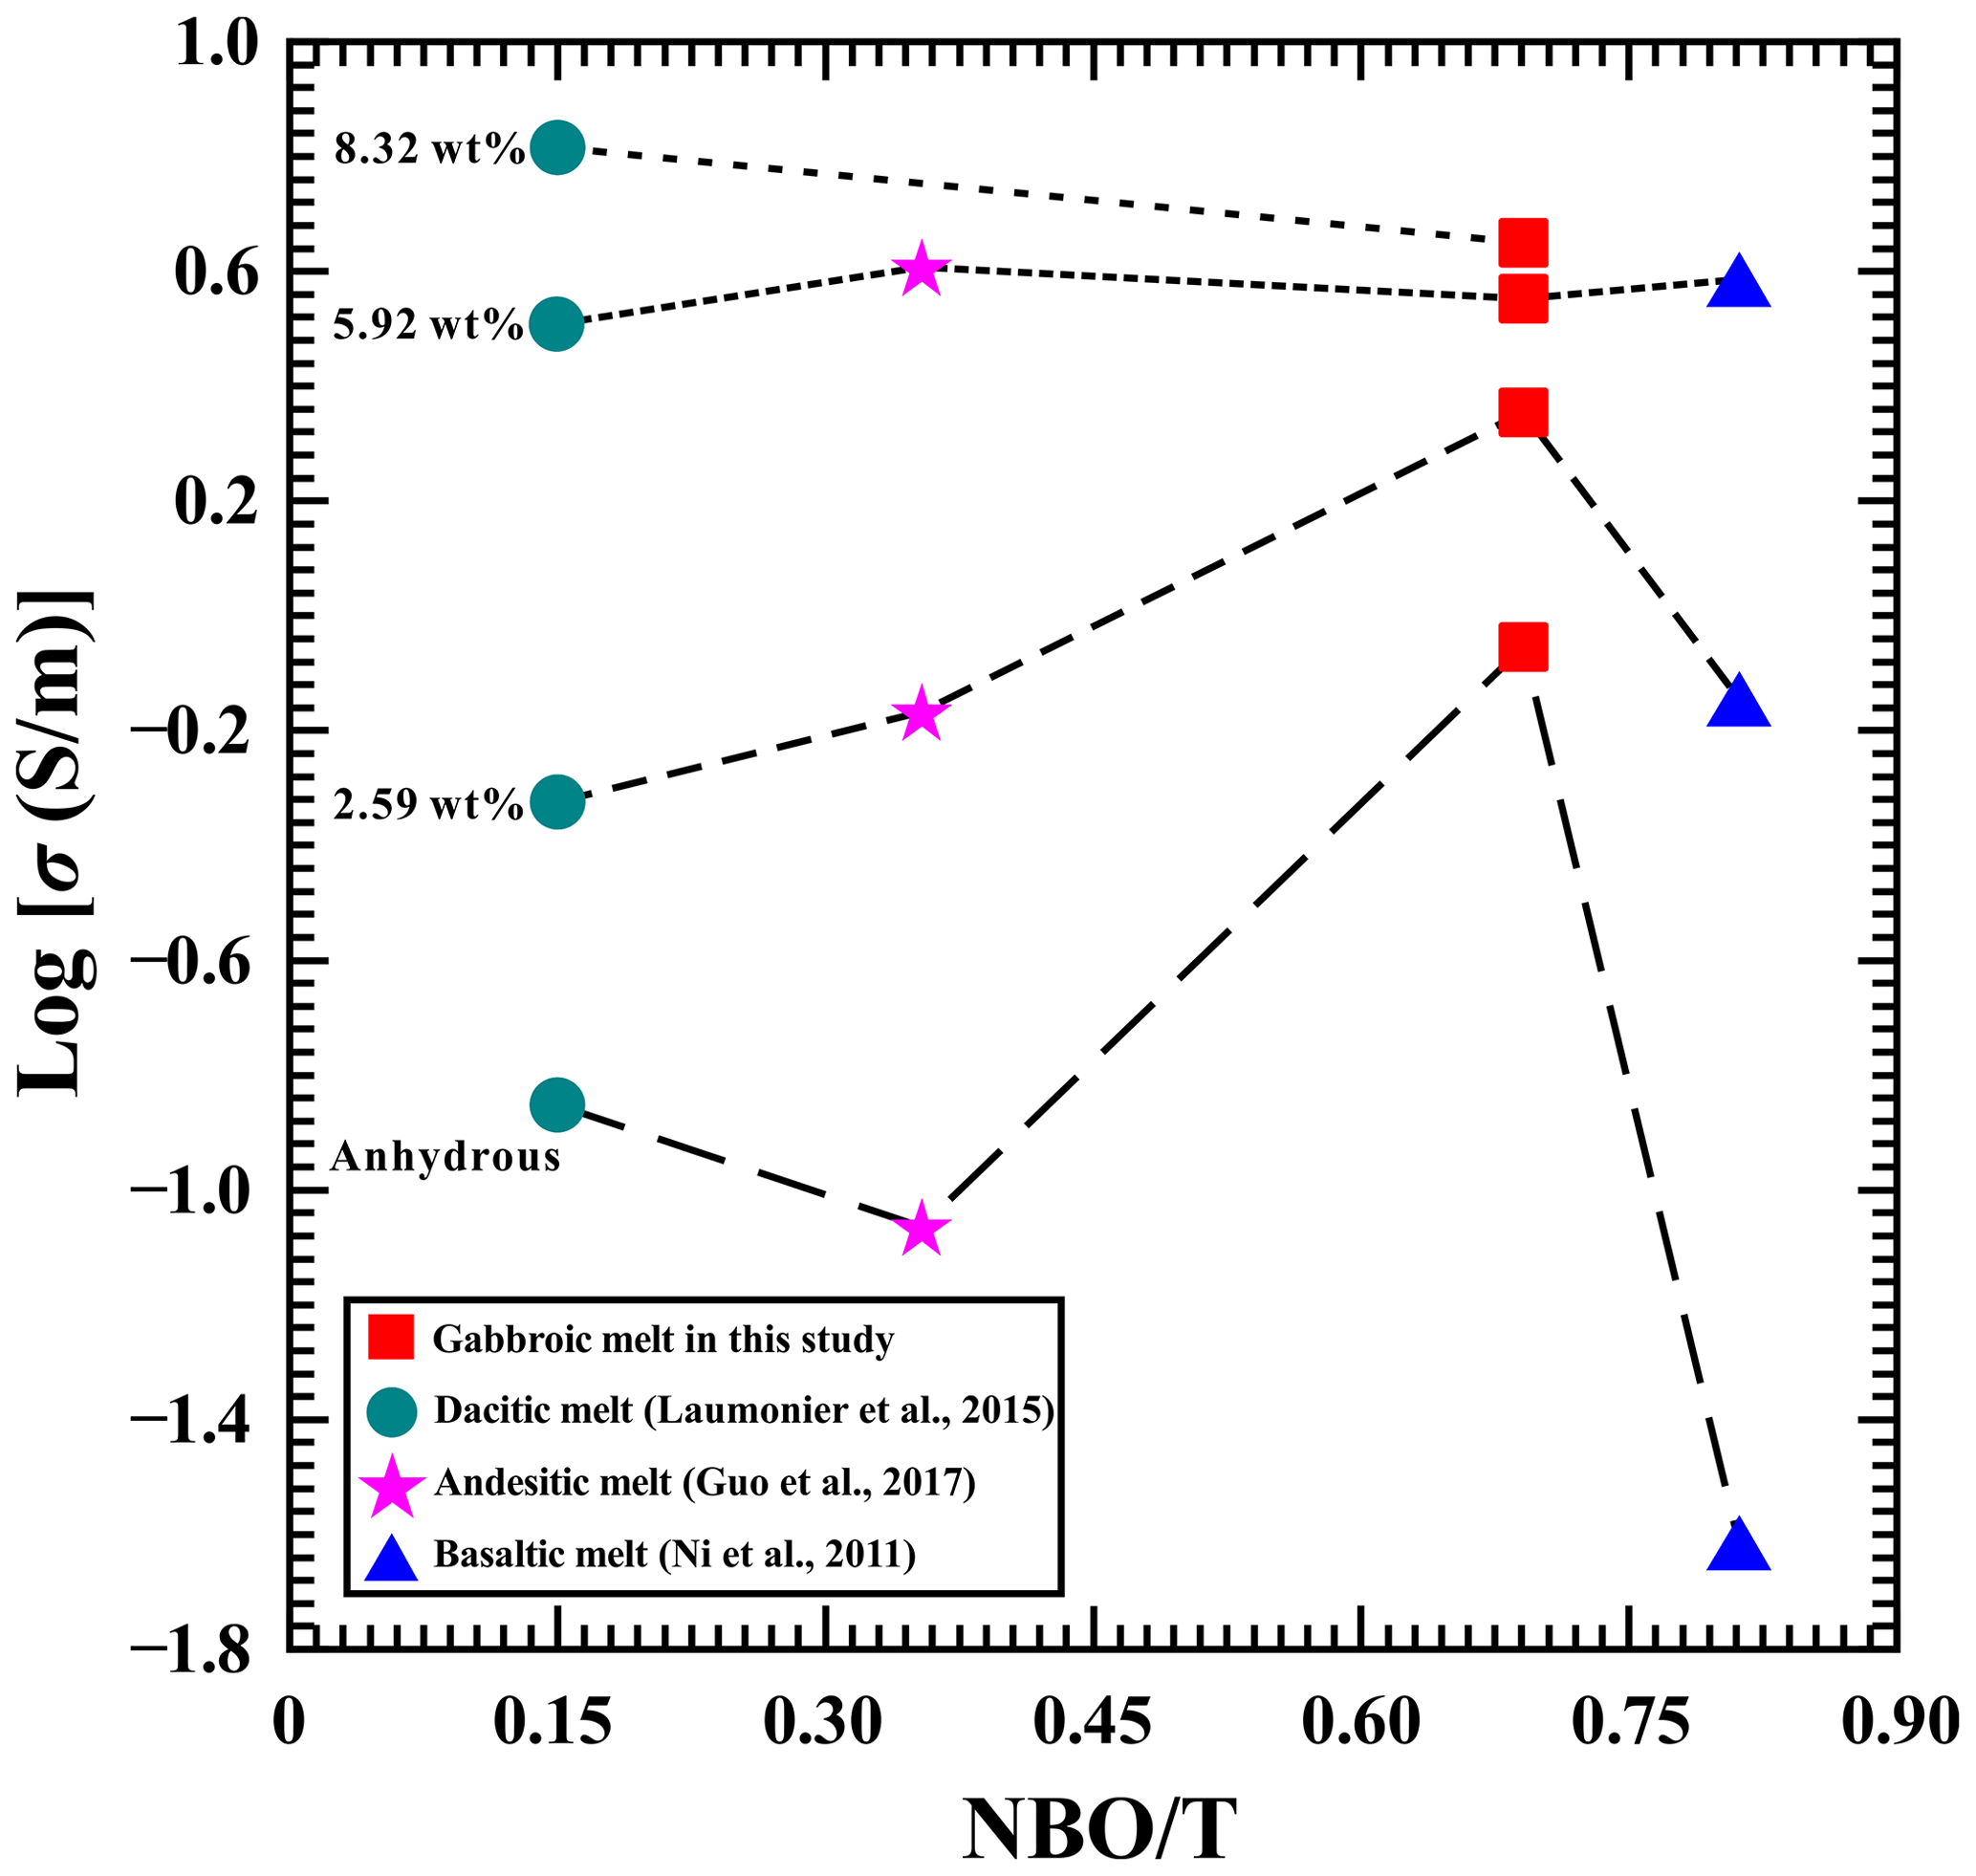
Figure 8Variation of the electrical conductivity of gabbroic melt and three representative calc-alkaline igneous rock melts with the degree of depolymerization () under conditions of four different water contents (i.e., 0 wt %, 2.59 wt %, 5.92 wt %, and 8.32 wt %) at 1373 K and 1.0 GPa. Data source: basaltic melt from Ni et al. (2011), andesitic melt from Guo et al. (2017), and dacitic melt from Laumonier et al. (2015).
As a typical active plate geotectonic boundary, previously available magnetotelluric results have already revealed that the phenomenon of high-conductivity anomalies is widely distributed in the mid-ocean ridge region (Key et al., 2013; Miensopust et al., 2014). For the representative Mohns Ridge of the Arctic Ocean, there are a large number of highly conductive layers with a conductivity magnitude within the range of ∼ 0.08–0.32 S m−1 at corresponding depths from 4 to 7 km (Johansen et al., 2019). All of these acquired seismic and gravitational survey datasets have confirmed that various volume percentages of gabbroic melt widely outcrop in the Mohns Ridge of the Arctic Ocean at depths of ∼ 4–11 km (Géli et al., 1994; Conley and Dunn, 2011). Therefore, the high-conductivity anomalies in the Mohns Ridge of the Arctic Ocean are possibly correlated with the gabbroic melt at high temperature and high pressure. In conjunction with our presently obtained experimental results on the electrical conductivity of anhydrous and hydrous gabbroic melts at conditions of 873–1373 K and 1.0–3.0 GPa, the typical Hashin–Shtrikman upper-bound model, and previously available magnetotelluric results, the electrical conductivity of a gabbroic melt–olivine system was constructed in detail, as displayed in Fig. 9. All of these influential ingredients, including water content and volume percentage, were comprehensively considered. During the process of the expansion of the mid-ocean ridge caused by the rapid upwelling of asthenosphere mantle, the geothermal distribution exhibited an abnormal behavior in the Mohns Ridge of the Arctic Ocean. As pointed out by Johansen et al. (2019), the temperature on the top gabbro layer is approximately 1373 K along the ultraslow-spreading Arctic mid-ocean Mohns Ridge region. In addition, the effect of pressure on the electrical conductivity of gabbroic melt is rather small, and it can be neglected.
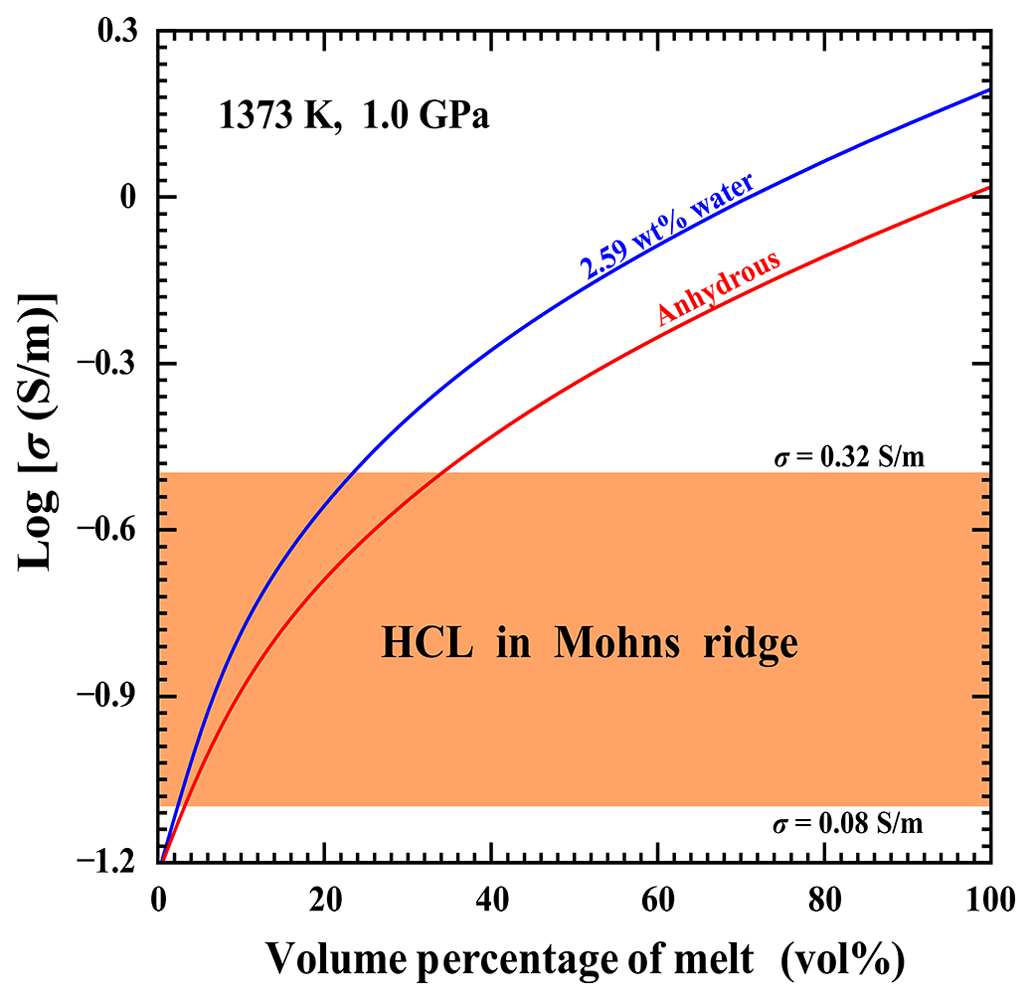
Figure 9The electrical conductivity for the gabbroic melt–olivine system at a temperature of 1373 K and 1.0 GPa, calculated with Eq. (7) of the Hashin–Shtrikman upper-bound model. The electrical conductivity of olivine from Dai and Karato (2014b) was adopted as σolivine. The orange region indicates the gabbro layer within the electrical conductivity range of 0.08–0.32 S m−1 along the ultraslow-spreading Arctic mid-ocean Mohns Ridge region (Johansen et al., 2019).
For the representative Mohns Ridge of the Arctic Ocean, previously available petrological and geochemical results have already revealed that the range of water content for the crustal rock and melt in the Mohns Ridge is ∼ 0.25 wt %–2.64 wt % (Neumann and Schilling, 1984; Poreda et al., 1986). The electrical conductivity results for gabbroic melt with two different water contents (anhydrous and a water content of 2.59 wt %) are selected from our present study. The electrical conductivity of olivine at 1373 K and 1.0 GPa is properly extrapolated from the available experimental data on polycrystalline olivine under conditions of 160 ppm wt water content, 873–1273 K, and 4.0–10.0 GPa reported by Dai and Karato (2014b). Regarding the variation of volume percentage for the gabbroic melt, the electrical conductivity of a gabbroic melt–olivine system (σHS+) can be expressed as (Hashin and Shtrikman, 1962)
Here, the signals of σmelt and σolivine stand for the electrical conductivity of gabbroic melt from the present study and that of polycrystalline olivine with a water content of 160 ppm wt from Dai and Karato (2014b), respectively; Xmelt stands for the volume percentage of gabbroic melt.
The electrical conductivity of a gabbroic melt–olivine system with a different volume percentage of gabbroic melt was successfully worked out at 1373 K and 1.0 GPa, as displayed in Fig. 9. For the gabbroic melt–olivine system with a certain volume percentage of gabbroic melt, the electrical conductivity increases with a rise in water content in gabbroic melt. Regarding the gabbroic melt containing a fixed water content, the electrical conductivity of the gabbroic melt–olivine system is gradually enhanced as the volume percentage of gabbroic melt increases. As pointed out by Johansen et al. (2019), the range of electrical conductivity for the high-conductivity layer (HCL) in the Mohns Ridge is ∼ 0.08–0.32 S m−1, as displayed in the orange region of Fig. 9. For the anhydrous gabbroic melt, the required volume percentage for the high-conductivity anomalies the ultraslow-spreading Arctic mid-ocean Mohns Ridge region falls within the range of ∼ 2.93 vol %–34.69 vol %, which is in good agreement with previously inferred results from geophysical observations (Géli et al., 1994; Conley and Dunn, 2011). When the water content of gabbroic melt increases, the required volume percentage for the HCL is reduced accordingly. As for the gabbroic melt with a relatively high water content of 2.59 wt %, its volume percentage range of ∼ 2.63 vol %–23.63 vol % is enough to explain the high-conductivity anomalies. In summary, the high-conductivity anomalies in the Mohns Ridge of the Arctic Ocean could be interpreted by the anhydrous and hydrous gabbroic melt, and our present electrical conductivity results for gabbroic melt with different water contents can provide an important constraint for the water content and volume percentage of gabbroic melt at a depth range of ∼ 4–7 km within the Mohns Ridge region of the Arctic Ocean.
In the present study, the electrical conductivity of gabbroic melt with different water contents of 0 wt %–8.32 wt % was measured at temperatures of 873–1373 K and pressure of 1.0–3.0 GPa. For the gabbroic melt with a fixed water content of 2.59 wt %, the electrical conductivity of the sample decreases slightly with a rise in pressure, and its corresponding activation energy and activation volume are determined as 0.87 ± 0.04 eV and −1.98 ± 0.02 cm3 molec.−1, respectively. When the water content of gabbroic melt is increased from 0 wt % to 8.32 wt % under the conditions of 873–1373 K and 1.0 GPa, the electrical conductivity of gabbroic melts tends to visibly increase, whereas the activation enthalpy is gradually reduced from 0.93 to 0.63 eV accordingly. Furthermore, functional relation models for the electrical conductivity of gabbroic melt with variations of temperature, pressure, and water content are constructed under high-temperature and high-pressure conditions. By using the typical Hashin–Shtrikman upper-bound model, the electrical conductivity of a gabbroic melt–olivine system with the variation of melt volume percentage is calculated under the conditions of four different water contents of gabbroic melt (i.e., 0 wt %, 2.59 wt %, 5.92 wt %, and 8.32 wt %) at 1373 K and 1.0 GPa, which can be employed to reasonably explain the high-conductivity anomalies in the Mohns Ridge of the Arctic Ocean observed in previously available field MT results.
The data that support the findings of this study are available from the first author upon reasonable request.
LD and HH performed the conceptualization of this article and led the project. MW and ZH performed the investigation including electronic probe microscopy analysis, high-pressure FT-IR spectroscopy, and high-pressure electrical conductivity measurements. LD, HH, MW, ZH, CJ, CY, SL, and JL contributed to the analysis, interpretation, and discussion of these results. MW, LD, and HH performed the writing of the original draft, as well as review and editing. All the authors commented on the final paper. LD and HH supervised the project.
The contact author has declared that none of the authors has any competing interests.
Publisher's note: Copernicus Publications remains neutral with regard to jurisdictional claims in published maps and institutional affiliations.
This research was financially supported by the NSF of China (grant nos. 42072055 and 42274137) and the Youth Innovation Promotion Association of CAS (grant no. 2019390).
This paper was edited by Yang Chu and reviewed by two anonymous referees.
Almeev, R., Holtz, F., Koepke, J., Haase, K., and Devey, C.: Depths of partial crystallization of H2O-bearing MORB: Phase equilibria simulations of basalts at the MAR near Ascension Island (7–11∘ S), J. Petrol., 49, 25-45, 2008.
Chen, J. Y., Gaillard, F., Villaros, A., Yang, X. S., Laumonier, M., Jolivet, L., Unsworth, M., Hashim, L., Scaillet, B., and Richard, G.: Melting conditions in the modern Tibetan crust since the Miocene, Nat. Commun., 9, 3515, https://doi.org/10.1038/s41467-018-05934-7, 2018.
Conley, M. M. and Dunn, R. A.: Seismic shear wave structure of the uppermost mantle beneath the Mohns Ridge, Geochem. Geophys. Geosy., 12, Q0AK01, https://doi.org/10.1029/2011GC003792, 2011.
Dai, L. D. and Karato, S. I.: Electrical conductivity of pyrope-rich garnet at high temperature and high pressure, Phys. Earth Planet. In., 176, 83–88, 2009a.
Dai, L. D. and Karato, S. I.: Electrical conductivity of orthopyroxene: Implications for the water content of the asthenosphere, Proc. Jpn. Acad. B-Phys., 85, 466–475, 2009b.
Dai, L. D. and Karato, S. I.: Electrical conductivity of wadsleyite at high temperatures and high pressures, Earth Planet. Sc. Lett., 287, 277–283, 2009c.
Dai, L. D. and Karato, S. I.: Influence of oxygen fugacity on the electrical conductivity of olivine under hydrous conditions: Implications for the mechanism of conduction, Phys. Earth Planet. In., 232, 57–60, 2014a.
Dai, L. D. and Karato, S. I.: The effect of pressure on the electrical conductivity of olivine under the hydrogen-rich conditions, Phys. Earth Planet. In., 232, 51–56, 2014b.
Dai, L. D. and Karato, S. I.: Electrical conductivity of Ti–bearing hydrous olivine aggregates at high temperature and high pressure, J. Geophys. Res.-Sol. Ea., 125, e2020JB020309, https://doi.org/10.1029/2020JB020309, 2020.
Dai, L. D., Li, H. P., Hu, H. Y., and Shan, S. M.: Experimental study of grain boundary electrical conductivities of dry synthetic peridotite under high-temperature, high-pressure, and different oxygen fugacity conditions, J. Geophys. Res.-Sol. Ea., 113, B12211, https://doi.org/10.1029/2008JB005820, 2008.
Dai, L. D., Li, H. P., Hu, H. Y., Shan, S. M., Jiang, J. J., and Hui, K. S.: The effect of chemical composition and oxygen fugacity on the electrical conductivity of dry and hydrous garnet at high temperatures and pressures, Contrib. Mineral. Petr., 163, 689–700, 2012.
Dai, L. D., Li, H. P., Hu, H. Y., Jiang, J. J., Hui, K. S., and Shan, S. M.: Electrical conductivity of Alm82Py15Grs3 almandine-rich garnet determined by impedance spectroscopy at high temperatures and high pressures, Tectonophysics, 608, 1086–1093, 2013.
Dai, L. D., Hu, H. Y., Li, H. P., Jiang, J. J., and Hui, K. S.: Effects of temperature, pressure and chemical composition on the electrical conductivity of granite and its geophysical implications, Am. Mineral., 99, 1420–1428, 2014.
Dai, L. D., Hu, H. Y., Li, H. P., Hui, K. S., Jiang, J. J., Li, J., and Sun, W. Q.: Electrical conductivity of gabbro: The effects of temperature, pressure and oxygen fugacity, Eur. J. Mineral., 27, 215–224, 2015.
Dai, L. D., Hu, H. Y., Li, H. P., Wu, L., Hui, K. S., Jiang J. J., and Sun, W. Q.: Influence of temperature, pressure, and oxygen fugacity on the electrical conductivity of dry eclogite, and geophysical implications, Geochem. Geophys. Geosy., 17, 2394–2407, 2016.
Di Genova, D., Morgavi, D., Hess, K. U., Neuville, D. R., Borovkov, N., Perugini, D., and Dingwell, D. B.: Approximate chemical analysis of volcanic glasses using Raman spectroscopy, J. Raman Spectrosc., 46, 1235–1244, 2015.
Dixon, J. B., Stolper, E. M., and Holloway, J. R.: An experimental study of water and carbon dioxide solubilities in mid-ocean ridge basaltic liquids. Part I: Calibration and solubility models, J. Petrol., 36, 1607–1631, 1995.
Förster, M. W. and Selway, K.: Melting of subducted sediments reconciles geophysical images of subduction zones, Nat. Commun., 12, 1320, https://doi.org/10.1038/s41467-021-21657-8, 2021.
Géli, L., Renard, V., and Rommevaux, C.: Ocean crust formation processes at very slow spreading centers: A model for the Mohns Ridge, near 72∘ N, based on magnetic, gravity, and seismic data, J. Geophys. Res.-Sol. Ea., 99, 2995–3013, 1994.
Guo, X., Li, B., Ni, H. W., and Mao, Z.: Electrical conductivity of hydrous andesitic melts pertinent to subduction zones, J. Geophys. Res.-Sol. Ea., 122, 1777–1788, 2017.
Hashin, Z. and Shtrikman, S.: A variation approach to the theory of effective magnetic permeability of multiphase materials, J. Appl. Phys., 33, 3125–3131, 1962.
Hong, M. L., Dai, L. D., Hu, H. Y., Yang, L. F., and Zhang, X. Y.: Pressure-induced structural phase transitions in natural kaolinite investigated by Raman spectroscopy and electrical conductivity, Am. Mineral., 107, 385–394, 2022.
Hu, H. Y., Dai, L. D., Sun, W. Q., Wang, M. Q., and Jing, C. X.: Constraints on fluids in the continental crust from laboratory-based electrical conductivity measurements of plagioclase, Gondwana Res., 107, 1–12, 2022a.
Hu, H. Y., Jing, C. X., Dai, L. D., Yin, C. Y., and Chen, D. M.: Electrical conductivity of siderite and its implication for high conductivity anomaly in the slab-mantle wedge interface, Front. Earth Sci., 10, 985740, https://doi.org/10.3389/feart.2022.985740, 2022b.
Huang, X. G., Xu, Y. S., and Karato S. I.: Water content in the transition zone from electrical conductivity of wadsleyite and ringwoodite, Nature, 434, 746–749, 2005.
Johansen, S. E., Panzner, M., Mittet, R., Amundsen, H. E. F., Lim, I., Vik, E., Landrø, M., and Arntsen, B.: Deep electrical imaging of the ultraslow-spreading Mohns ridge, Nature, 567, 379–383, 2019.
Key, K., Constable, S., Liu, L. J., and Pommier, A.: Electrical image of passive mantle upwelling beneath the northern East Pacific Rise, Nature, 495, 499–502, 2013.
Laumonier, M., Gaillard, F., and Sifre, D.: The effect of pressure and water concentration on the electrical conductivity of dacitic melts: Implication for magnetotelluric imaging in subduction areas, Chem. Geol., 418, 66–76, 2015.
Lee, S. K., Mysen, B. O., and Cody, G. D.: Chemical order in mixed-cation silicate glasses and melts, Phys. Rev. B, 68, 214206, https://doi.org/10.1103/PhysRevB.68.214206, 2003.
Leuthold, J., Lissenberg, C. J., O'Driscoll, B., Karakas, O., Falloon, T., Klimentyeva, D. N., and Ulmer, P.: Partial melting of lower oceanic crust gabbro: Constraints from poikilitic clinopyroxene primocrysts, Front. Earth Sci., 6, 15, https://doi.org/10.3389/feart.2018.00015, 2018.
Li, G. H., Gao, Y., Zhou, Y. Z., Ju, C. H., Shi, Y. T., and Cui, Q. H.: A low-velocity layer atop the mantle transition zone beneath the western Central Asian Orogenic Belt: Upper mantle melting induced by ancient slab subduction, Earth Planet. Sc. Lett., 578, 117287, https://doi.org/10.1016/j.epsl.2021.117287, 2022.
Luhr, J. F.: Glass inclusions and melt volatile contents at Parícutin Volcano, Mexico, Contrib. Mineral. Petr., 142, 261–283, 2001.
Maumus, J., Bagdassarov, N., and Schmeling, H.: Electrical conductivity and partial melting of mafic rocks under pressure, Geochim. Cosmochim. Ac., 69, 4703–4718, 2005.
Miensopust, M. P., Jones, A. G., Hersir, G. P., and Vilhjálmsson, A. M.: The Eyjafjallajökull volcanic system, Iceland: Insights from electromagnetic measurements, Geophys. J. Int., 199, 1187–1204, 2014.
Mysen, B. O., Virgo, D., and Seifert, F. A.: The structure of silicate melts: Implications for chemical and physical properties of natural magma, Rev. Geophys., 20, 353–383, 1982.
Neumann, E. R. and Schilling, J. G.: Petrology of basalts from the Mohns–Knipovich Ridge; the Norwegian–Greenland Sea, Contrib. Mineral. Petr., 85, 209–223, 1984.
Ni, H. W., Keppler, H., and Behrens, H.: Electrical conductivity of hydrous basaltic melts: Implications for partial melting in the upper mantle, Contrib. Mineral. Petr., 162, 637–650, 2011.
Poreda, R., Schilling, J. G., and Craig, H.: Helium and hydrogen isotopes in ocean–ridge basalts north and south of Iceland, Earth Planet. Sc. Lett., 78, 1–17, 1986.
Saito, S. and Bagdassarov, N. S: Laboratory measurements of electrical conductivity in a gabbro of the Oman ophiolite at high–pressures and high–temperatures: Implications for interpretation of resistivity structures of lower oceanic crust, J. Miner. Petrol. Sci., 113, 112–117, 2018.
Sato, H. and Ida, Y.: Low frequency electrical impedance of partially molten gabbro: the effect of melt geometry on electrical properties, Tectonophysics, 107, 105–134, 1984.
Schilling, F. R., Partzsch, G. M., Brasse, H., and Schwarz, G.: Partial melting below the magmatic arc in the central Andes deduced from geoelectromagnetic field experiments and laboratory data, Phys. Earth Planet. In., 103, 17–31, 1997.
Shaw, A. M., Behn, M. D., Humphris, S. E., Sohn, R. A., and Gregg, P. M.: Deep pooling of low degree melts and volatile fluxes at the 85∘ E segment of the Gakkel Ridge: Evidence from olivine-hosted melt inclusions and glasses, Earth Planet. Sc. Lett., 289, 311–322, 2010.
Shen, Y. and Forsyth, D. W.: Geochemical constraints on initial and final depths of melting beneath mid-ocean ridges, J. Geophys. Res.-Sol. Ea., 100, 2211–2237, 1995.
Sim, S. J., Spiegelman, M., Stegman, D. R., and Wilson, C.: The influence of spreading rate and permeability on melt focusing beneath mid-ocean ridges, Phys. Earth Planet. In., 304, 106486, https://doi.org/10.1016/j.pepi.2020.106486, 2020.
Stolper, E.: The speciation of water in silicate melts, Geochim. Cosmochim. Ac., 46, 2609–2620, 1982.
Turner, S. J. and Langmuir, C. H.: Sediment and ocean crust both melt at subduction zones, Earth Planet. Sc. Lett., 584, 117424, https://doi.org/10.1016/j.epsl.2022.117424, 2022.
Tyburczy, J. A. and Roberts, J. J.: Low frequency electrical response of polycrystalline olivine compacts: Grain boundary transport, Geophys. Res. Lett., 17, 1985–1988, 1990.
Wallace, P. J.: Volatiles in subduction zone magmas: concentrations and fluxes based on melt inclusion and volcanic gas data, J. Volcanol. Geoth. Res., 140, 217–240, 2005.
White, R. S., Minshull, T. A., Bickle, M. J., and Robinson, C. J.: Melt generation at very slow-spreading oceanic ridges: Constraints from geochemical and geophysical data, J. Petrol., 42, 1171–1196, 2001.
Wu, K., Ling, M. X., Hu, Y. B., Guo, J., Jiang, X. Y., Sun, S. J., Liang, H. Y., Liu, X., and Sun, W. D.: Melt-fluxed melting of the heterogeneously mixed lower arc crust: A case study from the Qinling orogenic belt, Central China, Geochem. Geophys. Geosy., 19, 1767–1788, 2018.