the Creative Commons Attribution 4.0 License.
the Creative Commons Attribution 4.0 License.
 | 08 Jan 2024
Thrusts control the thermal maturity of accreted sediments
Utsav Mannu
David Fernández-Blanco
Ayumu Miyakawa
Taras Gerya
Masataka Kinoshita
Thermal maturity assessments of hydrocarbon-generation potential and thermal history rarely consider how upper-plate structures developing during subduction influence the trajectories of accreted sediments. Our thermomechanical models of subduction support that thrusts evolving under variable sedimentation rates and décollement strengths fundamentally influence the trajectory, temperature, and thermal maturity of accreting sediments. This is notably true for the frontal thrust, which pervasively partitions sediments along a low- and a high-maturity path. Our findings imply that interpretations of the distribution of thermal maturity cannot be detached from accounts of the length and frequency of thrusts and their controlling factors. Our approach takes these factors into consideration and provides a robust uncertainty estimate of maximum exposure temperatures as a function of vitrinite reflectance and burial depth. As a result, our models reduce former inconsistencies between predicted and factual thermal maturity distributions in accretionary wedges.
- Article
(4078 KB) - Full-text XML
-
Supplement
(13647 KB) - BibTeX
- EndNote


Organic material transforms into coal, oil, and gas at rates primarily controlled by temperature. This transformation, critical for the hydrocarbon industry, is also useful to study the tectonic and sedimentary evolution of basins and orogens. The extent of this transformation in sediments, known as thermal maturity, can be measured as vitrinite reflectance, i.e. the percentage of incident light reflected from the surface of vitrinite particles in these sediments. Thermal maturity has been used to estimate the thermal evolution of igneous intrusions and seismic slip, the extent of low-grade metamorphism, porosity, and compaction in basin sediments, and the geothermal history of accreting material during subduction (e.g. Bostick and Pawlewicz, 1984; Rabinowitz et al., 2020; Fukuchi et al., 2017; Kamiya et al., 2017).
Inferences on the geothermal history of subduction margins based on thermal maturity depend on the trajectory followed by the accreting sediments (Miyakawa et al., 2019). Low-temperature, high-pressure metamorphic rocks in the subduction wedge are often attributed to the pressure maxima that typically predate the temperature maxima in accreted sediments undergoing diagenesis in the wedge (van Gool and Cawood, 1994). However, the existence of complicated patterns in sediment trajectories is supported by numerical models and field observations (Giunchi and Ricard, 1999). As the orogenic wedge evolves, sediments accreting along different paths reach different depths and velocities and are exposed to different regional peak temperatures. Miyakawa et al. (2019) proposed subdividing these trajectories based on their final characteristics, like thermal maturity. In this manner, the spatiotemporal evolution of sediments and their thermal maturity is regulated to the first order by the partition of incoming sediments along two endmember pathways: (i) a deeper path leading to elevated thermal maturities and constituted by under-thrusted material, the high thermal-maturity path, and (ii) a shallower path that typically lies closer to the surface or gets frequently exhumed to near-surface levels, the low thermal-maturity path.
Previous studies have used numerical and analogue approaches to study the trajectories of sedimentary particles, and their spatial and pressure–temperature evolution, as a function of changes in erosion, sedimentation, or décollement strength. The trajectory followed by under-thrusted sedimentary units is primarily determined by orogenic wedge dynamics and its controlling forces (Platt, 1986). Although these sediments may only be exhumed near the backstop of the wedge, the trajectories of other accreted sediments generally deflect toward the surface under the influence of erosion (Konstantinovskaia, 2005). In fact, sedimentary particle trajectories gradually shift from deflection toward the surface near the front of accretion to final exhumation near the wedge backstop (Wenk and Huhn, 2013). Still, even under-thrusted sediments, which would co-relate to high-maturity paths in our study, have variable pressure–temperature paths (Ruh, 2020). It is important to highlight that the majority of past studies have explored a snapshot of sediment trajectories, assuming that the general nature of trajectories remains relatively fixed with time or is stationary in nature. However, the intrinsic connection between thermal maturity and the comprehensive thermal exposure along the entire trajectory necessitates an in-depth investigation into the dynamic and transitory nature of sediment trajectories.
Although there is general consensus on the rate and extent of sediment trajectory transition from horizontal to vertical during accretion, the dynamic perturbations in sediment dynamics have yet to be adequately examined. For instance, while most studies show a great degree of correlation between the initial depth of incoming sediments and their final position in the wedge (e.g. Mulugeta and Koyi, 1992; Willett, 1992), a dynamic fluctuation in this correlation due to thrusting can result in non-stationary exhumation paths for accreting sediments in a wedge (e.g. Konstantinovskaia, 2005; Miyakawa et al., 2019). Much remains to be explored regarding the partition of high and low thermal-maturity paths and how sediments travel inside natural wedges, given the conventional assumption that accreting sediments remain at the same relative depth and translate along the adjacent “layers” without vertical mixing throughout the tectonic evolution of the wedge (Hori and Sakaguchi, 2011).
Our assessment identifies a primary gap in existing research: the prediction and mapping of the initial sediment influx to their location in the orogenic wedge. More specifically, the challenge lies in determining which portions of incoming sediment will predominantly constitute the core of the wedge and which will reside at comparatively shallower depths. Given that the maximum exposure temperature estimation from the thermal maturity is inherently reliant on the path of sediments inside the wedge, information on path diversity would inherently constrain the uncertainty in maximum exposure temperature used for the identification of paleo-thermal structures of subduction zones. Moreover, to better understand the time–depth paths of wedge sediments, their dependence on the initial state of undeformed sediments, and thus their thermal maturity, the factors that control the evolution of subduction–accretion systems, like sedimentation, erosion, and décollement strength, ought to be considered (Mannu et al., 2016; Simpson, 2010).
Here, we explore in detail the impact accretion in a subduction wedge has on the thermal maturity of its sediments. We simulate subduction–accretion using 2D finite-difference thermomechanical models incorporating empirical thermal conductivity values from the Nankai accretionary margin. We track the evolution of thermal maturity by computing vitrinite reflectance (%Ro) on each marker and throughout the model, using three well-established methods of %Ro computation, as accretion develops the wedge under different sedimentation rates and décollement strengths. These factors notably alter the trajectories and thermal maturities of incoming sediments. Particularly, thrusts define sharp thermal maturity boundaries leading to stark differences in the thermal maturity of sediments that accrete in different thrust blocks, even when they follow similar trajectories and lay nearby.
We use a generalised model for the subduction of an oceanic plate under a continental plate, with explicit integration of key parameters from the Nankai subduction margin off Kii Peninsula in south-west Japan. The Nankai subduction margin is a product of the ongoing, north-west-directed subduction of the Philippine Sea Plate beneath the Amurian Plate at a convergence rate of 4.1–6.5 cm yr−1 (Seno et al., 1993; Heki et al., 1999; DeMets et al., 2010). Past studies posit the initiation of this subduction within the Nankai region at circa 6 Mya (Kimura et al., 2014). The accretionary wedge adjacent to the Nankai margin is marked by the accretion of thick sediment layers (>1 km), predominantly formed by overlying younger trench sediments atop Shikoku Basin sediments. Mean sedimentation rates of ∼0.4 mm yr−1 for this area are calculated from on-land sediment data and may largely reach the trench through submarine channels (Korup et al., 2014).
Table 1Properties of the different materials used for the model runs.
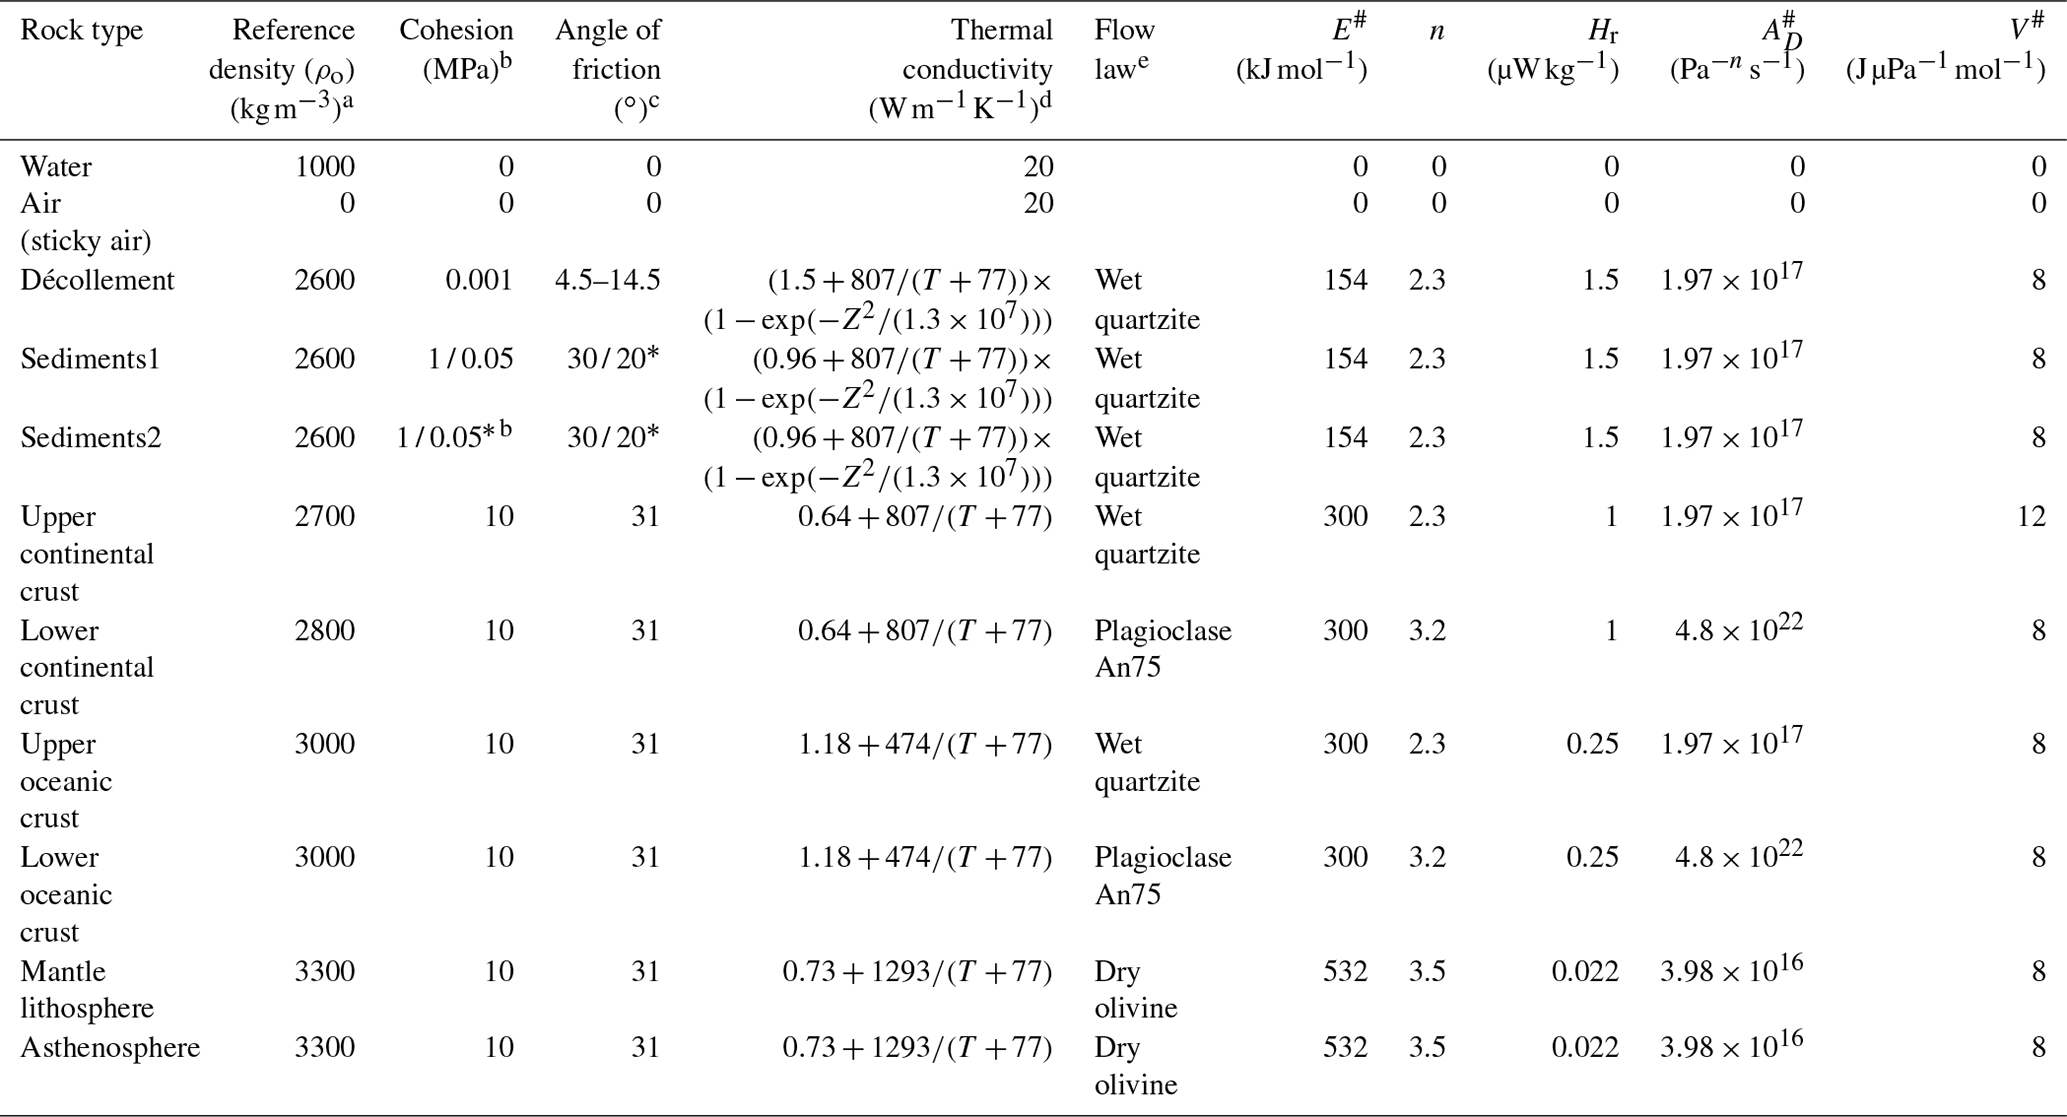
∗ is strain-softened cohesion/coefficient of friction. # We have assumed flow law parameters such as AD, E, V and n to be the same for dislocation and diffusion creep. T is temperature in Kelvin, and Z is the depth from the seafloor. The reference temperature for densities have been taken as the average temperature of the rock type. a Reference for densities (Turcotte and Schubert, 2002; Gerya and Meilick, 2011). b Reference cohesion values for sediments (Schumann et al., 2014). c Reference for angle of friction (Schumann et al., 2014; Ruh et al., 2014; Gerya and Meilick, 2011). d Reference for thermal conductivity (Clauser and Huenges, 1995; Sugihara et al., 2014). e Reference for flow laws and radiogenic heat production (Ranalli, 1995; Gerya and Meilick, 2011).
Another reason to select the Nankai subduction margin is that it is a particularly well-studied accretionary margin regarding its paleo-thermal history and thermal maturity distribution. For example, Underwood et al. (1992) and Sakaguchi (1999) used thermal maturity estimates from Shimanto accretionary wedge in the Nankai subduction margin to suggest that ridge subduction can explain the resulting paleo-heat flow. Following this, Ohmori et al. (1997) published a distribution of thermal maturity and maximum exposure temperature for the Shimanto accretionary wedge, identifying out-of-sequence thrusting in the region. The accretionary wedge adjacent to the Kumano forearc basin in the Nankai subduction margin has also been the subject of the NanTroSEIZE (Nankai Trough Seismogenic Zone) project, which drilled C0002 borehole during the 2012 Integrated Ocean Discovery Program Expedition 338. C0002 borehole is located south-west of Japan's Kii Peninsula in the Kumano Basin, within the Nankai accretionary margin, and extends 3348 m below the seafloor. Having data on both thermal maturity and thermal conductivity from the same borehole in subduction wedges is quite uncommon. To our knowledge, the C0002 borehole, located next to the Kumano forearc basin, is the only place where such data can be found in an accretionary wedge. Because of this unique characteristic, the C0002 borehole serves as an excellent dataset for validation purposes. We modify the thermal conductivity computation for sediments and décollement (see Table 1) to match the empirical relationship between depth and thermal conductivity, as measured on core samples in the borehole C0002 (Sugihara et al., 2014).
While these adjustments render our models somewhat specific to the Nankai accretionary wedge, we propose that the thermal conductivity values and trend are representative of patterns typically observed in forearc basins and accretionary wedges across the globe, making it broadly applicable to general subduction margins. For instance, in our simulations, the sediment thermal conductivity within our wedge steadily increases with depth from 0.96–4.0 , which is within the range of thermal conductivity estimates of comparable depth in other subduction zones, such as the Hikurangi subduction margin, Japan Trench, and Taiwan subduction zone (Fig. S1 in the Supplement, Henrys et al., 2003; Lin et al., 2014; Chi and Reed, 2008). As a result, we compare our simulation results not only to thermal maturity values in the Nankai accretionary margin but also to those of the Miura–Boso plate subduction margin in central Japan and the fold-and-thrust belts of the Western Foothills complex in western Taiwan.
We employ I2VIS, a conservative finite-difference 2-D thermomechanical subduction–accretion model with visco-plastic/brittle rheology (Gerya and Yuen, 2003a, b). The code solves the governing equations for the conservation of mass, momentum, and heat as well as the advection equation with a non-diffusive marker-in-cell scheme constrained by thermal conductivity values inferred from Nankai accretionary wedge. Our numerical approach has several advantages over earlier attempts to simulate thermal maturity in an accretionary wedge, such as a more realistic geothermal profile, variable particle paths, and thermal evolution. In the following sections, we provide information regarding the governing equations, the modified thermal conductivity formulations based on the C0002 borehole, boundary conditions, the rheological model, model setup, surface processes, and the computation of thermal maturity.
3.1 Governing equations
The mass conservation is described by the continuity equation with the Boussinesq approximation of incompressibility.
where vx and vy are horizontal and vertical components of velocity.
The equation for conservation of momentum with an incompressibility assumption is expressed in the 2D Stokes equation, for the x axis and y axis respectively,
where σxx, σxy, σyy are components of the deviatoric stress tensor; x and y denote the horizontal and vertical coordinates; and P is pressure.
where ρ is rock density and depends on rock type (C), temperature (T), and pressure as , where ξ is the coefficient of thermal expansion taken to be K−1 for all rock markers and 0 for air/water, ς is the coefficient of compressibility taken to be MPa−1 for all rock markers and 0 for air/water, ρ0 is the reference density at reference temperature (T0=298.15 K) and reference pressure (P0=105 K).
The thermal equation used in the model is as follows:
where
where is the Lagrangian time derivative; , , are components of the strain rate tensor; qx, qy are the components of heat flux in the horizontal and vertical direction; g is the vertical gravitational acceleration; CP is the isobaric heat capacity; and Hr, Ha, Hs denote the radioactive, adiabatic, and shear heat production respectively. is the thermal conductivity, a function of composition, depth, and temperature (Table 1). The radioactive heat production Hr is constant for a rock type as mentioned in Table 1.
In order to accurately assess thermal maturity, it is crucial to consider the temperature distribution, which necessitates a realistic thermal conductivity profile when modelling thermal maturity. Many geodynamic models assume that thermal conductivity decreases as temperature increases, following a defined relationship (e.g. Clauser and Huenges, 1995). These models typically predict a decrease in thermal conductivity with depth within accretionary wedges, as geothermal profiles tend to increase in temperature with depth. However, empirical data reveal a different trend: thermal conductivity increases with depth, primarily due to sediment porosity influencing shallow thermal conductivity (Henrys et al., 2003; Lin et al., 2014). Additionally, the thermal conductivity values calculated using the Clauser and Huenges (1995) model are significantly higher than those observed at shallow depths (<3 km). To address these disparities, we incorporate the observed empirical relationship between depth and thermal conductivity from the IODP Site C0002 borehole in the Nankai accretionary wedge into our simulations. By adjusting the thermal conductivity formulation for sediments based on temperature and depth, we aim to replicate the empirical relationship observed in the core samples taken from the borehole at IODP Site C0002 (Sugihara et al., 2014) and account for the decrease in thermal conductivity near the surface caused by increased porosity. We modify the thermal conductivity formulation for sediments as a function of temperature and depth as follows.
k0=0.96 and 1.5 for the wedge sediment and décollement respectively. The larger thermal conductivity of the décollement emulates higher heat transfer in shear zones due to fluid advection (Fig. S1).
3.2 Rheological model
The expression for effective creep viscosities (ηeff) is computed as follows.
where R is the gas constant (8.314 ) and AD, n, m, Ea, and Va are experimentally determined rheological parameters. AD is the material constant (), n is the stress exponent, m is the grain size exponent, Ea is activation energy (J mol−1), Va is activation volume (J Pa−1), and S is a stress factor for diffusion creep assumed to be 3×10⁴ Pa.
The model uses visco-plastic rheology to account for both brittle rheology of the shallower and colder rigid lithosphere and deeper, hotter ductile lithosphere and asthenosphere. Using the plastic yield threshold as per the Drucker–Prager criterion we limit effective viscosity as
where C is cohesion and φ is an effective internal angle of friction or μ=tan φ where μ is the coefficient of internal friction and λ the fluid pressure ratio assumed to be 0 in all the simulations.
3.3 Boundary conditions
A free-slip boundary condition is implemented on all boundaries, except on the lower boundary, which is permeable in the vertical direction. On the lower boundary we implement an external free slip condition similar to where a free slip condition is satisfied at an external boundary such that
where Vx and Vy are the velocities in the horizontal and vertical directions at the boundary, ΔYexternal is the depth that lies outside the modelling domain, and free slip condition is maintained. Similarly, we set thermally insulating boundary conditions on all sides except the lower one, where the external thermal boundary condition is implemented.
3.4 Surface processes
The rock–water/air boundary is simulated by an adaptive irregular grid that is advected horizontally and vertically and is coupled to the thermomechanical grid which controls the tectonic deformation of the surface. Apart from the tectonic changes, surface processes prescribed in the model can also change the topography. The surface process in the model is controlled by the conversion of rock markers to air/water and vice versa. All sedimentation in the model happens as a focused deposition of sediments from sea to land in morphological depressions (e.g. trench) and is modelled as follows (Fig. S2):
where .
The shape of the basin and the resolution of the surface grid can lead to overfilling or underfilling when using Eq. (14) to fill the basin. To address this issue, we calculate the volume of deposited sediments and adjust for any deficit or overfill in the subsequent step. This ensures that, over time, the total value of sedimentation remains consistent with the prescribed value. However, it is challenging to ensure that all sediments added in a particular step are accommodated within the basins, especially in models with high sedimentation rates where significant runoff occurs. Therefore, the sedimentation rates mentioned in this study are computed as effective sedimentation rates after the model runs, rather than being predetermined. We perform multiple models runs (approximately 100) with sedimentation rates uniformly distributed in the range of 0.1–0.9 mm yr−1. From these runs, we select models that exhibit appropriate sedimentation rates. This selection process ensures that the average sedimentation rates across all our models (ranging from 0.1 to 0.9 mm yr−1) fall within the observed sedimentation rates in our chosen natural equivalent, the Nankai accretionary wedge in the south-western subduction margin of Japan (Korup et al., 2014). For more specific information about the model run and prescribed sedimentary conditions, please see Table 2.
Table 2Model runs and their specific characteristic observations.
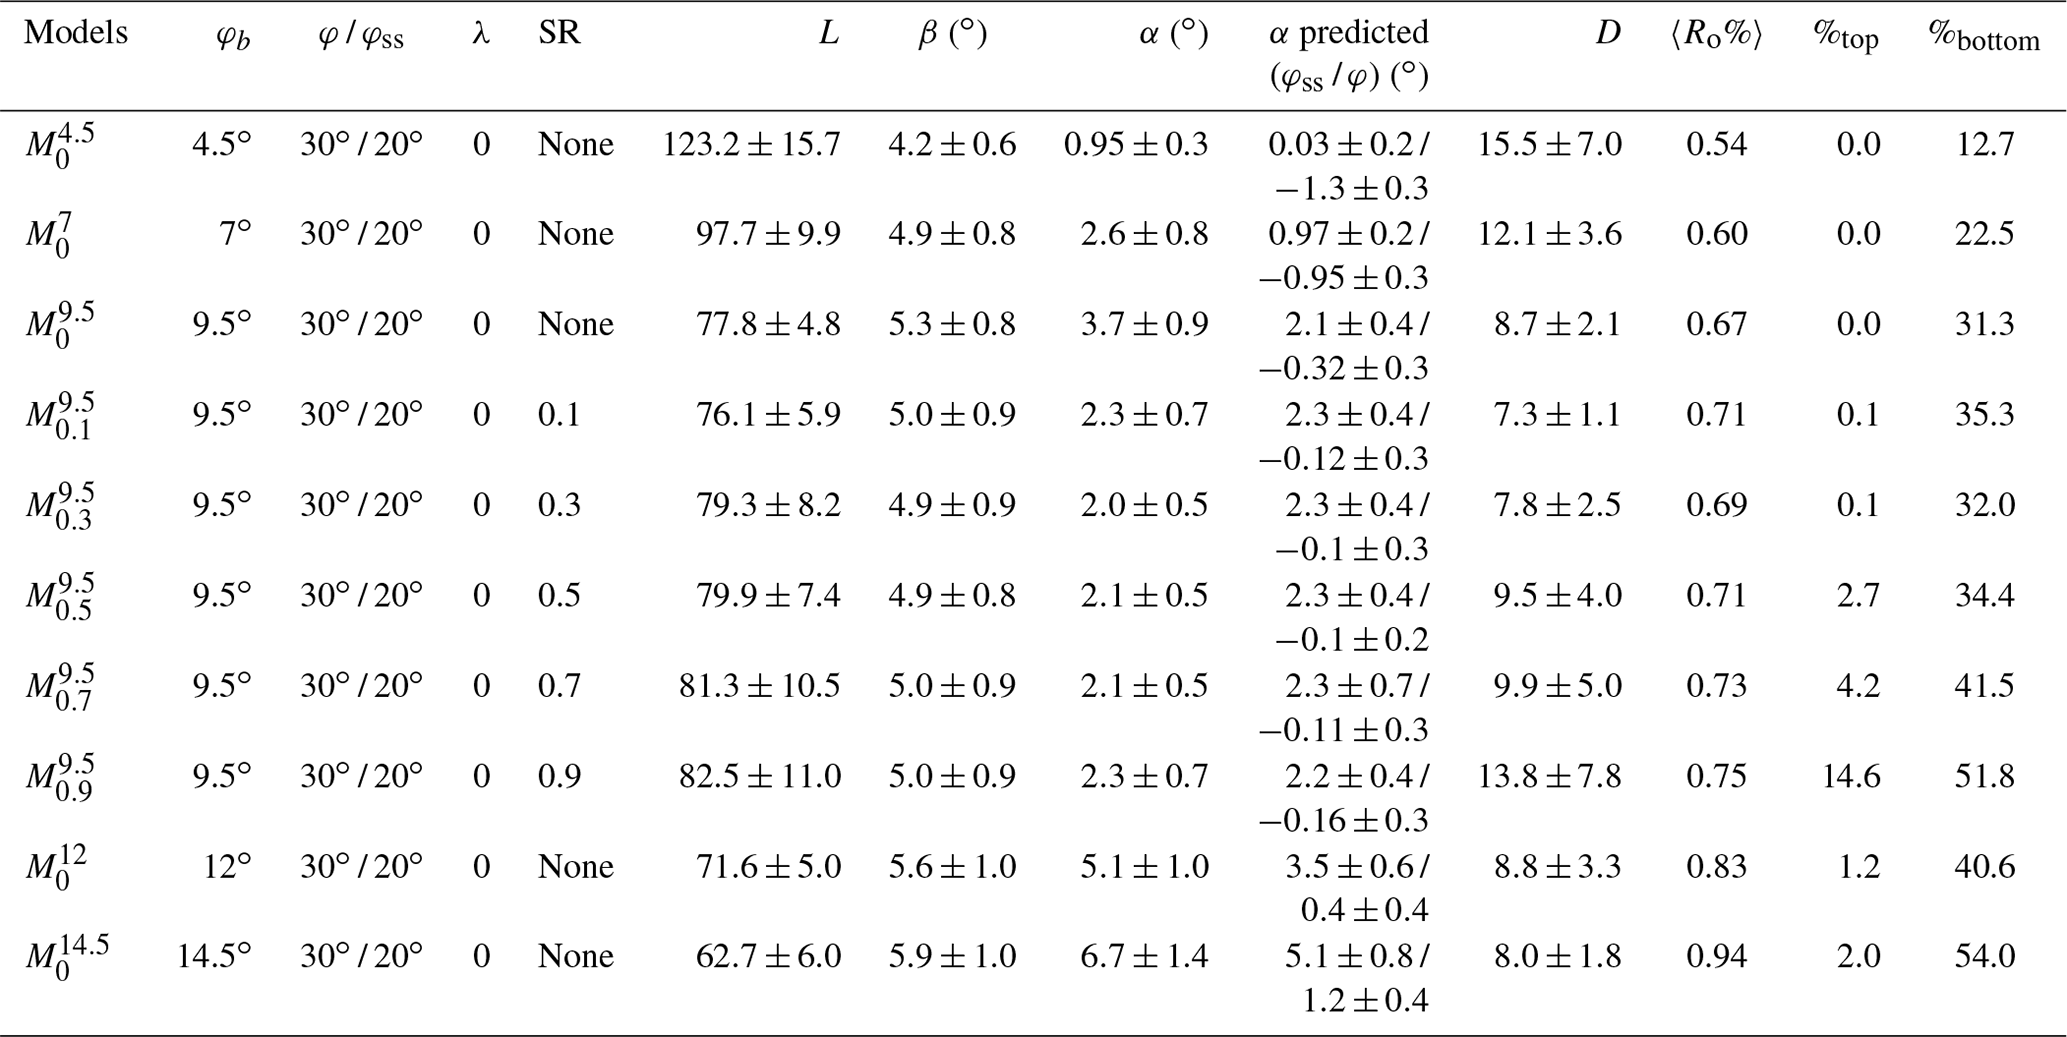
φb is décollement strength (internal angle of friction). φ is sediment strength. φss is sediment strength (strain weakened)/(internal angle of friction). SR is average sediment rate (mm yr−1). λ is pore–fluid pressure ratio. L is average length of the wedge (in kilometres) between ∼2.5 and 7.5 Myr. Length of the wedge is computed as the distance between trench and backstop (set at 1850 km from the right edge of the modelling domain). β is average basal dip angle β (in ∘) between ∼2.5 and 7.5 Myr measured by fitting a line in the basal surface. α is average surface slope angle α (in ∘) between ∼2.5 and 7.5 Myr measured computing the slope of fitting the best fitted line in the surface. D is average distance between the first and second frontal thrust between ∼2.5 and 7.5 Myr (in kilometres). The frontal thrust is always identified from the trench. The send thrust is identified by the high strain rate and deviation of the weak décollement material from the trend of oceanic plate. α predicted (φss / φ) is the surface slope predicted using critical wedge theory using the β observed in the model and sediment strength (initial/strain weakened). T is average time a frontal thrust remains active between ∼3.5 and 7.5 Myr. 〈Ro%〉 is average vitrinite reflectance of the wedge between ∼3.5 and 7.5 Myr. %top is proportion of >1 eventual Ro% (vitrinite reflectance at 7.5 Myr) in the shallow half of the incoming sediment at 2.5 Myr. %bottom is proportion of >1 eventual Ro% (vitrinite reflectance at 7.5 Myr) in the deep half of the incoming sediments.
∗ Please see Fig. S18 for details on the various measurement done on the wedge.
3.5 Thermal maturity calculation
The model computes the %Ro of each marker to estimate the thermal maturity of sediments during the model run using three widely used methods of thermal maturity modelling: Easy%Ro (Burnham and Sweeney, 1989; Sweeney and Burnham, 1990), Simple%Ro (Suzuki et al., 1993) and Basin%Ro (Nielsen et al., 2017). All the models presented here employ a simplified parallel Arrhenius reaction model, which accommodates an array of activation energies for every component of the kerogen, allowing it to estimate thermal maturity under varying temporal and thermal scales. The Easy%Ro model by Sweeney and Burnham (1990) can be described using the following equations:
where xoi are weights of reactions for ith component of the kerogen also described as the stoichiometric coefficient, A is the pre-exponential factor, Eai is the activation energy of the ith component of the kerogen, R is the gas constant, T(t) is the temperature history, F is the percentage of fixed carbon, and %Ro0 is the vitrinite reflectance of the immature unaltered sediment. Sweeney and Burnham (1990) provided a set of 20 activation energies (Eai) and the stoichiometric coefficient (xoi) listed in Table 3. All thermal models used in this study use the same method of vitrinite reflectance computation albeit with different sets of activation energies, stoichiometric coefficient, pre-exponential factor, and %Ro0. Table 3 provides a comprehensive list of all these parameters.
Table 3Parameters for Easy%Ro, Simple%Ro and Basin%Ro vitrinite reflectance model.
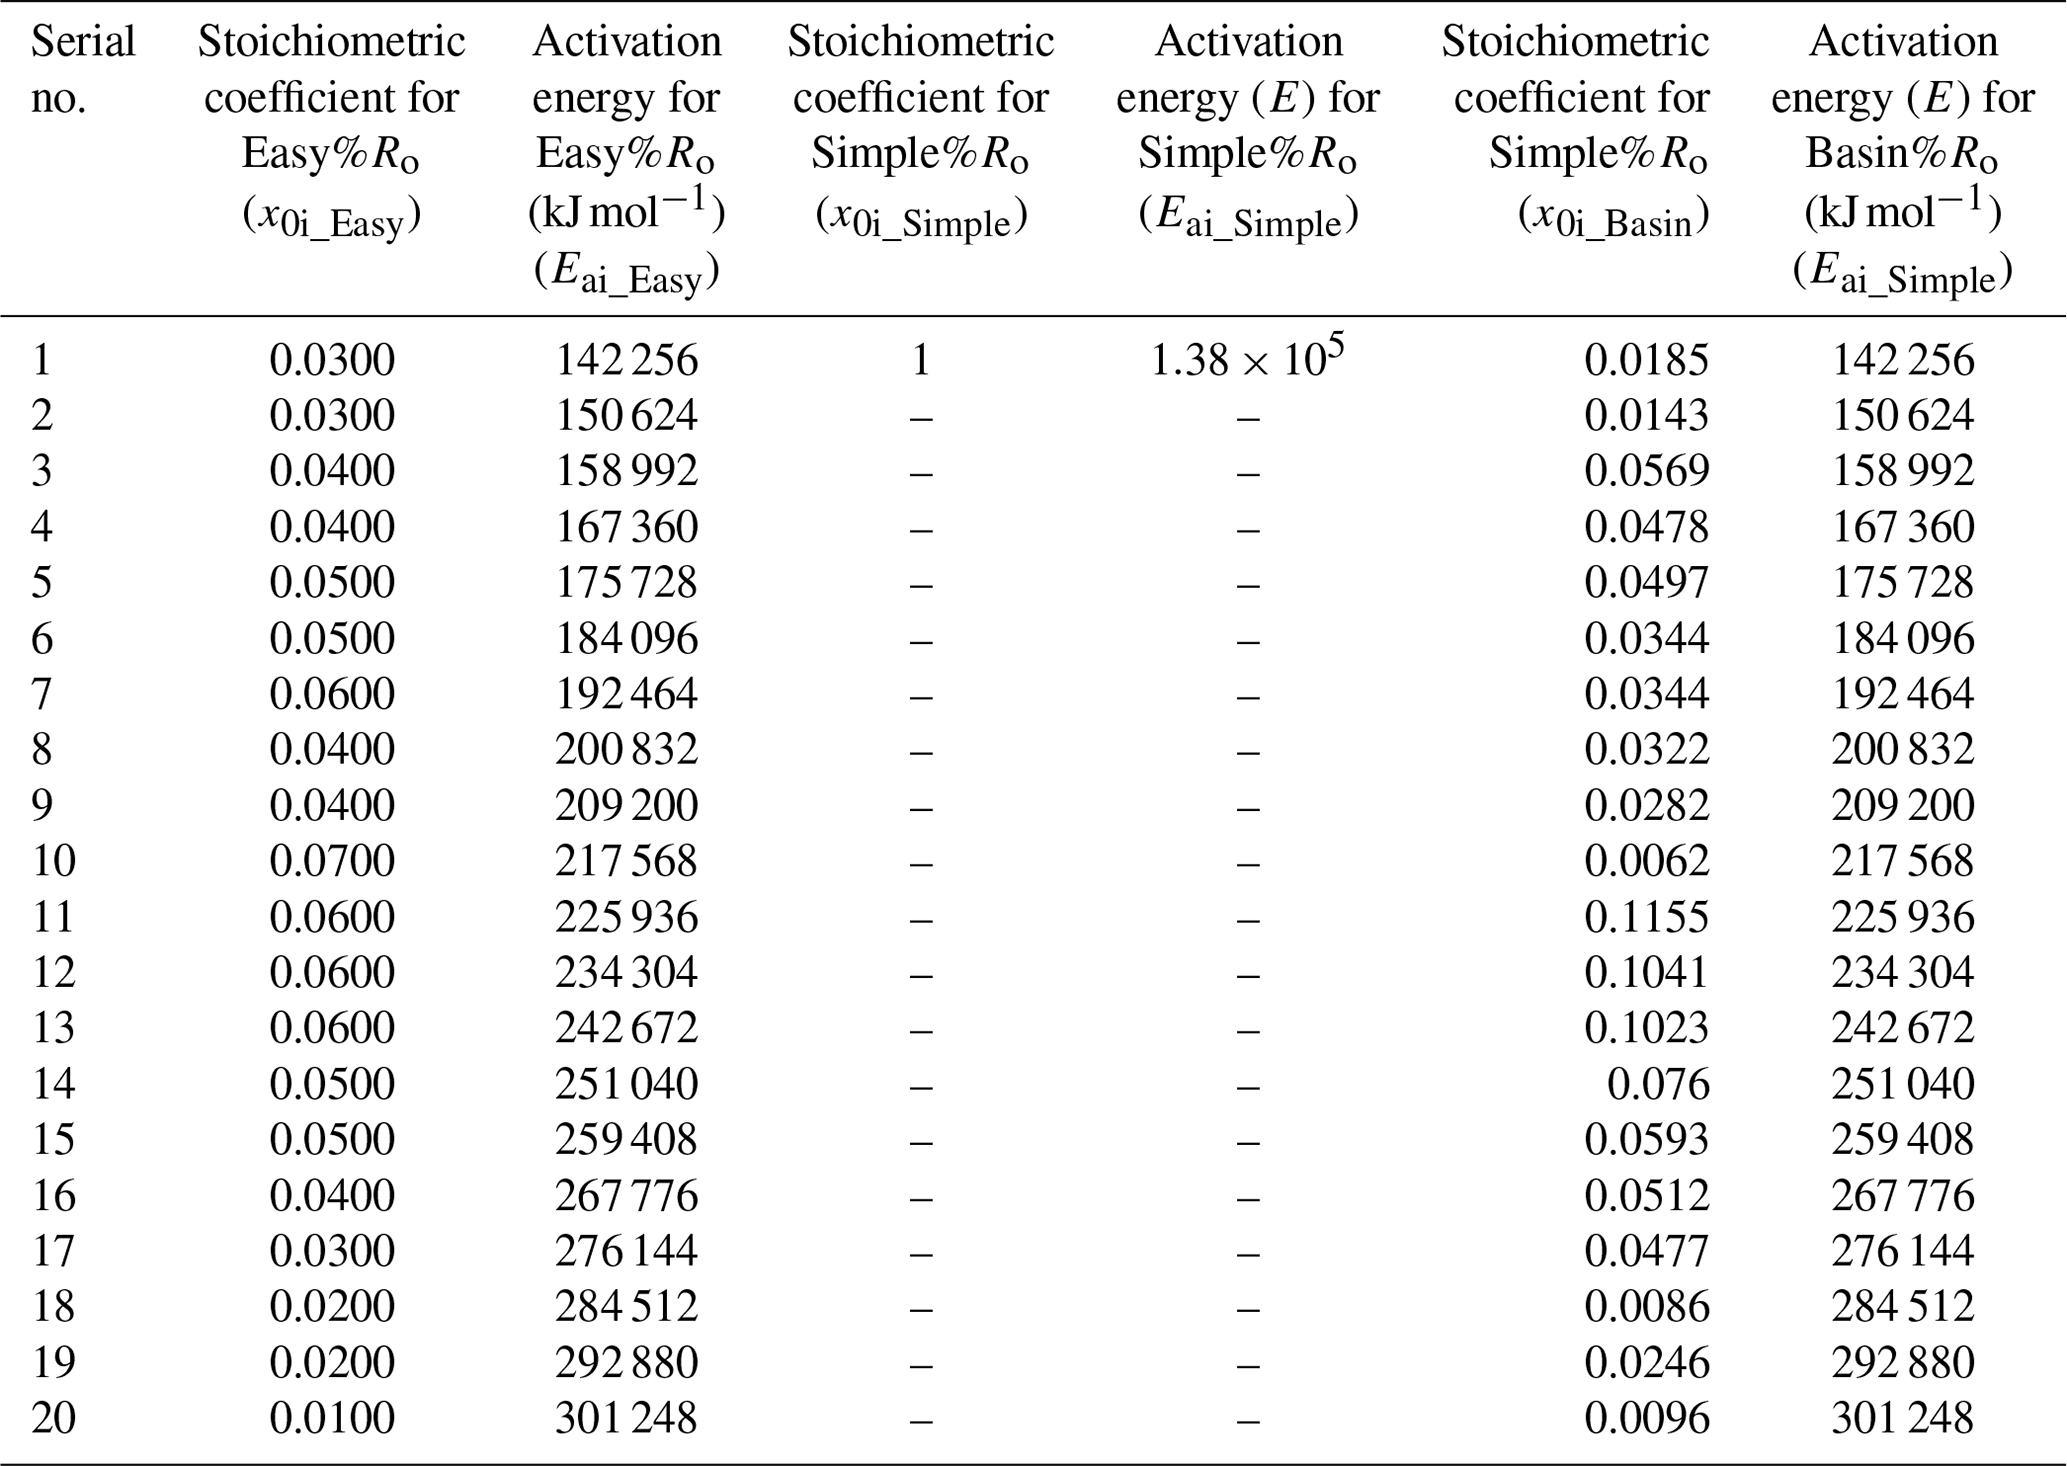
and %Ro0=0.2, and %Ro0=0.2, and %Ro0=0.2104.
All these approaches for computing %Ro yield similar trends albeit with different absolute values. In the interest of clarity, we have mostly illustrated Easy%Ro, which is the most extensively used method for vitrinite reflectance computation and hereafter we refer Easy%Ro as %Ro, unless explicitly stated. %Ro is set to %Roo in sediment markers at the start of the model until 2.5 Myr, while %Ro in markers for other rocks, air, and water is undefined at all times. After 2.5 Myr, the model computes %Ro on each marker as a function of temperature (T), time (t), and percentage of fixed carbon (F). The initial %Ro of newly deposited sediments is computed using an assumed water–sediment interaction temperature assumed to be the same as the thermocline. The thermocline used in the model has been estimated using the data obtained and made freely available by International Argo Program and the national programmes that contribute to it for the region near Nankai (Fig. S3; https://argo.ucsd.edu, last access: 2 August 2023, https://www.ocean-ops.org, last access: 2 August 2023).
3.6 Model setup
The modelling domain is 3500 km wide and 350 km deep and is divided into 3484×401 nodes populated with ∼125 million markers (Fig. 1). The high resolution of 220 m (horizontal)×130 m (vertical) that we assign to the site of accretionary wedge evolution decreases steadily toward the edges of the modelling domain to a minimum resolution of 3000 m×3200 m. The simulation consists of an oceanic plate converging with a velocity of ∼5 cm yr−1 and subducting beneath a continental plate (Fig. 1). The convergence is prescribed internally using highly viscous nodes inside the oceanic and continental plates near the boundary of the models. The oceanic plate consists of a 1 km thick upper oceanic crust and a 7 km thick lower crust (Akuhara, 2018). The thickness of the oceanic lithosphere depends on its age, which is set to 20 Myr at the start of the simulation (Turcotte and Schubert, 2002). The initial age of the oceanic lithosphere corresponds to the age of the subducting lithosphere in the Nankai subduction margin (Zhao et al., 2021). Displacement along the megathrust, at the contact between subducting oceanic plate and the overriding continental plate, occurs in a relatively weak basal layer in accretionary wedges across the globe (Byrne and Fisher, 1990). We simulate this with a predefined configuration at the interplate, with a 350 m thick weak décollement below a sediment layer that is 1 km thick. The wedge forms above this interphase by the accretion of sediments against the continental plate. The continental plate consists of an upper and lower continental crust with thicknesses of ∼20 and ∼15 km respectively (Akuhara, 2018) and is underlain by a mantle lithosphere of ∼25 km. We use a thin (10 km) “sticky air” layer to overlay the top face of the rock strata inside the model which is a fluid with a low viscosity of 5×10¹⁷ Pa s, and a low density, similar to air (white in Fig. 1) or water (light blue in Fig. 1) (Crameri et al., 2012). The transition between the lithosphere and asthenosphere is prescribed to occur at 1300 ∘C. A weak layer is emplaced at the junction of both plates, which fails mechanically and leads to subduction initiation. All sediments (light and dark brown in Fig. 1) are rheologically identical, but colours are alternated in time to allow tracking the development of different geological structures. Readers are referred to Table 1 for the rheological and thermal properties of all the materials used. Note that in our models, we measure all distances from the point where the continental and oceanic plates are initially located, which is situated 1850 km from the right boundary of the modelling area. The terms “landward” and “seaward” indicate the relative direction towards the continental plate or the oceanic plate respectively. The “backstop” refers to the edge of the continental plate that buttresses the wedge and acts akin to an indenter for the accretionary wedge. The “forearc high” represents the highest point in the forearc zone, which includes both the accretionary wedge and the forearc basin.
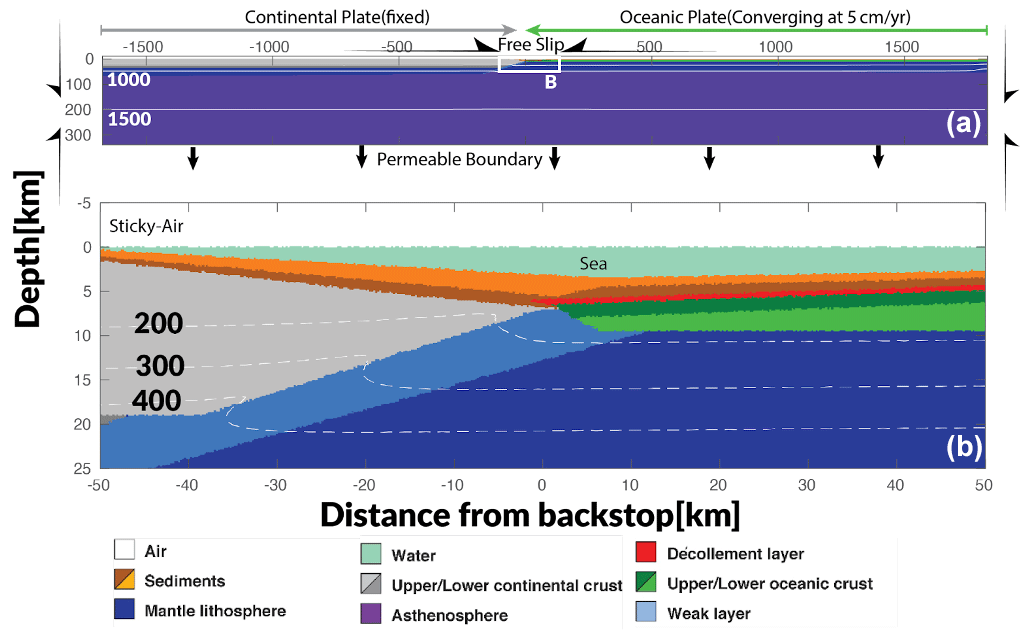
Figure 1Initial model setup. (a) The lithological and geothermal map of the whole computational domain with boundary conditions. (b) The zoomed lithological and geothermal map of the inset illustrates the junction of continental and oceanic plates. The colours represent different lithology of the materials used in the models, with upper and lower crust represented by light and dark grey and upper and lower oceanic crust represented by dark and light green. The arrows around the computational domain represent the imposed boundary conditions, while the white contour lines (dashed in the zoomed panel) show the geothermal gradients used for the initial model. The numbers on the white contour lines represent the temperature values in ∘C for the contour.
3.7 Experimental strategy
Here, we present a total of 10 simulations that vary in their effective basal friction or their effective sedimentation rate to discern patterns of thermal maturity evolution in wedge sediments. Models have no sedimentation and effective internal angle values for the décollement of φb=4.5, 7, 9.5, 12, and 14.5∘ respectively. The chosen range of effective décollement strength is well within the range of values postulated by several studies for the Nankai accretionary wedge (Tesei et al., 2021). The rest of the models () have a medium-strength décollement and variable effective sedimentation rate ranging from 0.1 to 0.9 mm yr−1. In all the models presented in this study, sedimentation is limited to the trench, extending from the sea to the land. Restricting sedimentation to the trench allows us to observe and analyse the length and frequency of thrust sheets, enabling comprehensive investigation of their role in determining sediment trajectories. With these models, we evaluate the particle trajectory and %Ro of accreting sediments as a function of décollement strength and sedimentation rate. To restrict the number of parameters influencing our observations, models have no erosion. Moreover, all models lack surface processes during the first ∼2.5 Myr and have sedimentation thereafter. Strain-softening has been modelled as a linear decrease in angle of friction (φ) and cohesion between a cumulative strain of 0.5 and 1.5. Sediments used in the model have an angle of friction (φ) of 30∘ before a cumulative strain of 0.5 and a strain-softened value of 20∘ after a threshold of 1.5 cumulative strain. Strain softening has been used in wedges to mimic the weakening of faults and shear zones due to lubrication, with values threshold taken from previous numerical studies (Hickman et al., 1995; Ruh et al., 2014).
In our models, subduction begins at 0.1 Myr by failure of the weak material between continental and oceanic plate (Figs. 2 and S4–S13, also see supporting information videos). Continued and sustained accretion of sediments against the deforming continental crust forms the accretionary wedge from the interplate contact landwards. After ∼5 Myr, all models develop a distinct wedge in agreement with the critical wedge theory (Davis et al., 1983). Surface slopes, measured by fitting a line in the surface of the wedge for every time step between 2.5 and 7.5 Myr and reported as mean ± standard deviation, increase systematically, as effective basal friction increases from ∼4.5 to ∼14.5∘ (Figs. 1 and S4–S13, Table 2, ). Whereas models with a relatively weaker décollement (as , φb=4.5∘) have surface slopes of 0.95 ± 0.3∘, models with very strong décollement (as , φb=14.5∘) have slopes as steep as 5.9 ± 1∘ (Table 2). Our estimations of surface slopes consistently exhibit an excess of approximately 1.5∘ compared to the surface slopes predicted by the critical wedge theory (Table 2). This is probably due to the penetration of weaker décollement material into high shear zones, resulting in faults that are weaker than the strain-softened wedge material.
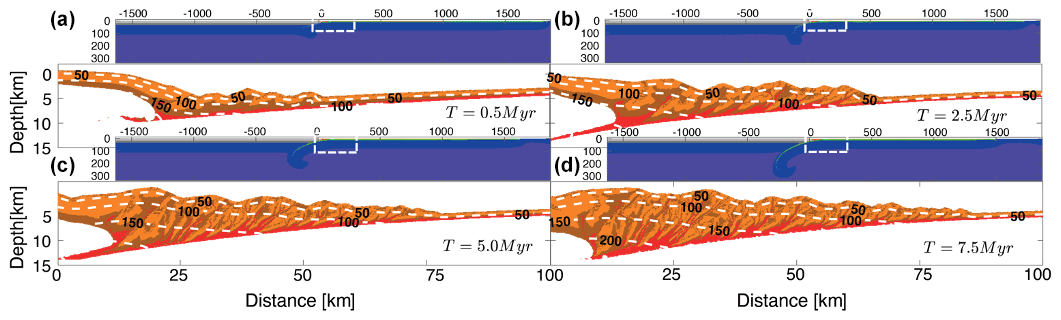
Figure 2Typical thermomechanical evolution of the accretionary wedge for model. The illustrated figure is for the model at (a) 0.5, (b) 2.5, (c) 5.0, and (d) 7.5 Myr. Similar figures for other models have been illustrated in supplementary images. The colour map for the panels is same as Fig. 1.
Models without trench sedimentation grow solely by accretion of incoming seafloor sediments, with frequent nucleation of frontal thrusts. Models with weaker décollements develop thrust sheets that are lengthier but remain active for shorter periods. This is clear when comparing, for models with increasingly strong décollement (), the average distance between first and second frontal thrusts, which are 15.5 ± 7.0, 12.1 ± 3.6, 8.8 ± 3.3, 8.7 ± 2.1, and 8.0 ± 1.8 km respectively. Increasing sedimentation rate also leads to an increase in thrust sheet length from 7.3 ± 1.1 km for model to 13.8 ± 7.8 km in model .
In models with similar basal friction, models with higher sedimentation rates have lengthier thrust sheets that remain active for longer periods (Table 2). Steeper surface slopes with increased décollement strengths and change in thrush sheet length with sedimentation and décollement strength are well-known effects that have been confirmed by previous numerical (Ruh et al., 2012) and analogue (Malavieille and Trullenque, 2009; Storti and Mcclay, 1995) models. All the reported values are mean ± standard deviation values recorded between 2.5 and 7.5 Myr in individual models. All models exhibit a temperature gradient that corresponds well with the temperature profile observed in the boreholes at IODP Site C0002 in the Kumano forearc basin, on top of the Nankai accretionary wedge (Fig. S14).
4.1 Thermal maturity of the wedge
Sediments are more thermally mature in wedges that have a higher sedimentation rate or décollement strength. For example, the mean %Ro of simulations for wedges with the highest sedimentation is 12 % higher (0.75) than in those without sedimentation (, Table 2, Fig. 3). Similarly, simulations of wedges with the strongest décollement have the highest mean %Ro (0.94) of all the simulations presented in this study.
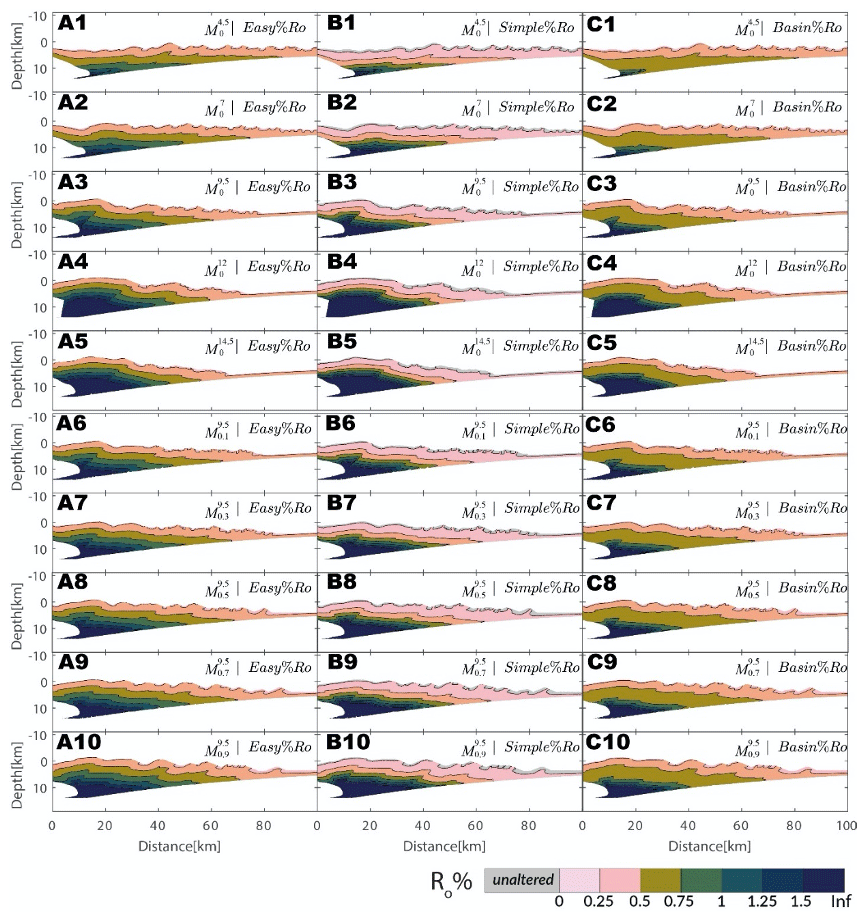
Figure 3Distribution of thermal maturity for different models at ∼6.0 Myr (3.5 Myr of thermal maturation). Panels A1–A5 show the thermal maturity distribution (computed using Easy%Ro) in subduction wedges of models as a function of décollement strength respectively. Panels A6–A10 show the thermal maturity distribution in subduction wedges of models function of sedimentation rate respectively. The grey colour of the markers indicate that no thermal maturity change in these sediments occurred. Panels B1–B10 and C1–C10 similarly show the thermal maturity distribution in subduction wedges computed using Simple%Ro and Basin%Ro, respectively.
Thermal maturity values increase with depth and landward distance from the trench to the forearc high irrespective of the décollement strength, sedimentation rates, and method of thermal maturity computation (Figs. 3 and 4). The absolute value of %Ro and the rate at which thermal maturity values increase landward from the trench are larger for wedges with high décollement strength (Fig. 4A). For wedges characterised by the same décollement strength but higher trench sedimentation, we observe that the rate of thermal maturity increases in a landward direction from the trench and remains consistent across these wedges (Fig. 4B). Comparing the values of %Ro along a horizontal marker at the depth of trench in several models emphasises this result; the model with the highest décollement strength reaches a maximum %Ro of 1.25 and has the highest rate of landward increase in thermal maturity (Fig. 4A). However, all models with similar décollement strength but different sedimentation do not visibly vary in their rate or magnitude of landward increase in thermal maturity. All models show a decrease in thermal maturity landward of the forearc high, commonly 0.2 %Ro. Other interesting observations that we explore below are the increased thermal maturity occurring in the vicinity of thrusts and the reversal in sediment maturity around out-of-sequence thrust active over longer times visible across several models (e.g. Fig. 3).
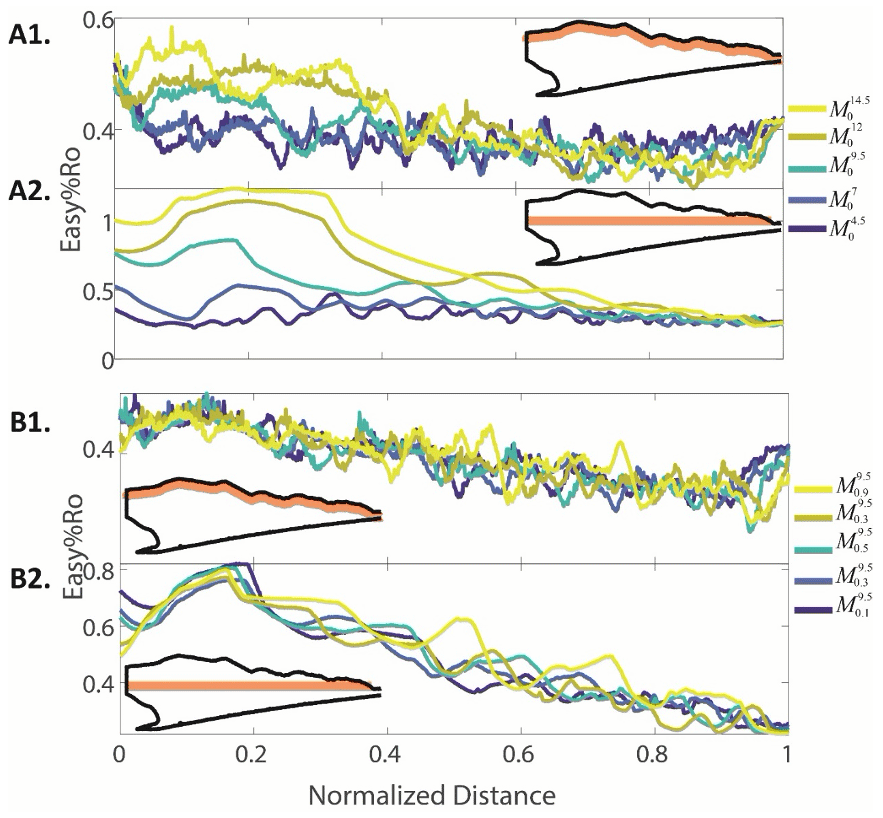
Figure 4The variation in %Ro for a horizon as indicated by the orange band in the inset at 7.5 Myr. Panels A1 and A2 show all the models with different décollement strength. Panels B1 and B2 show all the models with different sedimentation rates. Horizons in panels A1 and B1 are located at 1 km depth from the surface, while in panels A2 and B2 the horizons are horizontal zones located at the trench depth. The horizontal distance from the backstop is normalised by the wedge length. Horizontal distance 0 represents the fixed backstop and 1 represents the trench.
The magnitude of %Ro varies consistently among Easy%Ro, Simple%Ro, and Basin%Ro. On average Easy%Ro had the smallest values, followed very closely by Basin%Ro (with an average difference of only 0.02). However, Simple%Ro had the highest average value of thermal maturity, being 0.16 and 0.13 higher than Easy%Ro and Basin%Ro (Fig. 3).
4.2 Sediment trajectory inside the wedge
In wedges with a higher décollement strength or sedimentation rate, sediments tend to follow high-maturity paths in larger proportions. We demonstrate this effect by creating a map of the thermal maturity of sediments at 7.5 Myr of the model run, mapped to their spatial position at 2.5 My of the model run to analyse the spatial correlation between sediment position (depth and distance) from the trench and thermal maturity (Fig. 5). We also show the mean thermal maturity attained by sediments at a given horizontal distance from the trench during this period by a dashed black line in Fig. 5. The scatter plot shows sharp changes in eventual thermal maturity with horizontal distance from the trench that relate to changes in sediment trajectory. The mean thermal maturity is also variable along the horizontal length of the wedge and has a periodicity (Λ) increasing in distance with higher sedimentation rate but relatively constant with changing basal friction (Fig. 5). The periodicity of mean %Ro was computed by finding the average wavelength of the auto-correlated mean %Ro. Whereas the mean thermal maturity has a short periodicity of ∼7.2 km for the model with no sedimentation rates, the model shows the longest periodicity of 21 km. However, for all models with no sedimentation (), the periodicity remains relatively consistent in the range of 7–8 km.
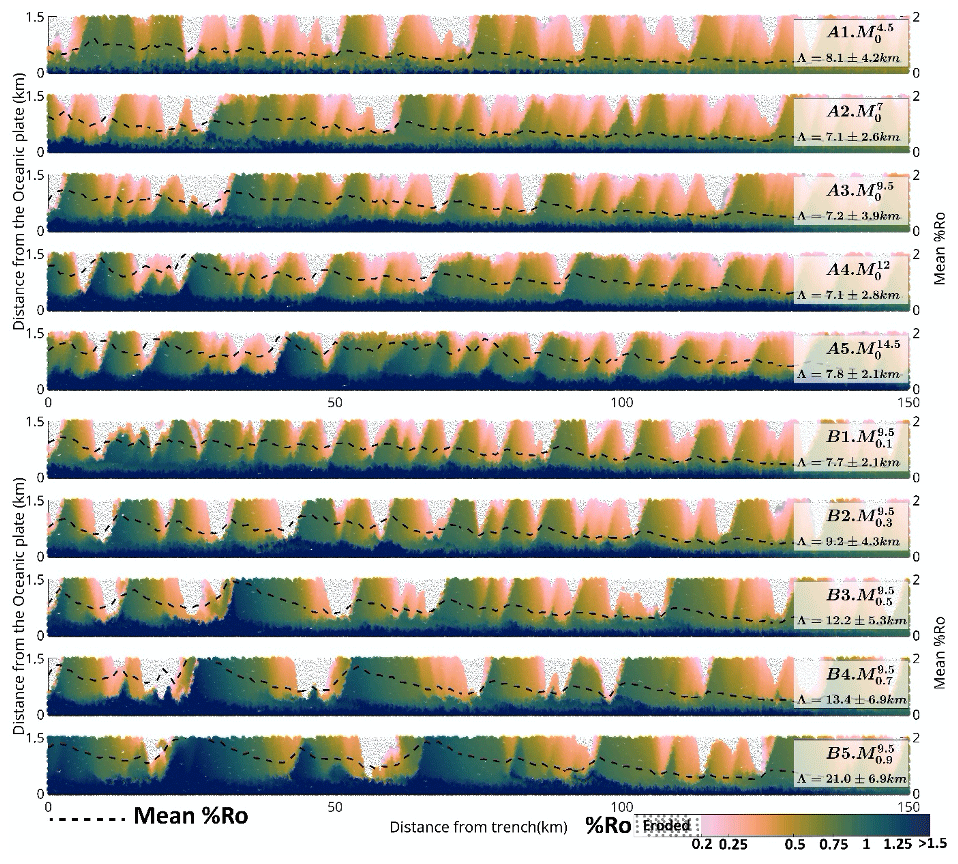
Figure 5Map of thermal maturity at 7.5 Myr mapped to sediments at 2.5 Myr. Panels A1–A5 and B1–B5 show the mapping for models – and –. The vertical axis (distance from the oceanic plate) has been corrected for the bending of the plate. The horizontal axis represents the distance of sediments from the trench. The grey colour of the markers indicates that these sediments have been eroded/reworked due to slope failure. The dashed black line represents the mean %Ro attained sediment at a given distance from the trench. Λ represents the horizontal periodicity in mean %Ro for the given model.
Figure 3 also represents the distribution of trajectories that exist in an accretionary wedge and how these trajectories get impacted under trench sedimentation (a subset of these trajectories can be viewed in Fig. S15). Whereas in wedges with weak décollements (), none of the shallowest half of incoming sediments reach %Ro>1 in 5 Myr, 2 % of sediments reach this value in wedges with strong décollement (). The effects of décollement strength in the thermal maturity of sediments can be quantified as well at deeper levels, with one-eighth vs. more than one-half of the sediments surpassing values of %Ro=1 for the deepest half of incoming sediments (12 % and 54 % respectively) in weak vs. strong décollement wedges ( vs. ) respectively. In wedges for the model without sedimentation (), the top half of the incoming sediments fail to achieve %Ro>1, as opposed to ∼15 % of them reaching %Ro>1 in the models with a sedimentation rate of 0.9 mm yr−1 (). In sum, the proportion of sediments in the top half and bottom half of the wedge that reach high maturity steadily increases with both sedimentation rate and décollement strength (Table 2).
4.3 Patterns of trajectory and thermal maturity in incoming sediments
The diversity in the trajectory of sediments in the wedge leads to a plethora of pathways in which the sediments can become thermally mature and thus introduces epistemic uncertainty in the estimation of maximum exposure temperature. Figure 6 captures this uncertainty, where we plot the maximum exposure temperature as a function of %Ro for all the models simulated in this study. The colours of individual markers represent the depth of the markers normalised by the thickness of the wedge represented as Yn (See Fig. S16 for more details). We find that almost all the models show a remarkable similarity in their relationship between maximum exposure temperature and %Ro (for individual models please see Fig. S16) and differ mostly in their proportion of sediments with extreme values of %Ro. We observe that the typical uncertainty in maximum exposure temperature increases with an increase in values of %Ro with the ∼15 ∘C interval at around %Ro=0.2 compared to the ∼33 ∘C interval at %Ro=3 (both for 95 % confidence interval, Fig. 6b). Moreover, we observe that incorporating information about the normalised depth of sediments (Yn) significantly aids in constraining the maximum exposure temperature. For instance, although the overall uncertainty at %Ro=1, is ∼23 ∘C, for sediments with a Yn of 0.2–0.4 the uncertainty greatly reduces to only ∼10.5 ∘C. Thus, the range of thermal maturity values for sediments clearly has a large correlation with their trajectories.
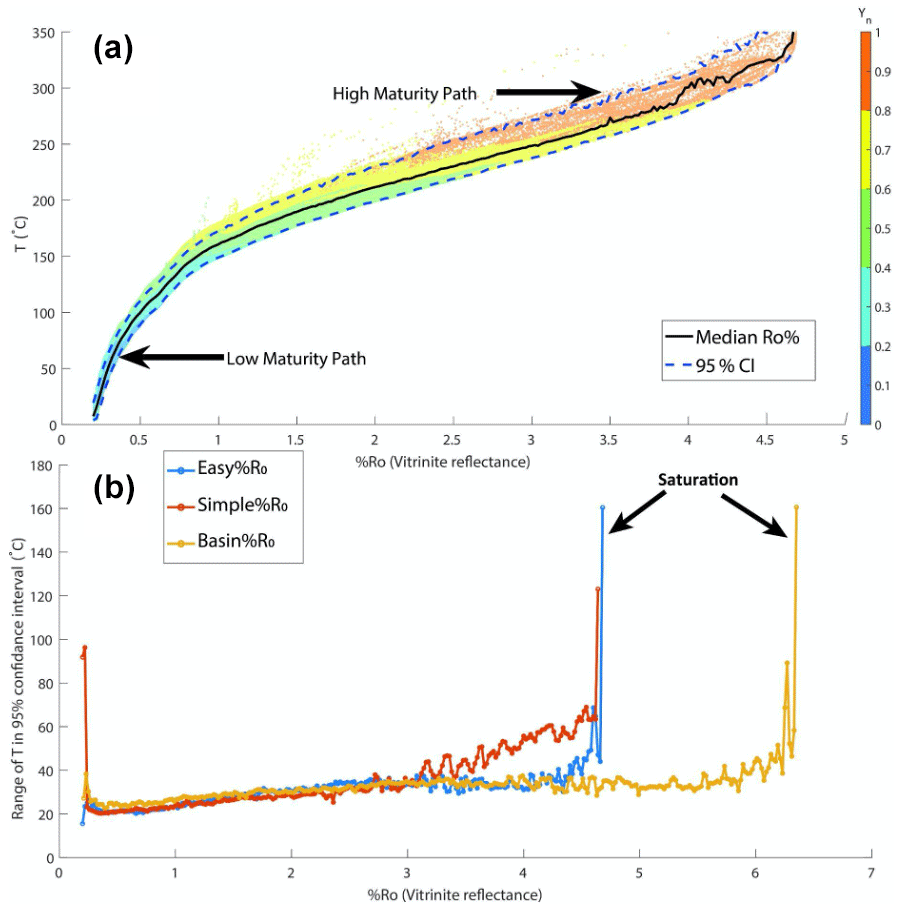
Figure 6(a) Vitrinite reflectance (%Ro) vs. maximum exposure temperature in all models. The colours in panel a represent the depth of the sediments at 7.5 Myr normalised by the thickness of the wedge (Yn). (b) Range of 95 % CI for Easy%Ro, Simple%Ro, and Basin%Ro. Yn is the depth of the marker from the surface normalised by the thickness (vertical extent) of the wedge at the location of the marker. Please see Fig. S16b for computation of Yn.
4.4 Comparison of Easy%Ro, Simple%Ro, and Basin%Ro
The usage of Easy%Ro, Simple%Ro, and Basin%Ro in our models provides us with a distinct perspective on the comparative (dis)advantages of each method in estimating thermal maturity values. The non-uniqueness of maximum exposure temperatures for the same values of %Ro arises from the variation in sediment trajectory and thermal exposure. This diversity among sediment markers results in multiple markers attaining the same level of thermal maturity. We refer to the range of maximum exposure temperatures corresponding to similar %Ro values as the uncertainty in maximum exposure temperatures. Uncertainty for all three models increases with increasing %Ro from ∼20 to ∼25 ∘C at approx. %Ro=0.3 to ∼35 ∘C at %Ro=3.5 (Fig. 6b). Easy%Ro, probably the best-recognised method of thermal maturity computation, yields the best constraint on uncertainty for very small changes nearing %Ro<1. For the values of %Ro between 1 and 3, all models yield very similar uncertainty, with Simple%Ro yielding the most constrained exposure temperatures (Fig. 6b). However, beyond %Ro=3, Simple%Ro becomes unreliable, with uncertainty in exposure temperatures as high as 55 ∘C at %Ro=4. Easy%Ro yields an uncertainty range of ∼37 ∘C until %Ro=4.4, and starts to be unreliable above this value. Basin%Ro remains consistent until a very high value of approx. %Ro=6, and thus provides the best constraint on the widest range of values of thermal maturity (Fig. 6b).
The thermomechanical models presented in this study provide (a) an explanation for the trend in thermal maturity observed in accretionary wedges, (b) a new venue to explore the uncertainty in the estimation of maximum exposure temperature using vitrinite reflectance, and (c) an estimate of the minimum lateral distance between the trench and the location of a paleo-thermal anomaly on the subduction plate for it to identified after accretion.
5.1 Thermal maturity distribution and importance of thrusting in wedges
Collectively, our results support a general increase in thermal maturity with depth and landward in accretionary wedges. The thermal maturity increase with depth is primarily the result of progressively larger exposures to higher temperatures as depth of burial increases. Conversely, the landward increase in thermal maturity is caused by the long-term deformation of sediments accumulated at older times and the exhumation of sediments that were under-thrusted as they met the backstop. Our models demonstrate that the rate of landward thermal maturity increase is faster for thicker wedges, both for the case of sediment near the surface and deep inside the wedge (Fig. 4). This can be attributed to a larger proportion of sediments being exposed to higher temperatures over an extended duration within thicker wedges, but validating this result with natural observations remains challenging given the very limited availability of thermal maturity data across natural wedges. Accretionary wedges in our models can be simplified as a system where the subducting oceanic plate acts as the primary heat source, while the seafloor acts as a heat sink. The heat generated through other sources such as shear heating, radioactivity, and advection is relatively insignificant compared to the heat originating from the younger oceanic plate. In our simulations, we consider a relatively younger and hotter oceanic plate of approximately 20 Myr, which is consistent with the accretionary wedge in the Nankai region adjacent to the Kumano forearc basin (Zhao et al., 2021). Given that the convergence rate remains constant across all models, the heat received from the oceanic plate should remain relatively similar. However, as the wedge thickness increases, the temperature gradient between the boundaries of the wedge must become gentler, resulting in a larger portion of the wedge experiencing elevated temperatures. Moreover, frequent advection from the subduction channel also results in elevated temperatures in the core of the wedge. Finally, models with thicker wedges typically exhibit higher décollement strength, leading to increased shear heating at the base of the wedge. Observational studies conducted by Yamano et al. (1992) on the thermal structure of the Nankai accretionary prism have further highlighted that the landward increase in prism thickness is the most significant factor contributing to temperature variations within the wedge. Consequently, the sustained higher temperatures within thicker wedges over time would lead to a higher rate of landward thermal maturity.
Our models show two cases where the above-mentioned trend in thermal maturity is relevantly altered, which we name “on-fault increase” and “fault-block inversion”. For instance, Fig. 3 shows a steep rise in the thermal maturity of sediments at fault sites. Thermal maturity inversions by thrusting, which are commonplace in accretionary contexts, are the primary cause of thermal maturity differentiation among wedges with similar paleo-thermal structures. During fault-block inversions, the positive gradient of thermal maturity with depth is inverted as relatively mature sediments are thrusted over less mature sediments (Underwood et al., 1992). The strong differentiation in the trajectory of sediments led by thrusting has a larger influence over thermal maturity than their burial depth or their in-wedge location. This novel inference has probably remained concealed thus far due to the large number of parameters that condition thrust development, frequency, length, and thermal state and due to the lack of high-resolution thermal maturity data.
The thermal maturity that incoming sediments reach also varies periodically as a function of thrust frequency. By examining the lateral and vertical position of incoming sediments and their eventual thermal maturity, we can deduce that the overall movement of sediments in the wedge is predominantly layered but not stationary over time. Changes in the depth of the thermal maturity boundary are less frequent and have larger amplitudes with increased décollement strength, and especially, increased sedimentation rates (Fig. 5). The periodicity in the thermal maturity boundary marks the periodic oscillation of the predominant trajectory followed by incoming sediments, i.e. between accretion (low thermal-maturity path) and under-thrusting (high thermal-maturity path). As a result, it should also strongly correlate with the periodicity observed in the evolution of forearc topography (Menant et al., 2020) and the frequency of thrust formation in our models. This is expected given that thrusts are active over longer mean times and that they channel material toward the décollement more efficiently in wedges with stronger décollement or increased sedimentation. While sediments at internal and higher structural positions of the wedge are translated toward the surface and have a lower thermal maturity, sediments at external and lower structural positions are translated toward the décollement and have a relatively higher maturity. The entire cycle is repeated with the formation of new in-sequence thrust.
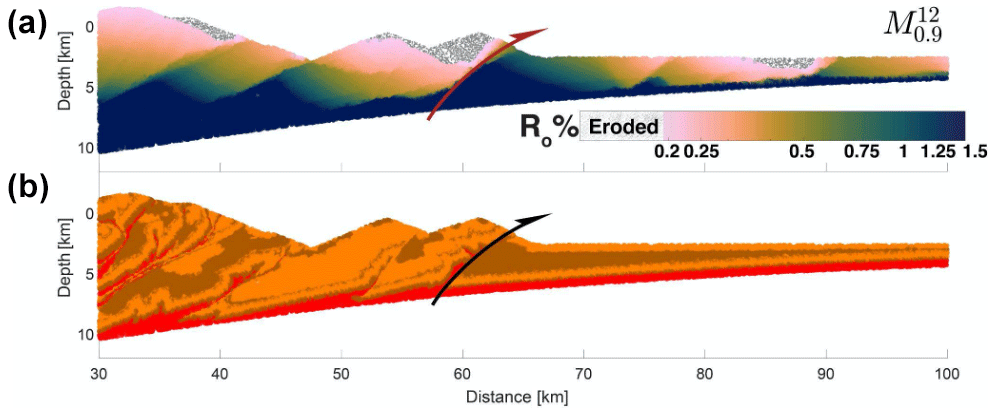
Figure 7Mapping of eventual thermal maturity (vitrinite reflectance at 7.5 Myr) to the location of same markers at ∼4 Myr in model . Panel a shows the values of thermal maturity for the markers, while the lithology of the wedge is shown in panel b. The half arrow represents the active frontal thrust. The sediments which were eroded by 7.5 Myr but exist at 4 Myr have been marked as eroded using grey dots.
This is a relevant observation for it typifies the causality of particular sediment grains following a high- or low-maturity path, a long-standing unanswered question (Miyakawa et al., 2019). We corroborate this observation by analysing the terminal thermal maturity of sediments across a frontal thrust active at a younger age. An example in Fig. 7 shows the thermal maturity of sediments at ∼7.5 Myr across a thrust active at ∼4 Myr. Whereas this occurs for all thrusts in the wedge, the frontal thrust is particularly pronounced in partitioning sediments into the high- and low-maturity paths. Thermal maturity correlates with sediment depth weakly near faults and more strongly away from them. The distance of sediment from the frontal thrust dictates the trajectory of sediment grains, and as a result, the pressure–temperature conditions to which they are exposed.
Our results show the need to consider all factors influencing fault frequency when inferring the geothermal history of contractional terrains by means of thermal maturity. In this study, we have considered solely how décollement strength and the rate of trench sedimentation vary the frequency, architecture, and overall behaviour of thrusts, and the frontal thrust, as the wedge evolves. Fortunately, this predictive exercise should be relatively straightforward, for the impact of these external factors on the fault structure of wedges has been established (Fillon and van der Beek, 2012; Mannu et al., 2016, 2017; Mugnier et al., 1997; Simpson, 2010; Storti and Mcclay, 1995), and the effect of each of these factors can be accounted for when assessing the trajectory of sediments and the distribution of thermal maturity in accretionary wedges. It is nevertheless important to note that the frequency of faults in a wedge can be impacted by many other factors, including hinterland sedimentation (Storti and Mcclay, 1995; Simpson, 2010; Fernández-Blanco et al., 2020), erosion (Konstantinovskaia, 2005; Willett, 1992), and seafloor topography (Dominguez et al., 2000).
5.2 Implications of thermal maturity evolution in a subduction wedge
The main implications of this contribution emerge from its predictive power. Our approach can predict to a precise degree the thermal maturity of sediments and the uncertainty associated with the maximum exposure temperature in accretionary contexts with known structuration. A more accurate quantification of the thermal evolution and thermal state of accreted sediments reduces the uncertainties attached to the location of temperature-led transformations of organic material into hydrocarbons in subduction margins and other accretionary contexts. Such increased accuracy in the distribution of thermally mature sediments may also be applied for improved assessments of the evolution in time of any other geothermal process, including seismic slip, magmatic and metamorphic extent, porosity, compaction, and diagenesis of sediments, as well as the reconstruction of convergent margins in general (Bostick and Pawlewicz, 1984; Ferreiro Mählmann and Le Bayon, 2016; Rabinowitz et al., 2020; Sakaguchi et al., 2011; Totten and Blatt, 1993; Underwood et al., 1992).
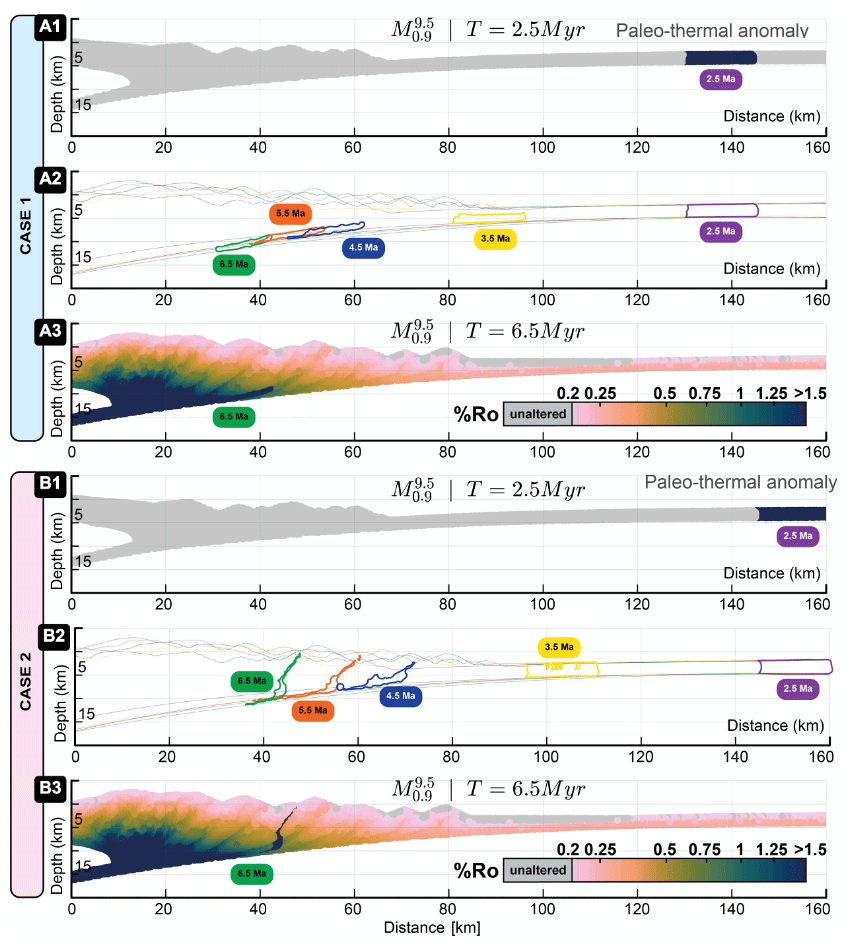
Figure 8Position dependency of thermal maturity preservation. (A1) Distribution of %Ro at 2.5 Myr with a paleo-thermal anomaly emplaced at 130–145 km from the backstop. (A2) The evolution of the emplaced paleo-thermal anomaly from 2.5 to 6.5 Myr in case 1. (A3) Distribution of %Ro at 2.5 Myr. (B1) Distribution of %Ro at 2.5 Myr with a paleo-thermal anomaly emplaced at 145–160 km from the backstop. (B2) The evolution of the emplaced paleo-thermal anomaly from 2.5 to 6.5 Myr in case 2. (B3) Distribution of %Ro at 2.5 Myr with a paleo-thermal anomaly emplaced at 145–160 km from the backstop.
Our simulations also imply that the paleo-thermal information stored in the incoming sediments can only be retrieved if sediments are at appropriate locations with respect to emergent thrusts. We illustrate this using two runs of the same model and tracking an artificial thermal anomaly imposed on incoming sediments at two different locations (Fig. 8). This hypothetical thermal anomaly can be conceptualised as any alteration of the thermal maturity profile of incoming sediments, for example, elevated heat flows by an antecedent magmatic intrusion. While the change in %Ro associated with the short-lived thermal anomaly results in abnormally high values of thermal maturity in both sediment packages, it can only be retrieved for the end-model run of sediments located further from the trench (those in Fig. 8B3. Contrarily, the end-model run of sediments closer to the trench (those in Fig. 8A3) shows no signs of discontinuity in the thermal maturity distribution of the wedge. This is because we deliberately placed the thermal anomaly at sites that evolve at two structural locations during the model run, i.e. above and below a yet-undeveloped frontal thrust (Fig. 8). The sediment sector affected by the thermal anomaly closer to the trench is over-thrusted by the frontal thrust and remains in a footwall location thereafter (Fig. 8A1–A3). In contrast, the homologous sedimentary package further away from the trench is accreted by the frontal thrust and remains in a hanging-wall location (Fig. 8B3). Thus, the preservation of the record of an antecedent thermal anomaly is only possible in the former case. We further note that, in our simulations, the entire vertical column of sediments records the thermal anomaly, while in nature, the anomaly may affect only sediments at the deeper locations of the sedimentary pile, which are in turn the sediments that most likely to follow a high-maturity path. We thus regard the possibility of retrieving such antecedent geothermal information as minimal.
Finally, among the three methods of %Ro computation, Easy%Ro and Basin%Ro are more consistent and well-constrained on a wide range of thermal maturities in comparison to Simple%Ro, which seems to be particularly useful for a smaller range of thermal maturity values. This simply illustrates the fact that while Easy%Ro and Basin%Ro computation deals with several parallel reactions related to the maturity of kerogen (and hence multiple activation energies), Simple%Ro is based on best-fitted single activation energy, and hence yields large confidence intervals at the extreme %Ro values. Additionally, the inclusion of the higher activation energy reactions in Basin%Ro makes it the best-suited formulation for sediments at the deeper and shear zone sediments which usually get saturated using Easy%Ro.
5.3 Comparisons to previous numerical studies
The thermomechanical models presented in this study offer a dynamic representation of trajectories within the wedge. Although the averaged trends in thermal structure and sediment trajectories remain consistent, there are short-term dynamic fluctuations near the frontal thrust. These fluctuations contribute to a diverse range of sediment paths along the depth of the incoming sediments. Miyakawa et al. (2019) conducted a similar study, modelling vitrinite reflectance using Simple%Ro and a stationary thermal field, which also resulted in an increase in thermal maturity towards the continent and thermal maturity inversions due to thrusting. However, the use of Simple%Ro led to premature saturation and the disappearance of thermal maturity variations at a shallower depth in their model.
We can compare our findings with other geodynamic models that examine the thermal structure of the wedge, although there are only a limited number of numerical models of thermal maturity in wedges. Pajang et al. (2022) recently investigated the distribution of the brittle–ductile transition in wedges and proposed a region dominated by viscous shear near the backstop, with the wedge core reaching temperatures of 450 ∘C and typically containing forearc basins. Although trench sedimentation in our model does not result in the formation of forearc basins, the overall flattening of the wedge slope and the high vitrinite reflectance in the core align with consistent structures. Moreover, the presence of highly mature sediments in the wedge core suggests compacted sediments with greater strength and higher P-wave velocity. Although empirical studies have shown a strong correlation between P-wave velocity and thermal maturity estimates for depths of up to 4 km (Baig et al., 2016; Mallick and Raju, 1995), the exact nature of this correlation may vary depending on the specific location. Nevertheless, the patterns of thermal maturity values in the wedge core in our models also correspond to the patterns of P-wave velocity observed in the Nankai and Hikurangi margins (Górszczyk et al., 2019; Nakanishi et al., 2018; Dewing and Sanei, 2009; Arai et al., 2020).
Two modes of sediment trajectory evolution, from incoming sediment to their position inside the wedge, are generally considered: depth dependence sediment trajectories, as observed in studies by Mulugeta and Koyi (1992) and Hori and Sakaguchi (2011), and crossover exhumation pathways, as illustrated by Konstantinovskaia (2005) and Miyakawa et al. (2019). We consider the latter as non-stationary sediment trajectories that vary with time and cut across sediment trajectories of sediments previously located at the same spatial position. Our models show that both modes of sediment trajectories are valid and that changes in trajectory patterns leading to path crossovers are controlled by the horizontal distance of sediments from the frontal thrust. Starting at a threshold distance from the trench, sediments at different depths follow laminar paths along different trajectories within the wedge. Laminar-type trajectories can be reproduced in a broad range of simulations and are particularly common in models with low sedimentation and décollement strengths. However, the depth dependence of sedimentary paths varies periodically as a function of distance from the trench of specific sedimentary packages (Fig. 5). This effect, which is particularly marked in the neighbourhood of the frontal thrust, explains the crossover paths for incoming sedimentary packages at similar depths but different horizontal locations (Konstantinovskaia et al., 2005). Therefore, thrust faults in the wedge act as the primary agent controlling whether sediments sustain depth-controlled laminar flow or sediment mixing.
5.4 Comparisons to natural wedges
Our models achieve thermal maturity distributions that are in good agreement with their natural analogues, despite several relevant assumptions. Our models are very simplified with regard to their natural analogues, with assumptions such as no elasticity, predefined décollement, no erosion, and simple and uniform rheology. Also, our models have an insufficient resolution for small-scale fault activity and lack empirical relations to simulate the compaction of sediments and multiscale fluid flow. Although these assumptions hinder a wholesale comparison between our simulations and natural examples of accretionary wedges, we still find an acceptable agreement between our model and natural observations, primarily due to simulations that have a temperature evolution assimilating empirical data and a fine spatiotemporal resolution. Our estimated %Ro values for the model are in very good agreement with those measured for the borehole C0002 Nankai accretionary wedge by Fukuchi et al. (2017) (Fig. 9). The maximum exposure temperature estimated from the observed thermal maturity for the C0002 borehole also strongly correlates with maximum temperatures recorded on markers in the model with similar thermal maturity with 95 % confidence (Fig. S17). However, our result is reliant on the empirical thermal conductivity profiles estimated for the C0002 borehole, which does not show any large thermal discontinuity between the forearc basin and inner wedge that has been observed in fossil accretionary wedges (e.g. Underwood et al., 1988).
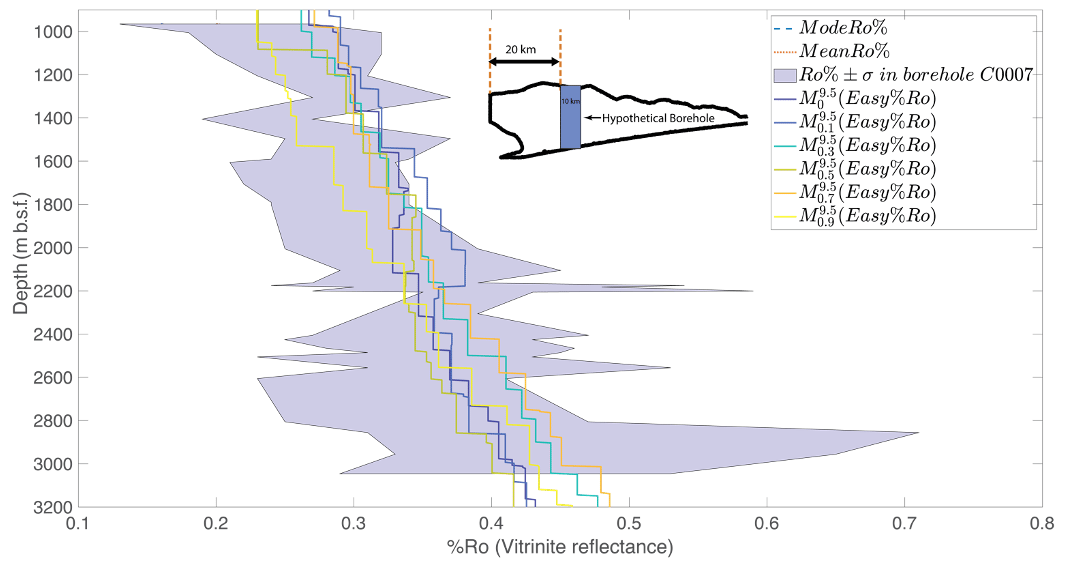
Figure 9Depth vs. thermal maturity (%Ro). The shaded (in violet) region shows the range of observed Ro% (mean ± 1 SD) from the C0002 borehole; coloured lines represent the values in models sampled from a 10 km wide hypothetical borehole 20 km seaward of the backstop as shown in the inset.
Landward increase in thermal maturity is well documented in studies of the Japan Trench, at the Miura–Boso plate subduction margin, the fold-and-thrust belts Western Foothills complex in western Taiwan, the Mesozoic accretionary prism in the Franciscan subduction complex in northern California, and the Cretaceous Shimanto accretionary complex in Nankai subduction margin (Kamiya et al., 2017; Sakaguchi et al., 2007; Underwood et al., 1989; Sakaguchi, 1999). The natural wedges mentioned above display vitrinite reflectance values with maximum %Ro values ranging from 0.2 to 4.0 near the surface, which is generally much higher than the near-surface %Ro values observed in our models. Underwood et al. (1988) suggested that this discrepancy is likely due to the ongoing process of progressive exhumation and erosion, leading to the exposure of deeper sections of the accretionary prism over time. As a result, younger wedges, such as those found in the Miura–Boso plate subduction margin, exhibit a much closer resemblance to the %Ro values near the surface of our models.
On-fault increases in vitrinite reflectance are well also documented in nature, as for boreholes C0004 and C0007, which sample the megasplay fault in Nankai accretionary margin (Sakaguchi et al., 2011). The vitrinite reflectance data from the megasplay and frontal thrusts in Nankai indicate the faults reach a temperature well in excess of 300 ∘C during an earthquake, much larger than the background thermal field. Therefore, on-fault increases in thermal maturity are comparatively smaller in our simulations and lack the marked increase in %Ro observed at fault sites in nature. We consider this is due to a discrepancy in the rate of change in thermal diffusion occurring in simulated thrusts, given that our models develop much wider fault zones than their natural equivalents. For instance, the location of megasplay fault in C0007 borehole exhibits an unevenness within the high-reflectance zone with a maximum of approx. %Ro=1.9 (Sakaguchi et al., 2011). This is in line with the prediction by Fulton and Harris (2012) about the impact of fault thickness on change in vitrinite reflectance. Natural observations also exhibit a much higher incidence of on-fault increase in thermal maturity compared to our simulations, given that our models do not have sufficient spatial resolution to capture the large number of thin faults that develop inside the wedge.
Natural examples of fault-block inversion have been well-documented in natural settings, providing evidence of past thrust activity preserved in the shallower sections of the Nankai accretionary wedge. Sakaguchi (1999) reported the presence of step increments of thermal maturity, similar to increments in vitrinite reflectance in Figs. 3 and 4 across the faults. Other examples are the fault block inversion along the Fukase fault in the Shimanto accretionary wedge (Ohmori et al., 1997) and the inversion beneath the forearc basin in the Nankai accretionary wedge (Fukuchi et al., 2017).
Our study highlights that paleo-thermal anomalies that extend laterally beyond the average thrust spacing have a significantly higher likelihood of being retained in the final thermal maturity record of the wedge. This allows for several inferences. For example, the subduction of the Cretaceous ridge, as identified by Underwood et al. (1992) and Sakaguchi (1999), must have caused a substantial alteration in thermal maturity during the Kula–Pacific subduction in order to be discernible in vitrinite reflectance records. Likewise, we can anticipate the preservation of the paleo-thermal anomaly near Ashizuri in the southern Nankai wedge, which has high thrust frequency, in contrast to that at the Muroto transect, where thrust sheets are widely spaced. In the case of the accretionary wedge adjacent to the Boso Peninsula, Kamiya et al. (2017) proposed the emplacement of an ophiolite complex beneath the Miura group. Our findings indicate that the preservation of the thermal-advection heating event coincided with a decrease in trench sedimentation. This likely led to an increase in the thrust frequency, which facilitated the preservation of the thermal-advection heating event in the thermal maturity data.
This study demonstrates how contractional faults alter the paths of sediments as they accrete and how this fundamentally controls the distribution of the thermal maturity of sediments in accretionary wedges and emphasises the role that sedimentation rate and interplate contact strength have in such distribution. The increased resolution of our approach leads to findings that have relevant implications. For example, the geothermal history that can be retrieved from the thermal maturity of sediments in drills, i.e. at the shallow wedge, provides, at best, an incomplete record that is skewed towards the thermal evolution of sediments near the trench. Coevally, relevant sectors of sediments located further seaward, when not subducted, follow high-maturity paths that overwrite their antecedent thermal history. Finally, this study also provides a first-order uncertainty measure for the thermal maturity of sediments based on the diversity in their trajectory.
I2VIS and vitrinite reflection computation and visualisation codes can be made available by the corresponding author on request.
The supplement related to this article is available online at: https://doi.org/10.5194/se-15-1-2024-supplement.
UM was responsible for the conceptualisation of the work, original draft writing, and administration of the paper. DFB contributed to figure visualisation and writing and review of the paper. MK and AM contributed to conceptualisation and review. TG provided the I2VIS code and contributed to the review of the paper.
At least one of the (co-)authors is a member of the editorial board of Solid Earth. The peer-review process was guided by an independent editor, and the authors also have no other competing interests to declare.
Publisher's note: Copernicus Publications remains neutral with regard to jurisdictional claims made in the text, published maps, institutional affiliations, or any other geographical representation in this paper. While Copernicus Publications makes every effort to include appropriate place names, the final responsibility lies with the authors.
The authors want to acknowledge the topic editor Susanne Buiter as well as the reviewers Jonas B. Ruh and David Hindle for constructive and intriguing reviews and feedback on the original and revised article.
This research has been supported by the Department of Science and Technology, Ministry of Science and Technology, India (grant no. IFA18-EAS71), and the Earthquake Research Institute, University of Tokyo (Visiting Faculty-2019).
This paper was edited by Susanne Buiter and reviewed by Jonas B. Ruh and David Hindle.
Akuhara, T.: Fluid Distribution Along the Nankai-Trough Megathrust Fault off the Kii Peninsula: Inferred from Receiver Function Analysis, Springer, 94 pp., https://doi.org/10.1007/978-981-10-8174-3, 2018.
Arai, R., Kodaira, S., Henrys, S., Bangs, N., Obana, K., Fujie, G., Miura, S., Barker, D., Bassett, D., Bell, R., Mochizuki, K., Kellett, R., Stucker, V., Fry, B., and NZ3D Team: Three-dimensional P wave velocity structure of the northern hikurangi margin from the NZ3D experiment: Evidence for fault-bound anisotropy, J. Geophys. Res.-Sol. Ea., 125, e2020JB020433, https://doi.org/10.1029/2020JB020433, 2020.
Baig, I., Faleide, J. I., Jahren, J., and Mondol, N. H.: Cenozoic exhumation on the southwestern Barents Shelf: Estimates and uncertainties constrained from compaction and thermal maturity analyses, Mar. Petrol. Geol., 73, 105–130, 2016.
Bostick, N. H. and Pawlewicz, M. J.: Paleotemperatures based on vitrinite reflectance of shales and limestone in igneous dike aureoles in the Upper Cretaceous Pierre shale, Walsenburg, Colorado, https://archives.datapages.com/data/rmag/SourceRocks84/bostick.htm (last access: 30 December 2023), 1984.
Burnham, A. K. and Sweeney, J. J.: A chemical kinetic model of vitrinite maturation and reflectance, Geochim. Cosmochim. Ac., 53, 2649–2657, 1989.
Byrne, T. and Fisher, D.: Evidence for a weak and overpressured décollement beneath sediment-dominated accretionary prisms, J. Geophys. Res., 95, 9081–9097, https://doi.org/10.1029/JB095iB06p09081, 1990.
Chi, W.-C. and Reed, D. L.: Evolution of shallow, crustal thermal structure from subduction to collision: An example from Taiwan, GSA Bulletin, 120, 679–690, 2008.
Clauser, C. and Huenges, E.: Thermal conductivity of rocks and minerals. in: Rock physics and phase relations: a handbook of physical constants, edited by: Ahrens, T. J., chap. 3, AGU, Washington, D.C., 105–126, https://doi.org/10.1029/RF003, 1995.
Crameri, F., Tackley, P. J., Meilick, I., Gerya, T. V., and Kaus, B. J. P.: A free plate surface and weak oceanic crust produce single-sided subduction on Earth, Geophys. Res. Lett., 39, 03306, https://doi.org/10.1029/2011GL050046, 2012.
Davis, D., Suppe, J., and Dahlen, F. A.: Mechanics of fold-and-thrust belts and accretionary wedges, J. Geophys. Res., 88, 1153–1172, 1983.
DeMets, C., Gordon, R. G., and Argus, D. F.: Geologically current plate motions, Geophys. J. Int., 181, 1–80, 2010.
Dewing, K. and Sanei, H.: Analysis of large thermal maturity datasets: Examples from the Canadian Arctic Islands, Int. J. Coal Geol., 77, 436–448, 2009.
Dominguez, S., Malavieille, J., and Lallemand, S. E.: Deformation of accretionary wedges in response to seamount subduction: Insights from sandbox experiments, Tectonics, 19, 182–196, 2000.
Fernández-Blanco, D., Mannu, U., Bertotti, G., and Willett, S. D.: Forearc high uplift by lower crustal flow during growth of the Cyprus-Anatolian margin, Earth Planet. Sc. Lett., 544, 116314, https://doi.org/10.1016/j.epsl.2020.116314, 2020.
Ferreiro Mählmann, R. and Le Bayon, R.: Vitrinite and vitrinite like solid bitumen reflectance in thermal maturity studies: Correlations from diagenesis to incipient metamorphism in different geodynamic settings, Int. J. Coal Geol., 157, 52–73, 2016.
Fillon, C. and van der Beek, P.: Post-orogenic evolution of the southern Pyrenees: constraints from inverse thermo-kinematic modelling of low-temperature thermochronology data, Basin Res., 24, 418–436, 2012.
Fukuchi, R., Yamaguchi, A., Yamamoto, Y., and Ashi, J.: Paleothermal structure of the Nankai inner accretionary wedge estimated from vitrinite reflectance of cuttings, Geochem. Geophy. Geosy., 18, 3185–3196, 2017.
Fulton, P. M. and Harris, R. N.: Thermal considerations in inferring frictional heating from vitrinite reflectance and implications for shallow coseismic slip within the Nankai Subduction Zone, Earth Planet. Sc. Lett., 335–336, 206–215, 2012.
Gerya, T. V. and Meilick, F. I.: Geodynamic regimes of subduction under an active margin: effects of rheological weakening by fluids and melts, J. Metamorph. Geol., 29, 7–31, 2011.
Gerya, T. V. and Yuen, D. A.: Characteristics-based marker-in-cell method with conservative finite-differences schemes for modeling geological flows with strongly variable transport properties, Phys. Earth Planet. In., 140, 293–318, 2003a.
Gerya, T. V. and Yuen, D. A.: Rayleigh–Taylor instabilities from hydration and melting propel “cold plumes” at subduction zones, Earth Planet. Sc. Lett., 212, 47–62, 2003b.
Giunchi, C. and Ricard, Y.: High-pressure/low-temperature metamorphism and the dynamics of an accretionary wedge, Geophys. J. Int., 136, 620–628, https://doi.org/10.1046/j.1365-246x.1999.00759.x, 1999.
Górszczyk, A., Operto, S., Schenini, L., and Yamada, Y.: Crustal-scale depth imaging via joint full-waveform inversion of ocean-bottom seismometer data and pre-stack depth migration of multichannel seismic data: a case study from the eastern Nankai Trough, Solid Earth, 10, 765–784, https://doi.org/10.5194/se-10-765-2019, 2019.
Heki, K., Miyazaki, S., Takahashi, H., Kasahara, M., Kimata, F., Miura, S., Vasilenko, N. F., Ivashchenko, A., and An, K.-D.: The Amurian Plate motion and current plate kinematics in eastern Asia, J. Geophys. Res., 104, 29147–29155, 1999.
Henrys, S. A., Ellis, S., and Uruski, C.: Conductive heat flow variations from bottom-simulating reflectors on the Hikurangi margin, New Zealand, Geophys. Res. Lett., 30, 1065, https://doi.org/10.1029/2002GL015772, 2003.
Hickman, S., Sibson, R., and Bruhn, R.: Introduction to special section: Mechanical involvement of fluids in faulting, J. Geophys. Res.-Sol. Ea., 100, 12831–12840, 1995.
Hori, T. and Sakaguchi, H.: Mechanism of décollement formation in subduction zones, Geophys. J. Int., 187, 1089–1100, 2011.
Kamiya, N., Yamamoto, Y., Wang, Q., Kurimoto, Y., Zhang, F., and Takemura, T.: Major variations in vitrinite reflectance and consolidation characteristics within a post-middle Miocene forearc basin, central Japan: A geodynamical implication for basin evolution, Tectonophysics, 710–711, 69–80, 2017.
Kimura, G., Hashimoto, Y., Kitamura, Y., Yamaguchi, A., and Koge, H.: Middle Miocene swift migration of the TTT triple junction and rapid crustal growth in southwest Japan: A review, Tectonics, 33, 1219–1238, 2014.
Konstantinovskaia, E.: Erosion and exhumation in accretionary orogens: Experimental and geological approaches, Geochem. Geophy. Geosy., 6, Q02006, https://doi.org/10.1029/2004GC000794, 2005.
Korup, O., Hayakawa, Y., Codilean, A. T., Matsushi, Y., Saito, H., Oguchi, T., and Matsuzaki, H.: Japan's sediment flux to the Pacific Ocean revisited, Earth-Sci. Rev., 135, 1–16, 2014.
Lin, W., Fulton, P. M., Harris, R. N., Tadai, O., Matsubayashi, O., Tanikawa, W., and Kinoshita, M.: Thermal conductivities, thermal diffusivities, and volumetric heat capacities of core samples obtained from the Japan Trench Fast Drilling Project (JFAST), Earth Planets Space, 66, 1–11, 2014.
Malavieille, J. and Trullenque, G.: Consequences of continental subduction on forearc basin and accretionary wedge deformation in SE Taiwan: Insights from analogue modeling, Tectonophysics, 466, 377–394, 2009.
Mallick, R. K. and Raju, S. V.: Thermal maturity evaluation by sonic log and seismic velocity analysis in parts of Upper Assam Basin, India, Org. Geochem., 23, 871–879, 1995.
Mannu, U., Ueda, K., Willett, S. D., Gerya, T. V., and Strasser, M.: Impact of sedimentation on evolution of accretionary wedges: Insights from high-resolution thermomechanical modeling, Tectonics, 35, 2828–2846, 2016.
Mannu, U., Ueda, K., Willett, S. D., Gerya, T. V., and Strasser, M.: Stratigraphic signatures of forearc basin formation mechanisms, Geochem. Geophy. Geosy., 18, 2388–2410, 2017.
Menant, A., Angiboust, S., Gerya, T., Lacassin, R., Simoes, M., and Grandin, R.: Transient stripping of subducting slabs controls periodic forearc uplift, Nat. Commun., 11, 1823, https://doi.org/10.1038/s41467-020-15580-7, 2020.
Miyakawa, A., Kinoshita, M., Hamada, Y., and Otsubo, M.: Thermal maturity structures in an accretionary wedge by a numerical simulation, Progress in Earth and Planetary Science, 6, 8, https://doi.org/10.1186/s40645-018-0252-z, 2019.
Mugnier, J. L., Baby, P., Colletta, B., Vinour, P., Bale, P., and Leturmy, P.: Thrust geometry controlled by erosion and sedimentation: A view from analogue models, Geology, 25, 427–430, 1997.
Mulugeta, G. and Koyi, H.: Episodic accretion and strain partitioning in a model sand wedge, Tectonophysics, 202, 319–333, 1992.
Nakanishi, A., Takahashi, N., Yamamoto, Y., Takahashi, T., Citak, S. O., Nakamura, T., Obana, K., Kodaira, S., and Kaneda, Y.: Three-dimensional plate geometry and P-wave velocity models of the subduction zone in SW Japan: Implications for seismogenesis, Geology and Tectonics of Subduction Zones: A Tribute to Gaku Kimura, Geol. S. Am. S., 534, 69–86, 2018.
Nielsen, S. B., Clausen, O. R., and McGregor, E.: basin%Ro: A vitrinite reflectance model derived from basin and laboratory data, Basin Res., 29, 515–536, 2017.
Ohmori, K., Taira, A., Tokuyama, H., Sakaguchi, A., Okamura, M., and Aihara, A.: Paleothermal structure of the Shimanto accretionary prism, Shikoku, Japan: Role of an out-of-sequence thrust, Geology, 25, 327–330, 1997.
Pajang, S., Khatib, M. M., Heyhat, M., Cubas, N., Bessiere, E., Letouzey, J., Mokhtari, M., and Le Pourhiet, L.: The distinct morphologic signature of underplating and seamounts in accretionary prisms, insights from thermomechanical modeling applied to Coastal Iranian Makran, Tectonophysics, 845, 229617, https://doi.org/10.1016/j.tecto.2022.229617, 2022.
Platt, J. P.: Dynamics of orogenic wedges and the uplift of high-pressure metamorphic rocks, GSA Bulletin, 97, 1037–1053, 1986.
Rabinowitz, H. S., Savage, H. M., Polissar, P. J., Rowe, C. D., and Kirkpatrick, J. D.: Earthquake slip surfaces identified by biomarker thermal maturity within the 2011 Tohoku-Oki earthquake fault zone, Nat. Commun., 11, 533, https://doi.org/10.1038/s41467-020-14447-1, 2020.
Ranalli, G.: Rheology of the Earth, Springer, Dordrecht, 414 pp., ISBN 978-0-412-54670-9, 1995.
Ruh, J. B.: Numerical modeling of tectonic underplating in accretionary wedge systems, Geosphere, 16, 1385–1407, 2020.
Ruh, J. B., Kaus, B. J. P., and Burg, J.-P.: Numerical investigation of deformation mechanics in fold-and-thrust belts: Influence of rheology of single and multiple décollements, Tectonics, 31, TC3005, https://doi.org/10.1029/2011TC003047, 2012.
Ruh, J. B., Gerya, T., and Burg, J.-P.: 3D effects of strain vs. velocity weakening on deformation patterns in accretionary wedges, Tectonophysics, 615–616, 122–141, 2014.
Sakaguchi, A.: Thermal maturity in the Shimanto accretionary prism, southwest Japan, with the thermal change of the subducting slab: fluid inclusion and vitrinite reflectance study, Earth Planet. Sc. Lett., 173, 61–74, 1999.
Sakaguchi, A., Yanagihara, A., Ujiie, K., Tanaka, H., and Kameyama, M.: Thermal maturity of a fold–thrust belt based on vitrinite reflectance analysis in the Western Foothills complex, western Taiwan, Tectonophysics, 443, 220–232, 2007.
Sakaguchi, A., Chester, F., Curewitz, D., Fabbri, O., Goldsby, D., Kimura, G., Li, C.-F., Masaki, Y., Screaton, E. J., Tsutsumi, A., Ujiie, K., and Yamaguchi, A.: Seismic slip propagation to the updip end of plate boundary subduction interface faults: Vitrinite reflectance geothermometry on Integrated Ocean Drilling Program NanTro SEIZE cores, Geology, 39, 395–398, 2011.
Schumann, K., Behrmann, J. H., Stipp, M., Yamamoto, Y., Kitamura, Y., and Lempp, C.: Geotechnical behavior of mudstones from the Shimanto and Boso accretionary complexes, and implications for the Nankai accretionary prism, Earth Planets Space, 66, 129, https://doi.org/10.1186/1880-5981-66-129, 2014.
Seno, T., Stein, S., and Gripp, A. E.: A model for the motion of the Philippine Sea Plate consistent with NUVEL-1 and geological data, J. Geophys. Res.-Sol. Ea., 98, 17941–17948, 1993.
Simpson, G. D. H.: Formation of accretionary prisms influenced by sediment subduction and supplied by sediments from adjacent continents, Geology, 38, 131–134, 2010.
Storti, F. and McClay, K.: Influence of syntectonic sedimentation on thrust wedges in analogue models, Geology, 23, 999–1002, 1995.
Sugihara, T., Kinoshita, M., Araki, E., Kimura, T., Kyo, M., Namba, Y., Kido, Y., Sanada, Y., and Thu, M. K.: Re-evaluation of temperature at the updip limit of locked portion of Nankai megasplay inferred from IODP Site C0002 temperature observatory, Earth Planets Space, 66, 107, https://doi.org/10.1186/1880-5981-66-107, 2014.
Suzuki, N., Matsubayashi, H., and Waples, D. W.: A Simpler Kinetic Model of Vitrinite Reflectance, AAPG Bull., 77, 1502–1508, 1993.
Sweeney, J. J. and Burnham, A. K.: Evaluation of a Simple Model of Vitrinite Reflectance Based on Chemical Kinetics, AAPG Bull., 74, 1559–1570, 1990.
Tesei, T., Cruciani, F., and Barchi, M. R.: Gravity-driven deepwater fold-and-thrust belts as Critical Coulomb Wedges: Model limitations and the role of friction vs. fluid pressure, J. Struct. Geol., 153, 104451, https://doi.org/10.1016/j.jsg.2021.104451, 2021.
Totten, M. W. and Blatt, H.: Alterations in the non-clay-mineral fraction of pelitic rocks across the diagenetic to low-grade metamorphic transition, Ouachita Mountains, Oklahoma and Arkansas, J. Sediment. Res., 63, 899–908, 1993.
Turcotte, D. L. and Schubert, G.: Geodynamics, Cambridge University Press, 456 pp., https://doi.org/10.1017/CBO9780511843877, 2002.
Underwood, M. B., O'Leary, J. D., and Strong, R. H.: Contrasts in Thermal Maturity within Terranes and across Terrane Boundaries of the Franciscan Complex, Northern California, J. Geol., 96, 399–415, 1988.
Underwood, M. B., Laughland, M. M., Byrne, T., Hibbard, J. P., and DiTullio, L.: Thermal evolution of the Tertiary Shimanto Belt, Muroto Peninsula, Shikoku, Japan, Island Arc., 1, 116–132, https://doi.org/10.1111/j.1440-1738.1992.tb00064.x, 1992.
van Gool, J. A. M. and Cawood, P. A.: Frontal vs. basal accretion and contrasting particle paths in metamorphic thrust belts, Geology, 22, 51–54, 1994.
Wenk, L. and Huhn, K.: The influence of an embedded viscoelastic–plastic layer on kinematics and mass transport pattern within accretionary wedges, Tectonophysics, 608, 653–666, 2013.
Willett, S.: Dynamic and kinematic growth and change of a Coulomb wedge, in: Thrust Tectonics, edited by: McClay, K. R., Springer, Dordrecht, https://doi.org/10.1007/978-94-011-3066-0_2, 1992.
Yamano, M., Foucher, J.-P., Kinoshita, M., Fisher, A., and Hyndman, R. D.: Heat flow and fluid flow regime in the western Nankai accretionary prism, Earth Planet. Sc. Lett., 109, 451–462, 1992.
Zhao, D., Wang, J., Huang, Z., and Liu, X.: Seismic structure and subduction dynamics of the western Japan arc, Tectonophysics, 802, 228743, https://doi.org/10.1016/j.tecto.2021.228743, 2021.