the Creative Commons Attribution 4.0 License.
the Creative Commons Attribution 4.0 License.
 | 02 Oct 2024
Influence of water on crystallographic preferred orientation patterns in a naturally deformed quartzite
Brendan Moehringer
Kenneth S. Befus
John S. Singleton
Laboratory experiments demonstrate that intragranular water exerts an important control on deformation within quartz, causing weakening and promoting plasticity. The role of water in natural quartz deformation, however, remains unclear, as recent studies find an inverse relationship between water content and the magnitude of plastic strain. Furthermore, little work has investigated the effects, if any, of water on the relative activity of various slip systems in quartz. We focus on a naturally strained quartzite from the Antietam Formation of the Blue Ridge in Virginia, USA. Quartz water content ranges from < 50 to > 2000 ppm H2O. Water content and crystallographic data were correlated for 968 grains, enabling us to explore the relationship between water content and quartz crystallographic preferred orientation (CPO) patterns. “Dry” (< 150 ppm H2O) and “wet” (> 500 ppm H2O) subsets show distinct CPOs; c axes of dry grains define a cross girdle oriented perpendicular to the extension direction (x), whereas c axes of wet grains are concentrated along the perimeter of the pole figure. All water content subsets show grains clustered near the direction of maximum shortening (z), consistent with activity of the basal 〈a〉 slip system. The cross girdle in the driest grains suggests activity of prism 〈a〉 and possibly rhomb 〈a〉, whereas the orientation of the wettest grains implies a contribution from prism [c] slip. These slip system interpretations are supported by analyses of intragranular misorientations. These results indicate that water content impacts the relative activity of various slip systems in natural quartz, potentially affecting application of the quartz opening angle thermometer.
- Article
(7450 KB) - Full-text XML
- BibTeX
- EndNote


Classic laboratory experiments demonstrated the significant role that water content exerts on the deformation of quartz (e.g., Griggs and Blacic, 1965). Relatively “wet” quartz, as either a single crystal or an aggregate, will deform plastically at experimental conditions for which “dry” quartz fails by brittle or semi-brittle processes. For synthetic samples, the rheologic transition from strong dry to weaker wet quartz is estimated to occur at concentrations of ∼ 150–500 ppm (Cordier and Doukhan, 1989; Griggs and Blacic, 1965; Kronenberg and Tullis, 1984; Muto et al., 2011). With observed water concentrations in natural quartz typically well above this threshold, it is commonly assumed to be rheologically weak. However, recent empirical studies document examples of plastically deformed quartz mylonites with very low water concentrations, as well as inverse correlations between quartz water content and finite strain (Finch et al., 2016; Kilian et al., 2016; Kronenberg et al., 2020). These findings indicate that the relationship between water content and quartz deformation is more complex than previously understood.
In addition to rheologic weakening, water may influence the relative activity of particular slip systems in deforming minerals. In olivine, for example, both experimental and field-based studies (e.g., Jung et al., 2006; Wallis et al., 2019) demonstrate changes in the dominant slip system with increasing water content that produce distinct crystallographic fabrics. For quartz, crystallographic fabric transitions are usually attributed to changes in deformation temperature (Faleiros et al., 2016; Law, 2014; e.g., Stipp et al., 2002) or strain (Muto et al., 2011), though some studies suggest that high water contents may promote slip on the prism [c] system (Blacic, 1975; Blacic and Christie, 1984; Mainprice et al., 1986; Okudaira et al., 1995).
Given the fundamental control quartz exerts on continental rheology, as well as the widespread reliance on quartz crystallographic preferred orientation (CPO) patterns in geologic interpretations, the relationships between intragranular water content, slip systems, and deformation in quartz merits further investigation, particularly in natural samples. Here, we present new results from a naturally deformed quartzite from the Blue Ridge of Virginia. The well-characterized geologic context for this rock (Singleton et al., 2020) and known large variation in quartz water content, grain shape and size, and crystallographic orientation make it ideal to explore these issues. We have measured the water content, aspect ratio, and crystallographic orientation on each of a large number (n= 968) of individual quartz grains, enabling us to investigate the relationships between these parameters. We find that crystallographic fabrics defined by comparatively wet grains differ markedly from those of dry grains, implying that intragranular water content in quartz influences active slip systems and the deformation of quartz.
We focus on a Cambrian quartzite (sample 14-11-11) from the Antietam Formation, collected from the western limb of the Blue Ridge Anticlinorium, Virginia, USA (location: 38.97101° N, −78.08335° E), and deformed during Mississippian-age shortening that accommodated long-term convergence between North America and Africa (Fig. 1). This sample was first described by Singleton et al. (2020), who documented the strain and deformation conditions. Plastic strain occurred at 250–280 °C and at a strain rate of ∼ 10−15 s−1. Recrystallized grain size piezometry suggests a differential stress of ∼ 188 MPa, consistent with deformation near the brittle–plastic transition. Three-dimensional strain analysis indicates a general flattening strain with a mean ratio of 2.53. Previous water content determinations show a wide range of values, from 50 to > 1400 ppm H2O.
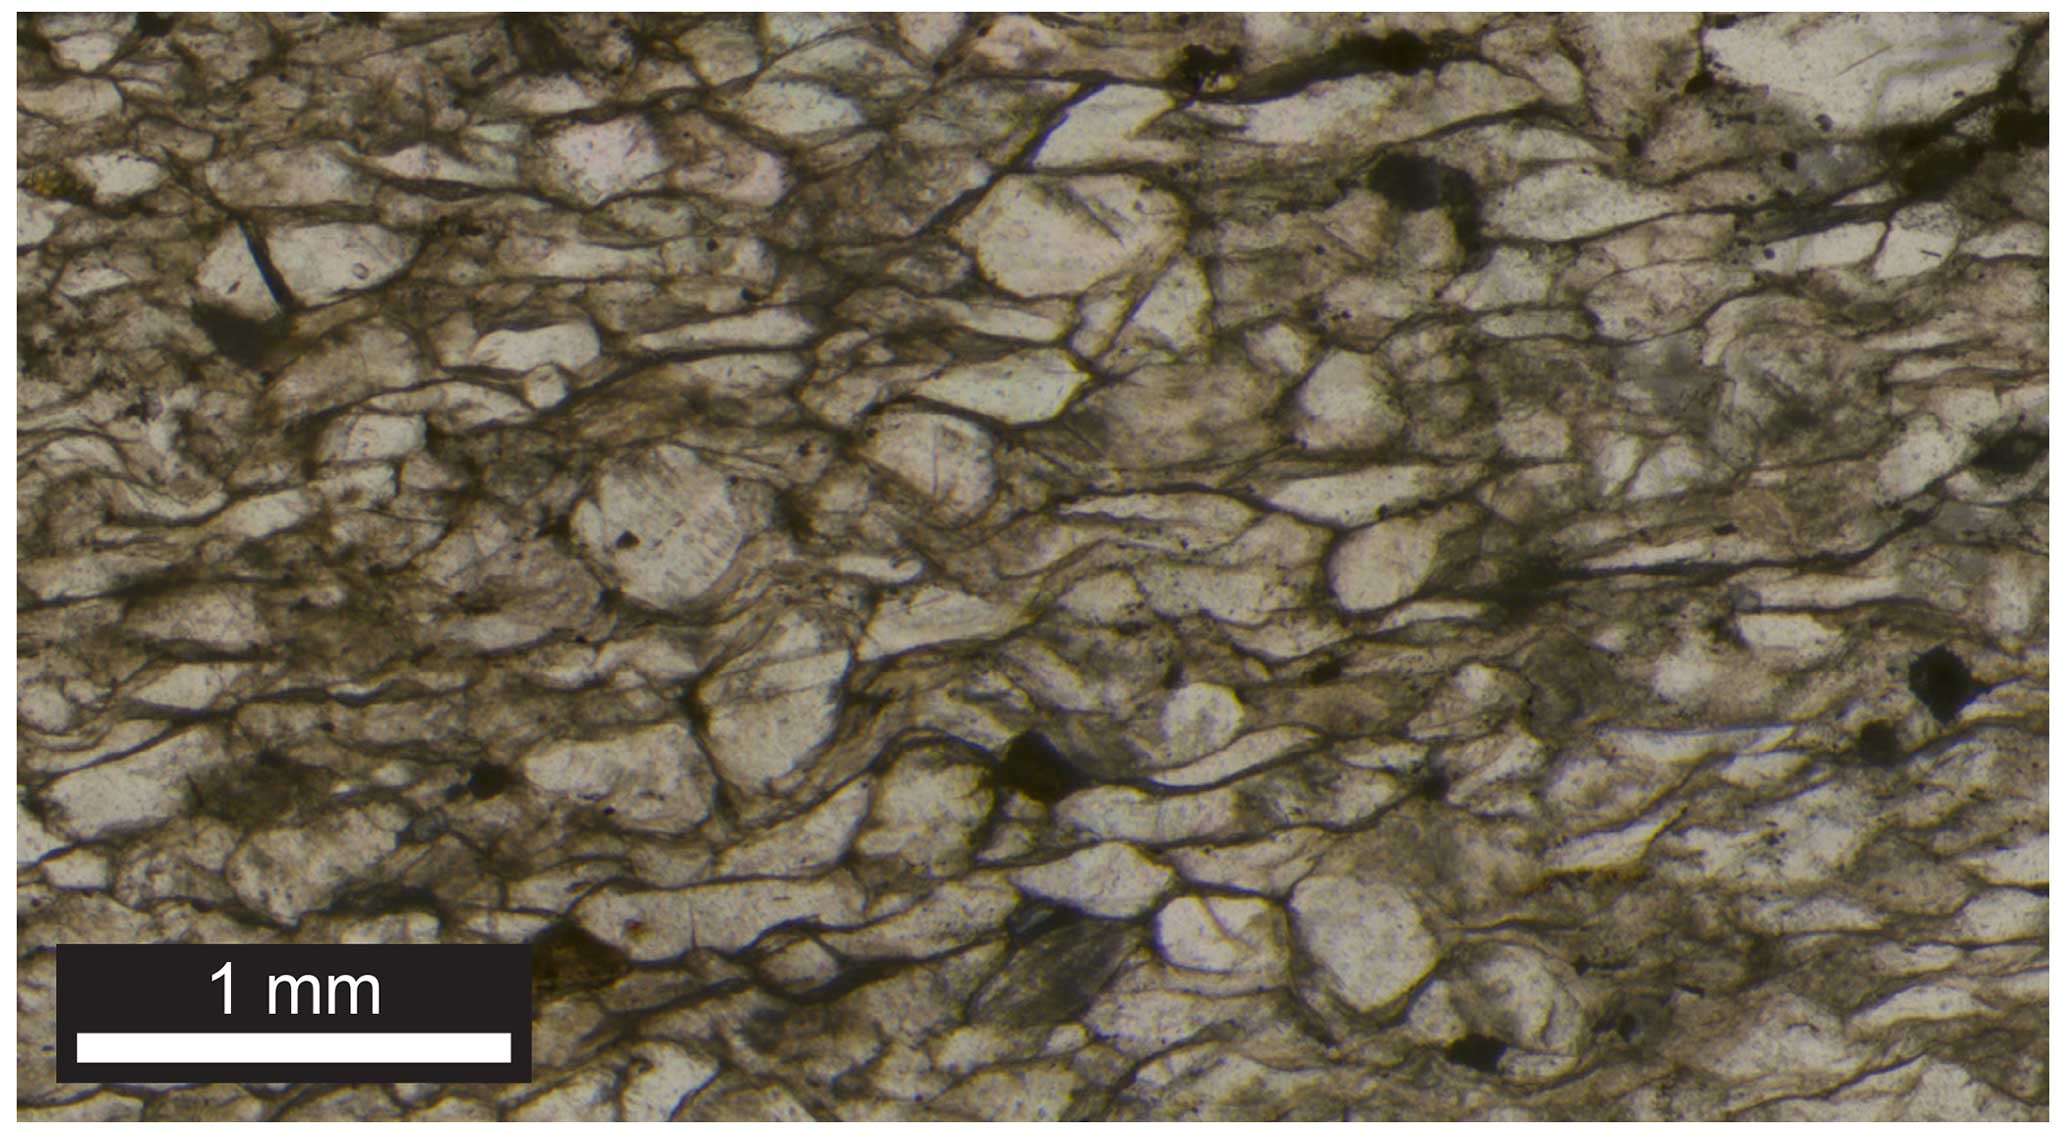
Figure 1Sample photomicrograph. Quartz (clear grains) displays a range of shapes, from generally equant to elongated parallel to the extension direction (horizontal).

Figure 2Photomicrographs of representative quartz grains. Most grains in the sample exhibit at least one set of fine extinction bands (deformation lamellae); examples are highlighted with dotted blue lines. Some grains contain two or even three distinct sets (e.g., panel f). Many of these planes are decorated with fluid inclusions (dashed red lines), usually oriented at a high angle to the projection of the c axis determined with EBSD (black lines).
Quartz grains generally exhibit evidence of plastic deformation, including undulose extinction and fine extinction bands (in the terminology of Derez et al., 2015). Many grains show one or more sets of fine extinction bands; in many instances one or more of these planes are decorated with fluid inclusions (Fig. 2). Quartz c-axis orientations measured through electron backscatter diffraction (see below) are usually, though not always, perpendicular to the trace of the observed fluid inclusion planes, suggesting these planes have developed on the basal plane (Fig. 2). Subgrains and evidence for recrystallization are generally rare, comprising less than 1 % of the sample area (Singleton et al., 2020).
A doubly polished thick section was prepared for electron backscatter diffraction (EBSD) analysis. The sample was analyzed on a Zeiss EVO MA 15 scanning electron microscope at Washington and Lee University, using an Oxford Instruments EBSD detector and Aztec software (v. 4.4). Operating conditions included an accelerating voltage of 25 kV, a probe current of 20–25 nA, a working distance of 24 mm, and a low-vacuum pressure of 30 Pa. Data were scanned on an 8 µm square grid and processed using the MTEX toolbox, v. 5.8.1 (Hielscher and Schaeben, 2008). Low-quality data (with mean angular deviation values > 1.25) were filtered out of the dataset. Grains were defined using a 10° misorientation. Dauphiné twin boundaries were identified using a 60±3° misorientation around the c axis, and adjacent twin domains were merged into single parent grains for the analysis. The full EBSD dataset covered an area of roughly 130 mm2 and contained > 12 000 quartz grains, though we limit our analysis to grains for which we also measured water content (see below). Contoured EBSD data are presented as lower-hemisphere stereoplots in a reference frame determined from finite strain analysis (Singleton et al., 2020), with the x axis horizontal and the z axis oriented vertically.
A common approach to assess active slip systems is boundary trace analysis, in which the rotation of crystallographic axes around a tilt sub-grain boundary is related to the motion of dislocations on particular slip systems (e.g., Lloyd et al., 1997; Neumann, 2000). However, quartz grains in the studied sample are nearly devoid of sub-grain boundaries, limiting the potential for this technique. Instead, we employ a conceptually similar approach, which focuses on long-range (i.e., throughout a grain) intragranular rotations (Shu et al., 2023). Even when dislocations are not organized into discrete sub-grain boundaries, dislocation motion may still produce bending of a crystal lattice. The misorientation axes of individual observations relative to the mean orientation of the grain may therefore reflect the active slip system. We created inverse pole figures of the distribution of the misorientation axes relative to the mean crystal orientation for all crystallographic observations to compare with predicted patterns for common quartz slip systems (Neumann, 2000).
Following EBSD analysis, water content was determined from individual grains using Fourier transform infrared spectroscopy (FTIR) at Baylor University. The thick section was removed from its glass slide and cleaned with baths of acetone and ethanol. A ThermoElectron Nicolet iN10 instrument was used to collect spectra from 675 to 7000 cm−1 using 64 scans and a spectral resolution of 4 cm−1. Individual crystals are generally > 200 µm in equivalent spherical diameter, larger than the ∼ 75 µm thick section, ensuring clear optical pathways through the crystals. For each FTIR analysis site, we used an aperture of 40×40 µm and primarily targeted centers of grains that were clear and free of obvious fluid inclusions. We assigned each analyzed grain an FTIR identification number recorded on enlarged images of the thin sections to enable correlation with the EBSD dataset. Water determinations were based on the integrated area of the broad absorbance peak at ∼ 3400 cm−1, measured above a linear baseline between ∼ 2900 and 3700 cm−1 (see Fig. 3 for representative spectra). Absorbances and thicknesses are provided in the associated data table of Rahl et al. (2024). To determine sample thickness, we focused on the top and bottom surface of the sample wafer using a petrographic microscope equipped with a Heidenhain linear encoder to measure stage height. Six thickness measurements were made at each of 21 calibration sites distributed through the study area on the sample. The standard deviation of these measurements varied between 0.5 and 3.1 µm. We fit a third-order polynomial to the calibration observations using the fit function within MATLAB. The mean distance to the 95 % confidence interval surface is less than 3 µm. A modified Beer–Lambert Law (Stalder, 2021; Thomas et al., 2009) was used to convert absorbances to molar ppm H2O, equivalent to (H: 106 Si) 6.67. Uncertainties in our calculated water contents are introduced by each variable in the modified Beer–Lambert Law, including density, absorption coefficient, integrated absorbance measured from choice of background, and sample thickness. Quartz density is known. The integrated absorbance measurements produce little uncertainty because a linear background captures the trend of the IR spectra well (Fig. 3). The greatest sources of uncertainty are found in the absorption coefficient of OH in quartz (89 000±15 000 L mol−1 cm−2, after Thomas et al., 2009) and sample thickness (∼ 75±3 µm). To conservatively accommodate those uncertainties we report all data with ±20 % error bars. We digitally traced grain shapes on photomicrographs to measure grain size and aspect ratio for all studied grains using the EllipseFit software, v. 3.8.0 (Vollmer, 2018). Our final dataset includes crystallographic orientation, water content, and aspect ratio measurements from each of 968 quartz grains.

Figure 3Representative IR spectra of quartz grains with different water contents. Water determinations are based on the integrated area of the broad absorbance peak at ∼ 3400 cm−1, measured above a linear baseline between ∼ 2900 and 3700 cm−1 and excluding the area of the sharp secondary peaks rising above the broad OH peak (the shaded regions). The sharp secondary peak at ∼ 3620 cm−1 in some samples (grains 5 and 77) is interpreted to reflect muscovite inclusions (e.g., Beran, 2002).
Water content values range from < 10 to > 2000 ppm, consistent with previous analyses of this quartzite (Singleton et al., 2020). The large dataset enables the creation of meaningful pole figures from subsets defined by varying water content. We present dry and wet pole figures for grains with < 150 and > 550 ppm H2O, respectively (Fig. 4); these cut-off values are arbitrary, and alternative choices produced similar results. The water content subsets show clearly distinct CPO patterns. Quartz c axes for the dry pole figure define a girdle oriented perpendicular to the x axis (direction of maximum extension). In contrast, the wet pole figure is dominated by grains with c axes oriented at the periphery of the pole figure. An animation showing the evolution of the CPO with increasing water content is available in Rahl et al. (2024).
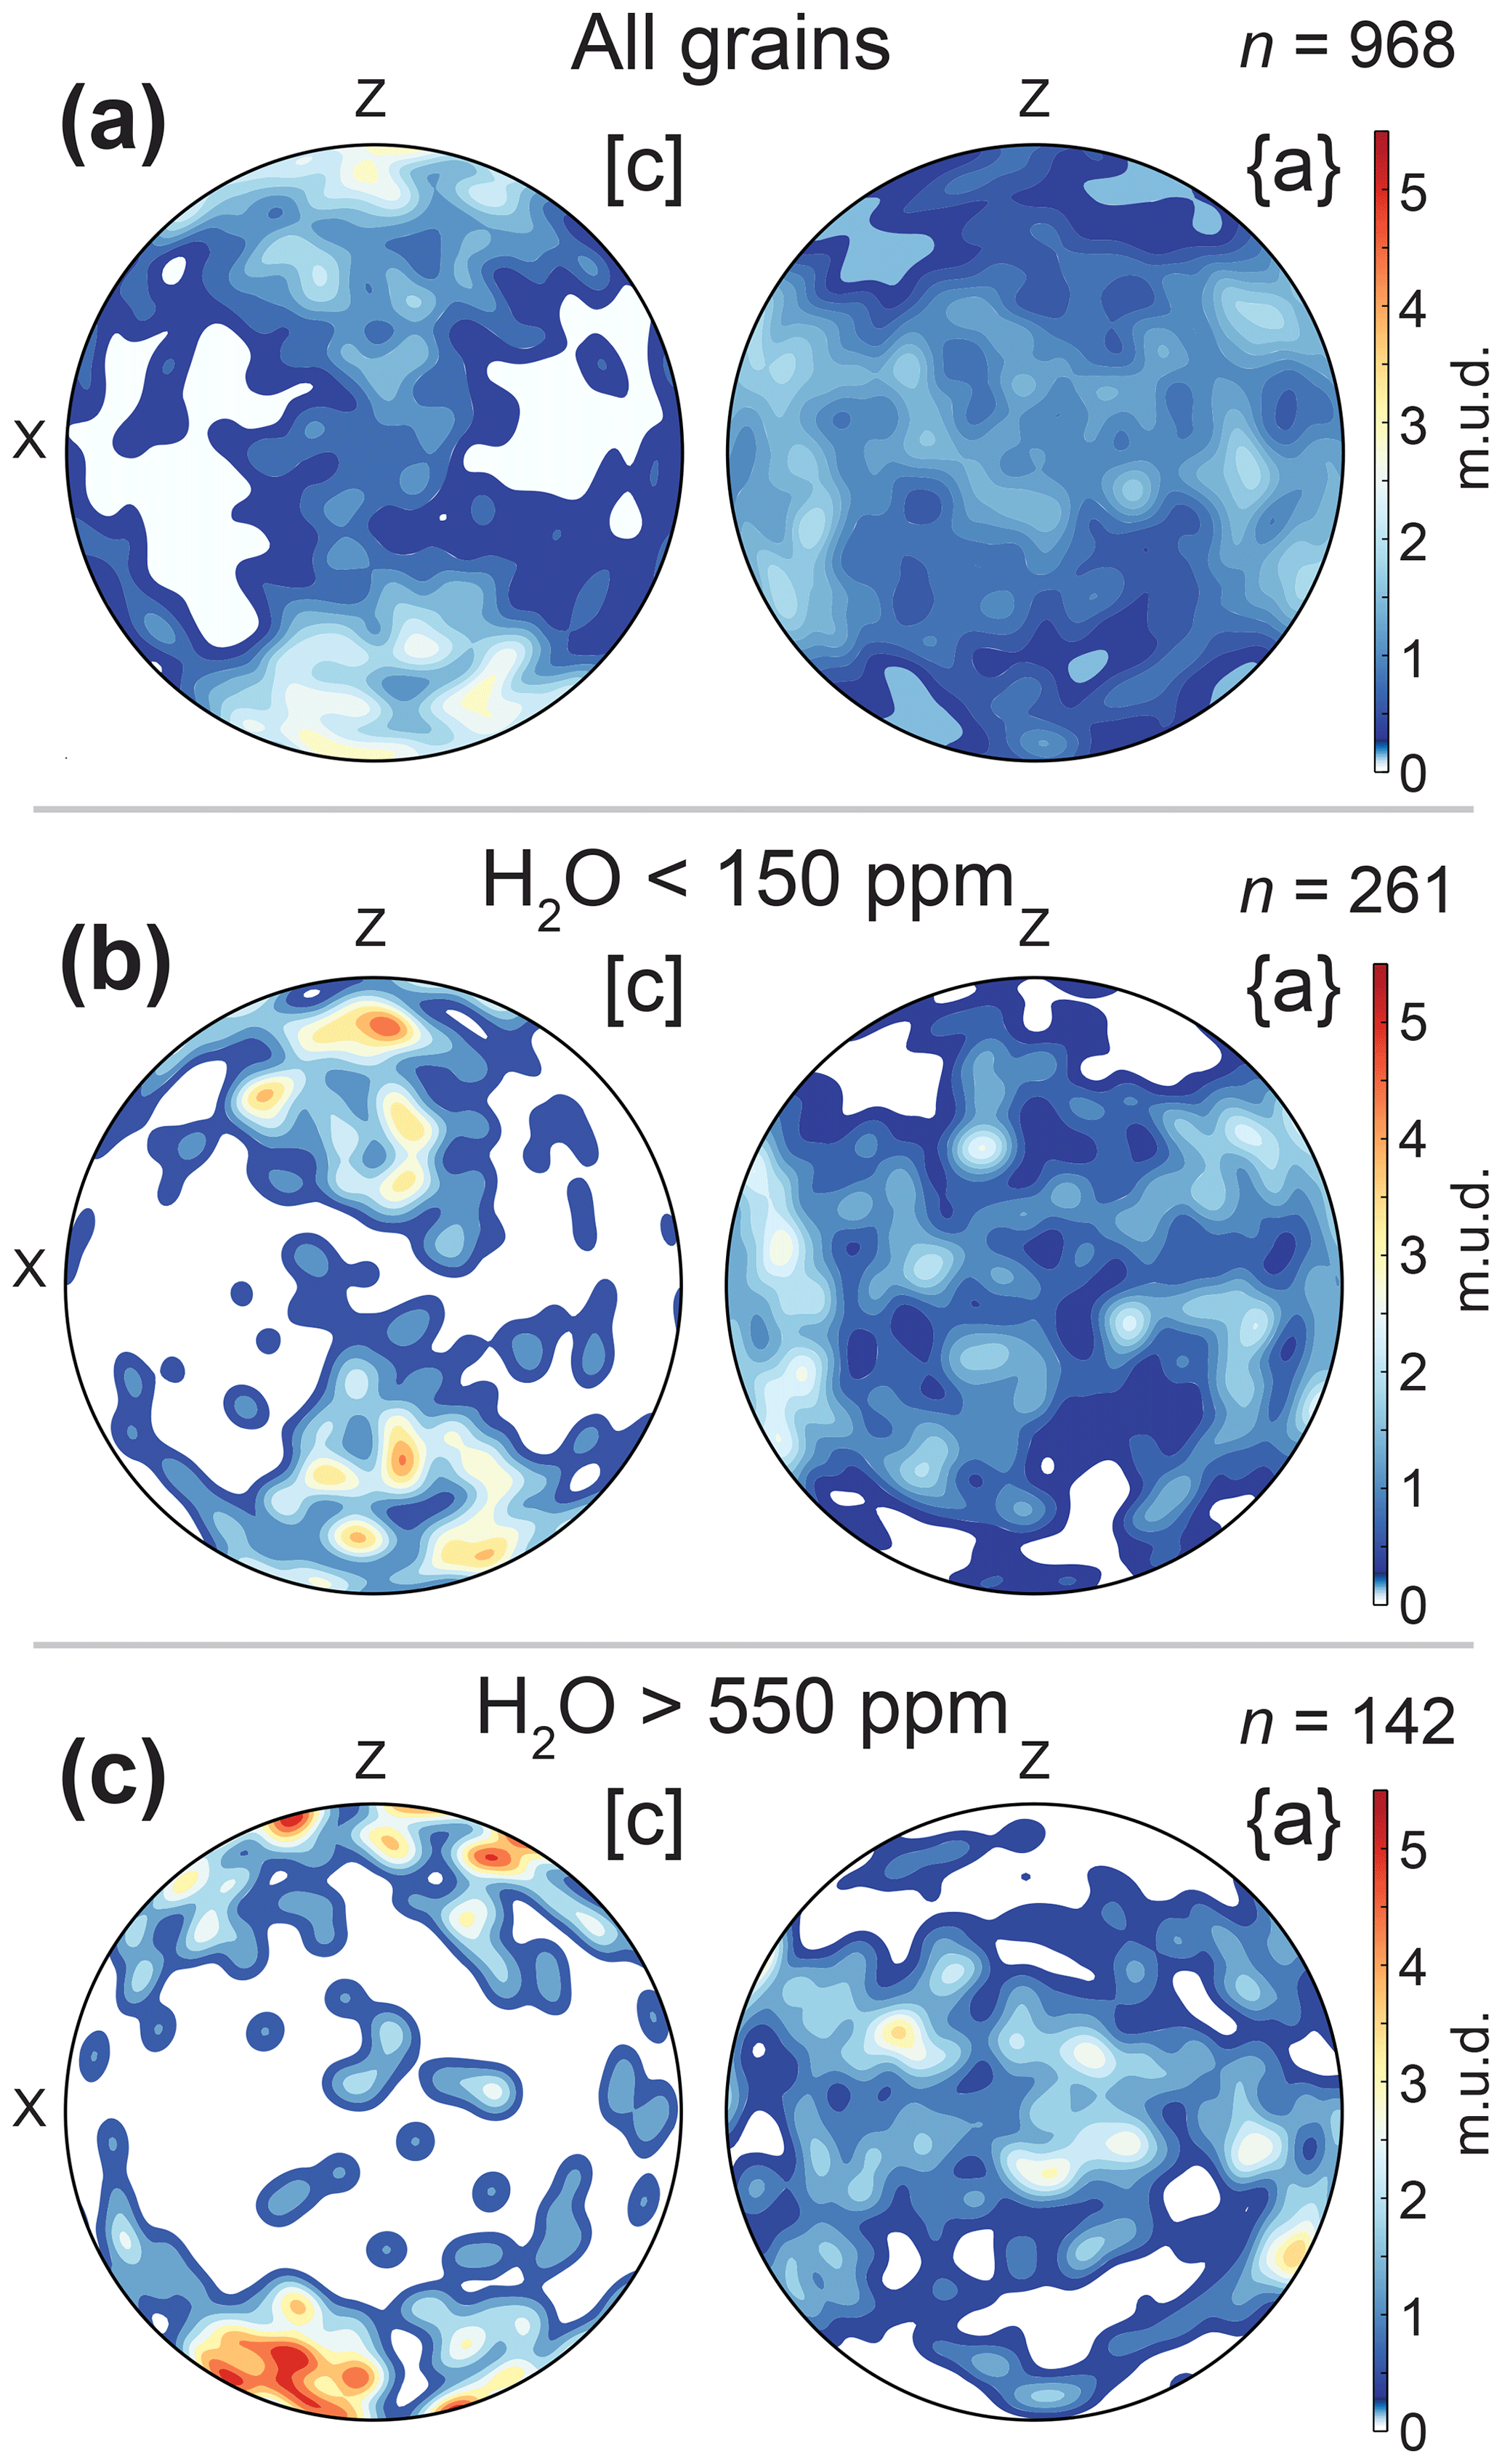
Figure 4Lower-hemisphere pole figures of contoured quartz crystallographic data for all grains (a) and “dry” (b) and “wet” (c) data subsets. Orientations shown are for the c axis [0001] and the a axis {11–20}. Here, n is the number of grains; m.u.d. stands for multiples of uniform density; and x and z indicate the extension and shortening directions, respectively, as determined from strain analysis.
The orientations of quartz c axes in a strain axes reference frame are commonly used to infer the activity of particular slip systems (e.g., Schmid and Casey, 1986; Toy et al., 2008). For example, slip on basal 〈a〉 tends to cluster c axes near the shortening direction (z), whereas activity of prism 〈a〉 orients c axes perpendicular to lineation and within the foliation plane (i.e., the center of the pole figure). Plotting our data in pole figures with a strain axis reference frame implies that the drier grains likely deformed by a combination of basal 〈a〉, prism 〈a〉, and rhomb 〈a〉 slip, whereas wetter grains may record less activity on prism 〈a〉 and perhaps a component of prism [c] slip (Fig. 4).
Although suggestive, simple slip system interpretations based on pole figure CPOs are indirect and could be erroneous in some circumstances, such as due to the simultaneous activity of multiple slip systems or deviations from plane strain (e.g., Keller and Stipp, 2011). Thus, we instead investigated slip system activity using the spread of intracrystalline orientations, visually assessing the misorientation distributions for all 968 grains. In some, we observed poorly organized distributions caused by insufficient data, minimal intracrystalline variation, or perhaps activity of multiple slip systems. However, in exactly half of the grains (484) the resulting patterns unambiguously aligned with the predictions of known quartz slip systems (characteristic examples shown in Fig. 5). We identified grains with slip corresponding to many known slip systems (see the data table in Rahl et al., 2024), with the three most common being basal 〈a〉 (21.2 %), prism 〈a〉 (41.0 %), and prism [c] (11.4 %). The population of grains dominated by basal 〈a〉 and prism 〈a〉 are similar in terms of both the distribution of water content and aspect ratios, whereas grains deformed by prism [c] show lower aspect ratios and higher water contents (Fig. 6). A data table with crystallographic orientations, FTIR data, and aspect ratio measurements is available (Rahl et al., 2024).

Figure 5(a) Inverse pole figure showing the predicted position of misorientation axes for common slip systems in quartz (after Neumann, 2000); (b–d) Inverse pole figures showing representative misorientation axis distributions for grains consistent with slip by the basal 〈a〉 (b), prism 〈a〉 (c), and prism [c] (d) systems.

Figure 6(a) Scatter plots of the aspect ratio of quartz grains versus water content for all grains (grey symbols). Grains with misorientation distributions associated with basal 〈a〉, prism 〈a〉, and prism [c] are highlighted in orange, red, and blue, respectively. Grey bars illustrate a conservatively estimated error of 20 %. (b, c) Cumulative distribution plots of aspect ratio and water content for grains deformed by basal 〈a〉, prism 〈a〉, and prism [c]. The prism [c] distribution shows lower aspect ratios (less deformation) and higher water content values. (d) Orientation of c axes for grains associated with basal 〈a〉 (orange), prism 〈a〉 (red), and prism [c] (blue) slip.
The relationship between grain shape (aspect ratio) and water content is complicated (Fig. 6). For any given water content value, grains show wide variation in aspect ratios. For example, grains with water content values between 100 and 200 ppm include grains with aspect ratios between 1.0 and greater than 6.0. However, the range of observed values decreases with higher water content, such that the wettest grains tend to show lower aspect ratios (e.g., only a few scattered grains with water contents > 500 ppm show aspect ratios greater than 4.0; Fig. 6).
5.1 Influence of water on quartz slip systems
Although experimental studies have found evidence that higher water contents in quartz may induce changes in slip systems (e.g., Blacic, 1975; Blacic and Christie, 1984; Linker et al., 1984), well-documented natural examples are uncommon and rely on indirect evidence. Mainprice et al. (1986) described quartz CPOs formed primarily via c slip in wet subsolidus granitic rocks and hypothesized that both high temperature and water content may be necessary conditions for activation of prism [c]. In a compelling example, Morgan and Law (2004) presented results from a transect through a plutonic aureole in which hot, anhydrous rocks lacked the prism [c] fabrics that are well developed in cooler but wetter nearby rocks, suggesting that water content rather than temperature was the critical factor enabling c slip.
In our dataset, the strikingly different quartz CPO patterns for subsets of comparatively wet and dry grains (Fig. 4) imply that water content influences the relative activity of slip systems in naturally deformed rocks. The wettest grains tend to have c axes oriented at the periphery of the pole figure, consistent with slip by either basal 〈a〉 or prism [c] (Fig. 4). The driest grains define a pole figure with a single girdle, suggesting less contribution from prism [c] and a greater role for prism 〈a〉 or rhomb 〈a〉. This result contrasts with previous studies that attributed dominant activity of prism 〈a〉 or rhomb 〈a〉 slip to increased water content (Joy and Saha, 2000; Kolb et al., 2005). The evidence from our misorientation analysis (Figs. 5, 6) for activity of prism [c] is particularly notable given the low deformation temperatures, estimated at 250–280 °C (Singleton et al., 2020). We infer that the combination of high water content and low strain rate (∼ 10−15 s−1) enabled c slip in this setting, despite the unusually low temperatures for plastic deformation in quartz.
The above observations indicate that water-induced variations in slip system influence observed quartz CPOs in natural rocks. One common application of quartz CPO patterns is opening angle thermometry (Kruhl, 1998; Law, 2014). In this technique, the position of cross girdles on the periphery of a pole figure is related to deformation temperature. Higher temperatures enhance the activity of prism [c] slip relative to basal 〈a〉, driving the cross girdle away from z and towards x (Fig. 7a). We investigate the role of increasing water content on opening angle using data subsets that each span a range of 400 ppm H2O. Most subsets do not display well-developed cross girdles that can define a c-axis opening angle (e.g., Fig. 4). Instead, we focus on the a axes, which produce better defined maxima that migrate in conjunction with the c axes. Whereas a c-axis opening angle is defined by the angular separation between cross girdles measured around the strain-z direction (Kruhl, 1998), a corresponding a-axis opening angle develops around the strain-x direction (Fig. 7a). We modified a MATLAB routine developed by Hunter et al. (2018) to estimate a-axis opening angles by quantifying data density variations around the margin of an orientation distribution function (odf) constructed using a half width of 10°. We find a axis opening angles vary from 45° at very dry conditions to > 60° for the wettest subsets (Fig. 7b, c). This range in opening angle values corresponds with a > 120 °C range in calculated deformation temperature (Faleiros et al., 2016). Future development of the quartz opening angle thermometer may benefit from explicitly incorporating water content into the analysis.
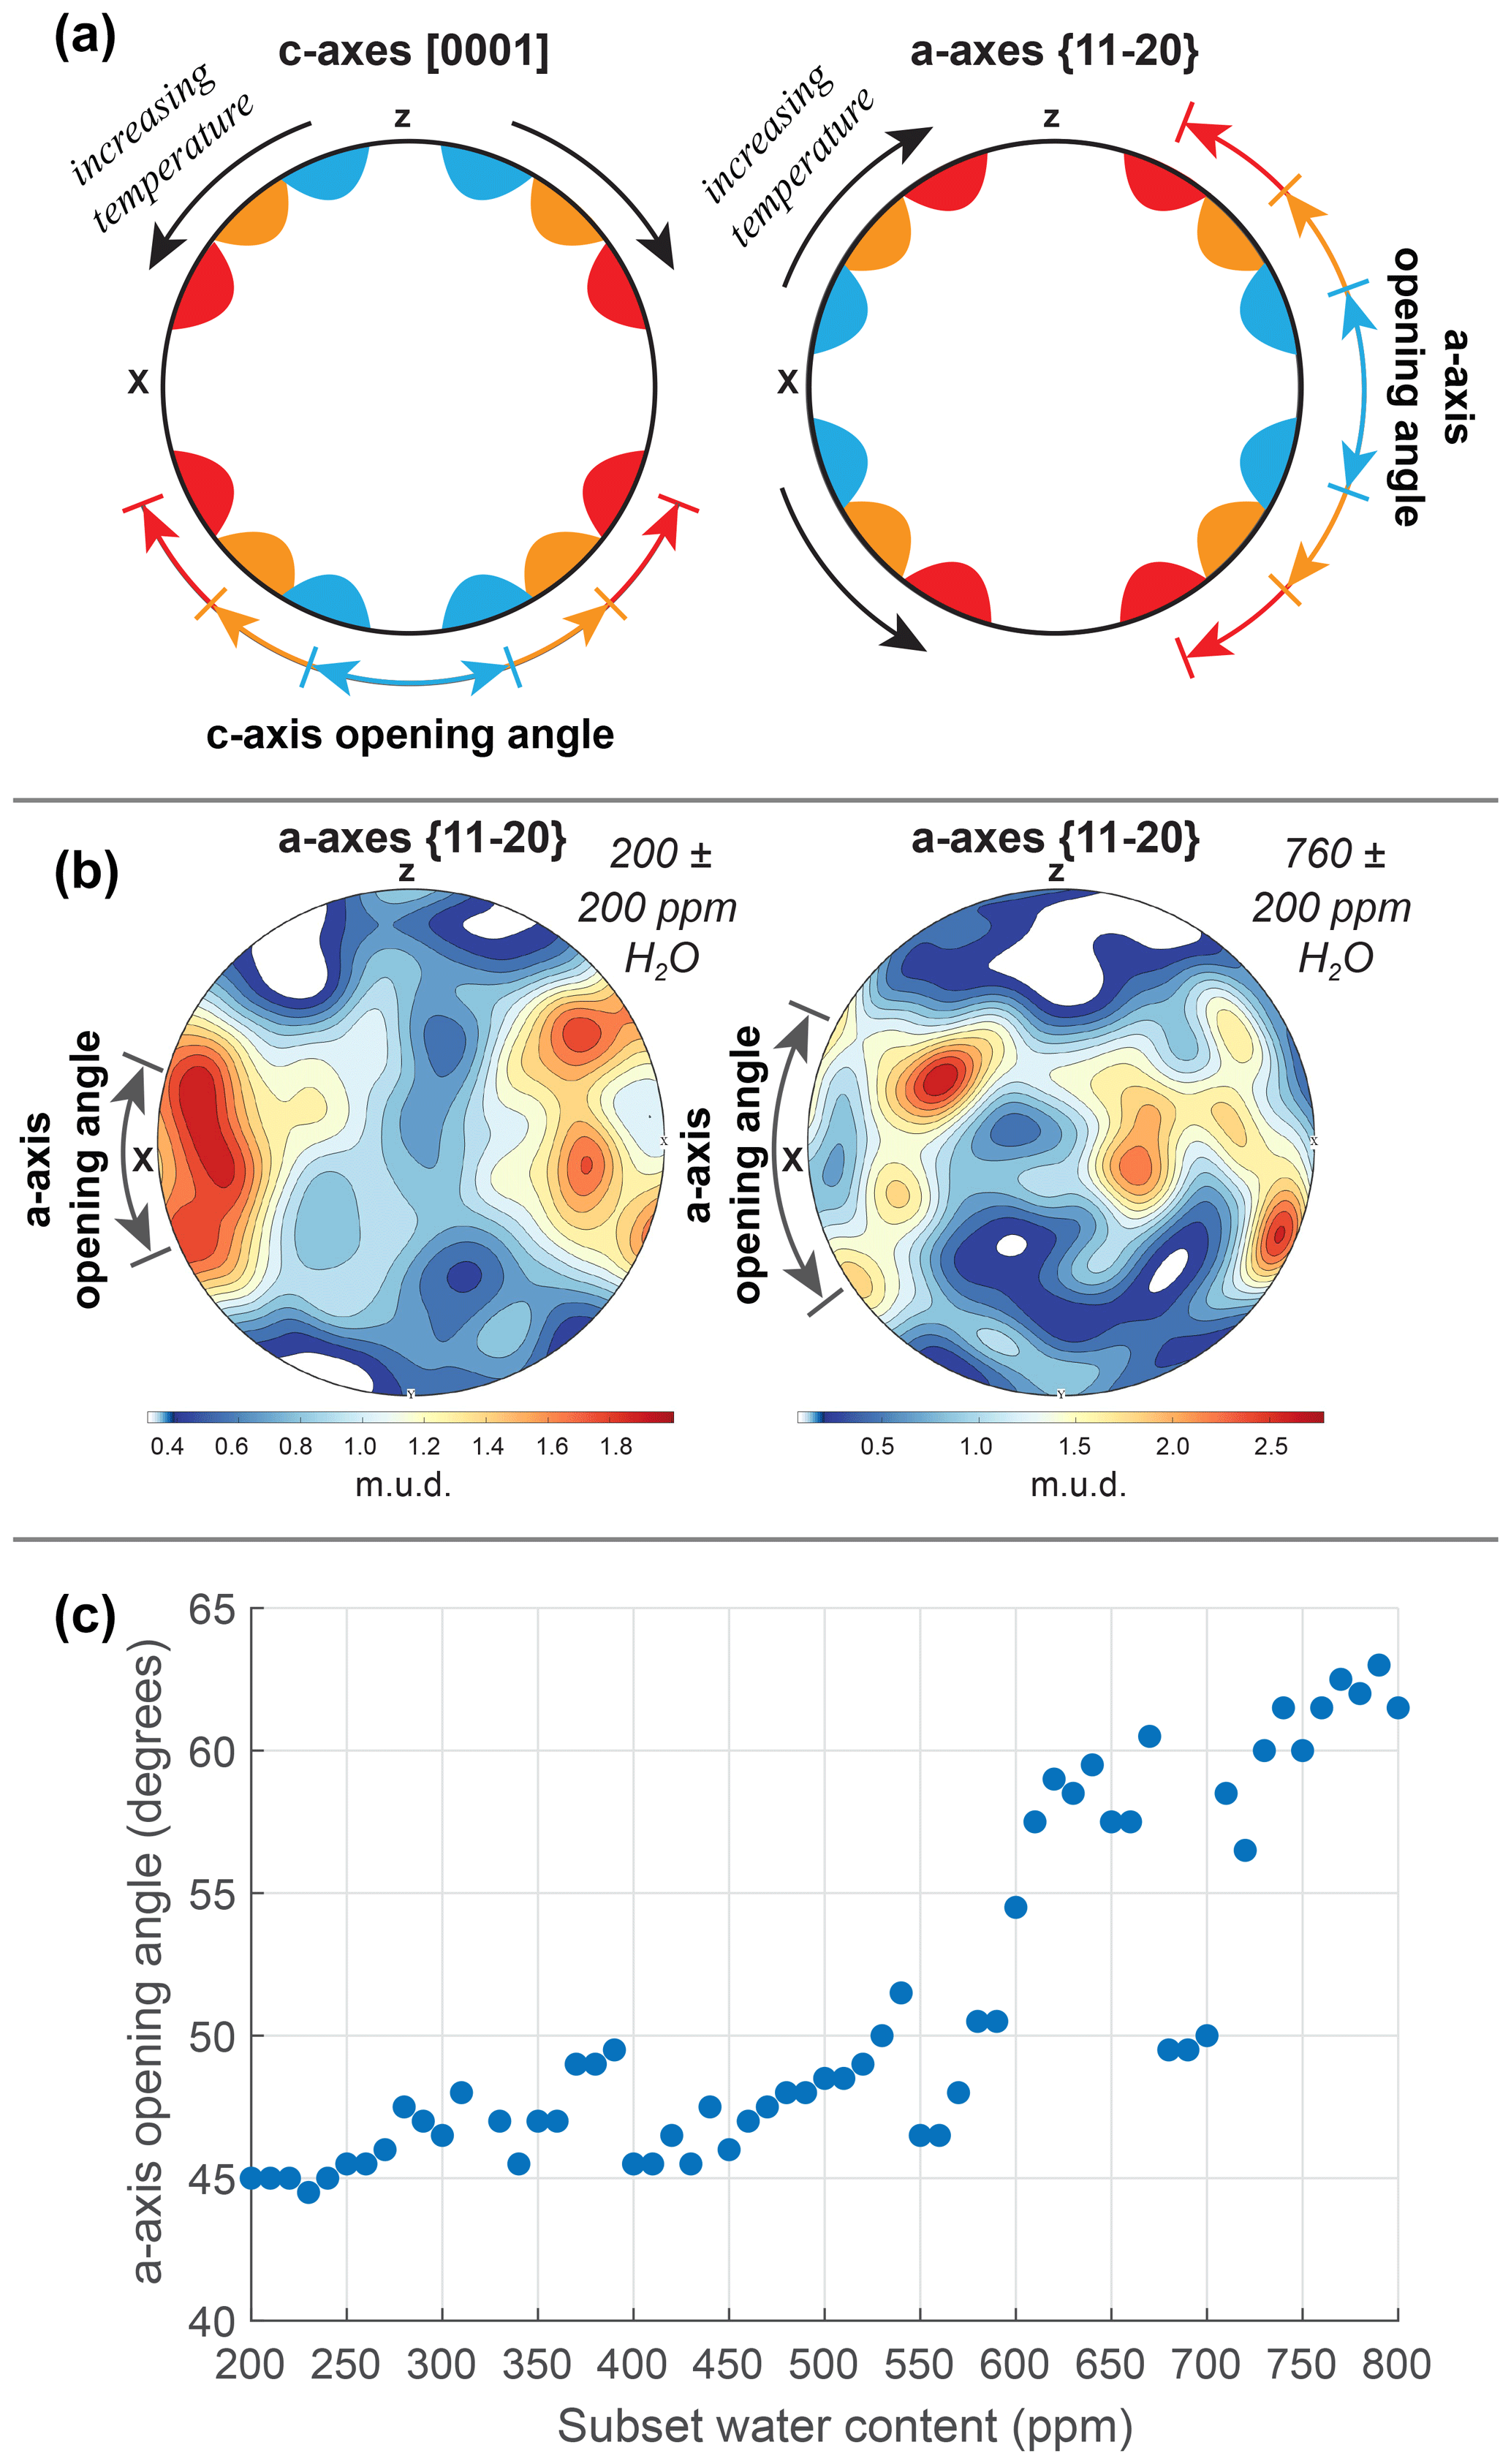
Figure 7(a) Sketch illustrating the relationship between c-axis and a-axis opening angles and temperature. The colored areas show the points of intersection of a fabric skeleton and the margin of a pole figure for relatively cool (blue), warm (orange), and hot (red) deformation conditions for c axes (left) and a axes (right). (b) Example a-axis distributions for two data subsets with different water contents, 200±200 ppm H2O (left) and 760±200 ppm H2O (right). (c) Plot of a-axis opening angles as a function of water content; each point represents the center of a subset containing data with water contents spanning a range of 400 ppm H2O.
5.2 Strain, water, and dehydration
Although higher water content has been proposed to promote intracrystalline deformation through hydrolytic weakening (e.g., Griggs and Blacic, 1965), our data lack a correlation between aspect ratio (a proxy for strain) and water content (Fig. 6). In fact, we observe instead that the most elongated grains in our dataset tend to be relatively dry (H2O ppm < 500). These results agree with recent field-based studies that document an inverse correlation between deformation intensity and water content (Finch et al., 2016; Kilian et al., 2016; Kronenberg et al., 2020; Palazzin et al., 2018; Singleton et al., 2020).
Several mechanisms to achieve dehydration have been proposed. Recrystallization may enable water to be swept to grain boundaries that serve as pathways for rapid diffusion (Fukuda et al., 2023; Kronenberg et al., 2020; Palazzin et al., 2018), though the quartz in our study is generally un-recrystallized. Alternate mechanisms for dehydration include pipe diffusion along dislocations (Bakker and Jansen, 1994) or along microfractures (Palazzin et al., 2018; Tarantola et al., 2010). Fine extinction bands, often decorated with fluid inclusions, are abundant in the Antietam Formation (Fig. 2). These features have been proposed to form by the release of structurally bound water, and they therefore may represent pathways for fluid migration (e.g., Derez et al., 2015). We observe these lamellae most commonly in elongated grains, supporting the inference that grains dehydrate during deformation and fluid inclusions precipitate along dislocations (Drury, 1993). While a complete census is beyond the scope of our work, we find that many grains interpreted to deform by prism [c] have lower aspect ratios and appear clear under plane-polarized light, lacking conspicuous fluid inclusions. Although a high water content may promote slip in these grains by prism [c], the low deformation temperature may produce sluggish dislocation creep and lower intracrystalline strain that minimizes fluid migration.
Supporting materials, including a data table and an animation, are available at https://doi.org/10.5281/zenodo.12789137 (Rahl et al., 2024).
JMR: conceptualization, data curation, formal analysis, funding acquisition, investigation, methodology, project administration, resources, software, supervision, validation, visualization, writing – original draft preparation, writing – review and editing. BM: funding acquisition, investigation, methodology, software, writing – review and editing. KSB: conceptualization, methodology, resources, supervision, writing – review and editing. JSS: conceptualization, resources, writing – review and editing.
The contact author has declared that none of the authors has any competing interests.
Publisher's note: Copernicus Publications remains neutral with regard to jurisdictional claims made in the text, published maps, institutional affiliations, or any other geographical representation in this paper. While Copernicus Publications makes every effort to include appropriate place names, the final responsibility lies with the authors.
We benefited from reviews by Florian Fusseis and James Gilgannon, as well as comments by Andreas Kronenberg, Chris J. L. Wilson, and an anonymous reviewer on an earlier version of the manuscript.
This research has been supported by Washington and Lee University through a Lenfest grant to Jeffrey M. Rahl and a Summer Research Scholars award to Brendan Moehringer.
This paper was edited by Florian Fusseis and reviewed by James Gilgannon and Florian Fusseis.
Bakker, R. J. and Jansen, J. B. H.: A mechanism for preferential H2O leakage from fluid inclusions in quartz, based on TEM observations, Contrib. Miner. Petr., 116, 7–20, 1994.
Beran, A.: Infrared spectroscopy of micas, Rev. Mineral. Geochem., 46, 351–369, 2002.
Blacic, J. D.: Plastic-deformation mechanisms in quartz: the effect of water, Tectonophysics, 27, 271–294, 1975.
Blacic, J. D. and Christie, J. M.: Plasticity and hydrolytic weakening of quartz single crystals, J. Geophys. Res.-Sol. Ea., 89, 4223–4239, 1984.
Cordier, P. and Doukhan, J.-C.: Water solubility in quartz and its influence on ductility, Eur. J. Mineral., 1, 221–238, https://doi.org/10.1127/ejm/1/2/0221, 1989.
Derez, T., Pennock, G., Drury, M., and Sintubin, M.: Low-temperature intracrystalline deformation microstructures in quartz, J. Struct. Geol., 71, 3–23, 2015.
Drury, M. R.: Deformation lamellae in metals and minerals, in: Defects and Processes in the Solid State: Geoscience Applications: The McLaren Volume, Developments in Petrology, 14, edited by: Boland, J. N. and Fitzgerald, J. D., Elsevier, Amsterdam, 195–212, ISBN 9780444817006, 1993.
Faleiros, F. M., Moraes, R., Pavan, M., and Campanha, G. A. C.: A new empirical calibration of the quartz c-axis fabric opening-angle deformation thermometer, Tectonophysics, 671, 173–182, https://doi.org/10.1016/j.tecto.2016.01.014, 2016.
Finch, M. A., Weinberg, R. F., and Hunter, N. J. R.: Water loss and the origin of thick ultramylonites, Geology, 44, 599–602, https://doi.org/10.1130/G37972.1, 2016.
Fukuda, J., Okudaira, T., and Ohtomo, Y.: Water release and homogenization by dynamic recrystallization of quartz, Solid Earth, 14, 409–424, https://doi.org/10.5194/se-14-409-2023, 2023.
Griggs, D. T. and Blacic, J. D.: Quartz: Anomalous Weakness of Synthetic Crystals, Science, 147, 292–295, https://doi.org/10.1126/science.147.3655.292, 1965.
Hielscher, R. and Schaeben, H.: A novel pole figure inversion method: specification of the MTEX algorithm, J. Appl. Crystallogr., 41, 1024–1037, 2008.
Hunter, N. J. R., Weinberg, R. F., Wilson, C. J. L., and Law, R. D.: A new technique for quantifying symmetry and opening angles in quartz c-axis pole figures: Implications for interpreting the kinematic and thermal properties of rocks, J. Struct. Geol., 112, 1–6, https://doi.org/10.1016/j.jsg.2018.04.006, 2018.
Joy, S. and Saha, D.: Dynamically recrystallised quartz c-axis fabrics in greenschist facies quartzites, Singhbhum shear zone and its footwall, eastern India – influence of high fluid activity, J. Struct. Geol., 22, 777–793, 2000.
Jung, H., Katayama, I., Jiang, Z., Hiraga, T., and Karato, S.-I.: Effect of water and stress on the lattice-preferred orientation of olivine, Tectonophysics, 421, 1–22, 2006.
Keller, L. M. and Stipp, M.: The single-slip hypothesis revisited: Crystal-preferred orientations of sheared quartz aggregates with increasing strain in nature and numerical simulation, J. Struct. Geol., 33, 1491–1500, 2011.
Kilian, R., Heilbronner, R., Holyoke, C. W., Kronenberg, A. K., and Stünitz, H.: Dislocation creep of dry quartz, J. Geophys. Res.-Sol. Ea., 121, 3278–3299, https://doi.org/10.1002/2015JB012771, 2016.
Kolb, J., Rogers, A., Meyer, F. M., and Siemes, H.: Dominant coaxial deformation of veins during the interseismic stage of the fault-valve cycle: microfabrics of laminated quartz veins of the Hutti gold mine, India, J. Struct. Geol., 27, 2043–2057, 2005.
Kronenberg, A. K. and Tullis, J.: Flow strengths of quartz aggregates: Grain size and pressure effects due to hydrolytic weakening, J. Geophys. Res., 89, 4281–4297, https://doi.org/10.1029/JB089iB06p04281, 1984.
Kronenberg, A. K., Ashley, K. T., Francsis, M. K., Holyoke III, C. W., Jezek, L., Kronenberg, J. A., Law, R. D., and Thomas, J. B.: Water loss during dynamic recrystallization of Moine thrust quartzites, northwest Scotland, Geology, 48, 557–561, https://doi.org/10.1130/G47041.1, 2020.
Kruhl, J. H.: Reply: prism- and basal-plane parallel subgrain boundaries in quartz: a microstructural geothermobarometer, J. Metamorph. Geol., 16, 142–146, 1998.
Law, R. D.: Deformation thermometry based on quartz c-axis fabrics and recrystallization microstructures: A review, J. Struct. Geol., 66, 129–161, https://doi.org/10.1016/j.jsg.2014.05.023, 2014.
Linker, M. F., Kirby, S. H., Ord, A., and Christie, J. M.: Effects of compression direction on the plasticity and rheology of hydrolytically weakened synthetic quartz crystals at atmospheric pressure, J. Geophys. Res.-Sol. Ea., 89, 4241–4255, 1984.
Lloyd, G. E., Farmer, A. B., and Mainprice, D.: Misorientation analysis and the formation and orientation of subgrain and grain boundaries, Tectonophysics, 279, 55–78, https://doi.org/10.1016/S0040-1951(97)00115-7, 1997.
Mainprice, D., Bouchez, J.-L., Blumenfeld, P., and Tubià, J. M.: Dominant c slip in naturally deformed quartz: Implications for dramatic plastic softening at high temperature, Geology, 14, 819–822, 1986.
Morgan, S. S. and Law, R. D.: Unusual transition in quartzite dislocation creep regimes and crystal slip systems in the aureole of the Eureka Valley–Joshua Flat–Beer Creek pluton, California: a case for anhydrous conditions created by decarbonation reactions, Tectonophysics, 384, 209–231, 2004.
Muto, J., Hirth, G., Heilbronner, R., and Tullis, J.: Plastic anisotropy and fabric evolution in sheared and recrystallized quartz single crystals, J. Geophys. Res., 116, B02206, https://doi.org/10.1029/2010JB007891, 2011.
Neumann, B.: Texture development of recrystallised quartz polycrystals unravelled by orientation and misorientation characteristics, J. Struct. Geol., 22, 1695–1711, https://doi.org/10.1016/S0191-8141(00)00060-2, 2000.
Okudaira, T., Takeshita, T., Hara, I., and Ando, J.: A new estimate of the conditions for transition from basal 〈a〉 to prism [c] slip in naturally deformed quartz, Tectonophysics, 250, 31–46, https://doi.org/10.1016/0040-1951(95)00039-4, 1995.
Palazzin, G., Raimbourg, H., Stünitz, H., Heilbronner, R., Neufeld, K., and Précigout, J.: Evolution in H2O contents during deformation of polycrystalline quartz: An experimental study, J. Struct. Geol., 114, 95–110, 2018.
Rahl, J. M., Moehringer, B., Befus, K. S., and Singleton, J. S.: Data supporting “Influence of water on crystallographic preferred orientation patterns in a naturally-deformed quartzite”, Zenodo [data set], https://doi.org/10.5281/zenodo.12789137, 2024.
Schmid, S. M. and Casey, M.: Complete fabric analysis of some commonly observed quartz c-axis patterns, Geophys. Monog., 36, 263–286, 1986.
Shu, Y., Wang, Z., Yang, H., Chen, X., Bai, J., and Pan, F.: Optimized method for the identification of slip directions in Mg alloy based on intragranular misorientation axes analysis, Journal of Materials Research and Technology, 23, 6140–6149, 2023.
Singleton, J. S., Rahl, J. M., and Befus, K. S.: Rheology of a coaxial shear zone in the Virginia Blue Ridge: Wet quartzite dislocation creep at ∼ 250–280 °C, J. Struct. Geol., 140, 104109, https://doi.org/10.1016/j.jsg.2020.104109, 2020.
Stalder, R.: OH point defects in quartz – a review, Eur. J. Mineral., 33, 145–163, 2021.
Stipp, M., Stünitz, H., Heilbronner, R., and Schmid, S. M.: The eastern Tonale fault zone: a “natural laboratory” for crystal plastic deformation of quartz over a temperature range from 250 to 700 °C, J. Struct. Geol., 24, 1861–1884, https://doi.org/10.1016/S0191-8141(02)00035-4, 2002.
Tarantola, A., Diamond, L. W., and Stünitz, H.: Modification of fluid inclusions in quartz by deviatoric stress I: experimentally induced changes in inclusion shapes and microstructures, Contrib. Miner. Petr., 160, 825–843, 2010.
Thomas, S.-M., Koch-Müller, M., Reichart, P., Rhede, D., Thomas, R., Wirth, R., and Matsyuk, S.: IR calibrations for water determination in olivine, r-GeO2, and SiO2 polymorphs, Phys. Chem. Miner., 36, 489–509, 2009.
Toy, V. G., Prior, D. J., and Norris, R. J.: Quartz fabrics in the Alpine Fault mylonites: Influence of pre-existing preferred orientations on fabric development during progressive uplift, J. Struct. Geol., 30, 602–621, 2008.
Vollmer, F. W.: Automatic contouring of geologic fabric and finite strain data on the unit hyperboloid, Comput. Geosci., 115, 134–142, 2018.
Wallis, D., Hansen, L. N., Tasaka, M., Kumamoto, K. M., Parsons, A. J., Lloyd, G. E., Kohlstedt, D. L., and Wilkinson, A. J.: The impact of water on slip system activity in olivine and the formation of bimodal crystallographic preferred orientations, Earth Planet. Sc. Lett., 508, 51–61, https://doi.org/10.1016/j.epsl.2018.12.007, 2019.