the Creative Commons Attribution 4.0 License.
the Creative Commons Attribution 4.0 License.
Increased metamorphic conditions in the lower crust during oceanic transform fault evolution
Myron F. H. Thomas
Christian Heine
Jörg Ebbing
Andrey Seregin
Jimmy van Itterbeeck
Oceanic transform faults connect the segments of active spreading ridges that slide past each other. In a classical view, transform faults are considered conservative, where no material is added or destroyed. Recent studies, however, suggest that the crust in the transform fault region is deformed during different episodes and is therefore non-conservative. We combine high-resolution 3D broadband seismic data with shipborne potential field data to study ancient oceanic fracture zones in Albian–Aptian aged oceanic crust in the eastern Gulf of Guinea offshore São Tomé and Príncipe. The crust in this region is characterized by a thin, high-reflective upper crust, underlain by a thick, almost seismically transparent lower crust. At the paleo-transform faults, the lower crust, however, comprises reflectors, which dip towards the transform fault and were previously interpreted as extrusive lava flows at an extensionally thinned inside corner. The lower crust therefore defines the target area for inversion and forward modeling of the potential field data. The chosen seismic horizons are used as geometrical boundaries of the crustal model. First, we perform a lateral parameter inversion for the lower crust, which provides vertical columns of density and magnetic susceptibility. Second, we sort the estimated values using a clustering approach and identify five groups with common parameter relationships. Third, we use the clustered lower-crustal domains to define a consistent 3D model of the study area that aligns with the seismic structure and geological concepts, which is preferred over the simple inversion of the first step. The final model generally shows anomalous low susceptibility and medium to high densities close to the buried fracture zones, which reflects increasing pressure and temperature as the transform faults evolved. This is accompanied by a change in metamorphic facies from prehnite-pumpellyite to greenschist. Our model indicates evolving extension and a second magmatic phase during juxtaposition against the trailing ridge segment. These results are in line with recent studies and strengthen the impressions of a widespread non-conservative character of transform faults.
- Article
(18845 KB) - Full-text XML
- BibTeX
- EndNote
Oceanic fracture zones (OFZs) are inactive remnants of ancient transform faults. Studies of transform fault processes are typically performed on modern crust at mid-oceanic ridges using bathymetric (e.g., Olive et al., 2015; Somoza et al., 2021), seismic (refraction and controlled-source, e.g., Keen and Tramontini, 1970; Lizarralde et al., 2004; Vaddineni et al., 2021), seismological (e.g., Rundquist and Sobolev, 2002; Schlindwein and Schmid, 2016), gravity (e.g., Wessel et al., 2015) and magnetic data (e.g., Matthews et al., 2011). In general, gravity and magnetic anomalies are caused by variations in density and magnetic susceptibility in the subsurface. In offshore systems, the seafloor and the Moho boundary reflect the main density contrasts. However, there are also notable sources within the oceanic crust (e.g., Catalán et al., 2023; Osorio-Granada et al., 2022). In ancient buried ridge–transform settings, the distribution of the sources is complicated by the addition of overlying sediments, which may decrease the density contrast to the oceanic crust underneath. Yet, their distribution is important to understand the formation of transform faults and their transition to fracture zones. In this study, we investigate the density and magnetic susceptibility structure of the oceanic crust in the eastern Gulf of Guinea, which hosts a set of buried Albian–Aptian-aged fracture zones.
In the simplest view, transform faults are conservative plate boundaries where no material is added or destroyed. Strike-slip movement, generated at adjacent spreading ridges, displaces oceanic crust in opposing directions along vertical fault planes (e.g., Wilson, 1965). Recent studies suggest a more complex interaction between ridge segments and transform faults. Indeed, negative gravity anomalies (i.e., residual mantle Bouguer anomalies) along transform faults show a correlation with the spreading rate of the adjacent mid-oceanic ridge (Gregg et al., 2007). This suggests a mass deficit underneath fast-slipping transform faults compared to adjacent ridge segments, which could indicate crustal thickening of magmatic material close to fast-slipping transform faults. In contrast, Guo et al. (2023) suggest that the crust is systematically thinner underneath transform faults compared to adjacent fracture zones. These studies primarily use potential field data for crustal thickness estimates but are unable to distinguish the internal density structure of the crust, which contributes to the observed signals.
Three-dimensional plastic shear-based numerical modeling showed that the inside corner between ridge and transform may not be purely conservative but can be accompanied by oblique shear and horizontal extension (Grevemeyer et al., 2021). Interpretation of 3D seismic reflection data offshore of São Tomé and Príncipe of Albian slow-spreading crust provided observational evidence for the oblique shear model, where the inside corner of the ridge–transform intersection acts as a conduit for decompression melt and volcanism (Thomas et al., 2022). Growth packages of extrusive lavas termed transform normal dipping reflectivity (TNDR packages) thickened towards the transform fault and record extension and crustal detachment. A basal bounding surface dipping at 35°, the TNDR-B, limits the TNDR package and terminates down onto the Moho. A schematic example of the TNDR geometry is provided in Thomas et al. (2022, their Fig. 7). The TNDR-B was interpreted as a crustal-scale detachment fault, which likely provides a conduit for melt feeding the TNDR lava packages. Sealing of the TNDR packages by abyssal-hill geometries occurred during juxtaposition of the inside-corner crust against the trailing spreading ridge. This second magmatic pulse dates the TNDR extension to be a transform fault process rather than a younger fracture zone process. This evolution was similarly interpreted by Grevemeyer et al. (2021) from observations of apparent infilling of the transform valley towards the fracture zone. If such processes are common, then TNDR packages are expected to leave signatures in density and magnetic properties, which contrast to the adjacent “typical oceanic crust” and therefore should be seen in potential field data.
Combining high-resolution seismic data with potential field data provides the opportunity to reveal the internal architecture and complexity of fracture zones and adjacent crustal segments (e.g., Antobreh et al., 2009; Marjanović et al., 2020). Here, we combine published seismic observations, including the TNDR packages, with shipborne potential field data to model the density and susceptibility structure of the crust in São Tomé and Príncipe. Our results reveal distinct anomalies in the vicinity of OFZ and TNDR packages that differentiate them from the surrounding oceanic crust.
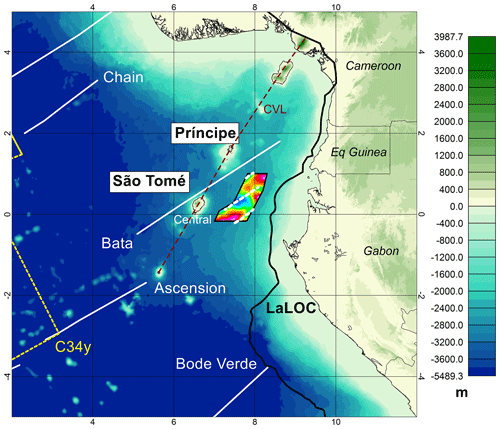
Figure 1Bathymetry of the Gulf of Guinea taken from GEBCO (General Bathymetric Chart of the Oceans). The study area offshore São Tomé and Príncipe is highlighted by the color-filled polygon. Solid white lines indicate the OFZs, which was taken from the global seafloor fabric database (Matthews et al., 2011). The bold black line indicates the landward limit of oceanic crust (LaLOC, taken from Heine et al., 2013). The dashed white lines define the fracture zones mapped with 3D seismic data (Thomas et al., 2022). The dashed yellow line indicates magnetic isochron C34y at 83 Ma, taken from Heine et al. (2013). The dashed dark red line connects the topographic highs, which are a consequence of the Cameroon Volcanic Line (CVL).
The study area is situated in the territorial waters of São Tomé and Príncipe and to the west of Gabon (Fig. 1). The bathymetry is characterized by a gentle ascent towards the passive margin, ranging from 3000 m below sea level (m b.s.l.) in the most offshore part in the southwest up to approximately 2350 close to the landward limit of oceanic crust (LaLOC) (Fig. 1).
To the west of the study area, the islands of São Tomé and Príncipe are the result of major Neogene volcanism along the Cameroon Volcanic Line (CVL) (Lee et al., 1994). The few sills that intruded into the sedimentary overburden and are recognized in the 3D seismic data in the south of the study area are the only indications of the CVL within the study area. Nevertheless, previous potential field studies in the basin have focused on the CVL structure in relation to upper-mantle processes and the uplift of oceanic crust (Meyers et al., 1998; Wilson et al., 2003). The timing of the CVL significantly postdates the Albian aged oceanic crust and is not discussed in this study.
The Global Seafloor Fabric Data Base (Matthews et al., 2011) shows a series of OFZ close to but outside of the study area (Fig. 1). The Ascension Fracture Zone (FZ) in the south and the Bata FZ in the north come closest to the survey outline. High-resolution broadband 3D seismic data used in this study map the Bata FZ further south, inside the NW part of the study area, and the Ascension FZ in the southern part of the study area (Thomas et al., 2022). The Ascension FZ extends close to the LaLOC and is a feature that is not captured in the global data compilation. Additionally, a third SE–NW-trending fracture zone is mapped on 3D seismic data, crossing the central part of the study area and was termed the “Central Fracture Zone” (Thomas et al., 2022).
The LaLOC is situated within a few tens of kilometers to the east of the study area and contains strong right lateral offsets, which approximately reflect the terminations of the mapped OFZ (Thomas et al., 2022). The abyssal-hill fabric is observed on the seismically mapped top oceanic crust with a northwest–southeast-trending ridge fabric in accordance with the perpendicular orientation of the fracture zones and a southwest–northeast-oriented spreading direction. The study area therefore lies exclusively on oceanic crust.
Precise dating of the age of the oceanic crust in the study area is difficult due to it having an age within the range of the Cretaceous Normal Superchron (CNS) (Granot et al., 2012) and lacking direct control through wells. The closest isochron is the young end of C34n (83.5 Ma) (Heine et al., 2013; Ogg, 2020). While magnetic anomaly identifications and global oceanic crustal age models map the age of the crust between 110–120 Ma (Seton et al., 2020), plate kinematic model-derived ages suggest a formation age between 105–110 Ma (Heine et al., 2013). Discrepancies are partly reflected in the age grid misfit of the global model (Seton et al., 2020), choices of the location of the LaLOC and plate kinematic models used. Disregarding the exact age of the oceanic crust, the absence of magnetic stripe patterns hampers precise assumptions on remanent magnetization and spreading velocity. However, for the latter, basement roughness, known as rugosity, can be utilized (e.g., Tucholke et al., 2023). In agreement with the present-day Mid-Atlantic Ridge, the high rugosity of the oceanic crust within the study area indicates slow to moderate spreading velocities, which are in line with plate kinematic model predictions (Thomas et al., 2022; Heine et al., 2013).
The seismic, marine gravity and magnetic data used in this study were acquired simultaneously in a survey area of ca. 16 050 km2 by the M/V Oceanic Endeavour. The survey was conducted by CGG Multi-Physics and lasted from January to August 2017. During this period, 23 886 km of gravity data and 23 960 km of magnetic data were collected with individual profile spacing of approximately 600 m. For this study, a subset of the data are available, covering an area of 8000 km2 (Fig. 1).
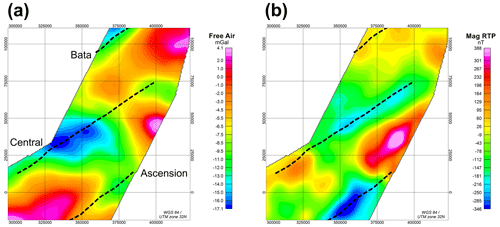
Figure 2(a) Free-air gravity anomaly. (b) RTP magnetic anomaly. Dashed lines indicate OFZ in the study area, taken from Thomas et al. (2022).
3.1 Potential field data
Gravity and magnetic data processing was performed by CGG Multi-Physics and consisted of several key stages, which are described in Appendix A.
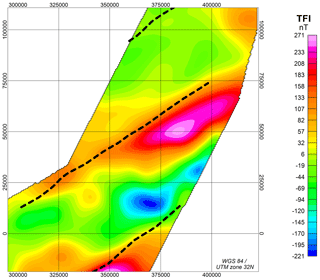
The free-air gravity anomaly was selected as input for the inversion of the crustal density (Fig. 2a). For the inversion of the magnetic data, the reduction-to-pole (RTP) data set was chosen (Fig. 2b). Both data sets are gridded in a lateral resolution of 200 m. In Appendix A, we also show the total field intensity data (Fig. A1).
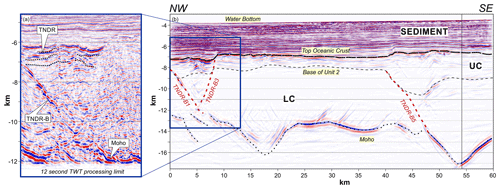
Figure 3Seismic dip line equivalent to GeoTIFF location 5 (see Fig. 4 for location). UC stands for upper crust, while LC stands for lower crust. TNDR is the transform normal dipping reflectivity. Solid lines mark the bounding horizons between the layers. Dashed red lines define areas of increased reflectivity in the lower crust (TNDR-B horizons). Panel (a) shows the Kirchhoff migration with a maximum pre-stack depth migration processing limit of 12 km, as used in Thomas et al. (2022). Panel (b) shows the full-record-length Beam migration data set, which allowed for a complete interpretation of the Moho for this study (Fig. 4d).
3.2 Seismic data
The seismic data set is a broadband 3D acquisition with a shot spacing of 25 m. Details of the acquisition and processing workflow can be found in Thomas et al. (2022). Thomas et al. (2022) utilized a Kirchhoff pre-stack depth migration (PSDM) providing a more reliable placement of reflectors and amplitudes but with a limited 12 km processed depth limit. A simple Gaussian Beam migration provided a lower-resolution migration but to the full 18 s two-way time (TWT) record length, such that the entire Moho and part of the upper mantle are included (Fig. 3). For this study, crustal seismic interpretation from the Kirchhoff migration (Thomas et al., 2022) is combined with observations and Moho interpretation from the Beam migration. The PSDM-derived interval velocity model was used for depth conversion of all horizons in the model. Crustal seismic velocities form a smooth increasing trend, typically ranging from 4 to 6 km s−1 for the upper crust and 6 to 7 km s−1 for the lower crust (see Thomas et al., 2022, for further details).
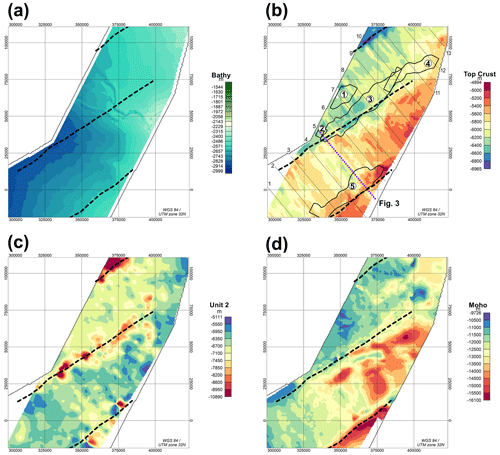
Figure 4Depth of seismic horizons that are used as geometrical constraints for the crustal model: (a) bathymetry, (b) top crust, (c) bottom of Unit 2 and (d) Moho boundary. Horizons with exception of the Moho are taken from the study of Thomas et al. (2022). Thick dashed lines indicate the OFZ. Panel (b) shows additional structural data. Black polygons define the aerial extent of the TNDR-B surfaces, labeled from 1 to 5 according to Thomas et al. (2022). Thin solid lines indicate section locations, which are used to define the model in IGMAS+ (see Sect. 3.3), labeled from 1 to 13. The dotted violet line defines the seismic cross-section shown in Fig. 3.
The 3D seismic data are used to provide a series of discrete dip line GeoTIFFs oriented perpendicular to the fracture zones (Fig. 4). In addition, several seismic horizons mapped on the 3D seismic data and published in Thomas et al. (2022) are used to define the boundaries between different crustal units. These boundaries comprise the water bottom (Fig. 4a), the top oceanic crust (Fig. 4b), the base of Unit 2 (Fig. 4c) and the Moho (Fig. 4d). The events are provided in depth using a pre-stack depth migration velocity model generated during the data processing workflow (see Thomas et al., 2022, for details).
Unit 2 of Thomas et al. (2022) is the uppermost layer of oceanic crust, defined as containing horizontal to subhorizontal high-amplitude reflectors with a lateral continuity of 2 to 5 km. It is interpreted as a mixture of extrusive lavas (i.e., Layer 2A) and sediments. The base of the Unit 2 horizon therefore separates this portion from the transparent seismic facies that makes up the lower crust (Fig. 3). Limited lower-crust reflectivity comes in the form of predominantly northwest-dipping, steeply inclined reflectors, which terminate at the Moho and are spatially constrained to the southeastern portion of the data set. They were described and interpreted by Thomas et al. (2022) as analogous to those in oceanic crust from areas including Alaska (Bécel et al., 2015) and the Enderby Basin of the Indian Ocean (Sauter et al., 2021), where the origins are interpreted as shear zones or dike-intruded faults occurring at the spreading axis. These features were therefore interpreted to be syn-magmatic and dating from the formation age of the oceanic crust. For details of the seismic stratigraphy, the reader is referred to the study of Thomas et al. (2022).
Five TNDR-B detachment surfaces from within the fracture zones are also included in the model and are labeled 1 through 5. As defined in Sect. 1, these detachment surfaces link the Moho to the top oceanic crust and mark a key lateral boundary between “standard” oceanic crust and the TNDR packages of the FZ. Their planform outlines are also included (Fig. 4b). The mapped locations of the fracture zones (Figs. 2 and 4) are derived from FZ topographical scarps on the top oceanic crust horizon (Fig. 4b).
3.3 Defining the crustal model
The boundaries shown in Fig. 3 represent the major contrasts and are implemented in GM-SYS 3D, part of Oasis Montaj, which is a gravity and magnetic modeling software for layered-earth models. As an extension, GM-SYS 3D allows the lateral inversion for density and susceptibility of selected crustal layers. Calculations of the potential fields in GM-SYS 3D are performed in the wave number domain based on the Parker algorithm (Parker, 1973). Here, we use this software to invert the gravity and magnetic data to obtain a first-order density and susceptibility model of the crust.
Specifically, we focus the lateral inversion on the crustal material between the base of Unit 2 and the Moho, which we define as the lower crust of the model. The lower crust forms > 80 % of the crustal thickness and contrasts with the overlying high-amplitude reflectors (Fig. 4). This provides enough space for the TNDR-B surfaces, which are identified by enhanced seismic reflectivity, to detach at the Moho boundary.
To test for the possibility of an upper-crust contribution, we also present scenarios where the magnetic susceptibility is allowed to vary in the upper crust, while keeping the lower-crustal susceptibility constant (Fig. A2, Table A1). These scenarios, described in Sect. 4, demonstrate that the thin nature of the upper crust does not allow for it to be a significant contributor to the first-order density and susceptibility of the crust, such that the main anomalous intra-crustal sources are expected to be located in the lower crust.
Table 1Densities and susceptibilities of the five layers of the model.

a Depth-dependent density. b Starting values prior to inversion.
The gravity and magnetic sources contributing to the observed signals arise from the basal bounding horizons, whose properties are assigned with constant values (Table 1). Note that the main density contrasts are located at the water bottom and at the Moho boundary. For the lower crust, the values in Table 1 represent starting parameters prior to the inversion. During the inversion, the lateral densities and susceptibilities are iteratively updated until the misfit between the observed and modeled gravity and magnetic data reaches a user-defined threshold. We define thresholds of 1 mGal for gravity data and 10 nT for magnetic data, respectively. Several starting susceptibilities of the lower crust were tested to investigate the distribution of the inverted lateral susceptibility. We selected a starting susceptibility of χ = 0.15 SI units for the lower crust, as this represents the lower threshold to avoid negative susceptibilities in the inverted model. For the densities of the sediments, we apply a calibrated mudrock density–depth trend based on available well log data:
where zbml is depth below the mud line.
This gives sediment density values in a range between 2.0 and 2.56 g cm−3.
After inverting for the density and susceptibility of the lower crust separately, we use a clustering approach to differentiate geological units with similar properties. This allows us to investigate if gravity and magnetic data are sensitive to similar sources. Previous studies have interpreted density and susceptibility grids by cross-plot analysis with a 2D color scale (e.g., Fichler and Pastore, 2022) or Gaussian mixture models (e.g., Lösing et al., 2022). Here, we apply the latter algorithm to the inverted fields and define a certain number of clusters depending on the distribution of the parameters. These clusters represent different lower-crustal types.
In the next step, the laterally variable lower-crustal lithologies are implemented together with the bounding horizons and the TNDR-B surfaces in IGMAS+ (Götze and Lahmeyer, 1988; Anikiev et al., 2023). IGMAS+ is a software for 3D numerical modeling and interdisciplinary interpretation of potential fields. Compared to GM-SYS 3D it allows a more independent implementation of additional constraints and is therefore well suited to transform the vertical blocks of the inverted lower crust into a 3D geometry, which better links the model structure to the 3D seismic observations and thus better represents geological plausibility.
We define 13 cross-sections with a separation distance of approximately 10 km (Fig. 3a). The cross-sections are oriented oblique to the fracture zones in order to best capture the transition from the oceanic crust to the high-reflectivity crust close to the fracture zones. Densities and susceptibilities of the lower crust are modeled to fit the measured potential field data but are limited in the range of the obtained cluster types. Distinct reflectivity in the seismic dip lines was used as a proxy to define the geometry of the TNDR packages.
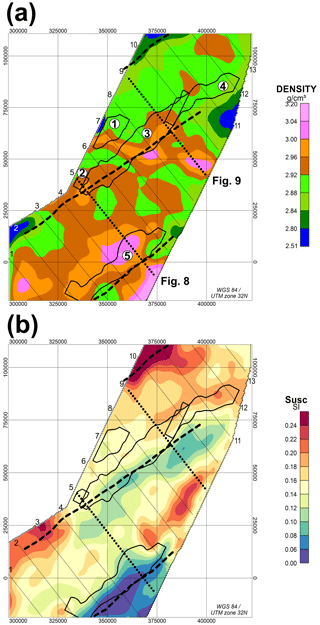
Figure 5Inverted densities (a) and susceptibilities (susc) (b) of the lower crust. Thick dashed black lines indicate fracture zones. Polygons mark the extent of the TNDR-B surface and are taken from Thomas et al. (2022). Encircled bold numbers in (a) indicate the respective number of the mapped TNDR-B according to Thomas et al. (2022). Dotted lines indicate cross-sections that are shown in Figs. 8 and 9. Regular numbers indicate the labels of the seismic cross-sections.
The inverted density of the lower crust shows a variable distribution (Fig. 5a). More than 95 % of the inverted density, which corresponds to twice the standard deviation 2σ, ranges between 2.82 and 3.02 g cm−3 (Fig. 5a) and reflects expected lower-crustal lithologies of basaltic and gabbroic materials (Dentith and Mudge, 2018). Peak values up to 2.51 g cm−3 in the lower limit and 3.20 g cm−3 in the upper limit are found only at the edge of the model and might represent artifacts caused by extrapolating the data as a preparatory step for the Fourier transform. Figure 5 also shows the outline of the TNDR-B surfaces, which are only found in the vicinity of the fracture zones (Thomas et al., 2022). Densities higher than 2.96 g cm−3 nucleate in those areas, where the two large surfaces TNDR-B 3 (Central FZ) and TNDR-B 5 (Ascension FZ) occur.
The inverted susceptibilities show strong variations, with values higher than 0.2 SI in the NW and SW of the model and lowest values below 0.05 SI in the SE of the model (Fig. 5b). Compared to density, the inverted susceptibilities extend up to the outermost range of crustal lithologies. Specifically, susceptibilities > 0.24 SI in the NW part (dark red colors in Fig. 5b) can only be expected for highly magnetic gabbros (Dentith and Mudge, 2018). The high susceptibility of the lower crust might indicate missing magnetization in the upper crust.
We have tested this by taking the average susceptibility as constant value for the lower crust and performing the lateral inversion for the upper crust only (see Appendix A). Compared to the lower crust inversion, the strength of the anomalies has strongly increased because the upper crust is much thinner than the lower crust and high susceptibility contrasts are necessary to fit the observed magnetic data (Fig. A3). However, the main structures are maintained with prominent low susceptibilities close to the Ascension and Central FZs (Fig. A3). Missing magnetization in the upper crust is therefore unlikely. The same conclusion can be drawn from inverting the susceptibility of the entire crystalline crust (upper and lower crust, Fig. A3).
It is more likely that the high susceptibilities at the NW edge of the model (Fig. 5b) reflect an artificial pattern, where the inversion tries to fit anomalies that are not fully covered in the data set. For structural interpretation we will not consider these high susceptibilities, as the TNDR-B sequences are instead located in the central and SW part of the model. Here, lower magnetization is found. Specifically, the Ascension FZ and the adjacent TNDR-B 5 surface reveal susceptibilities close to zero, implying almost magnetically transparent crustal material, which is investigated below in Sect. 5.
In the next step, the inverted densities and susceptibilities are investigated with the Gaussian mixture clustering algorithm (e.g., Lösing et al., 2022). This gives a first impression of how the sources of the inverted fields are related to each other. Given the simplicity of the utilized inversion approach, the distribution of the inverted parameters shows clear structures that can be attributed to certain clusters.
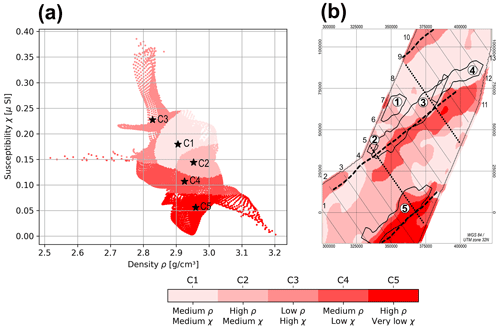
Figure 6Clustered density and susceptibility of the lower crust. (a) Density vs. susceptibility plot. Stars mark the average values of the respective cluster centers (Table 2). (b) Estimated clusters shown with a spatial map. Polygons and numbers indicate the extension of the TNDR sequences. Regular numbers indicate the labels of the cross-sections.
Table 2Average values and standard deviations of density ρ and susceptibility χ for the different clusters.

We define five lower-crustal clusters C1–C5, as this number coincides with well-defined segments of density and susceptibility (Fig. 6). The highest-frequency group C1 shows medium density and medium susceptibility, varying between 2.85–3.0 g cm−3 and 0.15–0.24 SI, respectively (statistical values are denoted in Table 2). Two other groups are defined by high density between 2.90–3.05 g cm−3 and medium susceptibility (C2), and there is also a cluster with a broad range of density combined with a comparatively narrow range of low susceptibility between 0.08–0.14 SI (C4). Furthermore, the distribution shows two distinct arms, which are clustered as a combination of low density and high susceptibility (C3) and high density and very low susceptibility (C5). C3 contains the high susceptibilities at the NW edge of the study area mentioned previously. In contrast, C5 and C4 are located along the Ascension and Central FZs and their respective TNDR packages (Fig. 6b). The combination of a high-density and low-magnetic lower crust becomes especially evident in the vicinity of the Ascension FZ (Fig. 6b). The distribution of the individual TNDR packages is shown in Fig. A4. There is also statistical evidence that the TNDR sequences, especially TNDR 3 and TNDR 5, preferably represent a medium to high density and low susceptibility compared to the surrounding lower crust, which is represented in the clusters C4 and C5. This is evident by calculating the cluster distribution within the respective TNDR-B polygons (Table A2).
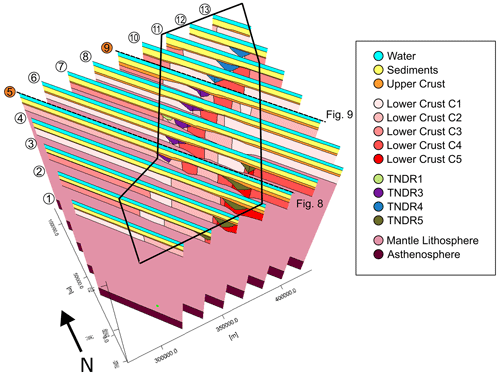
Figure 7A 3D IGMAS model with cross-sections, labeled from 1 to 13, that define the 3D geometry of the model. Sections 5 and 9 (Figs. 8 and 9) are highlighted in orange. The black polygon defines the boundary of the study area. The geometry of the five lower-crustal bodies is taken from the clustered domains. Note that the TNDR-B 2 surface is too small to be resolved in the model.
The estimated clusters are utilized as structural constraints to define crustal blocks within the model that are geologically plausible and correspond to the seismic horizons and interpretation of Thomas et al. (2022). Together with the other layers, the cluster-derived blocks are located on the 2D cross-sections and connected to a 3D model in IGMAS+. The model itself is defined from the surface to 100 km depth and therefore captures the mantle lithosphere and asthenosphere (Fig. 7). The properties of the lower-crustal blocks are allowed to vary laterally but must be constant for connected bodies. The range of possible variation in density and susceptibility is limited by the respective standard deviations, as listed in Table 2. For example, lower crust C1 along sections 6–10 in the NW part of the model may have different properties than lower crust C1 along sections 1–4 in the southern part. As an addition, the TNDR-B surfaces are incorporated in the model. Similar to the other bodies, their properties are constrained by the standard deviations (Fig. A4). In the 3D IGMAS model, the TNDR packages are recognized as lenticular structures that are clearly differentiated from the surrounding vertical blocks of the lower crust (Fig. 7).
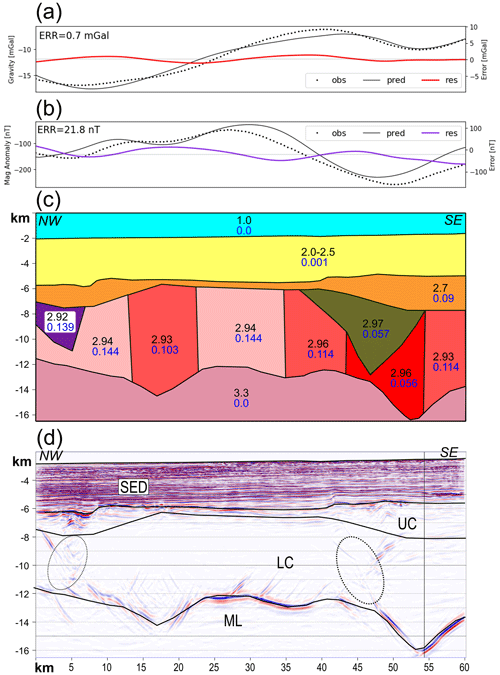
Figure 8A 2D profile across the Central and Ascension FZs (section 5 in Fig. 7). (a) Observed, predicted and residual gravity data. (b) Observed, predicted and residual magnetic data. The errors denote the standard deviation of the residual data. (c) IGMAS cross-section with densities (in g cm−3, black numbers) and susceptibilities (blue numbers) of the lower crust. The lower crust is split into several blocks, as obtained by cluster analysis. For coherent blocks, the density and susceptibility are allowed to vary within the standard deviation values (Table 2). TNDR structures are highlighted by violet (TNDR 3) and green (TNDR 5). (d) Beam migration seismic dip line with interpreted horizons taken from Thomas et al. (2022). SED is sediment, UC is the upper crust, LC is the lower crust and ML is the mantle lithosphere. Dashed ellipses mark TNDR-B 3 on the left and TNDR-B 5 on the right.
Two representative 3D seismic sections are selected to demonstrate the crustal structure along the Ascension and Central FZ and their respective TNDR packages. Each discrete seismic line is labeled in 5 km distance increments starting on the western side. The first cross-section, section 5, captures the surface extension of the Ascension FZ and the related TNDR 5 package in the SE part of the profile, as well as the onset of the Central FZ with a smaller package of TNDR 3 towards the NW (Fig. 8). The strongest reflections occur along the Moho boundary in the central and SE part of the profile (Fig. 8d). Toward the NW the reflectivity of the Moho boundary becomes more indistinct and vanishes with the onlapping TNDR 3 package.
In the central part of the model, between 10–35 km, seismic reflections partly correlate with the boundaries of the tectonic blocks, which are identified by the clustering. In the SE, high crustal densities are modeled for the TNDR 5 and the adjacent lower-crustal domains (Fig. 8c). The density of the TNDR 5 volume only differs slightly from the surrounding lower crust, which is also correlated with poor reflectivity inside the lower crust. This could indicate a 5 km wider extension of the TNDR 5 package towards the SE. However, the low susceptibility of the TNDR 5 reflects a sharp contrast to higher susceptibilities of the adjacent lower-crustal body of cluster C4. Towards the west, a smooth transition to higher susceptibility and lower density is modeled associated with missing lower-crustal reflectors. Pronounced lower-crustal reflectors between 0–5 km of the profile mark the onset of the TNDR-B 3 surface and are modeled with a slightly lower density of 2.92 g cm−3, which marks the lower boundary of the expected density range obtained from clustering.
The predicted signal generally matches with the observed trend of the gravity and magnetic data. The data mismatch of 0.7 mGal reflects the allowed range for the properties of the lower-crustal bodies. Enhanced reflectivity in the upper crust between 5–10 km markers of the profile and 6–8 km depth could indicate a change in crustal properties. Such small-scale lateral variations in the upper crust could also explain the mismatch in the magnetic data. An alternative source might arise from slight variations in the geometry of the lower-crustal bodies.
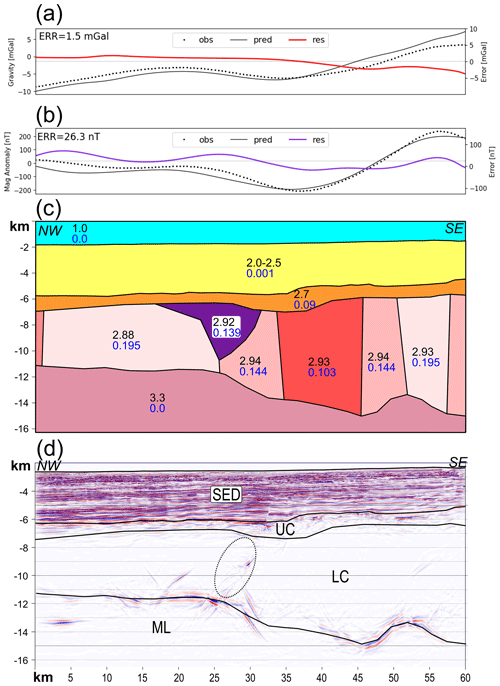
Figure 9A 2D profile across the Central FZ (section 9 in Fig. 7) (a) Observed, predicted and residual gravity data. (b) Observed, predicted and residual magnetic data. The errors denote the standard deviation of the residual data. (c) IGMAS cross-section with densities (in g cm−3, black numbers) and susceptibilities (blue numbers) of the lower crust. For coherent blocks, the density and susceptibility are allowed to vary within the standard deviation values (Table 2). The TNDR 3 package is highlighted in violet. (d) Beam migration seismic dip line with interpreted horizons, taken from Thomas et al. (2022). SED is sediment, UC is the upper crust, LC is the lower crust and ML is the mantle lithosphere. Dashed ellipses mark TNDR-B 3.
The second cross-section, section 9, is located perpendicular to the Central FZ (Figs. 7 and 9). It marks the boundary of the TNDR 3 package, which cross-cuts into the TNDR 4 package, accompanied by a change in the orientation of the dip direction (Thomas et al., 2022).
In general, the Moho boundary shallows from 14 km depth in the SE to 11 km depth in the offshore part in the NW (Fig. 9c and d). The reflection of the Moho boundary is not as sharp as in section 5. Prominent reflections are evident in the center of the profile at the 25 km marker, related to a sudden deepening of the Moho boundary, and in the SE, seen as a gentle shallowing of the Moho boundary from 15 to 13 km depth (Fig. 9d). In the lower crust, a constant density of 2.92–2.94 g cm−3 characterizes the central and eastern part. A sharp density gradient of 0.04 g cm−3 between the TNDR 3 package and the adjacent lower crust in observed in the NW of the model. The TNDR 3 package marks the transition of high-ρ–low-χ (C5) to medium-ρ–medium-χ crust (C1), which might also be identified by enhanced lower-crustal reflectors between 20–30 km makers (Fig. 9d). The western part is modeled as a constant lower-crustal body C1 with a density of 2.88 g cm−3. A long wavelength anomaly in the gravity data causes a mismatch of 1.4 mGal and might reflect a regional trend (Fig. A5).
The main susceptibility contrast is located at the western edge of the TNDR 3 package between the 20–25 km markers, modeled as a jump from 0.139 SI in the TNDR 3 package to 0.195 SI in the western lower-crustal body C1. Susceptibilities in the southeastern part mainly follow the average values of the clustering and fit the magnetic data (Fig. 9b). The main gradients in both susceptibility and density are located in the same area of the model, indicating a change in petrological properties at the western edge of the TNDR-B 5 surface.
5.1 Crustal structure along the fracture zones
Potential field data were used in previous studies to characterize the crust in ridge–transform settings. In many of these studies, the mantle Bouguer anomaly was modeled mainly by variations in crustal thickness (e.g., Lin et al., 1990; Prince and Forsyth, 1988; Gregg et al., 2007; Guo et al., 2023). Thin crust has been attributed to non-transform discontinuities connecting spreading segments along the Mid-Atlantic Ridge (MAR) and the Atlantis FZ, whereas thicker crust occurs beneath the spreading segments of the MAR (Lin et al., 1990). Along the Vema FZ, thin crust was found both in the active segment transform fault and in the inactive fracture zone, with a concentration of thin crust at the walls (Prince and Forsyth, 1988). In contrast, a more recent study shows significantly thinner crust in the transform deformation zone than in the adjacent fracture zone, which was interpreted as crustal thinning during transform faulting followed by magmatic accretion, which thickens the crust at the transition to passive fracture zones (Guo et al., 2023). Indeed, this second magmatic phase at the trailing ridge segment, at the transition from transform fault to fracture zone, was interpreted for the OFZ in this study from seismic observations (Thomas et al., 2022).
A key strength of our study is that crustal thickness is well constrained from 3D broadband seismic data (Thomas et al., 2022). This allows modeling of intra-crustal density variations, rather than assuming constant crustal density and adding residual gravity anomalies as an anomalous part to crustal thickness.
Thicker crust close to the Ascension Fracture Zone is seen as a distinct Moho deepening of 3 km over a horizontal distance of 10 km only (Fig. 8). This Moho depth anomaly explains most of the negative gravity anomaly in the SE of the profile. Therefore, the density contrast between TNDR 5 and the surrounding crust is rather small. For the Central FZ, the crustal thickening is not as prominent as observed for the Ascension FZ, but the density contrast between the related TNDR 3 and the surrounding crust is stronger.
The anomalous thick crust along fracture zones might also indicate serpentinization of mantle peridotite (Prince and Forsyth, 1988; Gregg et al., 2007). At mid-oceanic ridges, hydrothermal alteration might cause serpentinization of mantle peridotites (e.g., Rouméjon and Cannat, 2014). Serpentinization preferably occurs underneath slowly spreading ridges (Mével, 2003), which would be in line with the predicted slow to moderate spreading velocities in the study area (Heine et al., 2013; Thomas et al., 2022). While the inverted susceptibility range would allow serpentinization as a process to alter the lower crust, the inverted density in the area of the Ascension and Central FZ is too high to represent serpentinized upper-mantle peridotite, which is in the lower density range of rock-forming minerals (Dentith and Mudge, 2018). Therefore, serpentinization is an unlikely process of lower-crustal alteration in the study area.
Our model more likely suggests that magmatic addition during the transition of transform faults to fracture zones might be a mechanism to explain the anomalously thick crust for the Ascension FZ. However, it also indicates a variable budget of magmatic addition, which would explain the smaller volume of the TNDR 3 compared to the TNDR 5 package. This is also in line with observations drawn from seismic refraction and reflection profiles across the St. Paul FZ (Growe et al., 2021) and Chain FZ (Marjanović et al., 2020), which show only small variation in crustal thickness, suggesting a spreading rate dependency of magmatic addition (Gregg et al., 2007; Marjanović et al., 2020).
5.2 High magnetization in the lower crust
While the modeled densities are within the range of lower-crustal materials, the modeled susceptibilities are higher than expected (e.g., Dentith and Mudge, 2018). For example, the crust along the Mid-Norwegian continental margin crust is of similar age but shows susceptibilities up to maximum 0.075 SI in the lower crust (Maystrenko et al., 2018). Another study reports maximum susceptibility of 0.06 SI for mafic intrusions in the Barents Sea (Fichler and Pastore, 2022), which is less than half the maximum susceptibility of our model.
We see two reasons for the high susceptibilities in our model: first, there are additional magnetic sources outside the lower crust that the model is not accounting for. We have shown in the results that this scenario is not preferred, because the volume of the upper crust and possible volcanics within the sedimentary section are not sufficient to account for the remaining signal. Second, the contribution of remanent magnetization to the observed magnetic anomalies plays a more significant role than expected.
The fundamental problem for modeling remanent magnetization is that there are no samples of the crust available. Generally, direct measurements via scientific drill holes are very expensive, and if executed they mostly do not penetrate deeper than the top oceanic crust. Remanent magnetization of sheeted dike complexes can also be investigated with remotely operated underwater vehicles (ROVs) if the oceanic crust is directly exposed at the seafloor. Naturally, these studies are mainly focused on spreading centers of active mid-oceanic ridges, where sedimentation has not yet buried the crustal material underneath (e.g., Varga et al., 2008).
A further complication is that the eastern Gulf of Guinea is located in the CNS, where globally there is no evidence for polar reversal, leaving no signatures in the remanent magnetization. However, global satellite magnetic models imply enhanced remanent magnetization over the CNS, which was attributed to increased main field intensity (LaBrecque and Raymond, 1985). In a subsequent global study, the source depths to satisfy the amount of magnetization required to fit the satellite magnetic data were located in the deeper part of the oceanic crust (Dyment and Arkani-Hamed, 1998). Even though the wavelength characteristics of the satellite data differ from the magnetic data acquired in the eastern Gulf of Guinea and a simplified crustal model with unique layers was used, there seems to be a significant contribution of remanent magnetization in the lower crust of the CNS regime (Dyment and Arkani-Hamed, 1998; Hemant and Maus, 2005).
Geomagnetic polarity during the CNS was oriented in the normal direction (Ogg, 2020), even though short reversal events may have occurred (Yoshimura, 2022). Hence, the presence of remanent magnetization in our study area would amplify the magnetic signal in the same direction. In other words, parts of the modeled total magnetization can be regarded as remanent. The Koenigsberger ratio Q, which is the ratio between remanent and induced magnetization, can be used to scale the modeled susceptibility. Assuming Q = 3, a typical value for basalt or gabbro (Clark, 1997), would replace 75 % of the modeled susceptibility in the lower crust with remanent magnetization.
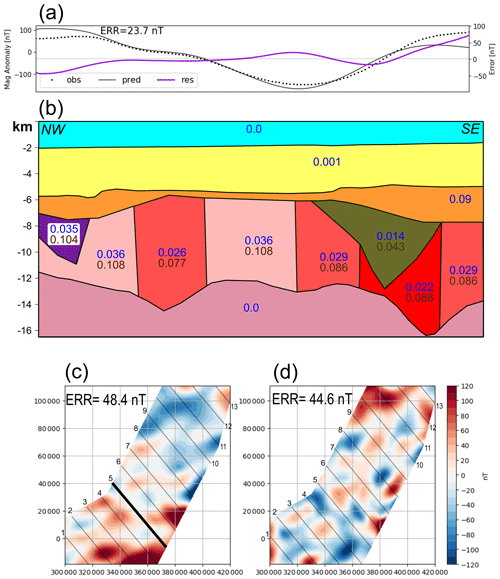
Figure 10A 2D profile across the Central and Ascension FZs (section 5 in Fig. 7). The geometry of the model is similar to Fig. 8. (a) Observed, predicted and residual magnetic data using total field intensity data. (b) Cross-section with susceptibilities only. The lower crust is modeled with induced (blue values) and remanent magnetization (brown values). To fit the trend of the data, the total susceptibility of cluster C5 (red block) was increased from 0.056 to 0.088 SI. (c) Residual magnetic data of the study area, assuming induced and remanent magnetization and using TFI data as input. (d) Residual magnetic data, assuming induced magnetization only and using RTP data as input. Regular numbers indicate the labels of the cross-sections. The thick black line highlights section 5.
We apply Q = 3 to the lower crust and investigate whether the modeled features are maintained (Fig. 10). For this test, we change the input data set to total field intensity (Fig. A1) because modeling RTP data assumes that remanent magnetization is negligible. For section 5 the lower-crustal susceptibilities vary between 0.014–0.036 SI (Fig. 10b), which is in the expected range for basaltic or gabbroic material (Clark and Emerson, 1991). The error in the residual magnetic data of the cross-section (Fig. 10a) is similar to the previous case. The same holds for the gridded residual magnetic data (Fig. 10c vs. Fig. 10d).
There are two main reasons why the error in the residual magnetic data is not reduced when applying remanent magnetization to the model. First, a constant value of Q scales the absolute susceptibilities of the lower crust. In this case, the susceptibility contrasts between the different lower-crustal segments are maintained. Second, the paleo-inclination of the magnetic field was different when the crust was magnetized in the Cretaceous. Applying paleo-inclination to the model requires a rescaling of the modeled susceptibilities, causing the susceptibility contrasts between the different lower-crustal segments to not be maintained. However, introducing a variable Q and paleo-inclination of the magnetic field requires petrological samples. If this is not done, uncertainties in the modeled susceptibilities will increase. Therefore, the model we have constructed accounting for remanent magnetization in the same direction as the main field with a constant Q can readily be applied to structural interpretation and related to the tectonic regime.
5.3 Implications for metamorphic conditions
The lower-crustal properties might reflect not only in situ tectonics but also far-field stresses related to the CVL. For the offshore origin of the CVL, various deep-seated sources have been proposed (e.g., Reusch et al., 2011; Milelli et al., 2012; Celli et al., 2020). However, seismic data several hundred kilometers northwest of this study area in the offshore territory of Equatorial Guinea suggest that compressional and strike-slip tectonics in the oceanic crust could have contributed to the formation of the CVL (Lawrence et al., 2017). In this light, the fracture zones we have imaged in our study area could have acted as a conduit for the CVL to reduce the lower-crustal susceptibility. However, the clear spatial correlation between the low susceptibility and the seismically mapped TNDR packages suggest a different picture.
Abyssal-hill fabric overlying the fracture zones and sealing the TNDR packages date them to be prior to the end of ridge-based volcanic processes (Thomas et al., 2022) and significantly older than the Oligocene CVL (Adams, 2022). Altered susceptibility as a post-accretion feature from the CVL can therefore be ruled out. Instead, the model demonstrates a statistically significant difference between oceanic crust generated through transform processes in the TNDR packages (Thomas et al., 2022) and the similar-aged “typical” oceanic crust generated at adjacent spreading ridges.
We suggest that the variations in density and susceptibility reflect different stages during accretion and evolution of oceanic crust, which are closely related to varying pressure (P) and temperature (T) conditions. The changes in density and magnetic properties of rocks are caused by a combination of hydrothermal alteration during crustal formation, followed by a change in compaction and metamorphism after burial (e.g., Honnorez, 2003). However, our results suggest that the strength of hydrothermal alteration and subsequent metamorphic processes are highly variable between OFZ and abyssal-hill-type crust.
To estimate the PT conditions of the crust within the study area at the time of accretion, we assume a source depth of 3–10 km below sea level once the sediment pile has been removed. With a typical lithostatic gradient of 0.03 GPa km−1 (Allen and Allen, 2013) and a temperature gradient between 3 and 5 °C per 100 m, in situ conditions of 0.09–0.3 GPa and a temperature range between 150–350 °C can be expected. These PT conditions are typical of zeolite and prehnite-pumpellyite facies (e.g., Fig. 2.8 in Winter, 2001), which are often characterized by hydrothermal alteration of oceanic crust around mid-ocean ridges (Mevel, 1981). However, the above maximum PT values would allow increased metamorphism with a possible transition to the lower limit of greenschist facies.
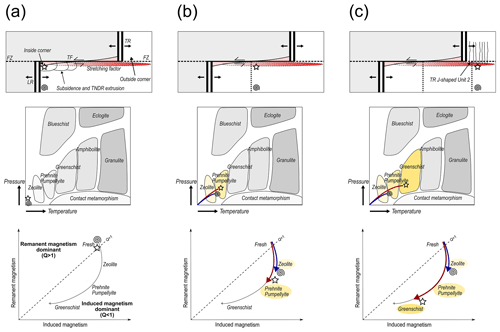
Figure 11Metamorphic facies and magnetization in relation to distance to ridge axis and transform fault (TF). The top row shows the ridge–transform intersection with the two main magmatic phases (magmatic phase 1: subsidence and TNDR extrusion resulting from inside corner thinning and TNDR extrusion; magmatic phase 2: trailing ridge juxtaposition) highlighted. The star indicates crustal material generated at the leading ridge (LR) close to the transform fault. The gray area indicates conjugate plate, which is not part of this study. The spiral represents crustal material with greater distance to the TF. The middle row shows the stability of metamorphic facies dependent on pressure and temperature (based on the facies diagram of Winter, 2001). The bottom row shows a magnetization path of crustal material, covering different metamorphic facies (adapted from Dentith and Mudge, 2018). Yellow colors indicate new metamorphic facies that have been reached. Red and blue curves represent the pathway of crustal material close to the transform fault and in distance of the transform fault, respectively. Q = 1 defines an equal Koenigsberger ratio of induced and remanent magnetization. FZ is the fracture zone, while TR is the trailing ridge.
In Fig. 11, we sketch possible PT and magnetization pathways with respect to distance along the transform fault. As a starting point, fresh and hot oceanic crust is generated at the mid-oceanic ridge (Fig. 11a). The material has not experienced metamorphic alteration and reflects the magnetization of basaltic material that has dropped below Curie temperature with equal remanent and induced components. Magnetization is constant along the ridge axis and therefore independent of the distance to the transform fault.
Shortly after formation, oceanic crust will be hydrothermally altered because seawater interacts with the basaltic magma through existing weak zones within the rock. As a consequence, the crustal material will reach zeolite and prehnite-pumpellyite facies (Fig. 11b). Close to the transform fault hydrothermal alteration is increased due to extensional thinning and elevated temperatures at the inside corner, resulting from mantle upwelling (Behn et al., 2007; Grevemeyer et al., 2021). At the same time, the crust cools as it is displaced away from the ridge. Therefore, magnetization of the lower crust close to the transform fault is only slightly higher compared to the distal domain (Fig. 11b). Magnetization is expected to be similar along the magnetic isochron, as all material remains in the prehnite-pumpellyite facies.
Once the crustal material has passed the trailing ridge, the transform fault develops to a fracture zone. This is accompanied by a major change in magnetization and metamorphic facies from prehnite-pumpellyite facies to potentially greenschist facies (Fig. 11c). Crust at a distance from the transform fault experiences no further alteration, and therefore magnetization is constant. In contrast, within the transform fault deformation zone, a second phase of magmatism overprints the crust at the outside corner, caused by juxtaposing the inside corner against the trailing ridge (Grevemeyer et al., 2021; Thomas et al., 2022; Guo et al., 2023). From high-resolution bathymetric data, Grevemeyer et al. (2021) document the creation of J-shaped ridges from dike injections across the active transform fault, volcanic hummocks and cones. Using multi-channel seismic reflection data, Barth (1994) also documents a 900 m thickening of the crust approaching the Clipperton ridge–transform intersection of the Clipperton FZ related to this second magmatic pulse. Numerical modeling (Grevemeyer et al., 2021) generates an abrupt shallowing of the brittle-to-ductile transition, at this point resulting in the increasing PT conditions, which may be accompanied by a change from prehnite-pumpellyite facies to greenschist facies. During that process, the crustal material will lose magnetic properties due to oxidation of iron-rich titanomagnetites (e.g., Fig. 3.48d in Dentith and Mudge, 2018). The deep crust in combination with high densities and low magnetization (clusters C4 and C5) indicate that some portion of the lower crust beneath the Ascension and Central FZs could have reached this stage. Even though metamorphic conditions for greenschist facies are typically reached during mountain-building processes, samples of seafloor basalts in the Atlantic were attributed to this facies (e.g., Fox and Opdyke, 1973). These greenschist facies-type rocks represent mineral transformations during local hydrothermal activity, rather than large-scale deformed and schistosed rocks, which are typical of regional metamorphism (Frisch et al., 2022).
Elevated temperatures along transform faults were previously predicted by finite-element models (Behn et al., 2007) and by the viscoplastic numerical models (Grevemeyer et al., 2021). Furthermore, the TNDR geometries within this data set have been interpreted as being related to the emplacement of a thick series of extrusive lava flows within the ridge–transform inside corner, necessitating a higher heat flow in relation to the adjacent crust (Thomas et al., 2022).
Both the PT conditions within the inside corner of the ridge–transform segments and the second magmatic pulse could change the density and magnetic properties during crustal accretion. This observation is in agreement with recent studies that describe the non-conservative character of ridge–transform fault segments (Grevemeyer et al., 2021; Thomas et al., 2022). An open question is to what extent both effects contribute to the PT conditions. Performing a similar inversion and statistical clustering on modern crust might allow a separation of the impact of the inside corner, vs. the impact of the second magmatic pulse. This might also help to assess to what extent sediment loading after crustal formation contributes to the overall present-day metamorphism the crust has experienced. Addressing these questions may help to identify whether the observed density and magnetic properties along fracture zones are a special case for São Tomé or a generalized mechanism.
Combining shipborne potential field data with high-resolution 3D seismic data highlights the variable structure of the crust offshore São Tomé and Príncipe. We have presented models of inverted density and susceptibility that show the special character of buried oceanic fracture zones in the study area. The fracture zones and their associated intra-crustal reflectors, previously identified as TNDR sequences, are characterized by a high-density and low-magnetic lower crust that clearly distinguish them from the surrounding tectonic fabric.
The derived densities and susceptibilities are typical of metamorphic rocks and indicate increasing pressure and temperature conditions accompanied by a change in metamorphic facies. In a broader perspective, the evolving temperature and pressure conditions within the inside corner of the ridge–transform segment and the second magmatic pulse at the outside corner could change the density and magnetic properties during crustal accretion. These observations imply enhanced tectonic and thermal activity during the formation of transform faults and are in agreement with previous models that exhibit the non-conservative character of ridge–transform intersections (Grevemeyer et al., 2021; Thomas et al., 2022).
A1 Potential field data processing
A1.1 Gravity data processing
Gravity and magnetic data processing was performed by CGG Multi-Physics and is summarized here. The raw data were sampled 200 times per second and afterwards averaged to 1 s samples. Cross-coupling channels are calculated in real time at 25 times per second and digitally logged using at the same sampling rate applied to the raw data. To obtain maximum signal from the data, gravity was reconstructed in the following way:
where S is spring tension, k is the gain factor to calibrate beam slope to mGal, B′ is the slope of the averaged beam position and CC is the total cross-coupling correlation. This procedure allows the level of digital filtering to be chosen based on the noise level of the data.
Cross-correlation (CC) is applied to ensure that there is no bias between ship motion and variations in the observed gravity. Ship acceleration and velocities, as well as products between these two variables, were simultaneously recorded with the gravity data. The cross-correlation between the curvature of gravity and each monitor channeled were used to construct a gain factor for each channel. These gain factors minimize the curvature of the corrected gravity.
Further corrections involved the instrument drift gID, Earth tide correction gTC and Eötvös effect gEE to obtain the post-processed gravity data gPostP:
Instrument drift gID was calibrated by still readings prior to and after the survey. First still readings were performed in the harbors of Cadiz and Las Palmas, Gran Canaria, Spain. After the survey another still reading was acquired in the harbor of Cape Town, South Africa. These still readings were used to tie the data to the world gravity network. Base station data in Muelle de Santa Catalina, Grand Canaria, Spain, and Berth 502 Bollard 56, Cape Town, South Africa, were used to calibrate the still reading and to define a base constant for the survey. The base constant was added to the calibrated gravity and yields absolute station gravity for each observation point.
Earth tide correction gTC was calculated using the formulas given in Longman (1959). This correction was calculated on a point-by-point basis and added to the calibrated gravity.
The Eötvös effect gEE, which occurs when measuring gravity on moving a platform (Harlan, 1968), was corrected using a time-varying decorrelation procedure, which presumes that correlation existing between observed gravity and the computed Eötvös effect is the true Eötvös effect, allowing removal. Vertical motions were 40 cm s−1 at their maximum, yielding an expected gravity data quality of 0.5–1 mGal and less.
Finally, the free-air anomaly gFA was calculated by subtracting the theoretical GRS 1980 gravity value gn from the post-processed value.
No height correction was applied, as the observation height above the spheroid is assumed to be zero. Further, the gravity data were leveled and gridded with 200 m distance on the grid using the prediction gridding technique, which reduces the noise level for high-resolution potential field data. Subsequently, a 2000 m Butterworth low-pass filter was applied to eliminate extraneous noise without removing valid signal information.
A1.2 Magnetic data processing
For the magnetic data, an IGRF (International Geomagnetic Reference Field) correction was applied. The Earth's nominal magnetic field was computed for every sample point using the location and time of the point and the 12th Generation International Geomagnetic Reference Field (IGRF-12) formula updated to the survey dates. Further, CGG obtained base station magnetic data from the Ascension Island Geomagnetic Observatory, which is approximately 2600 km SW of the survey area, and from the Yaounde Geomagnetic Observatory in Cameroon, which is approximately 600 km NE of the survey area. Base magnetometer data were decorrelated from the recorded magnetic data to remove diurnal effects using a similar time-variant decorrelation procedure to that described for the gravity Eötvös correction. After leveling the individual line data, the magnetic data were gridded with 200 m distance, and a 2000 m Butterworth low-pass filter was applied (Fig. A1).
RTP aims to aid interpretation of magnetic data by transforming observed magnetic anomaly data as if it was acquired at the magnetic pole with vertical geomagnetic inclination. As a result, magnetic anomalies are expected to be located directly above the causative magnetic sources. Geomagnetic inclination of −29.1° and declination of −2.59° were used as average parameters for the survey area to generate RTP magnetic anomaly grid.
Application of the RTP correction to magnetic data that is acquired at low magnetic latitudes is unstable and might lead to numerical artifacts like streaks in the data in declination direction (e.g., Stewart, 2019). Even though the study area offshore São Tomé is located close to the Equator, the background magnetic inclination is −29.1°, which limits the expected artifacts of RTP correction at low inclinations. Furthermore, noise in the acquired data is one of the main factors that causes linear artifacts along the direction of the declination (Li, 2008). Such anomalies are not observed in the magnetic data used for the study after the RTP correction (Fig. 2b), and the selected data set therefore is suitable for investigating the susceptibility of the lower crust.
A2 Lateral susceptibility inversion – methods
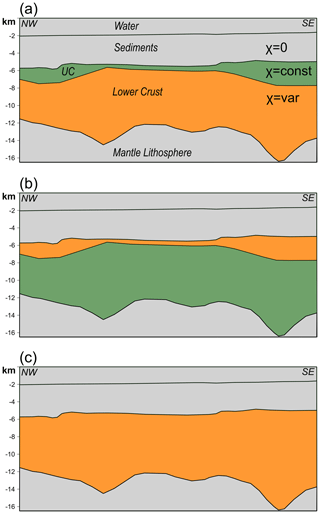
Figure A2Target layers of the lateral susceptibility inversion, exemplified for cross-section 5. The gray color indicates layers where no susceptibility is assumed (water, sediment and mantle lithosphere). Green indicates layers where constant susceptibility is assumed. Orange indicates the target layers of the inversion, where susceptibility is allowed to vary laterally. UC is the upper crust, while χ is the susceptibility. A lateral susceptibility inversion is performed for the (a) lower crust, (b) upper crust, and (c) lower and upper crust.
Table A1Details of the lateral susceptibility inversion with different target layers. Starting susceptibility defines the initial value for the target layer prior to inversion. Constant susceptibility defines the value that is chosen for the fixed layer. Note that no constant susceptibility is assumed for case 3 because the inversion is performed for the entire crust.

A3 Lateral susceptibility inversion – results
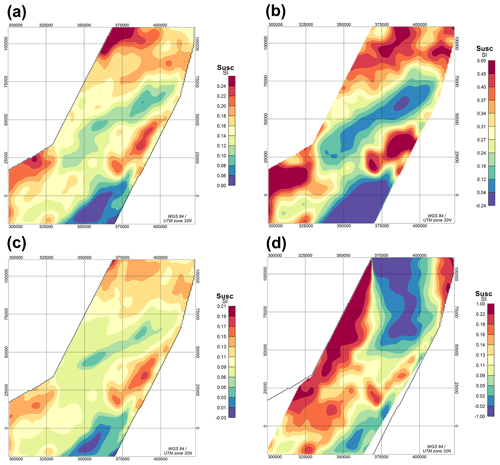
Figure A3Inverted susceptibilities (susc) of the lower crust for different model assumptions (a–c) using RTP data as the input. (a) Susceptibility of the lower crust, equivalent to Fig. 4b, (b) susceptibility of the upper crust only, (c) susceptibility for the entire crust without differentiation in the upper and lower crust, and (d) susceptibility for the lower crust but using TFI data as the input.
A4 Clustering of TNDR packages
Table A2Relative distribution of the individual TNDR packages in the different clusters. Values are in percentages. The sum of each row equals 100 %. Total TNDR represents the weighted average distribution of all TNDRs in the respective cluster domain. Total data shows the distribution of the entire data set. For example, TNDR 5 show a relative high abundance for cluster no. 4 compared to the TNDR average. (ρ is density, while χ is susceptibility.
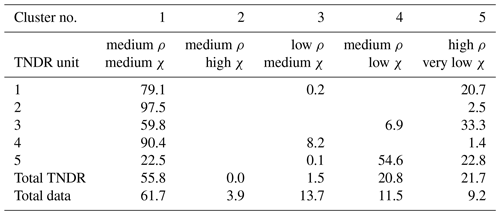
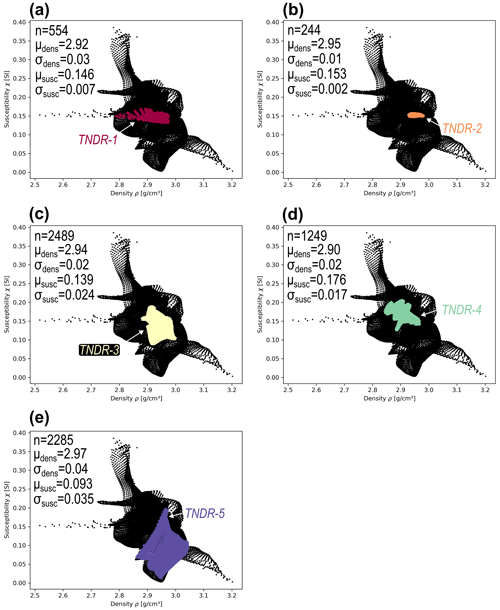
Figure A4Diagram showing the distribution of the gridded inverted density vs. the gridded inverted susceptibility (black dots). Colored points mark the distribution of the values within the individual TNDR geometry. Each plot contains information on the number of grid points n, mean density μdens, mean susceptibility μsusc, standard deviation of density σdens, and standard deviation of susceptibility σsusc: (a) TNDR-1, (b) TNDR-2, (c) TNDR-3, (d) TNDR-4 and (e) TNDR-5.
A5 Data fit of the final model
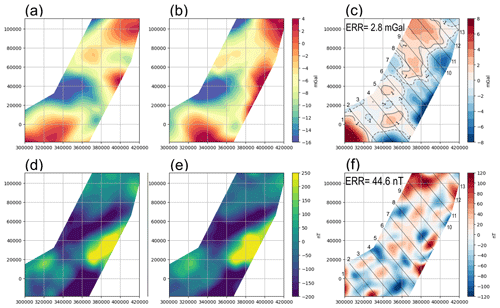
Figure A5Data and residuals of the final model. The top row shows gravity data, while the bottom row shows magnetic data. The first column shows observed data, the second column shows the calculated data of the model and the third column the residual between these two: (a) observed gravity data, (b) calculated gravity data, (c) residual gravity data, (d) observed magnetic data, (e) calculated magnetic data and (f) residual magnetic data. The relatively high error in the residual is a consequence of the limited number of bodies and the given range of density and susceptibility values obtained in the clustering.
The modeled densities and susceptibilities of the lower crust have been produced with the software Oasis Montaj and IGMAS+ (https://doi.org/10.5880/GFZ.4.5.igmas, Anikiev et al., 2023). A code that reproduces the results of the clustering is available at https://doi.org/10.5281/zenodo.10654794 (Haas, 2024).
The gravity and magnetic data are a proprietary survey acquired by CGG in 2017 for the Oil and Gas exploration companies Kosmos Energy, Galp and Shell Global. Under the STP petroleum law and the production sharing agreements for Blocks 6 and 11, ANP-STP as the oil and gas regulator is the ultimate data owner. All the aforementioned parties are legally bound to keep this data confidential. Requests for data access can be made through Shell Global via Myron Thomas (myron.thomas@shell.com).
PH drafted the manuscript and constructed the model. MT prepared the GeoTIFFs and led the interpretation of the seismic dip lines. CH assisted in the tectonic interpretation of the model. AS helped with processing and interpretation of the potential field data. JE helped set up the IGMAS model and assisted in the conceptualization of the manuscript. JvI assisted in data acquisition and cared about stakeholder interests. All authors read and commented on the draft manuscript.
The contact author has declared that none of the authors has any competing interests.
Publisher's note: Copernicus Publications remains neutral with regard to jurisdictional claims made in the text, published maps, institutional affiliations, or any other geographical representation in this paper. While Copernicus Publications makes every effort to include appropriate place names, the final responsibility lies with the authors.
We would like to thank Shell International Exploration and Production; our joint venture partners Galp São Tomé and Príncipe Unipessoal; and the regulator, the Agência Nacional do Petróleo de São Tomé e Príncipe, for granting permission to publish this work. This paper would not have been possible without the exceptional subsurface data. We owe special thanks to the Agência Nacional do Petróleo de São Tomé e Príncipe, the regulator and data owner, who have kindly granted us permission to use the gravity and magnetics data for this paper. We are further thankful for CGG Multiphysics, who acquired and processed the shipborne potential field data and gave us insights into the acquisition and processing report. We would also like to express our gratitude to Sabine Schmidt from Kiel University for her assistance while working with IGMAS+ software. Finally, we want to thank the reviewers Wolfram Geissler and Veleda Astarte Paiva Muller for their helpful and constructive comments, which improved our initial manuscript.
This paper was edited by Elias Lewi and reviewed by Wolfram Geissler and Veleda A. P. Muller.
Adams, A.: Insights Into the Source of Magmatic Hot-Lines: Forty Years of Geophysical Studies of the Cameroon Volcanic Line, Front. Earth Sci., 10, 838993, https://doi.org/10.3389/feart.2022.838993, 2022.
Allen, P. A. and Allen, J. R.: Basin analysis: Principles and applications, 3. edn., Wiley-Blackwell, Chichester, ISBN 978-0-470-67377-5, 619 pp., 2013.
Anikiev, D., Götze, H.-J., Plonka, C., Scheck-Wenderoth, M., and Schmidt, S.: IGMAS+: Interactive Gravity and Magnetic Application System, GFZ Data Services [code], https://doi.org/10.5880/GFZ.4.5.igmas, 2023.
Antobreh, A. A., Faleide, J. I., Tsikalas, F., and Planke, S.: Rift–shear architecture and tectonic development of the Ghana margin deduced from multichannel seismic reflection and potential field data, Mar. Petrol. Geol., 26, 345–368, https://doi.org/10.1016/j.marpetgeo.2008.04.005, 2009.
Barth, G. A.: Oceanic crust thickens approaching the Clipperton Fracture Zone, Mar. Geophys. Res., 16, 51–64, https://doi.org/10.1007/BF01812445, 1994.
Bécel, A., Shillington, D. J., Nedimović, M. R., Webb, S. C., and Kuehn, H.: Origin of dipping structures in fast-spreading oceanic lower crust offshore Alaska imaged by multichannel seismic data, Earth Planet. Sc. Lett., 424, 26–37, https://doi.org/10.1016/j.epsl.2015.05.016, 2015.
Behn, M. D., Boettcher, M. S., and Hirth, G.: Thermal structure of oceanic transform faults, Geology, 35, 307, https://doi.org/10.1130/G23112A.1, 2007.
Catalán, M., Negrete-Aranda, R., Martos, Y. M., Neumann, F., Santamaría, A., and Fuentes, K.: On the intriguing subject of the low amplitudes of magnetic anomalies at the Powell Basin, Front. Earth Sci., 11, 1–14, https://doi.org/10.3389/feart.2023.1199332, 2023.
Celli, N. L., Lebedev, S., Schaeffer, A. J., Ravenna, M., and Gaina, C.: The upper mantle beneath the South Atlantic Ocean, South America and Africa from waveform tomography with massive data sets, Geophys. J. Int., 221, 178–204, https://doi.org/10.1093/gji/ggz574, 2020.
Clark, D.: Magnetic petrophysics and magnetic petrology: Aids to geological interpretation of magnetic surveys, AGSO Journal of Australian Geology & Geophysics, 17, 83–104, 1997.
Clark, D. A. and Emerson, J. B.: Notes On Rock Magnetization Characteristics In Applied Geophysical Studies, Exploration Geophysics, 22, 547–555, https://doi.org/10.1071/EG991547, 1991.
Dentith, M. and Mudge, S. T.: Geophysics for the Mineral Exploration Geoscientist, Cambridge University Press, https://doi.org/10.1017/CBO9781139024358, 2018.
Dyment, J. and Arkani-Hamed, J.: Contribution of lithospheric remanent magnetization to satellite magnetic anomalies over the world's oceans, J. Geophys. Res., 103, 15423–15441, https://doi.org/10.1029/97JB03574, 1998.
Fichler, C. and Pastore, Z.: Petrology of the crystalline crust in the southwestern Barents Sea inferred from geophysical data, NJG, 102, 1–43, https://doi.org/10.17850/njg102-2-2, 2022.
Fox, P. J. and Opdyke, N. D.: Geology of the oceanic crust: Magnetic properties of oceanic rocks, J. Geophys. Res., 78, 5139–5154, https://doi.org/10.1029/JB078i023p05139, 1973.
Frisch, W., Meschede, M., and Blakey, R. C.: Plate Tectonics: Continental Drift and Mountain Building, 2nd edn., Springer Textbooks in Earth Sciences, Geography and Environment Ser, Springer International Publishing AG, Cham, https://doi.org/10.1007/978-3-030-88999-9, 247 pp., 2022.
Götze, H.-J. and Lahmeyer, B.: Application of three-dimensional interactive modeling in gravity and magnetics, GEOPHYSICS, 53, 1096–1108, https://doi.org/10.1190/1.1442546, 1988.
Granot, R., Dyment, J., and Gallet, Y.: Geomagnetic field variability during the Cretaceous Normal Superchron, Nat. Geosci., 5, 220–223, https://doi.org/10.1038/ngeo1404, 2012.
Gregg, P. M., Lin, J., Behn, M. D., and Montési, L. G. J.: Spreading rate dependence of gravity anomalies along oceanic transform faults, Nature, 448, 183–187, https://doi.org/10.1038/nature05962, 2007.
Grevemeyer, I., Rüpke, L. H., Morgan, J. P., Iyer, K., and Devey, C. W.: Extensional tectonics and two-stage crustal accretion at oceanic transform faults, Nature, 591, 402–407, https://doi.org/10.1038/s41586-021-03278-9, 2021.
Growe, K., Grevemeyer, I., Singh, S. C., Marjanović, M., Gregory, E. P. M., Papenberg, C., Vaddineni, V., La Gómez de Peña, L., and Wang, Z.: Seismic Structure of the St. Paul Fracture Zone and Late Cretaceous to Mid Eocene Oceanic Crust in the Equatorial Atlantic Ocean Near 18° W, J. Geophys. Res.-Sol. Ea., 126, 1–24, https://doi.org/10.1029/2021JB022456, 2021.
Guo, Z., Liu, S., Rüpke, L., Grevemeyer, I., Morgan, J. P., Lange, D., Ren, Y., and Tao, C.: Disparate crustal thicknesses beneath oceanic transform faults and adjacent fracture zones revealed by gravity anomalies, Geology, 51, 300–304, https://doi.org/10.1130/G50429.1, 2023.
Harlan, R. B.: Eotvos corrections for airborne gravimetry, J. Geophys. Res., 73, 4675–4679, https://doi.org/10.1029/JB073i014p04675, 1968.
Haas, P.: Sample code for the manuscript “Increased metamorphic conditions in the lower crust during oceanic transform fault evolution”, Zenodo [code], https://doi.org/10.5281/zenodo.10654795, 2024.
Heine, C., Zoethout, J., and Müller, R. D.: Kinematics of the South Atlantic rift, Solid Earth, 4, 215–253, https://doi.org/10.5194/se-4-215-2013, 2013.
Hemant, K. and Maus, S.: Geological modeling of the new CHAMP magnetic anomaly maps using a geographical information system technique, J. Geophys. Res., 110, B12103, https://doi.org/10.1029/2005JB003837, 2005.
Honnorez, J.: Hydrothermal alteration vs. ocean-floor metamorphism. A comparison between two case histories: the TAG hydrothermal mound (Mid-Atlantic Ridge) vs. DSDP/ODP Hole 504B (Equatorial East Pacific), C. R. Geosci., 335, 781–824, https://doi.org/10.1016/j.crte.2003.08.009, 2003.
Keen, C. and Tramontini, C.: A Seismic Refraction Survey on the Mid-Atlantic Ridge, Geophys. J. Int., 20, 473–491, https://doi.org/10.1111/j.1365-246X.1970.tb06087.x, 1970.
LaBrecque, J. L. and Raymond, C. A.: Seafloor spreading anomalies in the Magsat field of the North Atlantic, J. Geophys. Res., 90, 2565–2575, https://doi.org/10.1029/JB090iB03p02565, 1985.
Lawrence, S. R., Beach, A., Jackson, O., and Jackson, A.: Deformation of oceanic crust in the eastern Gulf of Guinea: role in the evolution of the Cameroon Volcanic Line and influence on the petroleum endowment of the Douala–Rio Muni Basin, SP, 438, 7–26, https://doi.org/10.1144/SP438.7, 2017.
Lee, D.-C., Halliday, A. N., Fitton, J., and Poli, G.: Isotopic variations with distance and time in the volcanic islands of the Cameroon line: evidence for a mantle plume origin, Earth Planet. Sc. Lett., 123, 119–138, https://doi.org/10.1016/0012-821X(94)90262-3, 1994.
Li, X.: Magnetic reduction-to-the-pole at low latitudes: Observations and considerations, Leading Edge, 27, 990–1002, https://doi.org/10.1190/1.2967550, 2008.
Lin, J., Purdy, G. M., Schouten, H., Sempere, J.-C., and Zervas, C.: Evidence from gravity data for focusedmagmatic accretionalong the Mid-Atlantic Ridge, Nature, 344, 627–632, https://doi.org/10.1038/344627a0, 1990.
Lizarralde, D., Gaherty, J. B., Collins, J. A., Hirth, G., and Kim, S. D.: Spreading-rate dependence of melt extraction at mid-ocean ridges from mantle seismic refraction data, Nature, 432, 744–747, https://doi.org/10.1038/nature03140, 2004.
Lösing, M., Moorkamp, M., and Ebbing, J.: Joint inversion based on variation of information—a crustal model of Wilkes Land, East Antarctica, Geophys. J. Int., 232, 162–175, https://doi.org/10.1093/gji/ggac334, 2022.
Longman, I. M.: Formulas for computing the tidal accelerations due to the moon and the sun, J. Geophys. Res., 64, 2351–2355, https://doi.org/10.1029/JZ064i012p02351, 1959.
Marjanović, M., Singh, S. C., Gregory, E. P. M., Grevemeyer, I., Growe, K., Wang, Z., Vaddineni, V., Laurencin, M., Carton, H., La Gómez de Peña, L., and Filbrandt, C.: Seismic Crustal Structure and Morphotectonic Features Associated With the Chain Fracture Zone and Their Role in the Evolution of the Equatorial Atlantic Region, J. Geophys. Res.-Sol. Ea., 125, e2020JB020275, https://doi.org/10.1029/2020JB020275, 2020.
Matthews, K. J., Müller, R. D., Wessel, P., and Whittaker, J. M.: The tectonic fabric of the ocean basins, J. Geophys. Res., 116, B12109, https://doi.org/10.1029/2011JB008413, 2011.
Maystrenko, Y. P., Gernigon, L., Nasuti, A., and Olesen, O.: Deep structure of the Mid-Norwegian continental margin (the Vøring and Møre basins) according to 3-D density and magnetic modelling, Geophys. J. Int., 212, 1696–1721, https://doi.org/10.1093/gji/ggx491, 2018.
Mevel, C.: Occurrence of pumpellyite in hydrothermally altered basalts from the Vema fracture zone (mid-Atlantic ridge), Contrib. Mineral. Petr., 76, 386–393, https://doi.org/10.1007/BF00371480, 1981.
Mével, C.: Serpentinization of abyssal peridotites at mid-ocean ridges, C. R. Geosci., 335, 825–852, https://doi.org/10.1016/j.crte.2003.08.006, 2003.
Meyers, J. B., Rosendahl, B. R., Harrison, C. G., and Ding, Z.-D.: Deep-imaging seismic and gravity results from the offshore Cameroon Volcanic Line, and speculation of African hotlines, Tectonophysics, 284, 31–63, https://doi.org/10.1016/s0040-1951(97)00173-x, 1998.
Milelli, L., Fourel, L., and Jaupart, C.: A lithospheric instability origin for the Cameroon Volcanic Line, Earth Planet. Sc. Lett., 335–336, 80–87, https://doi.org/10.1016/j.epsl.2012.04.028, 2012.
Ogg, J. G.: Geomagnetic Polarity Time Scale, in: Geologic Time Scale 2020, edited by: Gradstein, F. M., Ogg, J. G., Schmitz, M. D., and Ogg, G. M., Elsevier, 159–192, https://doi.org/10.1016/B978-0-12-824360-2.00005-X, 159–192, 2020.
Olive, J.-A., Behn, M. D., Ito, G., Buck, W. R., Escartín, J., and Howell, S.: Sensitivity of seafloor bathymetry to climate-driven fluctuations in mid-ocean ridge magma supply, Science, 350, 310–313, https://doi.org/10.1126/science.aad0715, 2015.
Osorio-Granada, A. M., Jigena-Antelo, B., Vidal Pérez, J. M., Hernández-Pardo, O., León-Rincón, H., and Muñoz-Pérez, J. J.: Potential fields modeling for the Cayos Basin (Western Caribbean Plate): Implications in basin crustal structure, Mar. Geol., 449, 106819, https://doi.org/10.1016/j.margeo.2022.106819, 2022.
Parker, R. L.: The Rapid Calculation of Potential Anomalies, Geophys. J. Int., 31, 447–455, https://doi.org/10.1111/j.1365-246X.1973.tb06513.x, 1973.
Prince, R. A. and Forsyth, D. W.: Horizontal extent of anomalously thin crust near the Vema Fracture Zone from the three-dimensional analysis of gravity anomalies, J. Geophys. Res., 93, 8051–8063, https://doi.org/10.1029/JB093iB07p08051, 1988.
Reusch, A. M., Nyblade, A. A., Tibi, R., Wiens, D. A., Shore, P. J., Bekoa, A., Tabod, C. T., and Nnange, J. M.: Mantle transition zone thickness beneath Cameroon: evidence for an upper mantle origin for the Cameroon Volcanic Line, Geophys. J. Int., 187, 1146–1150, https://doi.org/10.1111/j.1365-246X.2011.05239.x, 2011.
Rouméjon, S. and Cannat, M.: Serpentinization of mantle-derived peridotites at mid-ocean ridges: Mesh texture development in the context of tectonic exhumation, Geochem. Geophy. Geosy., 15, 2354–2379, https://doi.org/10.1002/2013GC005148, 2014.
Rundquist, D. and Sobolev, P.: Seismicity of mid-oceanic ridges and its geodynamic implications: a review, Earth-Sci. Rev., 58, 143–161, https://doi.org/10.1016/S0012-8252(01)00086-1, 2002.
Sauter, D., Werner, P., Ceuleneer, G., Manatschal, G., Rospabé, M., Tugend, J., Gillard, M., Autin, J., and Ulrich, M.: Sub-axial deformation in oceanic lower crust: Insights from seismic reflection profiles in the Enderby Basin and comparison with the Oman ophiolite, Earth Planet. Sc. Lett., 554, 116698, https://doi.org/10.1016/j.epsl.2020.116698, 2021.
Schlindwein, V. and Schmid, F.: Mid-ocean-ridge seismicity reveals extreme types of ocean lithosphere, Nature, 535, 276–279, https://doi.org/10.1038/nature18277, 2016.
Seton, M., Müller, R. D., Zahirovic, S., Williams, S., Wright, N. M., Cannon, J., Whittaker, J. M., Matthews, K. J., and McGirr, R.: A Global Data Set of Present-Day Oceanic Crustal Age and Seafloor Spreading Parameters, Geochem. Geophy. Geosy., 21, 1–15, https://doi.org/10.1029/2020GC009214, 2020.
Somoza, L., Medialdea, T., González, F. J., Machancoses, S., Candón, J. A., Cid, C., Calado, A., Afonso, A., Pinto Ribeiro, L., Blasco, I., Albuquerque, M., Asensio-Ramos, M., Bettencourt, R., Ignacio, C. de, López-Pamo, E., Ramos, B., Rincón-Tomás, B., Santofimia, E., Souto, M., Tojeira, I., Viegas, C., and Madureira, P.: High-resolution multibeam bathymetry of the northern Mid-Atlantic Ridge at 45–46° N: the Moytirra hydrothermal field, J. Maps, 17, 184–196, https://doi.org/10.1080/17445647.2021.1898485, 2021.
Stewart, I. C.: A simple approximation for low-latitude magnetic reduction-to-the-pole, J. Appl. Geophys., 166, 57–67, https://doi.org/10.1016/j.jappgeo.2019.04.021, 2019.
Thomas, M. F. H., Heine, C., van Itterbeeck, J., Ostanin, I., Seregin, A., Spaak, M., Morales, T., and Essink, T. O.: A New Model for the Evolution of Oceanic Transform Faults Based on 3D Broadband Seismic Observations From São Tomé and Príncipe in the Eastern Gulf of Guinea, Geochem. Geophy. Geosy., 23, 1–24, https://doi.org/10.1029/2022GC010351, 2022.
Tucholke, B. E., Parnell-Turner, R., and Smith, D. K.: The Global Spectrum of Seafloor Morphology on Mid-Ocean Ridge Flanks Related to Magma Supply, J. Geophys. Res.-Sol. Ea., 128, 1–42, https://doi.org/10.1029/2023JB027367, 2023.
Vaddineni, V. A., Singh, S. C., Grevemeyer, I., Audhkhasi, P., and Papenberg, C.: Evolution of the Crustal and Upper Mantle Seismic Structure From 0–27 Ma in the Equatorial Atlantic Ocean at 2°43′ S, J. Geophys. Res.-Sol. Ea., 126, e2020JB021390, https://doi.org/10.1029/2020JB021390, 2021.
Varga, R. J., Horst, A. J., Gee, J. S., and Karson, J. A.: Direct evidence from anisotropy of magnetic susceptibility for lateral melt migration at superfast spreading centers, Geochem. Geophy. Geosy., 9, Q08008, https://doi.org/10.1029/2008GC002075, 2008.
Wessel, P., Matthews, K. J., Müller, R. D., Mazzoni, A., Whittaker, J. M., Myhill, R., and Chandler, M. T.: Semiautomatic fracture zone tracking, Geochem. Geophy. Geosy., 16, 2462–2472, https://doi.org/10.1002/2015GC005853, 2015.
Wilson, J. T.: A New Class of Faults and their Bearing on Continental Drift, Nature, 207, 343–347, https://doi.org/10.1038/207343a0, 1965.
Wilson, P. G., Turner, J. P., and Westbrook, G. K.: Structural architecture of the ocean–continent boundary at an oblique transform margin through deep-imaging seismic interpretation and gravity modelling: Equatorial Guinea, West Africa, Tectonophysics, 374, 19–40, https://doi.org/10.1016/s0040-1951(03)00326-3, 2003.
Winter, J. D.: An introduction to igneous and metamorphic petrology, Prentice Hall, Upper Saddle River, NJ, ISBN 13 978-0132403429, 697 pp., 2001.
Yoshimura, Y.: The Cretaceous Normal Superchron: A Mini-Review of Its Discovery, Short Reversal Events, Paleointensity, Paleosecular Variations, Paleoenvironment, Volcanism, and Mechanism, Front. Earth Sci., 10, 834024, https://doi.org/10.3389/feart.2022.834024, 2022.


