the Creative Commons Attribution 4.0 License.
the Creative Commons Attribution 4.0 License.
Combining crosshole and reflection borehole ground-penetrating radar (GPR) for imaging controlled freezing in shallow aquifers
Peter Jung
Götz Hornbruch
Andreas Dahmke
Peter Dietrich
During test operation of a geological latent heat storage system as a potential option in the context of heat supply for heating and cooling demand, part of a shallow Quaternary glacial aquifer was frozen at the TestUM test site. In order to evaluate the current thermal state in the subsurface, the dimension of the frozen volume has to be known. As the target is too deep for high-resolution imaging from the surface, the use of borehole ground-penetrating radar (GPR) is being investigated. For imaging and monitoring of a vertical freeze–thaw boundary, crosshole zero-offset and reflection borehole GPR measurements are applied. The freezing can be imaged in the zero-offset profiles (ZOPs), but the determination of ice body size is ambiguous because of the lack of velocity information in the frozen sediment. Reflection borehole GPR measurements are able to accurately image the position of the freezing boundary through repeated measurements of ±0.1 m, relying on the velocity information from ZOPs. We have found that the complementary use of ZOPs and reflection measurements provides a fast and simple method to image freezing in geological latent heat storage systems. The presence of superimposed reflections from other observation wells and the low signal-to-noise ratio are problematic. The use in multiple observation wells allows an estimation of ice body size. A velocity model derived from multiple ZOPs enabled us to extrapolate geological information from direct-push-based logging and sediment cores to a refined subsurface model.
- Article
(4160 KB) - Full-text XML
- BibTeX
- EndNote
A high proportion of space heating is still based on burning fossil fuels (Steinbach et al., 2020). For the transition to renewable efficient heating, alternative concepts have to be developed and improved. Additionally, the predicted climate warming will result in an increased need for cooling applications (Lozàn et al., 2019). Using heat pumps, latent heat storage (LHS) allows the extraction of high amounts of energy for heating with little temperature change and low storage volume (Agyenim et al., 2010). For phase change materials with a low freezing point, such as water, the residual frozen volume generated during the heating period can act as a cold storage and later be used for cooling purposes. Therefore, LHS can meet the demand for both energy-efficient heating and cooling. In conventional LHS, tanks containing the phase-change material are burrowed, which makes installation expensive and limits building opportunities, especially in densely occupied urban areas, where there is a high heating and cooling demand (Steinbach et al., 2020).
Accessing geological layers, specifically aquifers, as storage volume, instead of burying tanks, can increase application possibilities because there is less above-ground space required and reduced installation costs. With segmented heat exchanger probes that allow depth-oriented controlled freezing and thawing (Fig. 1), the geotechnical use of aquifers as LHS is possible (Dahmke and Schwarzfeld, 2022).
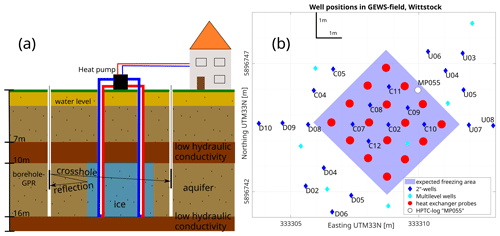
Figure 1(a) Schematic sketch of geological latent heat storage at the experimental site in Wittstock with the concept of GPR reflection and GPR crosshole measurements. (b) Overview of the experimental site with the positions of borehole heat exchangers and observation wells.
To validate and improve thermo-hydraulic modeling of geological LHS, the current thermal state at operating depth has to be assessed. Data from borehole in situ temperature measurements and cooling fluid feed and return temperatures only give punctual information. Since the boundary between frozen and unfrozen ground indicates a major change in thermal energy, knowing the lateral extent of frozen ground around the heat probes can act as a proxy for the thermal state, so imaging the lateral propagation of freezing with geophysical methods is desirable.
Extensive experience can be referred to in the use of geophysical methods for the observation of thawing and freezing processes in permafrost soils and glaciers (e.g., Campbell et al., 2021; Schwamborn et al., 2002; Terry et al., 2020; Vonder Mühll et al., 2002; Weigand et al., 2020). Electrical resistivity tomography (ERT) has regularly been used for the monitoring of geological storage (Hermans et al., 2014, 2015; Lamert et al., 2012), although, being sensitive to the strong change in electrical conductivity between frozen and unfrozen sediment, the application is not suitable for a precise estimation of a vertical freeze–thaw boundary. The lateral resolution of surface measurements like ERT decreases with greater depths, and the high conductive layer on top of the monitored groundwater aquifer further decreases resolution in target depth. Even with borehole ERT and sharp boundary conditions applied in the inversion, the measurements at an LHS site would be affected by the installed heat exchangers and connecting pipes and cables.
The high contrast in electrical permittivity of ice (ε≈3–4) and water (ε≈81) makes ground-penetrating radar (GPR) very sensitive to the phase change, and it is therefore widely used for permafrost monitoring (e.g., Cao et al., 2017; Du et al., 2020; Hinkel et al., 2001; Sokolov et al., 2020; Steelman et al., 2010; Stephani et al., 2014; Stevens et al., 2008; Wang and Shen, 2019). Using borehole measurements gives the advantage of getting the source and receiver close and perpendicular to the imaging target. Successful application was shown in Kim et al. (2007) by mapping ice rings in an underground liquid gas storage. The downside of this setup is the non-directionality of the antennas used, making determination of the reflector position ambiguous.
So far, the use of GPR has been examined in monitoring freezing and thawing processes within natural geosystems. However, its potential application as an indispensable measurement method for the operational monitoring of geological LHS systems remains unexplored. We hypothesize that borehole GPR will bring additional value in terms of spatial information of the ice body and that it can thus be used for monitoring purposes.
Therefore, the aim of this study is to use borehole reflection and crosshole GPR to image an ice body in a shallow aquifer. Firstly, crosshole GPR is used to get an enhanced site characterization before installation of a geological LHS system, and then the concept of borehole reflection and crosshole GPR measurements is tested to image the ice development during plant operation.
2.1 Experimental site
The experimental site, TestUM, is located on a former airfield near Wittstock/Dosse in the northeast of Germany. The near-subsurface consists of unconsolidated Quaternary glacial sediments, which is a representative scenario for many areas in the North European Plain. The TestUM site was already intensively used for several injection experiments. These prior experiments investigated the effects of injecting heat (Heldt et al., 2021; Keller et al., 2021; Lüders et al., 2021), carbon dioxide (Peter et al., 2012; Lamert et al., 2012), and hydrogen (Hu et al., 2023; Keller et al., 2024; Löffler et al., 2022) into the subsurface. The subsurface investigations for these projects in the area show a high spatial geological variability typical of glacial sedimentation. There are layers of fine-, medium-, and coarse-grained sands; glacial till (boulder clay) characterized by a mixture of sediments, including high clay content; and gravel alternating in thickness and lateral extent. Therefore, prior to establishing the experimental LHS site, a comprehensive site investigation was conducted using an adaptive approach that integrated surface geophysical measurements, direct-push-based investigations, and traditional coring techniques. This multifaceted methodology was employed to identify the most suitable area for the experiment at the site. In particular, surface electrical resistivity and electromagnetic induction measurements provided a non-invasive option to analyze subsurface characteristics in terms of near-surface anthropogenic remains (old foundations, remains of the former airfield). Complementing this, direct-push-based investigations with the hydraulic profiling tool (HPT; Geoprobe, USA) enabled a detailed examination of the geological setting with the help of vertical high-resolution data of hydraulic and electrical conductivity (McCall and Christy, 2020; McCall et al., 2014; Vienken et al., 2012; Dietrich et al., 2008). Additionally, traditional coring was employed to extract core samples, facilitating a more in-depth analysis of the geological strata. An area was selected for the experiment where coring indicated a sandy aquifer at a depth of 10–16 m, covered above and below by clayey till.
To test geological latent heat storage, a subsurface volume is frozen and thawed in a controlled manner (Fig. 1a). A total of 16 heat exchanger probes, each 16 m deep, are installed in a 1 m×1 m grid (Fig. 1b). The probes are designed with two separate fluid circuits, with the upper spanning 3 to 9 m and the lower spanning 10 to 16 m depth. Operating the lower fluid circuit with a feeding temperature <0 °C and the upper circuit with a temperature >0 °C allows depth-oriented controlled freezing in the sandy aquifer while keeping the overlying geological units unfrozen. A total of 18 wells (outer diameter: 60 mm) and 9 multilevel wells are installed to have direct access to the subsurface for GPR measurements, in situ temperature measurements, and probing for hydrochemical and microbiological analysis. The water table varies between zwater=2–3 m b.g.s. throughout the year; thus the experiment takes place in a fully saturated environment.
The 2 in. wells are 18 m deep with mesh filtering at 10 to 16 m depth and are therefore filled with water. Well naming is adapted to groundwater flow direction from northeast to southwest, which flows at a velocity of 0.05–0.09 m d−1 (Heldt et al., 2021). Upstream wells begin with the letter U, central wells being with C, and downstream wells begin with D. Wells for borehole GPR are positioned at a distance of 1.5 m from the outer heat exchangers to be close enough to register reflected signal despite the high attenuation caused by the high electrical conductivity in water-saturated sediments. Closer wells would have a higher probability of being affected by freezing, which would make them inaccessible. Also, if the reflector is too close to the antenna, the direct wave superimposes the reflected signal. Wells are only on three sides of the experimental field because an opening had to be left for logistical reasons, e.g., heat exchanger installation with heavy machinery.
2.2 Measurement methods
2.2.1 Inclinometer
Observation wells can deviate from their designated vertical orientation. The extent of deviation is measured using the DevProbe1 inclinometer (Geotomographie, Germany). Readings of tilt and heading are taken for every borehole, allowing calculation of the well path in the subsurface. The mean of the occurring horizontal deviation at 17 m depth is 0.28 m, with a maximum of 0.99 m at well C05 due to a drilling obstacle. The corrected true well position in the subsurface is used for GPR interpretation.
2.2.2 Ground-penetrating radar
The use of GPR reflections can give specific information about the distance from a well to a reflector, assuming a well-known propagation velocity. Therefore, the use of GPR is favored in this setting. With our target being a vertical-layer boundary at a depth greater than 10 m, surface GPR is not applicable because the overlaying aquitard with high electrical conductivity limits penetration. With the help of boreholes, source and receiver antenna are brought close enough to the imaging target to record signals despite the high attenuation. Two omnidirectional Tubewave-100 (Radarteam, Sweden) borehole antennas, with a vertical offset between the center of the transmitting and receiving array of 0.3 m, in combination with a GSSI SIR-4000 (GSSI Geophysical Survey Systems, Inc., USA), are used for the survey. The peak frequency, measured inside the observation wells at the experimental site, is 190 MHz. We performed three measurements at three different stages of the test site operation: (1) before installation of the heat exchangers for enhanced site characterization, (2) a baseline in the final equipped site, and (3) a measurement after 54 d of running the LHS system when the existence of an ice body is verified by temperature measurements. For stage (1), we measured zero-offset profiles (ZOPs). To image the lateral extent of a body of frozen saturated sediment in stages (2) and (3), both reflection measurements and ZOPs were used.
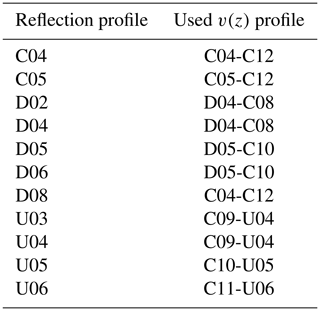
For reflection measurements, one single antenna acts as transmitter and receiver. It is lowered down in a borehole, and traces are collected every 0.25 m over an interval from a 0.8 to 17.3 m depth of the midpoint between transmitter and receiver. Measurements are done in the wells D02, D04, D05, D06, D08, C04, C05, U03, U04, U05, and U06. The remaining wells outside the freezing area are occupied with other instrumentation, and the wells between the heat exchangers are inaccessible during freezing. A standard processing is applied, consisting of subtraction of DC shift, zero-time correction, bandpass frequency filtering using a third-order Butterworth filter with cut-off frequencies 50 and 600 Hz, and a gain correcting for spherical divergence. The maximum phase of the reflection arrivals is picked. Maxima are picked because, due to the low signal-to-noise ratio, first-break picking is too erroneous. To account for the time shift between the first break and the first maximum, the travel time of the first maximum of the direct wave is used for zero-time correction. Because the emitted signal is assumed to be reflected at the freeze–thaw boundary and travel back to the receiver (Fig. 1a), with known antenna position and propagation velocity, the distance to the appearing reflectors can be calculated. For distance calculation, borehole-specific velocity–depth profiles (see Table 1) are taken from the crosshole measurements described in the following paragraph.
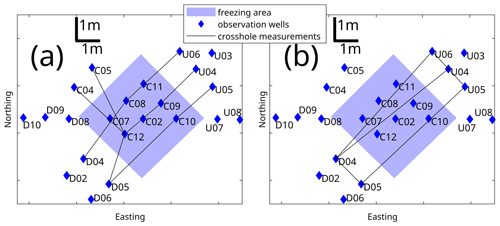
For crosshole zero-offset profiles, two antennas are placed in two boreholes, with one used as a transmitter and one used as a receiver. The antennas are lowered, simultaneously measuring at the same depth every 0.25 m over a depth interval from 0.8 to 17.3 m. The resulting ZOPs are processed with the same processing flow as the reflection profiles. Zero time is determined by picking the maximum of first arrivals in air measurements outside the wells. Source–receiver distance is increased from 1 to 3 m in 0.2 m steps in the zero-time measurements. Subtracting the calculated travel time for v=c in air leaves the value for zero-time correction. From the first arrival maxima in the ZOPs, we can calculate the bulk velocity of the soil between the antennas. When freezing happens, we assume higher velocity and lower attenuation that will result in lower travel times and higher amplitudes. To obtain a 3D distribution of wave velocity in the experimental field, different well combinations are realized (Fig. 2a). Well combinations covering all three sides of the test field ensure velocity information in close vicinity to all reflection measurements.
For the monitoring of freezing and thawing, only measurements running through the freezing area are of interest (Fig. 3b). Measurements between wells outside the freezing area serve as a reference to check for acquisition errors. If the measured velocity remains the same for the reference measurements, where there is no change in subsurface properties, the data acquisition is considered to be correct.
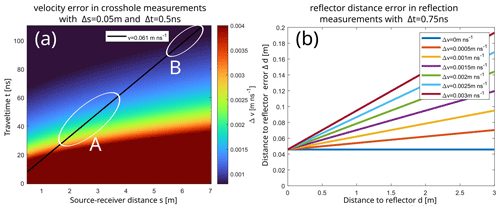
Figure 3(a) Error of velocity estimation in crosshole measurements. Error depends on source–receiver distance and travel time. The black line indicates expected values for velocity of 0.061 m ns−1. White circles highlight ranges for site characterization (A) and freezing monitoring (B). (b) Distance error for reflector position estimation via reflection measurements for different velocity errors.
2.2.3 Preliminary considerations – accuracy
The accuracy of velocity estimation in ZOPs is mainly influenced by positioning error and time error. Antenna positioning error consists of the GPS error and the inclinometer error. Time error is mainly composed of the picking error and the zero-time drift of the aperture. The time error was assessed by comparing travel times of repeated measurements on multiple days of the same well combination. Figure 3a shows the expected velocity error assuming a positioning error of Δs=0.05 m and a time error of Δt=0.5 ns. Greater distances between source and receiver minimize the velocity error. The downside of a greater source–receiver distance is that lateral variations are averaged. Smaller distances ensure that the measured velocities, which are then used for time–depth conversion of reflection measurements, represent the immediate vicinity of the observation wells. So, for site characterization, a trade-off between high velocity error and spatial averaging is selected with well distances of 2 to 4 m, resulting in an expected maximum velocity error of m ns−1 (Fig. 3a). ZOPs for freezing monitoring, where the wave travels through the whole experimental field covering distances of around 6 m, reduce velocity error to m ns−1.
The low signal-to-noise ratio in reflection measurements results in an increased time error of ns. Using the velocities from site characterization for the determination of reflector position, velocity error, and time error results in a distance error of m (Fig. 3b) at a reflector distance of 1.5 m. The 1.5 m corresponds to the distance of the surrounding observation wells to the heat exchanger probes. As the freeze–thaw boundary moves outwards, and therefore the distance to the observation well decreases, the error decreases.
Vertical positioning was done by aligning depth markings along the antenna cable with the top of the well casing. We assume the error of this method to be smaller than 0.01 m; therefore it was neglected.
The estimation of the lateral extent of the frozen body from ZOP velocities is assessed. The distance s traveled by the wave consists of the distance traveled in the thawed medium and in the frozen medium.
Travel time t consists of the time traveled in the thawed medium and in the frozen medium:
Inserting
and solving for sice yields
If the permittivity, and therefore velocity, of the frozen saturated soil is unknown, the equation is underdetermined. Distance s is known from GPS positioning corrected for borehole deviation, vthawed is taken from baseline measurements, and v is measured velocity. There is no access to direct information on vice in the test field because wells within the freezing zone are inaccessible during plant operation. Nonetheless, we expect to get qualitative information about the beginning of freezing and the shape of the ice body by looking at the changes in bulk velocity.
3.1 Site characterization
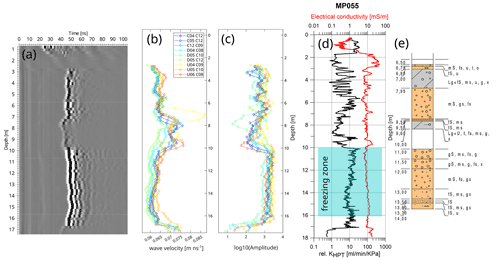
Logging with the direct-push-based hydraulic profiling tool (HPT) at drilling MP055 (Fig. 4d) shows a layer with high relative hydraulic conductivity, KHPT≈10 , and an electrical conductivity of σ≈10 mS m−1 between 10 and 17 m depth. Above a layer with lower hydraulic conductivity, higher electrical conductivity is observed. The low conductivity spans up to 7 m depth, while electrical conductivity is higher at 10–9.5 m and at 7 m depth. Below 17 m, electrical conductivity increases to σ=15–20 mS m−1 and KHPT decreases to ∼0.5 . Sediment coring at MP055 (Fig. 4e) matches the high hydraulic and low electrical conductivity with a sand layer and matches the low hydraulic and high electrical conductivity with a higher clay content. We assume a subsurface model with a sandy aquifer at 10 to 17 m depth covered at the top and bottom with an aquitard. The low-conductivity zone is very heterogeneous at this location (see supplement of Löffler at al., 2022). This can also be seen in Fig. 4b and c: over the small test field, we see most variations in amplitude and velocity precisely between 7 and 10 m, indicating the presence of a highly heterogeneous boulder clay. We correlate the low amplitude and low travel time with a highly heterogeneous layer, acting as a low hydraulic conductivity layer due to the presence of clayey material.
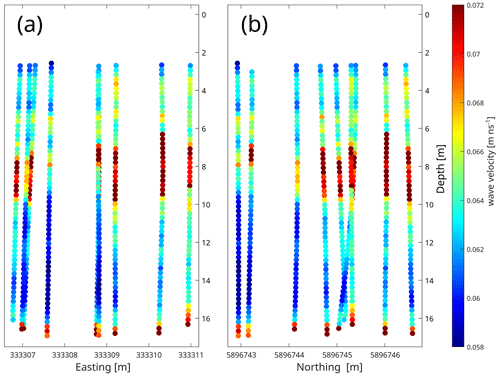
The ZOPs measured before the installation of the heat exchangers offer the possibility for an enhanced characterization of the experimental site itself. ZOPs were used to spatially extrapolate the information over the area of the test site. One example profile from wells C07 to C10 is shown in Fig. 4a. In the first 3 m the first arrivals are superimposed by a signal refracted at the surface. Up to a depth of 7 m, high amplitudes and longer travel times, converting to velocities of v=0.06–0.065 m ns−1, can be seen. From ∼7 to ∼10 m and from ∼16.5 m on, there are layers with lower amplitudes and shorter travel times converting to velocities of v=0.07–0.075 m ns−1. Between 10 and 16.5 m, very high amplitudes and longer travel times, converting to velocities of 0.06–0.065 m ns−1, are measured. The layering corresponds to the identified layers in the core drilling and in HPT and EC logging. The aquifer appears as a layer with high amplitudes due to lower electrical conductivity and with longer travel times due to higher permittivity, and the aquitard appears as a layer with low amplitudes due to high electrical conductivity and with shorter travel times due to lower permittivity. Plotting all measured well combinations shows that the layering of an aquifer covered on the top and bottom with an aquitard is seen in the velocity and amplitude in all profiles but with the thickness and velocity of the upper aquitard being variable. Placing the velocities at the midpoint between transmitter and receiver gives with the 2D view an idea of the 3D distribution of the velocities over the experimental site (Fig. 5). Figure 5a is with a fixed north coordinate, and Fig. 5b is with a fixed east coordinate. A slight velocity increase is seen from southwest to northeast. The thickness of the upper aquitard also increases from southwest to northeast.
3.2 Reflection profiles
Reflection measurements were performed at the final equipped site before the start of the freezing experiment and after 54 d of running the LHS system, with an ice body around the heat probes. In the baseline measurements, linear reflectors are visible in reflection profiles. An example is shown in the profile from well D02 (Fig. 6a). In the lower aquifer, reflectors are identifiable to a maximum travel time of 80 ns. In the aquitard, where attenuation is higher, only close reflectors are visible. From 0 to 4 m depth, the well reflections are superimposed by reflections at the surface and in the water table. Picking travel times of the reflectors and converting to distance, using the velocity estimation from ZOPs, this corresponds to the distance to other observation wells. So, in close vicinity, reflections of the surrounding observation wells occur in the data. Not all surrounding wells can be identified because of the low signal-to-noise ratio and superimposing signals. By identifying these reflectors as well reflections before the freezing is initiated, the baseline measurements enable us to distinguish between well reflections and the signal reflected at the freeze–thaw boundary.
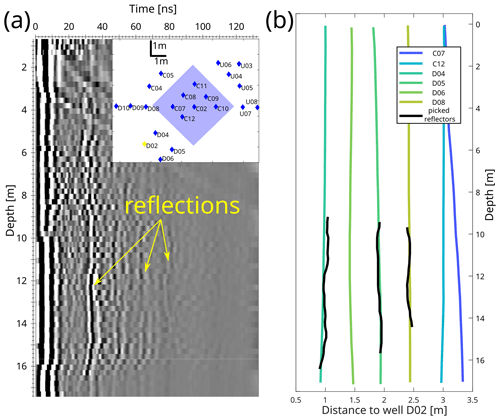
Figure 6(a) Reflection profile from baseline measurement at well D02 with visible reflectors. (b) Picked reflection travel times converted to distance using velocity from ZOPs. Reflector positions coincide with the distance to other observation wells.
Figure 7 displays profiles from well U04 before freezing and with a developed ice body during plant operation. A strong reflector appears at a travel time of ∼50 ns at a depth of 10 to 16 m. The hyperbolic increase in travel time at the upper and lower end of the reflection indicates that the reflecting object ends there, rather than that the signal is just not visible because of the high attenuation of the surrounding layers.
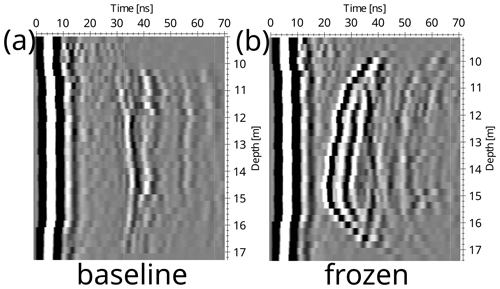
Figure 7Section of a reflection profile from (a) baseline measurement and (b) during freezing. Appearance of a new reflector at 10–16 m depth.
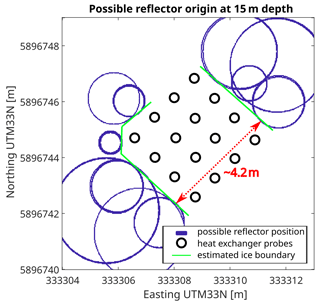
In a second step, travel times of new occurring reflections are picked in all reflection profiles. After converting to distance, the extent of the ice body is estimated. Because the antennas transmit the signal omnidirectionally, the possible reflector origin is a sphere around the antenna position. Assuming the reflector origin is at the same depth as the antenna, ±0.2 m, the possible reflector positions of each measurement are plotted on a discretized 3D space. The positions closest to the test site are interpreted as the freeze–thaw boundary, and connecting the edges gives an estimation of the current lateral ice volume. Figure 8 shows the estimated ice boundary at a depth of 15 m with an extension of 4.2 ± 0.2 m in a southwest to northeast direction.
3.3 Crosshole ZOPs
For the monitoring of freezing and thawing, only the well combinations crossing the whole freezing area, D04-U04, D04-U06, and D05-U05, are of interest (Fig. 2b). Perpendicular measurements are not possible due to the lack of observation wells in the southeast. The profiles D04-D05 and U06-U05 outside the freezing area serve as a reference. They show unchanged velocities within the error range.
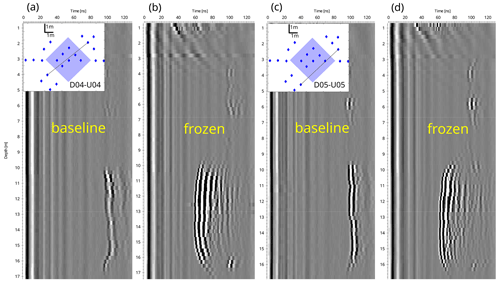
Figure 9 shows two profiles through the freezing area from well D04 to U04 and D05 to U05 before (Fig. 9a and c) and during (Fig. 9b and d) freezing. Due to the greater distance between wells and the high attenuation, no signal is registered in the aquitard. With the formation of ice, the first arrival times at 10 to 16 m depth drop significantly and reverberations occur. As an example, velocity at 15 m depth increases from 0.0605 ± 0.001 m ns−1 to 0.099 ± 0.001 m ns−1. The signal at a depth greater than 16 m arriving with an unchanged travel time of ∼100 ns indicates no freezing there. The changes shown also appear in the third profile crossing the freezing area, which is not shown here.
We are able to characterize the subsurface structure of the test site and image the frozen subsurface volume with crosshole and reflection borehole GPR measurements. The accuracy with which the extent of the frozen ground can be estimated is affected by several sources of error. The methodology and its sources of error, limitations, and underlying assumptions are discussed in the following subsections.
3.4 Deviation correction
The relevance of the well deviation measurements is highlighted by comparing the distances of the imaging target and the distance between the wells with the measured deviations. A mean deviation of ∼0.3 m at 17 m depth can add up to a 0.6 m under- or overestimation of the distance between the transmitter and the receiver. For the longest distance, used in this study, of 6 m between well positions at the surface, this results in a 10 % velocity error. For shorter distances, the error increases. Therefore, deviation measurements are essential for borehole GPR and are recommended for all scenarios where well deviation is a possible source of error.
3.5 Site characterization
The crosshole ZOP measurements, which are required to obtain velocity information for the time–distance conversion of reflection measurements, were consistent with the drilling and logging data. Based on this correlation, we were able to extrapolate this punctual information to the whole test site. This can be used for modification and verification of thermo-hydraulic modeling of the LHS experiment. It should be noted that the resolution of the model is somewhat limited because the velocity values are always a lateral average of the volume between source and receiver. Though it is smaller than the expected velocity error (see Sect. 2.2 and Fig. 3a), the observed velocity increase from v=0.61 to 0.63 m ns−1 in a southwest to northeast direction seems to be a real feature because repeated measurements rule out measurement errors as the source of the lateral velocity trend and variability. This spatial inhomogeneity of the subsurface prevents the use of longer baselines that would result in an improvement in the velocity error.
3.6 Reflection measurements
Reflections of the formed frozen subsurface volume are visible and allow determination of the distance from the reflector to the observation well. The ambiguity of reflector position due to omnidirectional wave emission can be removed by taking multiple measurements at different positions, as the possible reflections then overlap at the true reflector position. In cases of controlled subsurface freezing, the origin is clearly determinable, with the assumption that there is only change in subsurface parameters around the heat exchanger probes. Closer lateral spacing of observations would be beneficial for a more accurate imaging of the freezing front, which is contradictory to the following issue.
An unpleasant finding was that reflections of other observation wells are present in the data. We expected these reflections to be too weak to be measured because of the small well diameter of 0.05 m compared to a wavelength of λ≈0.3 m. Although smaller in amplitude, these well reflections appear to be superimposed on the imaging target signal, making it difficult to accurately determine ice reflection travel times. The layout of observation wells, being designed not only for GPR monitoring but also for geochemical and microbiological probing and in situ temperature monitoring, is not ideal for the GPR measurements, so monitoring designs for future projects should avoid having other observation wells in the same distance range as the imaging target.
As the geometry of the experimental setup is well known, 3D forward modeling of the wave propagation could help to eliminate reflections from installed structures. This would require further effort to account for the heterogeneity of the subsurface and the unknown electromagnetic parameters of heat exchangers and well casings. Since we are measuring from outside of the heat exchanger array, the ice front is closer to the observation wells than the heat exchangers. We expect the reflections from the ice body to arrive earlier than the reflections from the heat exchangers. Therefore, we decided not to do forward 3D modeling, as it is also subordinate to the intent of developing an easy-to-implement monitoring tool for LHS.
3.7 Crosshole measurements
Resolution of ray-based tomography is around the size of the first-order Fresnel zone (Dessa and Pascal, 2003). With the parameters of the test site and a source–receiver distance of 6 m, this corresponds to a maximum width of the first-order Fresnel zone of 0.7 m. With the sub-wavelength resolution of using full waveform inversion, a more detailed image could have been generated (Klotzsche et al., 2010). Our decision using simple crosshole sounding rather than tomography is based on three main considerations. (1) Acquisition is fast, taking less than 10 min per profile, and processing is fairly simple, making it efficient for monitoring in future non-academic settings. (2) Resolving a boundary parallel to the acquisition plane with high accuracy is only possible with high-angle ray paths. These measurements are not feasible because of high attenuation in the measurement area. (3) The complex 3D setting makes modeling more difficult. The presence of a large number of signal-altering objects outside the acquisition plane, such as heat exchanger probes, observation wells, and rocks, is likely to create artifacts in a 2D tomographic model. For interpretation of first arrivals in ZOPs, out-of-plane effects can be ignored because they are higher in travel time than the first arrivals. Multi-offset gathers (MOGs) with small offsets could increase resolution, especially in the site characterization, while avoiding the problem of ray paths that are too long in this high-attenuation environment. For further projects, an investigation with MOGs before installation of the subsurface structure of the LHS plant is desirable, yet the highly increased acquisition time (Looms et al., 2018) and the more complex evaluation compared to ZOPs makes it impracticable for fast and simple monitoring.
One interesting finding is that, when the subsurface is frozen, reverberations occur that are not prominent in the unfrozen state. Possible explanations are refractions on not-yet-frozen parts inside the freezing area or that the impedance contrast between surrounding material and the heat probes encased in concrete is greater in the frozen state, so that the signal is scattered on the heat probes.
The determination of ice body size from ZOP velocities is prevented by the missing value for velocity of the frozen ground. Literature values for electric permittivity of frozen saturated soil span er=3–6 (King et al., 1981; Cassidy, 2009; Stevens et al., 2008), which converts to velocities vice=0.12–0.17 m ns−1. Using values from the crosshole measurements at 15 m depth, s=6.05 m, vbulk=0.099 m ns−1, vthawed=0.061 m ns−1, and the possible ice body size is sice=3.5–4.5 m. So, even without accounting for measurement errors, the uncertainty is bigger than with reflection measurements. In addition, this assumption is only true for a homogeneous velocity of the frozen area and no permittivity change with varying ice temperature. Even if wave velocity of the frozen volume is known, no information about the lateral distribution of ice is possible. Due to groundwater flow, we expect a difference in ice propagation between upstream measurements and downstream measurements. While reflection measurements should be able to image this asymmetry in freezing and thawing, ZOPs do not provide information on lateral changes. A quantitative determination of ice body size from crosshole measurements is not possible due to insufficient determinability of permittivity of the frozen sediment, yet they are sensitive to freezing between heat probes inside the test field, which cannot be imaged by reflection measurements. Also, the obtained velocity information is imperative for reflection interpretation.
The pros and cons of both types of GPR measurements suggest combining both to complement each other.
3.8 Uncertainty
While positioning error is inherent to the error ranges of GPS and inclinometer, time error is assessed with repeated measurements with the same acquisition geometry as suggested by Yu et al. (2020). Repeating the same crosshole measurements shows an average error of ns. Zero-time corrections of up to 1.5 ns had to be applied, emphasizing the importance of determining zero time before acquisition, even when using the same equipment and setup. It was measured at the beginning and end of each field campaign, but it can vary between single profiles and even within the same profile (Axtell et al., 2016). A significant change in zero time occurred when there was a high difference between outside temperature and subsurface temperature. Comparing the zero-time measurements with air temperature data showed a temperature dependency, which is why we decided on using the zero time from measurements directly after the last borehole measurement, because then antennas and cables were at the same temperature as in the borehole. For further measurements, bringing the equipment to subsurface temperature by leaving it in the borehole before zero-time determination can increase the accuracy of zero-time correction. Cross-correlation between traces of different acquisition dates, in a depth range unaffected by freezing, could yield an additional correction factor. Unfortunately, in the profiles for freeze monitoring, attenuation is too high above the freezing depth. Precision would benefit from an improved t0 correction.
In reflection measurements, the low signal-to-noise ratio increased the time error to ns. The resulting error for absolute reflector position is determined to be ±0.1 m. Considering relative changes of the freezing front over time, the positioning and velocity error can be neglected because they are the same for all repeated measurements. This increases accuracy for temporal change to m.
A gradual transition zone from unfrozen to frozen medium alters the reflected signal and shifts the arrival time. In our considerations, the transition is presumed to be a sharp boundary. This assumption is based on freezing experiments with sediment from the test site. The observed transition zone is under 0.01 m thick, making our assumption a good approximation. During freezing and thawing cycles of the LHS plant, temperature in the boreholes is affected by the extraction and insertion of thermal energy. In the observation wells downstream from the groundwater flow, the temperature can vary between 4 and 8 °C. A permittivity change of the surrounding subsurface due to varying temperature is not considered in the estimations but might add to the uncertainty.
3.9 Vertical freezing boundary
In this study, we concentrated on imaging a lateral boundary. Nonetheless, indications for the top and bottom of the frozen area are present in the data. In ZOPs, the unchanged signal in depth greater than 16 m indicates the end of freezing there. In the reflection data, we see one side of a hyperbola at the top and bottom of the reflector, characteristic of a sudden vertical change in impedance. Even though spatial resolution seems to be limited by the trace spacing of 0.25 m, finer depth increments are not reasonable because of the measured peak frequency f=190 MHz resulting in a Fresnel zone width at a 6 m distance of m and m, respectively, for reflection measurements at a reflector distance of 1.5 m, making clear vertical separation impossible. We tried migrating the profiles, but we did not obtain favorable results because our trace spacing of 0.25 m between each trace is too coarse. In the unmigrated profiles, vertical extension of the frozen area might be overestimated. The main goal was to obtain the lateral extent of the ice body, which does not suffer from the lack of migration.
We conducted borehole GPR measurements in a shallow Quaternary glacial aquifer before and during operation of an experimental geological latent heat storage. Prior to this study, it was difficult to predict the geological conditions in the immediate vicinity of the experimental site. We show that it is possible to extrapolate punctual geological information from one drilling point using a 3D velocity model derived from simple zero-offset crosshole measurements. This allows us to include detailed geometries of the geological layering in thermo-hydraulic modeling approaches.
Furthermore, while operating the LHS system, we aimed to investigate the feasibility of imaging a vertical freeze–thaw boundary using borehole GPR in the challenging (for GPR) context of water-saturated glacial sediments. We therefore carried out reflection and crosshole borehole measurements during an LHS storage experiment, in which a depth-horizontal subsurface volume is frozen. These experiments confirmed that both borehole crosshole and borehole reflection GPR enable us to image the frozen subsurface volume. However, only reflection measurements are able to quantify ice body size by determining the position of the freeze–thaw boundary with an error of ±0.1 m. Measuring at multiple campaigns has shown fast acquisition and good repeatability of the data. Resolution is mainly limited by the timing error of the wave arrivals caused by low signal-to-noise ratio because of high attenuation in a water-saturated environment. This prevents the use of higher-frequency sources for reflection imaging. At least two boreholes are required to obtain accurate velocity information and to map the extent of freezing in one direction. There is evidence for the vertical confinement of the ice body, but the clear determination of top and bottom is limited by Fresnel zone width.
For further projects, observation well positions that are in same distance range as the expected freeze–thaw boundary have to be avoided. In this study, the monitoring design was affected by having too many observation wells at a similar distance to the imaging target due to the requirements of providing access not only for geophysical monitoring.
Taken together, these results suggest that borehole GPR is a viable method for monitoring LHS systems. The combination of ZOPs and reflection measurements is a suitable setup for quick imaging of the lateral boundary of a freezing subsurface volume.
Inclinometer and Differential Global Positioning System (DGPS) measurements, as well as borehole GPR data, are published in the PANGAEA repository (https://doi.org/10.1594/PANGAEA.971978; Jung et al., 2024).
PJ: writing (review and editing), writing (original draft), visualization, validation, project administration, methodology, investigation, software, formal analysis, data curation, and conceptualization. GH: writing (review and editing), resources, project administration, funding acquisition, and conceptualization. AD: writing (review and editing), resources, funding acquisition, and conceptualization. PD: writing (review and editing), supervision, methodology, resources, funding acquisition, and conceptualization. UW: writing (review and editing), writing (original draft), supervision, project administration, resources, methodology, validation, funding acquisition, and conceptualization.
At least one of the (co-)authors is a member of the editorial board of Solid Earth. The peer-review process was guided by an independent editor, and the authors also have no other competing interests to declare.
Publisher's note: Copernicus Publications remains neutral with regard to jurisdictional claims made in the text, published maps, institutional affiliations, or any other geographical representation in this paper. While Copernicus Publications makes every effort to include appropriate place names, the final responsibility lies with the authors.
This research has been supported by the Bundesministerium für Bildung und Forschung (grant no. 03G0907A/B).
The article processing charges for this open-access publication were covered by the Helmholtz Centre for Environmental Research – UFZ.
This paper was edited by Michal Malinowski and reviewed by three anonymous referees.
Agyenim, F., Hewitt, N., Eames, P., and Smyth, M.: A review of materials, heat transfer and phase change problem formulation for latent heat thermal energy storage systems (LHTESS), Renew. Sust. Energ. Rev., 14, 615–628, https://doi.org/10.1016/j.rser.2009.10.015, 2010.
Axtell, C., Murray, T., Kulessa, B., Clark, R. A., and Gusmeroli, A.: Improved accuracy of cross-borehole radar velocity models for ice property analysis, Geophysics, 81, WA203–WA212, https://doi.org/10.1190/GEO2015-0131.1, 2016.
Campbell, S. W., Briggs, M., Roy, S. G., Douglas, T. A., and Saari, S.: Ground-penetrating radar, electromagnetic induction, terrain, and vegetation observations coupled with machine learning to map permafrost distribution at Twelvemile Lake, Alaska, Permafrost Periglac., 32, 407–426, https://doi.org/10.1002/ppp.2100, 2021.
Cao, B., Gruber, S., Zhang, T., Li, L., Peng, X., Wang, K., Zheng, L., Shao, W., and Guo, H.: Spatial variability of active layer thickness detected by ground-penetrating radar in the Qilian Mountains, Western China, J. Geophys. Res.-Earth, 122, 574–591, https://doi.org/10.1002/2016jf004018, 2017.
Cassidy, N. J.: Electrical and Magnetic Properties of Rocks, Soils and Fluids, Ground Penetrating Radar Theory and Applications, 2, 41–72, https://doi.org/10.1016/b978-0-444-53348-7.00002-8, 2009.
Dahmke, A. and Schwarzfeld, B.: Untertägiges Eisspeichersystem in Grundwasserleitern und Grundwassergeringleitern zur Wärmeversorgung, International Patent no. WO2022117579A1, WIPO PCT, 2022.
Dessa, J.-X. and Pascal, G.: Combined traveltime and frequency-domain seismic waveform inversion: a case study on multi-offset ultrasonic data, Geophys. J. Int., 154, 117–133, 2003.
Dietrich, P., Butler Jr., J., and Faiß, K.: The direct push injection logger: a rapid approach for assessment of vertical variations in hydraulic conductivity, Groundwater, 46, 323–328, https://doi.org/10.1111/j.1745-6584.2007.00377.x, 2008.
Du, E., Zhao, L., Zou, D., Li, R., Wang, Z., Wu, X., Hu, G., Zhao, Y., Liu, G., and Sun, Z.: Soil moisture calibration equations for active layer GPR detection – A case study specially for the Qinghai–Tibet Plateau permafrost regions, Remote Sens.-Basel, 12, 605, https://doi.org/10.3390/rs12040605, 2020.
Heldt, S., Wang, B., Hu, L. W., Hornbruch, G., Luders, K., Werban, U., and Bauer, S.: Numerical investigation of a high temperature heat injection test, J. Hydrol., 597, 126229, https://doi.org/10.1016/j.jhydrol.2021.126229, 2021.
Hermans, T., Nguyen, F., Robert, T., and Revil, A.: Geophysical methods for monitoring temperature changes in shallow low enthalpy geothermal systems, Energies, 7, 5083–5118, https://doi.org/10.3390/en7085083, 2014.
Hermans, T., Wildemeersch, S., Jamin, P., Orban, P., Brouyère, S., Dassargues, A., and Nguyen, F.: Quantitative temperature monitoring of a heat tracing experiment using cross-borehole ERT, Geothermics, 53, 14–26, https://doi.org/10.1016/j.geothermics.2014.03.013, 2015.
Hinkel, K. M., Doolittle, J. A., Bockheim, J. G., Nelson, F. E., Paetzold, R., Kimble, J. M., and Travis, R.: Detection of subsurface permafrost features with ground-penetrating radar, Barrow, Alaska, Permafrost Periglac., 12, 179–190, https://doi.org/10.1002/ppp.369, 2001.
Hu, L., Schnackenberg, M., Hornbruch, G., Lüders, K., Pfeiffer, W. T., Werban, U., and Bauer, S.: Cross-well multilevel pumping tests – A novel approach for characterizing the changes of hydraulic properties during gas storage in shallow aquifers, J. Hydrol., 620, 129520, https://doi.org/10.1016/j.jhydrol.2023.129520, 2023.
Jung, P., Pohle, M., and Werban, U.: Borehole-GPR crosshole and reflection data from monitoring of freeze-thaw cycles in a geological latent heat storage system, Helmholtz Centre for Environmental Research – UFZ, PANGAEA [data set], https://doi.org/10.1594/PANGAEA.971978, 2024.
King, R. W. P., Smith, G. S., Owens, M., and Wu, T. T.: Antennas in matter: fundamentals, theory, and applications, MIT Press, Cambridge, Mass., 868 pp., ISBN 0262110741, ISBN 9780262110747, 1981.
Keller, N.-S., Hornbruch, G., Lüders, K., Werban, U., Vogt, C., Kallies, R., Dahmke, A., and Richnow, H. H.: Monitoring of the effects of a temporally limited heat stress on microbial communities in a shallow aquifer, Sci. Total Environ., 781, 146377, https://doi.org/10.1016/j.scitotenv.2021.146377, 2021.
Keller, N. S., Lüders, K., Hornbruch, G., Birnstengel, S., Vogt, C., Ebert, M., Kallies, R., Dahmke, A., and Richnow, H. H.: Rapid Consumption of Dihydrogen Injected into a Shallow Aquifer by Ecophysiologically Different Microbes, Environ. Sci. Technol., 58, 333–341, https://doi.org/10.1021/acs.est.3c04340, 2024.
Kim, J.-H., Park, S.-G., Yi, M.-J., Son, J.-S., and Cho, S.-J.: Borehole radar investigations for locating ice ring formed by cryogenic condition in an underground cavern, J. Appl. Geophys., 62, 204–214, https://doi.org/10.1016/j.jappgeo.2006.11.002, 2007.
Klotzsche, A., van der Kruk, J., Meles, G. A., Doetsch, J., Maurer, H., and Linde, N.: Full-waveform inversion of cross-hole ground-penetrating radar data to characterize a gravel aquifer close to the Thur River, Switzerland, Near Surf. Geophys., 8, 635–649, 2010.
Lamert, H., Geistlinger, H., Werban, U., Schütze, C., Peter, A., Hornbruch, G., Schulz, A., Pohlert, M., Kalia, S., and Beyer, M.: Feasibility of geoelectrical monitoring and multiphase modeling for process understanding of gaseous CO2 injection into a shallow aquifer, Environ. Earth Sci., 67, 447–462, 2012.
Löffler, M., Schrader, M., Lüders, K., Werban, U., Hornbruch, G.., Dahmke, A., Vogt, C., and Richnow, H. H.: Stable Hydrogen Isotope Fractionation of Hydrogen in a Field Injection Experiment: Simulation of a Gaseous H2 Leakage, ACS Earth and Space Chemistry, 6, 631–641, https://doi.org/10.1021/acsearthspacechem.1c00254, 2022.
Looms, M. C., Klotzsche, A., van der Kruk, J., Larsen, T. H., Edsen, A., Tuxen, N., Hamburger, N., Keskinen, J., and Nielsen, L.: Mapping sand layers in clayey till using crosshole ground-penetrating radar, Geophysics, 83, A21–A26, https://doi.org/10.1190/geo2017-0297.1 2018.
Lozàn, J. L., Breckle, S.-W., Grassl, H., Kasang, D., and Matzarakis, A.: Städte im Klimawandel, in: Warnsignal Klima: Die Städte, Thieme, 11–20, https://doi.org/10.1055/a-2144-5404, 2019.
Lüders, K., Hornbruch, G., Zarrabi, N., Heldt, S., Dahmke, A., and Köber, R.: Predictability of initial hydrogeochemical effects induced by short-term infiltration of ∼75 °C hot water into a shallow glaciogenic aquifer, Water Research X, 13, 100121, https://doi.org/10.1016/j.wroa.2021.100121, 2021.
McCall, W. and Christy, T. M.: The hydraulic profiling tool for hydrogeologic investigation of unconsolidated formations, Groundwater Monitoring & Remediation, 40, 89–103, 2020.
McCall, W., Christy, T. M., Pipp, D., Terkelsen, M., Christensen, A., Weber, K., and Engelsen, P.: Field application of the combined membrane-interface probe and hydraulic profiling tool (MiHpt), Groundwater Monitoring & Remediation, 34, 85–95, 2014.
Peter, A., Lamert, H., Beyer, M., Hornbruch, G., Heinrich, B., Schulz, A., Geistlinger, H., Schreiber, B., Dietrich, P., Werban, U., Vogt, C., Richnow, H.-H., Großmann, J., and Dahmke, A.: Investigation of the geochemical impact of CO2 on shallow groundwater: design and implementation of a CO2 injection test in Northeast Germany, Environ. Earth Sci., 67, 335–349, https://doi.org/10.1007/s12665-012-1700-5, 2012.
Schwamborn, G., Dix, J., Bull, J., and Rachold, V.: High-resolution seismic and ground penetrating radar–geophysical profiling of a thermokarst lake in the western Lena Delta, Northern Siberia, Permafrost Periglac., 13, 259–269, 2002.
Sokolov, K., Fedorova, L., and Fedorov, M.: Prospecting and evaluation of underground massive ice by ground-penetrating radar, Geosciences, 10, 274, https://doi.org/10.3390/geosciences10070274, 2020.
Steelman, C. M., Endres, A. L., and van der Kruk, J.: Field observations of shallow freeze and thaw processes using high-frequency ground-penetrating radar, Hydrol. Process., 24, 2022–2033, https://doi.org/10.1002/hyp.7688, 2010.
Steinbach, J., Popovski, E., Henrich, J., Christ, C., Ortner, S., Pehnt, M., Blömer, S., Auberger, A., Fritz, M., and Billerbeck, A.: Umfassende Bewertung des Potenzials für eine effiziente Wärme-und Kältenutzung für Deutschland: Comprehensive Assessment Heating and Cooling Germany – Gemäß Artikel 14 Absatz 1 und Anhang VIII der Richtlinie 2012/27/EU.2021, Fraunhofer Institute for Systems and Innovation Research ISI, https://publica.fraunhofer.de/handle/publica/301057 (last access: 5 December 2024), 2020.
Stephani, E., Fortier, D., Shur, Y., Fortier, R., and Doré, G.: A geosystems approach to permafrost investigations for engineering applications, an example from a road stabilization experiment, Beaver Creek, Yukon, Canada, Cold Reg. Sci. Technol., 100, 20–35, https://doi.org/10.1016/j.coldregions.2013.12.006, 2014.
Stevens, C. W., Moorman, B. J., and Solomon, S. M.: Detection of frozen and unfrozen interfaces with ground penetrating radar in the nearshore zone of the Mackenzie Delta, Canada, 1711–1716 (Vol 2) in: 2 Vols., Ninth International Conference on Permafrost, edtied by: Kane, D. L. and Hinkel, K. M., Institute of Northern Engineering, University of Alaska Fairbanks, 2140 pp., ISBN 978-0-9800179-3-9 (v.2), 2008.
Terry, N., Grunewald, E., Briggs, M., Gooseff, M., Huryn, A. D., Kass, M. A., Tape, K. D., Hendrickson, P., and Lane Jr., J. W.: Seasonal subsurface thaw dynamics of an aufeis feature inferred from geophysical methods, J. Geophys. Res.-Earth, 125, e2019JF005345, https://doi.org/10.1029/2019JF005345, 2020.
Vienken, T., Leven, C., and Dietrich, P.: Use of CPT and other direct push methods for (hydro-) stratigraphic aquifer characterization – a field study, Can. Geotech. J., 49, 197–206, 2012.
Vonder Mühll, D., Hauck, C., and Gubler, H.: Mapping of mountain permafrost using geophysical methods, Prog. Phys. Geog., 26, 643–660, https://doi.org/10.1191/0309133302pp356ra, 2002.
Wang, Q. and Shen, Y.: Calculation and Interpretation of Ground Penetrating Radar for Temperature and Relative Water Content of Seasonal Permafrost in Qinghai-Tibet Platea, Electronics, 8, 731, 2019.
Weigand, M., Wagner, F. M., Limbrock, J. K., Hilbich, C., Hauck, C., and Kemna, A.: A monitoring system for spatiotemporal electrical self-potential measurements in cryospheric environments, Geosci. Instrum. Meth., 9, 317–336, 2020.
Yu, Y., Klotzsche, A., Weihermüller, L., Huisman, J. A., Vanderborght, J., Vereecken, H., and van der Kruk, J.: Measuring vertical soil water content profiles by combining horizontal borehole and dispersive surface ground penetrating radar data, Near Surf. Geophys., 18, 275–294, 2020.


