the Creative Commons Attribution 4.0 License.
the Creative Commons Attribution 4.0 License.
 | 13 May 2024
Multiscalar 3D temporal structural characterisation of Smøla island, mid-Norwegian passive margin: an analogue for unravelling the tectonic history of offshore basement highs
Matthew S. Hodge
Guri Venvik
Jochen Knies
Roelant van der Lelij
Jasmin Schönenberger
Øystein Nordgulen
Marco Brönner
Aziz Nasuti
Giulio Viola
Smøla island, situated within the mid-Norwegian passive margin, contains crystalline-basement-hosted intricate fracture and fault arrays formed during a polyphase brittle tectonic evolution. Its detailed study may strengthen correlation attempts between the well-exposed onshore domain and the inaccessible offshore domain, further the understanding of the passive margin evolution, and provide useful constraints on petrophysical properties of fractured basement blocks. A combination of geophysical and remote sensing lineament analysis, field mapping, high-resolution drill hole logging, 3D modelling, petrographic and microstructural studies, and fault gouge K–Ar geochronology made it possible to define five deformation episodes (D1 to D5). These episodes occurred between the post-Caledonian evolution of the regional-scale Møre–Trøndelag Fault Complex (MTFC) and the Late Cretaceous and younger crustal extension preceding the final stages of Greenland–Norway break-up. Each reconstructed deformation stage is associated with different structural features, fault and fracture geometries, and kinematic patterns. Synkinematic mineralisations evolved progressively from epidote–prehnite, sericite–chlorite–calcite, chlorite–hematite, hematite–zeolite–calcite, to quartz–calcite. K–Ar geochronology constrains brittle deformation to discrete localisation events spanning from the Carboniferous to the Late Cretaceous. Multiscalar geometrical modelling at scales of 100, 10, and 1 m helps constrain the extent and size of the deformation zones of each deformation episode, with D2 structures exhibiting the greatest strike continuity and D1 features the most localised. Overall, the approach highlighted here is of great utility for unravelling complex brittle tectonic histories within basement volumes. It is also a prerequisite to constrain the dynamic evolution of the petrophysical properties of basement blocks.
- Article
(20629 KB) - Full-text XML
-
Supplement
(399 KB) - BibTeX
- EndNote


Offshore crystalline basement highs are important structural elements of rifted passive margins (Peron-Pinvidic et al., 2013; Zastrozhnov et al., 2020). However, accessing and studying these features is challenging due to their locations beneath deep oceanic waters and younger sedimentary cover. Constraining their structural characteristics and tectonic evolution typically relies on relatively low-resolution datasets, such as seismic surveys and scattered drill hole data (e.g. Holdsworth et al., 2019; Tanner et al., 2020), which limit detailed reconstructions. Most of the geological knowledge on offshore basement highs derives from hydrocarbon exploration work, which, until recently, mostly focussed on and around their faulted outermost edges, with limited interest in the basement volumes themselves (Riber et al., 2015). On the other hand, following indications that fractured and weathered basement may represent productive unconventional hydrocarbon reservoirs or act as pathways for oil and gas migration, they have recently begun to receive considerable attention (e.g. Hartz et al., 2013; Trice, 2014; Riber et al., 2015; Belaidi et al., 2018; Holdsworth et al., 2019).
A conceptual gap remains regarding the effective role of connected natural fractures and faults hosted within basement volumes (intrabasement structures) in an offshore context (Holdsworth et al., 2019). These structures are difficult to investigate offshore because their size is commonly below seismic resolution (Tanner et al., 2020). Consequently, characterising sub-seismic to regional-scale structures, and their potentially long-lived tectonic evolution, requires more than just low-resolution datasets. To mitigate these challenges, analogue onshore basement exposures can be of great assistance, as they provide more extensive and ready site access and data availability from regional- to microscale resolutions (e.g. regional geophysical data, field mapping, and thin sections).
The island of Smøla, within the mid-Norwegian passive margin, forms a subaerial exposure of crystalline basement rocks (Fig. 1a). The island is an ideal analogue for basement highs offshore central Norway, owing to both its proximity to the offshore Frøya High and the similarity of basement geology at both locations (Rønning and Elvebakk, 2005; Slagstad et al., 2011). Smøla has abundant local and regional structures which document the tectonic evolution of the margin through time. As such, any geological insights from Smøla could then potentially be applied to basement highs offshore, furthering the understanding of their internal structure and aiding in the reconstruction of their tectonic evolution.
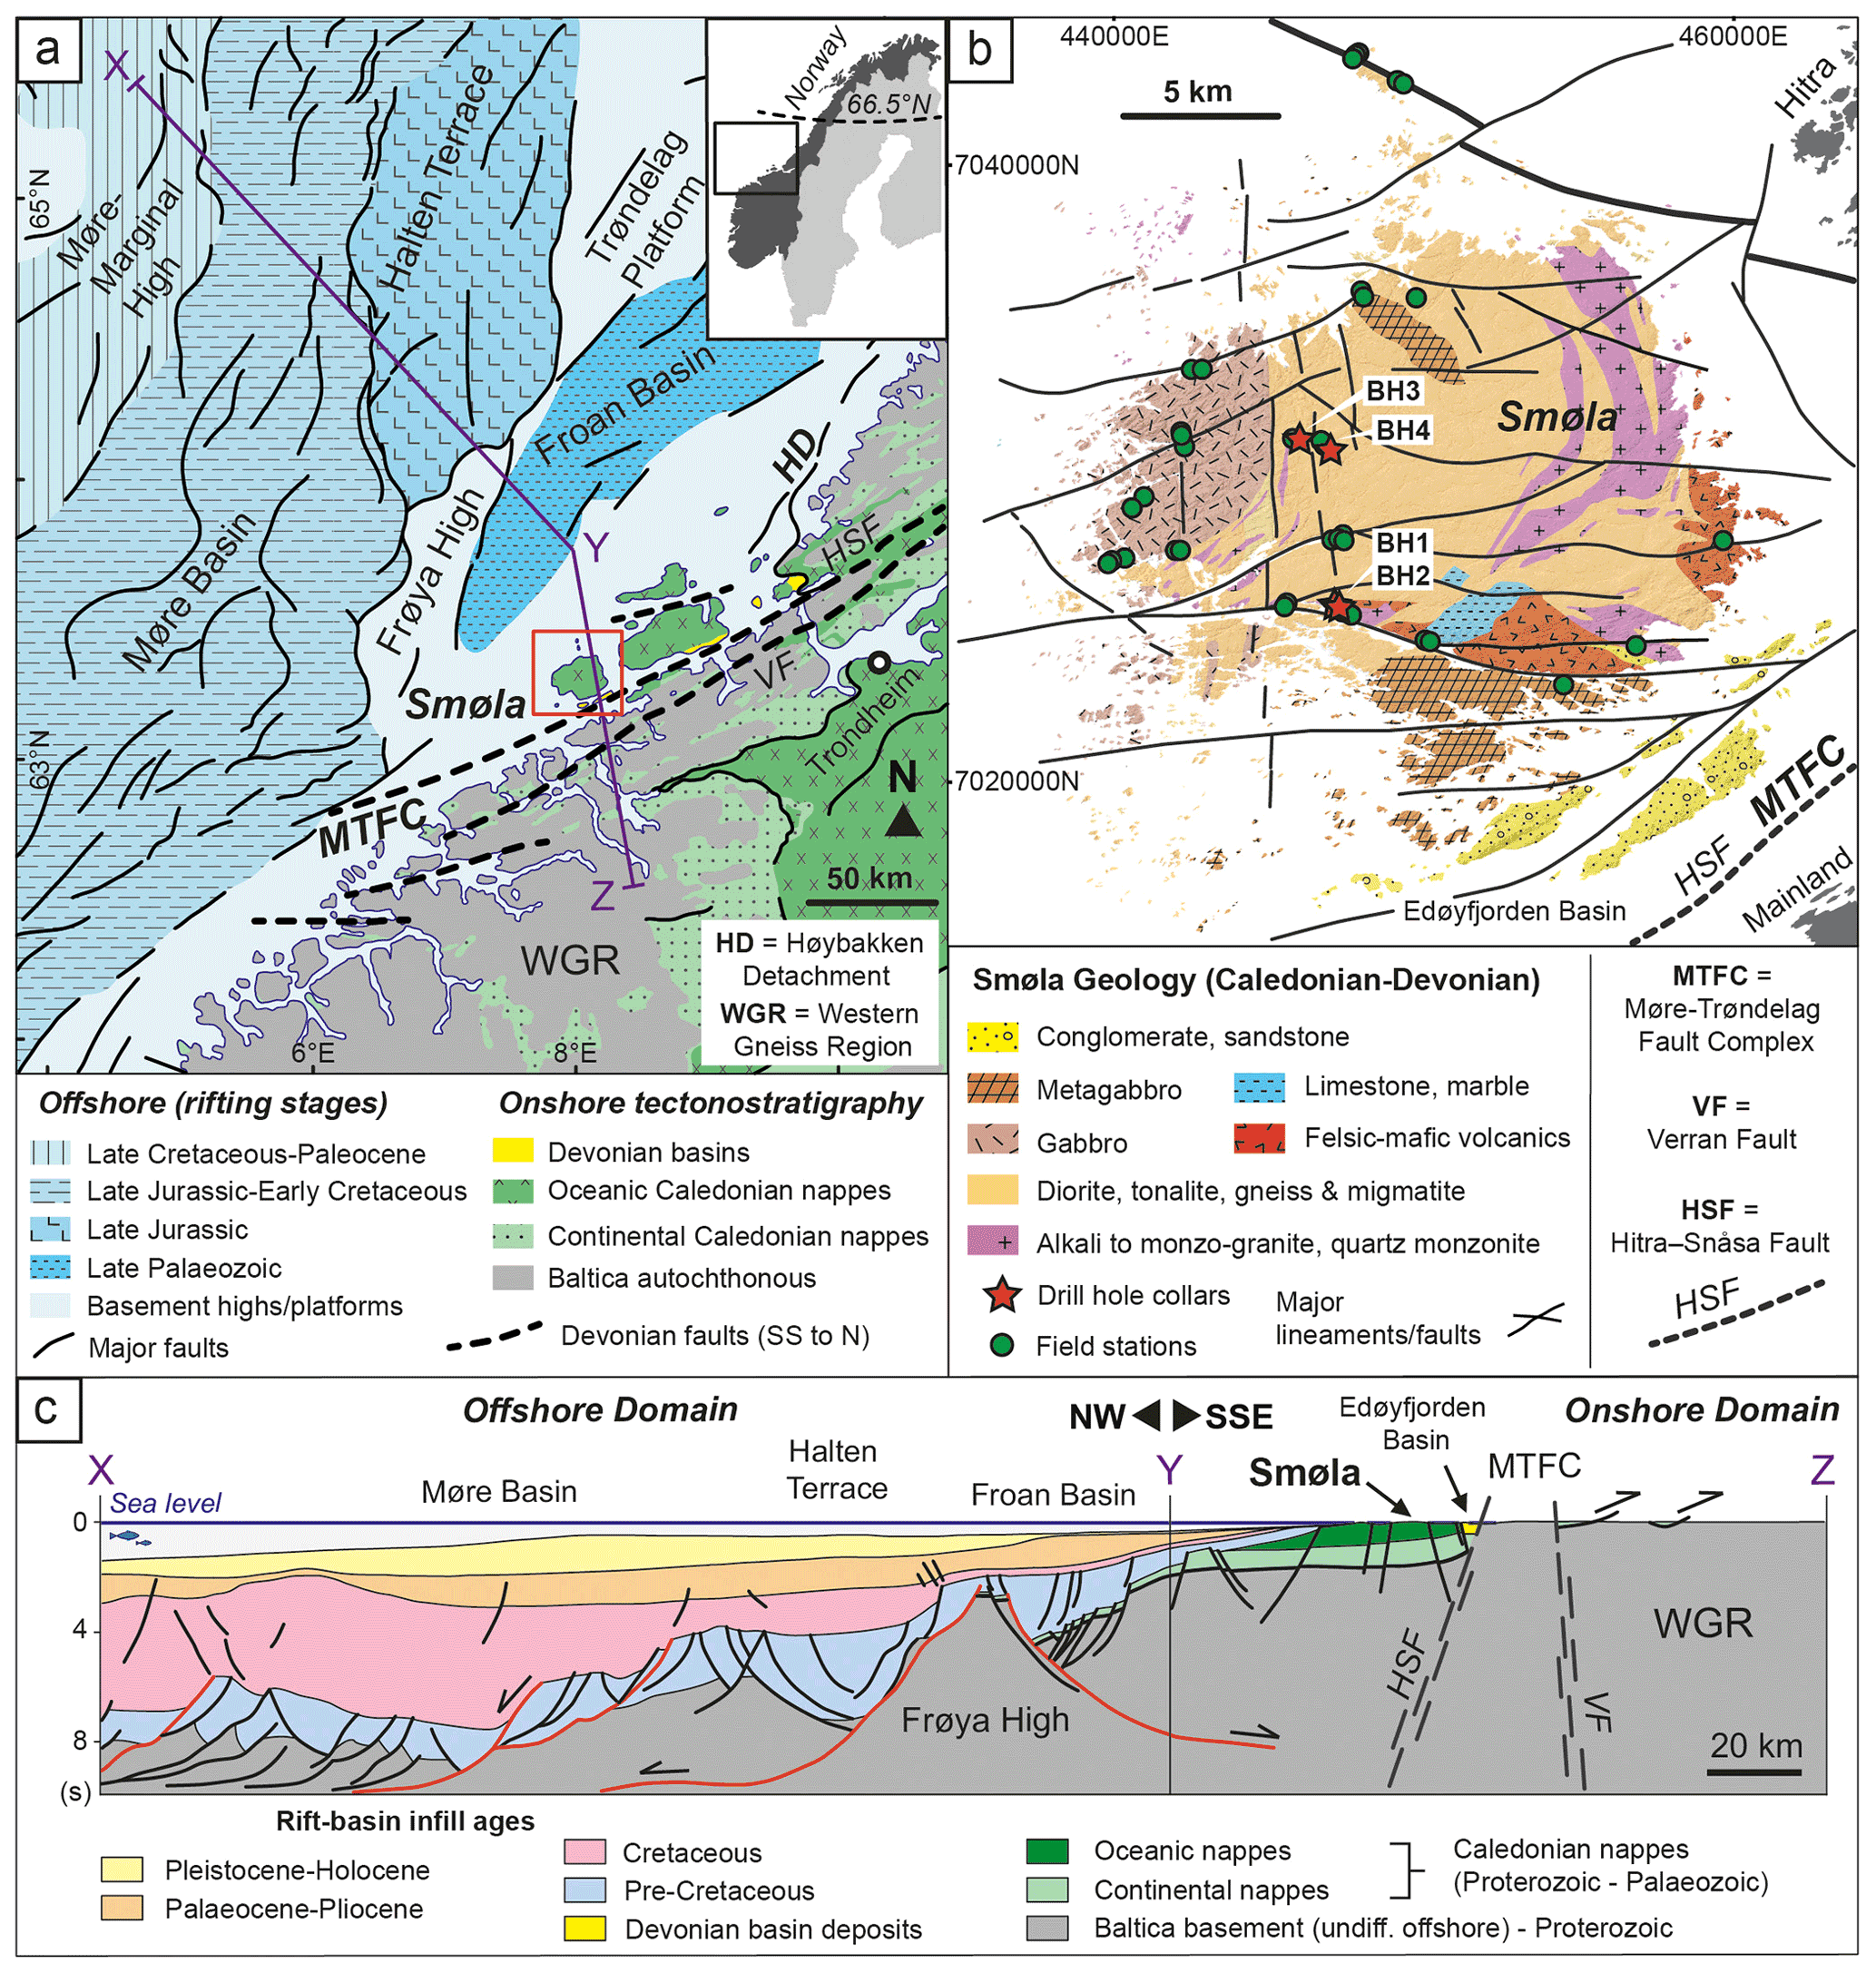
Figure 1The geological context of Smøla island, central Norway. (a) Regional setting of Smøla on the mid-Norwegian passive margin. Smøla is separated from the Western Gneiss Region (WGR) by the Møre–Trøndelag Fault Complex (MTFC) with two fault strands, namely the Hitra–Snåsa Fault (HSF) and the Verran Fault (VF). The Høybakken Detachment (HD) is shown to the NE of Smøla. Major basins present are to the NW of Smøla in the offshore domain (e.g. Møre basin) and bound by normal faults and structural highs (e.g. Frøya High) (modified from Faleide et al., 2008; bedrock map of Norway from Torgersen et al., 2021). (b) The local geology of Smøla showing the Caledonian and Devonian geology. Significant lineaments and faults (interpreted from airborne geophysics, DTM, and field studies) crosscut the island, with the MTFC (HSF strand) trace indicated. The drill holes (red stars) and outcrop mapping locations (green circles) are shown (modified from Fediuk and Siedlecki, 1977). (c) Onshore–offshore interpretive geological cross section (X–Y–Z), as shown in panel (a), showing major regional structures and crustal anatomy relative to Smøla. Including the two strands of the MTFC (HSF and VF) and the Frøya High offshore (modified from Zastrozhnov et al., 2020).
The brittle tectonic evolution of onshore basement exposures along the Norwegian passive margin has been extensively studied (Redfield et al., 2004; Davids et al., 2013; Ksienzyk et al., 2016; Scheiber et al., 2016, 2019; Scheiber and Viola, 2018; Tartaglia et al., 2020; Fossen et al., 2021; Hestnes et al., 2022), with Tartaglia et al. (2023) providing the latest insights for the mid-Norwegian portion. Applying the tight constraints from these studies, and a new three-dimensional (3D) perspective from four diamond drill holes on Smøla island, we present a case study that describes and tests a comprehensive workflow for characterising onshore basement blocks. Our multiscalar approach integrates surface geological tools (outcrop mapping and sampling), petrography, and regional datasets (airborne magnetic surveys and digital terrain models – DTMs), along with K–Ar geochronology, to constrain the absolute time dimension of the reconstructed tectonic phases. As fault and fracture arrays in crystalline rocks control local secondary permeability (Gillespie et al., 2020), our work has significant implications for resolving reservoir characteristics associated with offshore basement highs and basement deformation more generally. This study, therefore, offers a method to generate crucial deterministic inputs for modelling basement fractures and petrophysical behaviour over time.
2.1 Regional perspective
Smøla island, located in central Norway, is set along the mid-Norwegian passive margin (Fig. 1a), a region shaped by a prolonged and complex geological history (Peron-Pinvidic and Osmundsen, 2020). The island (Fig. 1b) comprises 445.7±3.8 Ma plutonic magmatic-arc rocks (Tucker et al., 2004; Slagstad et al., 2011) and oceanic crustal units, all of which were emplaced and accreted just prior to the Silurian–Devonian (∼430 to 400 Ma) Scandian Phase of the Caledonian Orogeny (Tucker et al., 2004; Gee et al., 2008; Slagstad and Kirkland, 2018; Corfu et al., 2014). Caledonian shortening led to nappe and thrust fault development, with the transposition of the Smøla rocks along major detachments over both the allochthonous continental Neoproterozoic Baltoscandian nappes and the underlying autochthonous Palaeo- to Mesoproterozoic Baltican crystalline basement of the Western Gneiss Region (WGR) (Tucker et al., 2004; Corfu et al., 2014; Fossen, 1992) (Fig. 1c).
During the Early Devonian collapse of the by then overthickened orogen resulted in significant crustal extension by both the reactivation of favourably oriented contractional structures (Fossen et al., 2017; Fossen, 2010) and the development of new crustal-scale extensional shear zones and regional exhumation (Fig. 1) (Osmundsen et al., 2006). Devonian extension also caused the Smøla rocks to be translated in response to both strike-slip and down-faulting across the Møre–Trøndelag Fault Complex (MTFC), a regional fault system with complex kinematics that was repeatedly reactivated through time (Redfield et al., 2004; Watts et al., 2023; Grønlie and Roberts, 1989; Grønlie et al., 1994). Smøla experienced limited metamorphic overprint (on average sub-greenschist facies conditions) and only localised ductile deformation (Tucker et al., 2004). Associated with the Devonian tectonic inversion, extensional (possible pull-apart) basins formed in response to brittle extensional faulting, such as the MTFC-related Edøyfjorden basin proximal to Smøla (Fig. 1b) (Fossen et al., 2017; Osmundsen et al., 2006; Bøe and Bjerkli, 1989; Bøe et al., 1989).
Post-Caledonian extension and rifting continued to the Late Cretaceous/Early Palaeocene, eventually leading to the Greenland–Eurasia plate break-up at ∼54 Ma and opening of the North Atlantic, forming the Norwegian passive margin (Peron-Pinvidic and Osmundsen, 2018; Bunkholt et al., 2022). This prolonged process involved multiple tectonic phases: rift initiation during the Carboniferous, Permo-Triassic crustal stretching and rifting, Late Triassic to Jurassic crustal thinning, and renewed Mid-Jurassic to Early Cretaceous rifting, with the extension of the margin during the Late Cretaceous to Palaeocene and early seafloor formation and spreading during the Palaeocene–Eocene (Mosar et al., 2002; Faleide et al., 2008; Peron-Pinvidic and Osmundsen, 2018; Gernigon et al., 2020).
These events produced discrete generations of basins (such as the Froan and Møre basins) along the newly forming Norwegian shelf, which progressively infilled with synrift sediments (Fig. 1a and c) (Faleide et al., 2008; Zastrozhnov et al., 2020). In places, structural highs of Caledonian-aged and underlying Baltica crystalline basement, such as the Frøya High to the NW of Smøla formed through rift-related exhumation between these basins, leading to a remarkable host and graben series (Muñoz-Barrera et al., 2020). Bounding the structural highs and the different basins are crustal-scale extensional faults (Fig. 1a and c) (Skilbrei et al., 2002; Mosar et al., 2002). Overall, this protracted rifting and extension history resulted in a highly attenuated offshore domain reactivating and overprinting the existing Caledonian deformation features (Fig. 1a and c) (Zastrozhnov et al., 2020; Mosar et al., 2002).
2.2 The geology of Smøla
Smøla is composed of several Caledonian-aged bedrock types traditionally attributed to the Caledonian Upper Allochthon (Roberts and Gee, 1985) (Fig. 1b), including diorite (the most common lithology), gabbro, tonalite, alkali granite, quartz monzonite to monzogranite, quartz–feldspar and amphibolite–biotite gneiss, and limestone and volcanic rocks (andesitic to rhyolitic in composition in a faulted block on the SE portion of Smøla). Late felsic to mafic dykes crosscut all other rock types (Gautneb, 1988; Gautneb and Roberts, 1989; Fediuk and Siedlecki, 1977; Roberts, 1980; Bruton and Bockelie, 1979). In addition to the 445.7±3.8 Ma (1σ) intrusive age of a dated granodiorite (Tucker et al., 2004), a granitic dyke was dated to 428±10 Ma (2σ) () (Gautneb, 1988), providing an Ordovician–Silurian age envelope for the plutonic rocks on the island. To the S and SE of Smøla, the Caledonian bedrock is unconformably overlain by the late Silurian–Mid-Devonian sedimentary cover of the Smøla group and later Jurassic–Cretaceous sedimentary successions (Bøe et al., 1989; Fediuk and Siedlecki, 1977; Bøe and Bjerkli, 1989). These include siliciclastic deposits of red-oxidised polymictic conglomerate, siltstone, and sandstone (Bøe et al., 1989) which fill in Devonian extensional basins (e.g. Edøyfjorden basin; Fig. 1b) along the MTFC (Bøe and Bjerkli, 1989).
Further to the S and SE of Smøla (and bounding the Devonian basins), the ∼ NE–SW-striking MTFC is the most proximal and dominant regional-scale structure to the island. This wide (10 to 50 km) structure extends >600 km from central Trøndelag into the northern part of the North Sea and branches into two sub-parallel strands, namely the Hitra–Snåsa Fault (HSF) to the NW (the most proximal to Smøla) and the Verran Fault (VF) to the SE (Fig. 1a–c) (Olsen et al., 2007; Watts et al., 2023; Watts, 2001). The structural evolution of the MTFC is complex, with a polyphase deformation history from the Devonian until the Cenozoic (e.g. Grønlie and Roberts, 1989; Seranne, 1992; Watts, 2001; Redfield et al., 2004; Tartaglia et al., 2023; Watts et al., 2023).
This study's multi-technique approach involves a variety of 2D and 3D datasets ranging from the regional scale through to the microscale. Integrated into these datasets is the absolute time dimension provided through K–Ar geochronology of structurally well-characterised fault rocks, which give chronological constraints on all other datasets. We briefly outline the methods below, with a more detailed description in the Supplement.
3.1 Geophysical and remote sensing data and lineament mapping
The geophysical and DTM data used in this study were acquired by the Geological Survey of Norway (NGU) (Nasuti et al., 2015), with details on survey parameters and data processing available in the Supplement. Our lineament picking and mapping followed White (2014) and Scheiber and Viola (2018), making use of both the magnetic geophysical and DTM imagery within a geographic information system (GIS) software platform. The description of the methodology used to identify and place the lineaments is also available in the Supplement.
3.2 Fieldwork and drill hole logging
The field-based structural data acquisition involved standard geological field methods, including the systematic mapping of representative outcrops and ground-truthing of possible exposed deformation zones identified in the lineament mapping. In total, 66 outcrop sites were studied, with data collected recording deformation feature types, fracture/vein mineral infill, fault slip information, host rock lithology, and crosscutting/genetic relationships between the various features. The four diamond drill holes used in this study (stored in Trondheim, Norway) were drilled in 2019 and were designed to target major structures and sample weathered basement rocks. Geological features in the drill cores were systematically logged downhole (for a total investigated length of 364.9 m of diamond drill core), recording lithology and rock alteration, deformation types, fracture/fault characteristics, mineral infill, and crosscutting relationships. These data were also used for the 3D modelling of intersected deformation zones in drill holes BH1 and BH2. The methodology used to measure structural data in the drill core followed both the methods of Holcombe (2013) and Blenkinsop et al. (2015). A more detailed description of the methodology is available in the Supplement.
3.3 X-ray diffraction and K–Ar dating
Seven structurally controlled fault gouge and breccia samples were collected from fault and deformation zones in both drill core and outcrop and subsequently processed at the NGU laboratory in Trondheim, Norway. Initially, all samples were disintegrated and separated into <0.1, 0.1–0.4, 0.4–2, 2–6, and 6–10 µm size fractions. Each of these size fractions then underwent quantitative analysis for both potassium (K) and argon (Ar) using total digested ICP-OES (inductively coupled plasma–optical emission spectrometry) and an Isotopx NGX multicollector noble gas mass spectrometer system, respectively. X-ray diffraction (XRD) analysis was performed on each fraction to determine and quantify the mineralogical composition. A full description of both the XRD and K–Ar analysis methodology is available in the Supplement and in Viola et al. (2018).
4.1 Lineament mapping from geophysics and DTM data
The analysis of regional-scale features such as geophysical lineaments and topographic features (Fig. 2) formed the initial stage of the study. These features occur on the kilometre scale and, using both geophysical and DTM imagery, can be traced over both off- and onshore areas. The >2000 mapped lineaments (available in the data repository in the Supplement) are linear and curvilinear to irregular features which either crosscut or terminate against one another (Fig. 2a and b). The lineaments are classified based on the length and hierarchy of the formation: first-order lineaments are potentially major regional structures; second-order lineaments, commonly >10 km in length, are typically major splays or secondary features off the first-order lineaments, while third-order lineaments, typically <10 km in length, constitute the remaining lineaments.
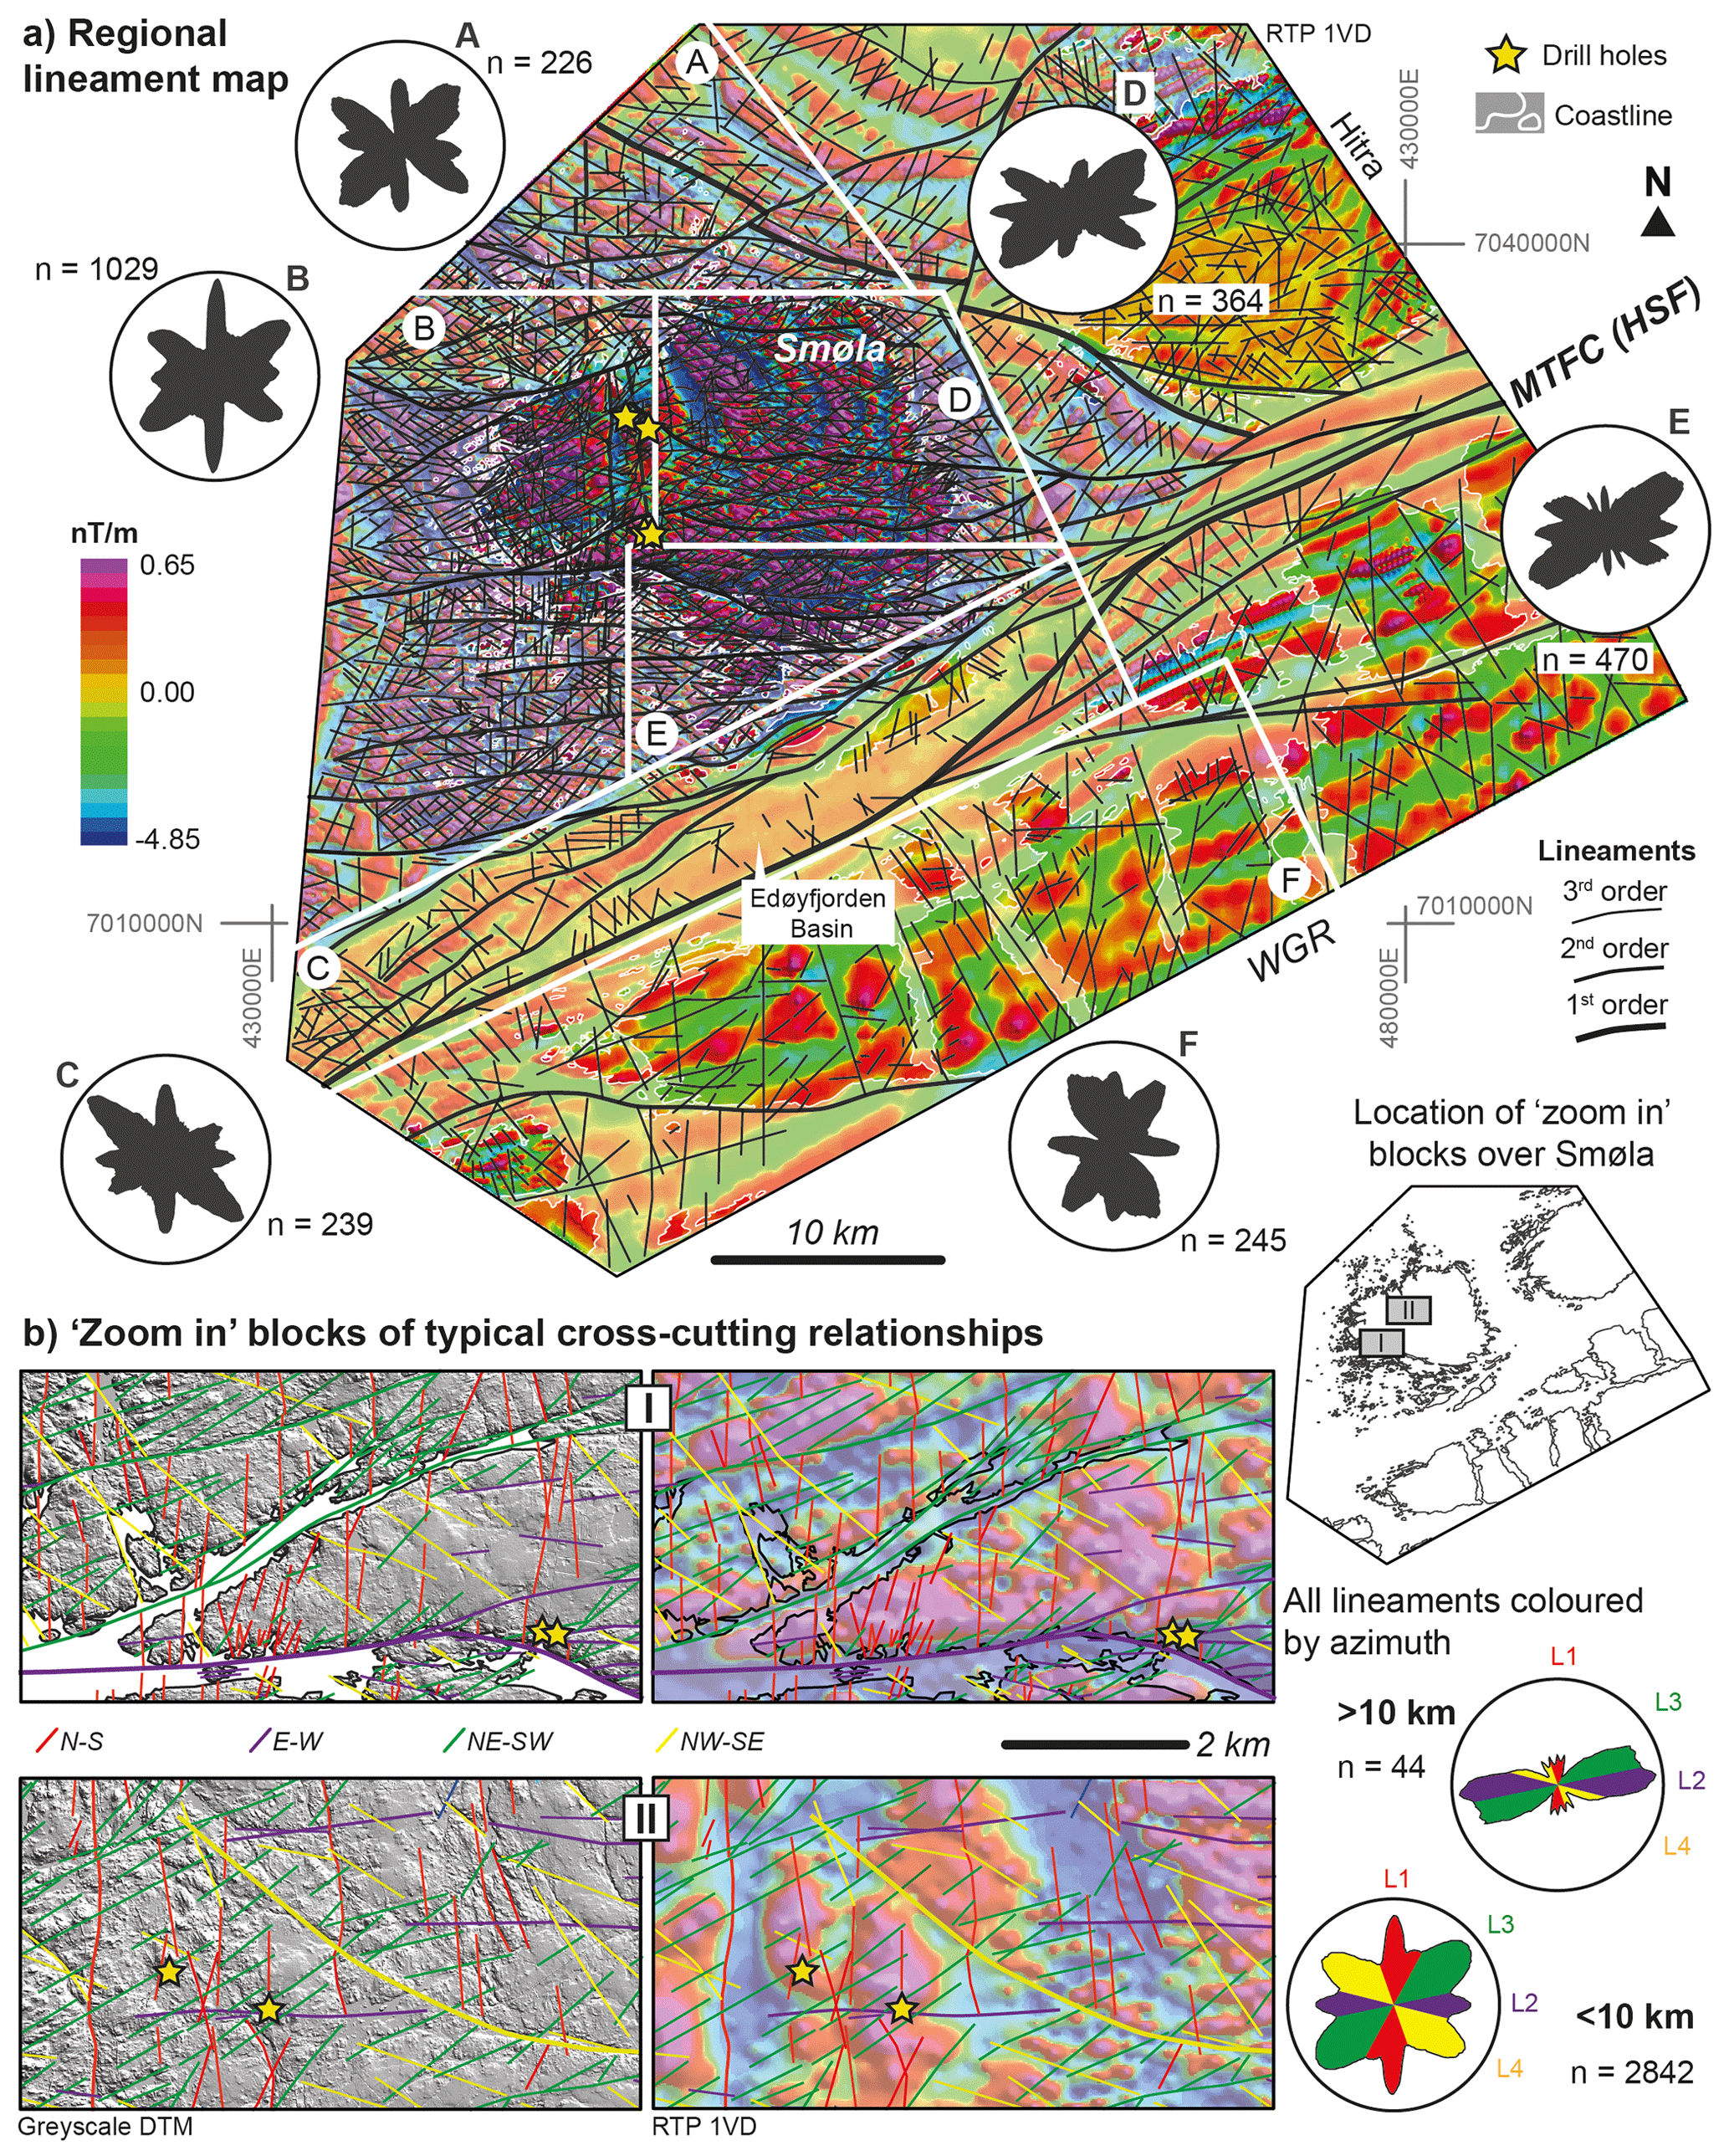
Figure 2(a) Airborne magnetic survey imagery (reduced to pole-first vertical derivative – RTP-1VD) over Smøla island and surrounding areas (coastline shown in white). Displayed over the magnetic imagery are first-, second-, and third-order lineaments mapped from both the magnetic data and DTM data. Airborne magnetic survey imagery from Nasuti et al. (2015). The area over Smøla onto the WGR region is subdivided into A (north of Smøla), B (west and SW of Smøla), C (area over the MTFC), D (NE Smøla), E (SE Smøla), and F (WGR area). Rose plots of strike trends of mapped lineaments are shown by area. (b) Zoomed-in blocks showing representative examples of crosscutting relationships between the different lineament trends (coloured by trend) on both DTM and geophysical imagery (DTM data from the NGU). Locations of the zoomed-in blocks are displayed on the adjacent schematic map of Smøla (coastline map courtesy of the NGU), along with rose diagrams showing orientation trends of lineaments with >10 and <10 km lengths. Rose plots use the same colours as the lineaments on the zoomed-in blocks and are labelled to show the L1 to L4 lineament trends.
The first-, second-, and third-order lineaments are subdivided into four main orientation trends, based on azimuth frequency maxima, which are labelled (L1) N–S, (L2) E–W, (L3) NE–SW, and (L4) NW–SE (Fig. 2b) (hereinafter L1 to L4). Determining precise crosscutting relationships between these lineament trends is often challenging due to the imagery resolution and the difficulty of defining lineament end points. However, where possible, interpretive crosscutting relationships provide a relative timing of lineament formation. The age, crosscutting, and termination relationships of the specific lineament trends are summarised in Table 1 and selectively illustrated in Fig. 2b.
Table 1Interpretive age relationship matrix between the main lineament trends. The lineament trends are ordered as they are discussed in the text. Relationship types include X (crosscutting), T (terminating), and ? (uncertain).
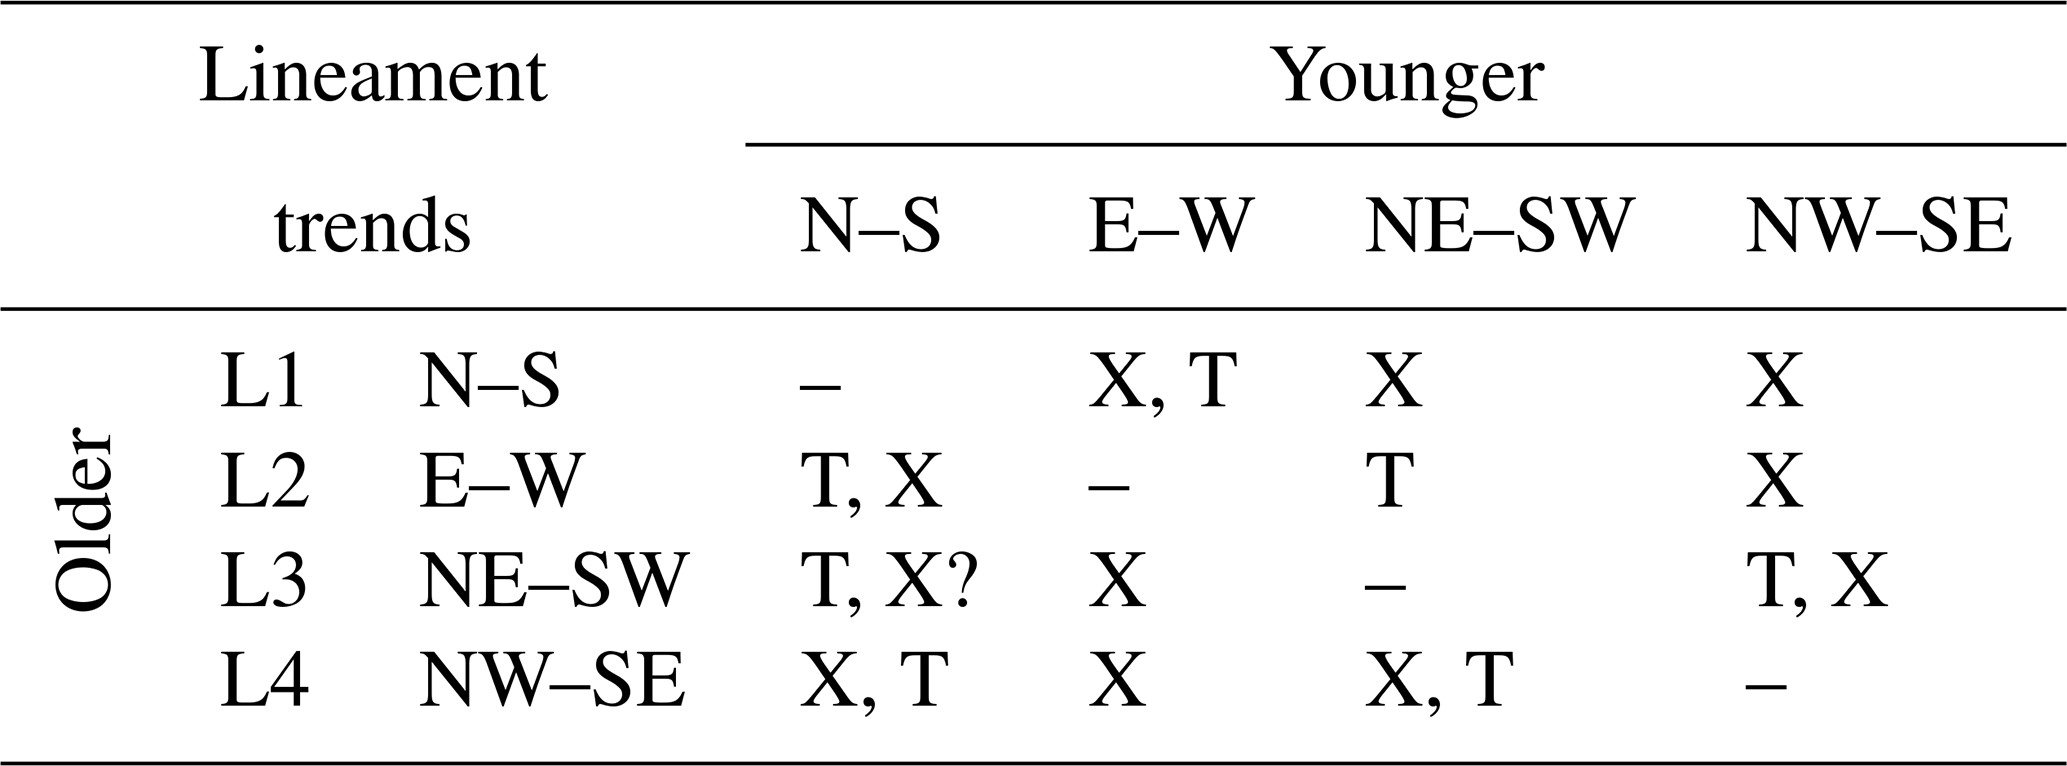
L1 is most common in the western part of Smøla and offshore in areas A and B in Fig. 2a. Its lineaments are typically second- to third-order and are crosscut by all other lineaments (Fig. 2bI). Local mutual crosscutting relationships between L1 and L4 suggest they are likely coeval/conjugates. L1, L2, and L3 lineaments have complex crosscutting relationships, with L1 being potentially horizontally offset (dextrally and sinistrally) with multiple possible reactivations in places (Fig. 2bI and bII).
The L2 lineaments are most common in central Smøla, particularly in areas B, D, and E, clustering on the NW side of the MTFC (Fig. 2a) and occurring as second-order lineaments and possible splays off the first-order MTFC (HSF) lineament (Fig. 2a). L2 is crosscut by L1 and L4 (Fig. 2bII) and also exhibits mutual crosscutting (potentially coeval) relationships with the L3 lineaments (which, in turn, typically splay off the E–W structures) (Fig. 2bI). Frequently, L1, L2, and L4 (third-order lineaments only) are similarly crosscut by the same lineament trends, indicating that these lineaments may have formed coevally (Fig. 2bII). The longer L2 second-order lineaments do, however, crosscut most other lineaments (Fig. 2bI), suggesting either a later formation or a longer period of activity/reactivation.
The L3 lineaments are pervasive across Smøla within areas A, D, E, B, and F (Fig. 2a). These lineaments are typically third-order lineaments and sub-parallel to the MTFC (HSF) trend. In the eastern part of Smøla (areas E and D), they cluster on and terminate against the N/NE sides of L2 (Fig. 2bI), possibly representing third-order Riedel shears or splays off the second-order L2. In the western part of Smøla, they form prominent elongated topographical valleys in the DTM and terminate less commonly against L2. These lineaments crosscut and dextrally offset both the L1 and L4 (less distinctly) and terminate against L2 (infrequently also L4) (Fig. 2bII). L3 lineaments are, however, in turn either locally crosscut by or are terminated up against by L1 and rarely L4 (mutual terminating relationship) (Fig. 2bII).
L4 is common to the north of the MTFC over most parts of Smøla and offshore (areas A, B, D, and E in Fig. 2a). L4 is similarly crosscut by many of the other lineament sets (Fig. 2b), although locally L4 crosscuts L2 and the L3 lineaments, as well as the magnetic grain (Fig. 2b), but this may be due to later reactivations. The L4 and L1 lineaments have rare mutual crosscutting relationships, although in general L1 tends to terminate up against L4.
Representing a later subset of L4, the WNW–ESE-striking portion of L4 is also present throughout the study area, although mostly NW of the MTFC and are either second- or third-order lineaments. This late L4 crosscuts all other lineaments, with only rare examples of L1 crosscutting it (Fig. 2bII). Similarly, L1 has a younger, possibly reactivated component. These younger L1 lineaments are most abundant in the areas D and B (more NNE–SSW-striking), and areas F and E (more NNW–SSE-striking) over Smøla and the WGR. Overall, these lineaments terminate against and crosscut all the other lineaments (Fig. 2bI and bII), suggesting an early formation and a possible late reactivation.
4.2 Field, drill hole, and petrographic results
Field observations (Figs. 1b and 3) and four diamond drill holes (Figs. 1b and 4) offer a novel 3D perspective on Smøla's geology. Various minerals decorating fracture surfaces, fault rocks, and veins are systematically documented, showing coeval or crosscutting relationships and orientation trends (Figs. 3, 5, and 6). As such, assemblages of coeval infill minerals have been used to group the deformation features based on the relative timing (labelled D1 to D5). The coeval mineral assemblages, with corresponding consistent deformation styles and orientation trends, may represent distinct mineralisation events associated with discrete deformation episodes (e.g. Drake et al., 2009; Viola et al., 2009).
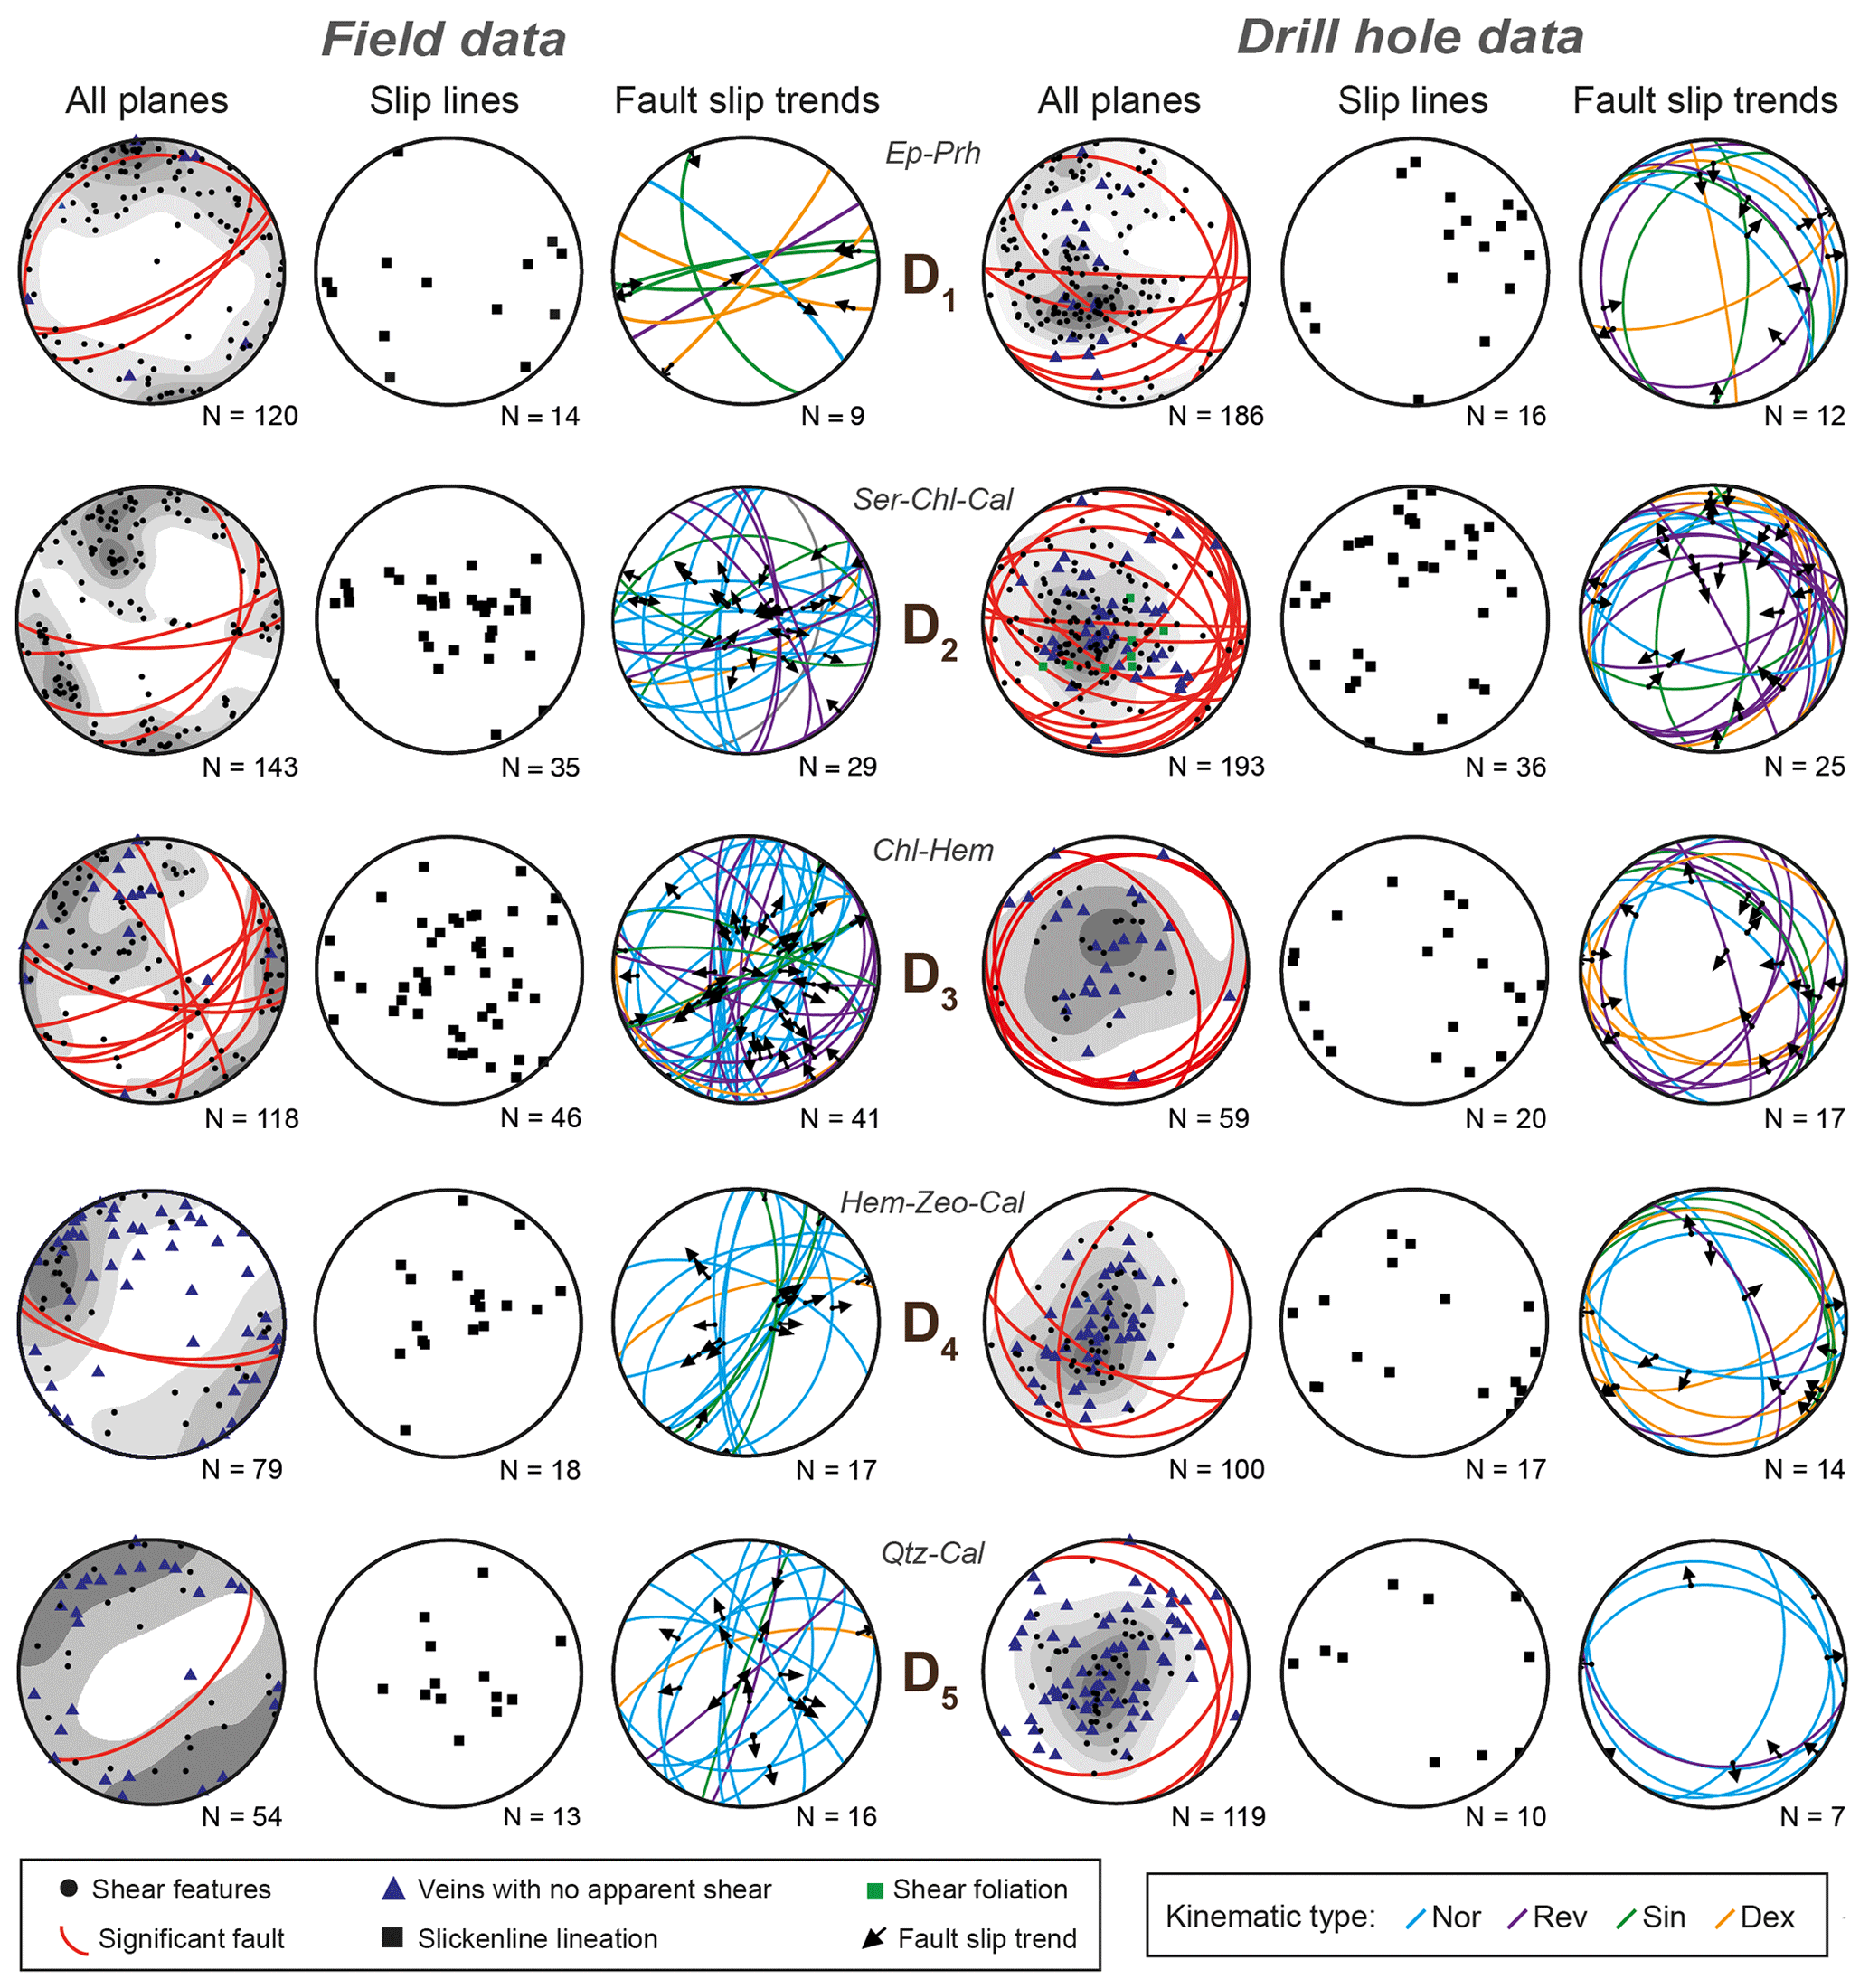
Figure 3Equal area, lower-hemisphere stereonet plots of deformation features in outcrop or drill core sorted by deformation episodes D1 to D5 and coeval mineral assemblages. All plane plots are Kamb-contoured at 2σ interval, with drill hole stereonets not Terzaghi-corrected. Mineral types are as follows: Ep is for epidote, Prh is for prehnite, Ser is for sericite, Chl is for chlorite, Cal is for calcite, Hem is for hematite, Zeo is for zeolite, and Qtz is for quartz. Kinematic types are as follows: Nor is for normal, Rev is for reverse, Sin is for sinistral, and Dex is for dextral.
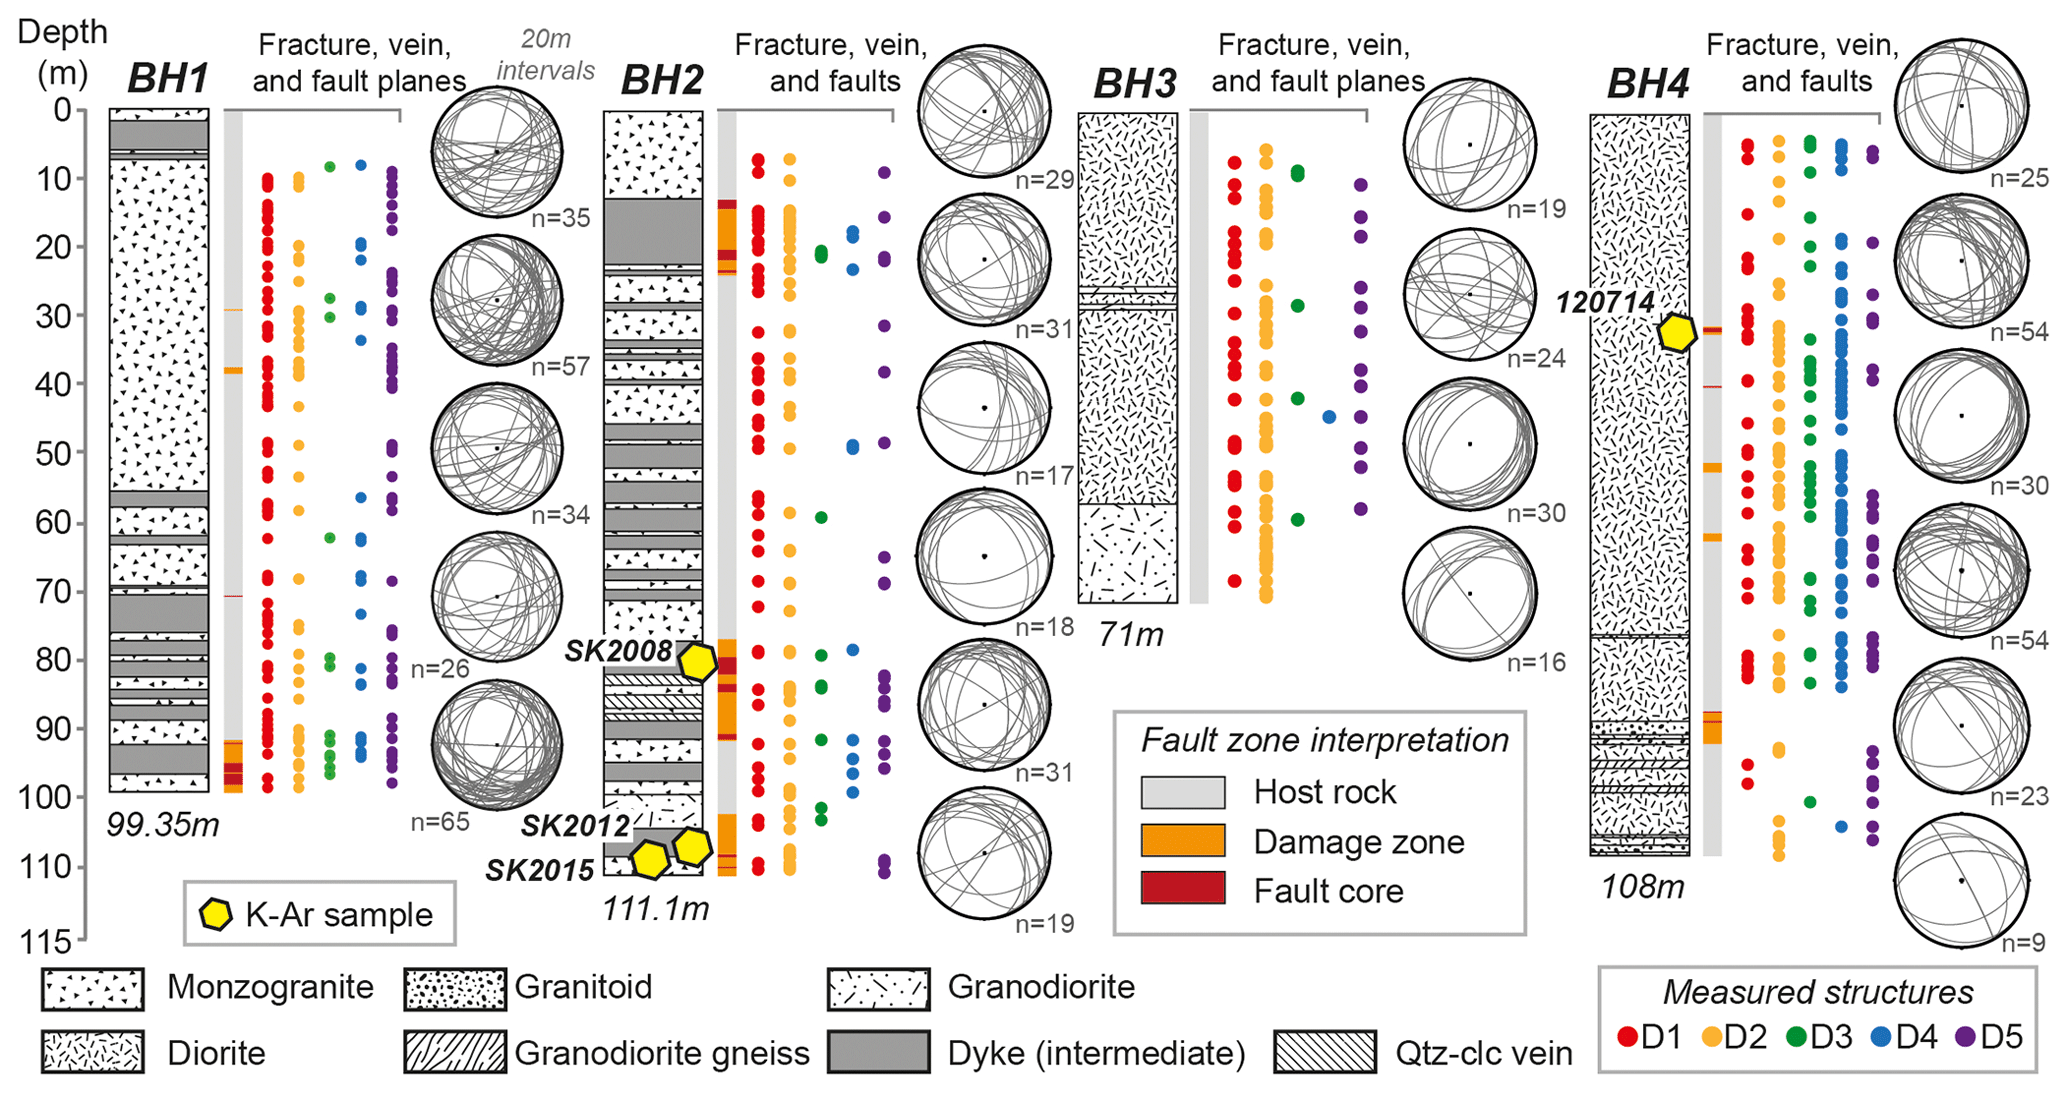
Figure 4Graphic logs showing both downhole lithology and fault zone interpretations for each of the four Smøla diamond drill holes. Measured structural data are shown distributed downhole, grouped by mineral assemblage (and deformation episode), with D1 for epidote–prehnite, D2 for sericite–chlorite–calcite, D3 for chlorite–hematite (± calcite), D4 for hematite–zeolite–calcite, and D5 for quartz–calcite. Measured structures are also represented plotted as planes on the adjacent stereonets. Each stereonet represents at least 20 m of drill core and corresponds to the downhole depths of the drill holes.
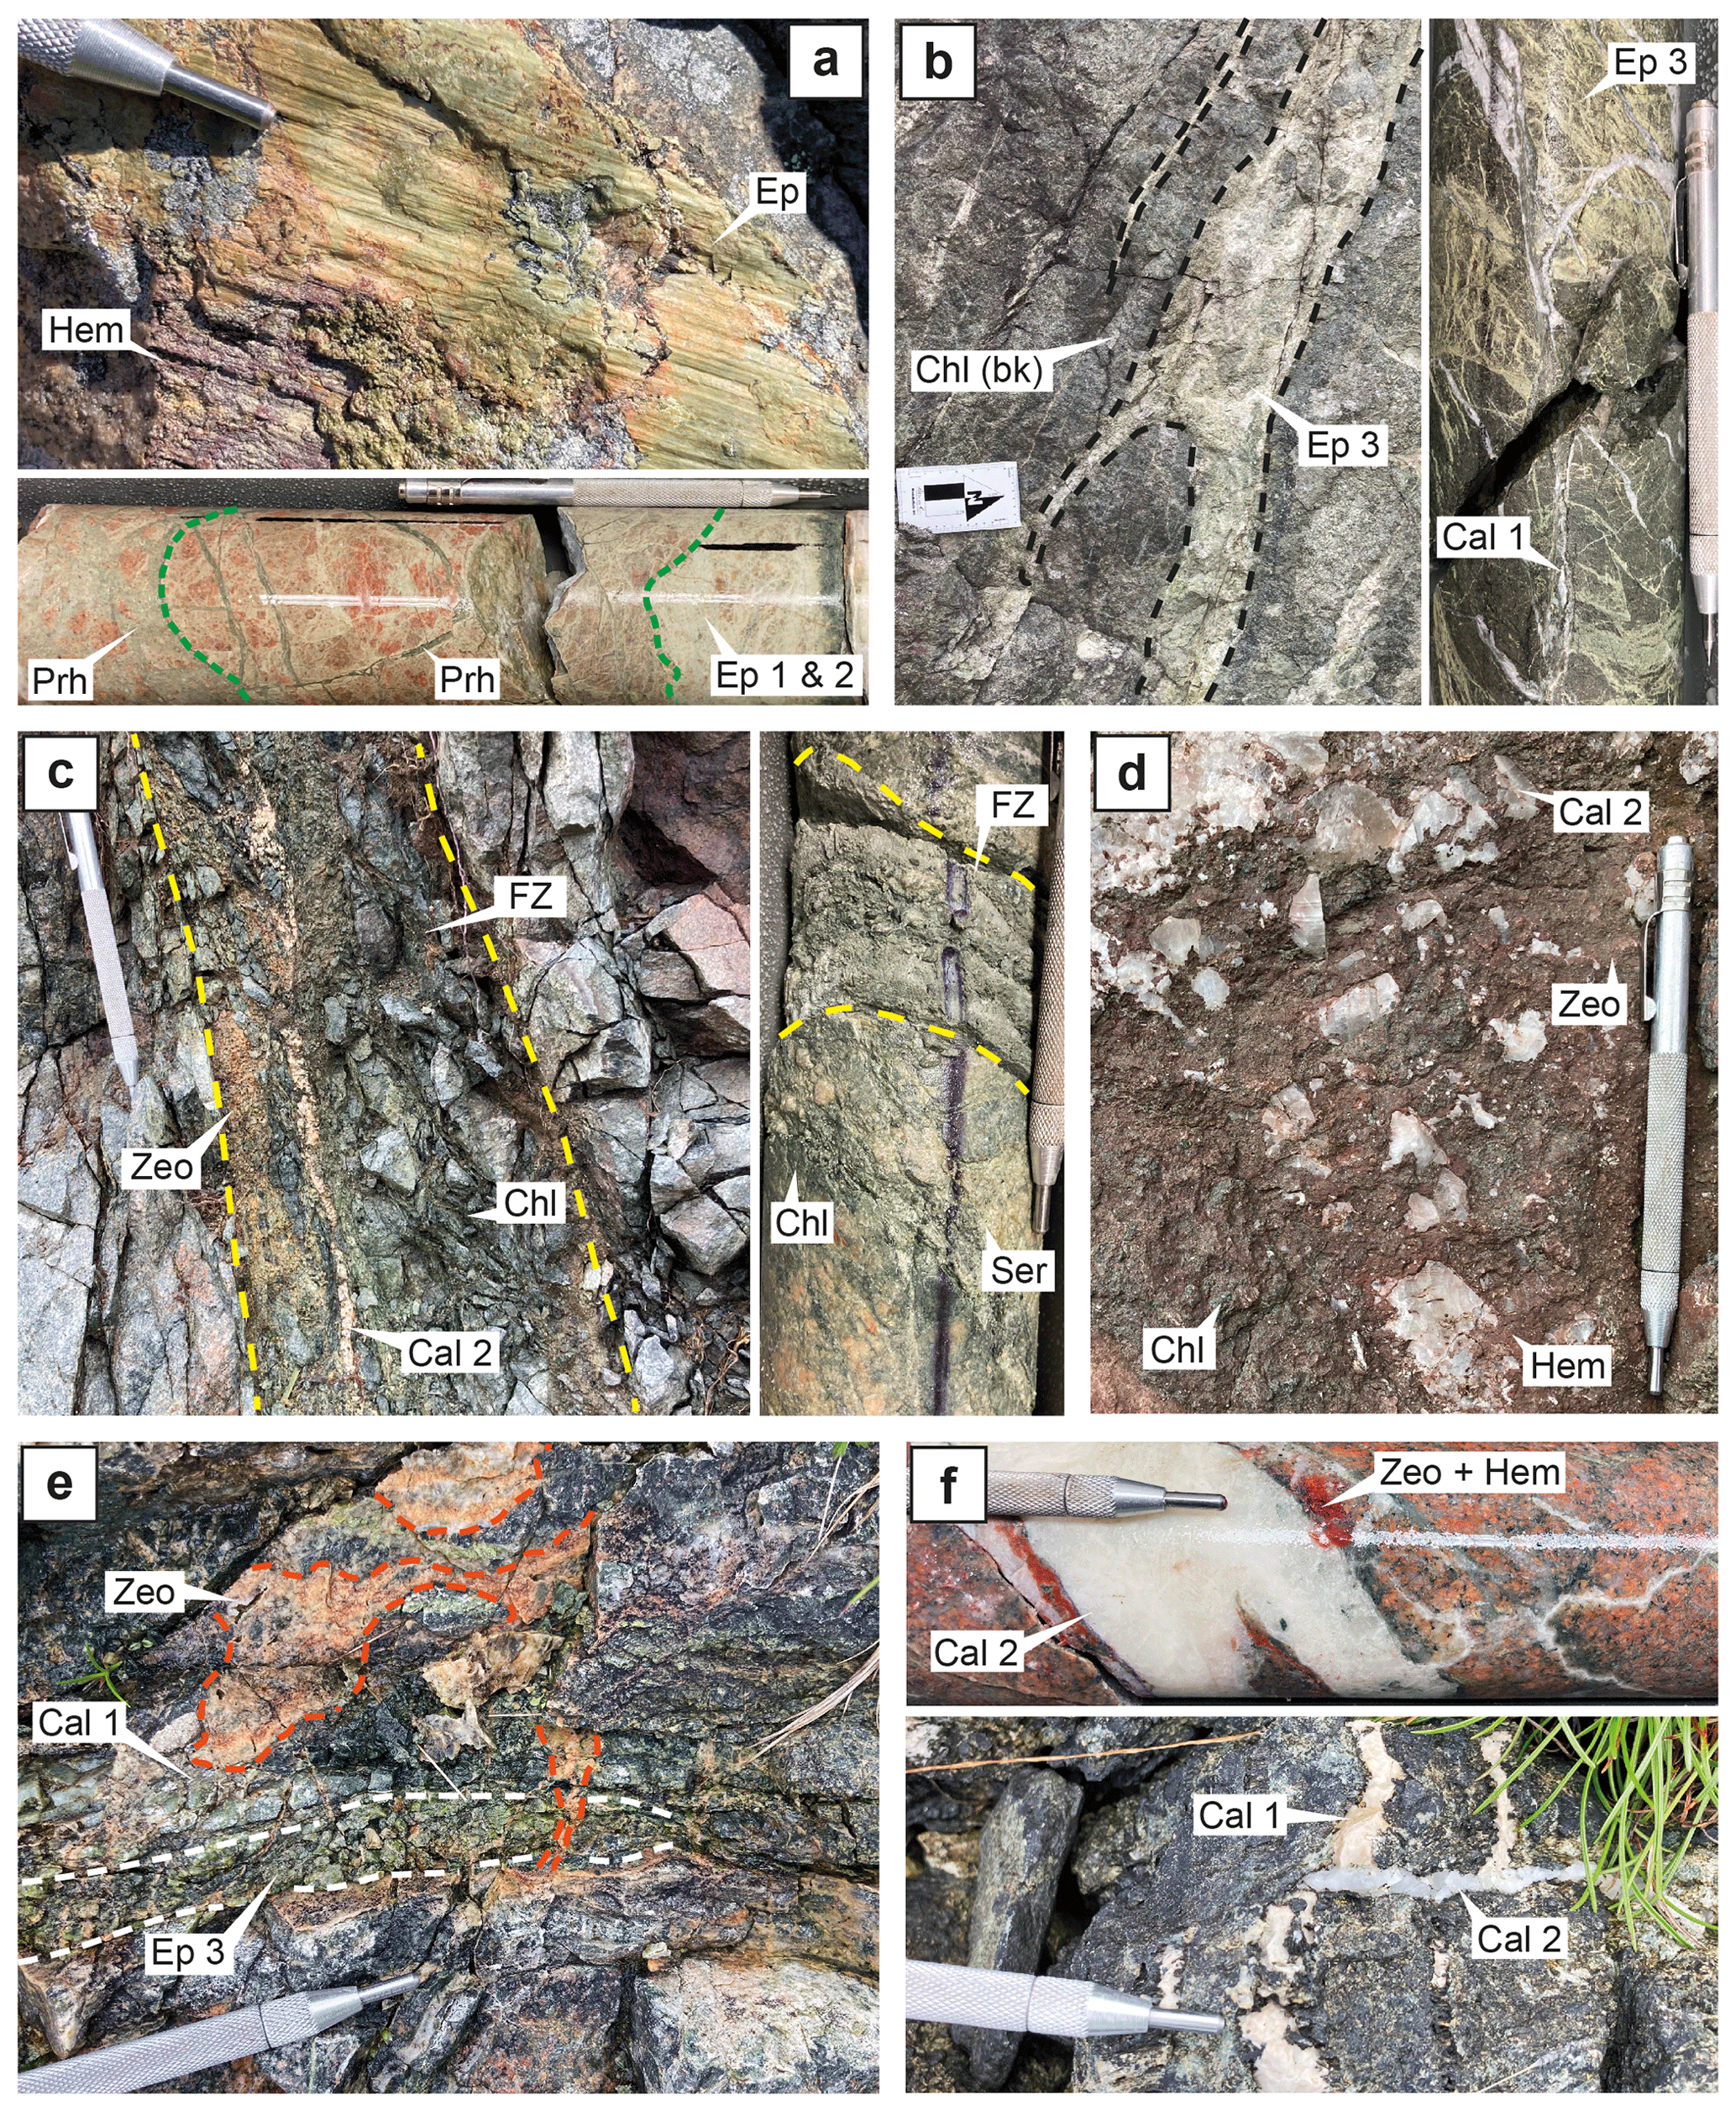
Figure 5Representative examples of mesoscale deformation features on Smøla. (a) Epidote slickenside surface (combination of light green and grass green epidote) and light green epidote (Ep 1 and 2) veins and cataclasite being crosscut by prehnite (Prh) vein breccia in BH1. (b) Bifurcating diffuse veins of grass green epidote (Ep 3) with black chlorite (Chl (bk)); core-hosted abundant grass green epidote veins are crosscut by early calcite veins (Cal 1). (c) Chloritic (Chl) fault zone (± sericitic) with later zeolite (Zeo) and calcite vein (Cal 2). The zone is highly fractured, and the friable gouge (left side of the zone) represents a fault core; a similar narrow fault zone is seen in BH2, with strong foliation and abundant sericite (Ser) infill. (d) Chlorite (Chl)–hematite (hem) cataclasite veneer on a fault surface with a later zeolite overprint and late quartz (Qtz)–calcite (Cal 2) infill. (e) Zeolite (Zeo) veins crosscutting early calcite (Cal 1) and epidote (Ep 3) veins. (f) Deformed early calcite veins (pale brown coloured) (Cal 1) being crosscut by translucent white late quartz–calcite vein (Cal 2). (a–f) Scratch pen for scale at 13 cm. (b) Scale bar arrow is 10 cm.
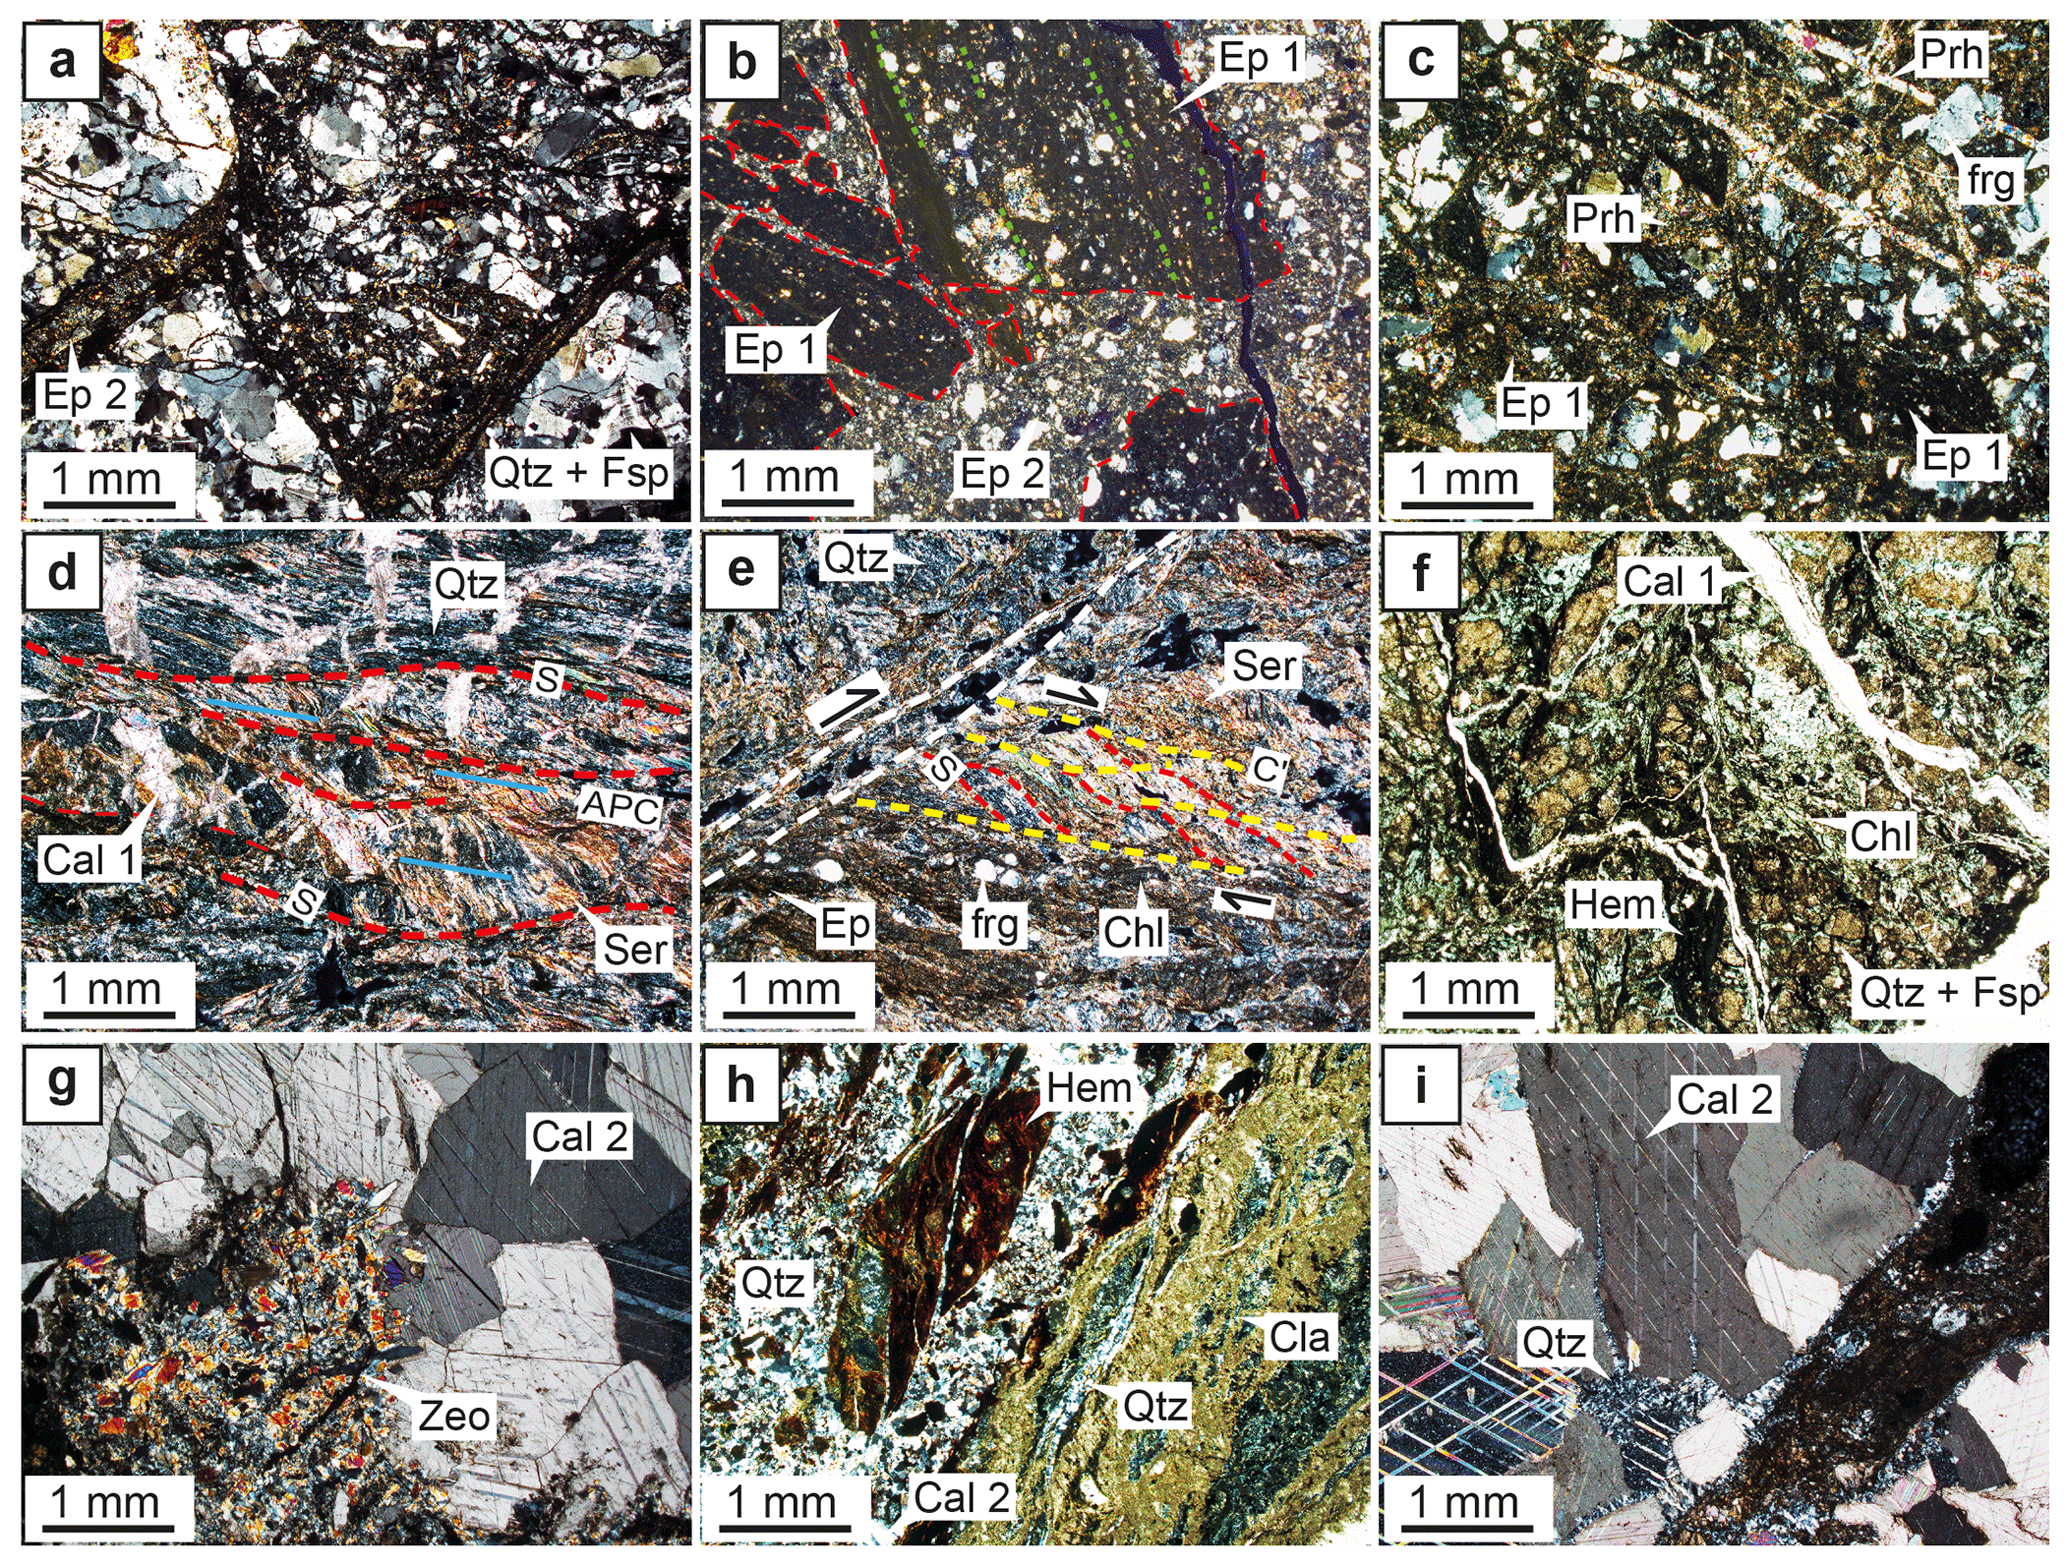
Figure 6Photomicrographs outlining the progressive deformation episodes affecting Smøla over time. (a) An Ep 2 vein and cataclasite reworking host rock monzogranite. (b) Two generations of light green epidote cataclasites and earlier ultracataclasite (Ep 1) fragments, almost isotropic, banded to foliated (dashed green lines highlighting the foliation) and set within a later cataclasite (Ep 2). (c) Prehnite (Prh) hydraulic breccia and veins reworking Ep 1 cataclasite/veins and host rock fragments (frg). (d) Asymmetric folds in a sericitic fabric and early calcite veins. Associated with the folds is a rootless axial planar cleavage that has formed (blue lines), along which a later foliation (red lines). (e) Possible extensional crenulation cleavage (ECC) fabric reworking the fabric in panel (d), forming in a sericite–chlorite shear zone. C′ planes (yellow lines), associated with chlorite, have formed inclined to a main shear surface (white line) and are reworking and back-rotating the cleavage-related foliation (from d), forming S surfaces. Reworked host rock fragments are also present and associated with the C′ planes and chlorite. (f) Chlorite–hematite breccia to gouge with deformed early calcite veins (Cal 1) and highly altered host rock minerals (feldspars). (g) Zeolite–calcite (± interstitial hematite in the zeolite) relatively undeformed vein, with the zeolite crystals having subhedral to euhedral crystal faces within the calcite. (h) Hematite-indurated gouge reworked by a later quartz–calcite vein. Abundant clays are adjacent to the vein. (i) Late quartz–calcite vein (Cal 2), exhibiting calcite twinning (low deformation overall). All photomicrographs are 2.5× XPL (cross-polarised light), except for panel (f), which is PPL (plane-polarised light).
We now systematically describe the progressive deformation and mineralisation types, starting from the apparent earliest to the latest features. As part of the structural characterisation, we have included both the field and drill hole structural data (Fig. 3). However, the drill hole data were localised in specific parts of the island and biased towards including shallowly dipping features (e.g. Terzaghi, 1965). Therefore, field data primarily inform the structural descriptions, as they illustrate typical geometries and kinematics across Smøla.
4.2.1 D1: epidote–prehnite-stable faulting and veining
The earliest recognised brittle deformation features on Smøla are epidote and prehnite veins, hydraulic breccias, and cataclasites involving at least three different generations of epidote (Ep 1, 2, and 3 in Fig. 5a and b). Field data reveal two clusters of the shear fractures and veins: one striking ENE–WSW with steep SSE dips and the other NW–SE with steep NE dips. Major structures associated with fault rocks (large red circles in the “All planes” plots in Fig. 3) primarily strike ENE–WSW with steep SSE dips. Slip lineations show varied orientations but have moderate to shallow plunges trending E or W. Kinematically, most structures with slip-trend information exhibit a strike- to oblique-slip motion predominantly oriented E–W. Overall, the data suggest a sinistral strike-slip regime with NNE–SSW contraction and WNW–ESE extension. Drill data also exhibit similar strike orientations, with an additional NW–SE trend dipping shallowly NE. Kinematically, shear features are mostly normal, dipping moderately to shallowly NE and indicating a mean NE–SW extension direction.
The epidote mineralisation consists of early pale/light green–yellow (Ep 1 and 2) or a later grass green type (Ep 3). Early epidote typically infills tensile or shear veins with well-developed slickenside surfaces on the vein–host rock interfaces or internally on crack–seal surfaces (Fig. 5a). In contrast, later grass green epidote occurs as the infill of irregular bifurcating to anatomising veins (Fig. 5b), which in places crosscut and rework the early epidote. All three types crosscut host rock lithological features, such as aplitic veins.
Prehnite veins, significantly less common than epidote veins, occur in drill holes BH1 and BH2 together with epidote. Prehnite, typically pale grey–green, infills veins and can form dense networks grading to dilatant hydraulic breccias (Fig. 5a, drill core). In the case of the hydraulic breccias, included fragments are either host rock fragments of polycrystalline aggregates of quartz–feldspar or reworked epidote cataclasites/veins (in places with host rock fragments with included veins; Fig. 6c).
The earlier epidote locally forms the matrix mineral of at least two generations of cataclasite to ultracataclasite, which are associated with the major structures in Fig. 3. The earliest epidote cataclasite to ultracataclasite (Ep 1) is typically preserved as isolated fragments (1–5 mm in size), which possibly originated as thin discrete pockets with a weak to distinct and foliated to banded matrix dominated by very fine-grained epidote and clay (forming up to 75 %–90 % of the pockets). The included clasts are fine-grained (average size < 60 µm), poorly sorted, and subangular and are typically mono- to polycrystalline aggregates of quartz–feldspar host rock (Fig. 6a and b). The later epidote cataclasite (Ep 2) occurs as localised zones (typically <10 cm in width), with a massive matrix (making up 60 %–70 % of the zones) formed by fine-grained epidote and clay (Fig. 6b). The included fragments are very fine- to coarse-grained (10 µm–6 mm), poorly sorted, angular- to subangular, and polycrystalline fragments of host rock (quartz–feldspar) or reworked fragments of the earlier epidote ultracataclasite. The included Ep 1 and host rock fragments within the Ep 2 cataclasite exhibit a minor offset and rotation from each other, suggesting that there was limited to no rigid-body rotation and mechanical comminution of the fragments.
Rarely, prehnite ultra-cataclasites occur as discrete zones 3–5 cm in width, striking NNW–SSE and NW–SE, with shallow to moderate dips (30–65°) (Fig. 3; drill data). Prehnite comprising >90 % of the matrix of these zones is very fine-grained with interspersed clay. The included clasts are fine-grained (<50 µm–1 mm), moderately sorted, subrounded to angular, and made up of mono- to polycrystalline fragments of host rock and epidote cataclasite. The prehnite ultracataclasites are associated with the epidote cataclasites, with both the cataclasites mutually reworking one another.
4.2.2 D2: repeated sericite–chlorite–calcite faulting
D2 sericite–chlorite–calcite shear features (Fig. 5e) invariably rework D1 structures. These structures occur as single-shear fractures or dense networks and local brittle–ductile shear zones.
Field data reveal three main trends of the shear fracture orientations (Fig. 3): E–W- to ENE–WSW-striking and steeply to moderately S-dipping; NE–SW-striking and moderately SE-dipping; and NNW–SSE-striking and steeply E-dipping. Slip lineations mostly plunge steeply, indicating dip-slip kinematics, with shallower trends toward W or SE. Kinematically, most shear features exhibit a normal or oblique–normal shear sense, striking E–W or NE–SW. Some N–S-striking and steeply E-dipping reverse faults are also observed. Sinistral and dextral strike- to oblique-slip features strike E–W, dipping moderately N or S. Overall, these features indicate an extensional regime with a mean NW–SE extension direction. Drill data show predominantly NW–SE-striking and shallowly NE-dipping fractures and veins. Major structures mostly dip shallowly SE, with steeper dipping features striking E–W. Kinematically, shear features are mostly reverse, dipping SE or NE, with some normal and strike-slip features.
The well-developed deformation zones with locally foliated gouge with highly fractured and disaggregating host rock clasts and early deformed calcite veins (Fig. 5c) are typically oriented the same as the first two shear fracture outcrop trends (Fig. 3). D2 structures, especially the well-developed deformation zones, are almost phyllitic at the microscale (Fig. 6d and e), locally involving fine- to medium-grained sericite/muscovite (30 %–40 %), chlorite (30 %), and clay (>5 %) with elongated domains of fine-grained recrystallised quartz (>20 %; the matrix forms ∼80 % of the total volume). The host rock clasts within this groundmass are 20 µm–1 cm monocrystalline quartz fragments or polycrystalline aggregates of subrounded quartz and altered feldspar.
Microstructural relationships indicate at least two distinct deformation events: an early event with localised shearing along axial planar cleavages in an early folded sericite groundmass with calcite veins (Fig. 6d) and a subsequent event reworking and rotating the earlier axial planar cleavage shear planes (S surfaces) by later C′ planes. This resulted in the development of an extensional crenulation cleavage (ECC)-type fabric (Fig. 6e) (e.g. Passchier and Trouw, 2005). These ECC zones also rework D1 epidote cataclasite and fragmented host rock. The host rock fragments locally form σ porphyroclasts with very fine-grained quartz in the strain shadows, and the sericite–chlorite groundmass (and very fine-grained clay) is deflected around them.
4.2.3 D3: chlorite–hematite-decorated fault rocks and shear fractures
The D3 chlorite–hematite structures (Fig. 5d), involve the brown–red staining or “dusting” of hematite and chlorite decorating and infilling these structures. D3 structures occur as individual anastomosing shear fractures, which locally have hematite slickensides, grading to networks, and breccias and gouges (and possible cataclasites).
Field data show four trends of these shear fractures: NE–SW-striking and steeply SE-dipping, N–S-striking and sub-vertical to steeply W-dipping, NE–SW-striking and shallowly SE-dipping; and WNW–ESE-striking and steeply SSW-dipping. Tensile veins mostly strike ENE–WSW and dip moderately to steeply SSE. Major D3 structures (with breccia and gouge) are sub-parallel to these trends. Slip lineations vary, with steep dip-slip predominating and shallower strike-slip orientations trending NE, W, and SW. Kinematically, shear features are mainly normal to oblique–normal, striking NNE–SSW, with shallow S-dipping thrusts and vertical N–S-striking reverse faults. Sinistral strike-slip features strike ∼ ENE–WSW, with occasional dextral features striking NE–SW. These features suggest associated WNW–ESE to NW–SE extension. Shear fractures and veins from drill data primarily strike ENE–WSW and dip shallowly SE. Major drill core structures have shallow dipping geometries that are either S or NW. Shear features are predominantly dip-slip and reverse, dipping either ∼ E or NW, with some dextral features striking E–W to NE–SW. Overall, these structures suggest a mean NW–SE contraction.
The chlorite–hematite breccias to gouges, typically diffuse zones (up to ∼3 m thick), exhibit abundant D3 fractures that form damage zones around them. The gouges are indurated and are moderately to well-consolidated features in the hand specimen (Fig. 5d). These features at the microscale are cemented by chlorite (40 %), hematite (30 %–50 %), and clay (10 %–20 %), with the matrix forming 5 %–20 % of the overall zones (rarely up to 60 %; Fig. 6f). The chlorite grains, either from overprinting or as growths between the fragmented host rock (and host rock clasts), form elongate grains in places. The hematite cement is dark red–brown to opaque in plane-polarised light (PPL), with the staining/dusting occurring as very fine-grained particles within fractures/matrix and overprinting the host rock. The host rock clasts themselves are typically medium- to coarse-grained in size (2 mm–1 cm), moderately to poorly sorted, clast-supported, and comprised by altered quartz–feldspar (feldspar is partially altered to sericite) polycrystalline fragments. Elsewhere, the D3 structures are associated with thin pockets of hematite-rich foliated to banded cataclasite/indurated gouge (<2 cm in thickness; Fig. 6h), with a very fine-grained matrix (up to 80 % of the zone) comprised of hematite (80 %), clay (15 %), and chlorite (5 %), with incorporated fine-grained (20–600 µm), poorly sorted, and subrounded host rock clasts.
4.2.4 D4: hematite–zeolite–calcite veining
The D4 hematite–zeolite–calcite structures, mostly tensile veins (0.1–6 mm in thickness) (Fig. 5e and f), crosscut the earlier epidote, sericite–chlorite–calcite (Cal 1), and chlorite–hematite structures. D4 veins are pervasive across Smøla (Fig. 5e and f; drill core), along with rare examples of hydraulic breccias and shear fractures with slickenside surfaces.
Field data indicate that the tensile veins strike ∼ ENE–WSW, dipping steeply SE or NW. Shear fractures primarily strike NNE–SSW to NE–SW with moderate to steep ESE dips. The D4 major structures (breccias and gouges) strike WNW–ESE, steeply dipping SSW. Slip lineations typically plunge steeply, showing dominant dip-slip, with subordinate shallower strike-slip lineation orientations ∼ NE/SW. Kinematically, features are mainly normal shear sense, striking NE–SW, with minor sinistral strike-slip (NNE–SSW strike) and rare dextral strike-slip (ENE–WSW strike) features, possibly representing conjugate features. This suggests NW–SE extension with NE–SW contraction. The drill data indicate shallow NE-dipping fractures and veins, with major structures striking NW–SE or NE–SW (steeper dipping). Kinematically, these features are mostly moderately dipping oblique- to strike-slip, with sinistral features dipping NE and dextral features dipping SW. Subordinate normal features dip moderately to steeply SSW or ENE. Overall, this indicates a mean ∼ NNE–SSW extension direction.
Along with zeolite, hematite typically occurs as a bright red type (different from the D3-related hematite), along with a later less deformed type of calcite (Cal 2) (Fig. 7). In the outcrop and drill core, D4 structures are associated with coarse-grained “sugary” masses of zeolite–calcite, locally mineralising over pre-existing veins of epidote or chlorite–hematite (Fig. 5e). At the microscale, the D4 veins consist of zeolite (laumontite) occurring as fine- to medium-grained, decussate, and subhedral prismatic crystals in places with interstitial Fe staining. Locally, where zeolite crystals have intergrown with late calcite, they form bounding comb-type textures with euhedral crystal morphologies (Fig. 6g). Additionally, radial masses of zeolite occur as grain boundary growths within the calcite portions of the veins, indicating the coeval mineralisation of both minerals. The zeolite, hematite, and late calcite (Cal 2) components in these veins show little to no significant post-crystallisation deformation, implying the D4 veins are indeed relatively late.
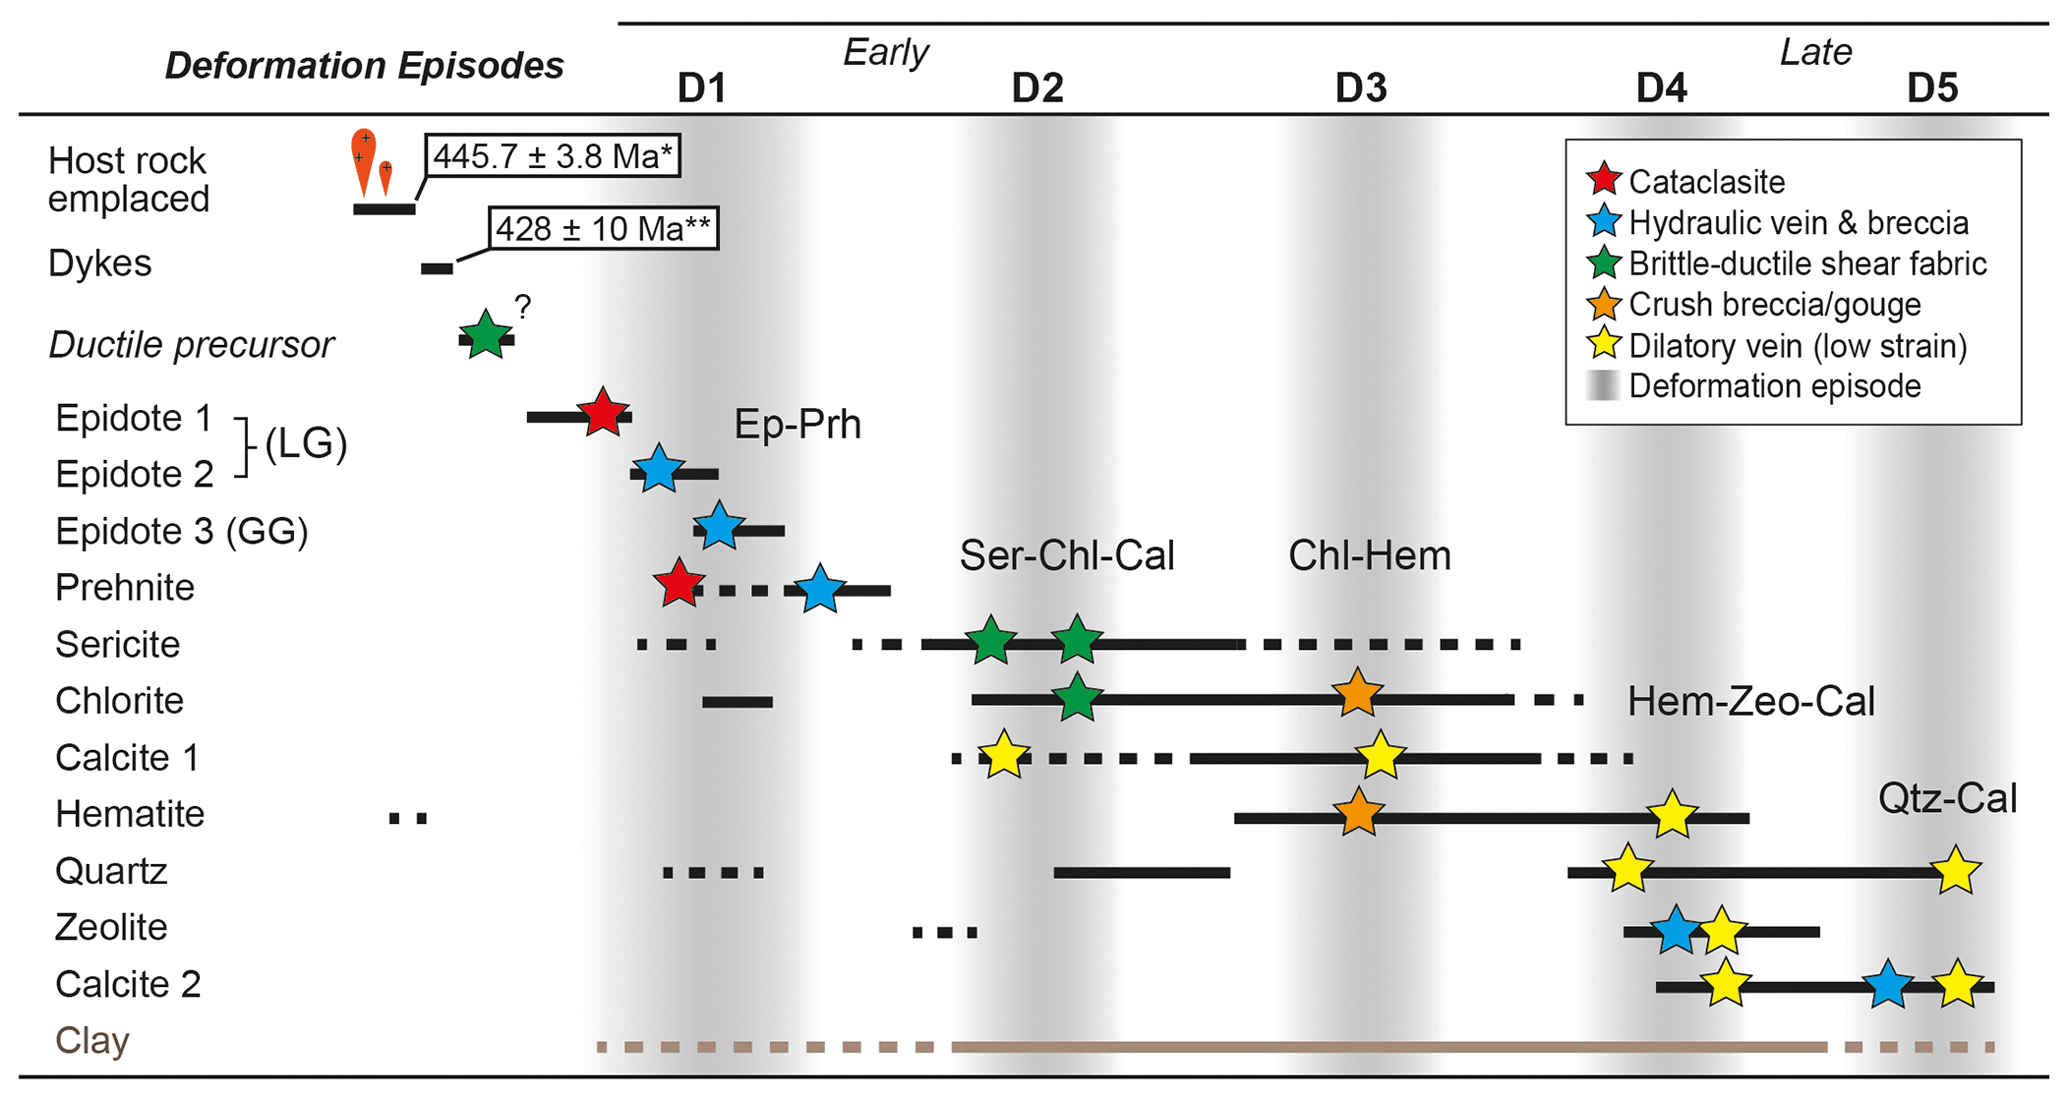
Figure 7Chronological table showing the relative mineralisation times of different mineral types. The key deformation features associated with each mineral type are shown in relative chronology, with the clustering of mineralisation and deformation features grouped into five main deformation episodes. These episodes are associated with specific mineral assemblages. Mineral types are as follows: Ep is for epidote (LG is for light green; GG is for grass green), Prh is for prehnite, Ser is for sericite, Chl is for chlorite, Cal is for calcite, Hem is for hematite, Zeo is for zeolite, and Qtz is for quartz. * Host rock age provided by Tucker et al. (2004). Age of dyke emplacement by Gautneb (1988).
4.2.5 D5: quartz–calcite veining
The D5 quartz–calcite veins, involving the late calcite variety (Cal 2) and mineralised quartz, rework and offset all other deformation features (D1 to D4) (Fig. 7).
The shear fractures and veins in outcrop strike NE–SW, dipping steeply SE or moderately NW. Major structures strike the same but dip more moderately SE. Slip lineations are mainly dip-slip, plunging steeply, with shallow strike-slip lineation orientations toward NNE and ENE. Kinematically, the features have predominantly normal shear sense and NE–SW-striking. The sinistral and dextral strike-slip planes, possibly conjugates, are oriented similarly to the normal features. Overall, the geometries and kinematics indicate a mean ∼ E–W extension orientation. In the drill core, fractures and veins show a dominant NW–SE strike, shallowly dipping NE. Similarly, tensile veins strike NW–SE but with shallow to steep NE or SW dips. Major structures are sub-parallel to the fracture trends. Kinematically, most features are shallowly NNE-/SSW-dipping, WNW–ESE- to NW–SE-striking normal dip-slip features, indicating a mean NNW–SSE/N–S extensional direction.
The D5 quartz–calcite veins, in the outcrop or drill core, are translucent to opaque white, exhibit crack–seal layering parallel to the vein–host boundary, and are planar to bifurcating features (Fig. 5f). The veins occur as singular narrow to wide veins (0.1 mm–22 cm) or complex vein networks and, in places, hydraulic breccias with included angular fragments of the host rock. Commonly, these late veins are within and sub-parallel to existing deformation features, such as sericite–chlorite deformation zones, and may represent a later tensile reactivation of these features (exploiting mechanically weak planes) (Fig. 5d). The late quartz–calcite veins crosscut the earlier calcite veins (Cal 1; Fig. 5f), which are less quartz-rich, relatively massive, more opaque white, and possess deformed non-planar morphologies to disaggregated irregular domains (for example, in D2).
At the microscale, D5 veins exhibit medium- to coarse-grained calcite crystals, typically anhedral, with distinct cleavage or show fine-grained rims on the quartz grains and between adjacent calcite grains (Fig. 6i). In places, coarser-grained quartz form comb-type textures with euhedral crystal terminations into the larger calcite crystals. Commonly, quartz and calcite also mineralise as vein border–parallel alternating bands, indicating multiple crack–seal mineralisations. Finally, while these veins exhibit minimal post-mineralisation deformation (like D4), the calcite in the veins is twinned, suggesting some later strain.
4.3 Basement deformation in 3D
The four oriented drill holes (Fig. 4, with locations shown in Fig. 1b) provide a 3D view of Smøla's geology. Using Leapfrog Works (Seequent, 2022) 3D modelling software, we could delineate the hanging wall and footwall boundaries of deformation zones using logged downhole intersections and orientation data. Implicit volumes were then generated to reproduce the actual thickness, orientation, and extent of zones through 3D space. The modelling of different zones in one volume provides insights into the continuity and extent of the deformation zones, as well as potential fracture connectivity. Furthermore, by incorporating both relative (Fig. 7) and absolute deformation ages, the modelling also includes a temporal dimension.
In this study, we have specifically used drill holes BH1 and BH2 for the modelling. These drill holes are close enough together to allow confident correlations between the drill holes. These drill holes intersected deformation zones, veined intervals, and shear zones/fault cores (Fig. 4). Considering the geological and deformation characteristics of each of these zones, particularly the fault core intersections (assumed to have the greatest strike continuity) and the associated damage zones, we have correlated at least four zones between the drill holes. The correlations and modelling also used the orientations of bounding deformation features to resolve the geometries of these zones. Examples of modelled zones which are correlated between BH1 and BH2 (labelled I–IV in Fig. 8a) are the following:
- I.
BH1 (37.46–37.81 m) and BH2 (12.94–23.59 m) intersect a S-dipping and E–W-striking zone characterised by early D1 epidote veins and hydraulic breccia (Ep 2) crosscut by D2 chloritic/sericitic fractures and breccia and late D5 quartz–calcite veins (Cal 1 and Cal 2).
- II.
Both BH1 (70.6–70.77 m) and BH2 (79.39–81.78 m) intersect a NE–SW-striking and NW-dipping zone, which widens in BH2, involving early D1 epidote veins and later chlorite–hematite (D3) breccia, with stronger hematite mineralisation in BH2. The zone also features deformed early calcite veins (Cal 1).
- III.
A NE–SW-striking and shallowly S-dipping zone in both BH1 (92.03–96.33 m) and BH2 (83.33–84.51 m) characterised by a D1 epidote cataclasite reworked by chlorite and zeolite deformation features (host rock fragments are overprinted by zeolite). These cataclasites are also crosscut by D4 zeolite–calcite and late D5 quartz–calcite veins (dense vein network).
- IV.
More clearly intersected in BH2 (108.08–111.1 m) is a moderately to shallowly SW-dipping zone characterised by intensely sheared D2 sericite–chlorite gouge and phyllitic bands, with a broader damage zone of sericite and chlorite fractures, that is also intersected at the base of BH1 (96.57–99.24 m).
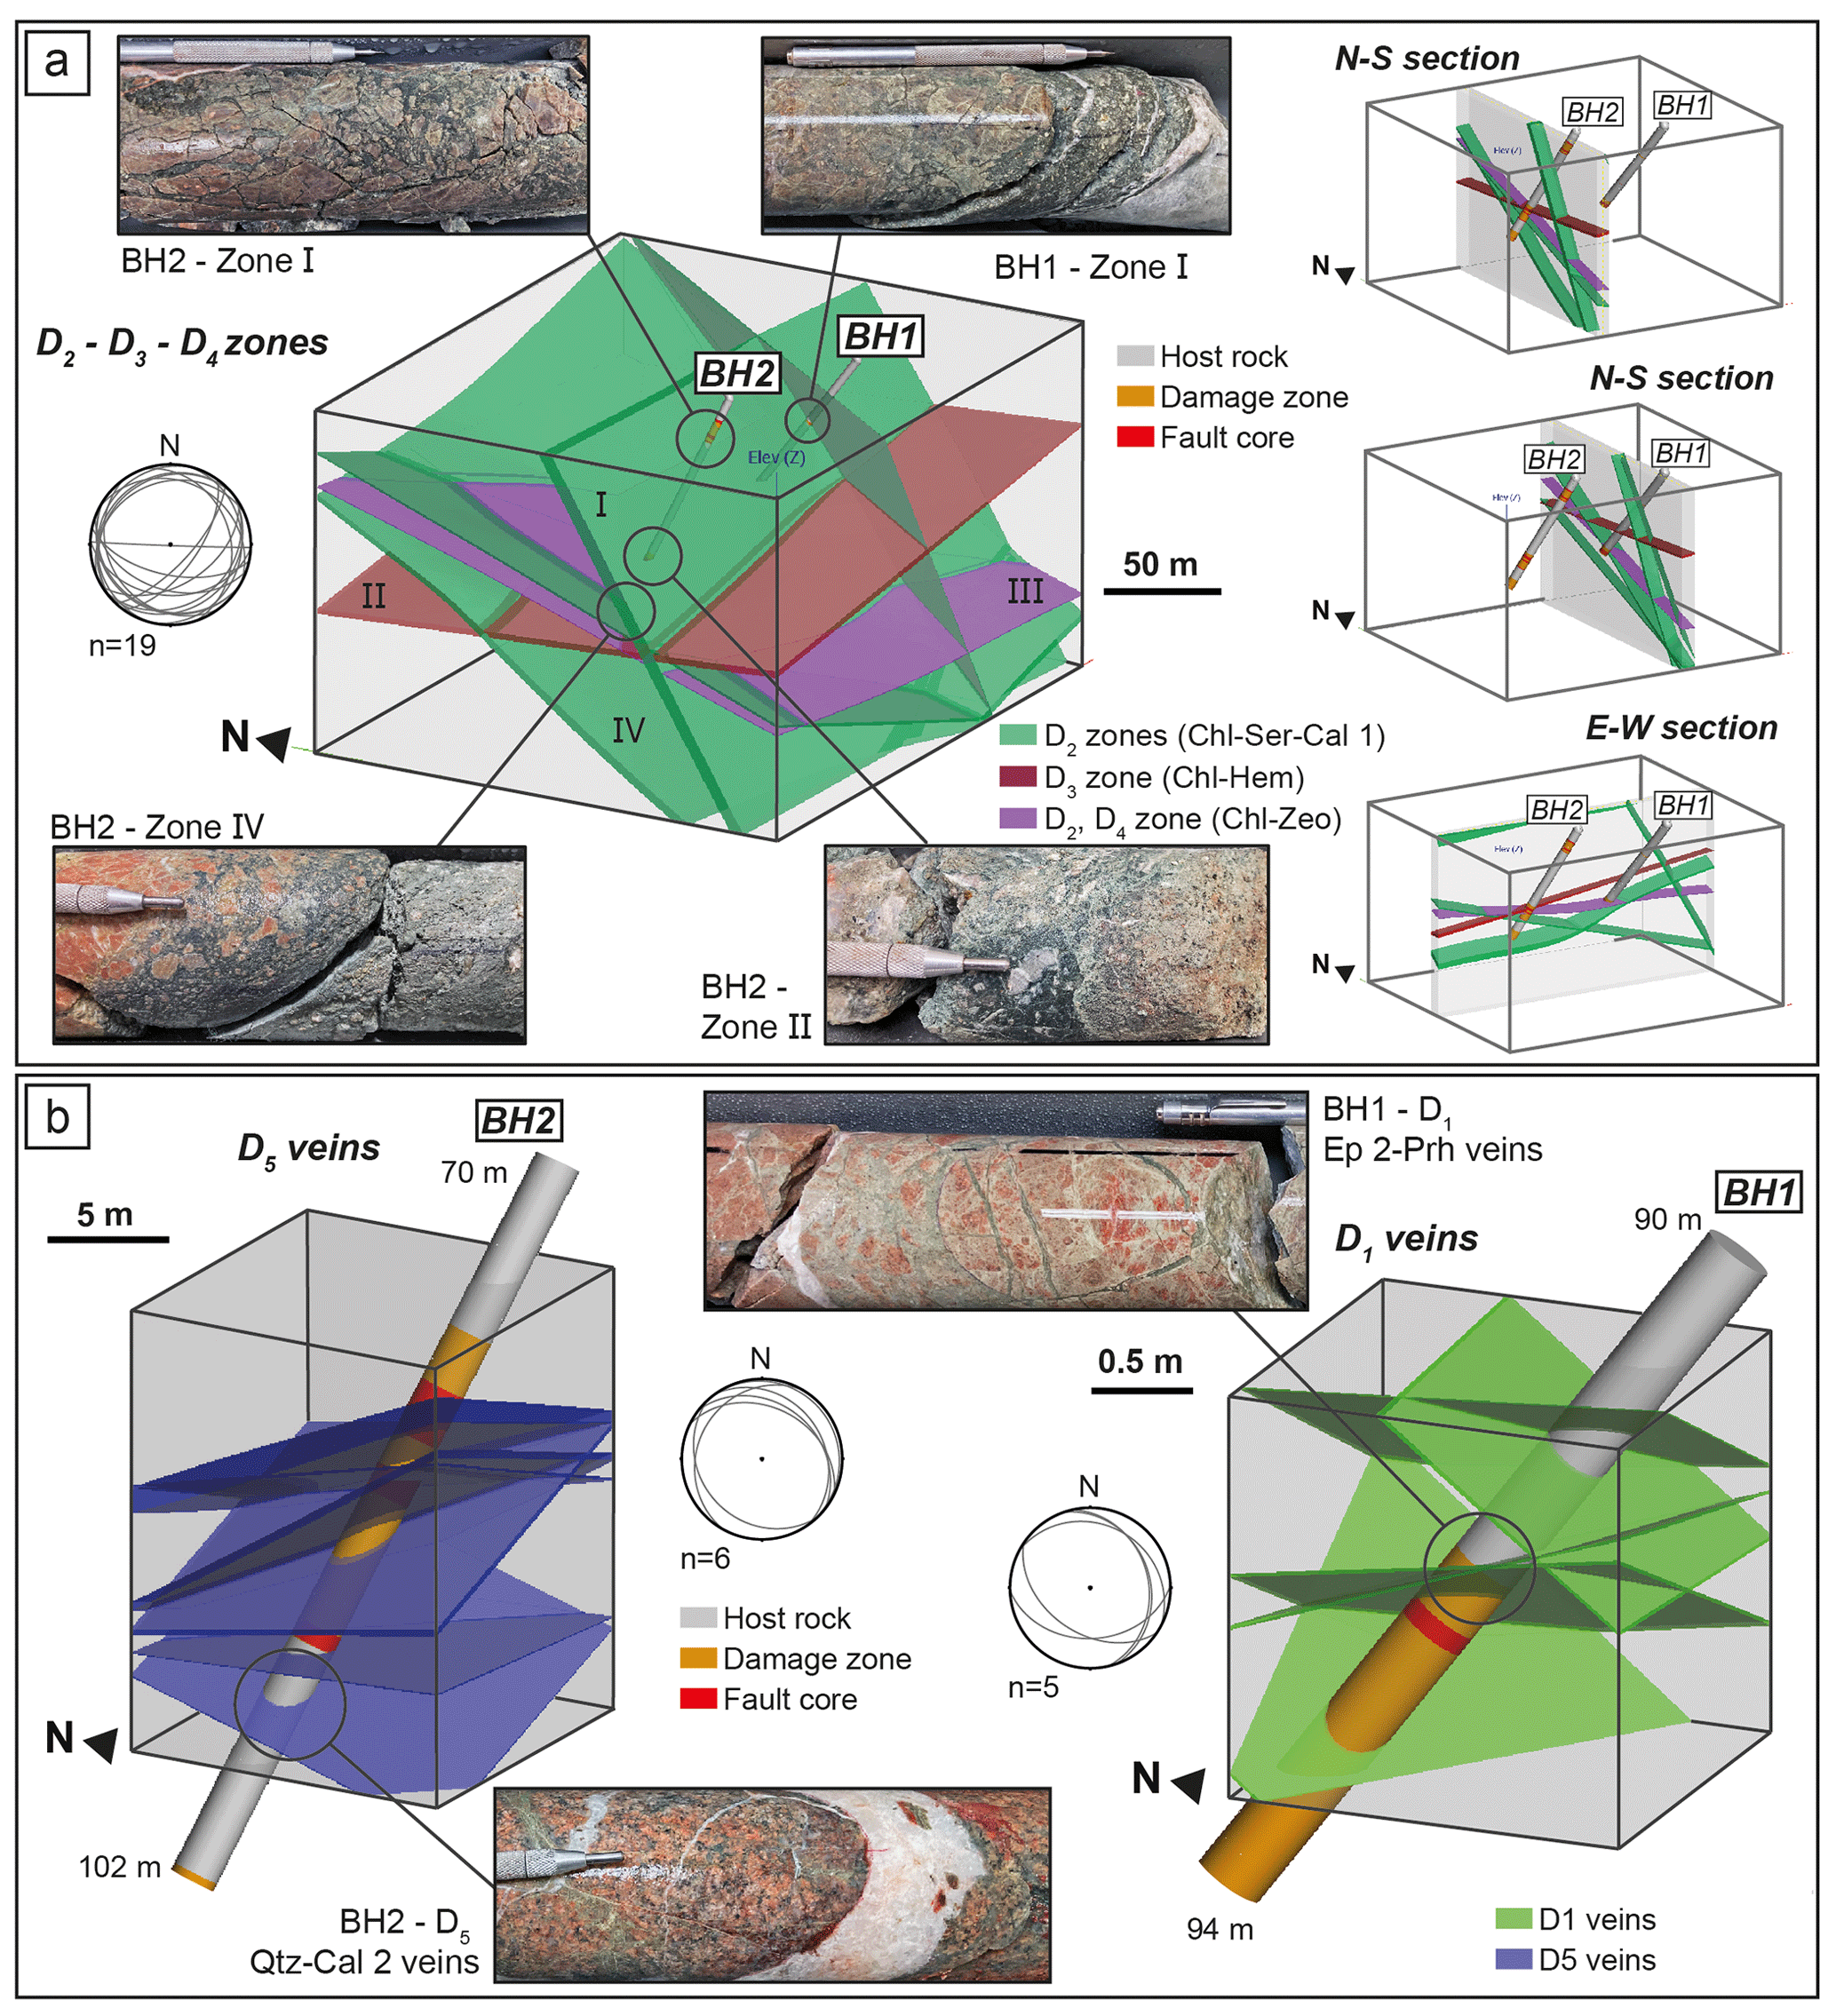
Figure 8(a) 3D model of major intersected brittle structures (green, red, and purple planar volumes) in drill holes BH1 and BH2. Modelling was completed in Leapfrog using bounding deformation features, such as shear fractures (plotted in included stereonet). Zones I to IV are representative of the deformation zones present in one or both the drill holes, and descriptions are included in the text. N–S and E–W cross sections are included to the right of the figure, with the N–S sections taken through each drill hole. (b) 3D models at different scales compared to panel (a), with both quartz–calcite (D5) and epidote–prehnite (D1) modelled from drill core structures (included in the associated stereonet plots).
The modelled zones crosscut each other, as assumed here with no offsets or lateral terminations. Their true thicknesses range from 1 to 6 m and exhibit some dip and thickness variation (as shown in the N–S and E–W sections in Fig. 8a). The zones display different orientation trends, with the D2-related zones moderately S to SE-dipping and D3-related zones shallowly W-dipping.
To explore Smøla's deformation features across scales, 3D models were created for selected intervals, such as D5 quartz–calcite veins in BH2 (∼10 m scale) or epidote–prehnite (D1) veins in BH1 (∼1 m scale) (Fig. 8b). These models, along with Fig. 8a (∼100 m scale), demonstrate the systematic to semi-systematic fracture arrays at various scales. Additionally, they illustrate differences in aperture widths and potential strike extents among structures associated with different deformation episodes; D2 structures, for example, typically have the widest apertures and longest strike extents, while D1 features exhibit the smallest apertures and the least lateral continuity on average but have the highest number of fractures per modelled volume.
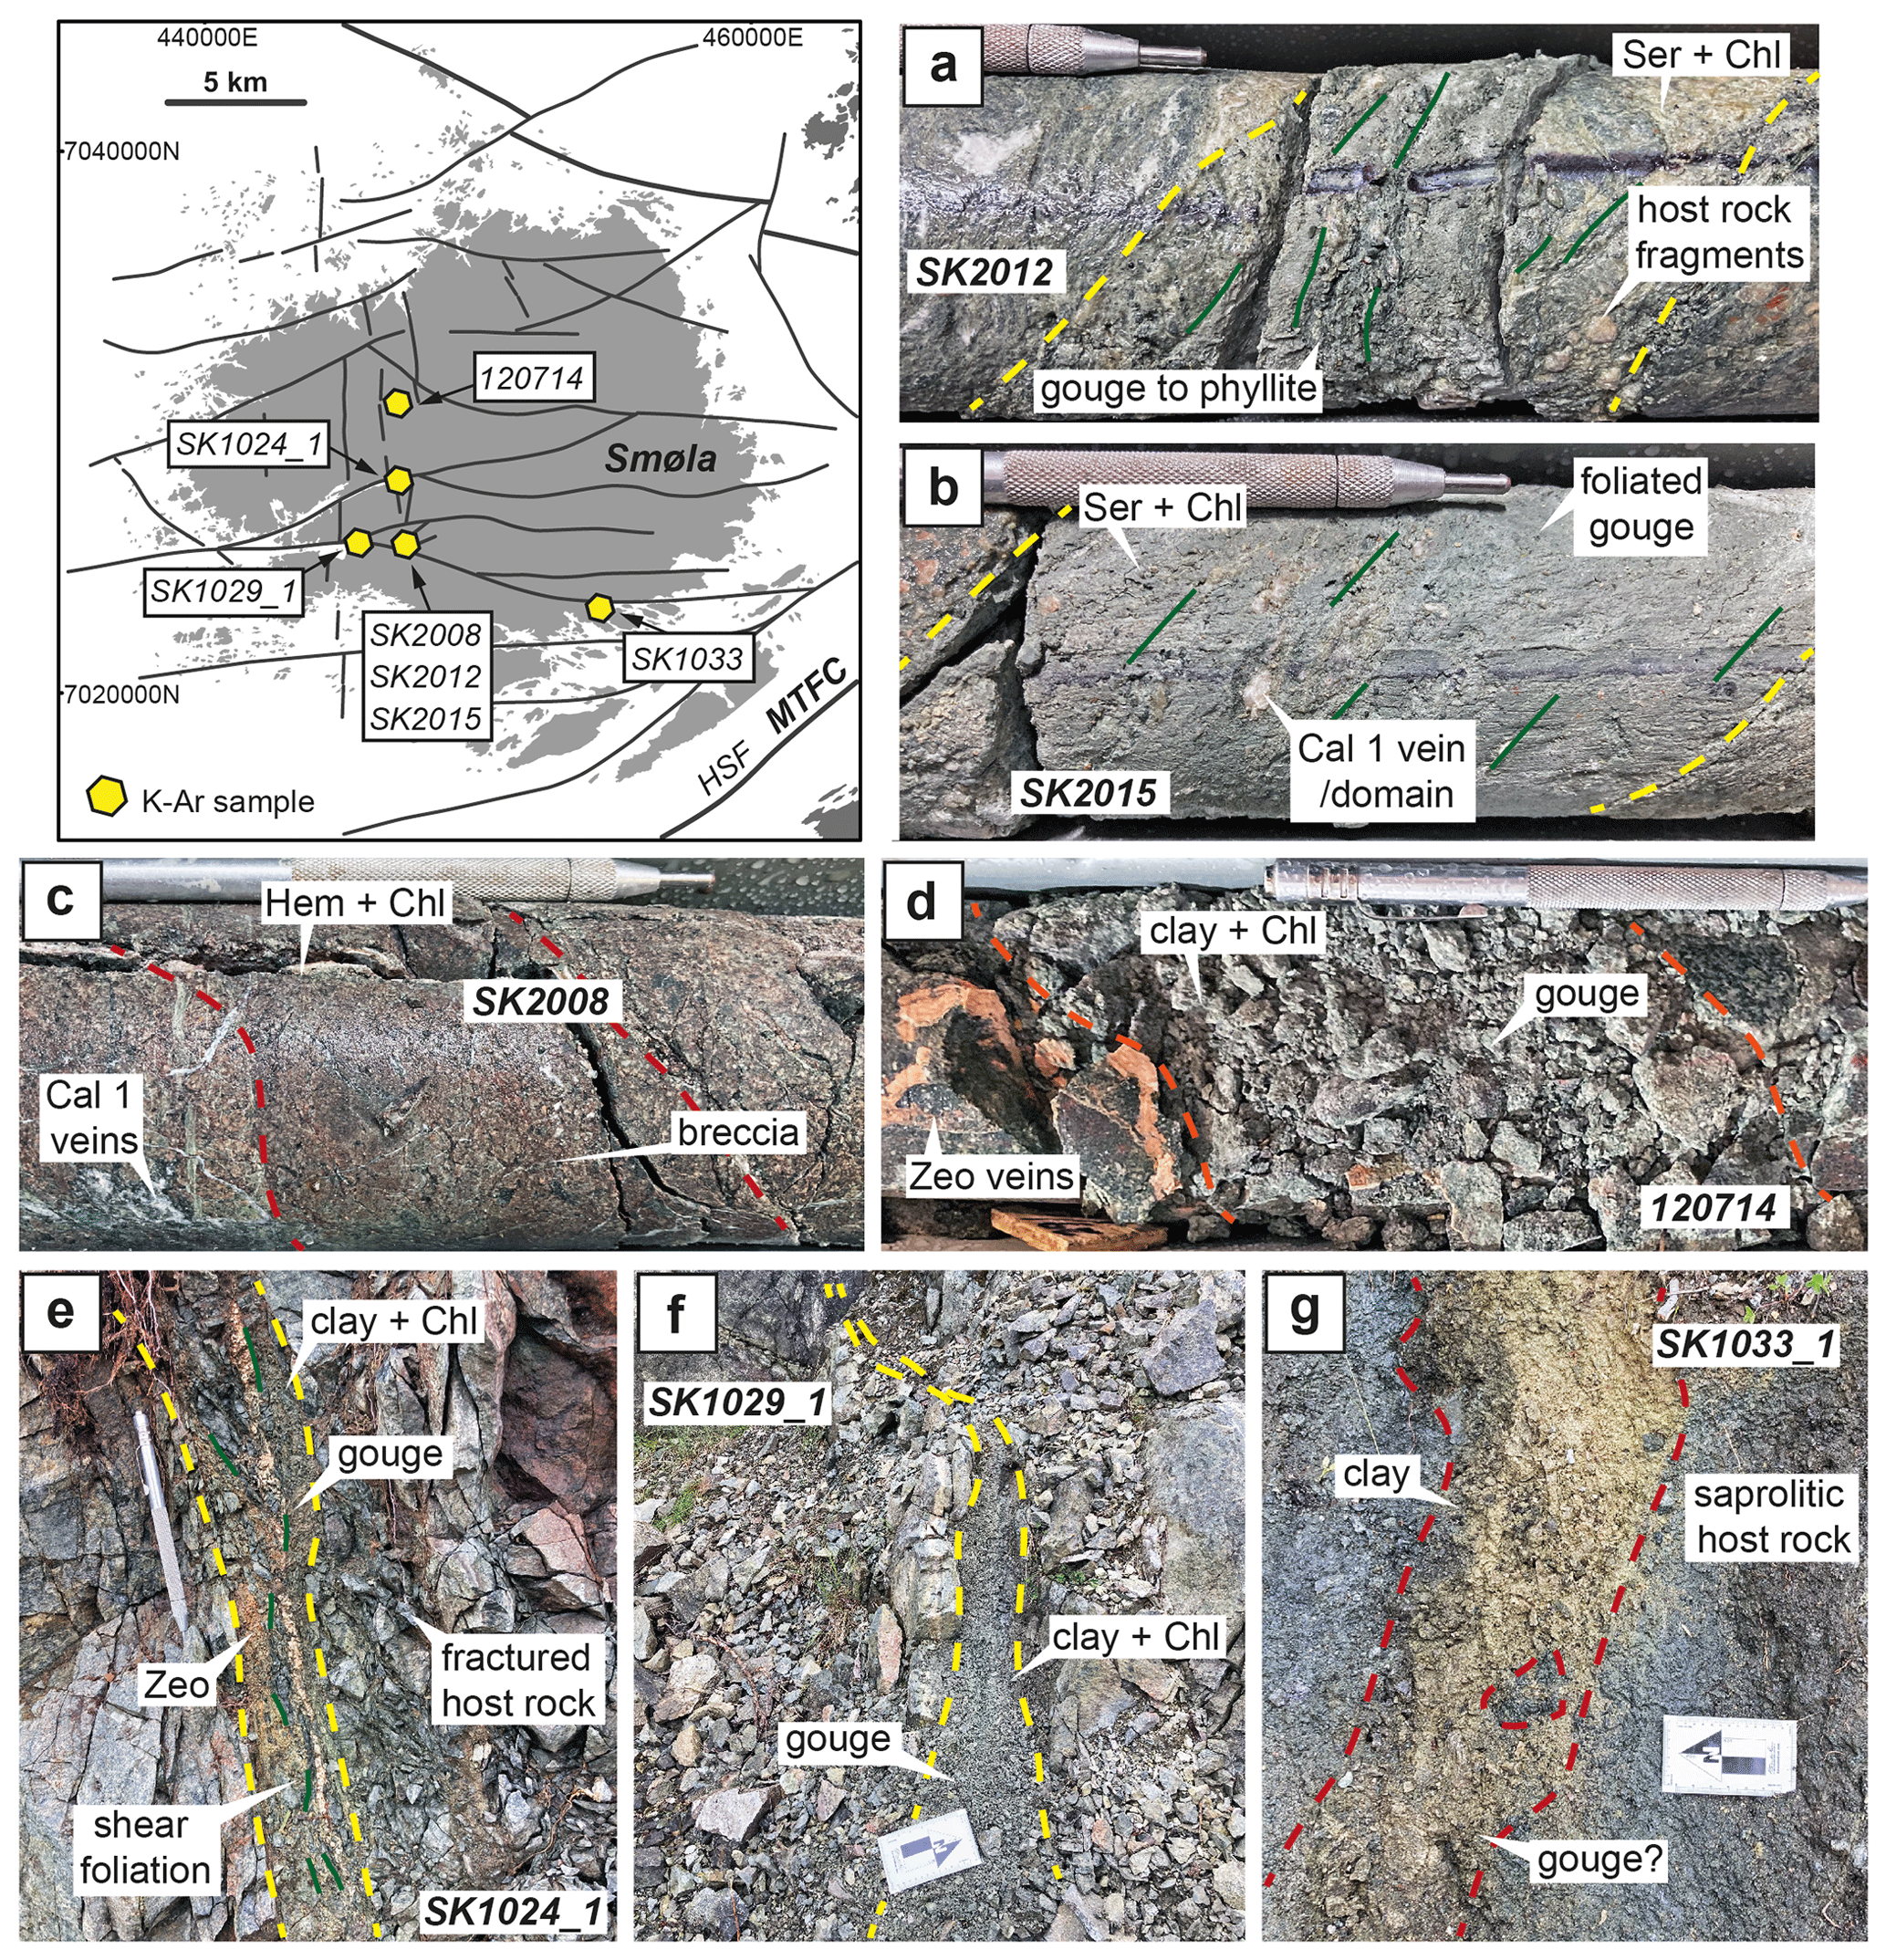
Figure 9The locations of the collected K–Ar samples on Smøla relative to mapped lineaments. (a–g) K–Ar sample sites, with samples SK2008, SK2012, SK2015, and 120714 collected from diamond drill core and samples SK2024_1, SK1029_1, and SK1033_1 collected from field locations. Map adapted from DTM data (courtesy of the NGU). Scratch pen for scale is 13 cm, or scale bar arrow is 10 cm.
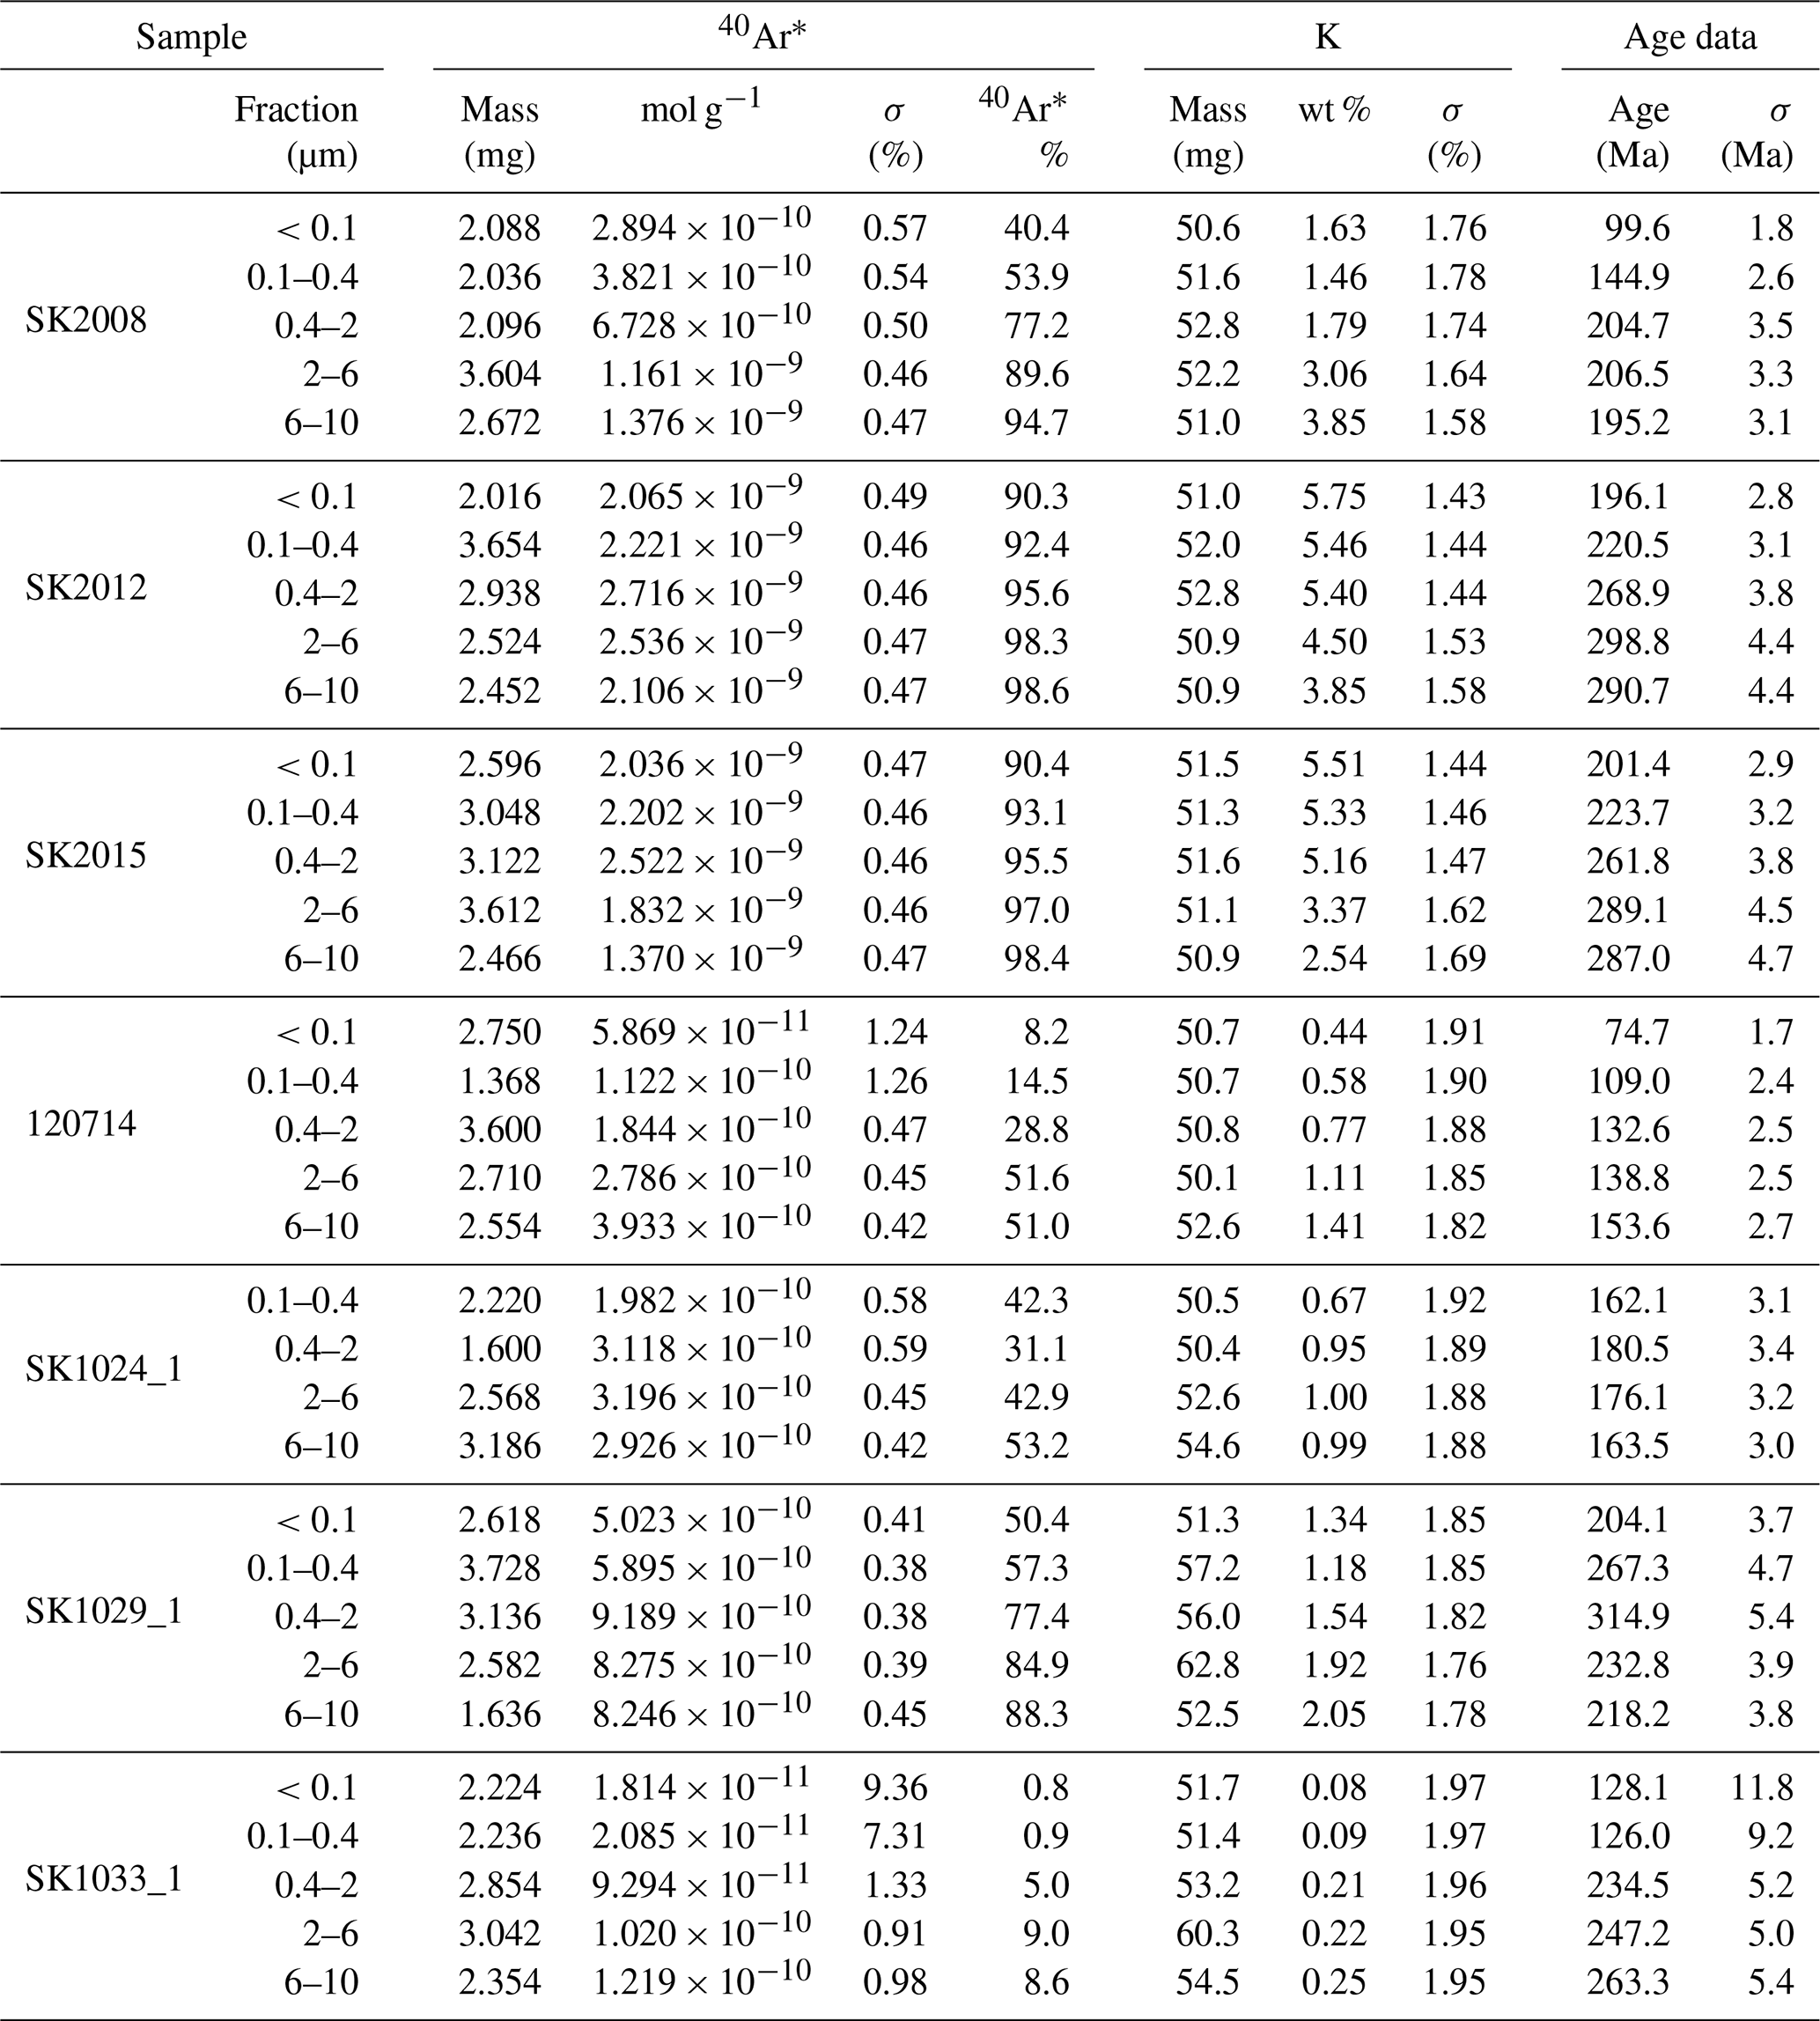
4.4 K–Ar geochronology and X-ray diffraction
Seven fault gouge samples (Table 2; Fig. 9) were collected from drill holes BH2 (SK2008, SK2012, and SK2015), BH4 (120714) (Fig. 4), and outcrops on Smøla island (SK1024_1, SK1029_1, and SK1033_1) to date potential authigenic and synkinematic potassium (K)-bearing clays. The dated samples compositions by X-ray diffraction (XRD) are shown in Fig. 10, with the K–Ar dating results in Table 3 and Fig. 11a subdivided by the grain size fraction for each sample (<0.1 to 6–10 µm). The orientations of the sampled structures (Fig. 11b) is provided in the text as dip inclination (0–90°) and dip direction (0–360°). None of the samples has associated kinematics, apart from sample SK1033_1. The sample descriptions are ordered by interpreted deformation episode, with the full sample characterisations available in the Supplement.
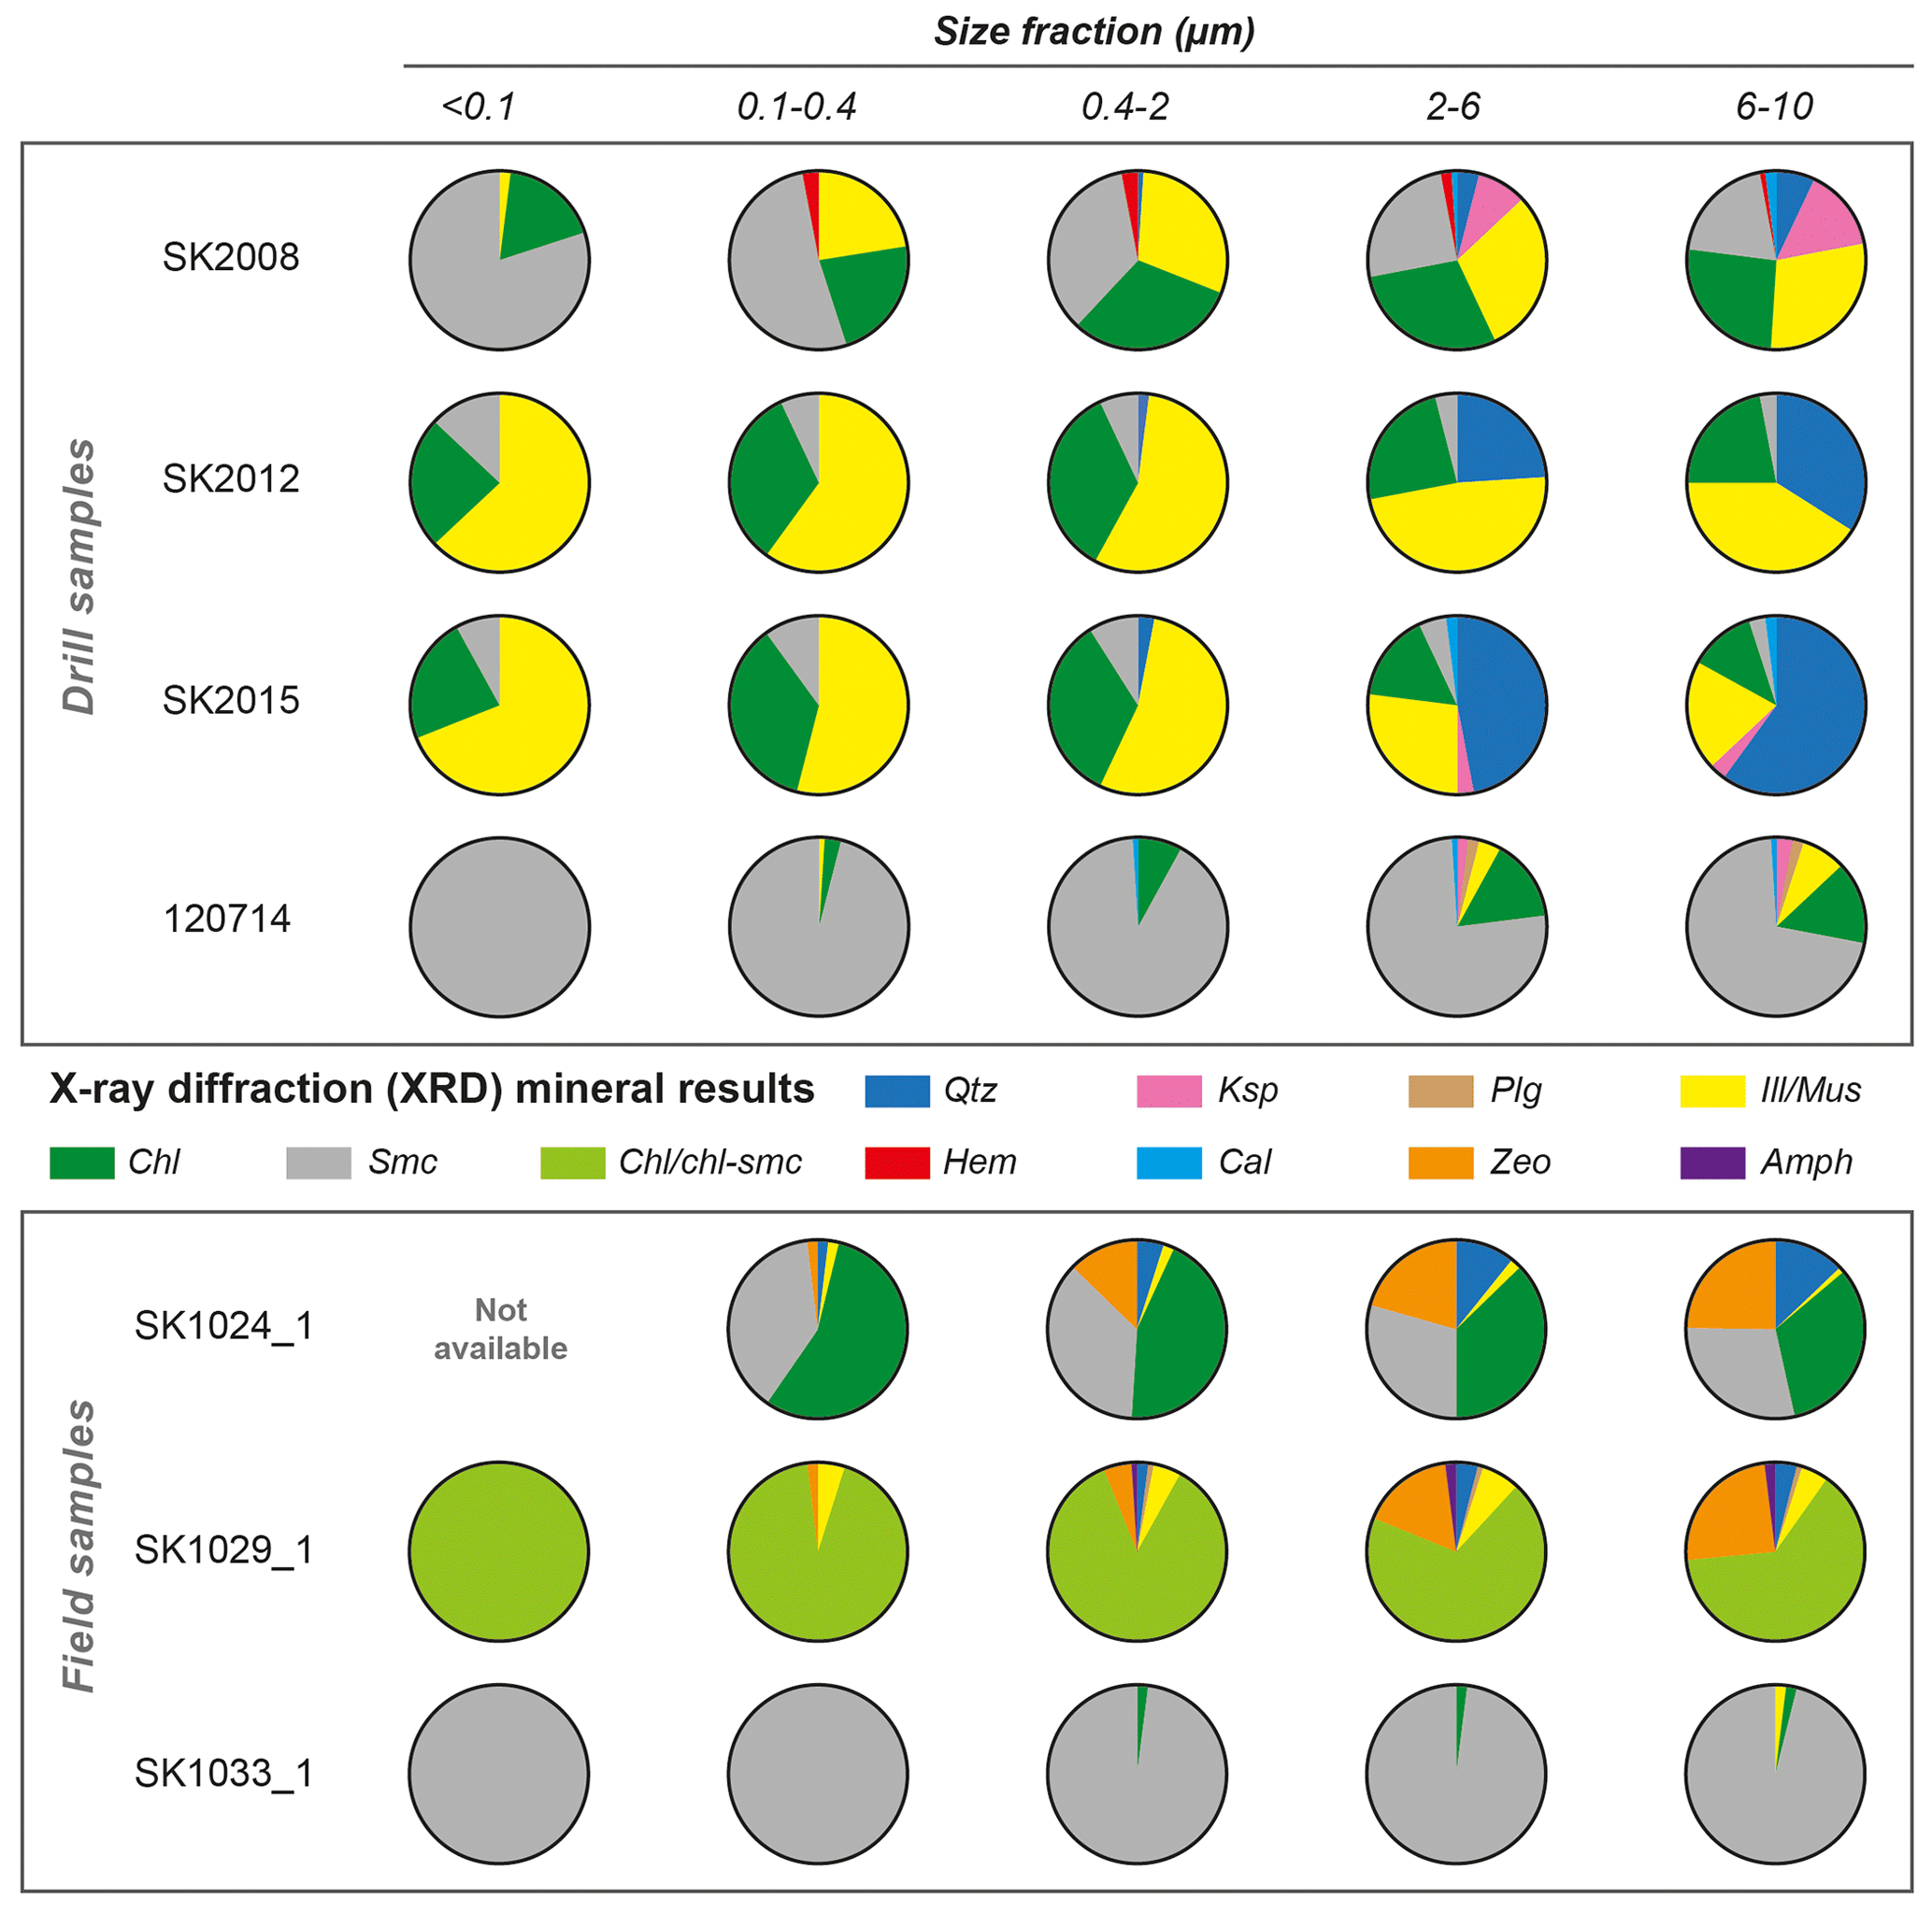
Figure 10Pie charts with mineral compositions by weight percent (wt %) from X-ray diffraction results of the K–Ar samples. Mineral abbreviations are as follows: Qtz is for quartz, Ksp is for potassic feldspar, Plg is for plagioclase, Ill/mus is for illite/muscovite, Chl is for chlorite, Smc is for smectite, Hem is for hematite, Cal is for calcite, Zeo is for zeolite, and Amp is for amphibole. Note that due to poor crystallinity and/or the lack of structural data for mixed-layer clay minerals, only semi-quantitative assessments could be made.
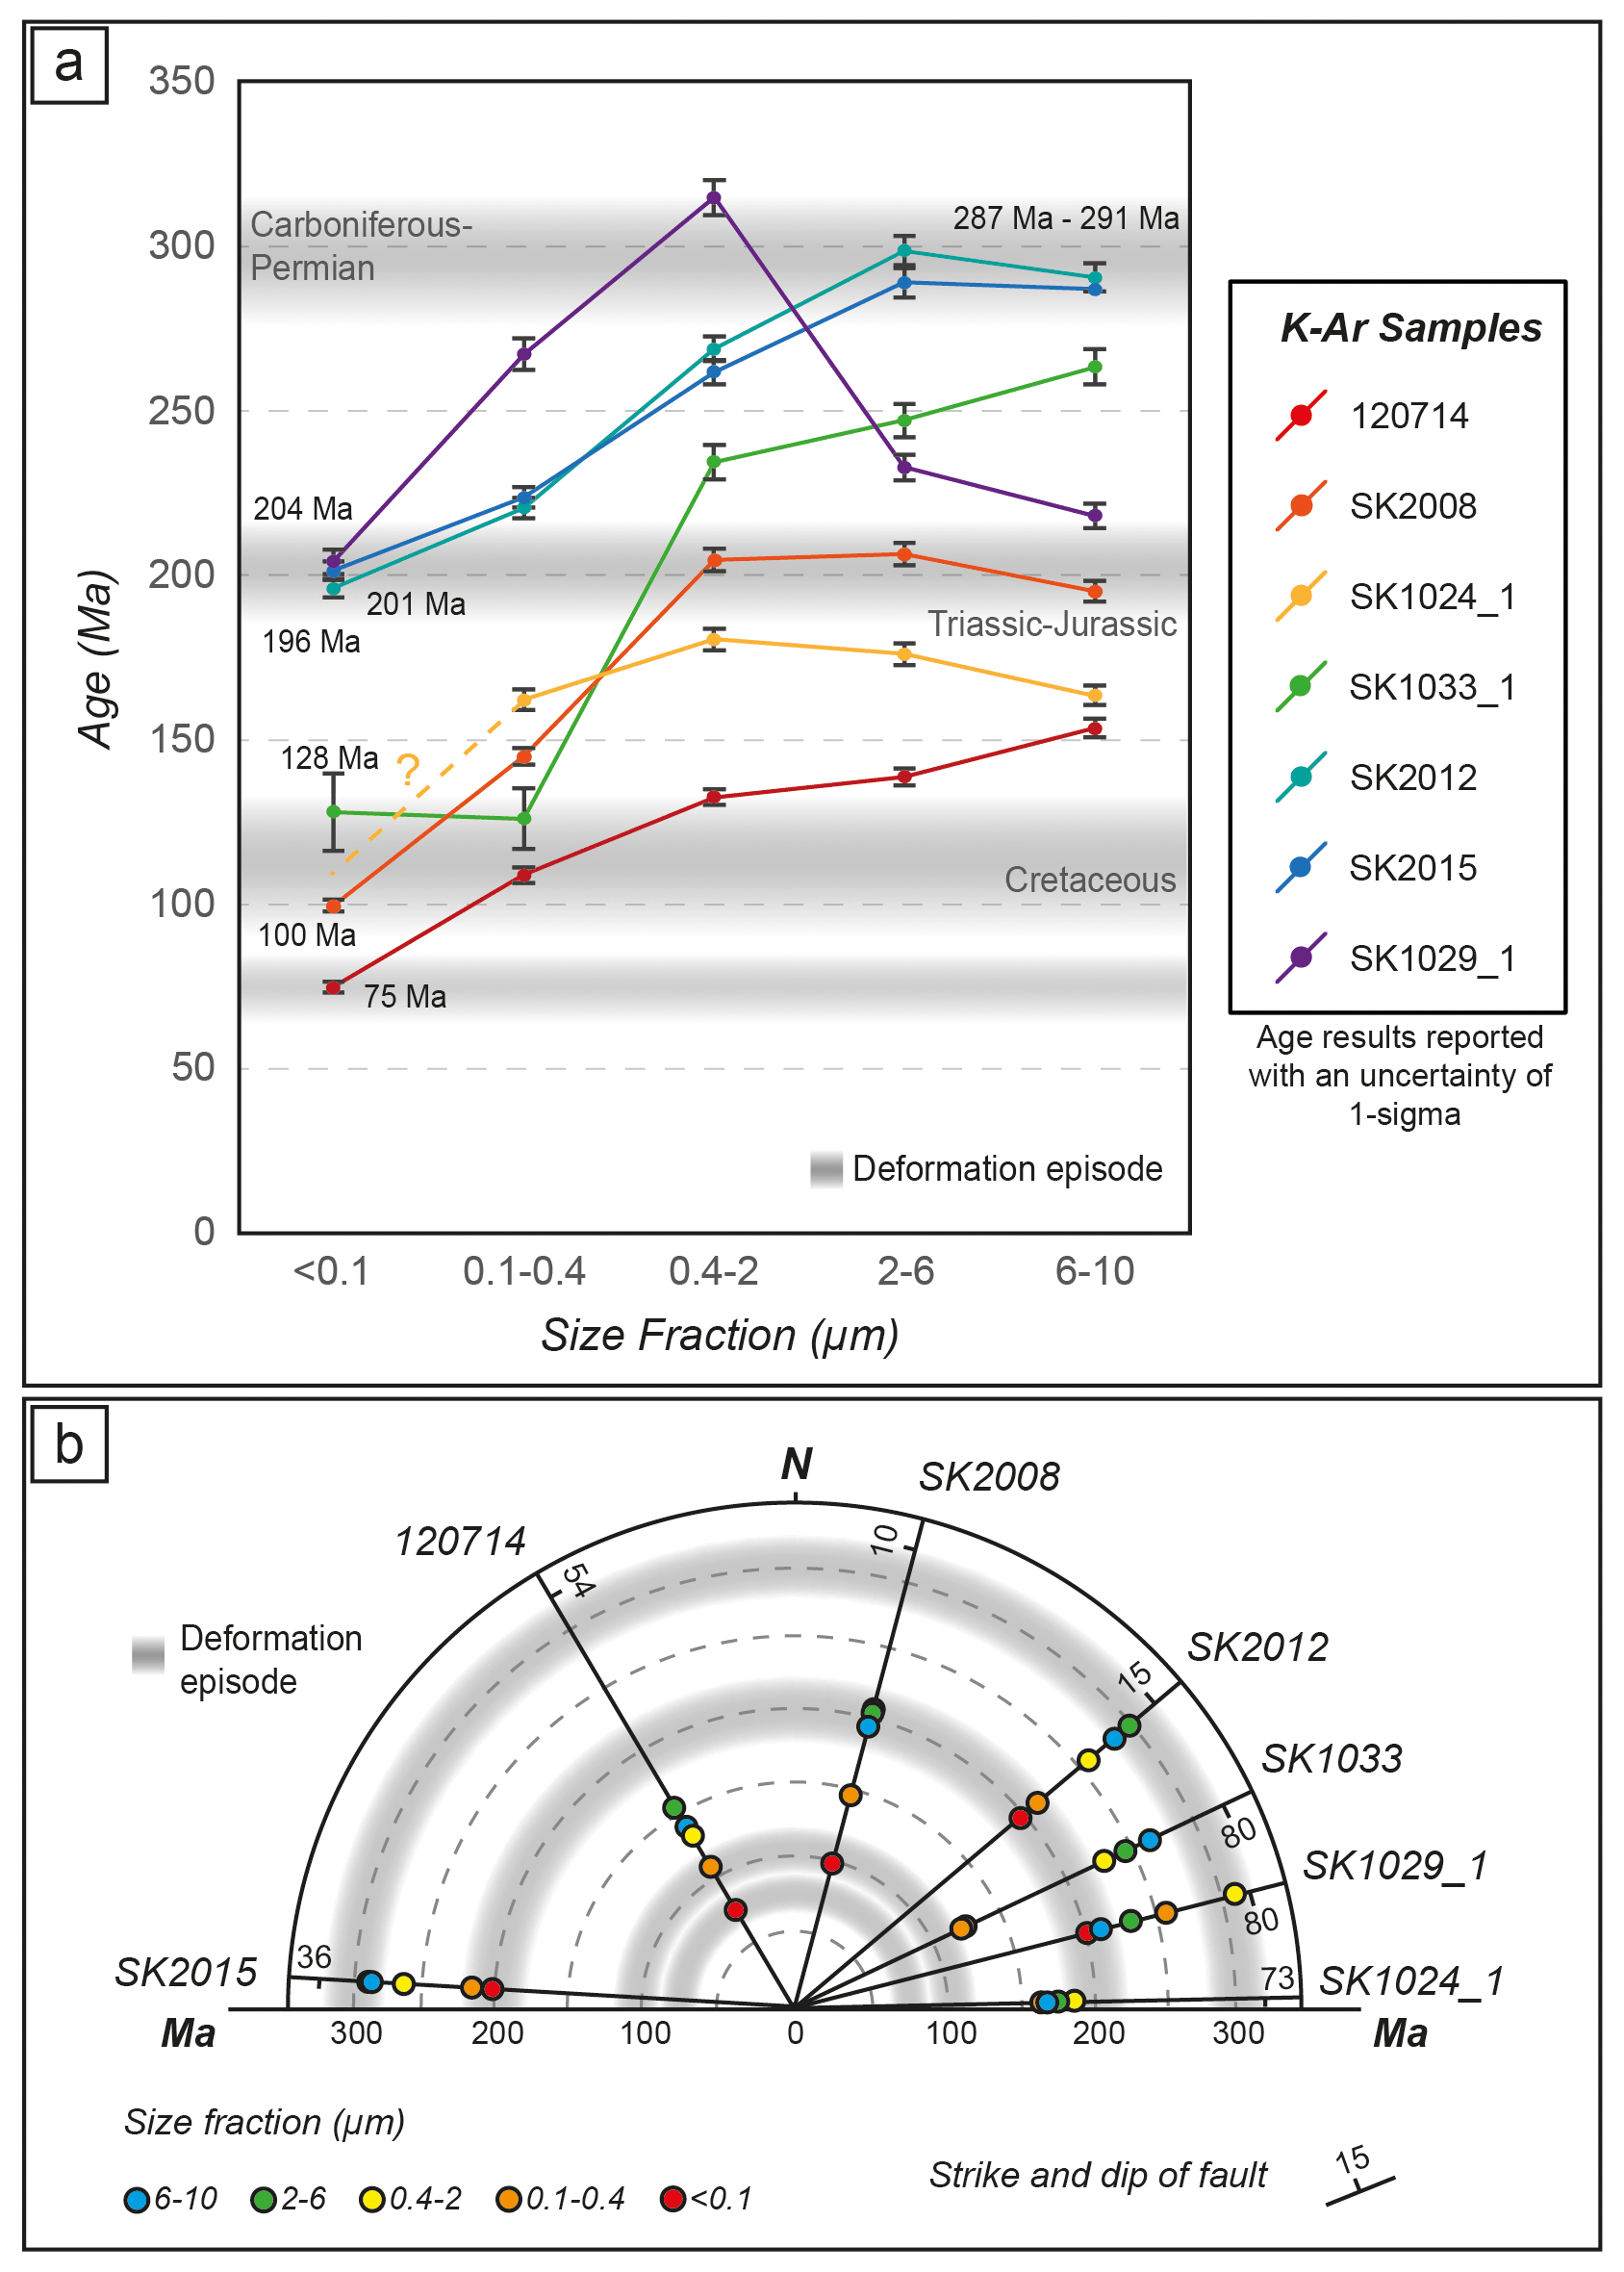
Figure 11(a) K–Ar age spectra results for the seven samples. Data are expressed by the size fraction of the sampled medium against the determined age, with age clustering indicating possible authigenic (and deformation) episodes. (b) Radial plot showing dated samples with K–Ar ages and the size fraction (coloured circles) plotted on lines indicating the strike orientations of sampled structures.
Table 2Summary of K–Ar samples collected from either drill holes BH2 and BH4 or field stations on Smøla island.
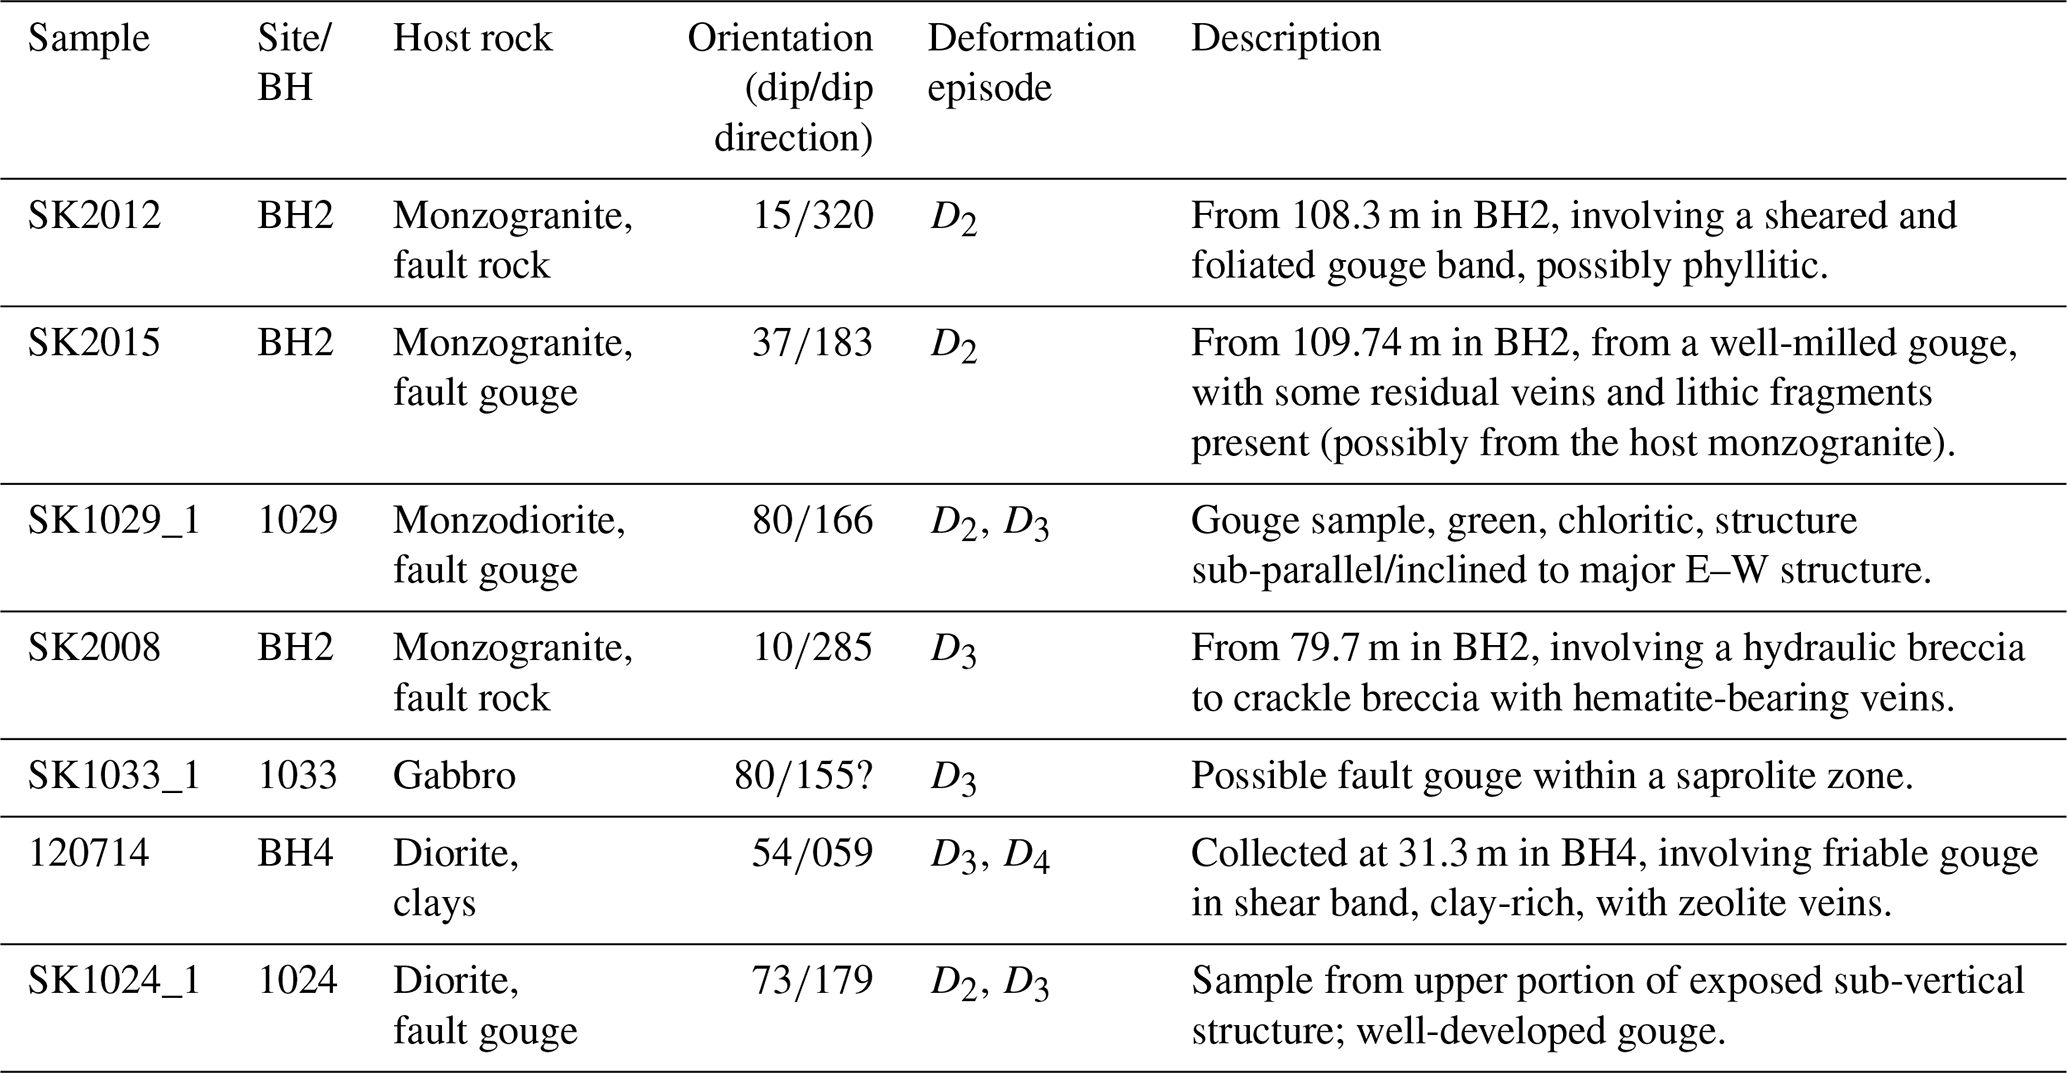
Table 3K–Ar analysis age results of the Smøla samples by size fraction. Ar* refers to radiogenic argon (Ar).
4.4.1 Field relationships and XRD results
Sample SK2012 is from a 25 cm wide foliated gouge/phyllite to cataclasite interval (Fig. 9a), oriented , in monzogranite. The zone has strong chlorite and sericite (D2) mineralisation and host rock fragments. XRD results indicate the K–Ar ages are provided by K-bearing illite/muscovite and smectite. Both illite/muscovite and smectite content increases with decreasing grain size fraction, with the highest abundance in the <0.1 µm fraction. Quartz is present in the coarser size fractions (0.4–2 to 6–10 µm), deriving from groundmass or host rock fragments.
Sample SK2015 is from a 20 cm wide well-milled, foliated, and clay-rich gouge zone (Fig. 9b) oriented . The interval is within a well-defined damage zone of highly fractured monzogranite. The gouge has abundant host rock and quartz–calcite vein fragments. XRD results show the K–Ar ages derived from illite/muscovite, smectite, and potassium feldspar. The illite/muscovite content increases in the finer fractions. The coarser fractions (2–6 to 6–10 µm) are quartz-dominated, with minor calcite and potassium feldspar.
Field sample SK1029_1 is from a ∼5 cm wide chlorite–clay-rich gouge zone, within monzodiorite (Fig. 9f), oriented , and extending >10 m. The zone is proximal and inclined to a major E–W structure, mapped as a second-order L3 lineament (Fig. 2). XRD results indicate that the K–Ar ages are from smectite, illite/muscovite, and zeolite. The size fractions are dominated by chlorite–smectite mixed clay (tosudite). Illite/muscovite is absent in the finest fraction but present in the 0.1–0.4 to 6–10 µm fractions. Zeolite is abundant in the coarser fractions (2–6 to 6–10 µm).
Sample SK2008 is from an 8 cm wide indurated gouge to micro-vein breccia (Fig. 9c), oriented . The interval is within a ∼5 m wide damage zone of chlorite–hematite (D3) mineralised and altered monzogranite. XRD results show the K–Ar ages derived from illite/muscovite, smectite, and potassium feldspar. Hematite is present in all size fractions, except the <0.1 µm fraction. Illite/muscovite is present in all fractions but a minor component in the <0.1 µm fraction. Smectite increases towards the finer fractions. The coarser fractions (2–6 to 6–10 µm) contain potassium feldspar, calcite, and quartz.
Field sample SK1033_1 is from a ∼25 cm wide possible weathered gouge zone within a saprolite horizon (Fig. 9g), bound by adjacent chloritic–hematite slickensides and oriented with low confidence (due to poor preservation) and possibly dip-slip (slickenlines too subtle to orient accurately). XRD results indicate the K–Ar ages come from smectite and illite/muscovite. The size fractions are dominated by smectite, with minor chlorite, and illite/muscovite only present in the coarsest fraction (6–10 µm).
Sample 120714 is from a 40 cm wide friable clay-rich gouge within a shear band, oriented , in diorite, with crosscutting zeolite veins (Fig. 9d). XRD results show the K–Ar ages derived from smectite, illite/muscovite, and potassium feldspar. Smectite is dominant in all size fractions, comprising the <0.1 µm fraction entirely. Illite/muscovite is present in coarser fractions and the 0.1–0.4 µm fraction. Potassium feldspar, plagioclase, and calcite are present in the coarser fractions (2–6 to 6–10 µm).
Field sample SK1024_1 is from a ∼8 cm wide foliated chloritic gouge zone (Fig. 9g), oriented , within an 8 m wide damage zone with hematite fractures. The gouge zone, a D2 to D3 feature, is crosscut by zeolite veins. The XRD analysis for the finest fraction was not possible due to insufficient material. XRD results, however, indicate the K–Ar ages come from smectite, illite/muscovite, and zeolite. Minor illite/muscovite is present in all size fractions, with major amounts of smectite and chlorite. Zeolite and quartz are particularly abundant in the 0.4–2 to 6–10 µm size fractions.
4.4.2 K–Ar geochronology results
The K–Ar geochronology results (Fig. 11 and Table 3) indicate that the samples can be grouped in D2 to D4.
Associated with D2, samples SK2012, SK2015, and SK1029_1 returned K–Ar ages for the finest fractions (<0.1 µm) of 196.1±2.8, 201.4±2.9, and 204.1±3.7 Ma, respectively. These ages likely correspond to authigenic illite–muscovite–smectite. Samples SK2012 and SK2015 yielded the coarsest fraction (6–10 µm) K–Ar ages of 290.7±4.4 and 287.0±4.7 Ma, respectively. Both samples SK2012 and SK2015 have similar inclined age spectra curves with a plateau at ∼300 Ma. The plateau implies an inherited component (potentially inherited illite/muscovite) from an earlier tectonic episode. Sample SK1029_1 returned a much younger coarsest fraction K–Ar age of 218.2±3.8 Ma. The younger ages are attributed to zeolite, with potentially radiogenic 40Ar loss from the crystal structure, leading to lower age results (e.g. Levy and Woldegabriel, 1995).
Associated with D3, samples SK2008 and SK1033_1 yielded <0.1 µm fraction K–Ar ages of 99.6±1.8 and 128.1±11.8 Ma, respectively, associated with likely authigenic illite–muscovite–smectite. The coarsest fractions provided ages of 195.2±3.1 and 263.3±5.4 Ma, respectively. The SK2008 fractions from 0.4–2 to 6–10 µm have ages clustering at ∼200 Ma, coinciding with the finest fraction ages for samples SK2012, SK2015, and SK1029_1, implying a D2 inheritance. The SK1033_1 ages may reflect authigenic clay growth during saprolite formation or hydrothermal activity, suggesting that this sample's results should be treated with caution.
Sample 120714, associated with D3 and D4, yielded a <0.1 µm fraction K–Ar age of 74.7±1.7 Ma and a 6–10 µm fraction age of 153.6±2.7 Ma. The finest fraction age is likely authigenic, but the coarsest fraction age, owing to the presence of potassic feldspar and illite/muscovite, may represent an inherited/protolithic age. The zeolite veins (not in the XRD results), crosscutting the sampled gouge, would have mineralised after the ∼75 Ma age, indicating a possible upper limit on the timing of D4.
Sample SK1024_1 lacked enough material for the <0.1 µm fraction and is for demonstrative purposes only. The K–Ar ages range from 162.1±3.1 Ma (0.1–0.4 µm fraction) to 163.5±3.0 Ma (6–10 µm fraction), with the oldest age (180.5±3.4 Ma) associated with the 0.4–2 µm fraction. The age spectra curve in Fig. 11a, a convex upward shape, indicates that the zeolite presence in the coarser fractions is also lowering ages, like for sample SK1029_1.
Overall, the K–Ar age results by structure orientation (Fig. 11b) indicate that the D2-associated structures striking NE–SW, E–W, and ENE–WSW yielded authigenic Triassic–Jurassic (∼196–204 Ma) ages, with possible inherited Carboniferous–Permian (∼287–291 Ma) ages. The D3-associated structures striking NNE–SSW and ENE–WSW yielded authigenic Cretaceous (100–128(?) Ma) ages, with inherited Triassic–Jurassic (∼200 Ma) material. Last, structures striking NW–SE, crosscut by later D4 zeolite veins, yielded Cretaceous (75 Ma) ages.
5.1 Polyphase evolution of Smøla and the passive margin
Based on our new multiscalar and multi-technique results, we propose an evolutionary tectonic history for Smøla (Fig. 12) and discuss its implications for the evolution of the passive margin.
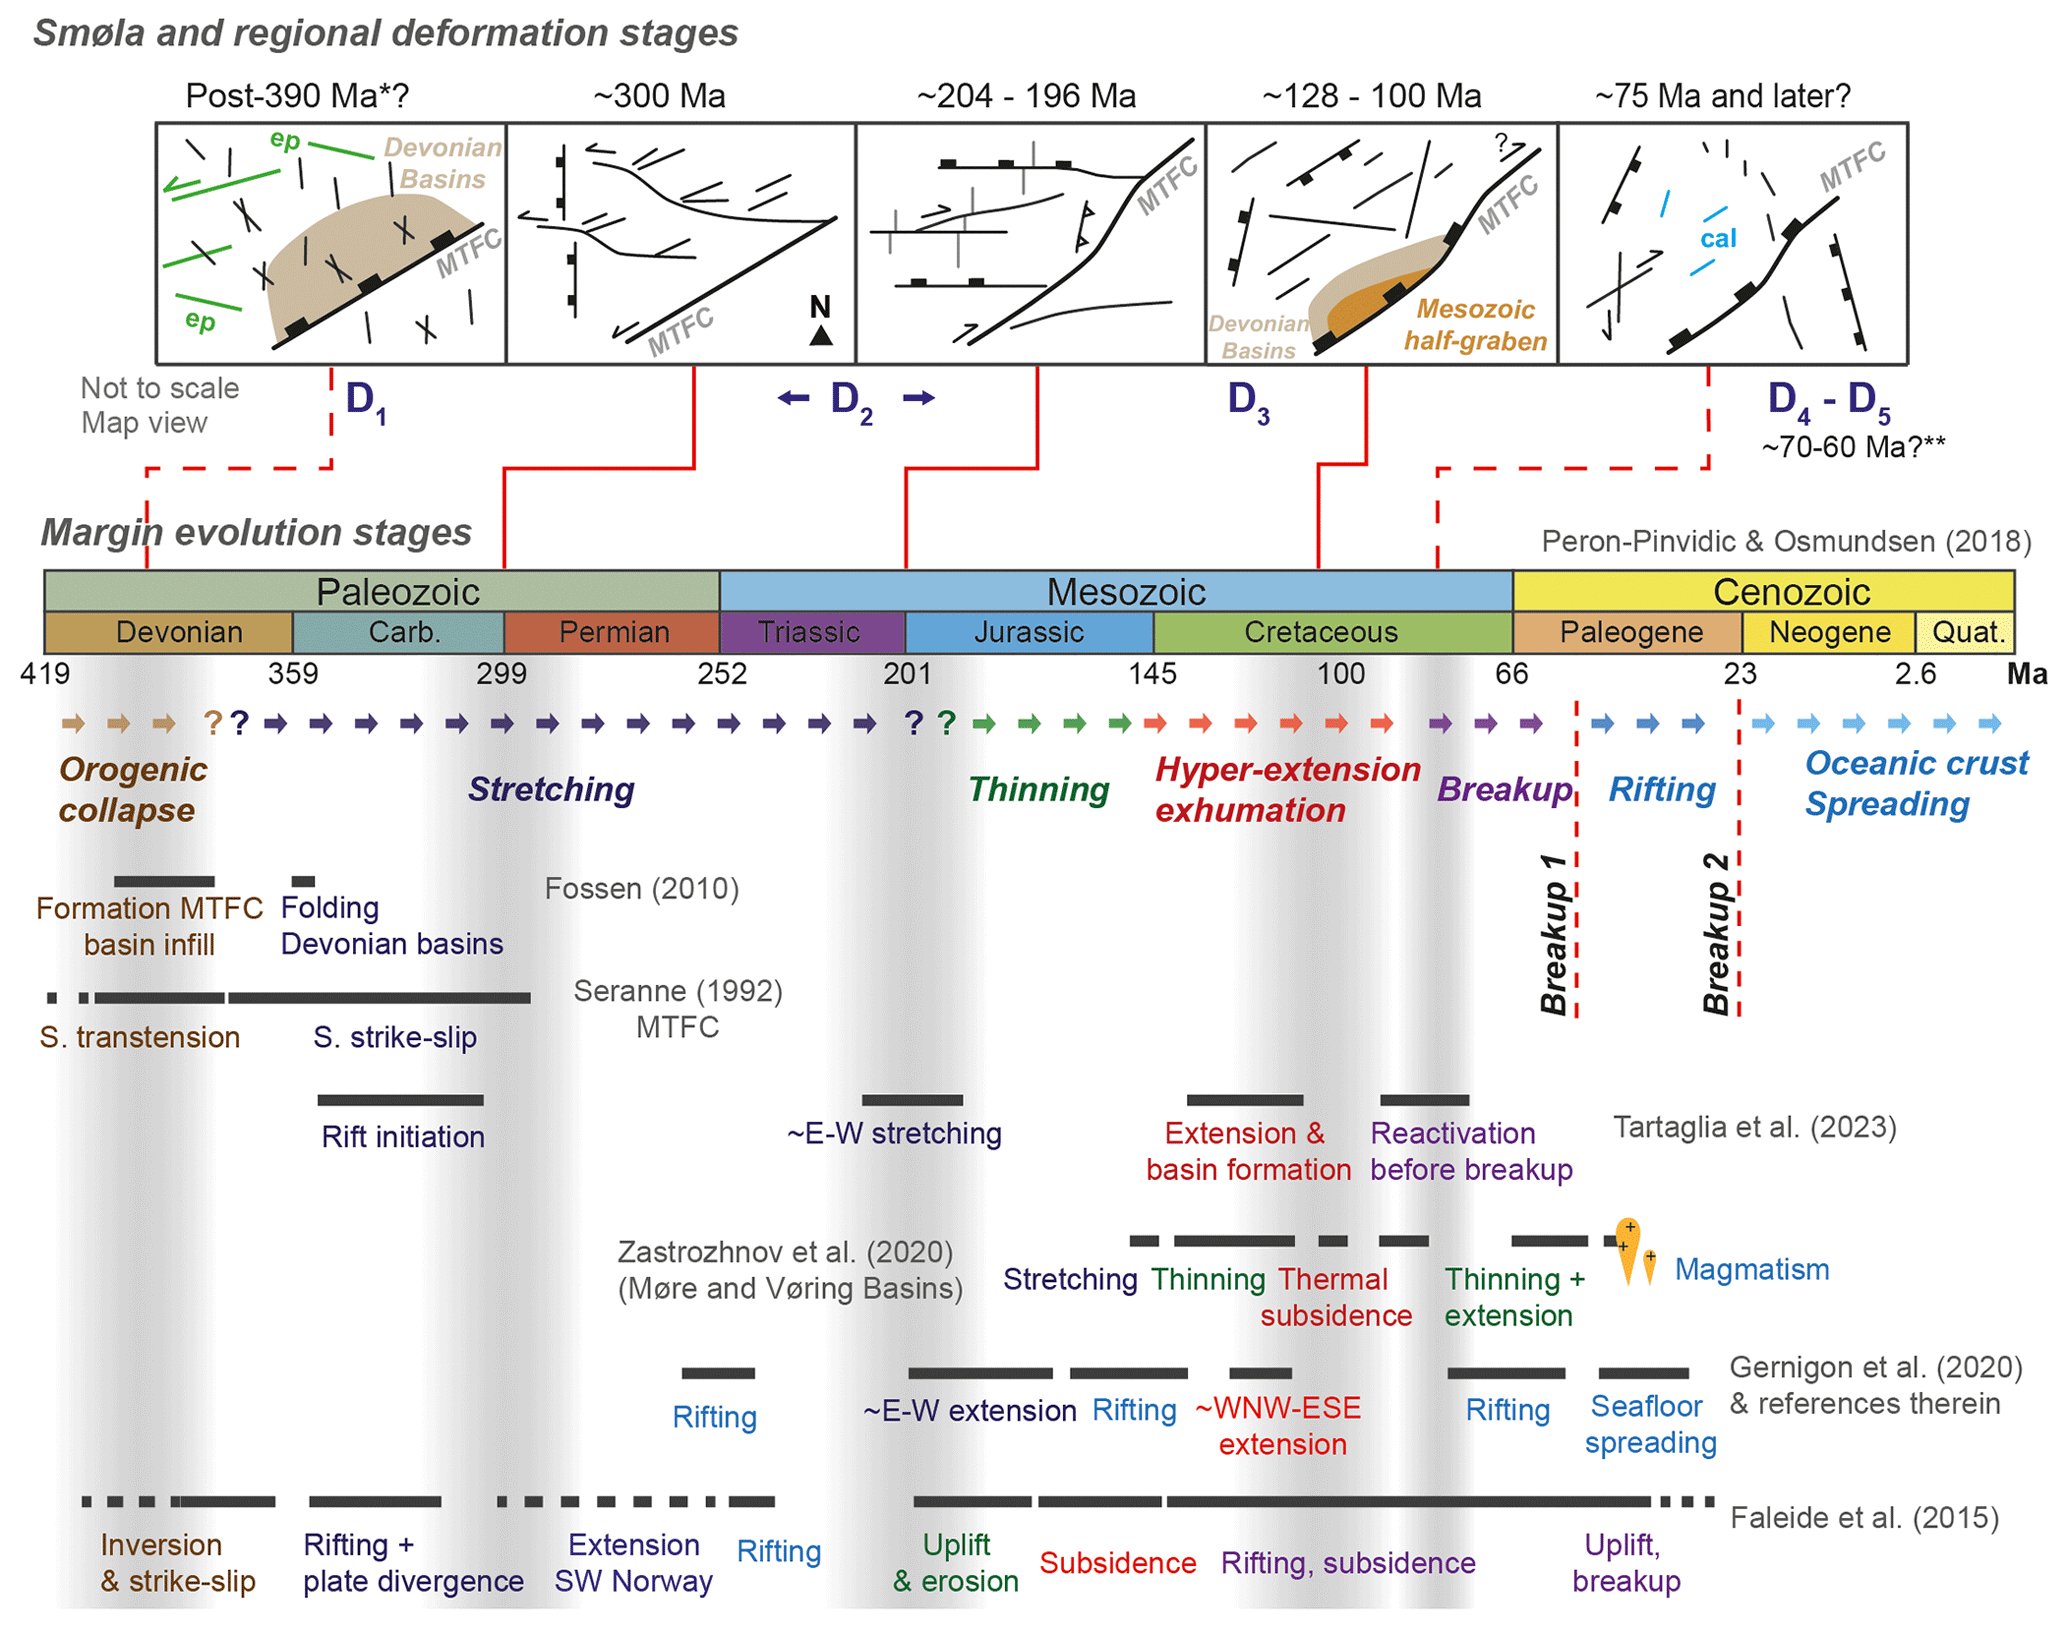
Figure 12Summary figure integrating this study's results, represented at the top, relative to other mid-Norwegian passive margin evolution studies. The main margin evolution stages are adapted from Peron-Pinvidic and Osmundsen (2018). Ages are provided by * Fossen et al. (2017) and Hestnes et al. (2023).
The D1 epidote–prehnite mineralisation, although not directly dated in this study, has been shown in other areas of the Norwegian margin to have formed from syn- to post-Devonian times until ∼290 Ma (Seranne, 1992; Watts et al., 2023; Sherlock et al., 2004; Indrevær et al., 2014). The D1 brittle structures (Figs. 5a, b and 8b) rework primary host rock features and are systematically offset by the D2 to D5 structures, indicating that epidote and prehnite mineralised prior to all other deformation episodes (Fig. 7). The D1 tensile veins or sinistral strike-slip features, striking ENE–WSW (sub-vertical to steep SSE dips and shallow-plunging slip lineations) (Fig. 3), likely formed during post-Caledonian brittle sinistral transtension on the MTFC (Seranne, 1992; Watts et al., 2023) and WNW–ESE extension (represented in Fig. 12).
Later, the NW–SE-striking features (moderately to shallowly NE-dipping), as well as the ∼ NNW–SSE to NNE–SSW-striking features (steeply ∼ E-dipping), being either normal dip-slip features or both dextral and sinistral (conjugate) features, may have formed because of local N–S to NNE–SSW shortening. This shortening direction is also implied by the Mid–Late Devonian development of E–W-trending folds in the Edøyfjorden basin Devonian rocks (Bøe et al., 1989; Fossen, 2010) (Fig. 12). From relative timing and structural data correlations, the lineaments L1, L3, and L4 may have formed during D1, with later reactivations. Overall, despite being the least strike-continuous features (as shown in the 3D model in Fig. 8b), D1 is pervasive across Smøla, the Devonian-aged Edøyfjorden basin, and the WGR to the SE of the MTFC (Fig. 2a and bI, bII).
The D2 sericite–chlorite–calcite structures (Figs. 5c and 6d, e) are dated to ∼204–196 Ma (finest fractions for samples SK2012, SK2015, and SK1029_1 in Fig. 11). However, microstructural and field evidence (Fig. 6d and e) and the plateau in the age spectra graph for the two coarsest fractions for SK2012 and SK2015 (Fig. 11a) suggest a possibility of an earlier inherited deformation episode at ∼300 Ma. Early faulting-related sericitisation of host rock feldspar (e.g. Wibberley, 1999) could explain the coarsest fraction illite/muscovite content and this inherited age. As such, two deformation (sub-)episodes may be associated with the sericite–chlorite–calcite mineral assemblage and thus tentatively to D2. Considering these two possible deformation phases, we can sort the complex array of D2 structures (Fig. 3) into two structural frameworks: (1) the sinistral strike-slip ∼ E–W and NE–SW-striking features (moderately to steeply dipping ∼ N, SSW, and NW), the normal faults striking ∼ N–S (moderately to steeply dipping W), and the ENE–WSW-striking (steeply SSE-dipping) reverse dip-slip features; and (2) the ENE–WSW-striking (steeply SSE-dipping) dextral strike-slip features, the ∼ N–S-striking (steeply E-dipping) reverse faults, and the ∼ E–W to NE–SW-striking (moderately to steeply dipping ∼ N/S to SE) normal dip-slip features.
The first set of structures indicates sinistral strike-slip or transtension conditions along the MTFC, with ∼ WNW–ESE crustal extension and ∼ NNE–SSW shortening. This is largely consistent with the Late Carboniferous–Early Permian MTFC evolution, as proposed by Seranne (1992) and Watts et al. (2023) (Fig. 12). Furthermore, the ∼ N–S-striking normal dip-slip features on Smøla have a similar geometry to the ∼ N–S extensional faults (Raudtinddalen Fault) off the VF, which have been associated with a similar age and kinematics (Watts et al., 2023). The moderately to shallowly south-dipping D2 features in drill holes BH1 and BH2, as shown in 3D modelling (Fig. 8a), likely coincide with the damage zone of the nearby major E–W structure. Adjacent to the drill holes, the major ∼ E–W structure also locally changes the strike to a NW–SE trend (Fig. 2bI). The shallow dipping D2 features, although possibly the result of local stress perturbations (e.g. Kim et al., 2004), may have formed from local shortening associated with the strike rotation of the major E–W structure (forming a restraining bend) (e.g. Cunningham and Mann, 2007), further supporting sinistral faulting.
Based on the above interpretation, the ∼ E–W, ENE–WSW, and NE–SW sinistral and reverse features may correspond to L2 and L3 (Fig. 2bI and II) second- to third-order lineaments, and the ∼ N–S-striking normal dip-slip features correlate with the L1 lineaments. Within this setting, the L3 lineaments could represent sinistral R and R′ Riedel shears off the L2 lineaments (Fig. 2bI), with the L1 lineaments predominantly involving extensional features accommodating an ∼ E–W/WNW–ESE extension. Additionally, during this phase, the L2 second-order lineaments which correlate with the major E–W structures and steep sinistral features (with sub-horizontal slip lineations) could also have formed as synthetic P shears off the main MTFC trend (Fig. 12). This earlier episode may therefore correspond to an overall NE–SW crustal stretching and rifting during the Late Carboniferous–Early Permian (timeline in Fig. 12), resulting in the Late Palaeozoic basins such as the Froan Basin and Høybakken-fault-related basin (Kendrick et al., 2004; Faleide et al., 2008; Peron-Pinvidic and Osmundsen, 2018).
The second set of structures may be associated with the ∼200 Ma ages constrained by the finest grain size fractions of the D2-associated samples. These structures suggest dextral strike-slip along the MTFC, with an overall extension direction of ∼ NNE–SSW. Moreover, the steeply dipping ENE–WSW-striking dextral strike-slip features (with a horizontal slip lineation), being sub-parallel to the HSF (MTFC) trend, also correspond to the L3 lineaments. These L3 lineaments do show rare dextral offsets of both the L1 and L4 lineaments, further suggesting that some dextral kinematics is subtlety preserved (Fig. 2bI).
Therefore, reflecting the above, both the steep ∼ N–S-striking reverse faults associated with D2 and the major E–W structures (L2 lineaments) converging on the NE side of the Edøyfjorden basin (Fig. 2a), where there is an ENE–WSW to NE–SW strike rotation of the MTFC, may indicate a possible restraining band (associated with dextral strike-slip; represented in Fig. 12). As such, the E–W structures could represent a positive flower structure forming off the MTFC due to local transpression (e.g. Cunningham and Mann, 2007). The ∼ E–W to NE–SW moderately dipping normal features (with steeply plunging slip lineations), however, indicate that extensional conditions mostly prevailed over Smøla, and many of the ∼ E–W structures formed during earlier D2 times were reactivated as steep normal faults or involve oblique dextral–normal kinematics. Additionally, the shallow D2 structures 3D-modelled in Fig. 8a, dipping south towards the major E–W structures, might represent shallow dipping antithetic or conjugate features formed during an extensional setting (related to late MTFC dextral faulting and extension). The shallow dipping D2 structures in BH3 and BH4, in contrast, are within diorite and gneiss units (Fig. 1b) and may involve the reactivation of foliation planes commonly associated with more micaceous intervals during either early or late D2 times.
Dextral kinematics on the MTFC during the Jurassic were proposed by Grønlie and Roberts (1989), with Watts et al. (2023) suggesting instead that it occurred later along the VF during the Late Jurassic/Early Cretaceous. Dextral strike-slip faulting could have resulted from poorly constrained Triassic–Jurassic far-field compressive forces acting on a mechanically weak MTFC and associated structures. However, at that time, the region was experiencing the start of an extensional phase with regional subsidence (Tsikalas et al., 2012; Peron-Pinvidic and Osmundsen, 2018) in response to ∼ E–W crustal extension (Gernigon et al., 2020; Tartaglia et al., 2023) (shown in the timeline in Fig. 12), which does not fit well with dextral kinematics, suggesting that this tectonic phase remains uncertain.
Associated with D3, the hematite-bearing structures (Table 2; Fig. 9c and g) yielded finest size fraction K–Ar ages of between ∼128 and ∼100 Ma (Fig. 11). Importantly, however, the ∼128 Ma age from sample SK1033_1 may reflect local saprolitisation or hydrothermalism instead of deformation linked to D3, even though most Norwegian margin saprolite ages fall within the Triassic/Jurassic time interval (e.g. Fredin et al., 2017; Knies et al., 2022; Olesen et al., 2023). The age spectra plateau for sample SK2008, corresponding to ∼200 Ma (fractions 0.4–2 to 6–10 µm), and the finest fraction K–Ar ages for samples SK2012, SK2015, and SK1029_1 also suggest a D2 inheritance within the coarser fractions of this sample. Thus, the D3 outcrop structures (Fig. 3) can be subdivided into two groups: (1) the majority of the normal to oblique–normal features striking NNE–SSW (dipping steeply W) and NE–SW (dipping moderately to steeply SE), the ∼ ENE–WSW sinistral strike- to oblique-slip features (moderately to steeply NNE and SE-dipping, with inclined to sub-horizontal slip lineations), and the ∼ NW–SE-striking reverse dip-slip features (moderately ENE and steeply SSW-dipping); and (2) ∼ N–S-striking (steeply W-dipping) reverse faults and dextral features striking ENE–WSW (steeply NW-dipping and inclined slip lineation, suggesting oblique–normal kinematics).
The first group of structures (dominated by dip-slip features, with steeply plunging slip lineations), being sub-parallel to the trace of the MTFC and the axis of the Edøyfjorden basin, probably relate to a WNW–ESE to NW–SE extension, half-graben development, and Mesozoic sediment deposition within the Edøyfjorden basin (Bøe and Bjerkli, 1989). A subset of pervasive L1 and L3 lineaments (mostly third-order), also correspond to the moderately SE- or steeply W-dipping normal dip- to oblique-slip faults, either formed or reactivated during D3 (suggested by their lack of offset across the earlier lineaments). The mostly sinistral strike-slip features, however, could involve the coeval reactivation of steeply dipping D2 sinistral features within an extensional setting. Associated with these features, some lineaments also have limited horizontal offsets of the magnetic fabric over the D3 lineaments (Fig. 2bII). Regionally, this relates to Jurassic–Cretaceous extension and exhumation, with regional rifting and basin development (Fig. 12), leading to numerous Cretaceous basins (including the Møre and Vøring basins) (Faleide et al., 2008; Peron-Pinvidic and Osmundsen, 2018).
The second group of structures, particularly the steeply W-dipping ∼ N–S-striking reverse faults, indicate ∼ E–W shortening. This corresponds to gentle folds (N–S-oriented fold axes) in the Mesozoic basin rocks in the Edøyfjorden basin (Bøe and Bjerkli, 1989). The steep NNW–SSE and N–S significant structures (large red circles in the D3 “All planes” stereonets in Fig. 3) and the shallowly SE-/W-dipping thrusts 3D-modelled in Fig. 8a are also associated with this setting. Geometrically, these folds indicate Late Mesozoic dextral transpressional conditions after dip-slip faulting on the HSF/MTFC, with ∼ E–W shortening of the basin sediments (Bøe and Bjerkli, 1989). Watts et al. (2023), however, associated the late dextral strike-slip kinematics with zeolite–calcite mineralisations on the VF (less distinct on the HSF; D4 in this study).
The D4 zeolite and calcite structures were not dated in this study (Table 2; Figs. 9d and 11). However, these veins would have formed after ∼75 Ma, owing to crosscutting relationships (Fig. 9d). Tartaglia et al. (2023) and Watts et al. (2023) noted similar zeolite–calcite mineralisation in other parts of the margin (Hitra and Runde islands) and on the Fosen peninsula associated with the VF (only locally along the HSF). This mineralisation has been attributed to (I) earlier Mesozoic dextral strike-slip to transpressional faulting related to the N–S folds in the Edøyfjorden basin (D3 structures; this study) and (II) later extensional dip-slip faulting on the HSF post-dating the zeolite–calcite features (Watts et al., 2023) or (III) Late Cretaceous extension in the distal part of the rift margin (Gernigon et al., 2020; Tartaglia et al., 2023). The D4 NNE–SSW and ENE–WSW sinistral/dextral faults and associated L1 and L3 lineaments may therefore preserve evidence of the earlier D3 Mesozoic (Jurassic) dextral strike-slip movement on the MTFC, and the NNE–SSW to NE–SW normal features (dipping ESE/W), with corresponding L1 and L4 lineaments, are attributed to a later D4 Cretaceous to Late Cretaceous (NW–SE) extension.
Representing the last Cretaceous–Palaeocene deformation episode, the D5 quartz–calcite veins (Figs. 5f and 6h, i) are similar to calcite veins U–Pb dated in western Norway and the WGR (Hestnes et al., 2023). Different veins oriented NE–SW yielded ages between ∼90 and ∼80 Ma, associated with Cretaceous reactivation of the MTFC; ∼ NW–SE (and NE–SW) veins formed between ∼70 to 60 Ma, associated with regional uplift possibly related to the doming of the proto-Icelandic plume; and NE–SW veins forming <50 Ma, associated with different Cenozoic extensional processes (lithospheric flexure and uplift from far-field tectonic stresses) (Hestnes et al., 2023).
The D5 structures, mostly normal dip-slip features or tensile veins, strike NE–SW (dipping steeply to moderately NW/SE) and NW–SE (steeply NE-dipping) (Fig. 3) and correspond to the L3, L4, and late L1 lineaments. These structures and lineaments are mostly late reactivations of older features and are present in all parts of Smøla and SE of the MTFC (HSF) in the WGR (Fig. 12). Overall, they suggest an ∼ E–W to NE–SW crustal extension. Similar to these D5 structures, and likewise indicating a late timing for D5, Bøe and Bjerkli (1989) also documented NW–SE-striking normal faults (SW-/NE-dipping) offsetting Mesozoic sediments within the Edøyfjorden basin. Based on geometry and timing, the D4 and D5 structures potentially relate to both a Cretaceous reactivation of the MTFC and the Cretaceous–Palaeocene rifting preceding the break-up of Greenland and Norway (Faleide et al., 2008). Importantly, the D4 and D5 features are sub-parallel to extensional structures offshore, particularly to the Klakk Fault Complex on the western side of the Frøya High and the Halten Terrace, as well as the Høybakken Detachment (HD) to the NW of Hitra and Frøya, suggesting a temporal and genetic association.
5.2 Smøla as an analogue for similar offshore basement volumes
Smøla island represents an ideal onshore analogue for offshore basement highs in the area. The Frøya High, offshore Norway, as an example (owing to it having similar basement rocks to Smøla), is likewise bound by major structures such as the Klakk Fault Complex, a major west-dipping extensional fault zone (Muñoz-Barrera et al., 2020). The Frøya High experienced a comparable polyphase deformation related to crustal stretching and thinning from the mid-Carboniferous to the Late Cretaceous–Palaeocene rifting (Faleide et al., 2008, 2015; Peron-Pinvidic and Osmundsen, 2018). To unravel its complex tectonic history, this structural high would therefore require a similar approach as our Smøla study. Although numerous drill holes have been completed along the mid-Norwegian margin, with at least three drill holes on Frøya (e.g. Slagstad et al., 2008; Bunkholt et al., 2022), the quality of the drill hole material is poor (only rock cuttings or rock plugs) (Muñoz-Barrera et al., 2020). Similarly, margin-wide geophysical (magnetic, gravity, and 2D or 3D seismic reflection surveys) datasets are also available (Skilbrei et al., 2002; Muñoz-Barrera et al., 2020), but most will only afford the ability to interpret at or above the seismic resolution scale. The advantage, therefore, of using an onshore analogue such as Smøla is the access and the availability of numerous datasets without these limitations.
Moreover, investigating fractured and weathered basement is crucial for understanding basement-hosted oil and gas reservoirs or fluid pathways (Trice et al., 2022; Trice, 2014). The petrophysical attributes of various deformation features associated with the D1 to D5 episodes could significantly impact fluid migration or storage. As these features exhibit crosscutting relationships and different orientation trends, structural permeability anisotropy is clearly present in the Smøla basement volume. Therefore, using an onshore analogue to produce high-resolution structural characterisations aided by the absolute time dimension may be crucial in the future understanding of basement-hosted plays offshore.
The integration of various methodologies and data types including multiscalar geophysical, drill core, outcrop, 3D modelling, microstructural data, and geochronological results give the following key conclusions:
- 1.
From regional to microscale evidence, we have identified five distinct tectonic episodes since the Devonian affecting Smøla associated with specific mineral assemblages and structural trends (Fig. 12). These are as follows:
- I.
The earliest D1 episode is associated with epidote–prehnite syn- to post-Devonian ENE–WSW-striking (sub-vertical to steep SSE dips) tensile veins and sinistral strike-slip features from brittle sinistral transtension along the MTFC. A later ∼ N–S contraction resulted in NW–SE (moderate to shallow NE dips) normal features and ∼ NNW–SSE to NNE–SSW (steep ∼ E dips) strike-slip features.
- II.
The D2 sericite–chlorite–calcite structures document two brittle–ductile phases, first during the Carboniferous (∼300 Ma) and later during the Late Triassic–Early Jurassic (∼204–196 Ma). The first phase accommodated sinistral strike-slip/transtension along the MTFC associated with ∼ E–W and NE–SW sinistral strike-slip features (moderate to steep ∼ N, SSW, and NW dips), ∼ N–S normal faults (moderate to steep W dips), and ENE–WSW reverse faults (steep SSE dips). The second phase involved possible dextral strike-slip along the MTFC (with local transpression related to a restraining bend east of the Edøyfjorden basin) associated with ENE–WSW dextral strike-slip features (steep SSE dips), ∼ N–S reverse faults (steep E dips), and ∼ E–W to NE–SW normal features (moderate to steep ∼ N/S to SE dips).
- III.
The D3 chloritic–hematite breccias and gouges are due to Cretaceous (∼128–100 Ma) WNW–ESE to NW–SE extension and half-graben development and are coeval with Edøyfjorden basin sediment infill. This episode is characterised by mostly dip-slip normal to oblique–normal features striking NNE–SSW (steep W dips) and NE–SW (moderate to steep SE dips), with ∼ ENE–WSW-oriented sinistral features (moderate to steep NNE and SE dips) and the ∼ NW–SE reverse faults (moderate to steep ENE and SSW dips). A possible later ∼ E–W shortening during dextral transpression on the MTFC also caused ∼ N–S trending folds within Mesozoic sediments (Edøyfjorden basin) and ∼ N–S-striking D3 reverse faults (steep W dips).
- IV.
The D4 hematite–zeolite–calcite structures form after ∼75 Ma and are associated with NNE–SSW- to NE–SW-striking normal dip-slip faults and tensile veins (moderate to steep ESE/SE and W dips). These structures developed during the Cretaceous to Late Cretaceous ∼ E–W crustal extension. Additionally, D4 may have accommodated a late Mesozoic dextral strike-slip movement on the MTFC, which is related to NNE–SSW- and ENE–WSW-striking sinistral/dextral features (moderate to steep ESE/NNW dips).
- V.
D5, a possible Cretaceous to Paleogene episode is associated with NE–SW (moderate to steep NW/SE dips) and NW–SE (steep NE dips) quartz–calcite shear (normal dip-slip) and tensile veins. These veins crosscut all previous deformation features. The D5 features are likely to have formed during continued ∼ E–W/NE–SW crustal extension related to the reactivation of the MTFC and the rifting preceding the Greenland–Norway break-up.
- I.
- 2.
Using the drill logging results and the temporal constraints of this study, 3D modelling has revealed the complex geometric characteristics of basement deformation. The modelling allowed several deformation zones to be modelled, with four zones correlated between the BH1 and BH2 characterised by epidote veins (D1), chlorite–sericite foliated gouge (D2), chlorite–hematite breccia (D3), and zeolite–calcite veins (D4). For comparison, models were produced at scales of 100, 10, and 1 m based on D2–D4, D5, and D1 features. These models highlight how the D2 structures possess the greatest size/strike extents, and the D1 features are the most localised. Additionally, the modelling provides indications that some of the zones (D2 and D4) can be linked to adjacent major structures, such as inclined splays from the nearby major E–W structures.
This study presents a method for understanding the tectonic evolution and structural characterisation of basement volumes with complex geological histories. The approach used could be valuable for studying offshore structures, such as the Frøya High, and other fracture-hosted unconventional hydrocarbon reservoirs associated with basement highs.
Relevant data analysed, including lineament shapefiles, field, drill, structural, and XRD and K–Ar geochronology data, are available at Mendeley Data via https://doi.org/10.17632/2nmr2cz9yy.3 (Hodge, 2024).
The supplement related to this article is available online at: https://doi.org/10.5194/se-15-589-2024-supplement.
MH undertook conceptualisation, data collection, sample collection, data curation, formal analysis, investigation, validation, writing (original draft and review and editing), and figure preparation. GVK did the conceptualisation, data collection, sample collection, writing (final draft), and editing. JK acquired funding, did the conceptualisation, contributed to the final draft, and reviewed the paper. RvdL undertook the sample collection and K–Ar geochronology laboratory analyses. JS did the XRD, and K–Ar geochronology laboratory analyses, writing (final draft), and editing. ØN performed data collection and writing (final draft and review and editing). MB managed the drilling on Smøla island. AN undertook data collection and writing (final draft and review and editing). GV obtained funding, administrated the project in Bologna, performed early conceptualisation of the study, contributed to data and sample collection, acted as the doctoral project supervisor, and contributed to the writing (final draft and review and editing).
The contact author has declared that none of the authors has any competing interests.
Publisher's note: Copernicus Publications remains neutral with regard to jurisdictional claims made in the text, published maps, institutional affiliations, or any other geographical representation in this paper. While Copernicus Publications makes every effort to include appropriate place names, the final responsibility lies with the authors.
We thank all the BASE colleagues for the continuous discussion and constructive input. The NGU petrography laboratory is thanked for the assistance in the preparation of the thin sections. All the colleagues at the University of Bologna are specially thanked for their continual support and encouragement. Also, we would like to express our sincere appreciation to the two reviewers, Alessandro Petroccia and Deta Gasser, for their constructive input during the review process.
This research has been supported by the ongoing BASE 3 project (BASE – Basement fracturing and weathering on- and offshore Norway); and the Research Council of Norway (Norges Forskningsråd), grant no. 319849. BASE is a joint research project launched and steered by the Geological Survey of Norway (NGU), with the industry partners Equinor ASA, Lundin Norway AS, AkerBP ASA, Spirit Energy Norway AS, and Wintershall Dea Norway AS, and the Norges Forskningsråd (NFR).
This paper was edited by Stefano Tavani and reviewed by Alessandro Petroccia and Deta Gasser.
Belaidi, A., Bonter, D. A., Slightam, C., and Trice, R. C.: The Lancaster Field: Progress in opening the UK's fractured basement play, Petrol. Geol. Conf. Proc., 8, 385–398, https://doi.org/10.1144/PGC8.20, 2018.
Blenkinsop, T., Doyle, M., and Nugus, M.: A unified approach to measuring structures in orientated drill core, in: Geological Society Special Publication, vol. 421, Geological Society of London, 99–108, https://doi.org/10.1144/SP421.1, 2015.
Bøe, R. and Bjerkli, K.: Mesozoic sedimentary rocks in Edøyfjorden and Beitstadfjorden, Central Norway: Implications for the structural history of the Møre-Trøndelag Fault Zone, Mar. Geol., 87, 287–299, https://doi.org/10.1016/0025-3227(89)90066-2, 1989.
Bøe, R., Atakan, K., and Sturt, B. A.: The style of deformation in on Hitra and Smøla. Central, Norges geologiske undersøkelse Bulletin, 414, 1–19, 1989.
Bruton, D. L. and Bockelie, J. F.: The Ordovician Sedimentary Sequence on Smøla, West Central Norway, Norges geologiske undersøkelse Bulletin, 348, 21–31, 1979.
Bunkholt, H. S. S., Oftedal, B. T., Hansen, J. A., Løseth, H., and Kløvjan, O. S.: Trøndelag Platform and Halten–Dønna Terraces Composite Tectono-Sedimentary Element, Norwegian Rifted Margin, Norwegian Sea, Geological Society, London, Memoirs, M57–2017, https://doi.org/10.1144/m57-2017-13, 2022.
Corfu, F., Andersen, T. B., and Gasser, D.: The Scandinavian Caledonides: Main features, conceptual advances and critical questions, Geol. Soc. Spec. Publ., 390, 9–43, https://doi.org/10.1144/SP390.25, 2014.
Cunningham, W. D. and Mann, P.: Tectonics of strike-slip restraining and releasing bends, Geol. Soc. Lond. Spec. Publ., 290, 1–12, https://doi.org/10.1144/SP290.1, 2007.
Davids, C., Wemmer, K., Zwingmann, H., Kohlmann, F., Jacobs, J., and Bergh, S. G.: K-Ar illite and apatite fission track constraints on brittle faulting and the evolution of the northern Norwegian passive margin, Tectonophysics, 608, 196–211, https://doi.org/10.1016/j.tecto.2013.09.035, 2013.
Drake, H., Tullborg, E. L., and Page, L.: Distinguished multiple events of fracture mineralisation related to far-field orogenic effects in Paleoproterozoic crystalline rocks, Simpevarp area, SE Sweden, Lithos, 110, 37–49, https://doi.org/10.1016/J.LITHOS.2008.12.003, 2009.
Faleide, J. I., Tsikalas, F., Breivik, A. J., Mjelde, R., Ritzmann, O., Engen, Ø., Wilson, J., and Eldholm, O.: Structure and evolution of the continental margin off Norway and the Barents Sea, International Union of Geological Sciences, 31, 82–91, https://doi.org/10.18814/epiiugs/2008/v31i1/012, 2008.
Faleide, J. I., Bjørlykke, K., and Gabrielsen, R. H.: Geology of the Norwegian Continental Shelf, in: Petroleum Geoscience: From Sedimentary Environments to Rock Physics, edited by: Bjørlykke, K., Springer, Berlin, Heidelberg, 603–637, https://doi.org/10.1007/978-3-642-34132-8_25, 2015.
Fediuk, F. and Siedlecki, S.: Smøla. Description of the geological map (AMS-M 711) 1321 I – 1:50 000, Universitetsforlaget, 1–26, https://hdl.handle.net/11250/2675044 (last access: 1 December 2023), 1977.
Fossen, H.: The role of extensional tectonics in the Caledonides of South Norway, J Struct Geol, 14, 1033–1046, 1992.
Fossen, H.: Extensional tectonics in the North Atlantic Caledonides: A regional view, Geol. Soc. Spec. Publ., 335, 767–793, https://doi.org/10.1144/SP335.31, 2010.
Fossen, H., Khani, H. F., Faleide, J. I., Ksienzyk, A. K., and Dunlap, W. J.: Post-Caledonian extension in the West Norway-northern North Sea region: The role of structural inheritance, in: Geological Society Special Publication, vol. 439, Geological Society of London, 465–486, https://doi.org/10.1144/SP439.6, 2017.
Fossen, H., Ksienzyk, A. K., Rotevatn, A., Bauck, M. S., and Wemmer, K.: From widespread faulting to localised rifting: Evidence from K-Ar fault gouge dates from the Norwegian North Sea rift shoulder, Basin Res., 33, 1934–1953, https://doi.org/10.1111/bre.12541, 2021.
Fredin, O., Viola, G., Zwingmann, H., Sørlie, R., Brönner, M., Lie, J. E., Grandal, E. M., Müller, A., Margreth, A., Vogt, C., and Knies, J.: The inheritance of a Mesozoic landscape in western Scandinavia, Nat. Commun., 8, 14879, https://doi.org/10.1038/ncomms14879, 2017.
Gautneb, H.: Structure, age and formation of dykes on the island of Smøla, Central Norway, Norsk Geologisk Tidsskrift, 68, 275–288, 1988.
Gautneb, H. and Roberts, D.: Geology and petrochemistry of the Smøla-Hitra batholith, Central Norway, Norges geologiske undersøkelse Bulletin, 416, 1–24, 1989.
Gee, D. G., Fossen, H., Henriksen, N., and Higgins, A. K.: From the Early Paleozoic Platforms of Baltica and Laurentia to the Caledonide Orogen of Scandinavia and Greenland, International Union of Geological Sciences, 31, 44–51, https://doi.org/10.18814/epiiugs/2008/v31i1/007, 2008.
Gernigon, L., Franke, D., Geoffroy, L., Schiffer, C., Foulger, G. R., and Stoker, M.: Crustal fragmentation, magmatism, and the diachronous opening of the Norwegian-Greenland Sea, Earth-Sci. Rev., 206, 102839, https://doi.org/10.1016/J.EARSCIREV.2019.04.011, 2020.
Gillespie, P. A., Holdsworth, R. E., Long, D., Williams, A., and Gutmanis, J. C.: Introduction: geology of fractured reservoirs, J. Geol. Soc. Lond., 178, jgs2020-197, https://doi.org/10.1144/jgs2020-197, 2020.
Grønlie, A. and Roberts, D.: Resurgent strike-slip duplex development along the Hitra-Snåsa and Verran Faults, Møre-trøndelag fault zone, Central Norway, J. Struct. Geol., 11, 295–305, https://doi.org/10.1016/0191-8141(89)90069-2, 1989.
Grønlie, A., Naeser, C. W., Naeser, N. D., Mitchell, J. G., Sturt, B. A., and Ineson, P. R.: Fission-track and K-Ar dating of tectonic activity in a transect across the Møre-Trøndelag Fault Zone, central Norway, Norsk Geologisk Tidsskrift, 74, 24–34, 1994.
Hartz, E. H., B. Martinsen, B., Øverli, P. E., Lie, H., Ditcha, E. M., Schmid, D. W., and Medvedev, S.: Newly Discovered Giant Oil Fields of North Sea – The Role of Fractured Basement Highs, in: Conference Proceedings, First EAGE/SBGf Workshop 2013, Rio de Janeiro – Fractures in Conventional and Unconventional Reservoirs, November 2013, European Association of Geoscientists & Engineers, https://doi.org/10.3997/2214-4609.20131805, 2013.
Hestnes, Å., Gasser, D., Scheiber, T., Jacobs, J., van der Lelij, R., Schönenberger, J., and Ksienzyk, A. K.: The brittle evolution of Western Norway – A space-time model based on fault mineralizations, K–Ar fault gouge dating and paleostress analysis, J. Struct. Geol., 160, 104621, https://doi.org/10.1016/J.JSG.2022.104621, 2022.
Hestnes, Å., Drost, K., Sømme, T. O., Gasser, D., Scheiber, T., Linge, H., Chew, D., and Jacobs, J.: Constraining the tectonic evolution of rifted continental margins by U-Pb calcite dating, Sci. Rep., 13, 7876, https://doi.org/10.1038/s41598-023-34649-z, 2023.
Hodge, M: Datasets for “Multiscalar 3D-temporal structural characterisation of Smøla Island, Mid-Norwegian passive margin” Authored by Hodge et al., V3, Mendeley Data [data set], https://doi.org/10.17632/2nmr2cz9yy.3, 2024.
Holcombe, R.: Oriented Drillcore: Measurement, Conversion and QA/QC Procedures for Structural and Exploration Geologists, https://www.holcombe.net.au/downloads/HCOVG_oriented_core_procedures.pdf (last access: 15 March 2022), 2013.
Holdsworth, R. E., McCaffrey, K. J. W., Dempsey, E., Roberts, N. M. W., Hardman, K., Morton, A., Feely, M., Hunt, J., Conway, A., and Robertson, A.: Natural fracture propping and earthquake-induced oil migration in fractured basement reservoirs, Geology, 47, 700–704, https://doi.org/10.1130/G46280.1, 2019.
Indrevær, K., Stunitz, H., and Bergh, S. G.: On Palaeozoic–Mesozoic brittle normal faults along the SW Barents Sea margin: Fault processes and implications for basement permeability and margin evolution, J. Geol. Soc. Lond., 171, 831–846, https://doi.org/10.1144/jgs2014-018, 2014.
Kendrick, M. A., Eide, A., Roberts, D., and Osmundsen, P. T.: The Middle to Late Devonian Høybakken detachment, central Norway: 40Ar–39Ar evidence for prolonged late/post-Scandian extension and uplift, Geol. Mag., 141, 329–344, https://doi.org/10.1017/S0016756803008811, 2004.
Kim, Y. S., Peacock, D. C. P., and Sanderson, D. J.: Fault damage zones, J. Struct. Geol., 26, 503–517, https://doi.org/10.1016/J.JSG.2003.08.002, 2004.
Knies, J., Schönenberger, J., Zwingmann, H., van der Lelij, R., Smelror, M., Vullum, P. E., Brönner, M., Vogt, C., Fredin, O., Müller, A., Grasby, S. E., Beauchamp, B., and Viola, G.: Continental weathering and recovery from ocean nutrient stress during the Early Triassic Biotic Crisis, Commun. Earth Environ., 3, 161, https://doi.org/10.1038/s43247-022-00480-z, 2022.
Ksienzyk, A. K., Wemmer, K., Jacobs, J., Fossen, H., Schomberg, A. C., Süssenberger, A., Lünsdorf, N. K., and Bastesen, E.: Post-Caledonian brittle deformation in the Bergen area, West Norway: results from K–Ar illite fault gouge dating, Norweg. J. Geol., 96, 275–299, https://doi.org/10.17850/njg96-3-06, 2016.
Levy, S. and Woldegabriel, G.: Ion Exchange and Dehydration Effects on Potassium and Argon Contents of Clinoptilolite, MRS Proc., 412, 791, https://doi.org/10.1557/PROC-412-791, 1995.
Mosar, J., Eide, E. A., Osmundsen, P. T., Sommaruga, A., and Torsvik, T. H.: Greenland – Norway separation: A geodynamic model for the North Atlantic, Norweg. J. Geol., 82, 282–299, 2002.
Muñoz-Barrera, J. M., Rotevatn, A., Gawthorpe, R. L., Henstra, G. A., and Kristensen, T. B.: The role of structural inheritance in the development of high-displacement crustal faults in the necking domain of rifted margins: The Klakk Fault Complex, Frøya High, offshore mid-Norway, J. Struct. Geol., 140, 104163, https://doi.org/10.1016/j.jsg.2020.104163, 2020.
Nasuti, A., Olesen, O., Baranwal, O., and Dumais, M.: Compilation of aeromagnetic data, in: Coop Phase 2 – Crustal Onshore-Offshore Project. NGU confidential Report, vol. 063, edited by: Olesen, O., Baranwal, O., Brönner, M., Dalsegg, E., Dumais, M., A., Gellein, J., Gernigon, L., Heldal, T., Larsen, B., E., Lauritsen, T., Lutro, O., Maystrenko, Y., Nasuti, A., Roberts, D., Rueslåtten, H., Rønning, J. S., Slagstad, T., Solli, A., and Stampolidis, A., Norges geologiske undersøkelse, 11–24, https://hdl.handle.net/11250/3059840 (last access: 1 July 2023), 2015.
Olsen, E., Gabrielsen, R. H., Braathen, A., and Redfield, T. F.: Fault systems marginal to the Møre-Trøndelag Fault Complex, Osen-Vikna area, Central Norway, Norweg. J. Geol., 87, 59–73, 2007.
Olesen, O., Rueslåtten, H. G., Schönenberger, J., Smelror, M., van der Lelij, R., Larsen, B. E., Olsen, L., Baranwal, V., Bjørlykke, A., and Brönner, M.: Jurassic heritance of the geomorphology in Mid Norway, Norweg. J. Geol., 103, 1–52, https://doi.org/10.17850/njg103-3-2, 2023.
Osmundsen, P. T., Eide, E. A., Haabesland, N. E., Roberts, D., Andersen, T. B., Kendrick, M., Bingen, B., Braathen, A., and Redfield, T. F.: Kinematics of the Høybakken detachment zone and the Møre–Trøndelag Fault Complex, central Norway, J. Geol. Soc. Lond., 163, 303–318, https://doi.org/10.1144/0016-764904-129, 2006.
Passchier, C. W. and Trouw, R. A. J.: Microtectonics, in: 2nd Edn., Springer Science & Business Media, Berlin, ISBN 978-3-540-64003-5, 2005.
Peron-Pinvidic, G. and Osmundsen, P. T.: The Mid Norwegian – NE Greenland conjugate margins: Rifting evolution, margin segmentation, and breakup, Mar. Petrol. Geol., 98, 162–184, https://doi.org/10.1016/j.marpetgeo.2018.08.011, 2018.
Peron-Pinvidic, G. and Osmundsen, P. T.: From orogeny to rifting: insights from the Norwegian `reactivation phase', Sci. Rep., 10, 14860, https://doi.org/10.1038/s41598-020-71893-z, 2020.
Peron-Pinvidic, G., Manatschal, G., and Osmundsen, P. T.: Structural comparison of archetypal Atlantic rifted margins: A review of observations and concepts, Mar. Petrol. Geol., 43, 21–47, https://doi.org/10.1016/J.MARPETGEO.2013.02.002, 2013.
Redfield, T. F., Torsvik, T. H., Andriessen, P. A. M., and Gabrielsen, R. H.: Mesozoic and Cenozoic tectonics of the Møre Trøndelag Fault Complex, central Norway: constraints from new apatite fission track data, Phys. Chem. Earth Pt. A/B/C, 29, 673–682, https://doi.org/10.1016/j.pce.2004.03.005, 2004.
Riber, L., Dypvik, H., and Sørlie, R.: Altered basement rocks on the Utsira High and its surroundings, Norwegian North Sea, Norweg. J. Geol., 95, 57–89, 2015.
Roberts, D.: Petrochemistry and palaeogeographic setting of the Ordovician volcanic rocks of Smøla, central Norway, Norges geologiske undersøkelse Bulletin, 359, 43–60, 1980.
Roberts, D. and Gee, D. G.: An introduction to the structure of the Scandinavian Caledonides, The Caledonian Orogen – Scandinavia and Related Areas, edited by: Gee, D. G. and Sturtt, B. A., John Wiley and Sons, New York, 55–68, ISBN 047110504X, 1985.
Rønning, J. S. and Elvebakk, H.: Onshore-Offshore Resistivity studies. Basement resistivity at the Frøya High, NGU Report 2005.032, Norges geologiske undersøkelse, https://hdl.handle.net/11250/2664989 (last access: 15 May 2023), 2005.
Scheiber, T. and Viola, G.: Complex Bedrock Fracture Patterns: A Multipronged Approach to Resolve Their Evolution in Space and Time, Tectonics, 37, 1030–1062, https://doi.org/10.1002/2017TC004763, 2018.
Scheiber, T., Viola, G., Wilkinson, C. M., Ganerød, M., Skår, Ø., and Gasser, D.: Direct 40Ar/39Ar dating of Late Ordovician and Silurian brittle faulting in the southwestern Norwegian Caledonides, Terra Nova, 28, 374–382, https://doi.org/10.1111/ter.12230, 2016.
Scheiber, T., Viola, G., van der Lelij, R., Margreth, A., and Schönenberger, J.: Microstructurally-constrained versus bulk fault gouge K-Ar dating, J. Struct. Geol., 127, 103868, https://doi.org/10.1016/j.jsg.2019.103868, 2019.
Seequent, T. B. S. C.: Leapfrog Works, https://www.seequent.com/products-solutions/leapfrog-works/ (last access: 23 September 2023), 2022.
Seranne, M.: Late Paleozoic kinematics of the Møre-Trøndelag Fault Zone and adjacent areas, central Norway, Norsk Geologisk Tidsskrift, 72, 141–158, 1992.
Sherlock, S. C., Watts, L. M., Holdsworth, R. E., and Roberts, D.: Dating fault reactivation by Ar/Ar laserprobe: an alternative view of apparently cogenetic mylonite–pseudotachylite assemblages, J. Geol. Soc. Lond., 161, 335–338, https://doi.org/10.1144/0016-764903-160, 2004.
Skilbrei, J. R., Olesen, O., Osmundsen, P. T., Kihle, O., Aaro, S., and Fjellanger, E.: A study of basement structures and onshore-offshore correlations in Central Norway, Norweg. J. Geol., 82, 263–279, 2002.
Slagstad, T. and Kirkland, C. L.: Timing of collision initiation and location of the Scandian orogenic suture in the Scandinavian Caledonides, Terra Nova, 30, 179–188, https://doi.org/10.1111/ter.12324, 2018.
Slagstad, T., Ramstad, R. K., Davidsen, B., and Barrére, C.: Petrophysical and thermal properties of pre-Devonian basement rocks on the Norwegian continental margin, Norges geologiske undersøkelse Bulletin, https://hdl.handle.net/11250/2674269 (last access: 12 April 2023), 2008.
Slagstad, T., Davidsen, B., and Stephen Daly, J.: Age and composition of crystalline basement rocks on the Norwegian continental margin: Offshore extension and continuity of the Caledonian-Appalachian orogenic belt, J. Geol. Soc. Lond., 168, 1167–1185, https://doi.org/10.1144/0016-76492010-136, 2011.
Tanner, D. C., Buness, H., Igel, J., Günther, T., Gabriel, G., Skiba, P., Plenefisch, T., Gestermann, N., and Walter, T. R.: Fault detection, Understanding Faults: Detecting, Dating, and Modelling, 2020, 81–146, https://doi.org/10.1016/B978-0-12-815985-9.00003-5, 2020.
Tartaglia, G., Viola, G., van der Lelij, R., Scheiber, T., Ceccato, A., and Schönenberger, J.: “Brittle structural facies” analysis: A diagnostic method to unravel and date multiple slip events of long-lived faults, Earth Planet. Sc. Lett., 545, 116420, https://doi.org/10.1016/j.epsl.2020.116420, 2020.
Tartaglia, G., Ceccato, A., Scheiber, T., van der Lelij, R., Schönenberger, J., and Viola, G.: Time-constrained multiphase brittle tectonic evolution of the onshore mid-Norwegian passive margin, GSA Bull., 135, 621–642, https://doi.org/10.1130/b36312.1, 2023.
Terzaghi, R. D.: Sources of Error in Joint Surveys, Géotechnique, 15, 287–304, https://doi.org/10.1680/geot.1965.15.3.287, 1965.
Torgersen, E., Arntsen, M. L., Bingen, B., Gasser, D., Gunleiksrud, I. H., and Nilsson, C.: Bedrock map of Norway, 1:1 350 000, Norges Geologiske Undersøkelse, Trondheim, Norway, 2021.
Trice, R.: Basement exploration, West of Shetlands: Progress in opening a new play on the UKCS, Geol. Soc. Spec. Publ., 397, 81–105, https://doi.org/10.1144/SP397.3, 2014.
Trice, R., Hiorth, C., and Holdsworth, R: Fractured basement play development on the UK and Norwegian rifted margins, Geol. Soc. Lond. Spec. Publ., 495, 73–97, https://doi.org/10.1144/SP495-2018-174, 2022.
Tsikalas, F., Faleide, J. I., Eldholm, O., and Blaich, O. A.: The NE Atlantic conjugate margins, Regional Geology and Tectonics: Phanerozoic Passive Margins, Cratonic Basins and Global Tectonic Maps, 140–201, https://doi.org/10.1016/B978-0-444-56357-6.00004-4, 2012.
Tucker, R. D., Robinson, P., Solli, A., Gee, D. G., Thorsnes, T., Krogh, T. E., Nordgulen, Ø., and Bickford, M. E.: Thrusting and Extension in the Scandian Hinterland, Norway: New U-Pb Ages and Tectonostratigraphic Evidence, Am. J. Sci., 304, 477–532, 2004.
Viola, G., Venvik Ganerød, G., and Wahlgren, C.-H.: Unraveling 1.5 Ga of brittle deformation history in the Laxemar-Simpevarp area, southeast Sweden: A contribution to the Swedish site investigation study for the disposal of highly radioactive nuclear waste, Tectonics, 28, TC5007, https://doi.org/10.1029/2009TC002461, 2009.
Viola, G., Torgersen, E., Mazzarini, F., Musumeci, G., van der Lelij, R., Schönenberger, J., and Garofalo, P. S.: New Constraints on the Evolution of the Inner Northern Apennines by K-Ar Dating of Late Miocene-Early Pliocene Compression on the Island of Elba, Italy, Tectonics, 37, 3229–3243, https://doi.org/10.1029/2018TC005182, 2018.
Watts, L. M.: The walls boundary fault zone and the Møre Trøndelag fault complex: a case study of two reactivated fault zones, PhD thesis, Durham University, 550 pp., http://etheses.dur.ac.uk/3878/ (last access: 20 March 2023), 2001.
Watts, L. M., Holdsworth, R. E., Roberts, D., Sleight, J. M., and Walker, R. J.: Structural evolution of the reactivated Møre-Trøndelag Fault Complex, Fosen Peninsula, Norway, J. Geol. Soc. Lond., 180, jgs2022-139, https://doi.org/10.1144/jgs2022-139, 2023.
White, N. C.: Geological Interpretation of Aeromagnetic Data (David J. Isles and Leigh R. Rankin), Econ. Geol., 109, 1495–1496, https://doi.org/10.2113/econgeo.109.5.1495, 2014.
Wibberley, C.: Are feldspar-to-mica reactions necessarily reaction-softening processes in fault zones?, J. Struct. Geol., 21, 1219–1227, https://doi.org/10.1016/S0191-8141(99)00019-X, 1999.
Zastrozhnov, D., Gernigon, L., Gogin, I., Planke, S., Abdelmalak, M. M., Polteau, S., Faleide, J. I., Manton, B., and Myklebust, R.: Regional structure and polyphased Cretaceous-Paleocene rift and basin development of the mid-Norwegian volcanic passive margin, Mar. Petrol. Geol., 115, 104269, https://doi.org/10.1016/j.marpetgeo.2020.104269, 2020.