the Creative Commons Attribution 4.0 License.
the Creative Commons Attribution 4.0 License.
 | 28 Jun 2024
Mapping geochemical anomalies by accounting for the uncertainty of mineralization-related elemental associations
Jian Wang
Renguang Zuo
Qinghai Liu
Geochemical mapping is a fundamental tool for elucidating the distribution and behaviour of economically significant elements and providing valuable insights into geological processes. Nevertheless, the quantification of uncertainty associated with geochemical mapping has only recently become a subject of widespread concern. This study presents a procedure that primarily consists of the determination of homogeneous clusters, the recognition of elemental associations for each cluster, and the identification of geochemical anomalies, with the aim of accounting for the uncertainty of elemental association in geochemical mapping. To illustrate and validate the procedure, a case study was conducted wherein geochemical stream-sediment samples from the northwestern region of the province of Sichuan, China, were processed to map anomalies associated with disseminated gold mineralization. The results indicate that (1) the representativeness of elemental association for the underlying geological process is an important source of uncertainty for geochemical mapping; (2) the procedure presented here is effective in addressing the uncertainty of elemental associations in geochemical mapping; and (3) the study area can be classified into two clusters, each characterized by unique elemental associations that align well with the distribution of Paleozoic and Triassic lithological units, respectively. Furthermore, the region still holds great potential for the discovery of gold deposits, particularly in areas proximal to known mineralization sites.
- Article
(11120 KB) - Full-text XML
- BibTeX
- EndNote


Geochemical mapping plays a vital role in understanding geological processes, discerning the distribution and behaviour of economically significant elements, and facilitating the assessment of the environmental impact of human activities (Bölviken et al., 1990; Cocker, 1999; Pearce et al., 2005; De Vivo et al., 2008; Grunsky et al., 2009; Hou et al., 2015; Wang et al., 2016; Talebi et al., 2019a; Zuo et al., 2019; Sammon et al., 2022). For example, the mapping of Sr and Pb isotopic variations in ocean floor basalts or that of Nd and Hf isotopic variations in continental felsic igneous rocks enables the identification of geographically distinct compositional reservoirs within the deep Earth (Hart, 1984; Mole et al., 2014; Wang et al., 2023). In particular, the significance of geochemical maps in mineral exploration, which assists in making informed decisions regarding exploration priorities by identifying concentrations of valuable elements, has been widely recognized (e.g. Rose et al., 1979; Cheng, 2007; Reimann et al., 2007; Carranza, 2008; Xie et al., 2008; Reimann et al., 2016).
Geochemical mapping entails the systematic collection of geochemical samples and the processing of geochemical data through multiple steps, with the purpose of mapping spatial variations in geochemical elements and identifying anomaly patterns that may reflect critical geological processes beneath the Earth's surface (Smith and Reimann, 2008; Zuo et al., 2016, 2021a; Grunsky and de Caritat, 2020). Geochemical mapping typically involves four sequential steps: (1) identifying the indicative element or elemental association that is characteristic of the targeted geological process (e.g. mineralization), (2) predicting or simulating the spatial distribution of the indicator being studied, (3) optionally enhancing and delineating the geochemical signatures of interest, and (4) evaluating the geological significance of the geochemical signatures and their potential to indicate noteworthy geological events (Carranza, 2008; Grunsky and de Caritat, 2020; Wang and Zuo, 2022). It is important to note that the distinctive geochemical signatures of geological bodies (a.k.a. geochemical anomalies), which are produced by specific geological processes, can be frequently obscured by subsequent geological or non-geological processes prevailing at the Earth's surface (Carranza, 2008; Cheng, 2012; Talebi et al., 2019b; Yousefi et al., 2019). In addition, geological processes that occur across different spatial and temporal scales tend to interact with each other in a multiplicative way. This can result in non-linearity, heterogeneity, and a mixing of patterns in the resulting geochemical signatures (Cheng, 2012). The scale-dependent nature and potential involvement of various heterogeneous geological processes present considerable challenges for geochemical mapping, thereby imposing limitations and uncertainties onto its effectiveness in identifying relevant patterns. Properly addressing the uncertainty is hence crucial for leveraging geochemical mapping to understand geological processes and make informed decisions with regard to mineral resource prediction (Wang and Zuo, 2018, 2024; Sadeghi, 2021; Zuo et al., 2021a). Previous studies have explored certain aspects of uncertainty that arise from the aforementioned steps involved in geochemical mapping for mineral deposit discovery (Costa and Koppe, 1999; Wang and Zuo, 2018, 2022; Ersoy and Yunsel, 2019; Chen et al., 2021; Sadeghi, 2021; Liu and Carranza, 2022; H. Wang et al., 2022; Sadeghi and Cohen, 2023; Fan et al., 2024). However, there has been limited research focusing on the uncertainty associated with determining the elemental association as a proxy for the targeted geological process.
Elements tend to be associated due to their similar relative mobility in certain geological processes occurring in unique chemical and physical conditions (White, 2020). For example, copper and gold frequently occur together due to their similar geochemical behaviour and affinity for certain geological processes, such as porphyry-copper–gold mineral systems (Sillitoe, 2010). Other notable instances can be found in the elemental associations of copper–nickel–platinum group elements within magmatic sulfide mineral systems, uranium–thorium in sandstone-hosted or vein-type uranium deposits, and gold–silver–arsenic–antimony–mercury associations observed in epithermal gold mineral systems (Pirajno, 2008; Robb, 2020). Note that certain elements may maintain consistent associations across a broad range of geological conditions, whereas others may coexist during most processes in deep-seated environments but become separated in surficial environments (Rose et al., 1979). Grunsky and de Caritat (2020) emphasized that stoichiometry governs the interrelationships among elements in geochemical data, thereby giving rise to distinct structural patterns within the data. Therefore, geological processes can be recognized by a continuum of variable responses. In this context, a linear model of elements is commonly accepted as a suitable approach to capture the stoichiometry of rock-forming minerals and the subsequent processes (e.g. hydrothermal fluids and weathering) that bring about modifications in mineral structures (Grunsky and de Caritat, 2020; Grunsky et al., 2023). Multivariate statistical methods, such as principal-component analysis (PCA), are usually applied to multielement geochemical data to identify the dominant components that generally reflect features related to mineralogy and depict geological processes. For instance, Grunsky and Kjarsgaard (2016) demonstrated the usefulness of PCA in statistically identifying the distinct geochemical kimberlite phases, which lead to efficiencies in the economic evaluation of kimberlite for diamonds in Saskatchewan, Canada. Mueller and Grunsky (2016) utilized min/max autocorrelation factor analysis on till-based geochemical-survey data collected across the Melville Peninsula in Nunavut, Canada, and effectively predicted the underlying bedrock lithologies and recognized the associated glacial-transport processes. Given its remarkable capability to capture nuanced and non-linear interrelationships among model variables, machine learning has also been employed to identify significant elemental associations that can serve as representations of underlying geological processes (Zuo, 2018; Grunsky et al., 2023). For example, C. Wang et al. (2022) utilized a machine learning technique called recursive feature elimination to identify the elemental-association patterns that serve as indicators for distinct types of tin mineralization.
However, during a geochemical survey conducted within a designated area, various geological processes often manifest in distinct local regions due to differences in geological conditions, and, even within the same area, multiple processes can overlap and intertwine with each other. In a magmatic- and hydrothermal-gold mineral system (e.g. the Masara gold district in Mindanao, Philippines), for example, different types of gold mineralization can take place at different stages and locations as magmatic fluids evolve and interact with the wall rocks and outer fluids (Robb, 2020). The early high-temperature stage is characterized by porphyry-style mineralization, located in the core of the system directly above the underlying magma chamber, which primarily yields disseminated gold–copper sulfides, such as chalcopyrite, bornite, and molybdenite. In the intermediate stage, epithermal quartz–adularia–gold vein mineralization is prominent, forming a ring-shaped zone surrounding the porphyry core, which produces native gold and sulfides, e.g. pyrite, galena, and sphalerite. The late stage is typically associated with low-sulfidation epithermal mineralization, which occurs further outwards from the core and is characterized by quartz–carbonate veins with high Au Ag ratios as well as gold occurring as electrum with minerals like pyrite, marcasite, stibnite, and realgar (Pirajno, 2008). Hot-spring gold mineralization can also occur when the remaining magmatic fluids mix with meteoric water at the surface and cool further. It is important to note that the heterogeneous zonation observed in the mineral system can even be likely disrupted by structures like faults, which serve as pathways for mineralizing fluids. In such a complicated context, relying solely on a single group of elements as a proxy for underlying geological processes can inevitably lead to uncertainties in the resulting geochemical patterns. Consequently, the means of addressing the uncertainty arising from the representativeness of elemental associations in geological processes becomes a significant concern when utilizing geochemical mapping to comprehend the processes and aid in mineral resource prediction.
To mitigate the uncertainty inherent in defining elemental associations, this study introduces a workflow that utilizes fuzzy clustering to delineate homogeneous zones and further determines their respective elemental associations; this is complemented by PCA and techniques in geochemical-anomaly detection for refined geochemical mapping. To illustrate and validate the procedure, a case study was conducted using geochemical stream-sediment samples from the northwestern region of the province of Sichuan, China, with the aim of delineating anomalies associated with sediment-hosted disseminated gold mineralization.
2.1 Geological setting
The study area is situated in the northwestern region of the province of Sichuan, China, covering a longitude range of 103°4′ to 104°36′30′′ E and a latitude range of 32°40′ to 34° N (Fig. 1).
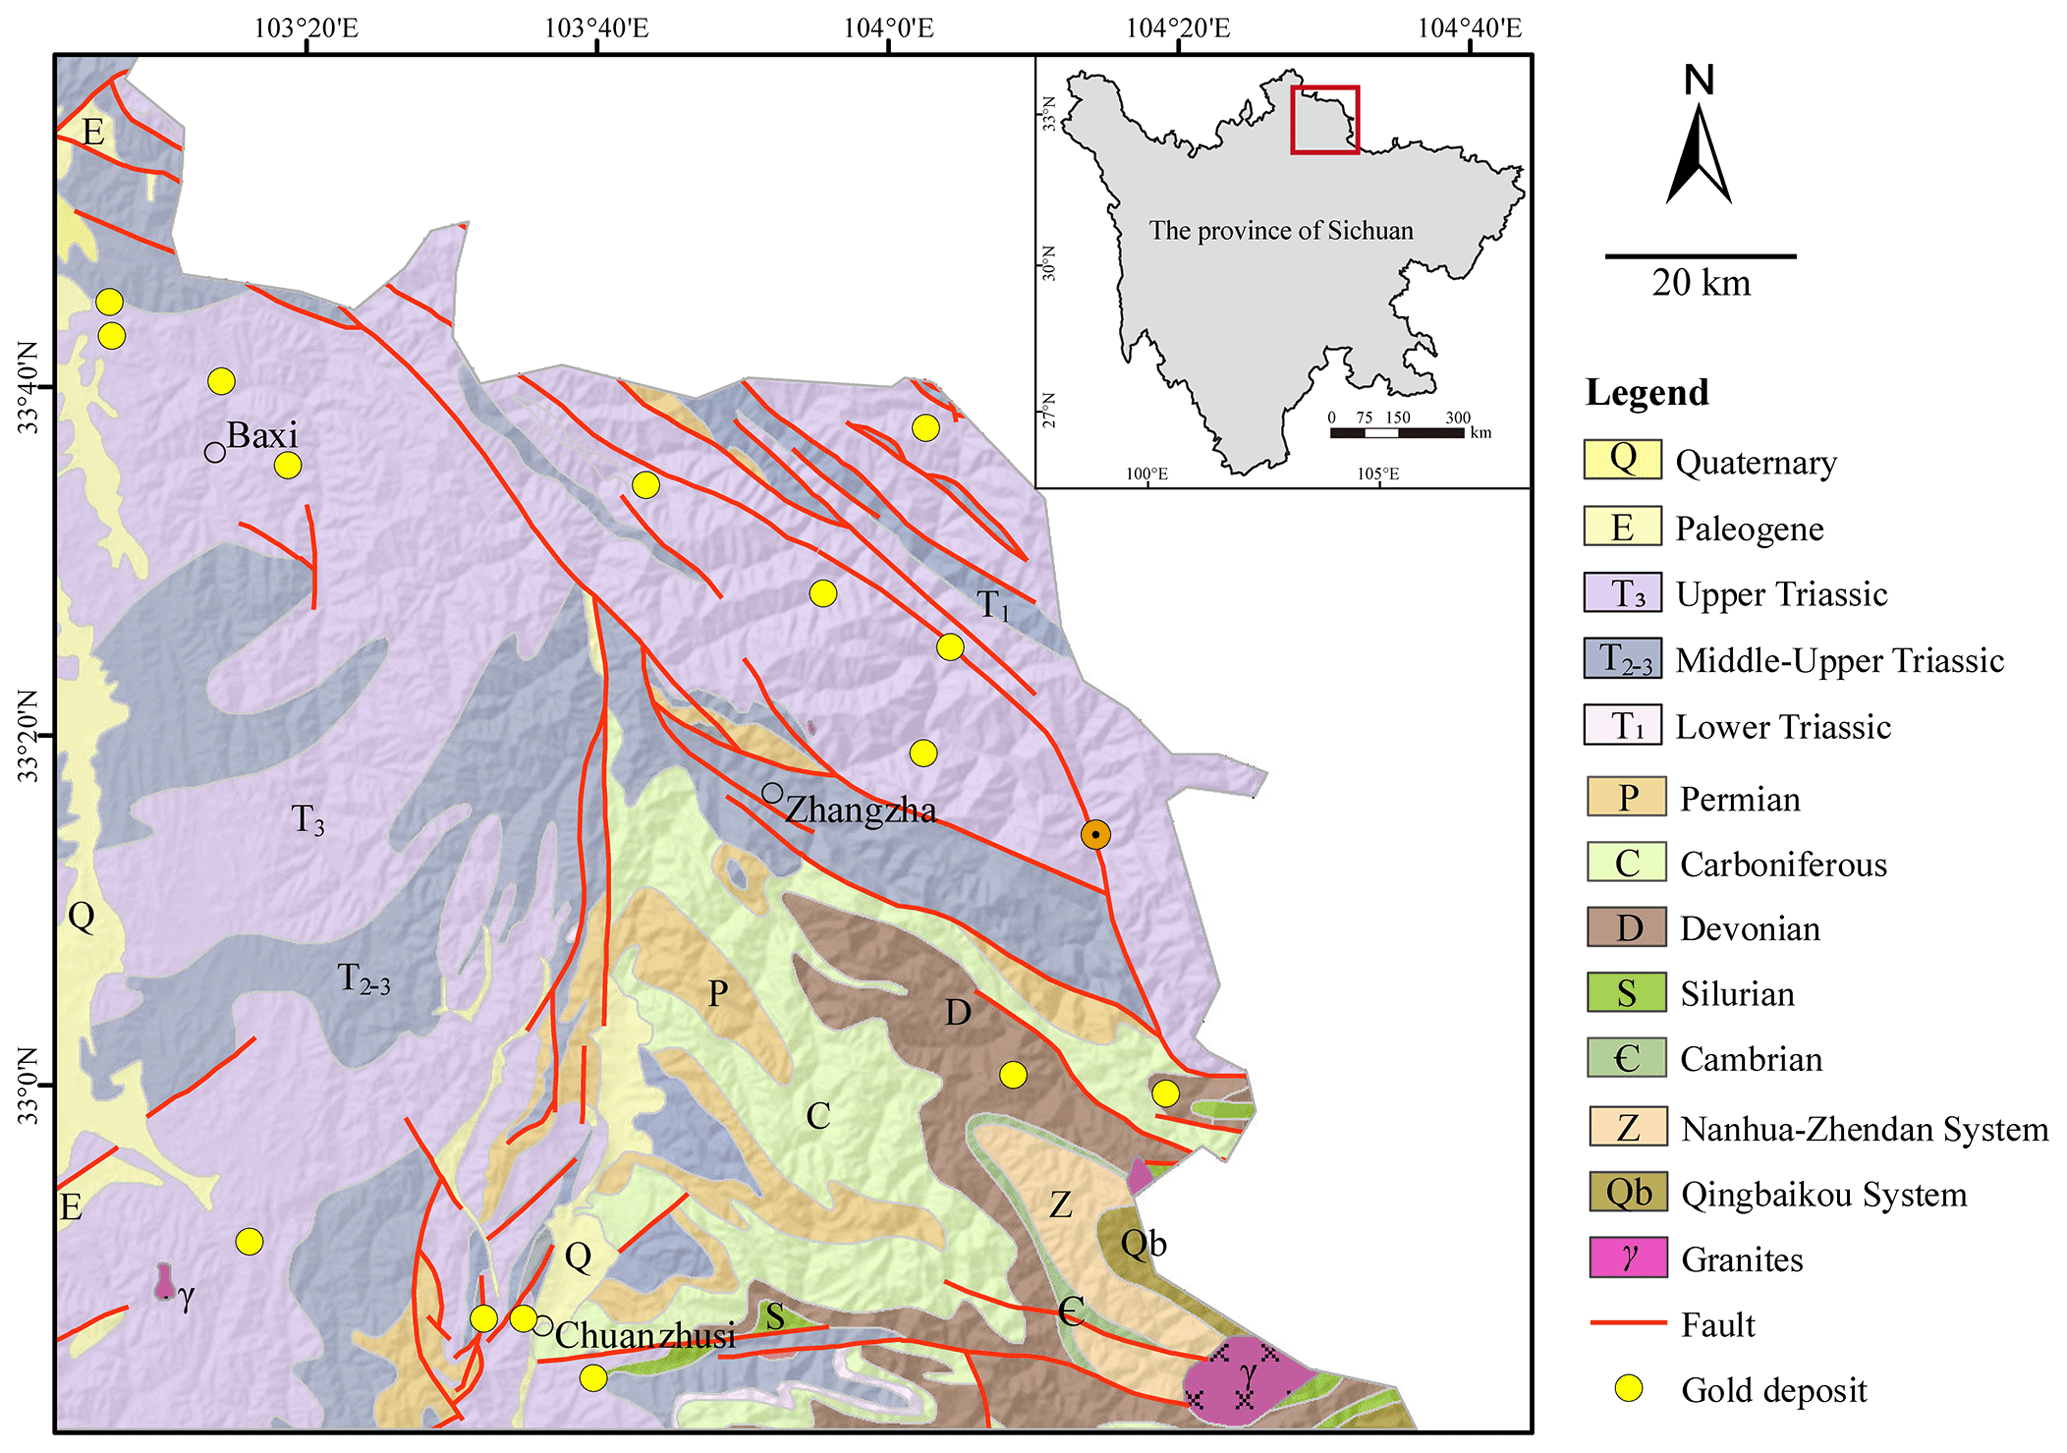
Figure 1Simplified geological map of the study area in the northwestern region of the province of Sichuan, China (after Wang and Zuo, 2022).
Located at the intersection of the Yangtze Plate, North China Plate, and Songpan–Ganzi terrane, this area has been distinguished by active tectonic and magmatic processes throughout geological histories. These long-lived crustal dynamics exert significant controls on the formation and widespread distribution of gold mineralization observed across the region. Previous studies have revealed a strong correlation between the emplacement of large gold deposits and the presence of NW–SE-extending major tectonic faults and have also noted the intersection of multiple faults and ring-shaped fault systems (e.g. Zhao, 1995; Li, 1996; Wang et al., 2003; Liu et al., 2010). In this area, one can find stratigraphic units ranging from the Proterozoic to the Cenozoic. The distribution of these units is evidently controlled by regional faults, and they are also prone to undergoing metamorphism. The Triassic strata, which cover approximately 73 % of the study area, predominate in the western and northern parts. They mainly consist of metamorphosed sandstones and slates that are interbedded with occasional volcanic rocks and limestones. These strata primarily represent sedimentary turbidite environments in shallow-sea slopes and play a significant role as the main sources of materials for gold mineralization, as demonstrated by isotopic and rare-earth-element geochemistry (Zheng et al., 1990; Chen, 1998; Wang et al., 2004; Zhang, 2014). Igneous rocks, including granites, granodiorites, and monzogranites, appear infrequently at the surface and are primarily confined to the southeastern portion of the study area. Previous studies have indicated that hypabyssal calc-alkaline igneous rocks from the late Indonesian period to the Yanshanian period play a crucial role in the generation of hydrothermal fluids and the creation of geodynamic conditions that facilitate the remobilization and concentration of gold in this region (e.g. Li, 1996; Liu et al., 2010).
The predominant type of gold deposits discovered in this area are sediment-hosted disseminated gold deposits, exemplified by the Dongbeizhai and Manaoke gold deposits. These deposits are primarily found within Triassic marine sequences. They are characterized by the presence of microscopic and/or dissolved gold as well as mineral associations for epithermal mineralization that include arsenopyrite, pyrite, and stibnite. Furthermore, studies imply that there are variations in the geological and geochemical characteristics of different gold deposits due to individual differences in tectonic settings and geological conditions. Consequently, these heterogeneities pose challenges for the processing of geochemical data (Li, 1996; Chen, 1998; Chen et al., 2004; Deng et al., 2023).
2.2 Geochemical-survey data
The geochemical data utilized in this research are derived from China's national geochemical-mapping project, which was initiated in 1979 and has played a critical role in mineral exploration in China (Xie et al., 1997). It comprises 3461 composite stream-sediment samples collected at a density of one composite sample per 4 km2. Each sample was analysed for 39 major, minor, and trace elements/oxides – i.e. Ag, As, Au, B, Ba, Be, Bi, Cd, Co, Cr, Cu, F, Hg, La, Li, Mn, Mo, Nb, Ni, P, Pb, Sb, Sn, Sr, Th, Ti, U, V, W, Y, Zn, Zr, SiO2, Al2O3, Fe2O3, K2O, Na2O, CaO and MgO. For comprehensive information regarding sample preparation, analytical methodologies, detection limits, and quality control, please refer to the works of Xie et al. (1997) and Wang et al. (2011).
3.1 The general workflow
To effectively address the uncertainty in defining elemental associations for geochemical mapping, our workflow starts by employing clustering analysis to pinpoint homogeneous regions, each presumed to be characterized by a distinct elemental association. Subsequently, it ascertains the pertinent elemental associations for each identified cluster, with the ensemble of these associations representing the uncertainty. The workflow proceeds by performing mapping of multivariate geochemical anomalies for each potential elemental association, ultimately synthesizing a comprehensive geochemical map through a linear weighting scheme based on the alternative maps. The workflow (Fig. 2) primarily consists of four consecutive parts.
-
Identifying homogeneous regions through fuzzy clustering.
Prior to cluster analysis, individual elements in a selected multivariate geochemical-survey dataset are spatially interpolated. The interpolated maps are subsequently utilized as input for the fuzzy-clustering method, commonly known as fuzzy c-means clustering, to obtain membership value maps. The number of membership value maps is equal to the number of clusters determined by optimization metrics, such as the Silhouette index (Rousseeuw, 1987), gap statistics (Tibshirani et al., 2001), and the cluster validity index (Xie and Beni, 1991). The homogeneous local regions can then be determined by the largest membership value for each grid cell.
-
Determining elemental associations for each region that serve as indicators of the underlying targeted process.
The geochemical-survey data are initially partitioned into distinct subsets based on the criteria of sample assignment to specific clusters. Subsequently, each subset of data undergoes PCA, enabling the examination of elemental associations through a biplot analysis. By identifying a distinctive set of elements for each subset, which is representative of the geological processes of interest, a comprehensive understanding of targeted geological phenomena with uncertain elemental associations can be achieved.
-
Recognizing multivariate anomalies based on each elemental association.
An algorithm for identifying geochemical anomalies, e.g. local singularity analysis by Cheng (2007) and the deep autoencoder network by Xiong and Zuo (2016), was firstly applied to the interpolated map of each element to enhance univariate-anomaly patterns. Multivariate-anomaly patterns were derived by integrating relevant univariate anomalies through PCA. For each potential elemental association linked to the underlying geological process, PCA was applied solely to the subset of elements within that assemblage. The first-principal-component score map, which captures the highest amount of variation, was retained to represent the multivariate-anomaly patterns for given elemental association (e.g. Cheng, 2007). Note that the set of multivariate-anomaly maps, in which each map corresponds to an alternative elemental association, represents the propagation of uncertainty stemming from using elemental associations as proxies for underlying geological processes.
-
Integrating alternative anomaly patterns to generate a comprehensive map of anomalies.
To mitigate the uncertainty inherent in defining elemental association for geochemical mapping, the multivariate-anomaly maps were further integrated into a comprehensive anomaly map using a linear weighting model. In this study, the weights assigned to each map correspond to the membership values obtained from fuzzy clustering – that is, they correspond to the cluster from which the map was derived. Since fuzzy clustering inherently normalizes memberships, these values intrinsically account for each domain's spatial representation and influence.
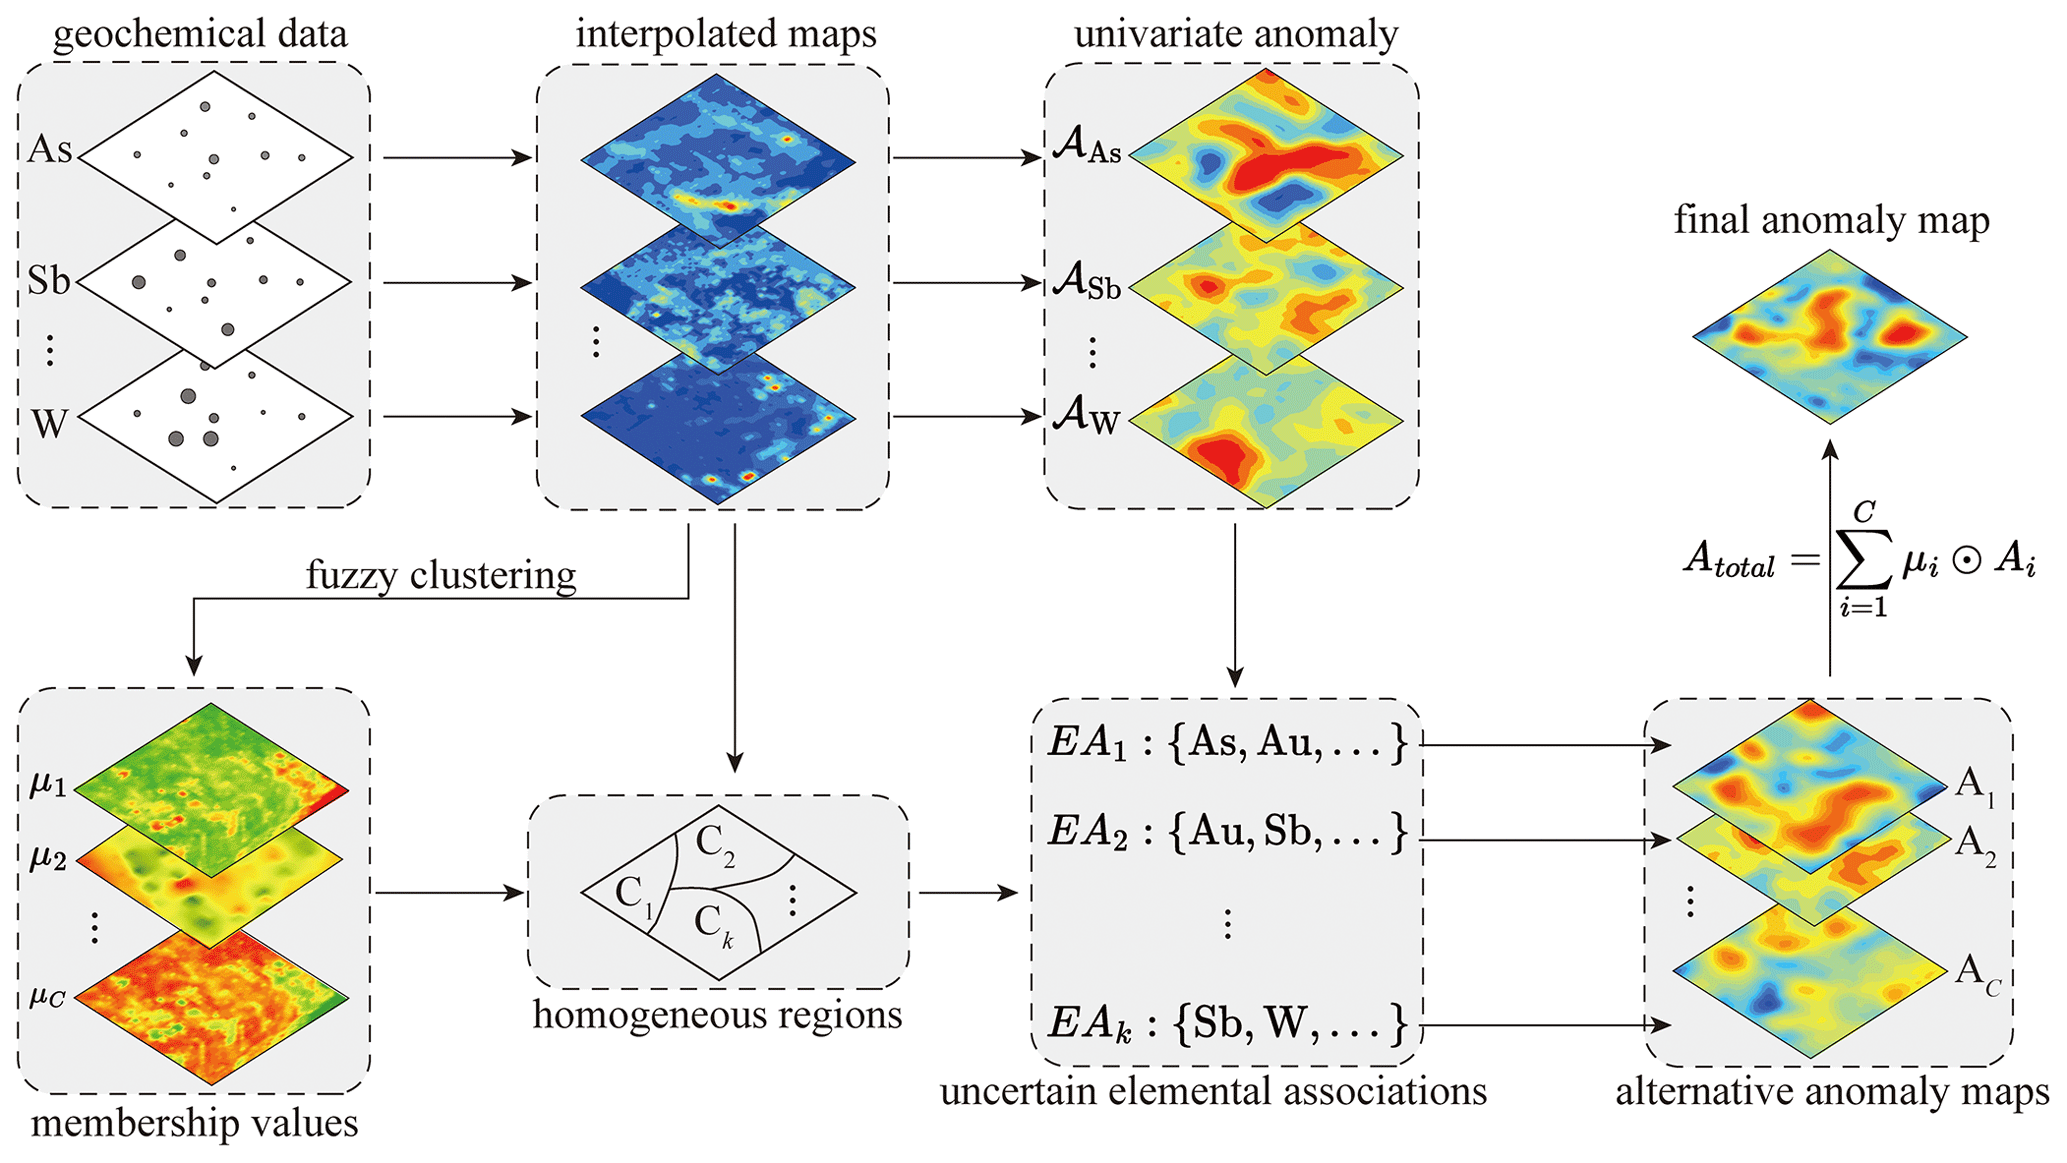
Figure 2The general workflow for mapping geochemical anomalies by accounting for the uncertainty of elemental association.
3.2 Fuzzy c-means clustering
The aim of clustering is to divide a set of N data points into C clusters such that data points within a cluster exhibit similarity and data points within different clusters are dissimilar. Clustering serves the purpose of extracting a set of cluster prototypes, enabling a compact representation of the dataset with several homogeneous subsets (Kaufman and Rousseeuw, 2009). Fuzzy set theory assumes that data points may not belong exclusively to a single set but may instead exhibit a degree of membership uncertainty that can be addressed through the utilization of a membership function (Zadeh, 1965). Integration of fuzzy logic with data mining techniques has emerged as a fundamental aspect of soft modelling to address such uncertainty (Bezdek, 2013). Fuzzy c-means (FCM) clustering, first developed by Dunn (1973), is an unsupervised soft-clustering technique that allows data points to be classified into multiple clusters with varying degrees of membership (Bezdek et al., 1984). FCM is an iterative algorithm that computes cluster centres and membership values to minimize the following objective function:
where C denotes the number of clusters; N the is number of data points; m is a hyperparameter that controls the degree of fuzzy overlap, which refers to how fuzzy the boundaries between clusters are (m < 1); μij is a continuous value between 0 and 1 and represents the degree of membership of the jth data point in the ith cluster (); and Dij is the distance between the jth data point xj and the ith cluster centre ci, for which the Euclidean distance is commonly used, expressed as . Note that for a given data point, the sum of its membership values for all clusters is constantly 1 and is expressed as
The classical FCM computes the distance Dij between data points and cluster centres using a Euclidean distance metric. However, other dissimilarity metrics can also be employed to establish alternative clustering algorithms. For instance, Gustafson and William (1978) presented a fuzzy-clustering algorithm that computes distances using a Mahalanobis distance metric, which enables us to account for correlations and variations in multiple dimensions or variables. The implementation of FCM closely resembles that of k-means, and for specific algorithmic details, one can refer to the work of Suganya and Shanthi (2012).
A key advantage of FCM lies in its flexibility in assigning gradual memberships to account for uncertainty. Hence, FCM has been one of the most widely used fuzzy-clustering algorithms in data science and machine learning applications (e.g. Fatehi and Asadi, 2017; Benjumea et al., 2021; Zhang et al., 2021).
In this study, we employed the Xie–Beni validity index (Xie and Beni, 1991) to determine the optimal cluster number, which is defined as
This index evaluates the dataset's geometric structure and membership degrees, offering a measure of cluster compactness and separation. A lower index value signifies elevated cluster density and distinction.
3.3 Derivation of the comprehensive anomaly map
Assuming that C elemental associations are and that the multivariate-anomaly map for elemental association EAi is Ai, the comprehensive anomaly map can be derived using the following formula:
where μi represents the membership value map for the ith cluster and the operator ⊙ denotes the “Hadamard product”, (i.e. the element-wise product). When considering two matrices, designated as A and B, both of which have identical dimensions (m by n), one can compute the Hadamard product A⊙B. This results in a matrix with matching dimensions, where each element (A⊙B)ij is the product of the corresponding elements from A and B, i.e. . Note that the membership values, ranging from 0 to 1, serve as a quantitative representation of each cell sample's affiliation with the identified clusters (and their corresponding elemental associations), thereby facilitating the integration of multiple anomaly maps through the Hadamard product. Moreover, while our anomaly scores, derived from the singularity exponent, require no scaling due to their dimensionless nature, we acknowledge that the Hadamard product can also be applied to scaled anomaly scores, provided they are normalized to ensure comparability across different measures.
4.1 The uncertainty of elemental associations related to gold mineralization
Zuo et al. (2021b) explored the lower-order statistics of the ore-forming element Au in this dataset using exploratory statistical graphs, including boxplots, histograms, and quantile–quantile plots. The results suggested that the original concentrations of Au exhibit an evidently positively skewed and heavy-tailed distribution, implying that the geochemical data might originate from more than one geological process, with gold mineralization imposing an important influence on shaping the distribution. A global elemental association consisting of Au, As, Sb, and Cu has also been identified in this area by applying PCA for compositional data to 15 trace elements (i.e. Ag, As, Au, Cd, Ba, Bi, Cu, Hg, Mn, Mo, Pb, Sb, Sn, W, and Zn). Furthermore, the spatial patterns of this elemental association confirm its correlation with gold mineralization and its relationship with the distribution of fault systems that controlled the mineralization (Zuo et al., 2021b). However, relying solely on a single elemental association might not adequately represent the potential mineralization in this area. This limitation arises from the inherent heterogeneity and multistage nature of gold mineralization, as indicated by previous geological studies (e.g. Chen, 1998; Chen et al., 2004; Deng et al., 2023). According to Li (1996), this study area exhibits at least two distinct types of gold mineralization. The first type is predominantly controlled by structures and is typically characterized by hydrothermal minerals, such as arsenopyrite, stibnite, realgar, orpiment, and microscopic natural gold. The common elemental association observed in this type is Au–As–Sb–Hg. The second type of gold mineralization is primarily controlled by igneous veins. The typical hydrothermal minerals associated with this type include pyrite, arsenopyrite, stibnite, barite, and microscopic natural gold, which are also accompanied, for example, by contact-metasomatism-derived chalcopyrite and galena. This type of mineralization exhibits an elemental association of Au–As–Sb–Ba–Cu–Pb. Other studies, such as Chen (1998), Zhao (1999), Wang et al. (2004), and Deng et al. (2023), also suggest that high-temperature hydrothermal fluids play a crucial role in remobilizing and concentrating ore-forming elements. Therefore, elements like W and Sn can also serve as indicators for gold mineralization in this area. Consequently, while the elemental association Au–As–Sb is commonly observed across the gold deposits in this region, individual deposits exhibit enrichment in certain pathfinder elements that are characteristic of the local mineralization.
Based on the procedure outlined in Sect. 2.1, we initially applied inverse-distance weighting (IDW) to the same 15 trace elements investigated by Zuo et al. (2021b). The cell size was set to 1 km, and the local interpolation utilized a default value of 12 neighbours in ArcGIS. Subsequently, FCM was performed on the interpolated maps. Various cluster numbers were explored, and the optimal value of 2 was determined based on the cluster validity index (Fig. 3). The FCM analysis assigned each grid cell a membership value indicating its degree of belongingness to each of the two clusters (Fig. 4a and b). The cluster label for each cell could be determined by identifying the largest membership value and assigning the corresponding cluster number to that cell. The clustering results reveal that Cluster 2 is primarily distributed in the southeast of the study area, while Cluster 1 is distributed pervasively throughout the rest of the study area. Cluster 1 mainly reflects the distribution of Triassic sequences, while Cluster 2 mainly reflects the distribution of Paleozoic sequences (Fig. 1). The marginal plot in Fig. 4c indicates that Cluster 2 is characterized by evidently higher concentrations of Au and As. This observation is consistent with the geological knowledge that the Paleozoic carbonaceous silty-shale formation exhibits a high geochemical background in elements related to gold mineralization and serves as one of the most important sources of materials for gold mineralization in this area (e.g. Li, 1996; Zhang, 2014).
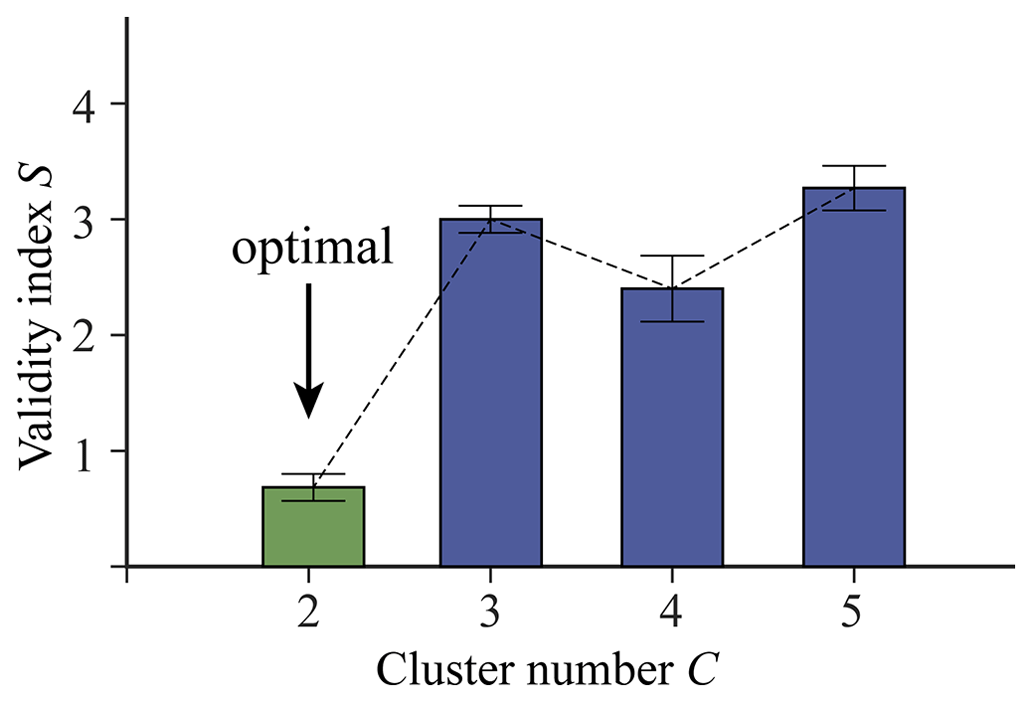
Figure 3Optimal cluster number determined according to the cluster validity index (Xie and Beni, 1991). Note that a total of 100 experiments were conducted to achieve a robust result.
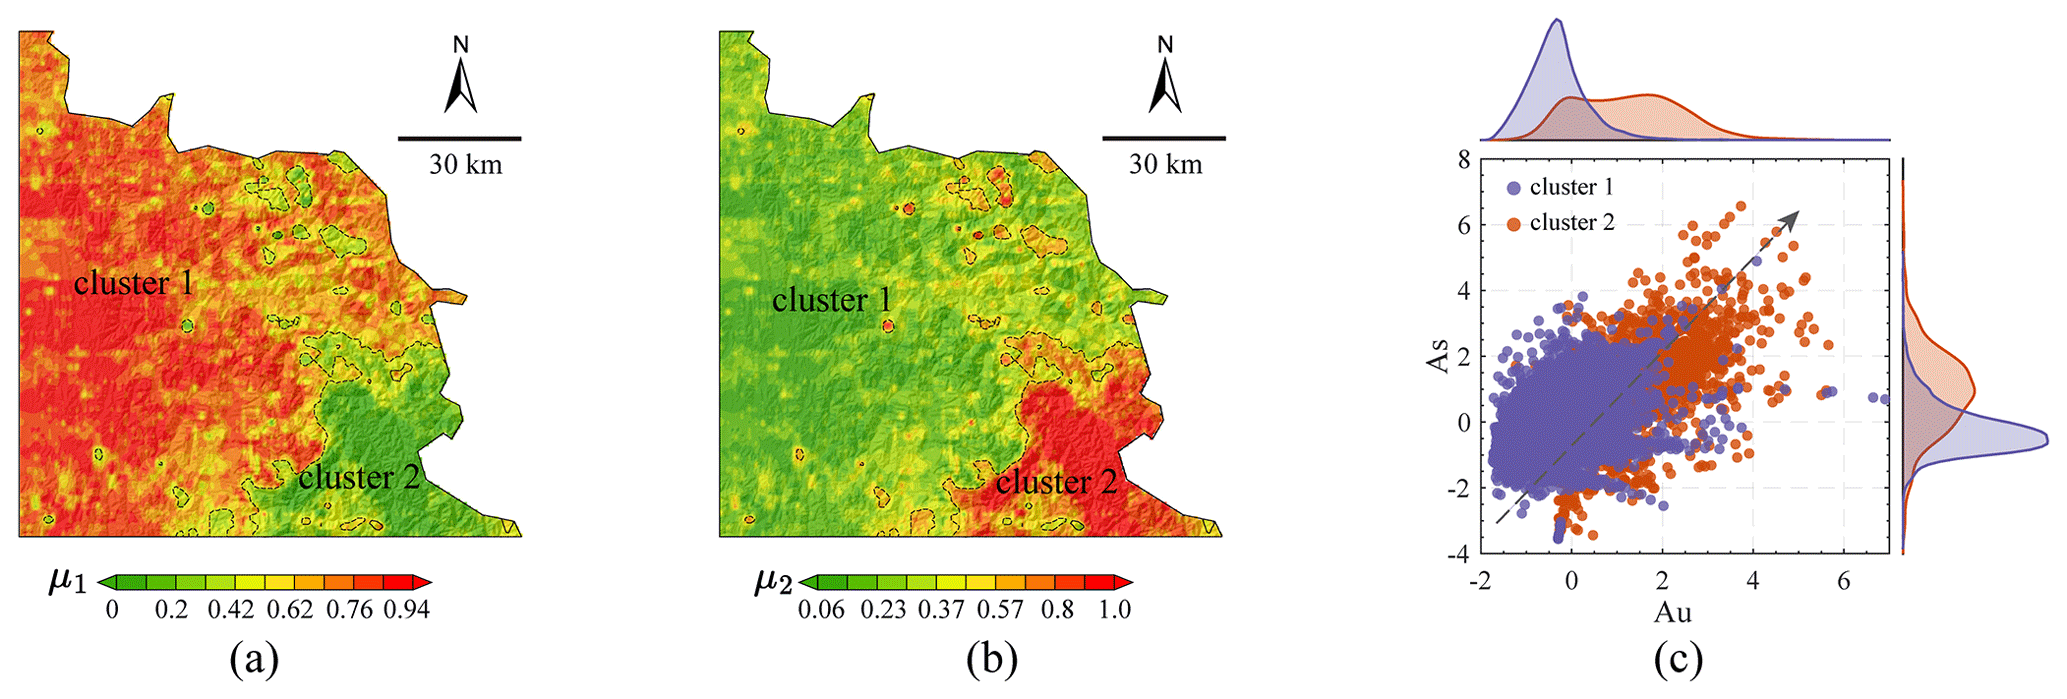
Figure 4Fuzzy c-means clustering of the interpolated maps. (a) The distribution of the fuzzy-membership values for Cluster 1, (b) the distribution of the fuzzy-membership values for Cluster 2, and (c) a marginal plot showing the distribution of data points for Au concentrations versus As concentrations. Note that the concentration values were logarithmically transformed and standardized for improved visualization.
To identify potential elemental associations that indicate gold mineralization in this area, we performed PCA separately on the data from each of the two clusters. The resulting biplot, which depicted the first two principal components, was utilized for visual exploration of the elemental associations. The biplot analysis indicates that the first two principal components account for a total of 55 % of the variation within the elements in Cluster 1, while in Cluster 2, the explained variation is 61 % (Fig. 5a and b). In a biplot, the angle between two vectors that represent geochemical elements can provide an approximation of their correlation (Gabriel, 1971; Reimann et al., 2011). By applying this principle, we can identify potential elemental associations indicative of gold mineralization by examining the relationship between each element and the ore-forming element Au. In addition, we also incorporated geological knowledge regarding expected elemental associations and the distribution of known gold deposits depicted in the biplot to determine an elemental association that closely aligns with the known deposits. For Cluster 1, the elemental association identified, in descending order of correlation (starting with the ore-forming element Au), is Au–W–As–Sb–Ba–Hg. Similarly, for Cluster 2, the sequence is Au–As–W–Sn–Sb–Hg–Pb–Bi, as evidenced by the biplots in Fig. 5a and b. These elemental associations demonstrate strong consistency with the aforementioned geological knowledge and can effectively predict the majority of known gold deposits.
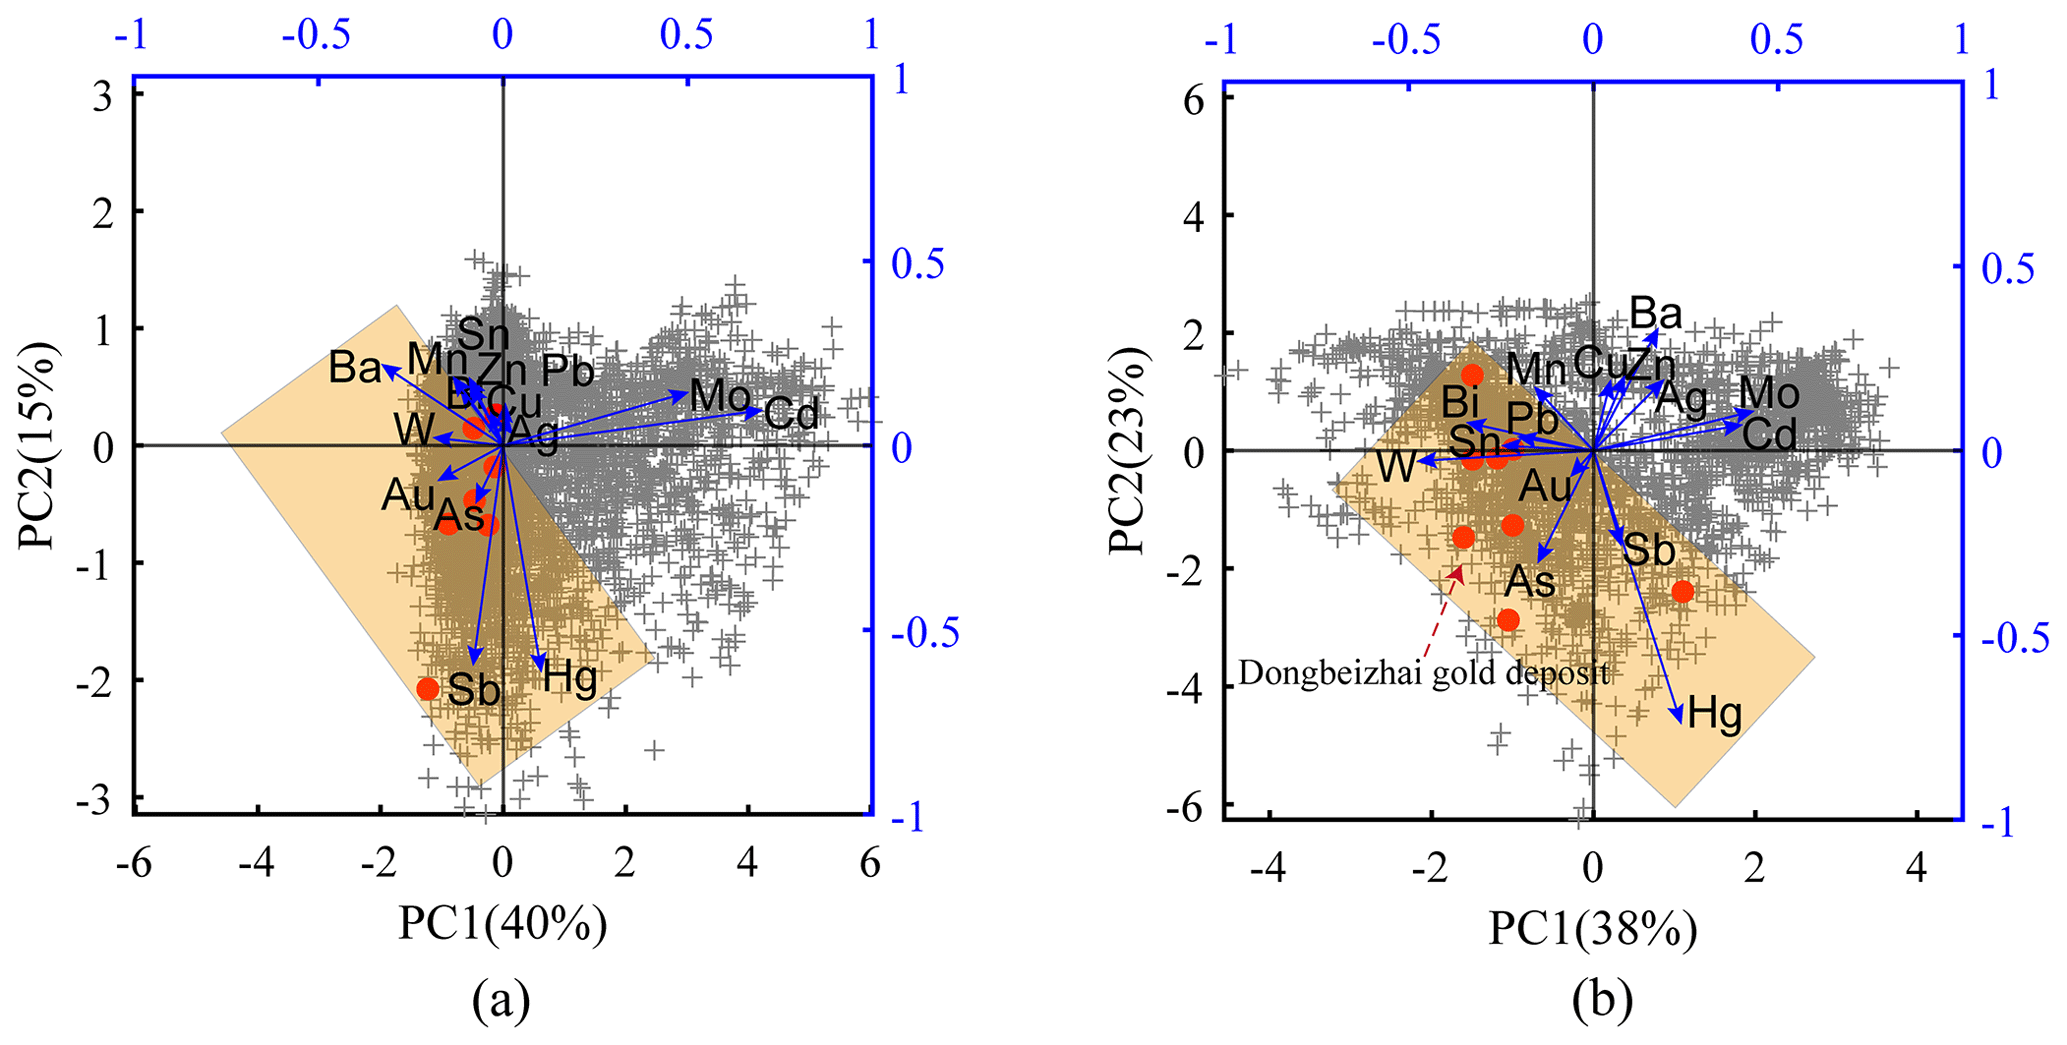
Figure 5Biplots of the first two principal components obtained from PCA of (a) Cluster 1 and (b) Cluster 2. Note that the red points represent the projections of the known gold deposits. The light-orange rectangle encompasses the elements that show good correlations with the ore-forming element Au. PC: principal component.
4.2 Mapping patterns of single-element and multielement anomalies
The interpolated maps of the elements that show correlations with the ore-forming element Au for both clusters (i.e. Au, As, W, Sb, Sn, Hg, Ba, Pb, and Bi) were used further for mapping local singularities, which can help quantify whether the local geochemical pattern is enriched or depleted. The effectiveness of local singularity exponents in enhancing anomaly patterns by mitigating the mask effect of heterogeneous local backgrounds has been well established (e.g. Cheng, 2007; Chen and Cheng, 2016; Li et al., 2017; Gonçalves et al., 2018; Wang et al., 2018; Xiao et al., 2018; Behera and Panigrahi, 2021). For detailed theoretical and algorithmic information on local singularity analysis (LSA), please refer to Cheng (2007). Figure 6 illustrates the distributions of singularity exponents estimated using the sliding-window-based technique developed by Cheng (2007). It can be observed that the local patterns indicated by singularity exponents are clear and remain scarcely unaffected by the heterogeneous geological background. The singularities for the primary indicative elements, such as Au, As, W, and Sb, exhibit strong spatial correlations with the distribution of known gold deposits. In addition, the distribution of singularities for elements Au, As, Sb, and Bi, which are often associated with hydrothermal systems and can exhibit significant mobility, aligns well with the distribution of geological structures in this area. It is noteworthy that all the elements studied here exhibit evident anomaly patterns (i.e. positive singularity), regardless of their strength, in the vicinity of the giant Dongbeizhai gold deposit (highlighted by the solid white rectangles in Fig. 6). In contrast, certain gold deposits may not display anomaly patterns in the singularity maps generated for specific elements. However, in the maps of other elements, discernible anomaly patterns can be identified for these gold deposits, as indicated by the dotted white rectangles in Fig. 6. This observation highlights the inherent uncertainty associated with indicative elements in relation to localized gold mineralization.
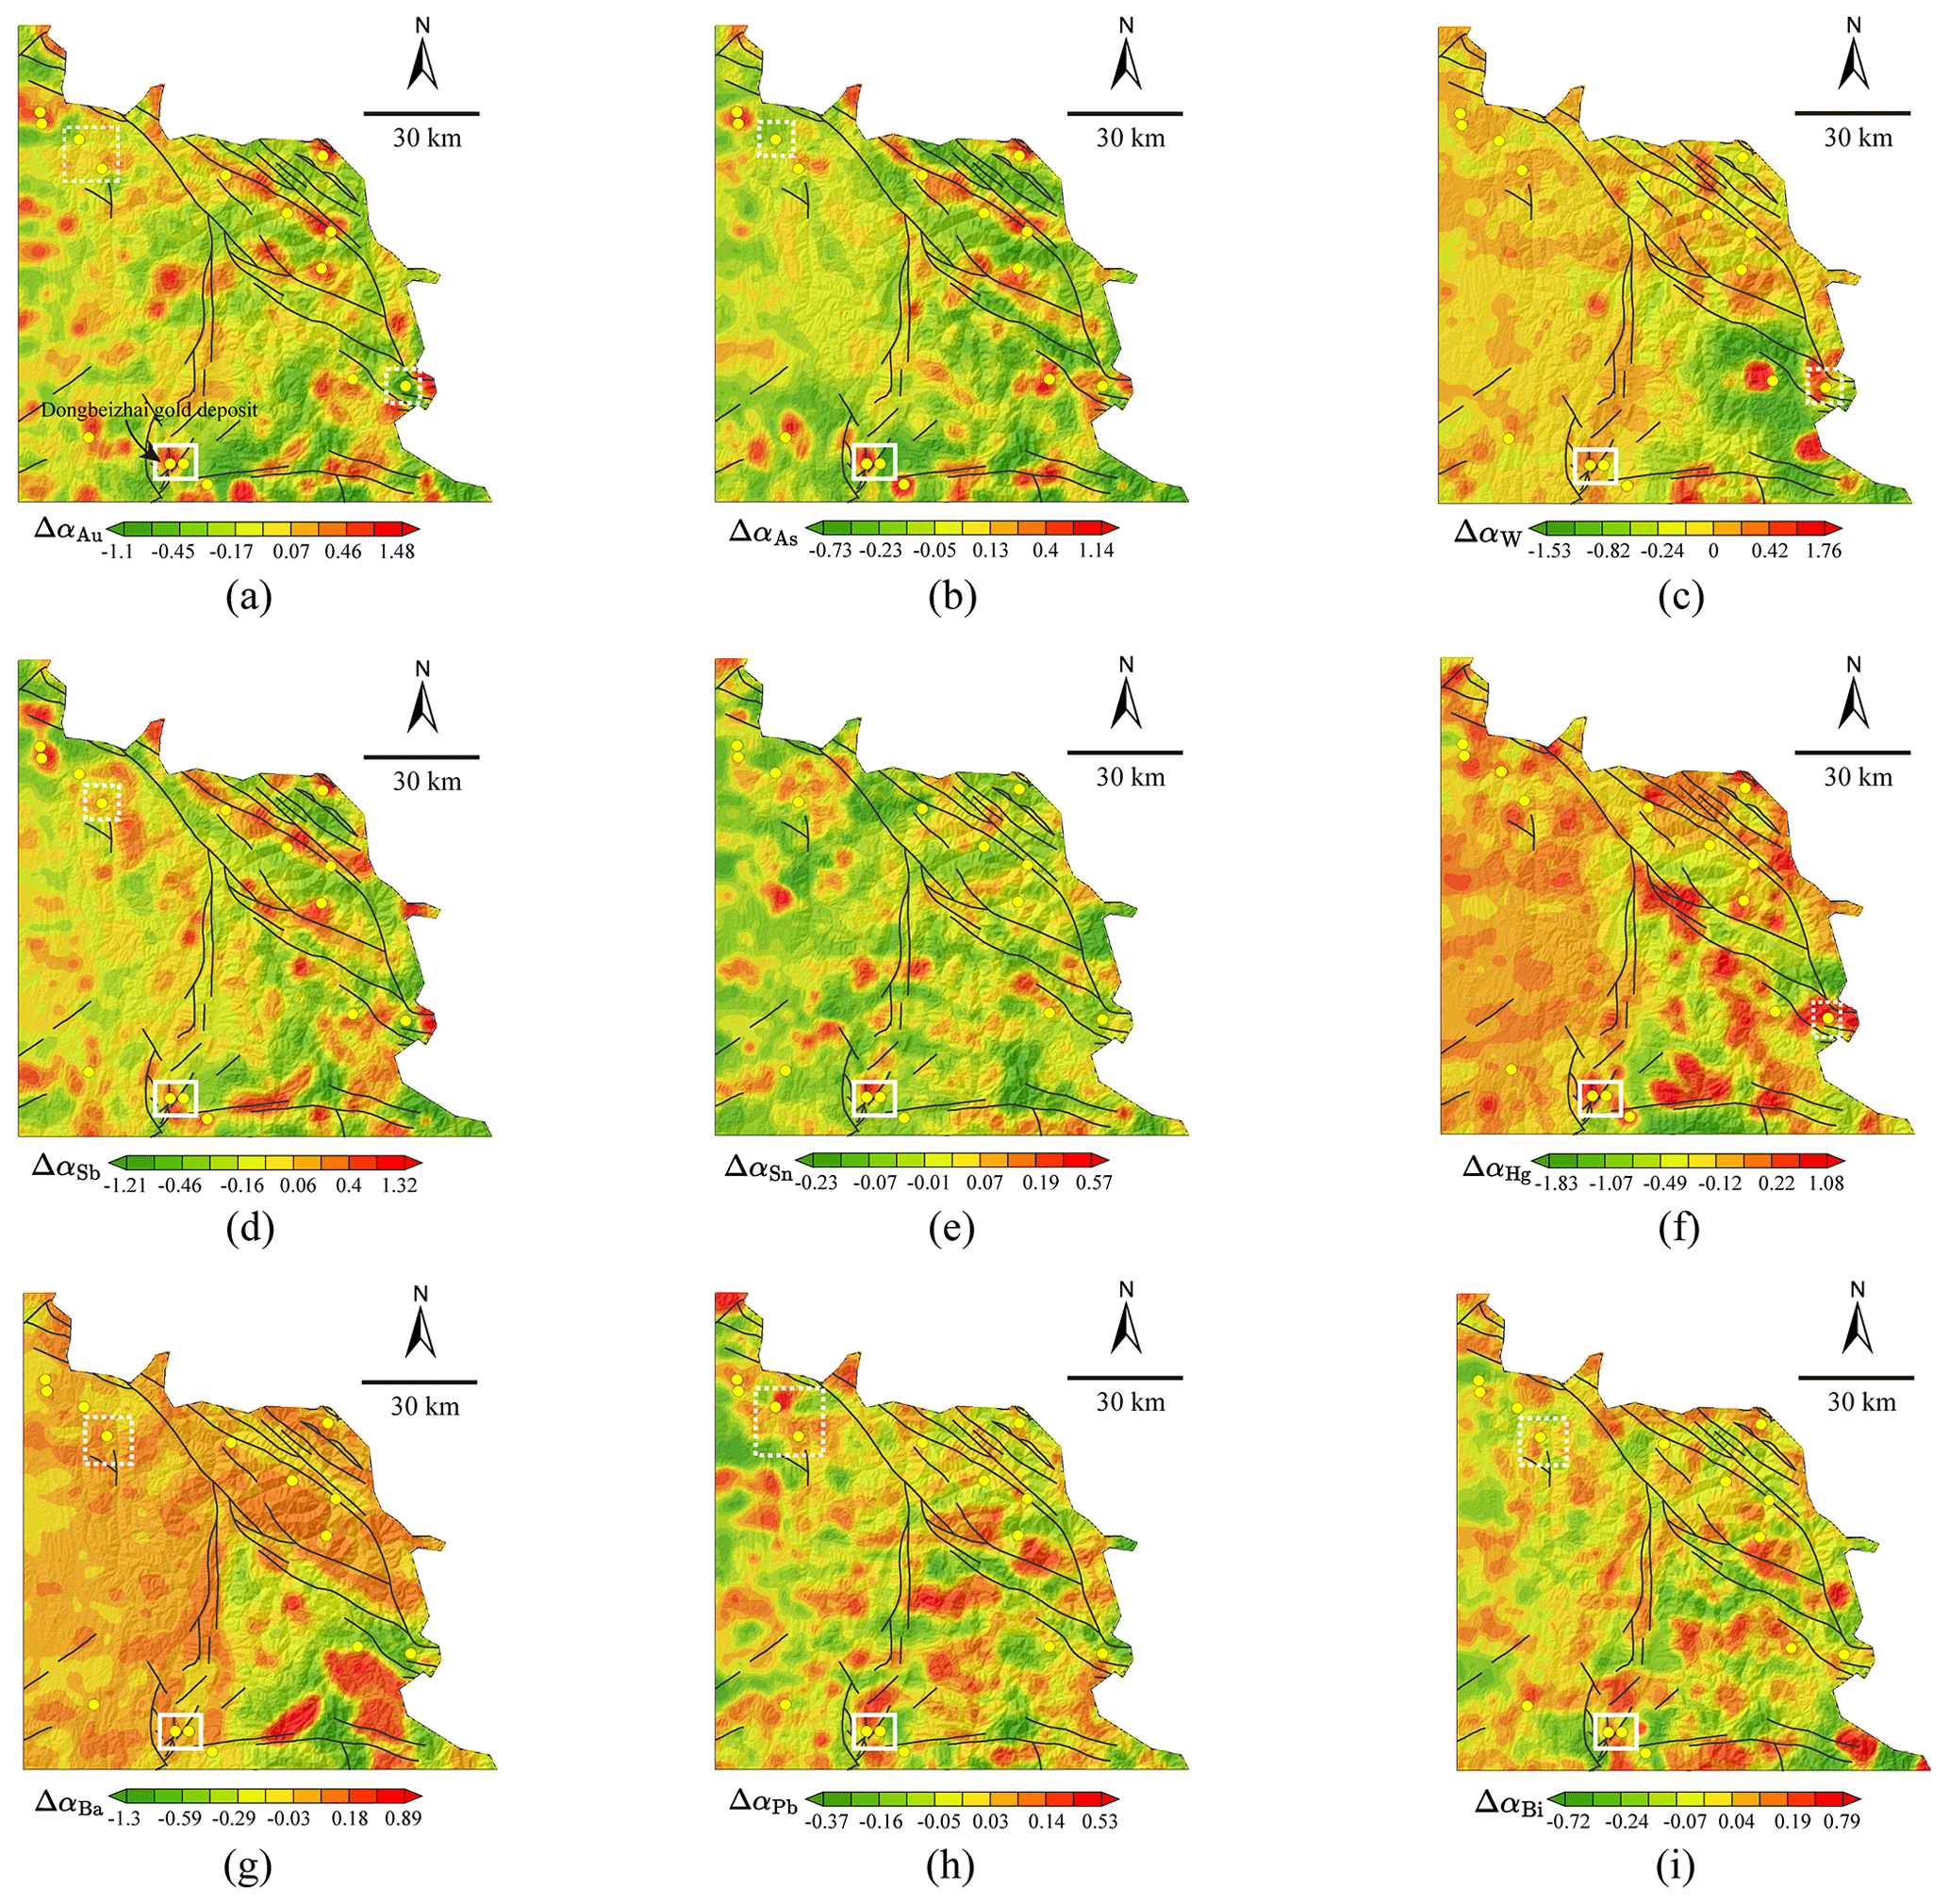
Figure 6The distribution of local singularity exponents for single elements within the set of elements showing correlation with Au for both Cluster 1 and Cluster 2. (a) Au. (b) As. (c) W. (d) Sb. (e) Sn. (f) Hg. (g) Ba. (h) Pb. (i) Bi. Note that a series of square windows, with half-window sizes ranging from 1 to 13 km at 2 km intervals, were utilized for the sliding-window-based singularity mapping technique.
To delineate the comprehensive anomaly patterns with the combined elements for both Cluster 1 and Cluster 2, we applied PCA to the singularity exponents for elements in the identified elemental associations (Fig. 5). The first principal components account for 46 % and 53 % of the total variance for Cluster 1 and Cluster 2, respectively. The multielement-anomaly patterns for the two clusters generally exhibit similarities in that they align well with the geological structures and can effectively predict known gold mineralization. However, there are variations in the local details of the anomaly patterns across different clusters. Furthermore, the overall anomaly intensity for Cluster 1 (Fig. 7a) is slightly higher compared to that for Cluster 2 (Fig. 7b). Notably, the resulting map for Cluster 1 exhibits distinct multilevel patterns in certain local areas, which are very weak or even absent for Cluster 2. The multielement anomalies for the two clusters were further integrated into a comprehensive anomaly map using a linear weighting scheme that utilized the fuzzy-membership values as weights. The resulting map preserves the common patterns that display good correlation with known gold mineralization (Fig. 7c). More importantly, the integrated singularity map also underscores the importance of detecting underlying geological structures and mineralization patterns in the western portion of the study area.
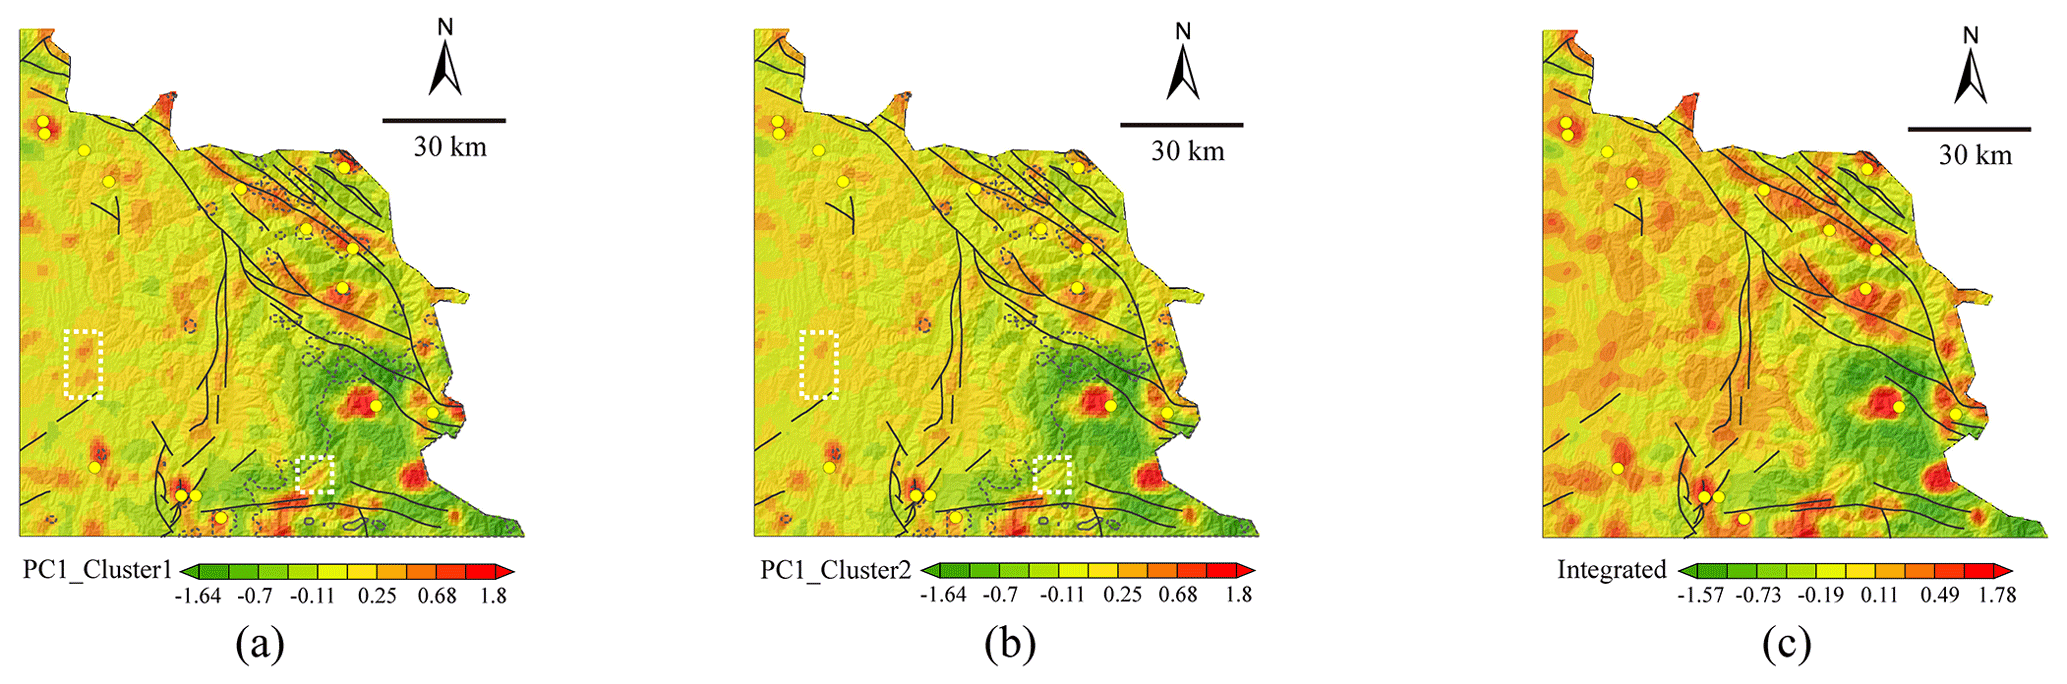
Figure 7The first-principal-component scores showing the distribution of combined singularities obtained by applying PCA to singularities of (a) Au–W–As–Sb–Ba–Hg for Cluster 1, and (b) Au–As–W–Sn–Sb–Hg–Pb–Bi for Cluster 2. The comprehensive map of anomaly patterns integrated from the maps illustrating combined singularities based on fuzzy-membership values is shown in panel (c). Note that local patterns enclosed by dotted white rectangles in panels (a) and (b) indicate the differences between the multielement-anomaly maps for Cluster 1 and Cluster 2.
4.3 Model evaluation
To evaluate the performance of the result presented in Fig. 7c, we additionally identified multielement-anomaly patterns while disregarding the uncertainty of elemental associations. This was then used as the benchmark for performance comparison, referred to hereafter as the “global reference case”. The elemental association adopted for the global reference case was Au–As–Sb–Cu, with the purpose of aligning with the study of Zuo et al. (2021b). The multielement-anomaly patterns were derived consistently with those for each elemental association in the case where uncertainty considered. This was achieved by applying PCA to the univariate-anomaly maps of Au, As, Sb, and Cu and retaining the first principal component to represent the multivariate-anomaly map (Fig. 8a). This map exhibits strong spatial correlation with geological structures and known gold mineral deposits. However, differences can also be easily observed when comparing it to the results obtained from the procedure that accounts for the uncertainty of elemental associations, referred to hereafter as the “case with uncertainty”. For example, there is no anomaly present in the vicinity of the easternmost known gold mineralization, as indicated by the dotted white rectangle in Fig. 8a. In contrast, clear anomaly patterns associated with this deposit can be observed in the resulting map for the case that considers uncertainty (Fig. 7c).
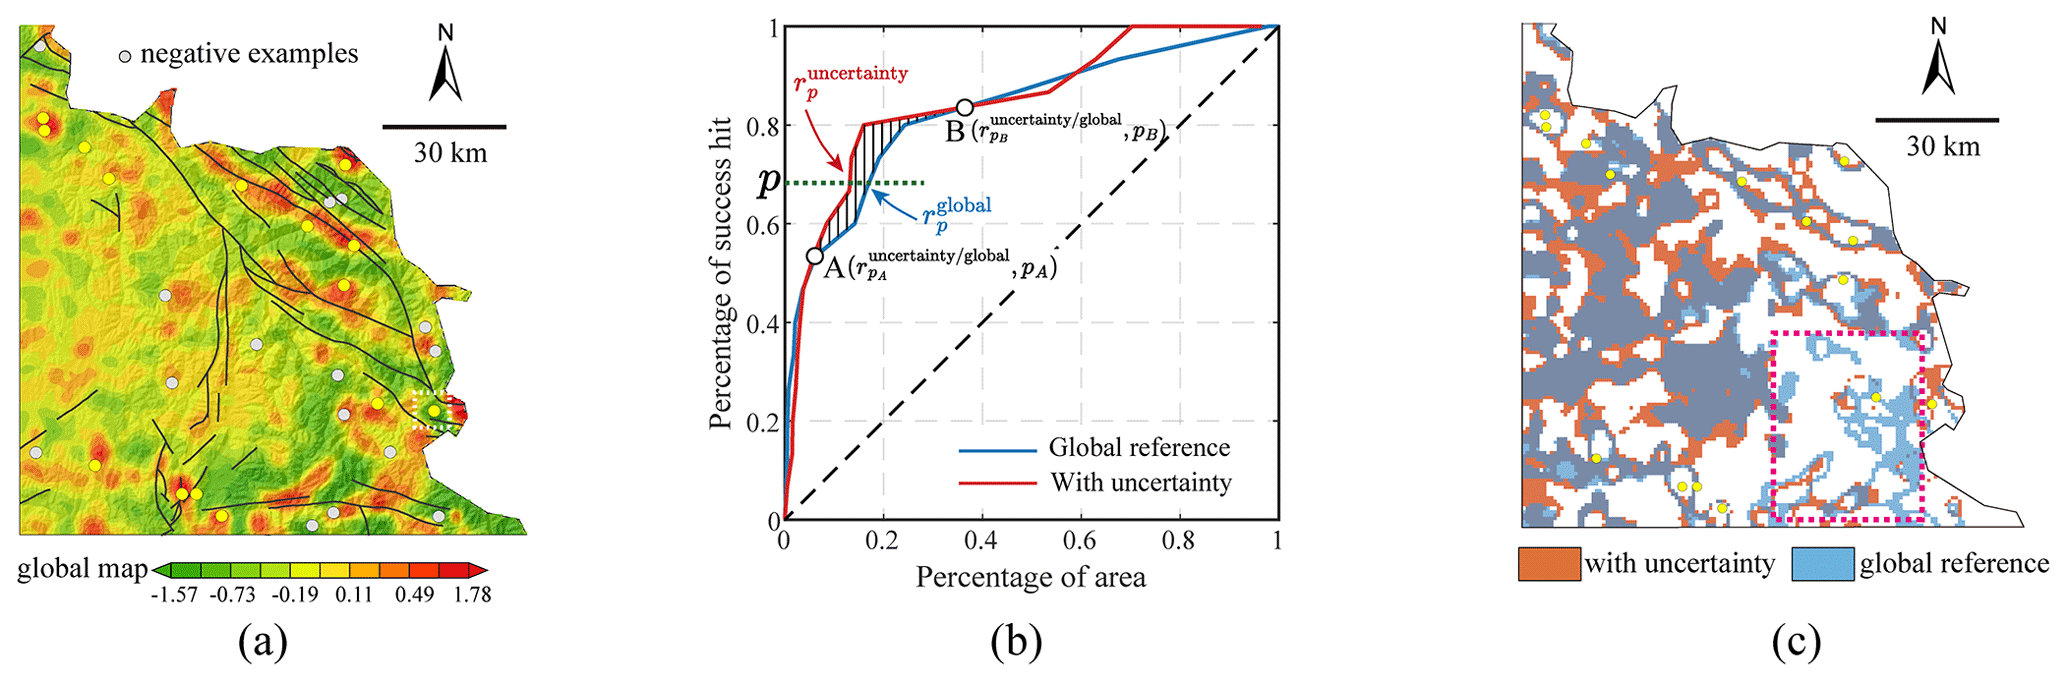
Figure 8A comparison of the performance of the mapped results in predicting known gold mineralization in two scenarios: (a) the global reference case, which does not consider the uncertainty, and the case presented in this study that accounts for the uncertainty of elemental associations (Fig. 7c). The success rate curves for these two scenarios are shown in panel (b), and the incremental areas delineated by the cutoff values corresponding to points A and B in panel (b) for the two scenarios are displayed in panel (c). Note that colours in panel (c) are rendered with 30 % transparency. As a result, areas where two colour patterns overlap exhibit a blended colour that is distinct from the colour of regions with only a single-colour pattern (e.g. the southeastern region outlined by the dotted rectangle).
In the present study, the multielement-anomaly patterns for the two cases were verified using success rate curves that indicate the patterns' capability in predicting known mineralization. These curves were obtained by plotting the cumulative percentage of known gold deposits against the cumulative percentage of anomaly pattern areas after overlaying the deposits onto the anomaly map and ranking the anomaly scores in descending order (e.g. Carranza, 2008). In general, the results from the case with uncertainty outperform the global reference case (Fig. 8b). The success rate curves also suggest that approximately the top 6 % of the total area can predict around 54 % of known mineralization (point A), regardless of whether we consider the global reference case or the case that accounts for the uncertainty of elemental associations. However, when a larger area is delineated to predict gold mineralization from 54 % (point A) to 83 % (point B), the success rate curve exhibits distinct behaviours between the two scenarios. The case that considers uncertainty can consistently predict the same proportion of known gold mineralization with a relatively lower percentage of study area than the global reference case ( in Fig. 8b). By examining the incremental areas delineated by the cutoff values corresponding to points A and B for the two scenarios, we were able to visually discern the disparities in the spatial distribution of geochemical patterns that contribute to the different performances observed between these two points. This is achieved by subtracting the cumulative area corresponding to the threshold defined by point A from that defined by point B for each scenario, thus isolating the specific regions responsible for the discrepancy in performance (Fig. 8c). The global reference case placed a greater emphasis on the southeastern region, as indicated by the dotted rectangle in Fig. 8c, which is distinguished by elevated geochemical backgrounds for most indicative elements due to the prevalence of Paleozoic gold-enrichment lithologic units. This observation suggests that the procedure proposed in this study might have the potential to mitigate the impact of heterogeneous geochemical backgrounds on the mapping of geochemical anomalies.
To derive a quantitative metric for accuracy assessment, this study also utilized the “receiver operating characteristic” (ROC) curve and the “area under curve” (AUC) methodology, as described by Fawcett (2006). When constructing a ROC curve, negative examples that represent the absence or non-occurrence of mineralization event are required to be used along with positive examples (i.e. known gold mineralization) to evaluate the performance of a binary classification model. In addition, studies also suggested that the number of negative examples should be comparable to that of positive examples to ensure a balanced evaluation. We randomly generated a set of negative examples under the constraint that they were located outside the local 3 km neighbourhood of known deposits (Fig. 8a). Moreover, the number of negative examples was set to match that of known mineral deposits. The ROC curves in Fig. 9a depict the true-positive rate (TPR) and false-positive rate (FPR) at various classification thresholds for both the case considering the uncertainty of elemental associations and the global reference case. The AUC value was determined to be 0.8 for the global reference case and 0.85 for the case with uncertainty. Therefore, when compared to the global reference case, the case with uncertainty demonstrates superior overall performance in terms of accurately identifying known gold mineralization while minimizing false positives. Considering the potential uncertainties involved in calculating the AUC value, we proceeded to randomly generate multiple sets of negative examples. Specifically, a total of 300 sets were created to mitigate potential biases or peculiarities that may exist in a single negative example set. The results (Fig. 9b) suggest that the case accounting for uncertainty in elemental associations, on average, outperforms the global reference case in predicting known mineralization. The non-overlapping notches of the boxes signify a statistically significant median difference between the two cases. Also, it should be noted that the case with uncertainty exhibits higher sensitivity to the selection of negative examples. Given that the elemental association for the global reference case involves a total of four elements, we additionally investigated a scenario where only the top four relevant elements were retained for the two clusters. It is evident from the results (Fig. 9b) that this particular case even exhibits superior performance on average compared to the previous two cases. This observation indicates that the incorporation of certain elements that exhibit weak correlation with the ore-forming element Au may offer limited or even detrimental contributions to the accurate mapping of geochemical anomalies.
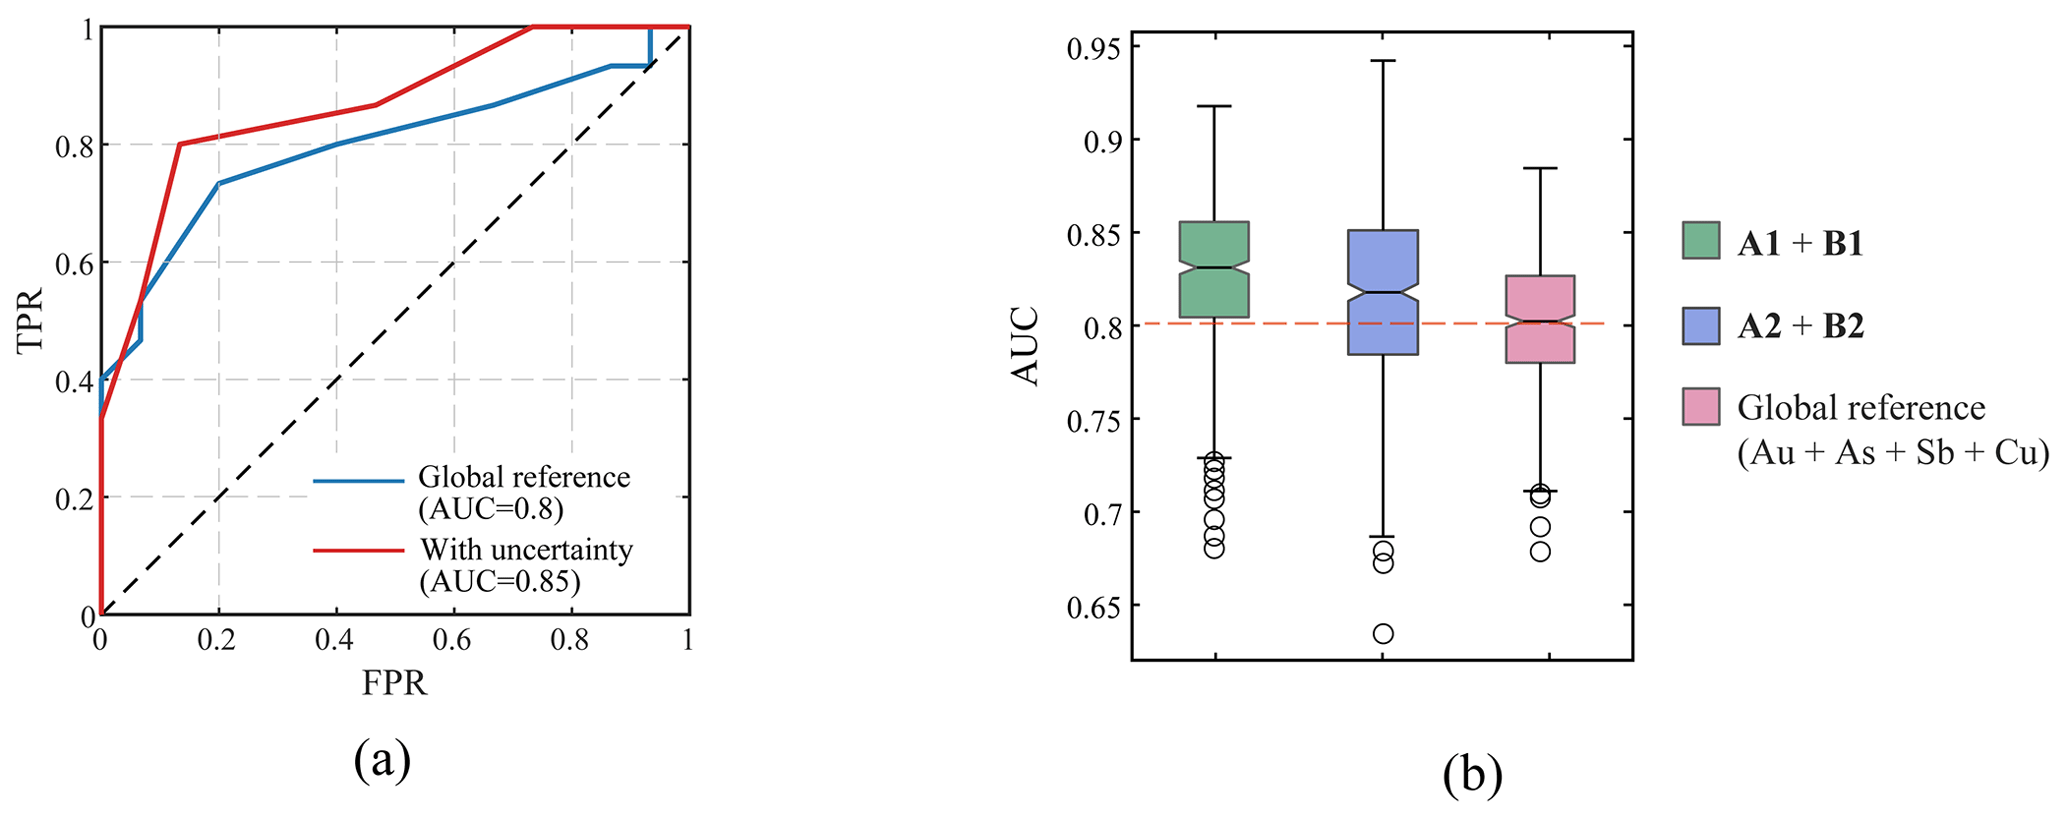
Figure 9(a) The ROC curves and AUC values for the global reference case and the case considering the uncertainty of elemental associations. (b) The notched boxplot showing the AUCs from 300 experiments that sample different negative examples for the two scenarios. Here, an additional combination of elemental associations for the two clusters, both of which consist of the top four most relevant elements, was also examined. The elemental associations denoted by A1, A2, B1, and B2 are as follows: A1 (Au, W, As, Sb), A2 (Au, W, As, Sb, Ba, Hg), B1 (Au, As, W, Sn), and B2 (Au, As, W, Sn, Sb, Hg, Bi, Pb). Note that the notched boxplot applies a “notch” around the median, which serves as a visual representation of the median's confidence interval.
4.4 Delineation of significant geochemical anomalies
To further delineate significant geochemical anomalies for guiding subsequent mineral exploration, the “weight of evidence” method was used to derive the statistical t values, which allow for defining significant anomalies (Bonham-Carter, 1994). A t value serves as a measure of the significance of spatial correlation between point features and polygons, with higher t values indicating stronger spatial correlation. Typically, a t value of 1.96 can be taken to be a threshold above which the spatial correlation can be regarded statistically significant at a significance level of 0.05.
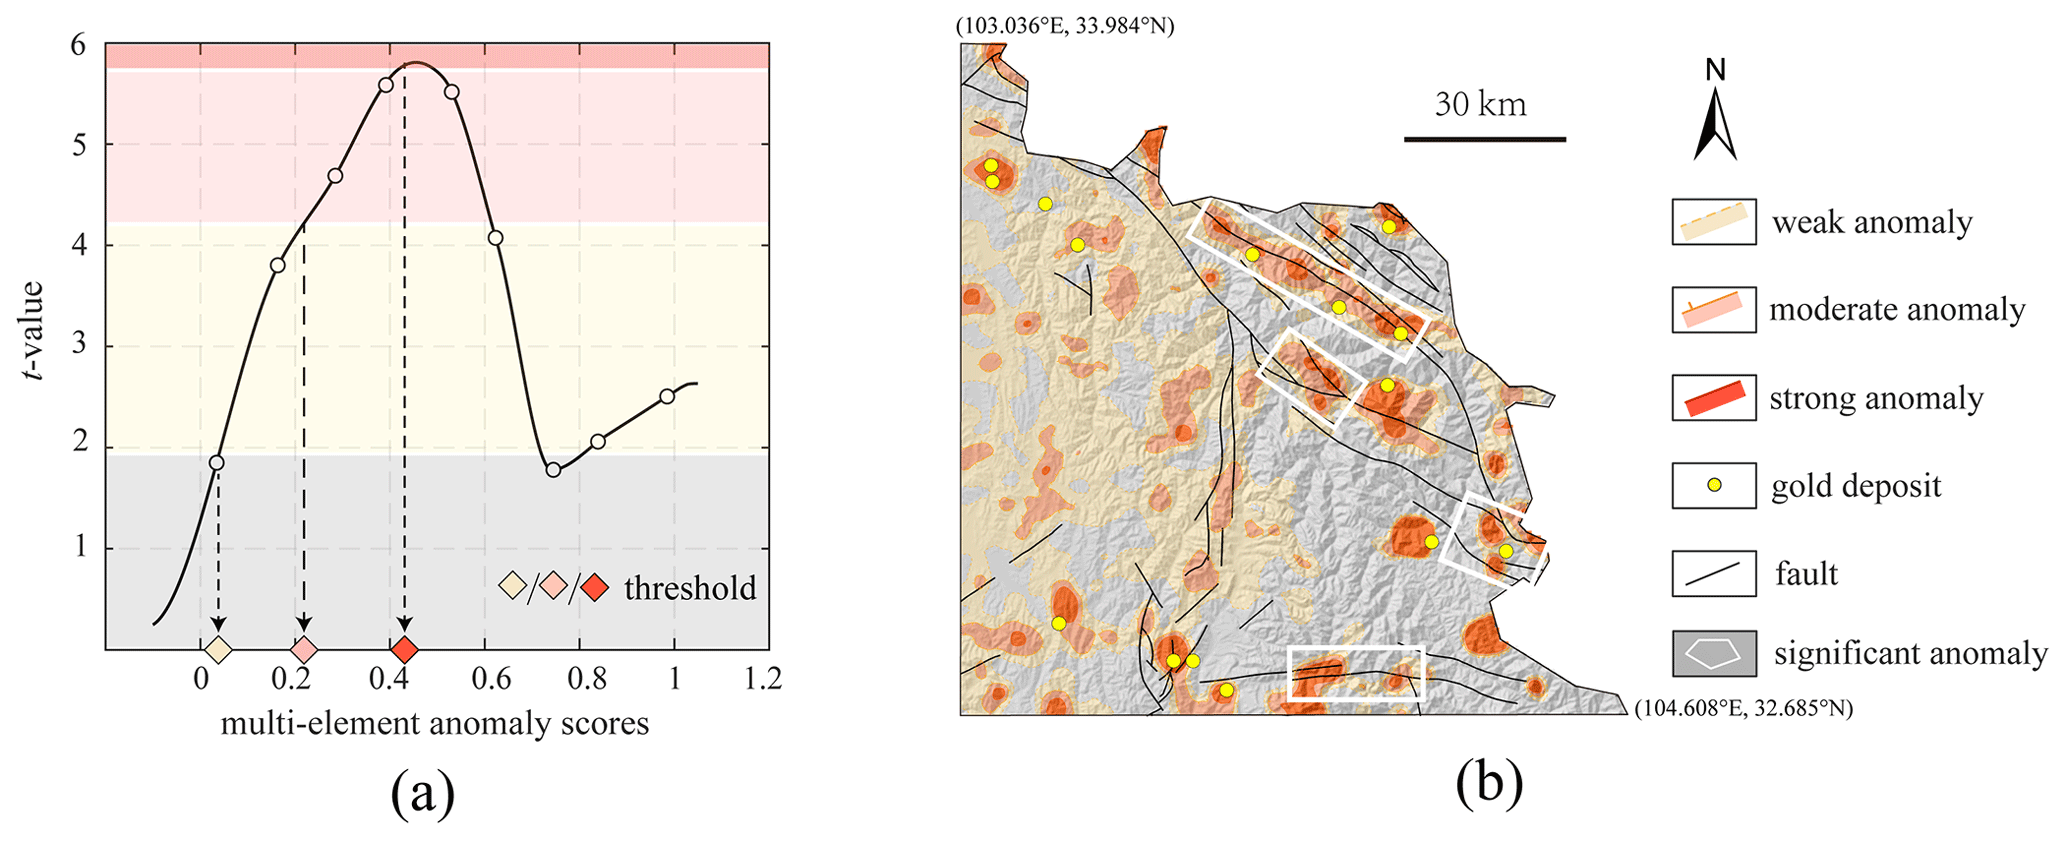
Figure 10The student's t values (a) and the delineated geochemical anomalies (b) based on the multielement-anomaly scores derived from the case considering the uncertainty of elemental association (Fig. 7c). Note that different levels of anomalies were overlaid on the hillshade map of the study area.
The t values for the resulting anomaly score map (Fig. 7c), as depicted in Fig. 10a, demonstrate an increasing trend as the threshold rises from 0 to 0.42. It is important to note that the portion of the study area with an anomaly score ≥ 0.42 occupies only 7 % of the total area, yet it contains 60 % of the total number of mineral deposits. In addition, the t value reaches 1.96 at an anomaly score of 0.03. The two values 0.03 and 0.42, along with an arbitrarily determined anomaly score of 0.21 that is nearly at their midpoint, were utilized as thresholds to define the weak anomaly (0.03–0.21), moderate anomaly (0.21–0.42), and strong anomaly (≥ 0.42) (Fig. 10b). The result shows that the delineated patterns are directly associated with the known gold deposits. Notably, most of the known deposits are spatially linked to multilevel anomaly patterns. We also preliminarily delimited some significant anomalies based on the following criteria: (a) the presence of multilevel anomaly patterns, (b) the proximity to known deposits, and (c) the proximity to geological structures. The delimited anomalies (Fig. 10b) should be further investigated and validated with other evidence pertaining to undiscovered gold deposits.
4.5 The implications and limitations of the procedure for mapping geochemical anomalies under uncertainty
Geochemical patterns result from dynamic geological systems that are open, non-linear, complex, and subject to spatial and temporal variations. The intrinsic heterogeneity of these patterns poses challenges in identifying and understanding the underlying constituent geological processes based on geochemical data, thus leading to inherent uncertainties. Specific geological processes are commonly considered to have the potential to be reliably represented by certain elemental associations. Therefore, in order to address the uncertainties and hence improve our comprehension of geological processes and the performance of mineral resource prediction, it is crucial to identify and analyse the diverse range of possible elemental associations present in a study area.
The procedure presented here identified two distinct clusters within the study area, and they are characterized by different elemental associations related to gold mineralization. Cluster 1 covers a significantly larger area and predominantly encompasses Triassic formations, whereas the other cluster is primarily composed of Paleozoic lithologic units. These two clusters can be approximately differentiated by the regional Heye fault belt, trending NW–SE, and the Minjiang fault belt, trending S–N, which serve as the boundaries between the above geological units. Studies have also demonstrated the significant influence of regional fault belts in constraining and delineating areas where various geological processes have occurred throughout geological history. These processes encompass sedimentation, magmatic activities, metamorphism, and mineralization events (Wang and Liang, 2004). The presence of regional structures in the area highlights the evident spatial heterogeneity in the geological composition across various regions and throughout different geological time periods. The study area was a passive continental margin during the late Proterozoic to Paleozoic era, characterized by the development of sedimentary-cover layers primarily consisting of terrigenous clastics with minor occurrences of carbonate and siliceous rocks. However, during the Mesozoic era, the area experienced tectonic movements associated with the ancient Tethys Ocean, resulting in extensive folding within regions where Paleozoic sequences are distributed. In other areas, intense faulting occurred, accompanied by the deposition of extensive thick-flysch sequences during the Triassic period. These flysch sequences have proven to be crucial sources of ore-forming materials (Wang et al., 2003). Regional geochemical analysis suggests that Paleozoic lithological units are characterized by a higher geochemical-background level of Au compared to Triassic formations (Zhao, 1995). In addition, according to previous studies (e.g. Zhao, 1995), there is a discernible pattern where the temperature of mineralization-related fluids increases from north to south. This geological knowledge is further supported by the elemental association observed in Cluster 2 in this study, which includes high-temperature hydrothermal elements, e.g. Sn, W, and Bi.
Note that the current procedure only accounts for the dissimilarity of elemental concentrations during fuzzy clustering and disregards the tectonic settings and geological conditions of the data points. Consequently, it is evident that Cluster 2 includes irregular and disconnected areas in addition to the major southeastern area that exhibits a high geochemical background (Fig. 4), although the membership values of these scattered areas are relatively lower. Note that these small areas are characterized by high concentration values for the selected geochemical elements. However, the geological sequence in these areas is Triassic, which differs from that in the southeastern area. Therefore, future studies should focus on extending classical fuzzy-clustering algorithms to account for geological constraints or take spatial connectivity into consideration as an additional constraint. We also acknowledge that relying solely on the biplots to determine elemental associations can introduce additional uncertainty. This is because only part of the variation is explained by the biplot itself, and there is a lack of widely accepted criteria for determining an optimal subset of elements that exhibit a strong correlation with the ore-forming element of interest. Nevertheless, the case study presented here indicates that the procedure that considers the uncertainty of elemental associations provides a promising approach to achieve superior performance in the mapping of geochemical anomalies compared to the global case, where such uncertainty is not taken into account.
In this study, we developed a procedure that accounts for the uncertainty of elemental associations as an indicator of the underlying geological process of interest, aiming to improve geochemical mapping. A case study processing geochemical stream-sediment samples to map geochemical anomalies linked to disseminated gold mineralization in the northwestern region of the province of Sichuan, China, was presented to illustrate and validate the procedure. Three main conclusions could be drawn:
-
The determination of elemental association as an indicator of the underlying geological process is an important source of uncertainty for geochemical mapping.
-
The procedure outlined in this study, which mainly comprises fuzzy clustering, principal-component analysis, and geochemical-anomaly identification, provides an effective framework for addressing the uncertainty associated with elemental associations in geochemical mapping. Also, note that the procedure allows for the incorporation of alternative methods for fuzzy clustering, the determination of elemental associations, and the identification of geochemical anomalies, rather than being limited to the methods employed in this particular study. This provides greater flexibility and adaptability to suit different research contexts.
-
Two distinct clusters can be identified within the study area, closely aligning with the distribution of lithological units impacted by predominant regional geological processes. Moreover, the procedure presented here demonstrates, on average, superior performance compared to the global reference case in accurately predicting gold mineralization. The delineated-anomaly patterns show potential for the discovery of more gold deposits in this region. It is worth noting that attention should also be paid to the western areas, where minimal gold deposits have been uncovered thus far. However, weak anomalies persist in these regions, which is possibly indicative of deeply buried mineralization and underlying structures.
The core code can be obtained by emailing the first author, Jian Wang (jwang@cdut.edu.cn). The authors do not have permission to share data.
JW contributed to the conceptualization, data curation, formal analysis, funding acquisition, investigation, methodology, validation, visualization, and writing of the original draft. RZ contributed to the conceptualization of the study and reviewed and supervised the work. QL contributed to the visualization and writing of the original draft. All the authors read and approved the final paper.
The contact author has declared that none of the authors has any competing interests.
Publisher’s note: Copernicus Publications remains neutral with regard to jurisdictional claims made in the text, published maps, institutional affiliations, or any other geographical representation in this paper. While Copernicus Publications makes every effort to include appropriate place names, the final responsibility lies with the authors.
We thank Xueqiu Wang at the Institute of Geophysical and Geochemical Exploration, China, for providing the geochemical data.
This research benefited from financial support from the National Natural Science Foundation of China (grant no. 42002295); the National Science Foundation of Hubei Province, China (grant no. 2023AFA001); and the MOST Special Fund from the State Key Laboratory of Geological Processes and Mineral Resources, China University of Geosciences (grant nos. GPMR202444, MSFGPMR2024-701, and MSFGPMR2024-401).
This paper was edited by Johan Lissenberg and reviewed by Satyabrata Behera and Mohammad Parsa.
Behera, S. and Panigrahi, M. K.: Mineral prospectivity modelling using singularity mapping and multifractal analysis of stream sediment geochemical data from the auriferous Hutti-Maski schist belt, S. India, Ore Geol. Rev., 131, 104029, https://doi.org/10.1016/j.oregeorev.2021.104029, 2021.
Benjumea, B., Gabàs, A., Macau, A., Ledo, J., Bellmunt, F., Figueras, S., and Piña, J.: Undercover karst imaging using a Fuzzy c-means data clustering approach (Costa Brava, NE Spain), Eng. Geol., 293, 106327, https://doi.org/10.1016/j.enggeo.2021.106327, 2021.
Bezdek, J. C.: Pattern recognition with fuzzy objective function algorithms, Springer Science & Business Media, https://doi.org/10.1007/978-1-4757-0450-1, 2013.
Bezdek, J. C., Ehrlich, R., and Full, W.: FCM: The fuzzy c-means clustering algorithm, Comput. Geosci., 10, 191–203, 1984.
Bölviken, B., Kullerud, G., and Loucks, R. R.: Geochemical and metallogenic provinces: a discussion initiated by results from geochemical mapping across northern Fennoscandia, J. Geochem. Explor., 39, 49–90, 1990.
Bonham-Carter, G. F.: Geographic Information System for Geosciences: Modelling with GIS, Pergamon Press, Oxford, ISBN 978-0-08-041867-4, 1994.
Carranza, E. J. M.: Geochemical anomaly and mineral prospectivity mapping in GIS, Elsevier, ISBN 9780444513250, 2008.
Chen, D.: A regional geochemical prospecting model for main types of gold deposit in west Sichuan, Acta Geologica Sichuan, 18, 131–140, 1998 (in Chinese with English abstract).
Chen, G. and Cheng, Q.: Singularity analysis based on wavelet transform of fractal measures for identifying geochemical anomaly in mineral exploration, Comput. Geosci., 87, 56–66, 2016.
Chen, Y., Zhang, J., Zhang, F., Franco, P., and Li, C.: Carlin and Carlin-like golf deposits in Western Qinling mountains and their metallogenic time, tectonic setting and model, Geol. Rev., 50, 134–152, 2004 (in Chinese with English abstract).
Chen, Y., Zhao, Q., and Lu, L.: Combining the outputs of various k-nearest neighbor anomaly detectors to form a robust ensemble model for high-dimensional geochemical anomaly detection, J. Geochem. Explor., 231, 106875, https://doi.org/10.1016/j.gexplo.2021.106875, 2021.
Cheng, Q.: Mapping singularities with stream sediment geochemical data for prediction of undiscovered mineral deposits in Gejiu, Yunnan Province, China, Ore Geol. Rev., 32, 314–324, 2007.
Cheng, Q.: Singularity theory and methods for mapping geochemical anomalies caused by buried sources and for predicting undiscovered mineral deposits in covered areas, J. Geochem. Explor., 122, 55–70, 2012.
Cocker, M. D.: Geochemical mapping in Georgia, USA: a tool for environmental studies, geologic mapping and mineral exploration, J. Geochem. Explor., 67, 345–360, 1999.
Costa, J. F. and Koppe, J. C.: Assessing uncertainty associated with the delineation of geochemical anomalies, Nat. Resour. Res., 8, 59–67, 1999.
Deng, H., Li, N., Song, Y., Wang, G., Wei, H., Chen, S., Luo, S., and Zhou, X.: Metallogenic geological characteristics and exploration significance of typical rock-gold deposits in western Sichuan Province, Mineral Exploration, 14, 701–717, 2023 (in Chinese with English abstract).
De Vivo, B., Lima, A., Bove, M. A., Albanese, S., Cicchella, D., Sabatini, G., Di Lella, L. A., Protano, G., Riccobono, F., Frizzo, P., and Raccagni, L.: Environmental geochemical maps of Italy from the FOREGS database, Geochemistry: Exploration, Environment, Analysis, 8, 267–277, 2008.
Dunn, J. C.: A fuzzy relative of the ISODATA process and its use in detecting compact well-separated clusters, J. Cybernetics, 3, 32–57, 1973.
Ersoy, A. and Yunsel, T. Y.: Geochemical modelling and mapping of Cu and Fe anomalies in soil using combining sequential Gaussian co-simulation and local singularity analysis: a case study from Dedeyazı (Malatya) region, SE Turkey, Geochemistry: Exploration, Environment, Analysis, 19, 331–342, 2019.
Fan, W., Liu, G., Chen, Q., Lu, L., Cui, Z., Zuo, B., and Wu, X.: Extraction of weak geochemical anomalies based on multiple-point statistics and local singularity analysis, Comput. Geosci., 28, 157–173, 2024.
Fatehi, M. and Asadi, H. H.: Application of semi-supervised fuzzy c-means method in clustering multivariate geochemical data, a case study from the Dalli Cu-Au porphyry deposit in central Iran, Ore Geol. Rev., 81, 245–255, 2017.
Fawcett, T.: An introduction to ROC analysis, Pattern Recogn. Lett., 27, 861–874, 2006.
Gabriel, K. R.: The biplot graphic display of matrices with application to principal component analysis, Biometrika, 58, 453–467, 1971.
Gonçalves, M. A., Mateus, A., Pinto, F., and Vieira, R.: Using multifractal modelling, singularity mapping, and geochemical indexes for targeting buried mineralization: Application to the W-Sn Panasqueira ore-system, Portugal, J. Geochem. Explor., 189, 42–53, 2018.
Grunsky, E., Greenacre, M., and Kjarsgaard, B.: GeoCoDA: Recognizing and validating structural processes in geochemical data. A workflow on compositional data analysis in lithogeochemistr, Appl. Comput. Geosci., 22, 100149, https://doi.org/10.1016/j.acags.2023.100149, 2023.
Grunsky, E. C., Drew, L. J., and Sutphin, D. M.: Process recognition in multi-element soil and stream-sediment geochemical data, Appl. Geochem., 24, 1602–1616, 2009.
Grunsky, E. C. and de Caritat, P.: State-of-the-art analysis of geochemical data for mineral exploration, Geochemistry: Exploration, Environment, Analysis, 20, 217–232, 2020.
Grunsky, E. C. and Kjarsgaard, B. A.: Recognizing and validating structural processes in geochemical data: examples from a diamondiferous kimberlite and a regional lake sediment geochemical survey, in: Compositional Data Analysis: CoDaWork, L'Escala, Spain, 6 June 2015, Springer International Publishing, 85–115, https://doi.org/10.1007/978-3-319-44811-4_7, 2016.
Gustafson, D. and William, K.: Fuzzy Clustering with a Fuzzy Covariance Matrix, in: 1978 IEEE Conference on Decision and Control Including the 17th Symposium on Adaptive Processes, San Diego, CA, USA, 761–66, https://doi.org/10.1109/CDC.1978.268028, 1978.
Hart, S. R.: A large-scale isotope anomaly in the Southern Hemisphere mantle, Nature, 309, 753–757, 1984.
Hou, Z., Duan, L., Lu, Y., Zheng, Y., Zhu, D., Yang, Z., Yang, Z., Wang, B., Pei, Y., Zhao, Z., and McCuaig, T. C.: Lithospheric architecture of the Lhasa terrane and its control on ore deposits in the Himalayan-Tibetan orogen, Econ. Geol., 110, 1541–1575, 2015.
Kaufman, L. and Rousseeuw, P. J.: Finding groups in data: an introduction to cluster analysis, John Wiley & Sons, https://doi.org/10.2307/2532178, 2009.
Li, X., Yuan, F., Jowitt, S.M., Zhou, K., Wang, J., Zhou, T., Hu, X., Zhou, J., and Li, Y.: Singularity mapping of fracture fills and its relationship to deep concealed orebodies–a case study of the Shaxi porphyry Cu-Au deposit, China, Geochemistry: Exploration, Environment, Analysis, 17, 252–260, 2017.
Li, X.: Types and distribution of epithermal gold deposit in northwest Sichuan, Acta Geologica Sichuan, 16, 135–141, 1996 (in Chinese with English abstract).
Liu, G., Wang, E., Chen, Y., Chang, C., Cong, R., Zhang, H., Li, Y., and Chao, Y.: Metollogenic conditions for gold deposits in the northwest Sichuan Province, Contributions to Geology and Mineral Resources Research, 25, 5–11, 2010 (in Chinese with English abstract).
Liu, Y. and Carranza, E. J. M.: Uncertainty analysis of geochemical anomaly by combining sequential indicator co-simulation and local singularity analysis, Natural Resources Research, 31, 1889–1908, 2022.
Mole, D. R., Fiorentini, M. L., Thebaud, N., Cassidy, K. F., McCuaig, T. C., Kirkland, C. L., Romano, S. S., Doublier, M. P., Belousova, E. A., Barnes, S. J., and Miller, J.: Archean komatiite volcanism controlled by the evolution of early continents, P. Natl. Acad. Sci USA. 111, 10083–10088, 2014.
Mueller, U. A. and Grunsky, E. C.: Multivariate spatial analysis of lake sediment geochemical data; Melville Peninsula, Nunavut, Canada, Appl. Geochem., 75, 247–262, 2016.
Pearce, J. A., Stern, R. J., Bloomer, S. H., and Fryer, P.: Geochemical mapping of the Mariana arc-basin system: Implications for the nature and distribution of subduction components, Geochem. Geophy. Geosy. 6, Q07006, https://doi.org/10.1029/2004GC000895, 2005.
Pirajno, F.: Hydrothermal processes and mineral systems, Springer Science & Business Media, https://doi.org/10.1007/978-1-4020-8613-7, 2008.
Reimann, C., Melezhik, V., and Niskavaara, H.: Low-density regional geochemical mapping of gold and palladium highlighting the exploration potential of northernmost Europe, Econ. Geol., 102, 327–334, 2007.
Reimann, C., Filzmoser, P., Garrett, R., and Dutter, R.: Statistical data analysis explained: applied environmental statistics with R, John Wiley & Sons, https://doi.org/10.1002/9780470987605, 2011.
Reimann, C., Ladenberger, A., Birke, M., and Caritat, P. D.: Low density geochemical mapping and mineral exploration: application of the mineral system concept, Geochemistry: Exploration, Environment, Analysis, 16, 48–61, 2016.
Robb, L.: Introduction to ore-forming processes, John Wiley & Sons, ISBN 0125962525, 2020.
Rose, A. W., Hawkes, H. E., and Webb, J. S.: Geochemistry in mineral exploration, 2nd Edition, Academic Press, https://doi.org/10.1016/j.oregeorev.2021.104511, 1979.
Rousseeuw, P. J.: Silhouettes: a graphical aid to the interpretation and validation of cluster analysis, J. Computat. Appl. Math., 20, 53–65, 1987.
Sadeghi, B.: Simulated-multifractal models: a futuristic review of multifractal modeling in geochemical anomaly classification, Ore Geol. Rev., 139, 104511, https://doi.org/10.1016/j.oregeorev.2021.104511, 2021.
Sadeghi, B. and Cohen, D. R.: Decision-making within geochemical exploration data based on spatial uncertainty–A new insight and a futuristic review, Ore Geol. Rev., 161, 105660, https://doi.org/10.1016/j.oregeorev.2023.105660, 2023.
Sammon, L. G., McDonough, W. F., and Mooney, W. D.: Compositional attributes of the deep continental crust inferred from geochemical and geophysical data, J. Geophys. Res.-Sol. Ea., 127, e2022JB024041, https://doi.org/10.1029/2022JB024041, 2022.
Sillitoe, R. H.: Porphyry copper systems, Econ. Geol., 105, 3–41, 2010.
Smith, D. B. and Reimann, C.: Low-density geochemical mapping and the robustness of geochemical patterns, Geochemistry: Exploration, Environment, Analysis, 8, 219–227, 2008.
Suganya, R. and Shanthi, R.: Fuzzy c-means algorithm-a review, International Journal of Scientific and Research Publications, 2, 440–442, 2012.
Talebi, H., Mueller, U., Tolosana-Delgado, R., Grunsky, E. C., McKinley, J. M., and Caritat, P. D.: Surficial and deep earth material prediction from geochemical compositions, Nat. Resour. Res., 28, 869–891, 2019a.
Talebi, H., Mueller, U., Tolosana-Delgado, R., and van den Boogaart, K.G.: Geostatistical simulation of geochemical compositions in the presence of multiple geological units: application to mineral resource evaluation, Math. Geosci., 51, 129-153, 2019b.
Tibshirani, R., Walther, G., and Hastie, T.: Estimating the number of clusters in a data set via the gap statistic, J. R. Stat. Soc. B, 63, 411–423, 2001.
Wang, C., Bagas, L., Lu, Y., Santosh, M., Du, B., and McCuaig, T.C.: Terrane boundary and spatio-temporal distribution of ore deposits in the Sanjiang Tethyan Orogen: Insights from zircon Hf-isotopic mapping, Earth-Sci. Rev., 156, 39–65, 2016.
Wang, C., Zhao, K. D., Chen, J., and Ma, X.: Examining fingerprint trace elements in cassiterite: Implications for primary tin deposit exploration, Ore Geol. Rev., 149, 105082, https://doi.org/10.1016/j.oregeorev.2022.105082, 2022.
Wang, H., Zuo, R., Carranza, E. J. M., and Madani, N.: Modelling spatial uncertainty of geochemical anomalies using fractal and sequential indicator simulation methods, Geochemistry: Exploration, Environment, Analysis, 22, 4, https://doi.org/10.1144/geochem2022-029, 2022.
Wang, J. and Zuo, R.: Identification of geochemical anomalies through combined sequential Gaussian simulation and grid-based local singularity analysis, Comput. Geosci., 118, 52–64, 2018.
Wang, J. and Zuo, R.: Model averaging for identification of geochemical anomalies linked to mineralization, Ore Geol. Rev., 146, 104955, https://doi.org/10.1016/j.oregeorev.2022.104955, 2022.
Wang, J. and Zuo, R.: Uncertainty quantification in geochemical mapping: A review and recommendations. Geochem. Geophy. Geosy., 25, e2023GC011301, https://doi.org/10.1029/2023GC011301, 2024.
Wang, K., Yao, S., Yang, Y., and Dai, J.: Geological characteristics and origin of Manaoke fine-grained disseminated gold deposit in northwestern Sichuan Province, Mineral Deposits, 23, 494–501, 2004 (in Chinese with English abstract).
Wang, Q., Yao, S., and Liang, B.: Discussion of ore-forming tectonic dynamics of gold deposits in northwest Sichuan Province, Geological Science and Technology Information, 22, 80–84, 2003 (in Chinese with English abstract).
Wang, Q. and Liang, B.: Control of structure over the dissemination gold deposits in northwest Sichuan Province, Journal of Mineralogy and Petrology, 24, 49–52, 2004 (in Chinese with English abstract).
Wang, T., Huang, H., Zhang, J., Wang, C., Cao, G., Xiao, W., Yang, Q., and Bao, X.: Voluminous continental growth of the Altaids and its control on metallogeny, Natl. Sci. Rev., 10, p.nwac283, https://doi.org/10.1093/nsr/nwac283, 2023.
Wang, W., Cheng, Q., Zhang, S., and Zhao, J.: Anisotropic singularity: A novel way to characterize controlling effects of geological processes on mineralization, J. Geochem. Explor., 189, 32–41, 2018.
Wang, X., Xie, X., Zhang, B., and Hou, Q.: Geochemical probe into China's continental crust, Acta Geoscientica Sinica, 32, 65–83, 2011.
White, W. M.: Geochemistry, John Wiley & Sons, ISBN 0470656689, 2020.
Xiao, F., Chen, J., Hou, W., Wang, Z., Zhou, Y., and Erten, O.: A spatially weighted singularity mapping method applied to identify epithermal Ag and Pb-Zn polymetallic mineralization associated geochemical anomaly in Northwest Zhejiang, China, J. Geochem. Explor., 189, 122–137, 2018.
Xie, X. and Beni, G.: A validity measure for fuzzy clustering, IEEE T. Pattern Anal., 13, 841–847, 1991.
Xie, X., Mu, X., and Ren, T.: Geochemical mapping in China, J. Geochem. Explor., 60, 99–113, 1997.
Xie, X., Wang, X., Zhang, Q., Zhou, G., Cheng, H., Liu, D., Cheng, Z., and Xu, S.: Multi-scale geochemical mapping in China, Geochemistry, 8, 333–341, 2008.
Xiong, Y. and Zuo, R.: Recognition of geochemical anomalies using a deep autoencoder network, Comput. Geosci., 86, 75-82, 2016.
Yousefi, M., Kreuzer, O. P., Nykänen, V., and Hronsky, J. M.: Exploration information systems – A proposal for the future use of GIS in mineral exploration targeting, Ore Geol. Rev., 111, 103005, https://doi.org//10.1016/j.oregeorev.2019.103005, 2019.
Zadeh, L. A.: Fuzzy sets, Inform. Control, 8, 338–353, 1965.
Zhang, G.: Metallogenic regularities and ore-prospecting direction of Manaoke gold deposit in Sichuan Province, Chengdu University of Technology, PhD thesis, 2014 (in Chinese with English abstract).
Zhang, S., Carranza, E. J. M., Xiao, K., Chen, Z., Li, N., Wei, H., Xiang, J., Sun, L., and Xu, Y.: Geochemically constrained prospectivity mapping aided by unsupervised cluster analysis, Nat. Resour. Res., 30, 1955–1975, 2021.
Zhao, Q.: Regional geology, geophysics and geochemistry of fine disseminated type of gold deposits in northwest Sichuan, Acta Geologica Sichaun, 15, 31–40, 1995 (in Chinese with English abstract).
Zhao, Q.: Supergene geochemical characteristics of ore-forming elements in gold deposits of west Sichuan plateau-prairie area, Geophysical & Geochemical Exploration, 23, 381–387, 1999 (in Chinese with English abstract).
Zheng, M., Gu, X., and Zhou, Y.: An analysis of metallogenic physicochemical conditions and metallogenic processes of the Dongbeizhai micro-disseminated gold deposit in Sichuan Province, Mineral Deposits, 9, 129–140, 1990 (in Chinese with English abstract).
Zuo, R., Carranza, E. J. M., and Wang, J.: Spatial analysis and visualization of exploration geochemical data, Earth-Sci. Rev., 158, 9–18, 2016.
Zuo, R.: Selection of an elemental association related to mineralization using spatial analysis, J. Geochem. Explor., 184, 150–157, 2018.
Zuo, R., Xiong, Y., Wang, J., and Carranza, E. J. M.: Deep learning and its application in geochemical mapping, Earth-Sci. Rev., 192, 1–14, 2019.
Zuo, R., Wang, J., Xiong, Y., and Wang, Z.: The processing methods of geochemical exploration data: past, present, and future, Appl. Geochem., 132, 105072, https://doi.org/10.1016/j.apgeochem.2021.105072, 2021a.
Zuo, R., Wang, J., and Yin, B.: Visualization and interpretation of geochemical exploration data using GIS and machine learning methods, Appl. Geochem., 134, 105111, https://doi.org/10.1016/j.apgeochem.2021.105111, 2021b.