the Creative Commons Attribution 4.0 License.
the Creative Commons Attribution 4.0 License.
 | 08 Jul 2024
Various lithospheric deformation patterns derived from rheological contrasts between continental terranes: insights from 2-D numerical simulations
Renxian Xie
Jason P. Morgan
Yongshun John Chen
Continents are formed by the amalgamation of numerous micro-terranes and island arcs, so they have spatially varying lithosphere strengths. The crème brûlée (CB) model and the jelly sandwich (JS) model have been commonly used to describe continental lithosphere strength–depth variations. Depending on the strength of the continental lower crust, the CB and JS models can be further subdivided into two subclasses in which the I subclass (CB-I and JS-I) and II subclass (CB-II and JS-II), respectively, have a strong or weak lower crust. During the continental collision, lithosphere deformation is the byproduct of the comprehensive interaction of multiple terranes. Here we used 2-D thermomechanical numerical models that contain three continental terranes to systematically explore the effects of terranes with various strengths on continental deformation and studied the effects of different rheological assumptions on terrane deformation. We found four types of lithosphere deformation patterns: collision, subduction, thickening and delamination, and replacement. These simulation patterns are seen in observed deformation patterns and structures in East Asia, suggesting they are likely to be naturally occurring modes of intracontinental orogenesis.
- Article
(11323 KB) - Full-text XML
-
Supplement
(3463 KB) - BibTeX
- EndNote


Continents have undergone multiple break-up and assembly events during the past ∼2 billion years, with the assembly events often being associated with the accretion and deformation of numerous micro-terranes (Mitchell et al., 2021). Accreted terranes have different ages ranging from ∼3500–3000 to 50–0 Ma and diverse compositions and structures linked to their diverse continental, arc, or oceanic origin, which often leads to them having distinct initial lithospheric thicknesses and strengths (Artemieva, 2006; Audet and Bürgmann, 2011; Pasyanos et al., 2014; Morgan and Vannucchi, 2022). The lithosphere of ancient continental terranes like cratons are usually thick and strong, while the younger lithosphere of continental margins and tectonically active regions is thin and weak (Audet and Bürgmann, 2011; Burov, 2011), and deeply buried former oceanic fragments can have temperature and strengths that vary over a ∼0.5 Gyr timescale (Morgan and Vannucchi, 2022).
Continental lithosphere strength conventionally been represented by two prevailing rheology models – the crème brûlée (CB) and the jelly sandwich (JS) idealizations (Chen and Molnar, 1983; Jackson, 2002; Burov and Watts, 2006; Bürgmann and Dresen, 2008; Burov, 2011). The crème brûlée scenario suggests that lithosphere strength resides entirely in the crust, with the lithospheric mantle being much weaker (with this strength contrast being the explanation for why little seismicity is typically seen in the continental mantle, despite rock mechanics arguments that it should usually be stronger than its overlying crust). In contrast, the jelly sandwich model is based on conventional rock mechanics arguments which imply that in general the continental middle and lower crust should be weaker than overlying cooler upper crust and underlying further-from-solidus lithospheric mantle (Fig. 1a). The rheology of the continental lower crust can also differ strongly in different continental terranes due to the varieties in composition, temperature, water content, stress, and tectonic environment (Bürgmann and Dresen, 2008; Hacker et al., 2015; Morgan and Vannucchi, 2022). Therefore, the CB and JS conceptualizations can be further subdivided into CB-I and CB-II and also JS-I and JS-II subclasses that reflect potentially variable strengths of the lower crust; CB-I and JS-I and also CB-II and JS-II have a strong and weak continental lower crust, respectively (Fig. 1a). Observations in eastern Asia show a wide variability in the terrane deformation styles that argue for the potential feasibility of all four of these rheological models (Fig. 1b).
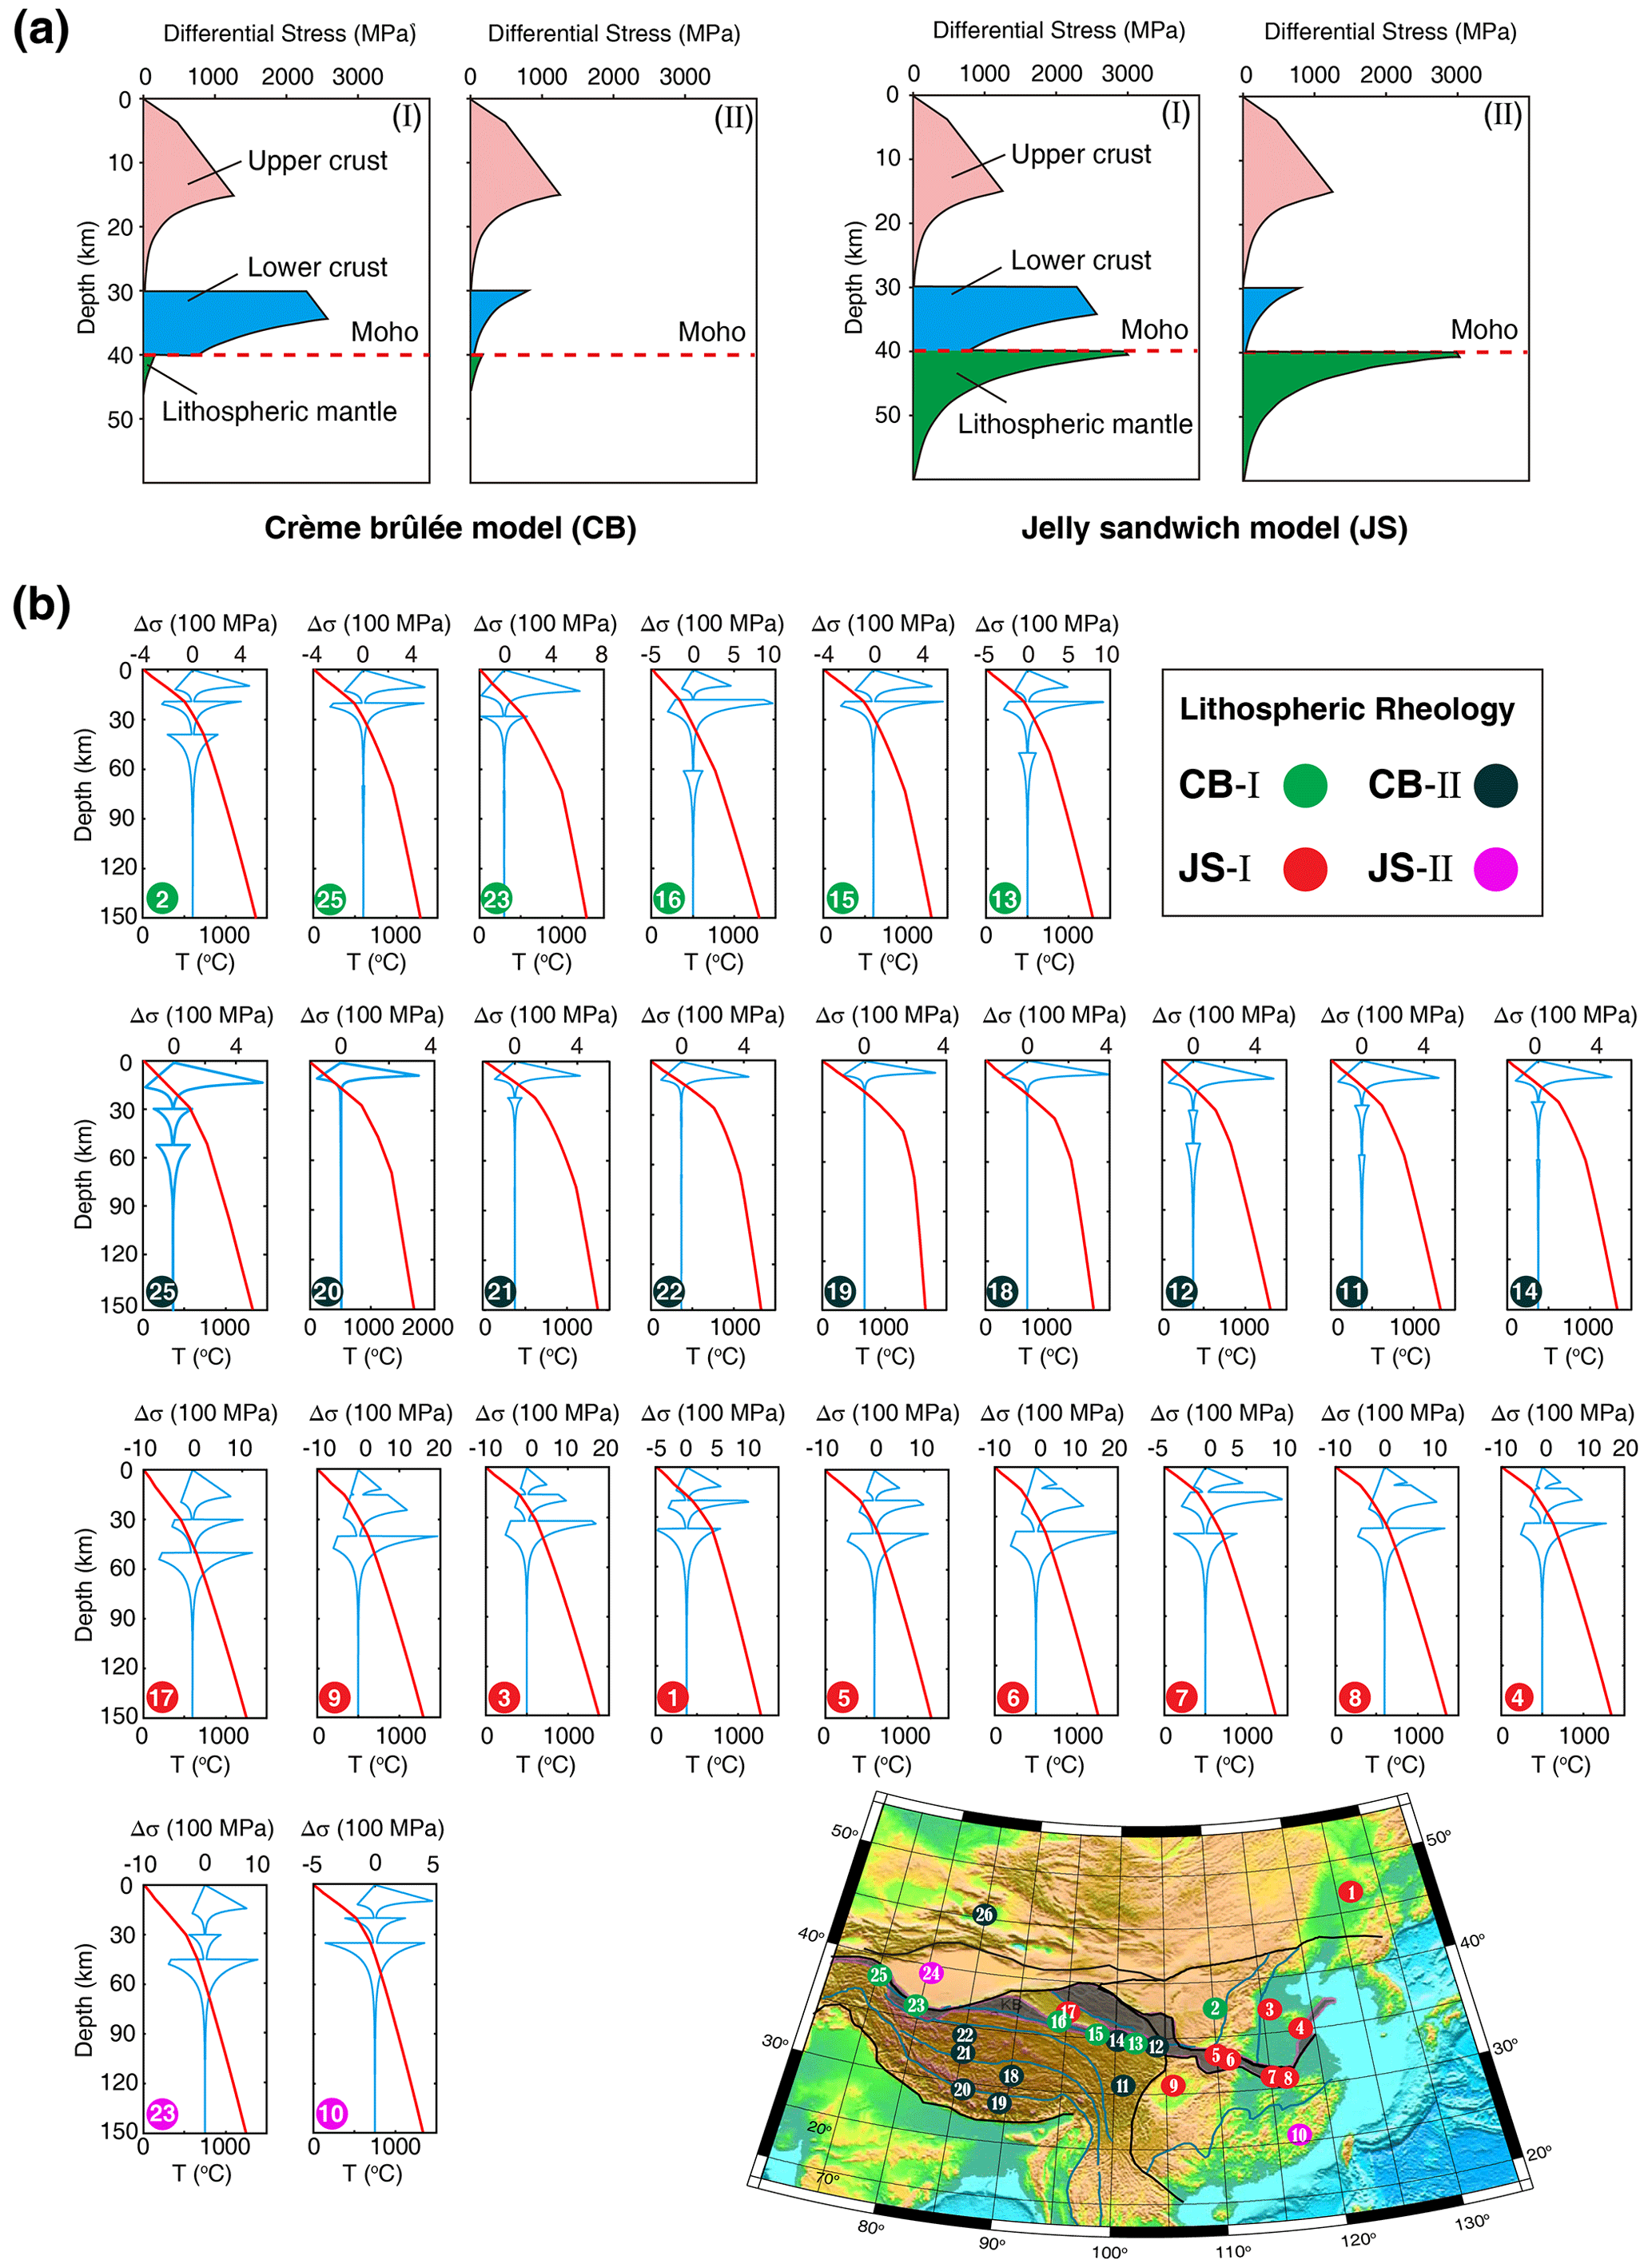
Figure 1Four rheological models of continental lithosphere. (a) Crème brûlée model (CB) and jelly sandwich model (JS). The two rheological models can be further subdivided into CB-I, CB-II, JS-I, and JS-II, according to the strength of the lower crust (modified from Jackson, 2002). (b) Observations of four distinct lithosphere rheological structures implied for East Asia (modified from Zhang et al., 2013). Locations of strength profiles are pointed out by dots with numbers in the topography map. Dots filled with different colors indicate different models of lithospheric rheology. These strength profiles are calculated based on observed geothermal structure and lithospheric structure and assumed that compositions of the upper and lower crust and lithospheric mantle are wet quartzite, undried granulite, and dry olivine, respectively. Variations in the temperature and lithospheric compositions lead to a diverse suite of strength profiles vs. depth.
Several previous numerical modeling studies have discussed the effects of rheological contrasts between terranes in lithosphere deformation in a collisional system. Studies containing two terranes have explored contrasts in crustal rheology and found that this can greatly change the morphology, size, and deep lithosphere structure of collisional orogenic belt (Chen, 2021; Chen et al., 2017; Cook and Royden, 2008; Faccenda et al., 2008; Sun and Liu, 2018; Vogt et al., 2018; Xie et al., 2021). Strong crust also has the potential to protect its underlying lithospheric mantle from deformation and destruction (Heron and Pysklywec, 2016). Studies containing three or more terranes in their models have usually focused on the middle terrane, which can play a crucial role in lithosphere deformation in a collisional system (Kelly et al., 2016, 2020; Z. H. Li et al., 2016; Huangfu et al., 2018, 2022; Sun and Liu, 2018; Xie et al., 2023). A weak middle terrane is easy to be thickened to the point where eventually its lithospheric mantle can be delaminated from the crust, while a moderate-strength middle terrane can induce far-field orogenesis, and a strong middle terrane may prevent propagation of deformation and facilitate underthrusting of the advancing terrane. In addition, some studies have also stressed the importance of local pre-existing weak zones which can change the order and style of lithosphere deformation (Chen et al., 2020; Heron et al., 2016; Sokoutis and Willingshofer, 2011; Xie et al., 2021).
A large-scale continental collisional system often involves multiple units of an indenting terrane, a middle terrane, and far-end backwall terranes. These terranes have different lithosphere rheologies and thicknesses, and they collectively contribute to several styles of continental deformation (Artemieva, 2006; Audet and Bürgmann, 2011; Pasyanos et al., 2014; Morgan and Vannucchi, 2022). Here, we use a 2-D thermomechanical numerical modeling method to systematically study the effects of terranes with various rheological properties on continental deformation. Our numerical models simulate a continent–continent collisional system that contains three continental terranes. They explores the effects of four groups of lithosphere deformation patterns linked to the four rheological idealizations of CB-I, CB-II, JS-I, and JS-II applied to each terrane. We will summarize the rheological features for each deformation pattern and then apply the simulations to better understand ongoing and past deformation histories of various orogenic belts in eastern Asia, such as the eastern Tien Shan orogenic belt, the Tibetan Plateau, and the Early Paleozoic Orogen in Southeastern China.
2.1 Numerical modeling method
Our thermomechanical models were performed with the I2VIS code of Gerya and Yuen (2003a), previously used in Xie et al. (2021, 2023). This code combines finite differences with marker-in-cell techniques to solve the mass, momentum, and energy conservation equations for incompressible flow. It incorporates the non-Newtonian viscoplastic rheologies for the lithosphere, as well as the possibility of including parameterizations of the effects of surface processes like sedimentation and erosion.
2.1.1 Governing equations
The mass conservation equation for incompressible flow is
The momentum conservation equations (Stokes equations) are
The energy (heat) conservation equation is
where x and y represent the horizontal and vertical coordinate directions, and vx and vy are the corresponding velocity components, respectively. and ) are deviatoric stress and strain rate tensors, respectively; g is the gravitational acceleration; and ρ is density. In the heat conservation equation, qx and qy are the horizontal and vertical components of the heat flux, respectively; Cp is the heat capacity, and Hr, Ha, Hs, and HL denote the radioactive, adiabatic, shear, and latent heat production, respectively; and k is the thermal conductivity.
The rheological constitutive relationship connects the deviatoric stress and strain rate:
where ηeff is the effective viscosity.
2.1.2 Rheology
Here we make the conventional assumption that the crust and mantle have a viscoplastic rheology. Viscous deformation is determined as a combination of diffusion and dislocation creep that depends on temperature, pressure, and strain rate and is expressed as (Gerya, 2019)
For mineral aggregates, both dislocation and diffusion creep occur simultaneously, with a combined effective viscosity given by
where ηdisl and ηdiff are viscosities for dislocation and diffusion creep, respectively. σcr is the critical stress for the dislocation-to-diffusion stress transition, and the parameters AD, Ea, Va, and n are a material constant, activation energy, activation volume, and stress exponent, respectively. R is the universal gas constant. The strength scaling factor, S, is introduced as a simple parameter to vary the lithospheric viscosity.
Plasticity is implemented using a conventional pseudo-viscous yield criterion first used to study rifting (e.g., Chen and Morgan, 1990) that is extended to include a strain-weakening-like parameterization of fracture-related strain weakening (Gerya, 2010; Vogt et al., 2017):
where σyield is yield stress, P is dynamic pressure, γ is the integrated plastic strain, and γcr is the upper strain limit for fracture-related weakening. C and ϕ are the cohesion and friction angle that depend on the plastic value. Ca and ϕa are the initial and Cb and ϕb are final strength values, respectively. This involves making the rheological assumption that deeply percolating fluids and high pore fluid pressure can significantly lower the plastic strength of fractured rocks.
The final effective viscosity is determined by the minimum value between the ductile and plastic viscosities as follows (Ranalli, 1995):
2.1.3 Surface processes
Topography in our models evolves according to a transport equation that is solved at each time step, with a crude local parameterization of effects of accounts for sedimentation and erosion:
where yes is the vertical position of the surface as a function of horizontal distance x, and vx and vy are the corresponding velocity components, respectively. vs and ve are the sedimentation and erosion rates, respectively, conforming to the relation
Owing to the fact that surface processes are not our focus in this study, for the aim of simplification, we adopt a small erosion and sedimentation rates of 0.3 mm yr−1 which are similar to previous studies (Gerya and Yuen, 2003b; Bian et al., 2020). Moreover, we simply choose a very large value of 5 km as the threshold for initiating denudation and sedimentation to further weaken the influences of surface processes on the evolutions of our model.
2.2 Model setup
The 2-D numerical model covers a rectangular computational domain of 3000 km × 700 km and consists of 1360×400 non-uniform grid cells with dozens of mobile markers in each grid cell to transport physical properties (Fig. 2a). Above 300 km, the cell size of the grid in the middle of the model (x=1300–2200 km) is 1 km × 1 km and gradually widens towards the two sides to finally become 5 km × 1 km. From the 300 km depth to the model bottom, each grid is stretched to 5 km in the vertical direction. As a result, the grid in the middle of the model (x=1300–2200 km) is 1 km × 5 km and 5 km × 5 km in other regions. Changing resolutions in different model regions can ensure the model can finely depict lithosphere deformation in the region of interest while improving the calculation's efficiency.

Figure 2Initial model setup. (a) Initial model configuration. The model size is 3000 km × 700 km, and the size of study region is 1500 km × 500 km. Three continental terranes of the pro-, mid-, and retro-terranes are contained in the numerical model, and they are 200, 130, and 160 km thick, respectively. White lines are isotherms with an interval of 600 °C. Yellow arrows indicate the convergence rate of 20 mm yr−1. Colored grids are as follows: 1 – sticky air; 2 – sediments; 3 – weak zone; 4, 6, 8 – the upper crust of the pro-, mid-, and retro-terranes, respectively; 5, 7, 9 – the lower crust of the pro-, mid-, and retro-terranes, respectively; 10, 11, 12 – lithospheric mantle of the pro-, mid-, and retro-terranes, respectively; 13 – asthenosphere. (b) Initial temperature structure for the three terranes. The pro- and mid-terranes, respectively, have a coldest and warmest lithospheric mantle due to their differences in the lithosphere thicknesses. (c) Four rheological models with contrasting lithospheric strength profiles. These are derived from different strength scaling factor (S) combinations for the upper crust, lower crust, and lithospheric mantle (Table S1 in the Supplement). Strength profiles are calculated based on the pro-terrane's initial lithospheric structure, composition, and temperature field. The prescribed strain rate is s−1. CB-I and CB-II are the crème brûlée model with a strong and weak lower crust, respectively; JS-I and JS-II are the jelly sandwich model with a strong and weak lower crust, respectively.
In the initial configuration, the model comprises three continental terranes – the pro-, mid-, and retro-terrane – which refer to the indenting “pro-” terrane driven by plate convergence, an intermediate “mid-” terrane, and a far-end backwall “retro-” terrane, respectively (Fig. 2a). For the purposes of simplification, the three terranes are assumed to have the same initial crustal structure with 20 km thick upper and lower crust, respectively. In the meantime, to simulate lateral structure differences within continental lithosphere (Pasyanos et al., 2014), the thicknesses of the initial lithospheric mantle of the pro-, mid-, and retro-terrane are 160, 90, and 120 km, respectively. The rest of the region is filled by asthenosphere, except along the model top, where a 20 km thick layer of “sticky air” with low viscosity (1×10¹⁸ Pa s) and low density (1 kg m−3) is placed to simulate the effects of a free surface (Schmeling et al., 2008). Flow laws and material properties for each lithospheric layer are listed in Table 1.
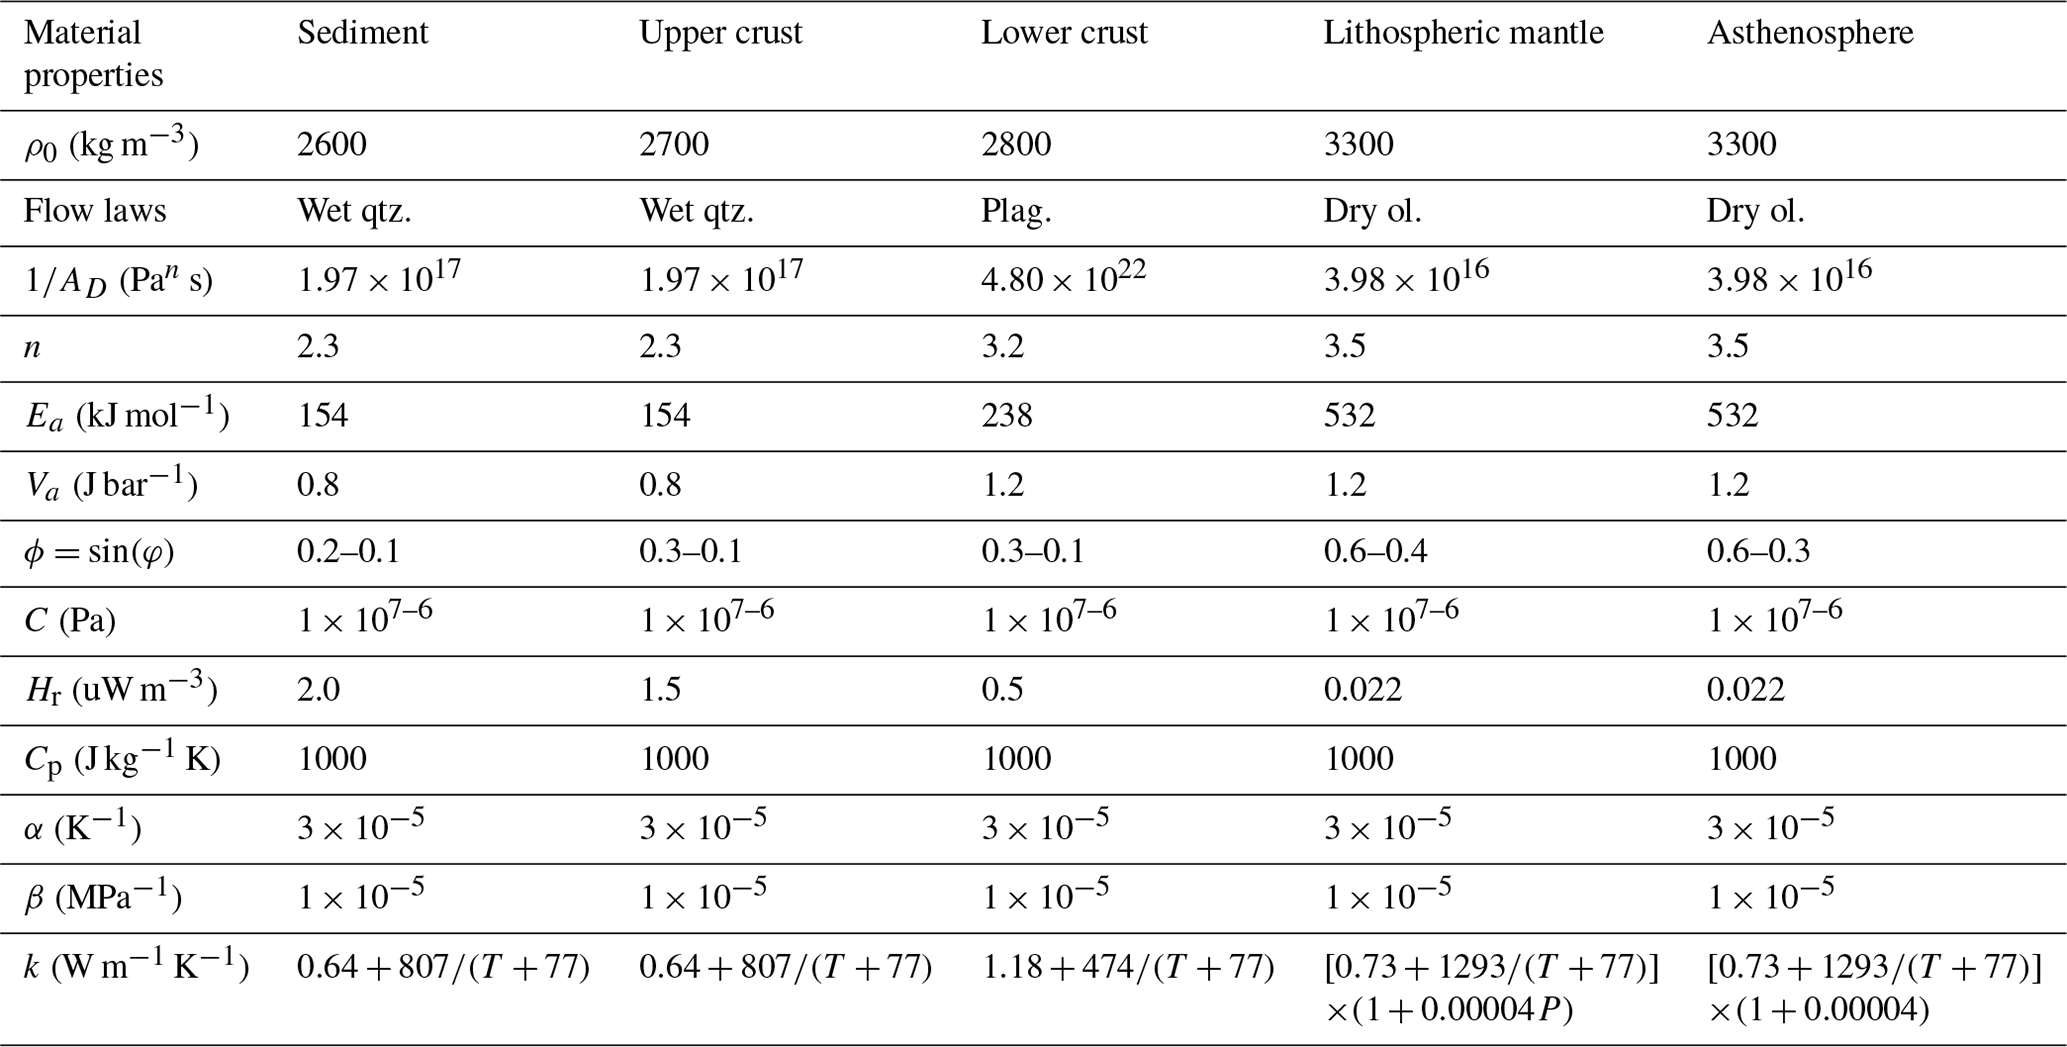
Table 1Flow laws and material properties for different lithospheric layers. ρ0 is the initial density; it evolves with time as , where T0=20 °C, P0=105 MPa. Flow laws use the following abbreviations: qtz. is for quartzite, Plag. is for plagioclase, and ol. is for olivine.
Mechanical boundary conditions of the model are such that the top and sides are free-slip boundaries, meaning that the vertical velocity at the top boundary and horizontal velocity at the side boundaries are all zero. The bottom is assumed to be a somewhat non-physical “permeable boundary” that was developed to reduce the required depth of the computational region (Burg and Gerya, 2005). For top-driven flows like those considered here, this approximation has been shown to not affect deformation in the upper parts of the region (Burg and Gerya, 2005). Finally, a constant convergence rate of 20 mm yr−1 is assigned to the pro-terrane (x=1000 km) to drive the model.
Initial temperature conditions are set as follows: the model top is set to 0 °C, the two side boundaries are adiabatic boundaries with zero horizontal heat fluxes, and the model bottom has an initial temperature of 1593 °C and can dynamically adjust as the model evolves. The initial thermal gradient in the crust is 15 °C km−1 in the three terranes, so their Moho temperature is 600 °C. A temperature of 1330 °C is applied at the bottom of the lithospheric mantle of the three terranes, which leads to the pro- and mid-terrane having minimum and maximal thermal gradients in the lithospheric mantle, respectively (see the right plane in Fig. 2a). An adiabatic thermal gradient of 0.5 °C km−1 is assumed within the asthenosphere. The temperature field would evolve over time; thus, although the three terranes are not in thermal equilibrium at the start of the experiments, it has little effect on the model evolution. The initial setup of lithosphere structure and temperature field makes the mid-terrane weakest when the same rheology model is used for the three terranes.
The rheological models of CB-I, CB-II, JS-I, and JS-II result from different strength scaling factors for the upper crust, the lower crust, and the lithospheric mantle in our numerical models (Fig. 2b). We systematically test the effects of these rheological assumptions on the deformation of the pro-, mid-, and retro-terranes. According to the different behaviors of lithosphere deformation, these simulation results can be categorized into four basic modes of collision, subduction, thickening and delamination, and replacement (Figs. S1 and S2 in the Supplement). In the deformation mode of collision, the lithospheric mantle of the mid-terrane is extruded out, and the lithospheric mantles of the two bounding terranes meet and collide together. In the deformation mode of subduction, the lithospheric mantle of one of the bounding terranes subducts into the deep mantle below the mid-terrane while the other one keeps almost undeformed. In the deformation mode of thickening and delamination, one of the bounding terranes is shortened by compression, and delamination may come on the heels of thickening of lithosphere due to gravitational instability in some cases. In the deformation mode of replacement, the bottom of the weak and thick lithospheric mantle of the bounding terrane is scraped off by the strong lithospheric mantle of the mid-terrane and replaced by the latter. Here, we select a typical case for each mode of the lithosphere deformation to describe more details of these modes of model evolution.
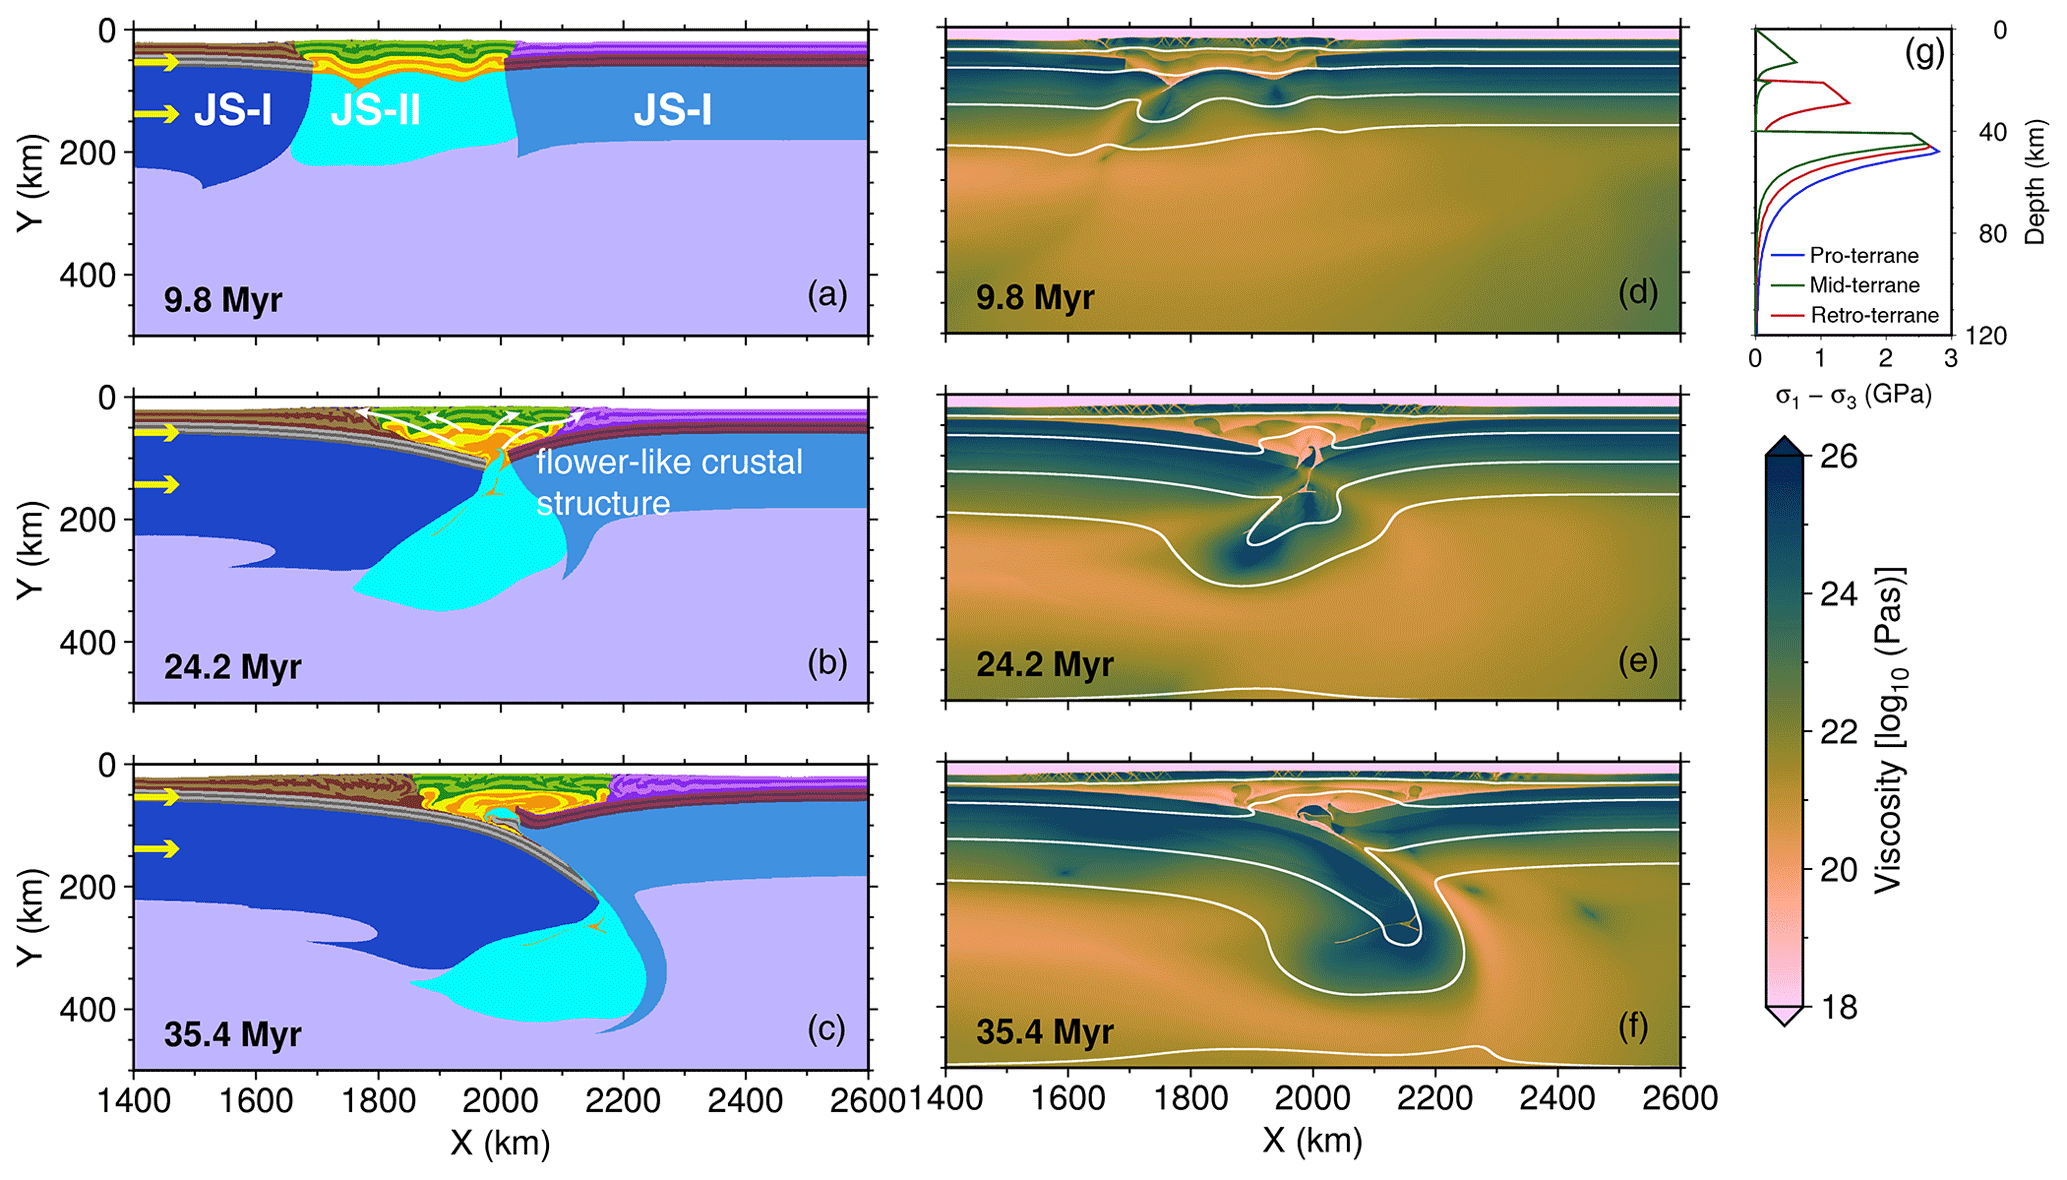
Figure 3Collision of the lithospheres of the pro- and retro-terranes. Rheological models for the pro-, mid-, and retro-terranes are JS-I, JS-II, and JS-I, respectively, as shown in panel (g). (a–c) The left panel shows compositional fields at 9.8, 24.2, and 35.4 Myr, respectively. Yellow arrows indicate the convergence rate. (d–f) The right panel shows the corresponding viscosities. White lines are isotherms with an interval of 300 °C.
3.1 Case 1: lithosphere collision
Case 1 represents the scenario of lithosphere collision (Fig. 3). In this model, the assumed rheological models for the pro-, mid-, and retro-terrane are JS-I, JS-II, and JS-I, respectively, which means that the mid-terrane has a significantly weaker lower crust relative to the pro- and retro-terranes. The lithospheric mantle of the mid-terrane is also slightly weaker due to its thinner lithosphere and correspondingly higher initial temperature field. The lithosphere strength profiles of the three terranes are shown in Fig. 3g.
The mid-terrane is the first to deform when the pro-terrane begins to collide, absorbing plate convergence in the form of lithosphere thickening (Fig. 3a and d). The upper crust of the mid-terrane breaks due to strain weakening, and several reverse faults are formed to absorb the crustal shortening. The lower crust folds, and strain diffusely distributes within it. Since the retro-terrane is relatively strong, it prevents crustal deformation from propagating into this terrane and restricts the bulk of deformation to the mid-terrane. With the continuous advance of the pro-terrane and resistance of the retro-terrane, the crust of the mid-terrane is intensively shortened, leading to more thrusting structures in the upper crust and a “flower-like” structure in the lower crust (Fig. 3b and e). Thrust structures and crustal deformation also expand toward the pro- and retro-terranes at this stage. Topography also grows towards the two bounding terranes (Fig. 7a). Ultimately, the weak lithospheric mantle of the mid-terrane is squeezed out, and the pro- and retro-terrane's lithospheric mantles meet and so start to collide beneath the overlying crust of the mid-terrane (Fig. 3c and f).
3.2 Case 2: lithosphere subduction
Case 2 shows lithosphere subduction of the pro-terrane (Fig. 4). In this model, the assumed rheological models for the pro-, mid-, and retro-terrane are JS-II, JS-I, and JS-I, respectively. The mid-terrane has a stronger lower crust compared with the pro-terrane, but its lithospheric mantle is a little weaker than the pro-terrane due to higher-temperature field resulting from its thinner lithosphere structure (Fig. 4g). When convergence begins, the weak lower crust of the pro-terrane is blocked by the stronger lower crust of the mid-terrane. This induces it to stack in a collisional front to form a remarkable folding structure (Fig. 4a and d). The strong lithospheric mantle of the pro-terrane continues to move forward and underthrusts beneath the mid-terrane. As the pro-terrane advances, its crust gradually enters the mid-terrane, inducing shortening and thickening of the upper crust of the mid-terrane, while the strong lower crust of the mid-terrane almost keeps undeformed (Fig. 4b and e).
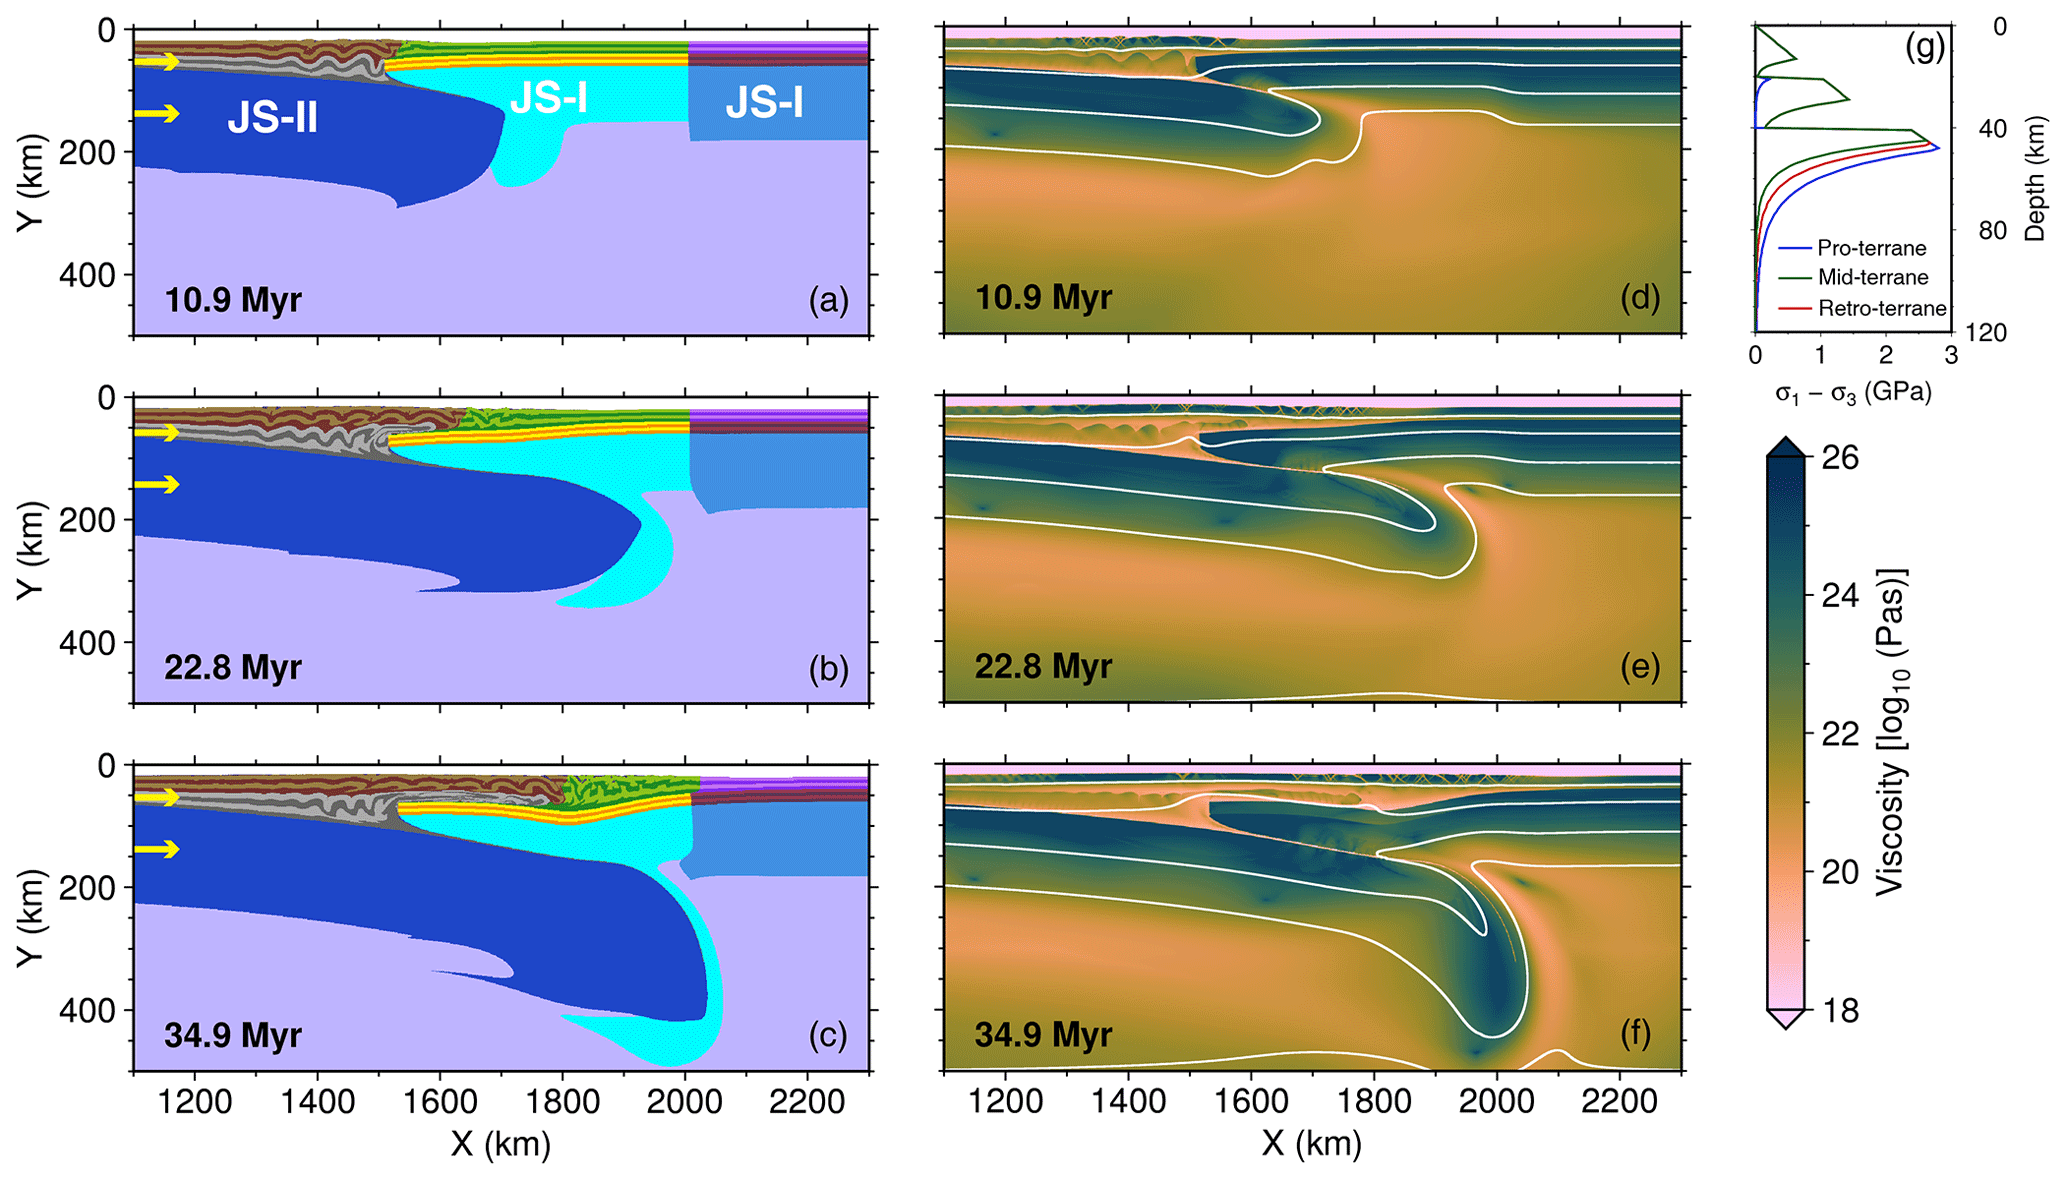
Figure 4Subduction of the lithosphere of the pro-terrane. Rheological models for the pro-, mid-, and retro-terranes are JS-II, JS-I, and JS-I, respectively. See Fig. 3 for the plotting conventions.
Meanwhile, the lithospheric mantle of the pro-terrane continues to underthrust, scraping off part of the lithospheric mantle of the mid-terrane. Eventually, the crust of the pro-terrane wedges a long distance into the mid-terrane, and the lithospheric mantle of the pro-terrane subducts into the deeper mantle (Fig. 4d and f). In this example, crustal deformation and topography gradually propagate from the pro-terrane to the mid-terrane, whereas the retro-terrane remains nominally “undeformed” at all times (Fig. 7b). In some experiments, the lithospheric mantle of the retro-terrane can subduct beneath the mid-terrane (Fig. S1).
3.3 Case 3: lithosphere thickening and delamination
Case 3 illustrates the thickening and delamination of the lithospheric mantle of the pro-terrane (Fig. 5). In this case, the rheological models for the pro-, mid-, and retro-terranes are CB-II, JS-I, and JS-I, respectively (Fig. 5j). The pro-terrane has a rheologically weaker lower crust and lithospheric mantle, making it relatively easy to deform once the collision has started. The lithosphere of the pro-terrane is first thickened, and the crust starts to fold in two discrete zones (Fig. 5a and f). The lower part of the thickened lithospheric mantle is denser than its ambient mantle, owing to lower temperature, which causes it to drip downwards (Fig. 5b–h). After delamination of the thickened lithosphere, the subduction of the pro-terrane's lithospheric mantle along one of the deformation localization zones absorbs the plate convergence (Fig. 5e and i). Crustal deformation is restricted in the pro-terrane until lithosphere delamination, after which the crustal strain and topography rapidly spread from the pro-terrane to the mid-terrane (Fig. 7c). Like Case 2, the retro-terrane stays essentially undeformed at all times.
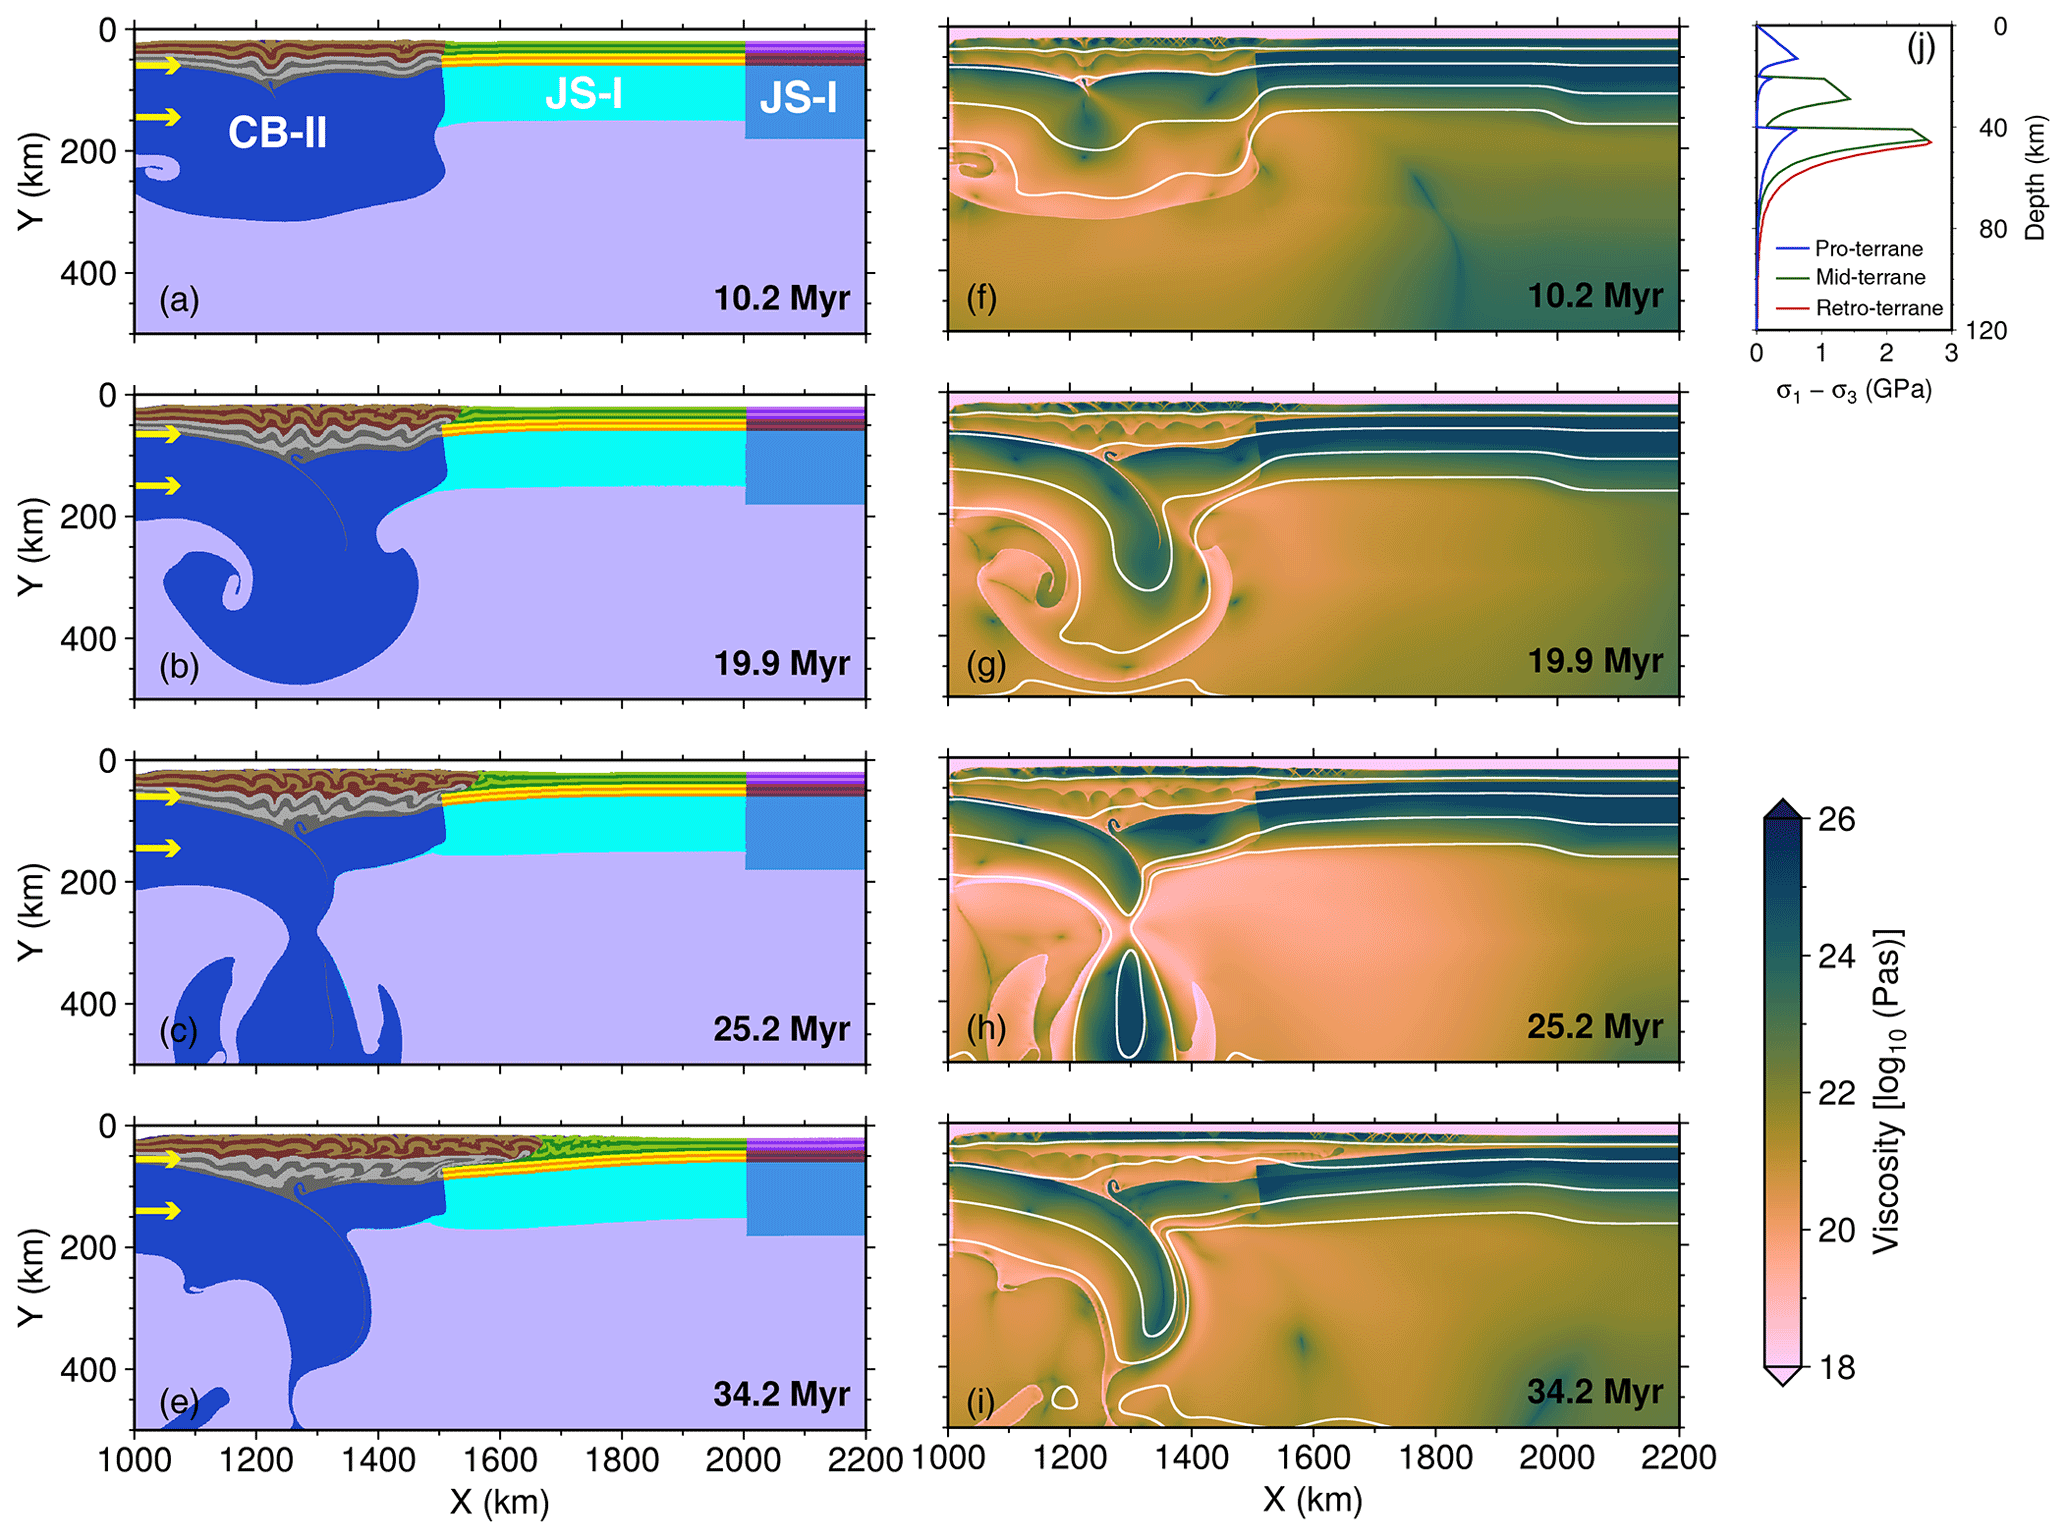
Figure 5Thickening and delamination of the lithosphere of the pro-terrane. Rheological models for the pro-, mid-, and retro-terranes are CB-II, JS-I, and JS-I, respectively. See Fig. 3 for the plotting conventions.
3.4 Case 4: lithosphere replacement
Case 4 illustrates how the lithospheric mantle of the pro-terrane is replaced by that of a neighboring stronger mid-terrane (Fig. 6). In this case, the rheological models for the pro-, mid-, and retro-terranes are CB-I, JS-II, and JS-I, respectively. The pro-terrane has a strong lower crust and a thick and weak lithospheric mantle, while the mid-terrane has a weaker lower crust and a strong lithospheric mantle (Fig. 6g). This lithosphere configuration between the pro- and the mid-terrane causes the deformation to be primarily distributed in the pro-terrane's lithospheric mantle and the mid-terrane's crust. As a result, the mid-terrane's crust becomes intensely shortened by fold and thrust structures, but its strong lithospheric mantle wedges into the pro-terrane's thick and weak lithospheric mantle (Fig. 6a, b, d and e). The strong lithospheric mantle of the mid-terrane scrapes off the lower part of the weak lithospheric mantle of the pro-terrane and so replaces it (Fig. 6c and f). Similar to Case 1, the crustal deformation and topography expand from the mid-terrane towards its side terranes (Fig. 7d). The lithospheric mantle of the retro-terrane can also be replaced in some cases (e.g., Fig. S1).
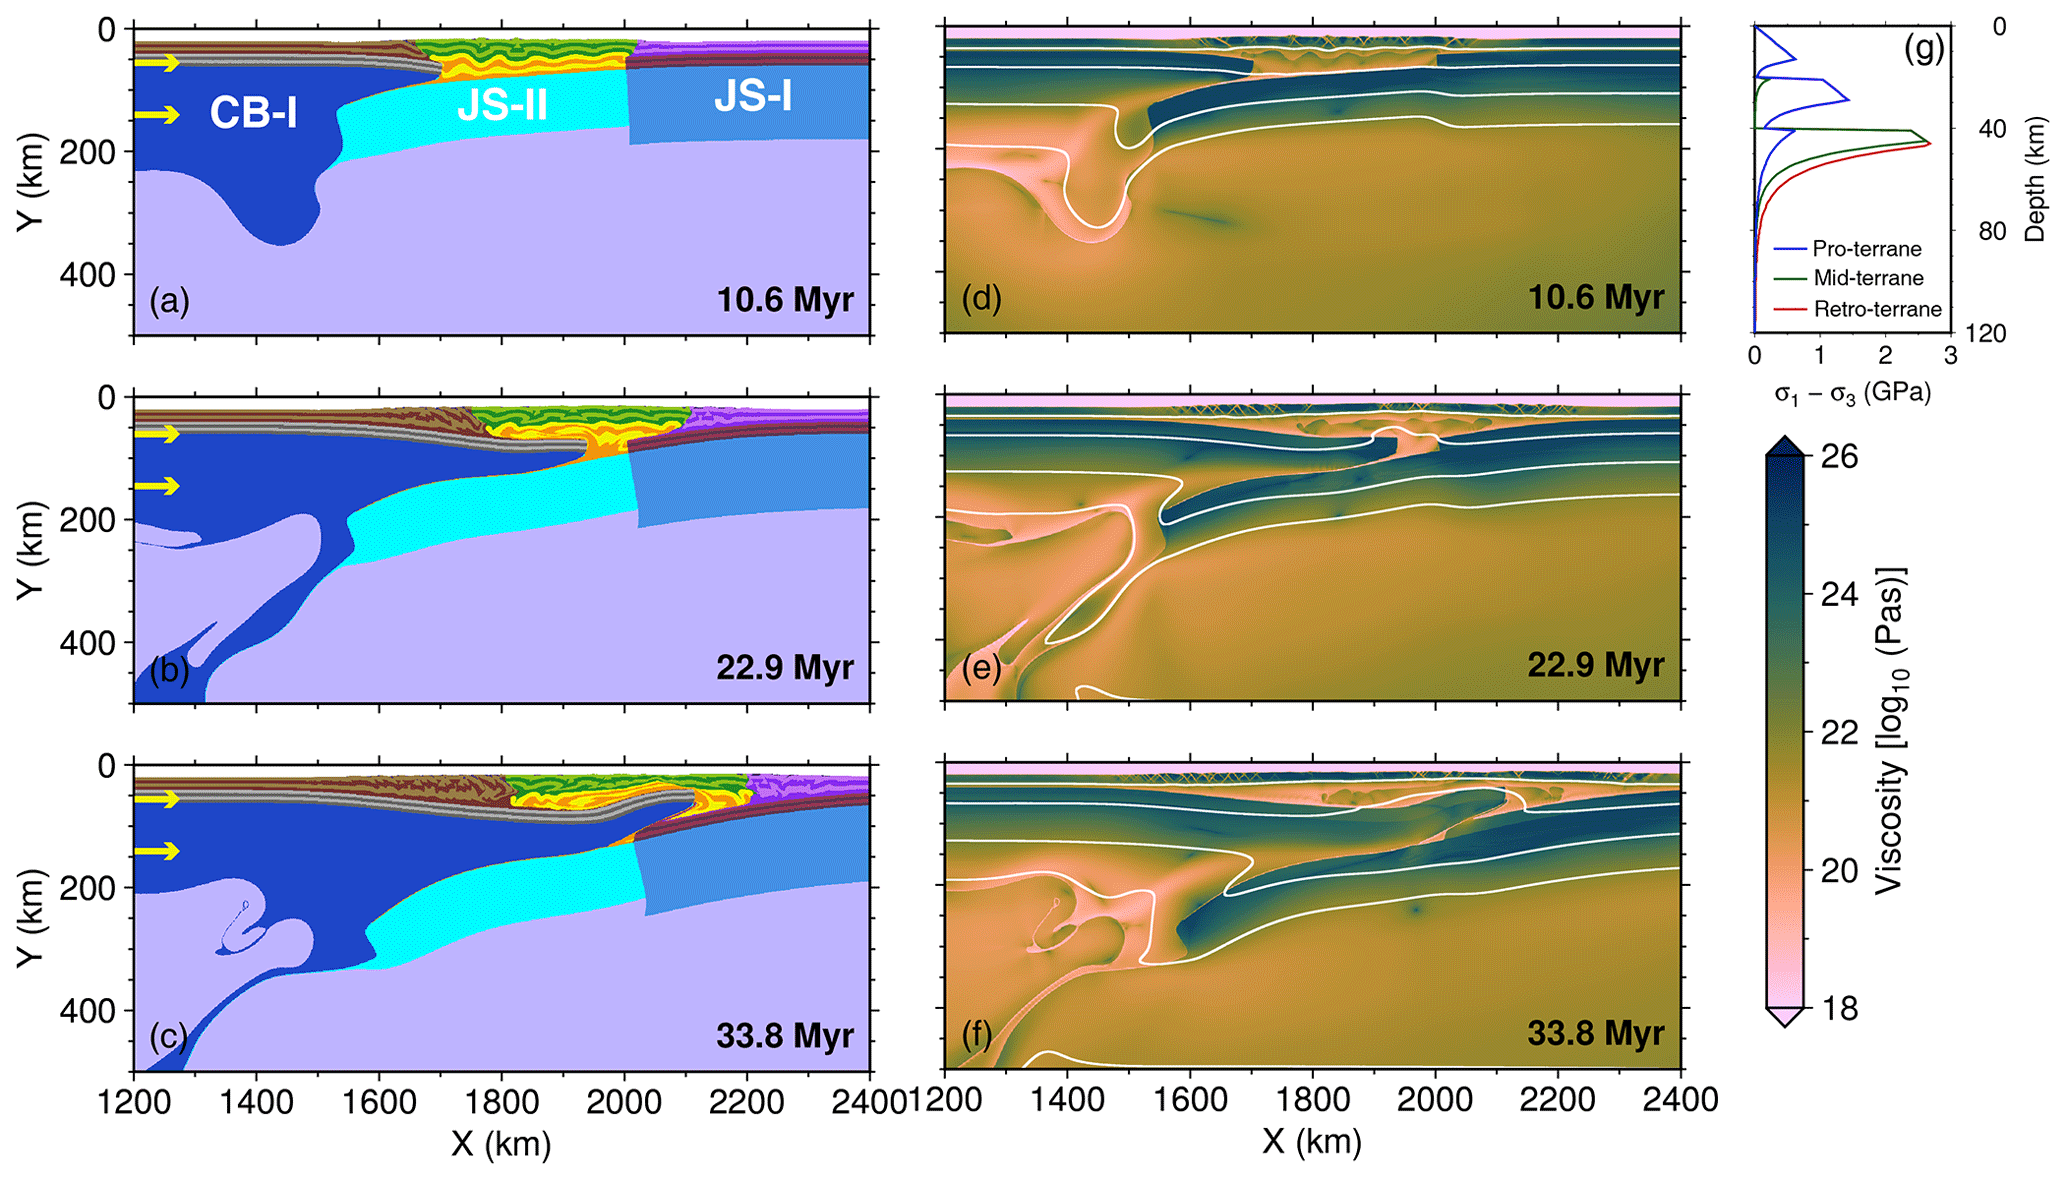
Figure 6Replacement of the lithosphere of the pro-terrane. Rheological models for the pro-, mid-, and retro-terranes are CB-I, JS-II, and JS-I, respectively. See Fig. 3 for the plotting conventions.
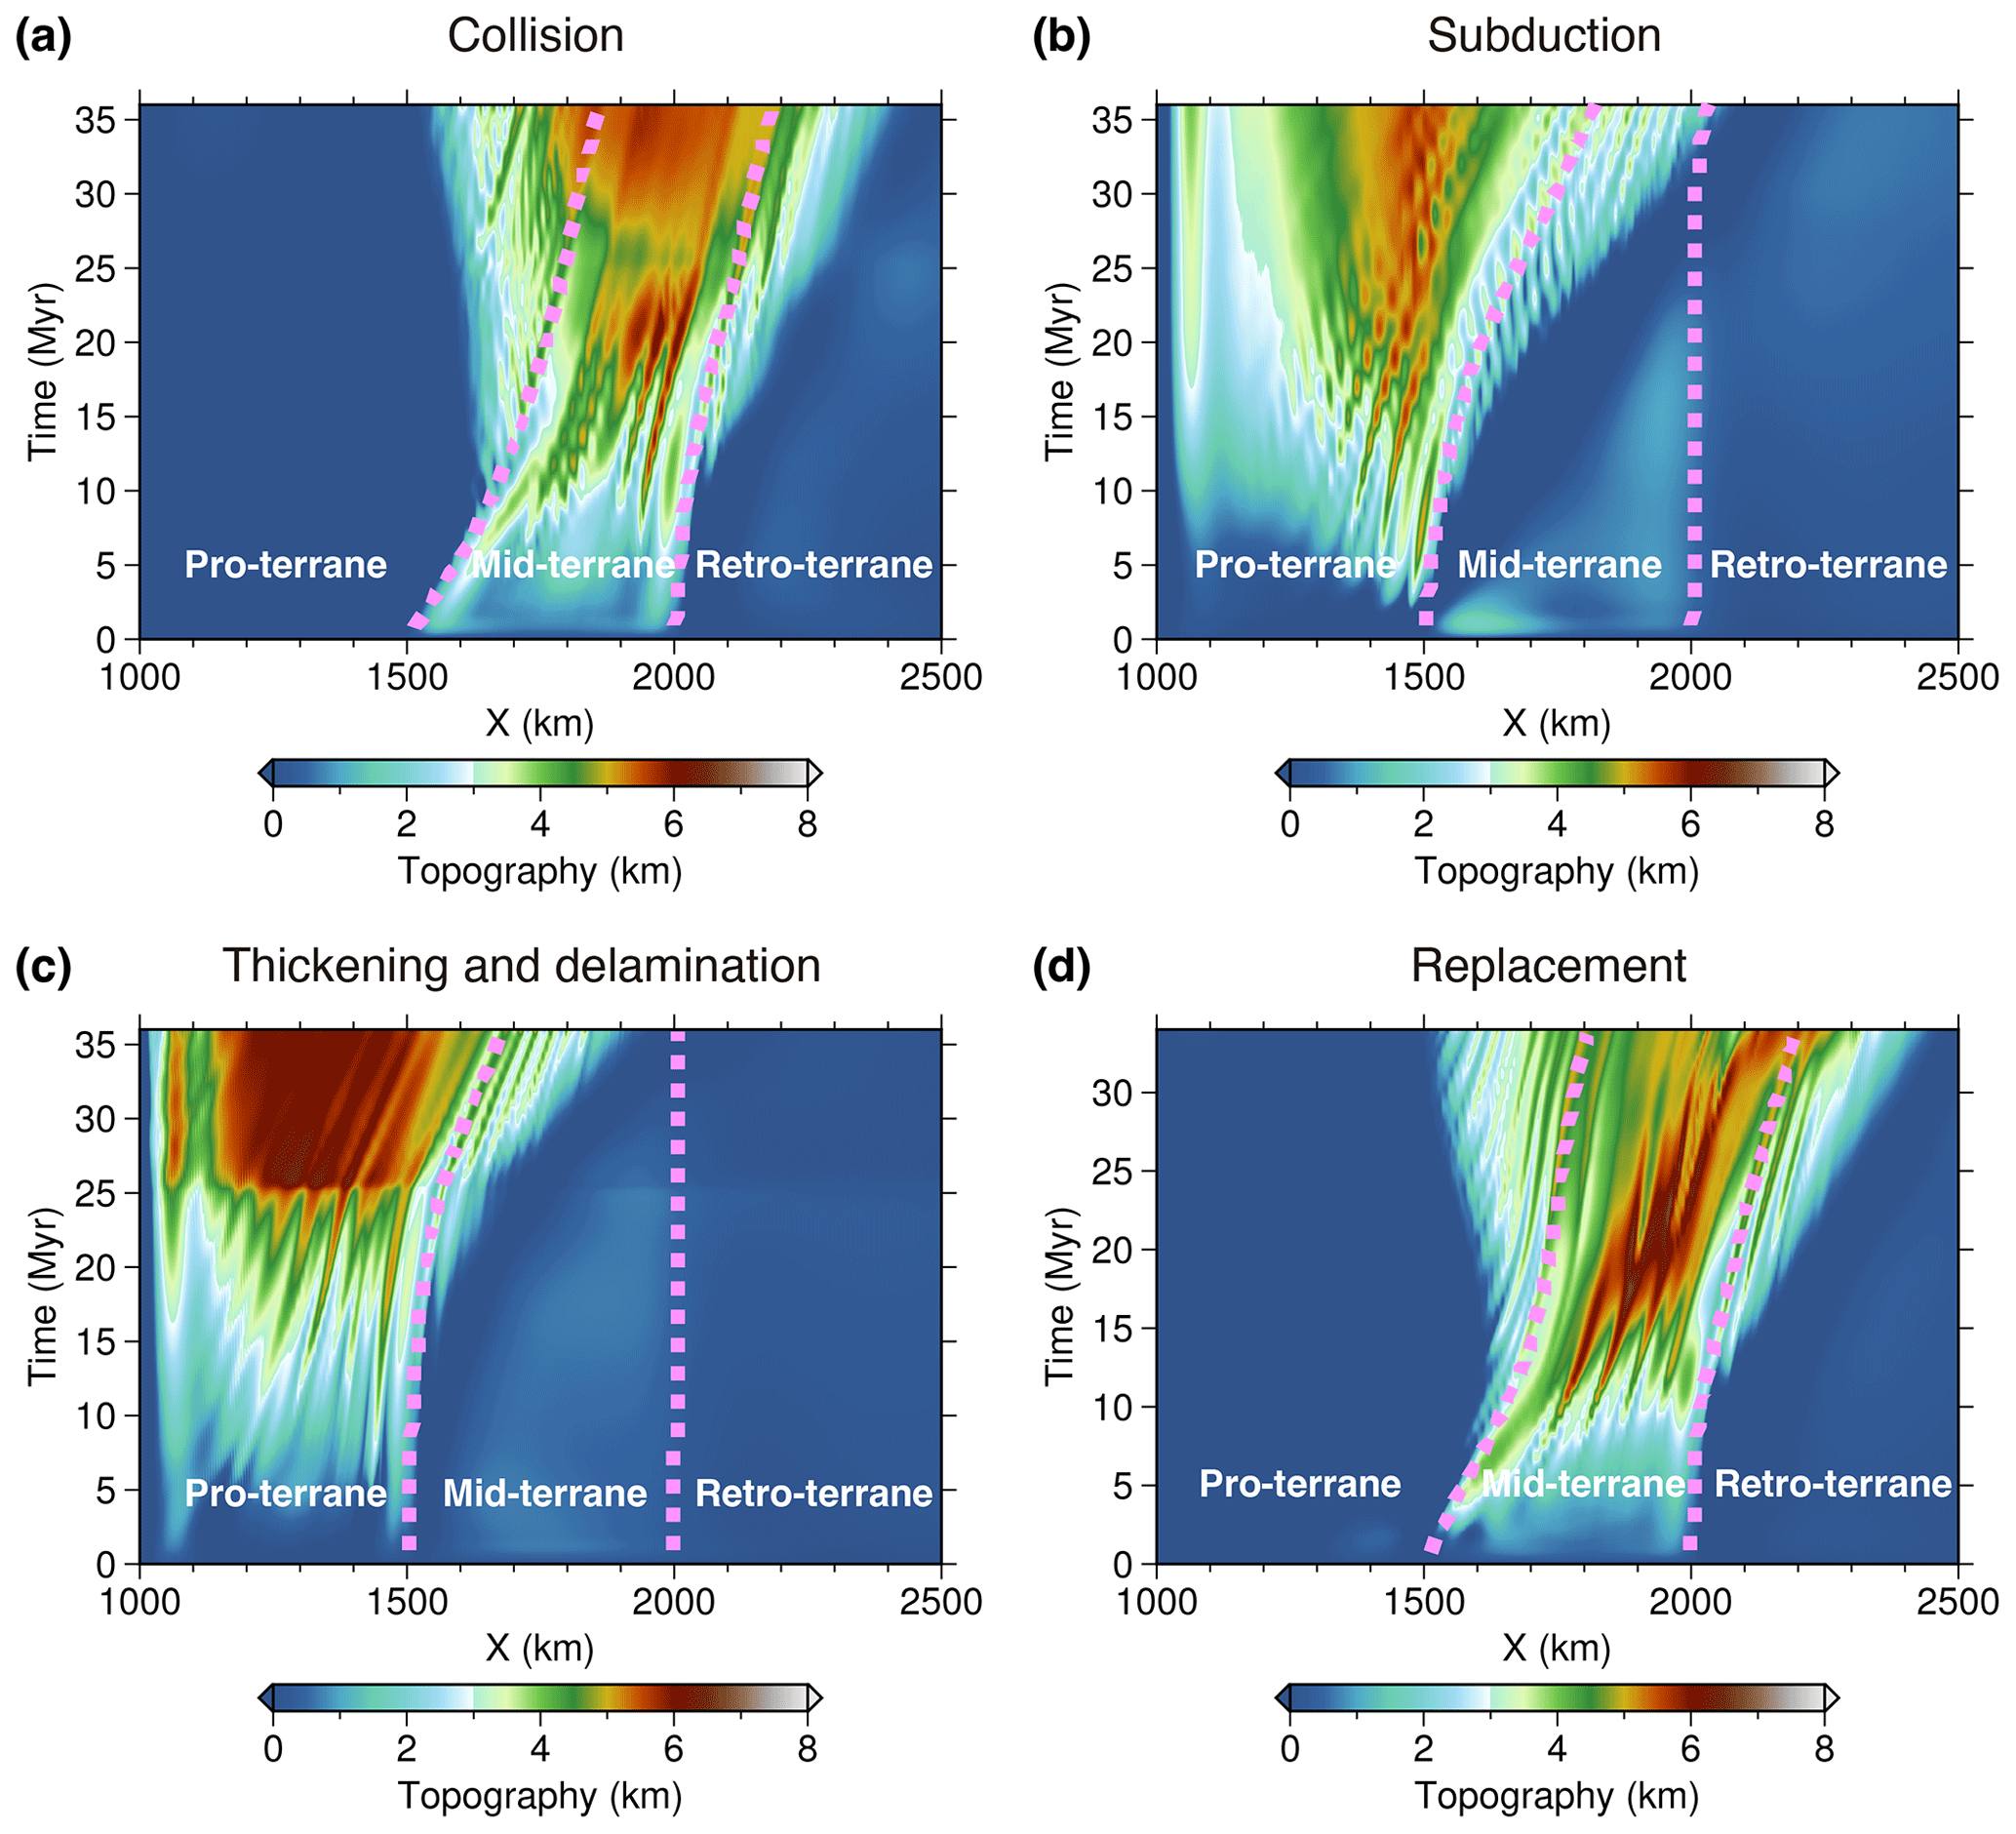
Figure 7The evolution of surface relief for the different deformation styles. The dashed purple lines indicate the boundaries between terranes. (a–d) Surface relief associated with the deformation patterns of lithosphere collision, subduction, thickening and delamination, and replacement, respectively.
4.1 Rheological characteristics for distinct lithosphere deformation patterns
Distinct lithosphere deformation patterns in our simulations arise from rheological contrasts between neighboring continental terranes. Figure 8 summarizes the rheological characteristics of these distinct deformation patterns. When the mid-terrane's lithospheric mantle is weakest (typified by models in which the rheological model of the mid-terrane is CB-II), it is easy for its mantle to be extruded out, leading to collision between the lithospheric mantles of its surrounding pro- and retro-terranes. When one of the two bounding terranes has extremely weak lithospheric mantle, its lithosphere is the first to be thickened by compression, and delamination may follow due to density-driven instability. When the lower crust of the mid-terrane is relatively strong (CB-I or JS-I) while the lower crust is weaker in the pro- or retro-terrane (CB-II or JS-II), the lithospheric mantle of the pro- or retro-terrane will tend to subduct into the deep mantle, e.g., leading to intracontinental subduction. Finally, when the mid-terrane has a weak lower crust and strong lithospheric mantle (JS-II) while the pro- or retro-terrane has a strong lower crust and weak lithospheric mantle (CB-I), the lithospheric mantle of the former may replace the lithospheric mantle of the latter.
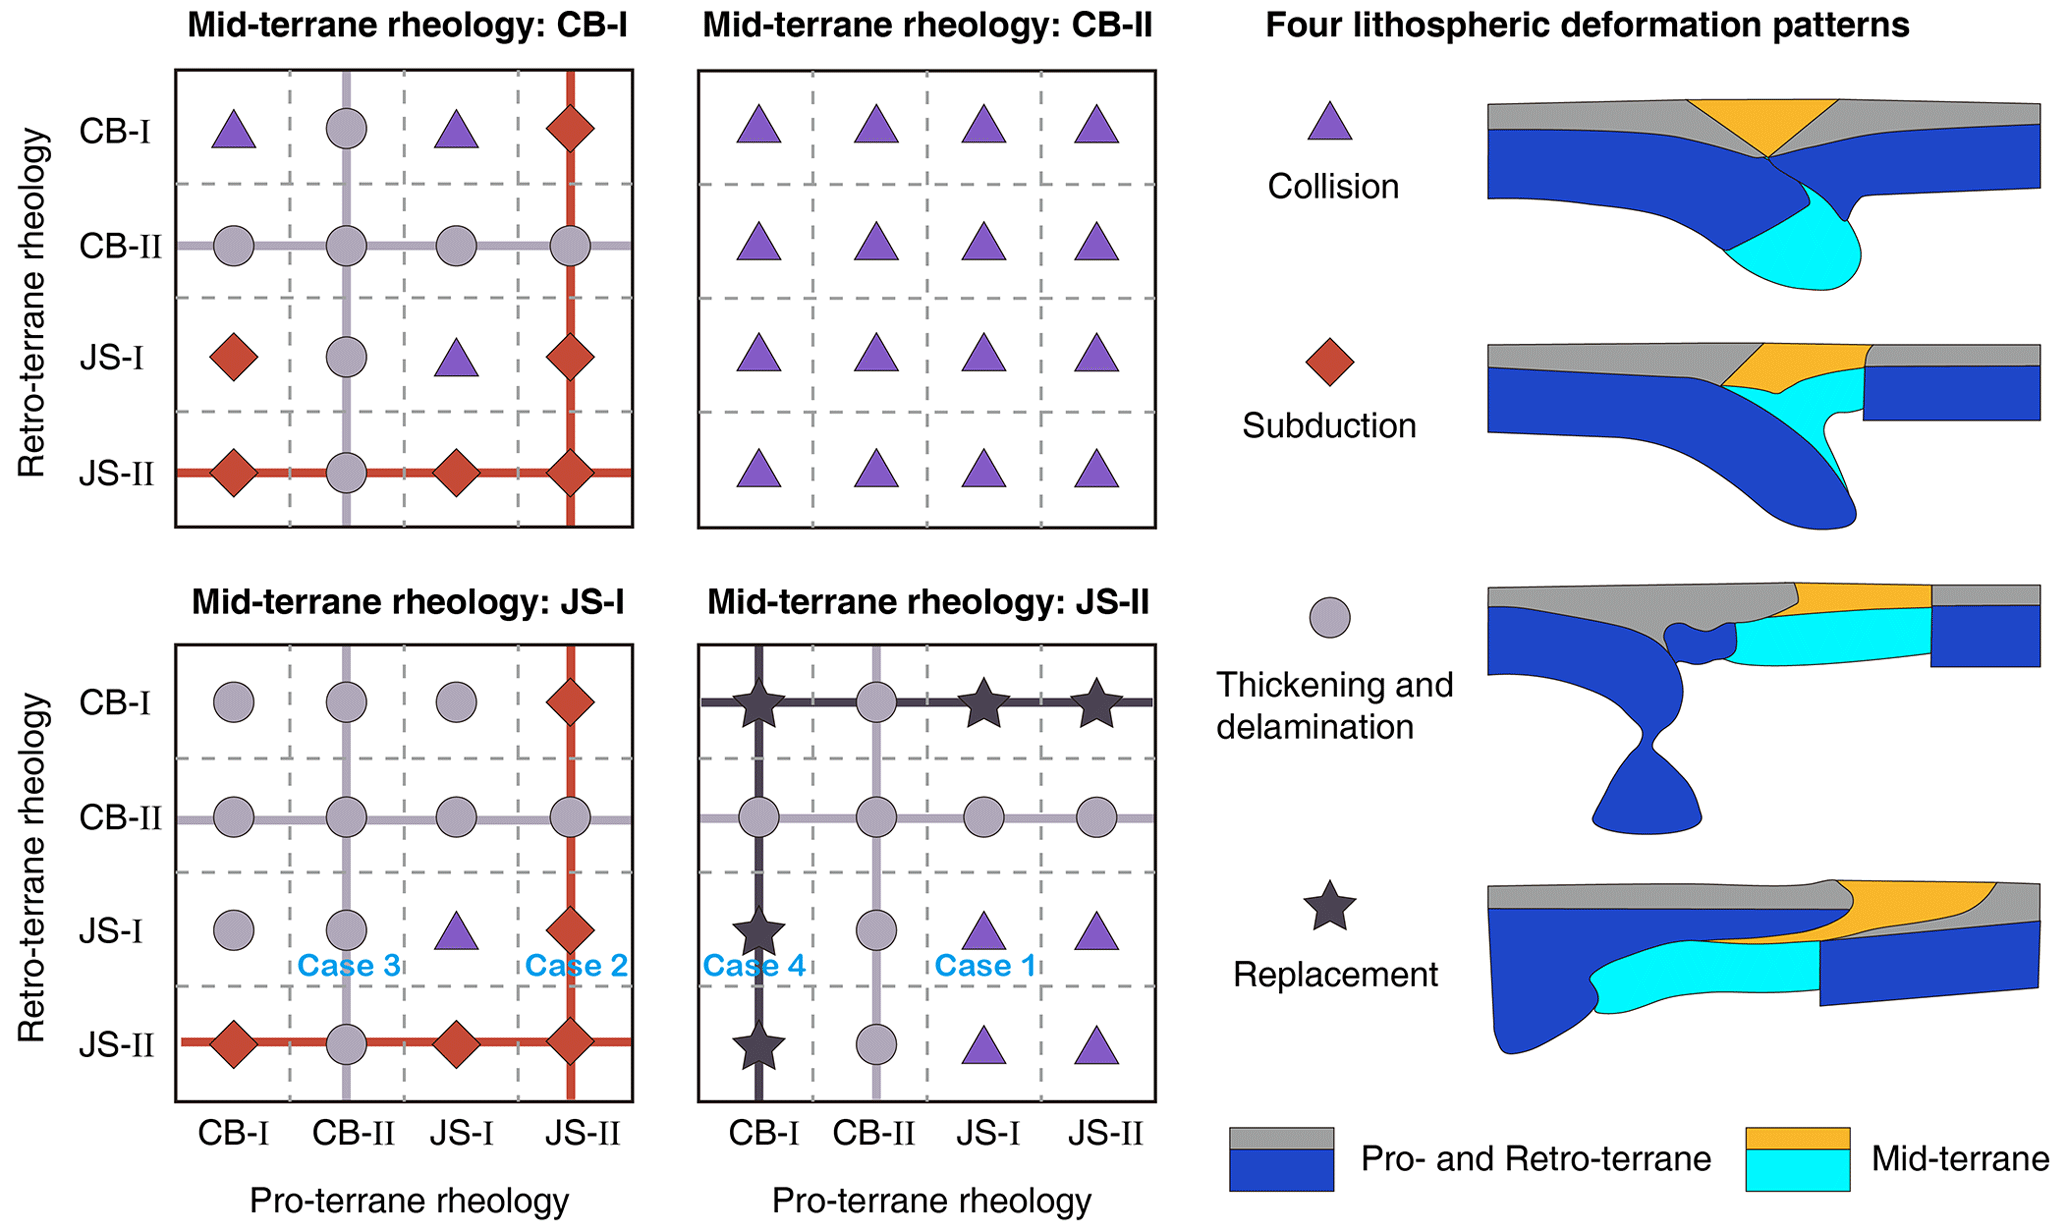
Figure 8Four styles of lithosphere deformation patterns. Symbols with colors indicate different deformation patterns of the lithosphere. Cases 1–4 are the selected models chosen to illustrate details of these modes of compressional evolution.
When the deformation patterns involve the collision and replacement of the lithosphere, continental deformation involves all three terranes (Figs. 3 and 6). In contrast, the other deformation patterns only involve two terranes, namely the pro- or retro-terrane and the mid-terrane (Figs. 4 and 5). The rheological properties of the mid-terrane are responsible for these differences. Like previous numerical studies (Kelly et al., 2016, 2020; Z. H. Li et al., 2016; Huangfu et al., 2018, 2022; Sun and Liu, 2018), our simulations show that a weak mid-terrane is easier to deform and that in this case lithosphere deformation will expand from the center to its neighboring sides. On the other hand, a relatively strong mid-terrane prevents the deformation from propagating far, so that lithosphere deformation is constrained to occur within two terranes.
Although our multi-terrane numerical models mainly focus on the impact of the lateral strength differences between different terranes in a continental collisional system, rheological models of CB-I, CB-II, JS-I, and JS-II also involve vertical rheological variation (Fig. 1a). It seems difficult to summarize how vertical strength variation affects the lithosphere deformation of the continental collisional system. For example, in some cases, only changing the rheological models of the pro- or retro-terranes may produce distinct deformation modes such as collision, subduction, thickening and delamination, and displacement (e.g., the first and third rows, the third column in the upper-left panel in Fig. 8, and the third column in the lower-right panel in Fig. 8). However, changing the rheological models of the pro- or retro-terranes seems to have less of an impact on the deformation mode of the continental collisional system, according to the simulation results of models which are connected by several cross-shaped solid lines with different colors in Fig. 8. Thus, it is difficult to determine whether the horizontal strength contrasts between terranes or the vertical strength variation in a single terrane plays the dominant role in a multi-terrane collisional system. This is also the significance and necessity of our study.
4.2 Influences of lithosphere structure
Lithospheric thickness is one of the critical factors that control its strength (Burov, 2011), and it can strongly vary between tectonic regions (Pasyanos et al., 2014). In our models, we assume different lithospheric thicknesses for the pro-, mid-, and retro-terrane to explore these effects. Complex effects are seen. When changing the lithospheric thicknesses of the mid-terrane, or of all three terranes, remarkable variations in the lithosphere deformation appear in Cases 1 and 2, but smaller variations are seen for Cases 3 and 4 (Fig. 9). Cases 1 and 2 assume a jelly sandwich rheology for the pro-, mid-, and retro-terrane, so the strength of the lithospheric mantle of the three terranes is comparable. Strength variations produced by the differences in the lithospheric thickness may alter the relative strength of the three terranes, resulting in distinct lithospheric deformations. For example, if the pro- and mid-terranes have the same lithosphere thickness, then the deformation mode in Case 2 would change from subduction to thickening (subplot 3 vs. subplot 8 in Fig. 9); if the mid-terrane is thickest or the three terranes have the same thickness for the lithosphere, then the deformation mode in Case 1 would change from collision to replacement (subplot 2 vs. subplot 17 and 22 in Fig. 9), and the polarity of the subduction of pro-terrane's lithospheric mantle would be reversed in Case 2 (subplot 3 vs. subplot 18 and 23 in Fig. 9). Instead, in Cases 3 and 4, the pro-, mid-, and retro-terrane have two regions with stronger jelly-sandwich-like rheological structures and one with a weaker crème brûlée structure, and the deformation preferentially concentrates in the weaker terrane. In comparison to the large strength difference implied for the lithospheric mantle between the crème brûlée and jelly sandwich rheological models, the strength variations associated with the differences in lithosphere thickness are relatively small. Therefore, changing the thicknesses of the lithosphere has much smaller effects on the lithosphere deformation, as seen in Cases 3 and 4 (also see the subplots in third and fourth rows of Fig. 9).
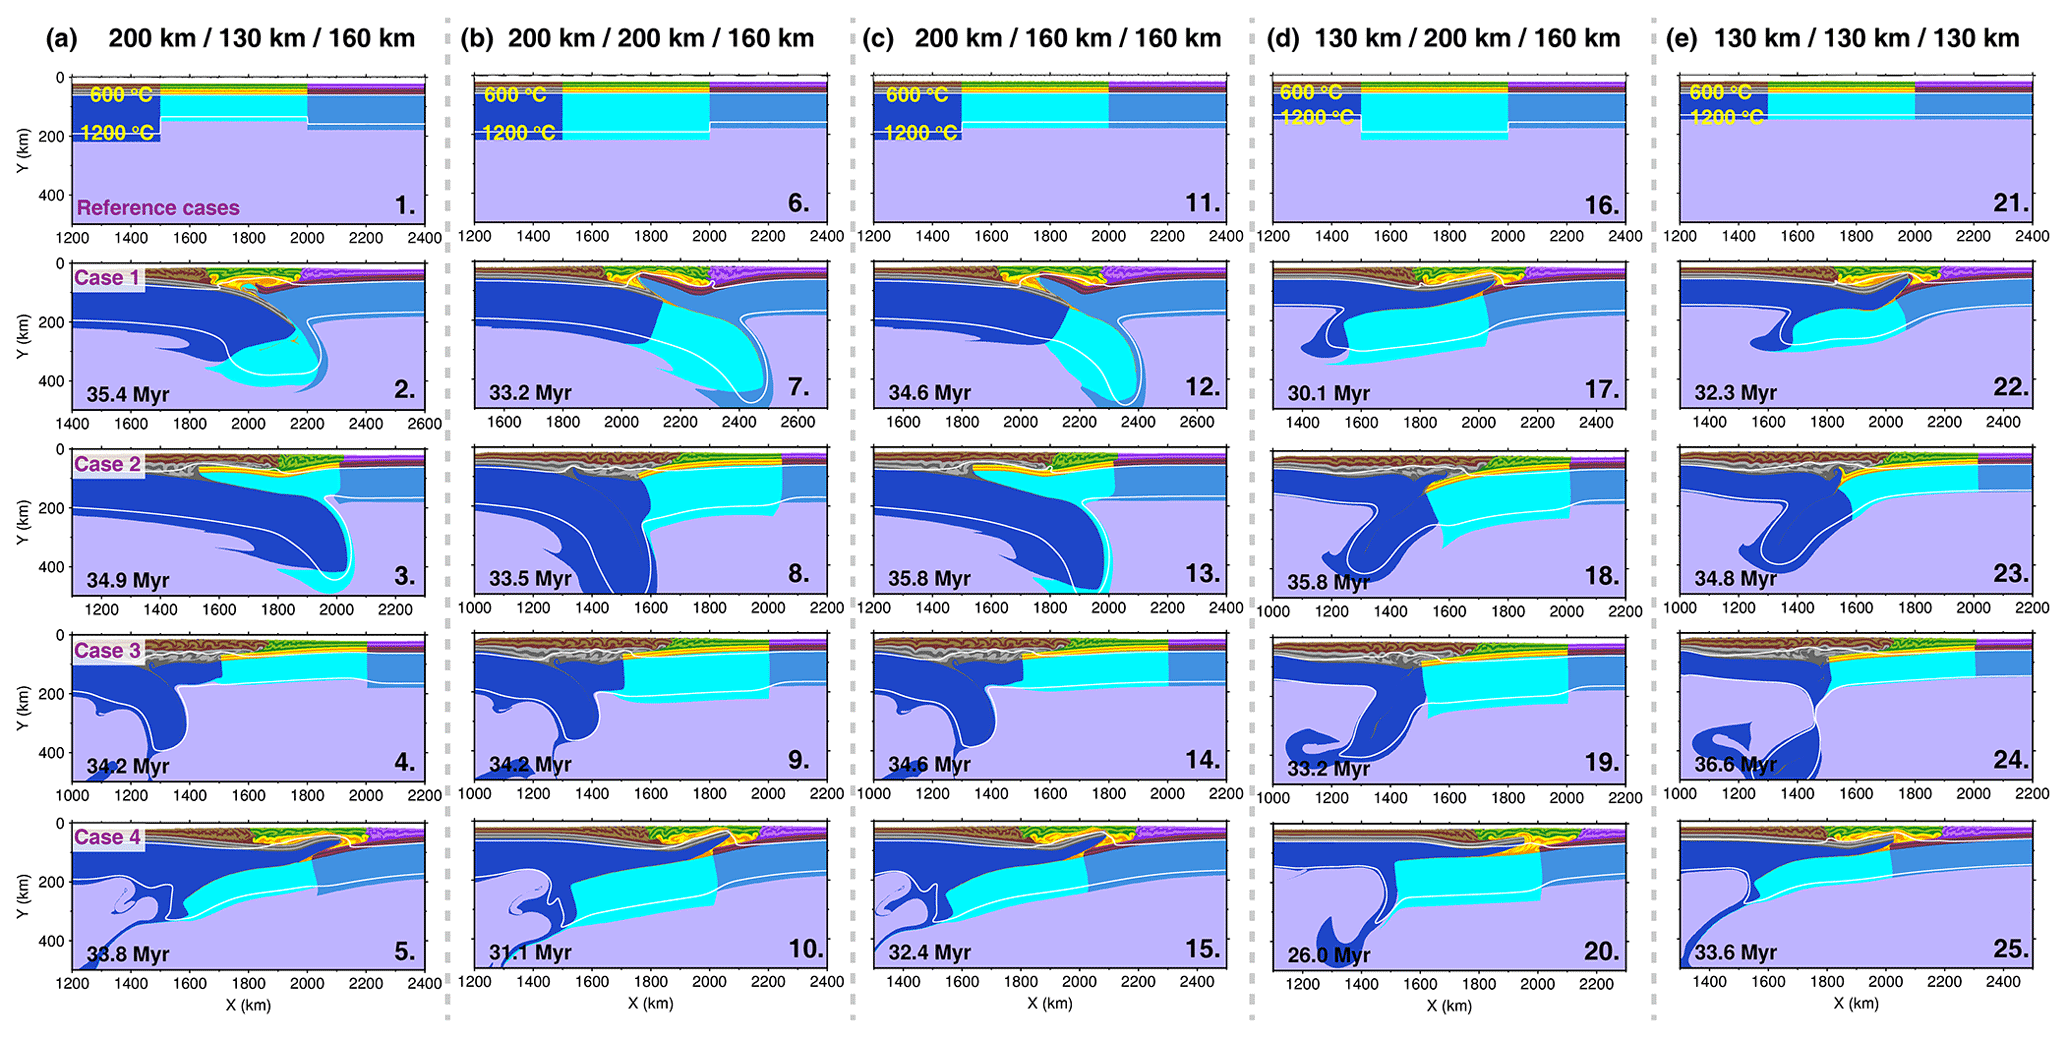
Figure 9Effects of lithosphere thicknesses of various terranes. (a–e) Final simulation results of models with different lithosphere thicknesses for the pro-, mid-, and retro-terranes, respectively. (a) Final simulation results of reference cases. Rheological models of the pro-, mid-, and retro-terranes in rows 2–4 are the same as those in Cases 1–4, respectively.
In addition, the weak zones that suture two terranes are generally preserved during the continental amalgamation (Burke et al., 1977; Vink et al., 1984; Yin and Harrison, 2000). These local pre-existing lithosphere weaknesses would be preferentially activated if the continental lithosphere were subjected to compression and could play a key role in concentrating the deformation, adjusting deformation sequences, and inducing lithosphere subduction (Sokoutis and Willingshofer, 2011; Heron et al., 2016; Chen et al., 2020; Xie et al., 2021, 2023). Comparing the simulation results of models with and without a weak zone, we find that a weak zone will facilitate the lithosphere subduction in the earlier stages of model evolution, resulting in more diverse lithosphere deformation patterns during the later stage (Fig. 10).
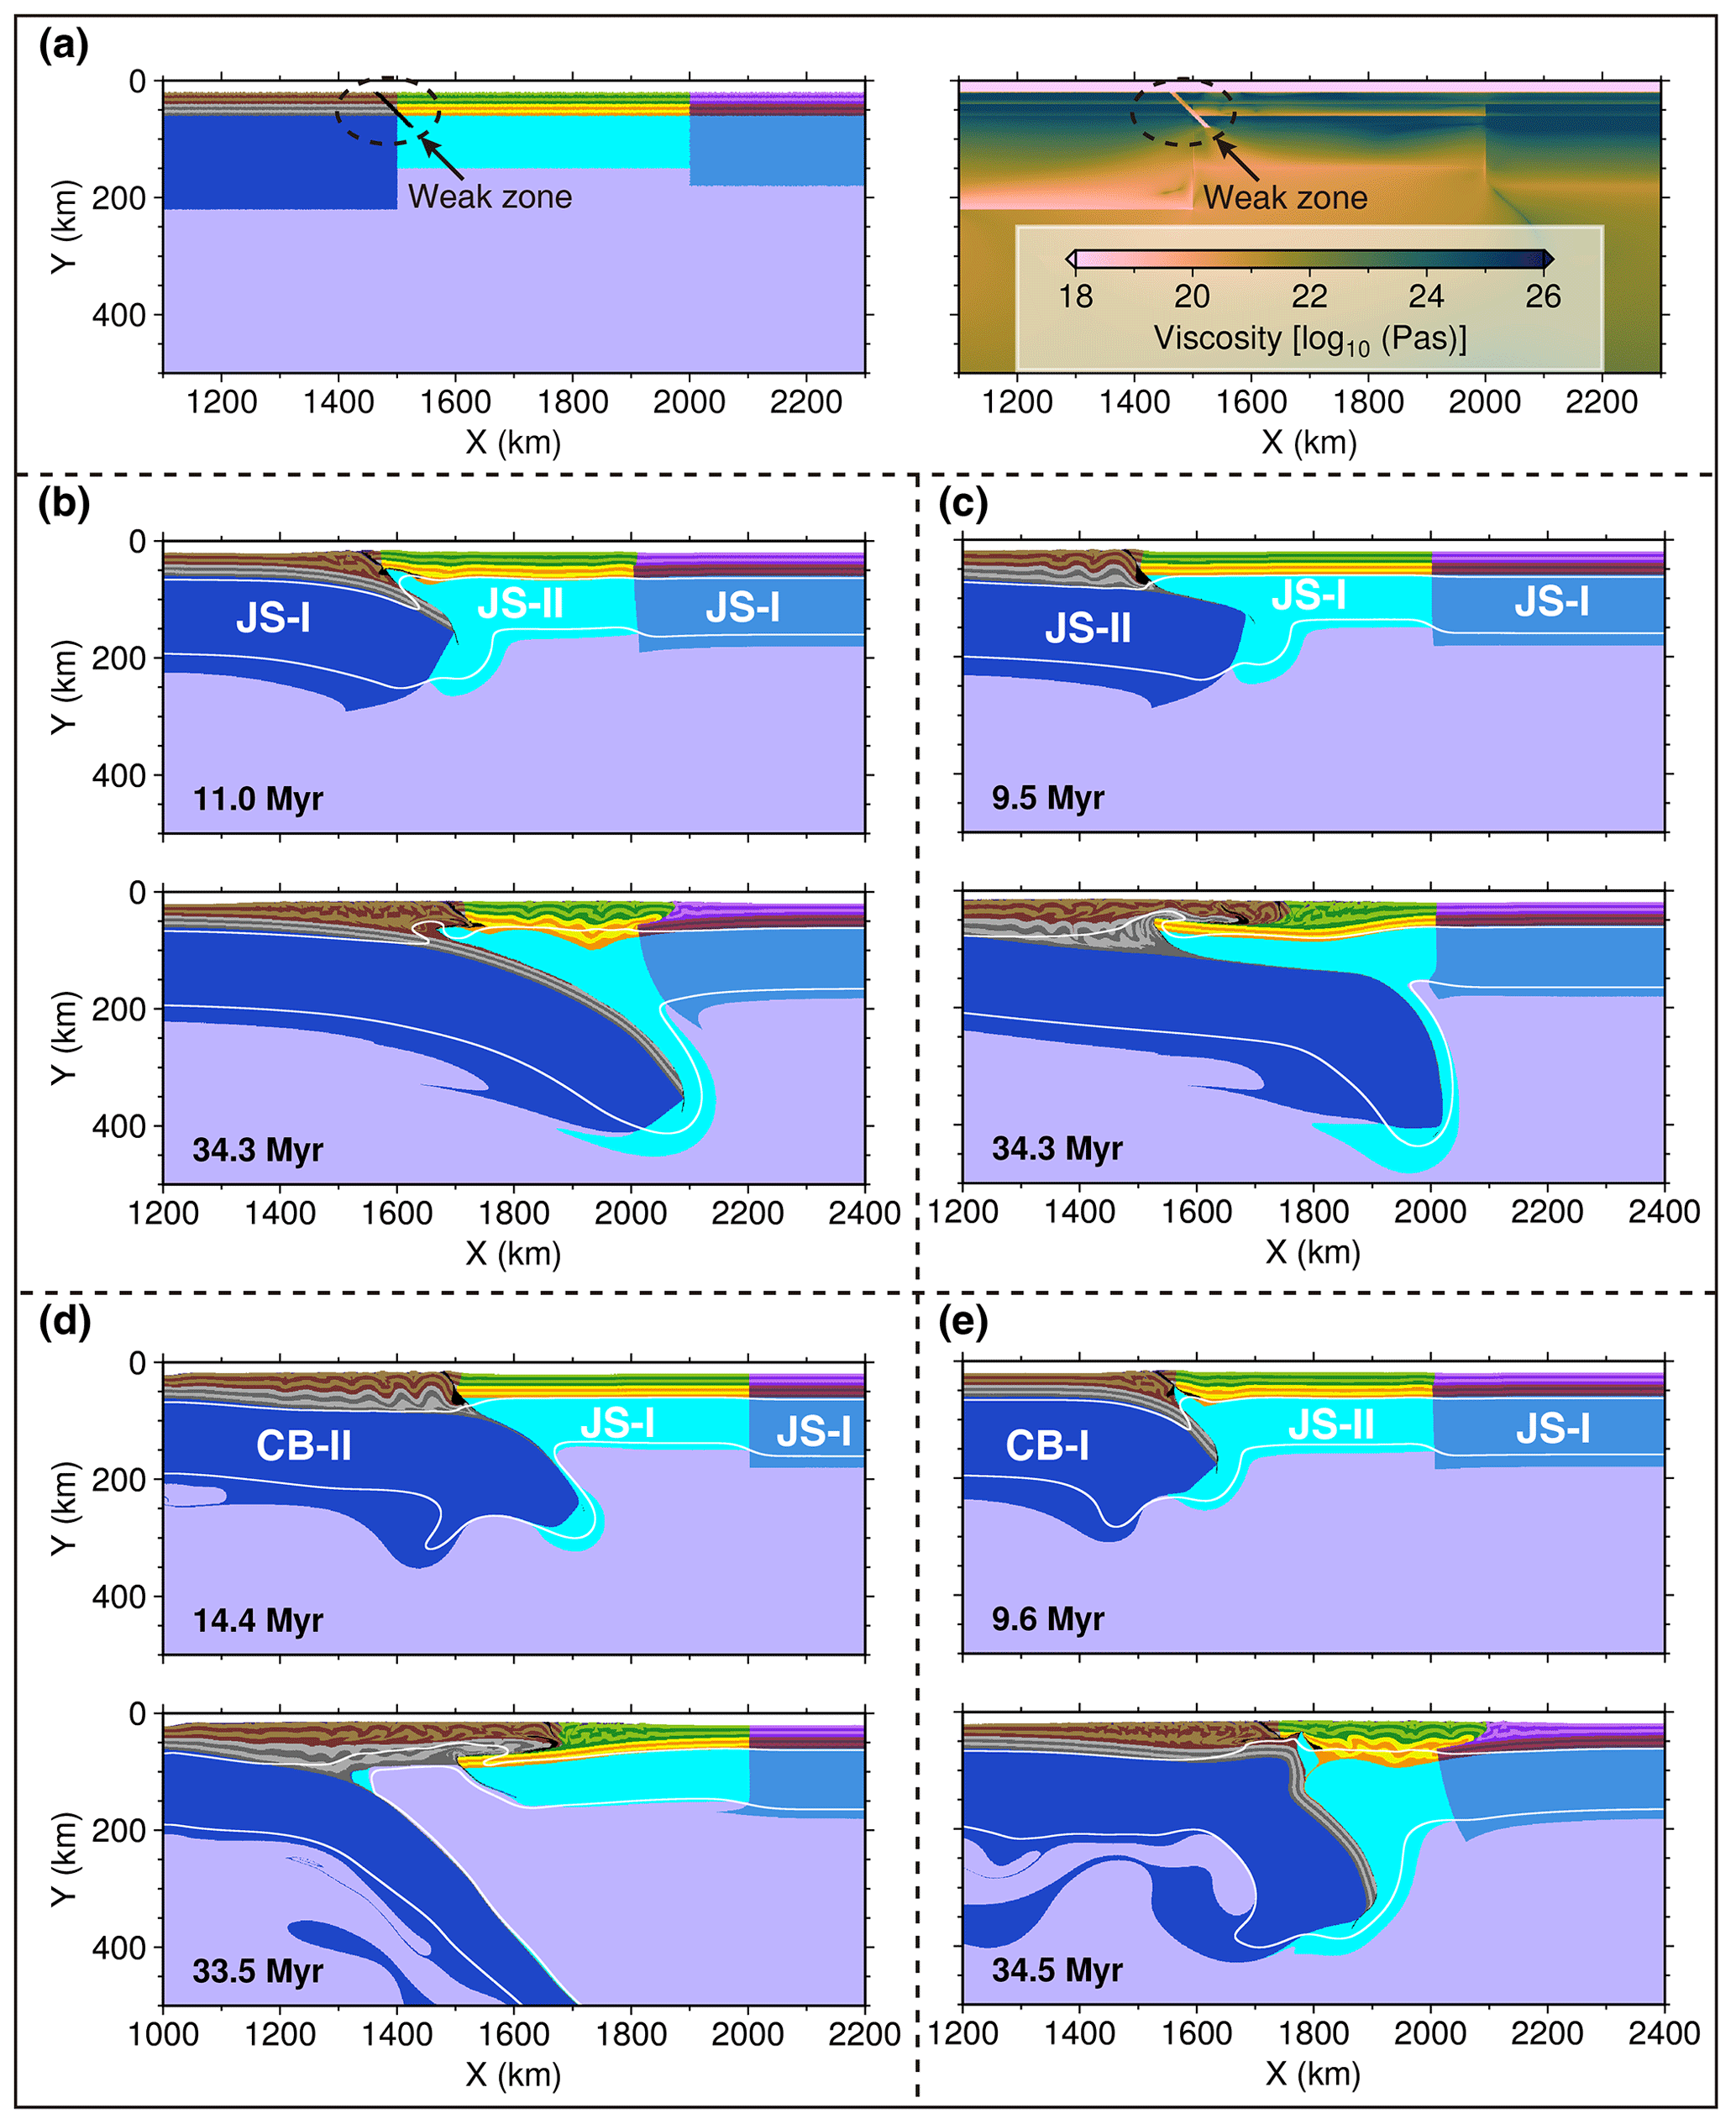
Figure 10Effects of local weak zone on lithosphere deformation. (a) Details about the weak zone. (b–e) Final simulation results of models corresponding to Cases 1–4, respectively.
4.3 Implications for the tectonics of East Asia
4.3.1 Lithosphere collision beneath the eastern Tien Shan
The eastern Tien Shan is an ideal region to study the deformation patterns linked to long-term lithosphere collision (Fig. 11a). The eastern Tien Shan is bounded by the Tarim Basin to the south and the Junggar Basin to the north. It is composed of a series of former island arcs and small continental blocks that amalgamated during the late Paleozoic (Han and Zhao, 2018). The lithosphere of the eastern Tien Shan is weaker and thinner in comparison to its neighboring Tarim Basin and Junggar Basin (Kumar et al., 2005; Lei and Zhao, 2007; Zhang et al., 2013; Deng and Tesauro, 2016). At ∼20–25 Ma, the eastern Tien Shan became a reactivated orogeny in response to ongoing India–Asia collision (Yin et al., 1998). Compression linked to the India–Asia collision induced the Tarim lithosphere to underthrust northward (Xu et al., 2002; Guo et al., 2006; Lei and Zhao, 2007; Lü et al., 2019; Hapaer et al., 2022; Sun et al., 2022). In the northern part of the eastern Tien Shan, significant high-velocity anomalies and the Moho overlap are also imaged, which are conventionally explained as being due to the southward underthrusting of the Junggar lithosphere (Xu et al., 2002; Guo et al., 2006; Z. H. Li et al., 2016; Lü et al., 2019). High-velocity anomalies in the Tarim and Junggar lithosphere appear to connect beneath the eastern Tien Shan, suggesting that the lithosphere of the Tarim and Junggar basins has converged and collided together in this region (Fig. 11b; Lü et al., 2019). Bidirectional underthrusting of the Tarim and Junggar lithosphere leads to intense crustal shortening and thrust faults on both flanks over the adjacent basins, as well as attendant fold and reverse fault zones along the range fronts (Yin et al., 1998; Wang et al., 2004).
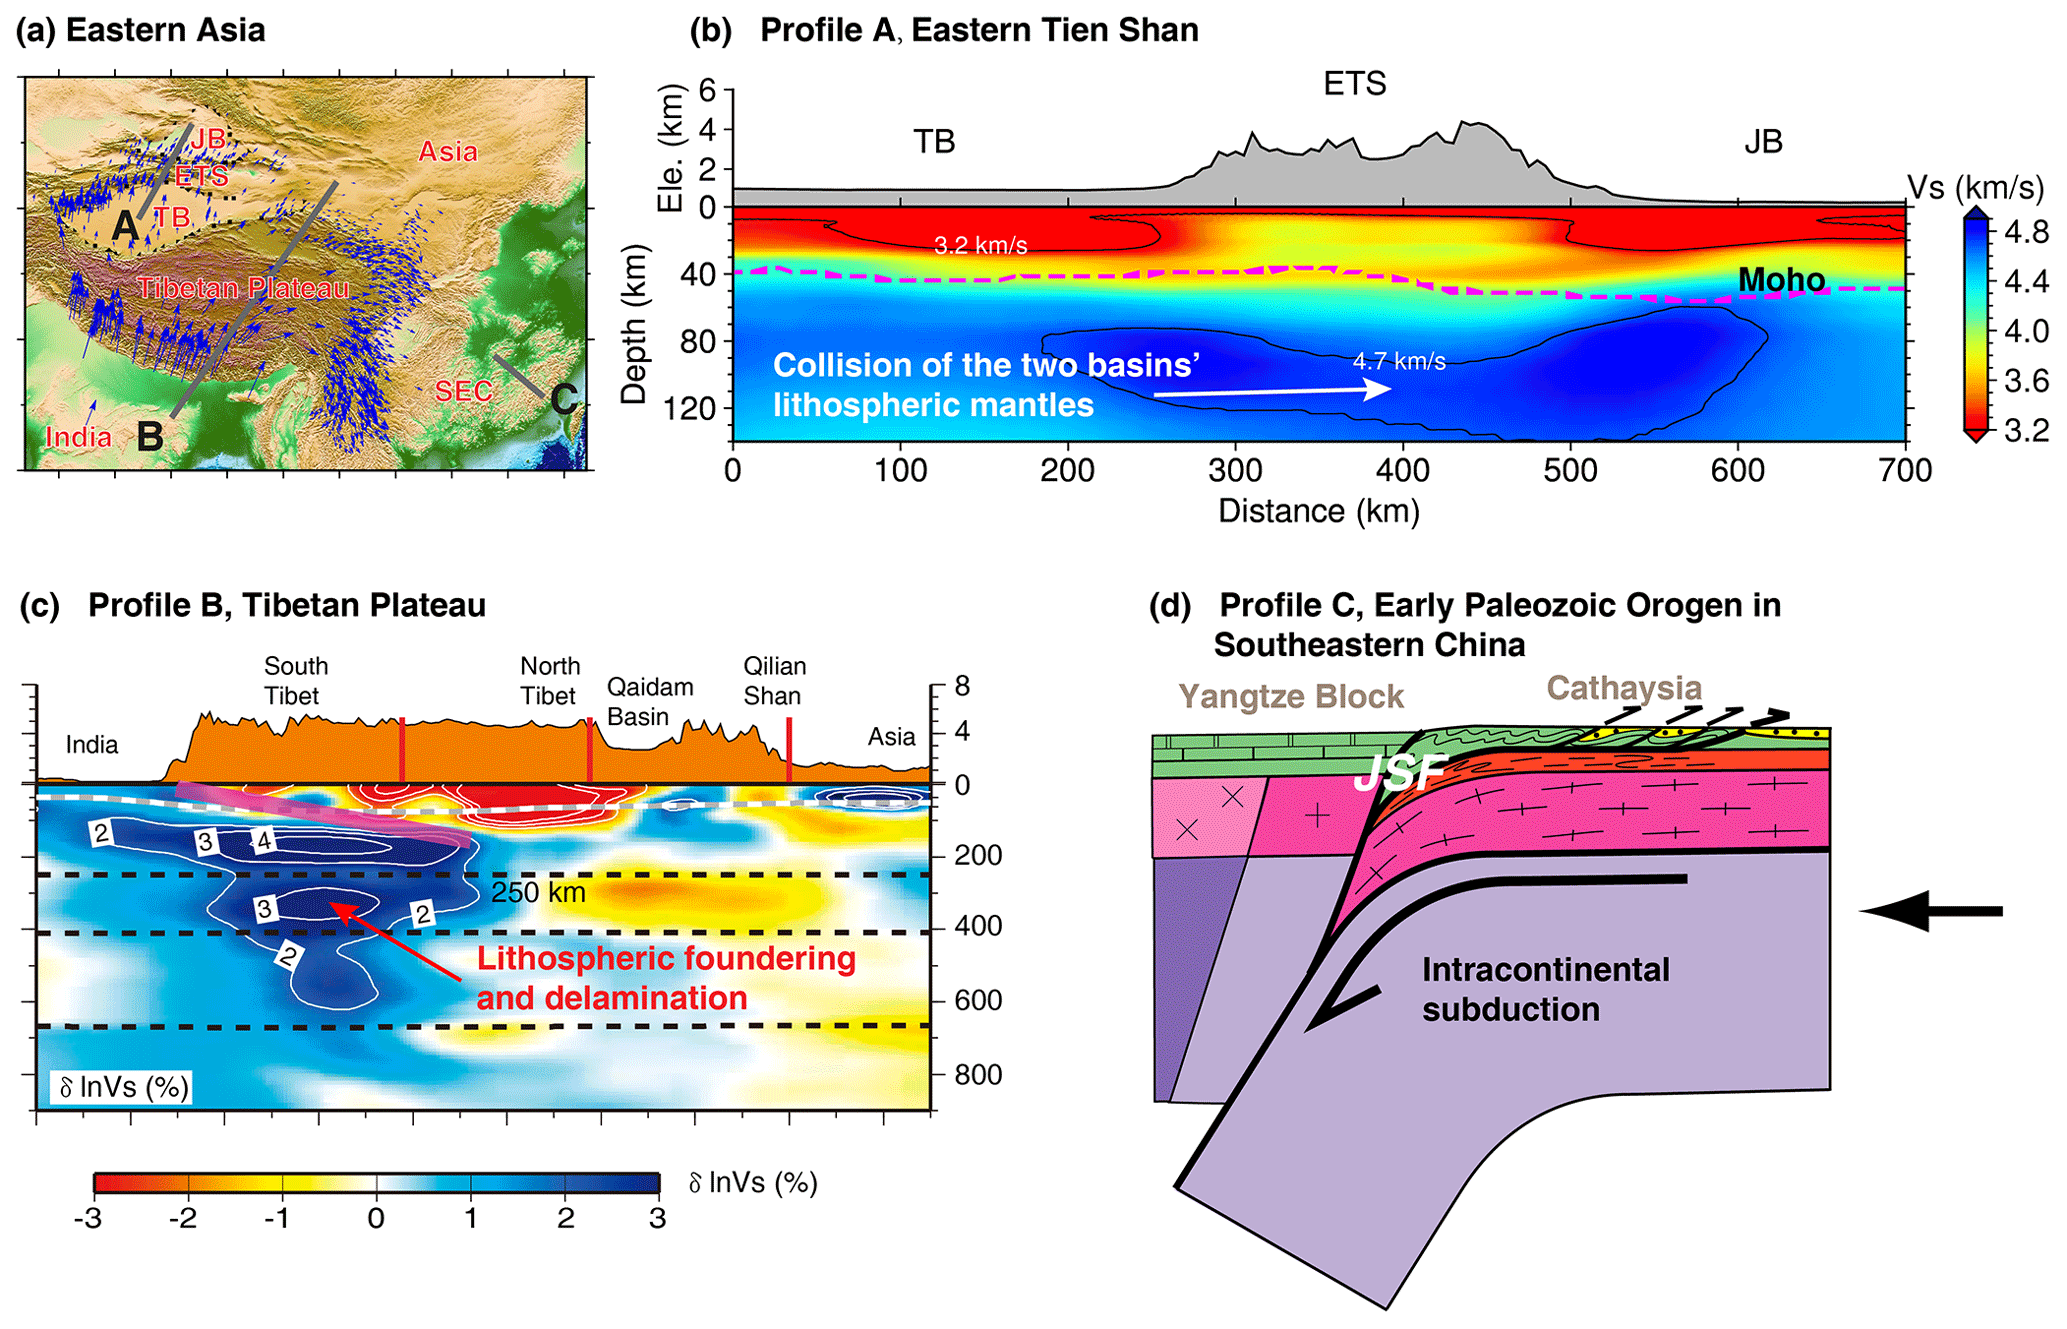
Figure 11Implications of simulation results to East Asia. (a) Topography of East Asia. The three gray lines point out the locations of lithosphere profiles in panels (b)–(d). TB is for Tarim Basin; ETS is for eastern Tien Shan; JB is for Junggar Basin; SEC is for Southeastern China. (b) Collision of the lithospheric mantle of Tarim Basin and Junggar Basin beneath the eastern Tien Shan (modified from Lü et al., 2019). (c) Lithospheric founding and delamination in the Tibetan Plateau (modified from Chen et al., 2017). (d) Intracontinental subduction in the Early Paleozoic Orogen in southeastern China (modified from Faure et al., 2009). JSF is for Jiangshan–Shaoxing Fault.
4.3.2 Lithosphere thickening and delamination in the Tibetan Plateau
The deformation pattern arising from lithosphere thickening and delamination has been applied to the Tibetan Plateau (Fig. 11c). The Tibetan lithosphere may have been significantly weakened by hydration, metasomatism, and partial melting of the lithospheric mantle during a series of oceanic closure and terrane accretion events before the India–Asia collision (Yin and Harrison, 2000; Zhang et al., 2014; Ma et al., 2021). It was then pushed northward by the Indian craton and was blocked by the Tarim–Qaidam craton during India–Asia collision, leading to double crustal thickness (Zhao and Morgan, 1985; Zhang et al., 2011). The lithosphere beneath the Tibetan Plateau does not thicken significantly like its crust, especially beneath northern Tibet (Owens and Zandt, 1997; Tunini et al., 2016). Numerous observations instead suggest that the Tibetan lithosphere has been detached from the crust and has sunk into the deeper mantle, consistent with the presence of high-velocity regions in the deep mantle in western, southern, and southeastern Tibet (Li et al., 2008; Chen et al., 2017; Feng et al., 2022). A significant depression of the 660 km discontinuity beneath the Himalaya terrane and the uplift of 410 km discontinuity in western Tibet have also attributed to the presence of delaminated Tibetan lithosphere (Wu et al., 2022). In northern Tibet, anomalously high temperatures are assumed to be linked to a region of inefficient Sn propagation indicating a thin or absent lithospheric mantle lid in this region, while a remarkable low-velocity zone in the mantle and ultra-potassic volcanics also suggest lithosphere thinning (Barazangi and Ni, 1982; Turner et al., 1996; Owens and Zandt, 1997; Guo et al., 2006; Liang et al., 2012; Tunini et al., 2016). After lithosphere thinning commenced in the Miocene, the Tibetan Plateau rapidly grew outwards (Lu et al., 2018, and references therein; Molnar et al., 1993; Xie et al., 2023).
4.3.3 Lithosphere subduction in Southeastern China
An example of intracontinental subduction is the Early Paleozoic Orogen in Southeastern China which appears to have not been preceded by oceanic subduction (Fig. 11d; Faure et al., 2009). The northeasterly trending Early Paleozoic Orogen of Southeastern China is located on the Wuyi–Yunkai fold belt which welds the Cathaysian Block to the south and the Yangtze Block to the north. Two groups of models of the collisional belt (Guo et al., 1989; Hsü et al., 1990) and intercontinental orogen (Faure et al., 2009; Charvet et al., 2010; Li et al., 2010) have been proposed to explain the Early Paleozoic Orogen in Southeastern China. Arguments against it being a collisional orogenic belt are its lack of preserved ophiolites, a magmatic arc, subduction complexes, and high-pressure metamorphism; instead, structural, metamorphic, and sedimentary elements indicate that this orogen was an intracontinental orogen controlled by the northward subduction of Cathaysian Block (Faure et al., 2009; Charvet et al., 2010; Li et al., 2010). At ∼465 Ma, the Cathaysian Block underthrust beneath the Yangtze Block along the Jiangshan–Shaoxing Fault in which the lithospheric weaknesses inherited from previous tectonic event of Nanhua rift at 800–850 Ma played an important role (Faure et al., 2009; Charvet et al., 2010). During continental subduction, north–south horizontal shortening is accommodated by ductile décollement zones in the Cathaysia block, causing remarkable south-directed crustal folding and thrusting structures related to both thin-skinned and thick-skinned tectonics in the Wuyishan proper and its southern border and north-directed structures to the west of Ganjiang Fault and north of Jiangshan–Shaoxing Fault, where only thin-skinned tectonics are visible (Li, 1998; Shu et al., 1999; Charvet et al., 2010). The tectonic development of the Early Paleozoic Orogen in Southeastern China appears similar to the deformation mode of lithosphere subduction (Figs. 4 and 10a, c).
So far, we have yet to find a suitable region to apply the model deformation pattern of lithosphere replacement. In this deformation pattern, the crustal deformation and topographic evolution are similar to those in the deformation pattern of lithosphere collision (Fig. 7a and c). Thus, it is not easy to identify this pattern by geological and geophysical techniques when the replaced and original continental lithosphere has similar properties. Improved imaging observations with better resolution may allow this deformation pattern to be identified in the future.
Although we can obtain four deformation modes of continental lithosphere by changing the rheologies of different terranes in a collisional model, we must keep in mind that our results are based on some simplifications and assumptions which may affect the model results. For example, in our model three terranes are directly collaged together, but in nature different terranes are often connected through weak sutures which may preferentially deform when they are subjected to compression (Burke et al., 1977; Yin and Harrison, 2000). These local pre-existing weak zones have non-negligible influences on lithospheric deformation, and their roles were widely discussed in previous studies (Sokoutis and Willingshofer, 2011; Heron et al., 2016; Chen et al., 2020; Xie et al., 2021, 2023). We also discussed the effects of local pre-existing weak zones in Sect. 4.2. In addition, lithosphere thicknesses of the pro-, mid-, and retro-terranes are chosen arbitrarily in our models, but they also have important influences on lithosphere deformation (Fig. 9). Some studies suggest that differences in crustal strength will also cause different lithospheric deformation (Faccenda et al., 2008; Vogt et al., 2017, 2018), but the three terranes are set the same crustal structure in our model for the aim of simplification. Moreover, some studies believe that the convergence rate will greatly affect the deformation of orogenic belts (Chen and Gerya, 2016; Vogt et al., 2017), but in this study, the impact of the convergence rate is not been discussed.
The continental lithosphere is likely to have strong lateral variations in its strength. We explored 2-D numerical models that contain three diverse types of continental terranes to study the responses of continental terranes with different strengths to compression. Four rheological models were, respectively, applied to each of the pro-, mid-, and retro-terranes, and simulation results can be grouped into four distinct deformation styles, namely lithosphere collision, subduction, thickening and delamination, and replacement. These deformation styles arise from the rheological contrasts between the terranes: (1) when the middle terrane is the weakest, its lithosphere is easily extruded, which leads to lithosphere collision between its two bounding terranes; (2) when the middle terrane has a strong lower crust, while the lower crust of a bounding terrane is weak, then subduction of the lithosphere of the bounding terrane will occur; (3) when a bounding terrane is the weakest, its lithosphere would tend to be thickened by lateral compression, followed by lithosphere delamination due to the resulting density/gravitational instability; and (4) when a bounding terrane has a strong lower crust and weak lithospheric mantle, while the middle terrane has a weak lower crust and strong lithospheric mantle, then lithosphere replacement will occur. These simulation patterns are seen in observed deformation patterns and structures in the eastern Tien Shan, and the Tibetan Plateau, in the Early Paleozoic Orogen of Southeastern China, suggesting that they are likely to be naturally occurring modes of intracontinental orogenesis.
The code I2VIS used in this study is provided in the Zenodo repository (https://doi.org/10.5281/zenodo.12645964, Xie et al., 2024a).
Numerical modeling data and the model evolution animations of Cases 1–4 are all provided in the Zenodo repository (https://doi.org/10.5281/zenodo.8354366, Xie et al., 2024b and https://doi.org/10.5281/zenodo.10731981, Xie, 2024).
The supplement related to this article is available online at: https://doi.org/10.5194/se-15-789-2024-supplement.
Conceptualization: YJC. Methodology: LC and RX. Investigation: RX. Formal analysis: RX and LC. Visualization: RX and JPM. Writing (original draft preparation): RX. Funding acquisition: YJC, LC, and RX.
The contact author has declared that none of the authors has any competing interests.
Publisher's note: Copernicus Publications remains neutral with regard to jurisdictional claims made in the text, published maps, institutional affiliations, or any other geographical representation in this paper. While Copernicus Publications makes every effort to include appropriate place names, the final responsibility lies with the authors.
The authors sincerely thank Taras Gerya for providing the I2VIS package and his long-lasting guidance on our geodynamic modeling. We are also grateful to the two anonymous reviewers for their insightful comments which greatly improved the presentation of the paper. The authors acknowledge that figures of simulation results were prepared with the Generic Mapping Tools (GMT; https://www.generic-mapping-tools.org/, last access: February 2024), and the color bar of batlow used in the figures of viscosity field is from Crameri (2018). All models were performed on the TianHe-1A system at the National Supercomputing Center of Tianjin.
This study has been supported by the National Natural Science Foundation of China (grant nos. U1901602 and 42374076), the Shenzhen Science and Technology Programs (grant no. KQTD20170810111725321), and the National Key R&D Program of China (grant no. 2022YFF0800800).
This paper was edited by Taras Gerya and reviewed by Jie Liao and one anonymous referee.
Artemieva, I. M.: Global 1×1 thermal model TC1 for the continental lithosphere: implications for lithosphere secular evolution, Tectonophysics, 416, 245–277, https://doi.org/10.1016/j.tecto.2005.11.022, 2006.
Audet, P. and Bürgmann, R.: Dominant role of tectonic inheritance in supercontinent cycles, Nat. Geosci., 4, 184–187, https://doi.org/10.1038/ngeo1080, 2011.
Barazangi, M. and Ni, J.: Velocities and propagation characteristics of Pn and Sn beneath the Himalayan arc and Tibetan plateau: Possible evidence for underthrusting of Indian continental lithosphere beneath Tibet, Geology, 10, 179–185, https://doi.org/10.1130/0091-7613(1982)10<179:VAPCOP>2.0.CO;2, 1982.
Bian, S., Gong, J., Chen, L., Zuza, A. V., Chen, H., Lin, X., and Yang, R.: Diachronous uplift in intra-continental orogeny: 2D thermo-mechanical modeling of the India-Asia collision, Tectonophysics, 775, 228310, https://doi.org/10.1016/j.tecto.2019.228310, 2020.
Burg, J. P. and Gerya, T. V.: The role of viscous heating in Barrovian metamorphism of collisional orogens: thermomechanical models and application to the Lepontine Dome in the Central Alps, J. Metamorph. Geol., 23, 75–95, https://doi.org/10.1111/j.1525-1314.2005.00563.x, 2005.
Burke, K., Dewey, J. F., and Kidd, W. S. F.: World distribution of sutures – the sites of former oceans, Tectonophysics, 40, 69–99, https://doi.org/10.1016/0040-1951(77)90030-0, 1977.
Bürgmann, R. and Dresen, G.: Rheology of the lower crust and upper mantle: Evidence from rock mechanics, geodesy, and field observations, Annu. Rev. Earth Planet. Sci., 36, 531–567, https://doi.org/10.1146/annurev.earth.36.031207.124326, 2008.
Burov, E. B.: Rheology and strength of the lithosphere, Mar. Petrol. Geol., 28, 1402–1443, https://doi.org/10.1016/j.marpetgeo.2011.05.008, 2011.
Burov, E. B. and Watts, A. B.: The long-term strength of continental lithosphere: “jelly sandwich” or “crème brûlée”?, GSA Today, 16, 4–10, https://doi.org/10.1130/1052-5173(2006)016<4:TLTSOC>2.0.CO;2, 2006.
Charvet, J., Shu, L., Faure, M., Choulet, F., Wang, B., Lu, H., and Le Breton, N.: Structural development of the Lower Paleozoic belt of South China: genesis of an intracontinental orogeny, J. Asian Earth Sci., 39, 309–330, https://doi.org/10.1016/j.jseaes.2010.03.006, 2010.
Chen, M., Niu, F., Tromp, J., Lenardic, A., Lee, C. T. A., Cao, W., and Ribeiro, J.: Lithospheric foundering and underthrusting imaged beneath Tibet, Nat. Commun., 8, 15659, https://doi.org/10.1038/ncomms15659, 2017.
Chen, L.: The role of lower crustal rheology in lithospheric delamination during orogeny, Front. Earth Sci., 9, 755519, https://doi.org/10.3389/feart.2021.755519, 2021.
Chen, L. and Gerya, T. V.: The role of lateral lithospheric strength heterogeneities in orogenic plateau growth: Insights from 3-D thermo-mechanical modeling, J. Geophys. Res.-Solid, 121, 3118–3138, https://doi.org/10.1002/2016JB012872, 2016.
Chen, L., Capitanio, F. A., Liu, L., and Gerya, T. V.: Crustal rheology controls on the Tibetan plateau formation during India-Asia convergence, Nat. Commun., 8, 15992, https://doi.org/10.1038/ncomms15992, 2017.
Chen, L., Liu, L., Capitanio, F. A., Gerya, T. V., and Li, Y.: The role of pre-existing weak zones in the formation of the Himalaya and Tibetan plateau: 3-D thermomechanical modelling, Geophys. J. Int., 221, 1971–1983, https://doi.org/10.1093/gji/ggaa125, 2020.
Chen, W. P. and Molnar, P.: Focal depths of intracontinental and intraplate earthquakes and their implications for the thermal and mechanical properties of the lithosphere, J. Geophys. Res.-Solid, 88, 4183–4214, https://doi.org/10.1029/JB088iB05p04183, 1983.
Chen, Y. and Morgan, W. J.: Rift valley/no rift valley transition at mid-ocean ridges, J. Geophys. Res.-Solid, 95, 17571–17581, https://doi.org/10.1029/JB095iB11p17571, 1990.
Cook, K. L. and Royden, L. H.: The role of crustal strength variations in shaping orogenic plateaus, with application to Tibet, J. Geophys. Res.-Solid, 113, B08407, https://doi.org/10.1029/2007JB005457, 2008.
Crameri, F.: Scientific colour maps, Zenodo [data set], https://doi.org/10.5281/zenodo.1243862, 2018.
Deng, Y. and Tesauro, M.: Lithospheric strength variations in Mainland China: Tectonic implications, Tectonics, 35, 2313–2333, https://doi.org/10.1002/2016TC004272, 2016.
Faccenda, M., Gerya, T. V., and Chakraborty, S.: Styles of post-subduction collisional orogeny: Influence of convergence velocity, crustal rheology and radiogenic heat production, Lithos, 103, 257–287, https://doi.org/10.1016/j.lithos.2007.09.009, 2008.
Faure, M., Shu, L., Wang, B., Charvet, J., Choulet, F., and Monie, P.: Intracontinental subduction: a possible mechanism for the Early Palaeozoic Orogen of SE China, Terra Nova, 21, 360–368, https://doi.org/10.1111/j.1365-3121.2009.00888.x, 2009.
Feng, J., Yao, H., Chen, L., and Wang, W.: Massive lithospheric delamination in southeastern Tibet facilitating continental extrusion, Natl. Sci. Rev., 9, nwab174, https://doi.org/10.1093/nsr/nwab174, 2022.
Gerya, T.: Dynamical instability produces transform faults at mid-ocean ridges, Science, 329, 1047–1050, https://doi.org/10.1126/science.1191349, 2010.
Gerya, T.: Introduction to numerical geodynamic modelling, in: 2nd Edn., Cambridge University Press, 488 pp., ISBN 9781316534243, https://doi.org/10.1017/9781316534243, 2019.
Gerya, T. V. and Yuen, D. A.: Characteristics-based marker-in-cell method with conservative finite-differences schemes for modeling geological flows with strongly variable transport properties, Phys. Earth Planet. Inter., 140, 293–318, https://doi.org/10.1016/j.pepi.2003.09.006, 2003a.
Gerya, T. V. and Yuen, D. A.: Rayleigh–Taylor instabilities from hydration and melting propel `cold plumes' at subduction zones, Earth Planet. Sc. Lett., 212, 47–62, https://doi.org/10.1016/S0012-821X(03)00265-6, 2003b.
Guo, B., Liu, Q. Y., Chen, J. H., Zhao, D. P., Li, S. C., and Lai, Y. G.: Seismic tomography of the crust and upper mantle structure underneath the Chinese Tianshan, Chinese J. Geophys., 49, 1543–1551, https://doi.org/10.1002/cjg2.982, 2006.
Guo, L. Z., Shi, Y. S., Lu, H. F., Ma, R. S., Dong, H. G., and Yang, S. F.: The pre-Devonian tectonic patterns and evolution of South China, J. SE Asian Earth Sci., 3, 87–93, https://doi.org/10.1016/0743-9547(89)90012-3, 1989.
Hacker, B. R., Kelemen, P. B., and Behn, M. D.: Continental lower crust, Annu. Rev. Earth Planet. Sci., 43, 167–205, https://doi.org/10.1146/annurev-earth-050212-124117, 2015.
Han, Y. and Zhao, G.: Final amalgamation of the Tianshan and Junggar orogenic collage in the southwestern Central Asian Orogenic Belt: Constraints on the closure of the Paleo-Asian Ocean, Earth-Sci. Rev., 186, 129–152, https://doi.org/10.1016/j.earscirev.2017.09.012, 2018.
Hapaer, T., Tang, Q., Sun, W., Ao, S., Zhao, L., Hu, J., Jiang, M., and Xiao, W.: Opposite facing dipping structure in the uppermost mantle beneath the central Tien Shan from Pn traveltime tomography, Int. J. Earth Sci., 111, 2571–2584, https://doi.org/10.1007/s00531-022-02162-9, 2022.
Heron, P. J. and Pysklywec, R. N.: Inherited structure and coupled crust-mantle lithosphere evolution: Numerical models of Central Australia, Geophys. Res. Lett., 43, 4962–4970, https://doi.org/10.1002/2016GL068562, 2016.
Heron, P. J., Pysklywec, R. N., and Stephenson, R.: Lasting mantle scars lead to perennial plate tectonics, Nat. Commun., 7, 11834, https://doi.org/10.1038/ncomms11834, 2016.
Hsü, K. J., Li, J., Chen, H., Wang, Q., Sun, S., and Şengör, A. M. C.: Tectonics of South China: key to understanding West Pacific geology, Tectonophysics, 183, 9–39, https://doi.org/10.1016/0040-1951(90)90186-C, 1990.
Huangfu, P., Li, Z. H., Gerya, T., Fan, W., Zhang, K. J., Zhang, H., and Shi, Y.: Multi-terrane structure controls the contrasting lithospheric evolution beneath the western and central–eastern Tibetan plateau, Nat. Commun., 9, 3780, https://doi.org/10.1038/s41467-018-06233-x, 2018.
Huangfu, P., Li, Z. H., Fan, W., Zhang, K. J., and Shi, Y.: Contrasting collision-induced far-field orogenesis controlled by thermo-rheological properties of the composite terrane, Gondwana Res., 103, 404–423, https://doi.org/10.1016/j.gr.2021.10.020, 2022.
Jackson, J. A.: Strength of the continental lithosphere: time to abandon the jelly sandwich?, GSA Today, 12, 4–10, https://doi.org/10.1130/1052-5173(2002)012<0004:SOTCLT>2.0.CO;2, 2002.
Kelly, S., Butler, J. P., and Beaumont, C.: Continental collision with a sandwiched accreted terrane: Insights into Himalayan–Tibetan lithospheric mantle tectonics?, Earth Planet. Sc. Lett., 455, 176–195, https://doi.org/10.1016/j.epsl.2016.08.039, 2016.
Kelly, S., Beaumont, C., and Butler, J. P.: Inherited terrane properties explain enigmatic post-collisional Himalayan-Tibetan evolution, Geology, 48, 8–14, https://doi.org/10.1130/G46701.1, 2020.
Kumar, P., Yuan, X., Kind, R., and Kosarev, G.: The lithosphere-asthenosphere boundary in the Tien Shan-Karakoram region from S receiver functions: Evidence for continental subduction, Geophys. Res. Lett., 32, L07305, https://doi.org/10.1029/2004GL022291, 2005.
Lei, J. and Zhao, D.: Teleseismic P-wave tomography and the upper mantle structure of the central Tien Shan orogenic belt, Phys. Earth Planet. Inter., 162, 165–185, https://doi.org/10.1016/j.pepi.2007.04.010, 2007.
Li, C., Van der Hilst, R. D., Meltzer, A. S., and Engdahl, E. R.: Subduction of the Indian lithosphere beneath the Tibetan Plateau and Burma, Earth Planet. Sc. Lett., 274, 157–168, https://doi.org/10.1016/j.epsl.2008.07.016, 2008.
Li, J., Zhang, J., Zhao, X., Jiang, M., Li, Y., Zhu, Z., Feng, Q., Wang L., Sun, G., Liu. J., and Yang, T.: Mantle subduction and uplift of intracontinental mountains: A case study from the Chinese Tianshan Mountains within Eurasia, Sci. Rep., 6, 28831, https://doi.org/10.1038/srep28831, 2016.
Li, Z.: Tectonic History of the Major East Asian Lithospheric Blocks Since the Mid-Proterozoic – A Synthesis, in: Mantle Dynamics and Plate Interactions in East Asia, edited by: Martin, F., Chung, S., Lo, C., and Lee, T., American Geophysical Union, 27, 221–243, ISBN 978-1-118-67013-2, 1998.
Li, Z. H., Liu, M., and Gerya, T.: Lithosphere delamination in continental collisional orogens: A systematic numerical study, J. Geophys. Res.-Solid, 121, 5186–5211, https://doi.org/10.1002/2016JB013106, 2016.
Li, Z. X., Li, X. H., Wartho, J. A., Clark, C., Li, W. X., Zhang, C. L., and Bao, C.: Magmatic and metamorphic events during the early Paleozoic Wuyi-Yunkai orogeny, southeastern South China: New age constraints and pressure-temperature conditions, GSA Bull., 122, 772–793, https://doi.org/10.1130/B30021.1, 2010.
Liang, X., Sandvol, E., Chen, Y. J., Hearn, T., Ni, J., Klemperer, S., …, and Tilmann, F.: A complex Tibetan upper mantle: A fragmented Indian slab and no south-verging subduction of Eurasian lithosphere, Earth Planet. Sc. Lett., 333, 101–111, https://doi.org/10.1016/j.epsl.2012.03.036, 2012.
Lu, H., Tian, X., Yun, K., and Li, H.: Convective removal of the Tibetan Plateau mantle lithosphere by ∼26 Ma, Tectonophysics, 731, 17–34, https://doi.org/10.1016/j.tecto.2018.03.006, 2018.
Lü, Z., Gao, H., Lei, J., Yang, X., Rathnayaka, S., and Li, C.: Crustal and upper mantle structure of the Tien Shan orogenic belt from full-wave ambient noise tomography, J. Geophys. Res.-Solid, 124, 3987–4000, https://doi.org/10.1029/2019JB017387, 2019.
Ma, L., Wang, Q., Kerr, A. C., and Tang, G. J.: Nature of the pre-collisional lithospheric mantle in central Tibet: Insights to Tibetan Plateau uplift, Lithos, 388, 106076, https://doi.org/10.1016/j.lithos.2021.106076, 2021.
Mitchell, R., Zhang, N., Salminen, J., Liu, Y., Spencer, C., Steinberger, B., Murphy J., and Li, Z.: The supercontinent cycle, Nat. Rev. Earth Environ., 2, 358–374, https://doi.org/10.1038/s43017-021-00160-0, 2021.
Molnar, P., England, P., and Martinod, J.: Mantle dynamics, uplift of the Tibetan Plateau, and the Indian monsoon, Rev. Geophys., 31, 357–396, https://doi.org/10.1029/93RG02030, 1993.
Morgan, J. P. and Vannucchi, P.: Transmogrification of ocean into continent: implications for continental evolution, P. Natl. Acad. Sci. USA, 119, e2122694119, https://doi.org/10.1073/pnas.2122694119, 2022.
Owens, T. J. and Zandt, G.: Implications of crustal property variations for models of Tibetan plateau evolution, Nature, 387, 37–43, https://doi.org/10.1038/387037a0, 1997.
Pasyanos, M. E., Masters, T. G., Laske, G., and Ma, Z.: LITHO1.0: An updated crust and lithospheric model of the Earth, J. Geophys. Res.-Solid, 119, 2153–2173, https://doi.org/10.1002/2013JB010626, 2014.
Ranalli, G.: Rheology of the Earth, in: 2nd Edn., Springer Science and Business Media, 421 pp., ISBN 0412546701, 1995.
Schmeling, H., Bakeyko, A., Enns, A., Faccenna, C., Funiciello, F., Gerya, T., Golabek, G., Grigull, S., Kaus, B., Morra, G., Schmalholz, S., and van Hunen, J.: A benchmark comparison of spontaneous subduction models – Towards a free surface, Phys. Earth Planet. Inter., 171, 198–223, https://doi.org/10.1016/j.pepi.2008.06.028, 2008.
Shu, L. S., Lu, H. F., Jia, D.: Study of the 40Ar/39Ar Isotopic Age for the Early Paleozoic Tectonothermal Event in the Wuyishan Region, South China, Journal Nanjing University Natural Sciences Edition, 35, 668–674, 1999.
Sokoutis, D. and Willingshofer, E.: Decoupling during continental collision and intra-plate deformation, Earth Planet. Sc. Lett., 305, 435–444, https://doi.org/10.1016/j.epsl.2011.03.028, 2011.
Sun, W., Ao, S., Tang, Q., Malusà, M. G., Zhao, L., and Xiao, W.: Forced Cenozoic continental subduction of Tarim craton-like lithosphere below the Tianshan revealed by ambient noise tomography, Geology, 50, 1393–1397, https://doi.org/10.1130/G50510.1, 2022.
Sun, Y. and Liu, M.: Rheological control of lateral growth of the Tibetan Plateau: Numerical results, J. Geophys. Res.-Solid, 123, 10124–10141, https://doi.org/10.1029/2018JB016601, 2018.
Tunini, L., Jimenez-Munt, I., Fernandez, M., Verges, J., Villasenor, A., Melchiorre, M., and Afonso, J. C.: Geophysical-petrological model of the crust and upper mantle in the India-Eurasia collision zone, Tectonics, 35, 1642–1669, https://doi.org/10.1002/2016TC004161, 2016.
Turner, S., Arnaud, N., Liu, J., Rogers, N., Hawkesworth, C., Harris, N., Kelley, S., van Calsteren, P., and Deng, W.: Post-collision, shoshonitic volcanism on the Tibetan Plateau: implications for convective thinning of the lithosphere and the source of ocean island basalts, J. Petrol., 37, 45–71, https://doi.org/10.1093/petrology/37.1.45, 1996.
Vink, G. E., Morgan, W. J., Zhao, W. L.: Preferential rifting of continents: a source of displaced terranes, J. Geophys. Res.-Solid, 89, 10072–10076, https://doi.org/10.1029/JB089iB12p10072, 1984.
Vogt, K., Matenco, L., and Cloetingh, S.: Crustal mechanics control the geometry of mountain belts. Insights from numerical modelling, Earth Planet. Sc. Lett., 460, 12–21, https://doi.org/10.1016/j.epsl.2016.11.016, 2017.
Vogt, K., Willingshofer, E., Matenco, L., Sokoutis, D., Gerya, T., and Cloetingh, S.: The role of lateral strength contrasts in orogenesis: A 2D numerical study, Tectonophysics, 746, 549–561, https://doi.org/10.1016/j.tecto.2017.08.010, 2018.
Wang, C. Y., Yang, Z. E., Luo, H., and Mooney, W. D.: Crustal structure of the northern margin of the eastern Tien Shan, China, and its tectonic implications for the 1906 M∼7.7 Manas earthquake, Earth Planet. Sc. Lett., 223, 187–202, https://doi.org/10.1016/j.epsl.2004.04.015, 2004.
Wu, Y., Bao, X., Zhang, B., Xu, Y., and Yang, W.: Seismic evidence for stepwise lithospheric delamination beneath the Tibetan Plateau, Geophys. Res. Lett., 49, e2022GL098528, https://doi.org/10.1029/2022GL098528, 2022.
Xie, R.: Various lithospheric deformation patterns derived from rheological contrasts between continental terranes: Insights from 2-D numerical simulations (1.0), Zenodo [data set], https://doi.org/10.5281/zenodo.10731981, 2024.
Xie, R., Chen, L., Xiong, X., Wang, K., and Yan, Z.: The Role of Pre-existing Crustal Weaknesses in the Uplift of the Eastern Tibetan Plateau: 2D Thermo-Mechanical Modeling, Tectonics, 40, e2020TC006444, https://doi.org/10.1029/2020TC006444, 2021.
Xie, R., Chen, L., Yin, A., Xiong, X., Chen, Y. J., Guo, Z., and Wang, K.: Two phases of crustal shortening in northeastern Tibet as a result of a stronger Qaidam lithosphere during the Cenozoic India–Asia collision, Tectonics, 42, e2022TC007261, https://doi.org/10.1029/2022TC007261, 2023.
Xie, R., Chen, L., Morgan, J. P., and Chen, Y. J.: Various lithospheric deformation patterns derived from rheological contrasts between continental terranes: Insights from 2-D numerical simulations (Ver.1), Zenodo [code], https://doi.org/10.5281/zenodo.12645964, 2024a.
Xie, R., Chen, L., Morgan, J. P., and Chen, Y. J.: Various lithospheric deformation patterns derived from rheological contrasts between continental terranes: Insights from 2-D numerical simulations, Zenodo [data set], https://doi.org/10.5281/zenodo.8354366, 2024b.
Xu, Y., Liu, F., Liu, J., and Chen, H.: Crust and upper mantle structure beneath western China from P wave travel time tomography, J. Geophys. Res.-Solid, 107, ESE 4-1–ESE 4-15, https://doi.org/10.1029/2001JB000402, 2002.
Yin, A. and Harrison, T. M.: Geologic evolution of the Himalayan-Tibetan orogen, Annu. Rev. Eearth Planet. Sci., 28, 211–280, https://doi.org/10.1146/annurev.earth.28.1.211, 2000.
Yin, A., Nie, S., Craig, P., Harrison, T. M., Ryerson, F. J., Xianglin, Q., and Geng, Y.: Late Cenozoic tectonic evolution of the southern Chinese Tian Shan, Tectonics, 17, 1–27, https://doi.org/10.1029/97TC03140, 1998.
Zhang, Z., Deng, Y., Teng, J., Wang, C., Gao, R., Chen, Y., and Fan, W.: An overview of the crustal structure of the Tibetan plateau after 35 years of deep seismic soundings, J. Asian Earth Sci., 40, 977–989, https://doi.org/10.1016/j.jseaes.2010.03.010, 2011.
Zhang, Z., Deng, Y., Chen, L., Wu, J., Teng, J., and Panza, G.: Seismic structure and rheology of the crust under mainland China, Gondwana Res., 23, 1455–1483, https://doi.org/10.1016/j.gr.2012.07.010, 2013.
Zhang, Z., Teng, J., Romanelli, F., Braitenberg, C., Ding, Z., Zhang, X., Fang, L., Zhang, S., Wu, J., Deng, Y., Ma, T., Sun, R., and Panza, G.: Geophysical constraints on the link between cratonization and orogeny: Evidence from the Tibetan Plateau and the North China Craton, Earth-Sci. Rev., 130, 1–48, https://doi.org/10.1016/j.earscirev.2013.12.005, 2014.
Zhao, W. L. and Morgan, W. J.: Uplift of Tibetan plateau, Tectonics, 4, 359–369, https://doi.org/10.1029/TC004i004p00359, 1985.