the Creative Commons Attribution 4.0 License.
the Creative Commons Attribution 4.0 License.
 | 16 Jul 2024
Palaeoseismic crisis in the Galera Fault (southern Spain): consequences in Bronze Age settlements?
Ivan Medina-Cascales
Francisco Juan García-Tortosa
Maria Oliva Rodríguez-Ariza
Fernando Molina González
Juan Antonio Cámara Serrano
Pedro Alfaro
Palaeoseismological studies play a crucial role in the seismic characterization of regions with slow-moving faults. This is the case in the central Betic Cordillera, a highly populated area for which the record of prehistoric earthquakes is very limited, despite being one of the regions with the greatest seismic hazard in Spain.
We present here a palaeoseismological characterization of the Galera Fault, one of the active faults accommodating deformation in the central Betic Cordillera. We excavated and analysed several trenches along the fault trace. We quantitatively correlate the results from these trenches, resulting in a surface rupture history involving seven or eight events (accounting for the epistemic uncertainties) during the last ca. 24 000 years, with recurrence intervals ranging from 1520 to 1720 years. Further analysis of this surface rupture history seems to indicate that the Galera Fault is prone to producing earthquake clusters as we recorded five events in ∼400 years (ca. 1536–1126 BCE) and only two events in the ∼3200 years that followed.
Using the fault geometry and palaeoseismological data, we also carried out a seismogenic characterization of the fault. This analysis yielded a maximum expected magnitude of 6.7 ± 0.3 and a recurrence interval of 1857 years. Furthermore, we also present a geodetic rupture scenario for the maximum expected event, involving displacements of up to 0.5 m.
Finally, we discuss the possible impact of the deduced palaeoearthquakes on the development of Bronze Age human settlements located in the vicinity of the fault. In addition to their intrinsic value, our results will provide the basis for future seismic-hazard assessments carried out in the central Betic Cordillera.
- Article
(14263 KB) - Full-text XML
-
Supplement
(39492 KB) - BibTeX
- EndNote


The plate boundary between the Iberian Peninsula (Eurasia plate) and North Africa (Nubia plate) moves at a moderate rate of 5–7 mm yr−1 (DeMets et al., 1994; Nocquet, 2012) (Fig. 1). This plate boundary presents a complex tectonic arrangement, with areas dominated by shortening, extension, and oblique kinematics. Along this boundary lies the central Betic Cordillera, a region dominated by ENE–WSW extension that is accommodated mainly by active normal faults with a NNW–SSE orientation (Fig. 1) (Sanz de Galdeano et al., 2012, 2020; Castro et al., 2018; Galindo-Zaldivar et al., 2015; Gil et al., 2017; Martin-Rojas et al., 2023; Medina-Cascales et al., 2020b, 2019, 2021a; Rodríguez-Fernández and Sanz de Galdeano, 2006). Because of this deformation, this region is one of the more active tectonic zones in the Iberian Peninsula and is undergoing significant seismicity (Galindo-Zaldívar et al., 1999; Herraiz et al., 2000; Madarieta-Txurruka et al., 2021a, 2022; Morales et al., 1997; Reicherter et al., 2003; Ruano et al., 2006; Sanz de Galdeano et al., 2003). Regarding seismicity, the central Betic Cordillera has experienced the most destructive instance of onshore historical earthquakes in Spain, the 1884 Andalusian earthquake (IEMS98 IX-X; estimated magnitude Mw of 6.5) (Muñoz and Udías, 1991), and other significant events, such as the 1531 Baza earthquake (IMMI VIII-IX; estimated magnitude of about 6.0) (Sanz de Galdeano et al., 2012; Martínez-Solares and Mezcua, 2002), the 1964 Galera earthquake (VII; mbLg: 4.8) (Martínez-Solares and Mezcua, 2002; García-Tortosa et al., 2008; Silva Barroso et al., 2014), and the 2021 Granada seismic sequence (Lozano et al., 2022; Madarieta-Txurruka et al., 2021b, 2022). Moreover, the central sector of the Betic Cordillera has been densely populated since prehistoric times and today includes important urban centres, e.g. Granada, Guadix, and Baza.
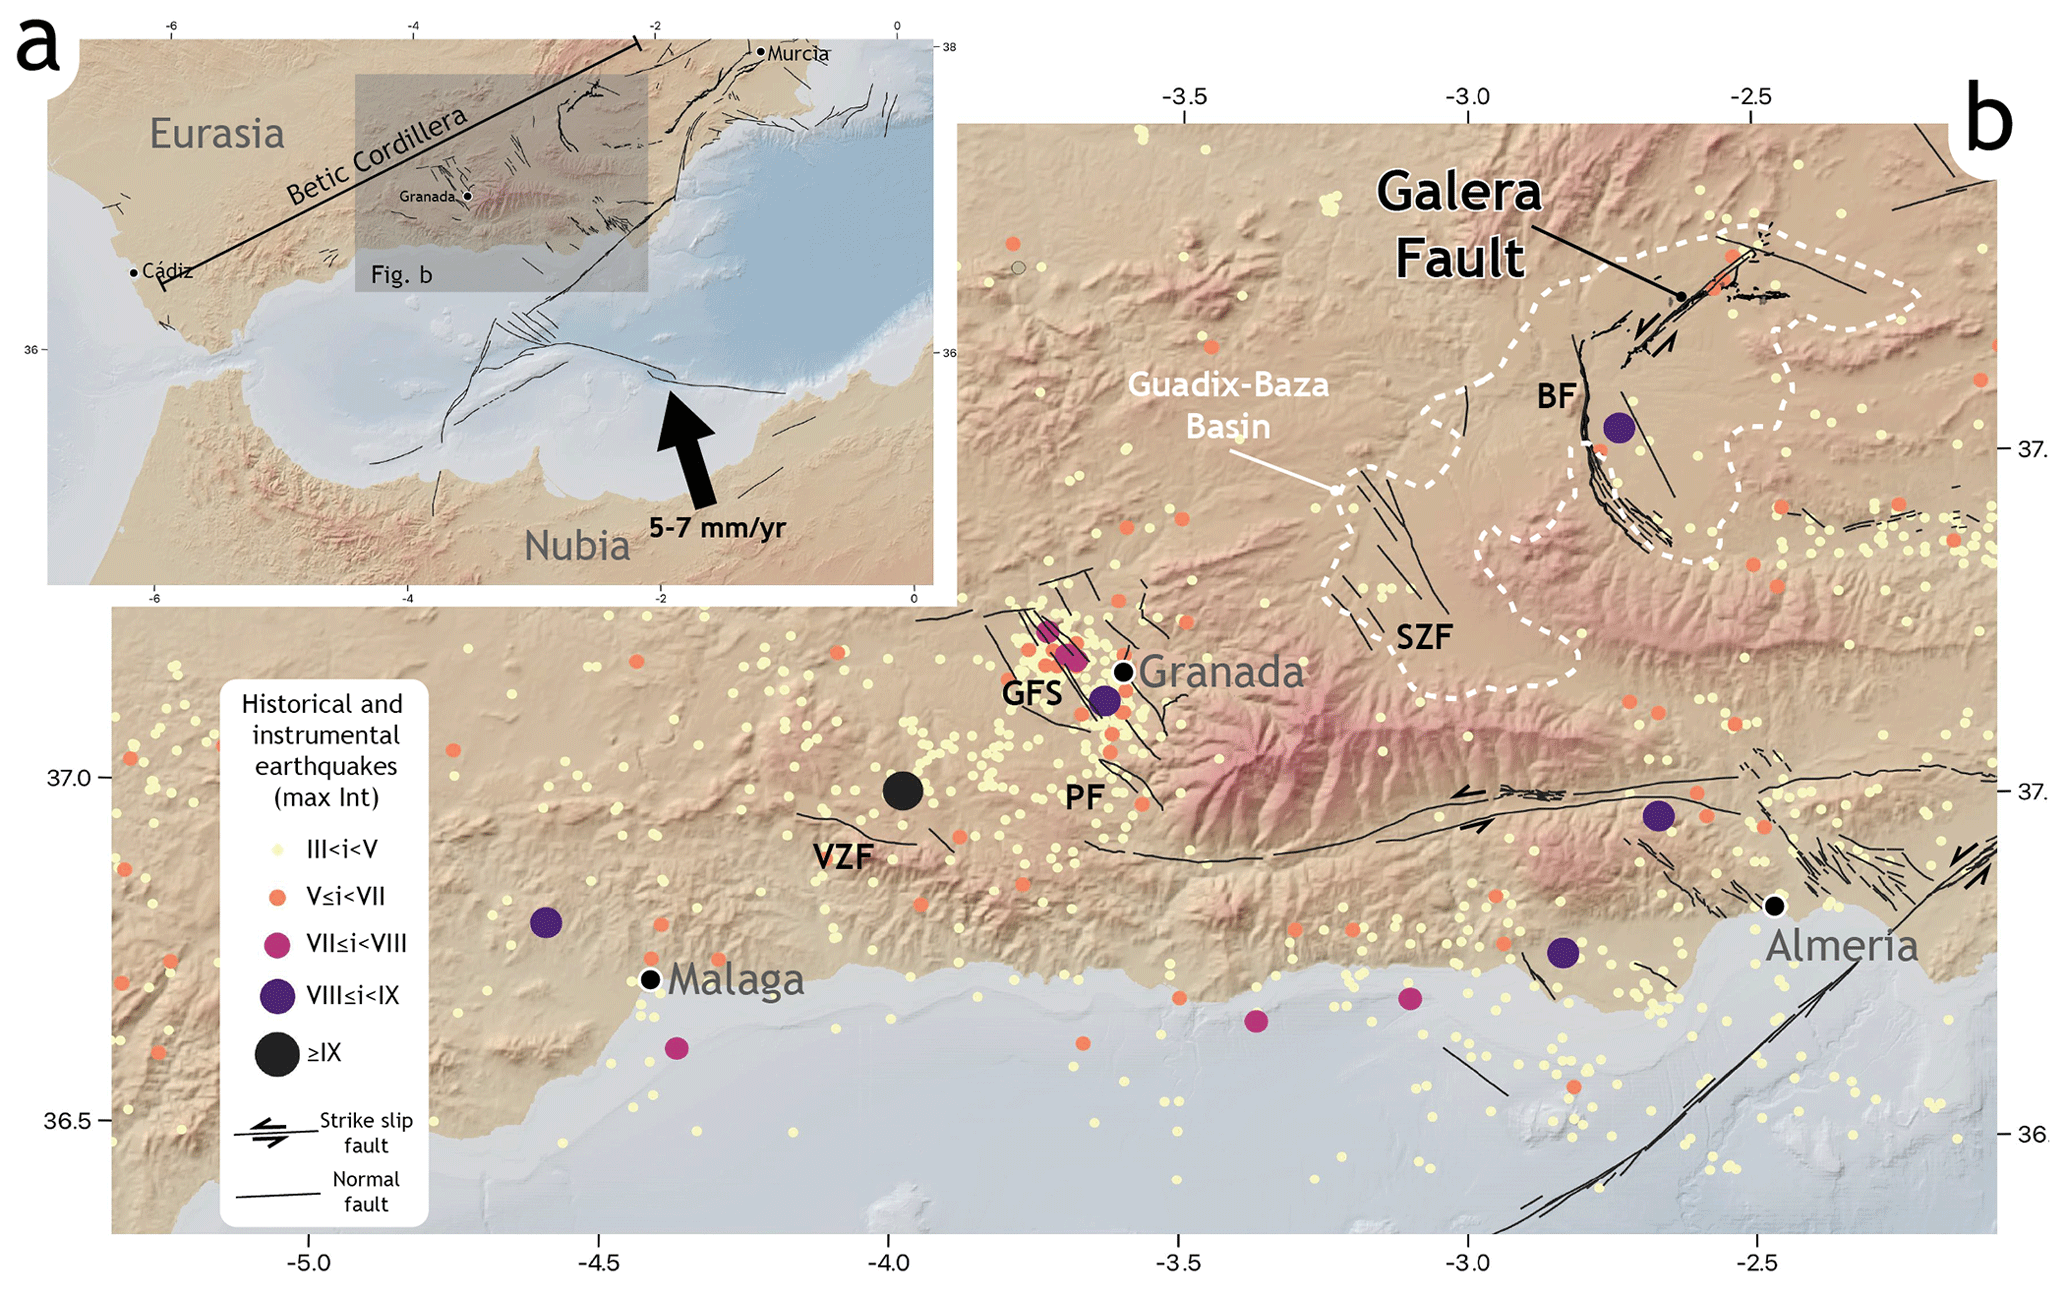
Figure 1(a) Tectonic setting of the western Mediterranean region. (b) Seismotectonic map of the central Betic Cordillera. BF: Baza Fault. SZF: Solana del Zamborino Fault. GFS: Granada Fault system. PF: Padul Fault. VZF: Ventas de Zafarraya Fault. Int: intensity.
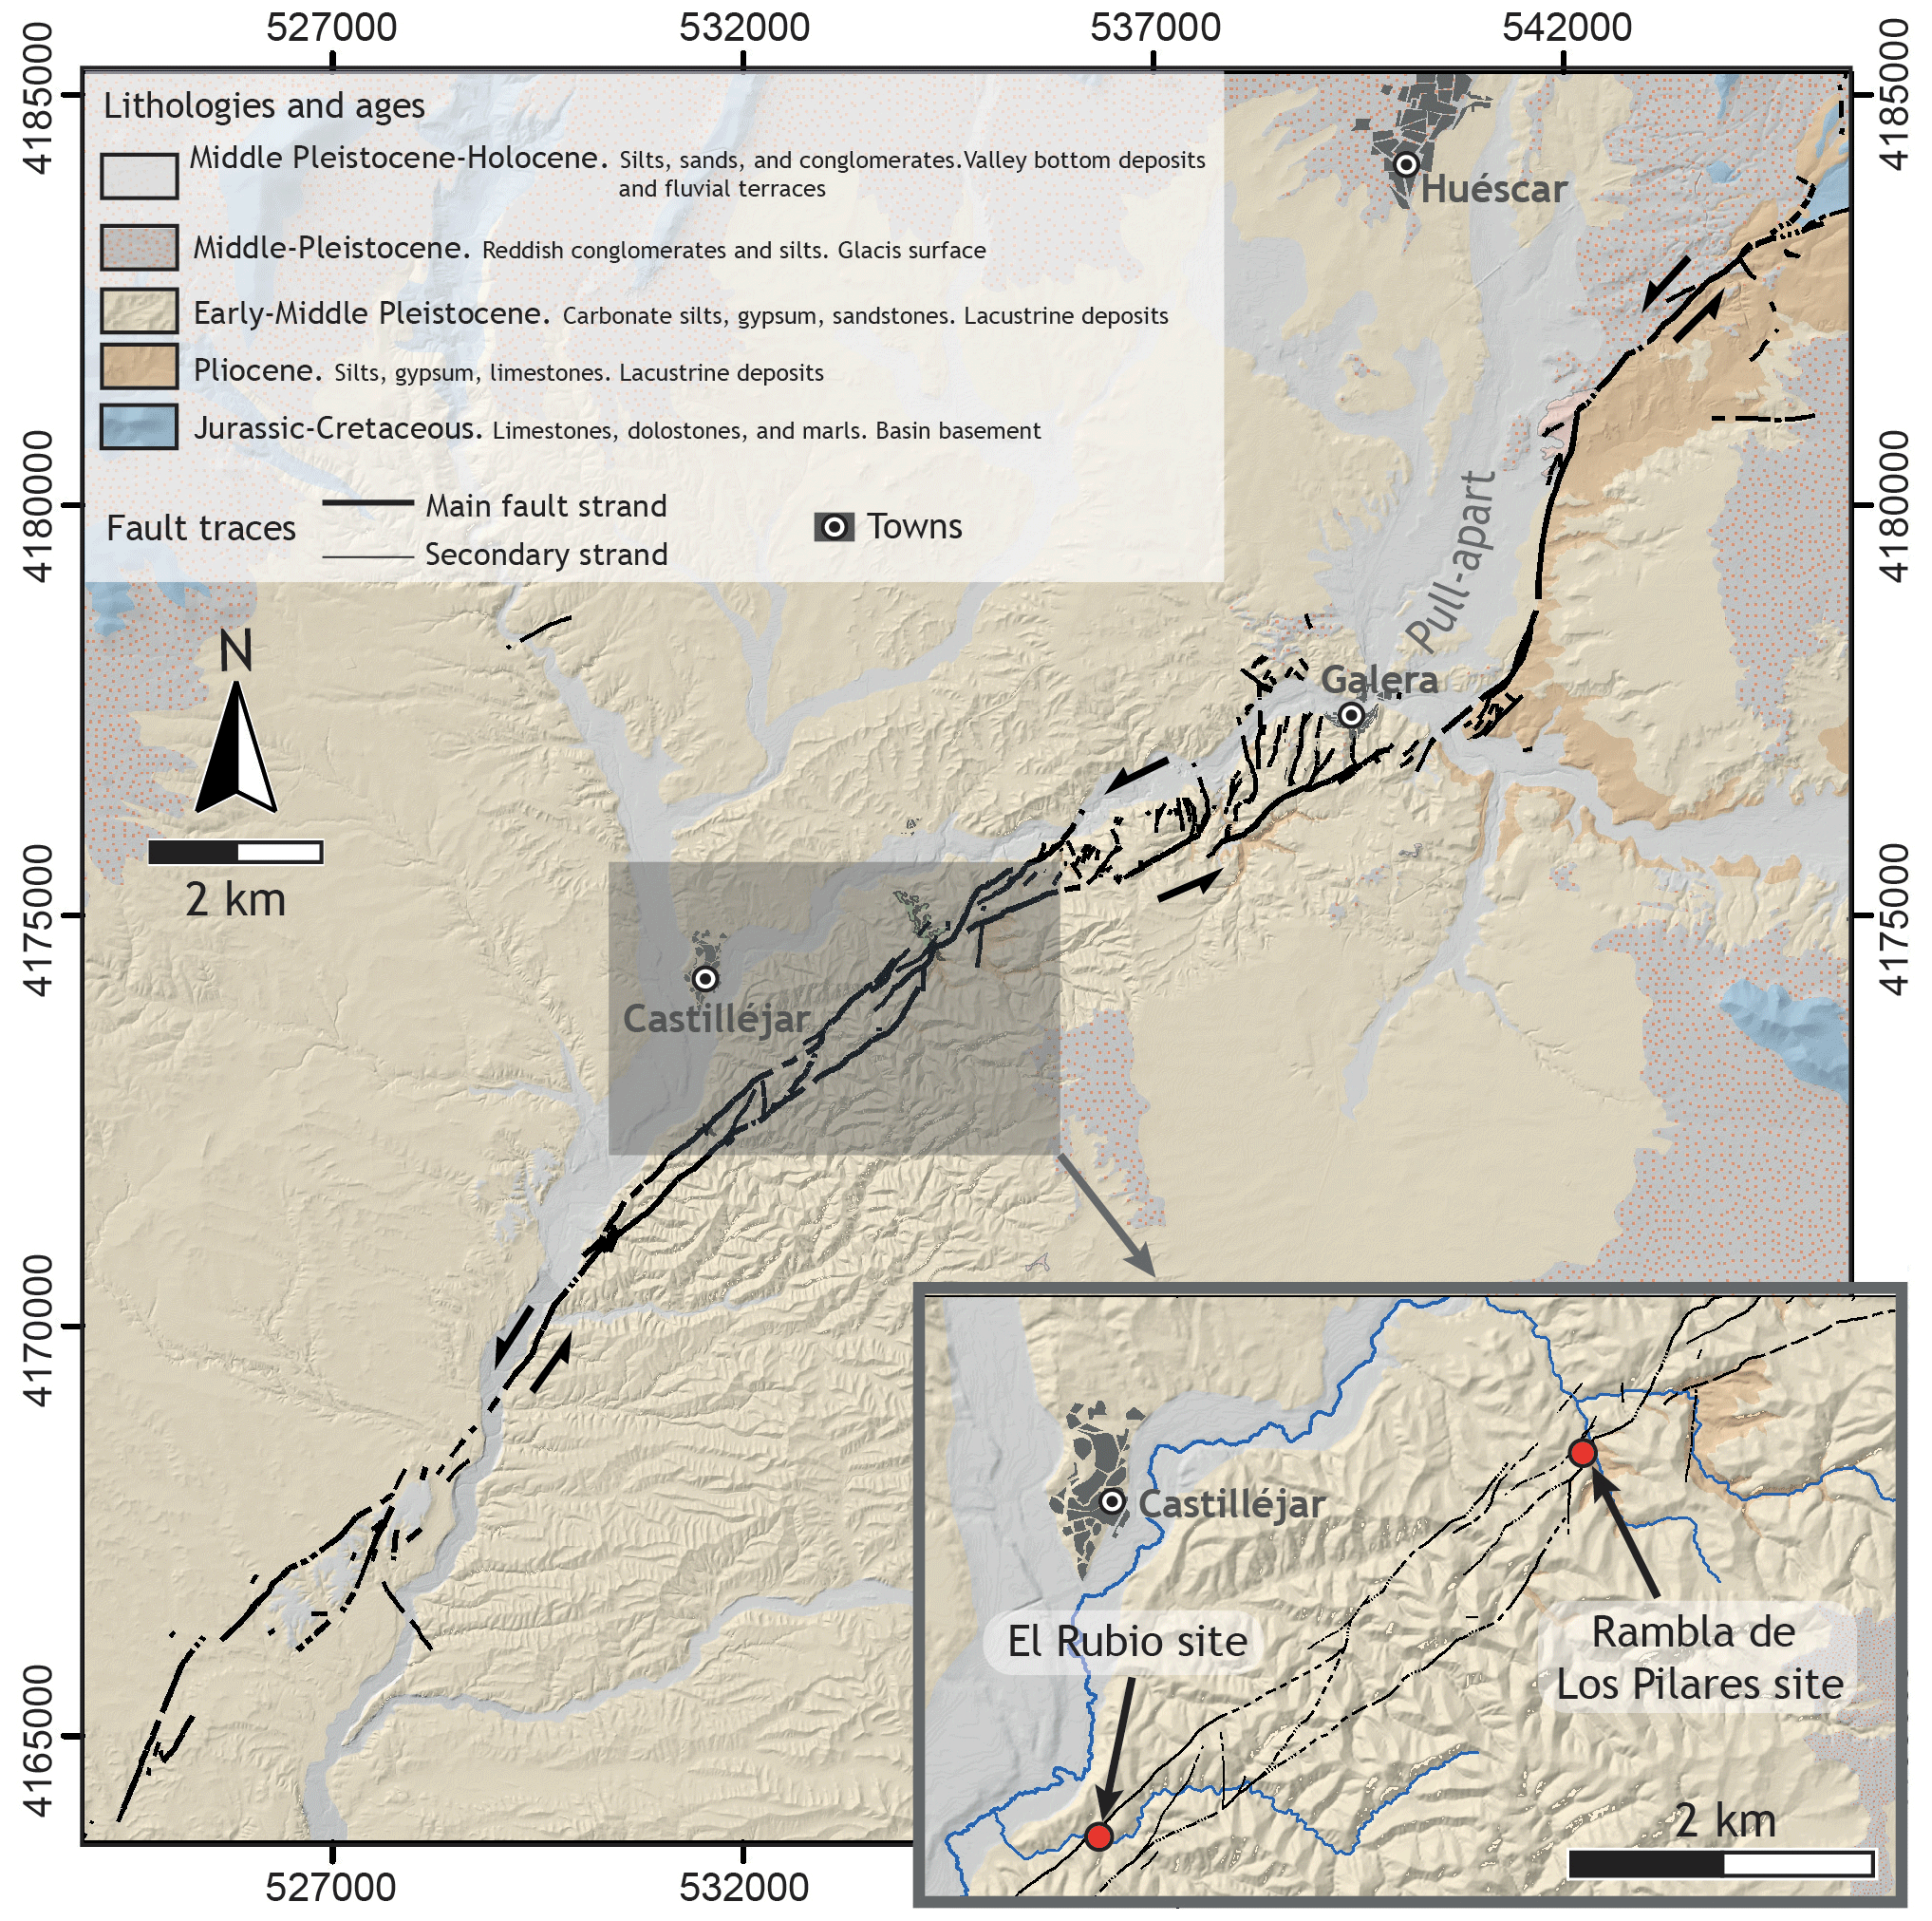
Figure 2Geological map of the strike-slip Galera Fault. The inset shows the locations of the trench sites analysed in this study.
Such an intrinsic seismic risk makes probabilistic seismic-hazard assessment (PSHA) studies essential in the central Betic Cordillera. PSHAs become increasingly precise as the seismic record extends further into the past. Therefore, basing an assessment solely on historical and instrumental records exhibits limited reliability, especially in areas dominated by slow faults with long recurrence intervals, such as the Betic Cordillera. Thus, the incorporation of palaeoseismological data becomes mandatory to improve PSHAs. The problem in this region lies in the fact that palaeoseismic data are very scarce. The first data were provided by Alfaro et al. (2010), who studied liquefaction structures related to the Padul Fault (Fig. 1). They proposed these features as seismic evidence pertaining to the Late Pleistocene (ca. 35 to 30 ka). Later, Reicherter et al. (2003) conducted a study on the Ventas de Zafarraya Fault (Fig. 1). The authors reported two events in the last 10 kyr, which took place prior to the 1884 Andalusian earthquake, and estimated recurrence intervals of between 2 and 3 kyr for major earthquakes in this fault. The last palaeoseismological study in the central Betic Cordillera was carried out by Castro et al. (2018) in the Baza Fault (Figs. 1 and 2). In this study, they identified eight to nine surface-rupturing events in the last 45 kyr, providing recurrence intervals of 5 kyr. Palaeoliquefaction features were also reported in the Baza and Galera faults (Alfaro et al., 1997; Alfaro et al., 2010) and were interpreted as indirect evidence of palaeoearthquakes. These pioneering results are essential for assessment studies of seismic hazards, but the overall palaeoseismic record of active faults in the central Betic Cordillera is still very poor, with many faults still lacking their own studies.
The aim of this work is to provide the first palaeoseismic data from the Galera Fault, one of the active structures accommodating present deformation in the central Betic Cordillera. We provide and describe palaeoseismic evidence from two trench sites. We depict stratigraphic and structural observations of the trench walls and carry out a Bayesian analysis to model the initial surface-rupturing history for the Galera Fault, integrating evidence from the two sites. Then, we calculate the recurrence intervals between the proposed events. We also discuss the temporal fault behaviour in terms of potential temporal clustering. Furthermore, we carry out a preliminary seismogenic characterization of the fault, calculating the main parameters of its seismic potential and modelling a geodetic rupture scenario. Finally, we discuss the implications of our findings in terms of the potential impact of palaeoearthquake clustering on Bronze Age human societies that were situated near this active structure.
The Galera Fault is located in the Guadix–Baza Basin, an intramontane basin in the central sector of the Betic Cordillera (western Mediterranean region) (Fig. 1). Since the late Miocene, the geodynamic setting of the Betic Cordillera has been conditioned by the NNW–SSE convergence between the Nubia and Eurasia plates (approximately 5–7 mm yr−1) (DeMets et al., 1994; Nocquet, 2012). Against this background, the central Betic Cordillera is dominated by regional NNW–SSE shortening (DeMets et al., 1994; Galindo-Zaldívar et al., 1993; Herraiz et al., 2000; Nocquet, 2012; Sanz de Galdeano and Alfaro, 2004) as well as perpendicular extension with a predominantly ENE–WSW orientation (e.g. (Galindo-Zaldivar et al., 2015, 1993), with rates estimated to be between 2.1 and 3.7 mm yr−1 (e.g. Martin-Rojas et al., 2023; Pérez-Peña et al., 2010; Serpelloni et al., 2007). Since the Miocene, this extension has been responsible for steeply dipping normal faults with a NNW–SSE orientation and oblique faults oriented SW–NE to W–E (e.g. Alfaro et al., 2008; Sanz de Galdeano et al., 2012, 2020; Galindo-Zaldivar et al., 2015; Gil et al., 2017; Martínez-Martínez et al., 2006; Medina-Cascales et al., 2020a, 2020b, 2021a; Pedrera et al., 2006; Rodríguez-Fernández and Sanz de Galdeano, 2006). In the Guadix–Baza Basin (Fig. 1), the main structures accommodating the regional extension are the normal Baza Fault (Alfaro et al., 2008; Castro et al., 2018; Medina-Cascales et al., 2020b) and the oblique Galera Fault (García-Tortosa et al., 2011; Medina-Cascales et al., 2021b).
The Galera Fault (GF) is an intrabasinal fault that offsets and juxtaposes rocks from the sedimentary infill of the Guadix–Baza Basin (Figs. 1 and 2). The basin infill consists of upper Miocene to Quaternary sediments that cover Palaeozoic to Neogene rocks from the Betic Internal and External Zones (García-Aguilar and Martín, 2000; García-Aguilar and Palmqvist, 2011; Gibert et al., 2007a, b; Soria et al., 1987; Soria et al., 1999; Vera et al., 1983, 1970). The Guadix–Baza Basin was established as an endorheic continental basin during the late Miocene after a marine-to-continental transition due to a regional uplift of the central Betic Cordillera (Corbí et al., 2012; Sanz de Galdeano and Vera, 1992; García-Aguilar and Martín, 2000; Peña, 1985). From the early Pliocene to the middle Pleistocene, the basin was dominated by extensive continental sedimentation (García-Tortosa et al., 2008; Gibert et al., 2007a, b). During this period, more than 2000 m of sediment accumulated in the Guadix–Baza Basin, as indicated by geological, gravity, and seismic data (e.g. Vera, 1970, 1983; Peña, 1985; Soria et al., 1987; Alfaro et al., 2008; Haberland et al., 2017). During the endorheic stage, the GF did not develop any surface expression as the slow vertical slip rate was surpassed by the sedimentation rate, and thus, any geomorphic evidence was easily buried (Medina-Cascales et al., 2021).
The Guadix–Baza Basin became exorheic in the middle Pleistocene (600–500 ka, Gibert et al., 2007b; García-Tortosa et al., 2008, 2011) after its drainage was captured (Calvache Quesada and Viseras, 1995; Diaz-Hernandez and Julia, 2006; García-Tortosa et al., 2008; Gibert et al., 2007a, b; Scott and Gibert, 2009). Since then, extensive sedimentation has ended, and erosion has since dominated the basin. Deposition of new sediments during recent Quaternary times has been restricted to the basin margins (alluvial fans and piedmont deposits) and the modern drainage system (fluvial terraces and valley-bottom deposits). During the exorheic stage, the displacement of the GF led to the development of certain geomorphic expressions. These expressions are mainly characterized by a gentle elevation in the basin's upthrown side and its control over the development of the drainage network in the NE sector of the basin (García-Tortosa et al., 2011; Medina-Cascales et al., 2021).
The GF is a SW–NE-oriented fault that extends 30 km along the NE sector of the Guadix–Baza Basin (Figs. 1 and 2). The GF presents a slow, oblique displacement, characterized by a main left-lateral-slip component (0.5 ± 0.3 mm yr−1, Alfaro et al., 2021) and a minor vertical slip component (0.02–0.24 mm yr−1, García-Tortosa et al., 2011; Medina-Cascales et al., 2021). The GF shows kinematic coherence with the normal Baza fault, which is located towards the SW (Fig. 1) (Alfaro et al., 2021). The surface expression of the GF consists of a fault zone with a width that ranges from a few tens of metres to 1500 m (Fig. 2). The fault zone geometry shows remarkable along-strike variations (Medina-Cascales et al., 2021), changing from extensional duplex structures in the SW to en echelon and linear patterns in the NE, including a pull-apart basin (Fig. 1).
In addition to geodetic (Alfaro et al., 2021) and geomorphic (García-Tortosa et al., 2011; Medina-Cascales et al., 2021) evidence of recent fault activity, the GF presents both palaeoseismological and instrumental seismicity. Near the GF zone, more than 10 levels of giant seismites can be identified within the sedimentary succession from the Pliocene to Pleistocene (Alfaro et al., 1997, 2010), indicating occurrences of relatively large-magnitude earthquakes in the area. More recently, during instrumental times, the GF was the seismogenic source of the 1964 Galera earthquake (IEMS98 VII; mbLg: 4.7) (Martínez-Solares and Mezcua, 2002; Silva et al., 2014). This earthquake was responsible for causing severe damage to many buildings in the villages of Galera, Orce, Huéscar, and Castilléjar (Silva Barroso et al., 2014); partially reactivating a massive rock avalanche close to the village of Galera; and causing great social alarm. The GF has also been proposed as the seismogenic source of the 1973 Huéscar earthquake (mbLg: 4.0) and the background seismicity in the area (Silva et al., 2014).
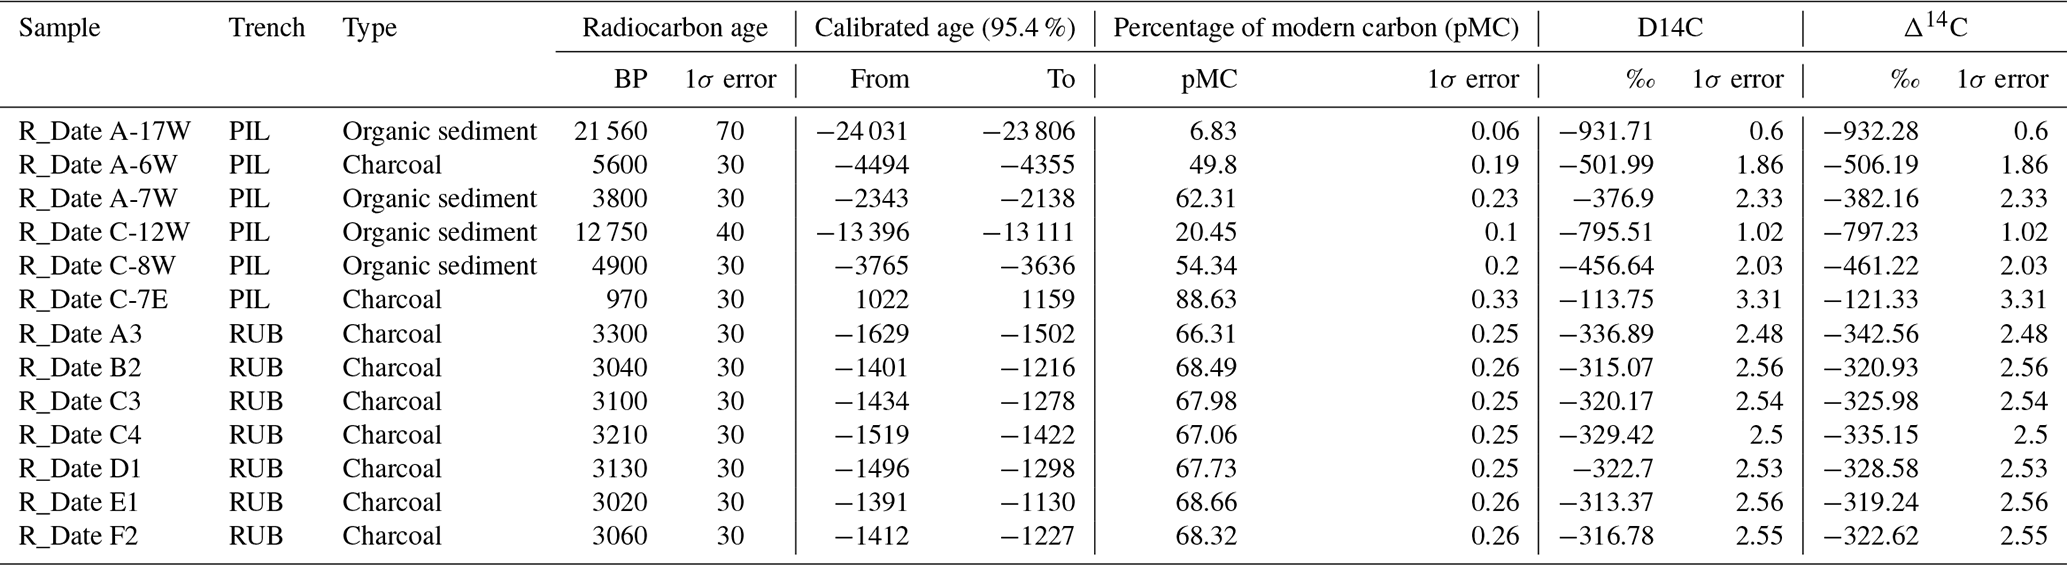
In this section, we present the main results of the palaeoseismological analysis carried out at two trench sites of the Galera Fault (Fig. 2). This analysis includes a tectonic geomorphological study, a description of the stratigraphy and structure of the trenches, and a surface rupture history deduced for each site. Details of the radiocarbon samples dated for this analysis are included in Appendix A (Table A1).
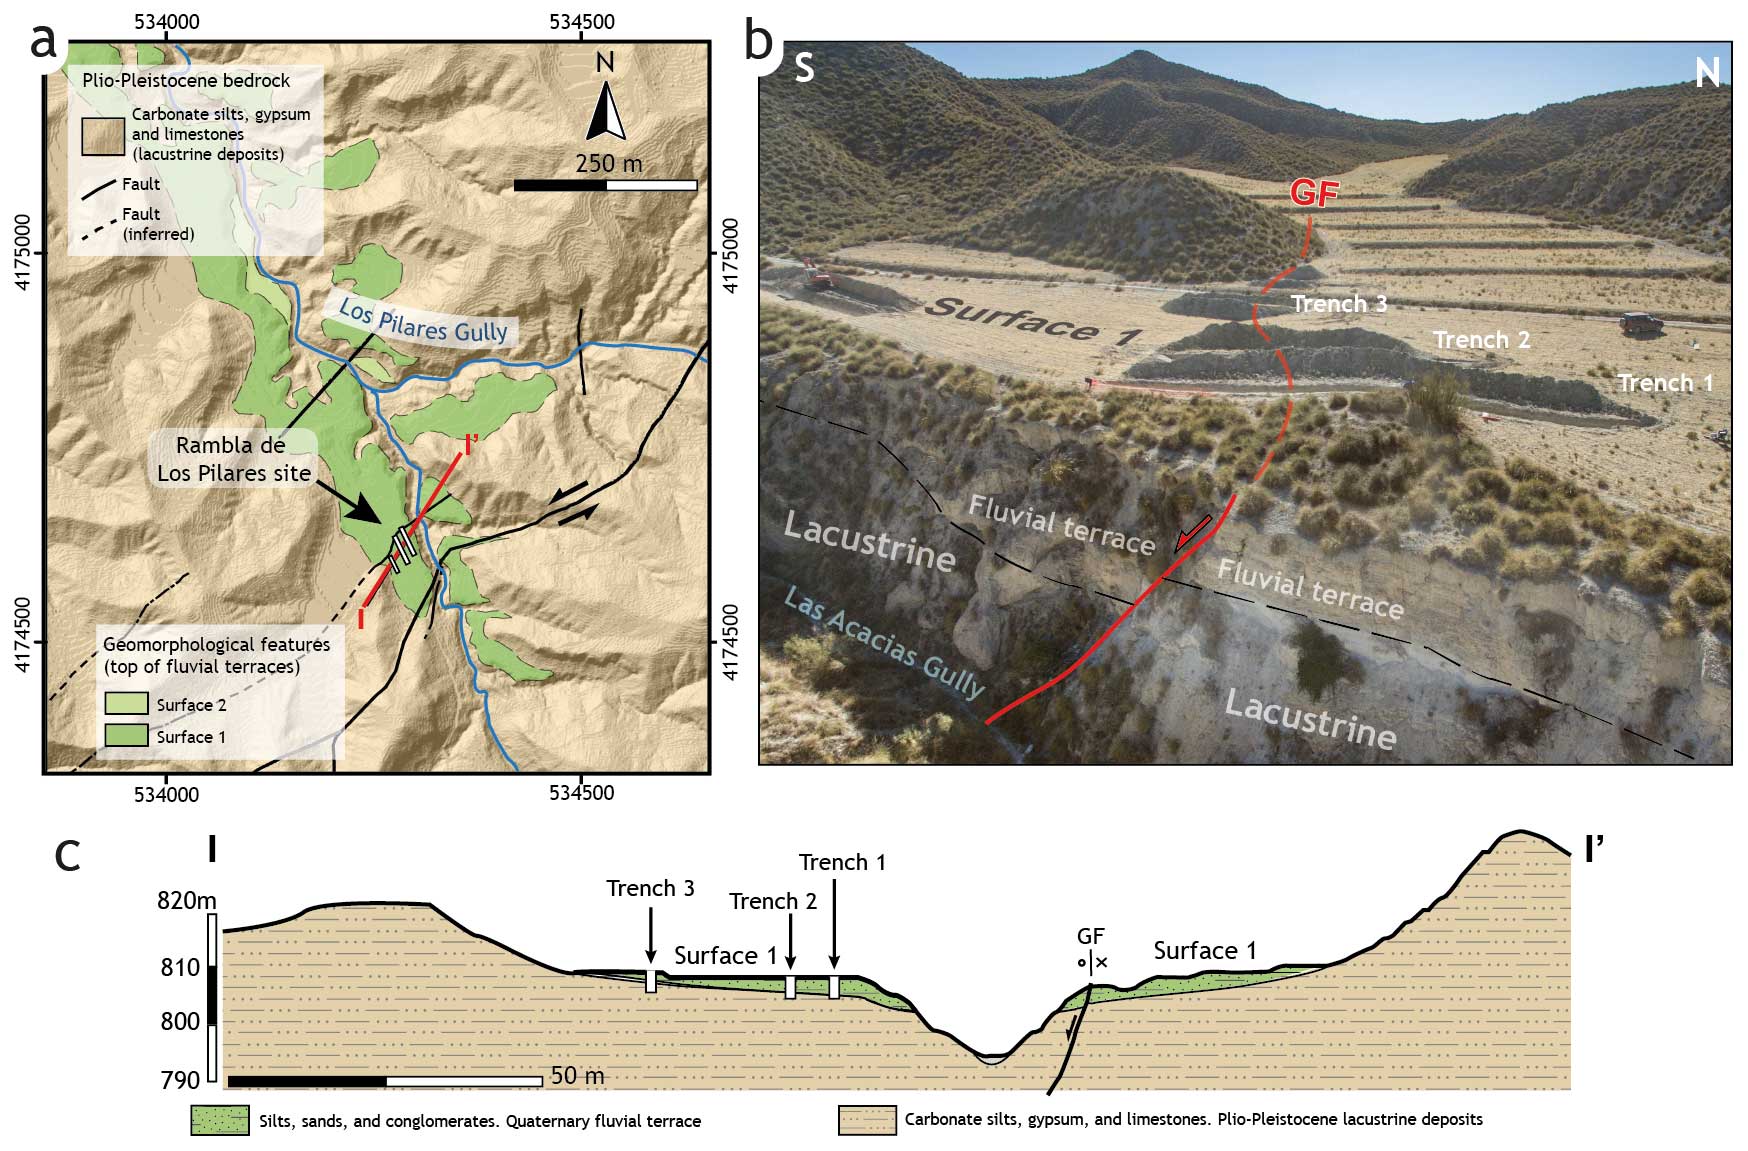
Figure 3(a) Geological and geomorphological map of the Rambla de los Pilares site. (b) Oblique view of the trench site showing a subtle geomorphic imprint of the GF. (c) Geological cross-section of the trench site.
3.1 Rambla de los Pilares site
The Rambla de los Pilares site (PIL site; Universal Transverse Mercator (UTM): 30S 534278 m E 4174615 m N; Fig. 2) is located to the east of the town of Castilléjar. In this area, the Galera Fault zone reaches 350 m in width and is formed by several N30° E–N45° E-striking fault strands. The palaeoseismological analysis at the PIL site focuses on a N40° E, south-dipping secondary strand that offsets recent fluvial deposits. In the trench area, a main gully cuts down into lower Pleistocene (ca. 2.5 Ma) sediments (Fig. 3) and flows from SSE–NNW, roughly perpendicular to the GF. The main geomorphological features of the study area are flat landforms that appear on both sides of the gully. These landforms correspond to a geomorphic surface dissected by the gully, which gently dips towards the north (downstream) and is located approximately 15–20 m above the present thalweg. This surface forms the top of a Holocene depositional fluvial terrace. These terrace deposits unconformably overlie the Pleistocene sediments because, since the middle Pleistocene, the Guadix–Baza Basin has been dominated by erosion, and sedimentation is restricted to the present drainage network, which presents variable thickness as it is accommodated by the morphology of the valley, reaching a maximum thickness of around 5 m. The fault strand at the PIL site presents a subtle geomorphic expression, although it juxtaposes the fluvial-terrace deposits against the Pleistocene deposits. The PIL site consists of three parallel trenches (trenches 1, 2, and 3) that were excavated on the western side of the gully, on the fluvial-terrace surface, and across the secondary fault strand (Fig. 3). High-resolution orthophotomosaics of the PIL trenches are included in Figs. S1–S4 in the Supplement.
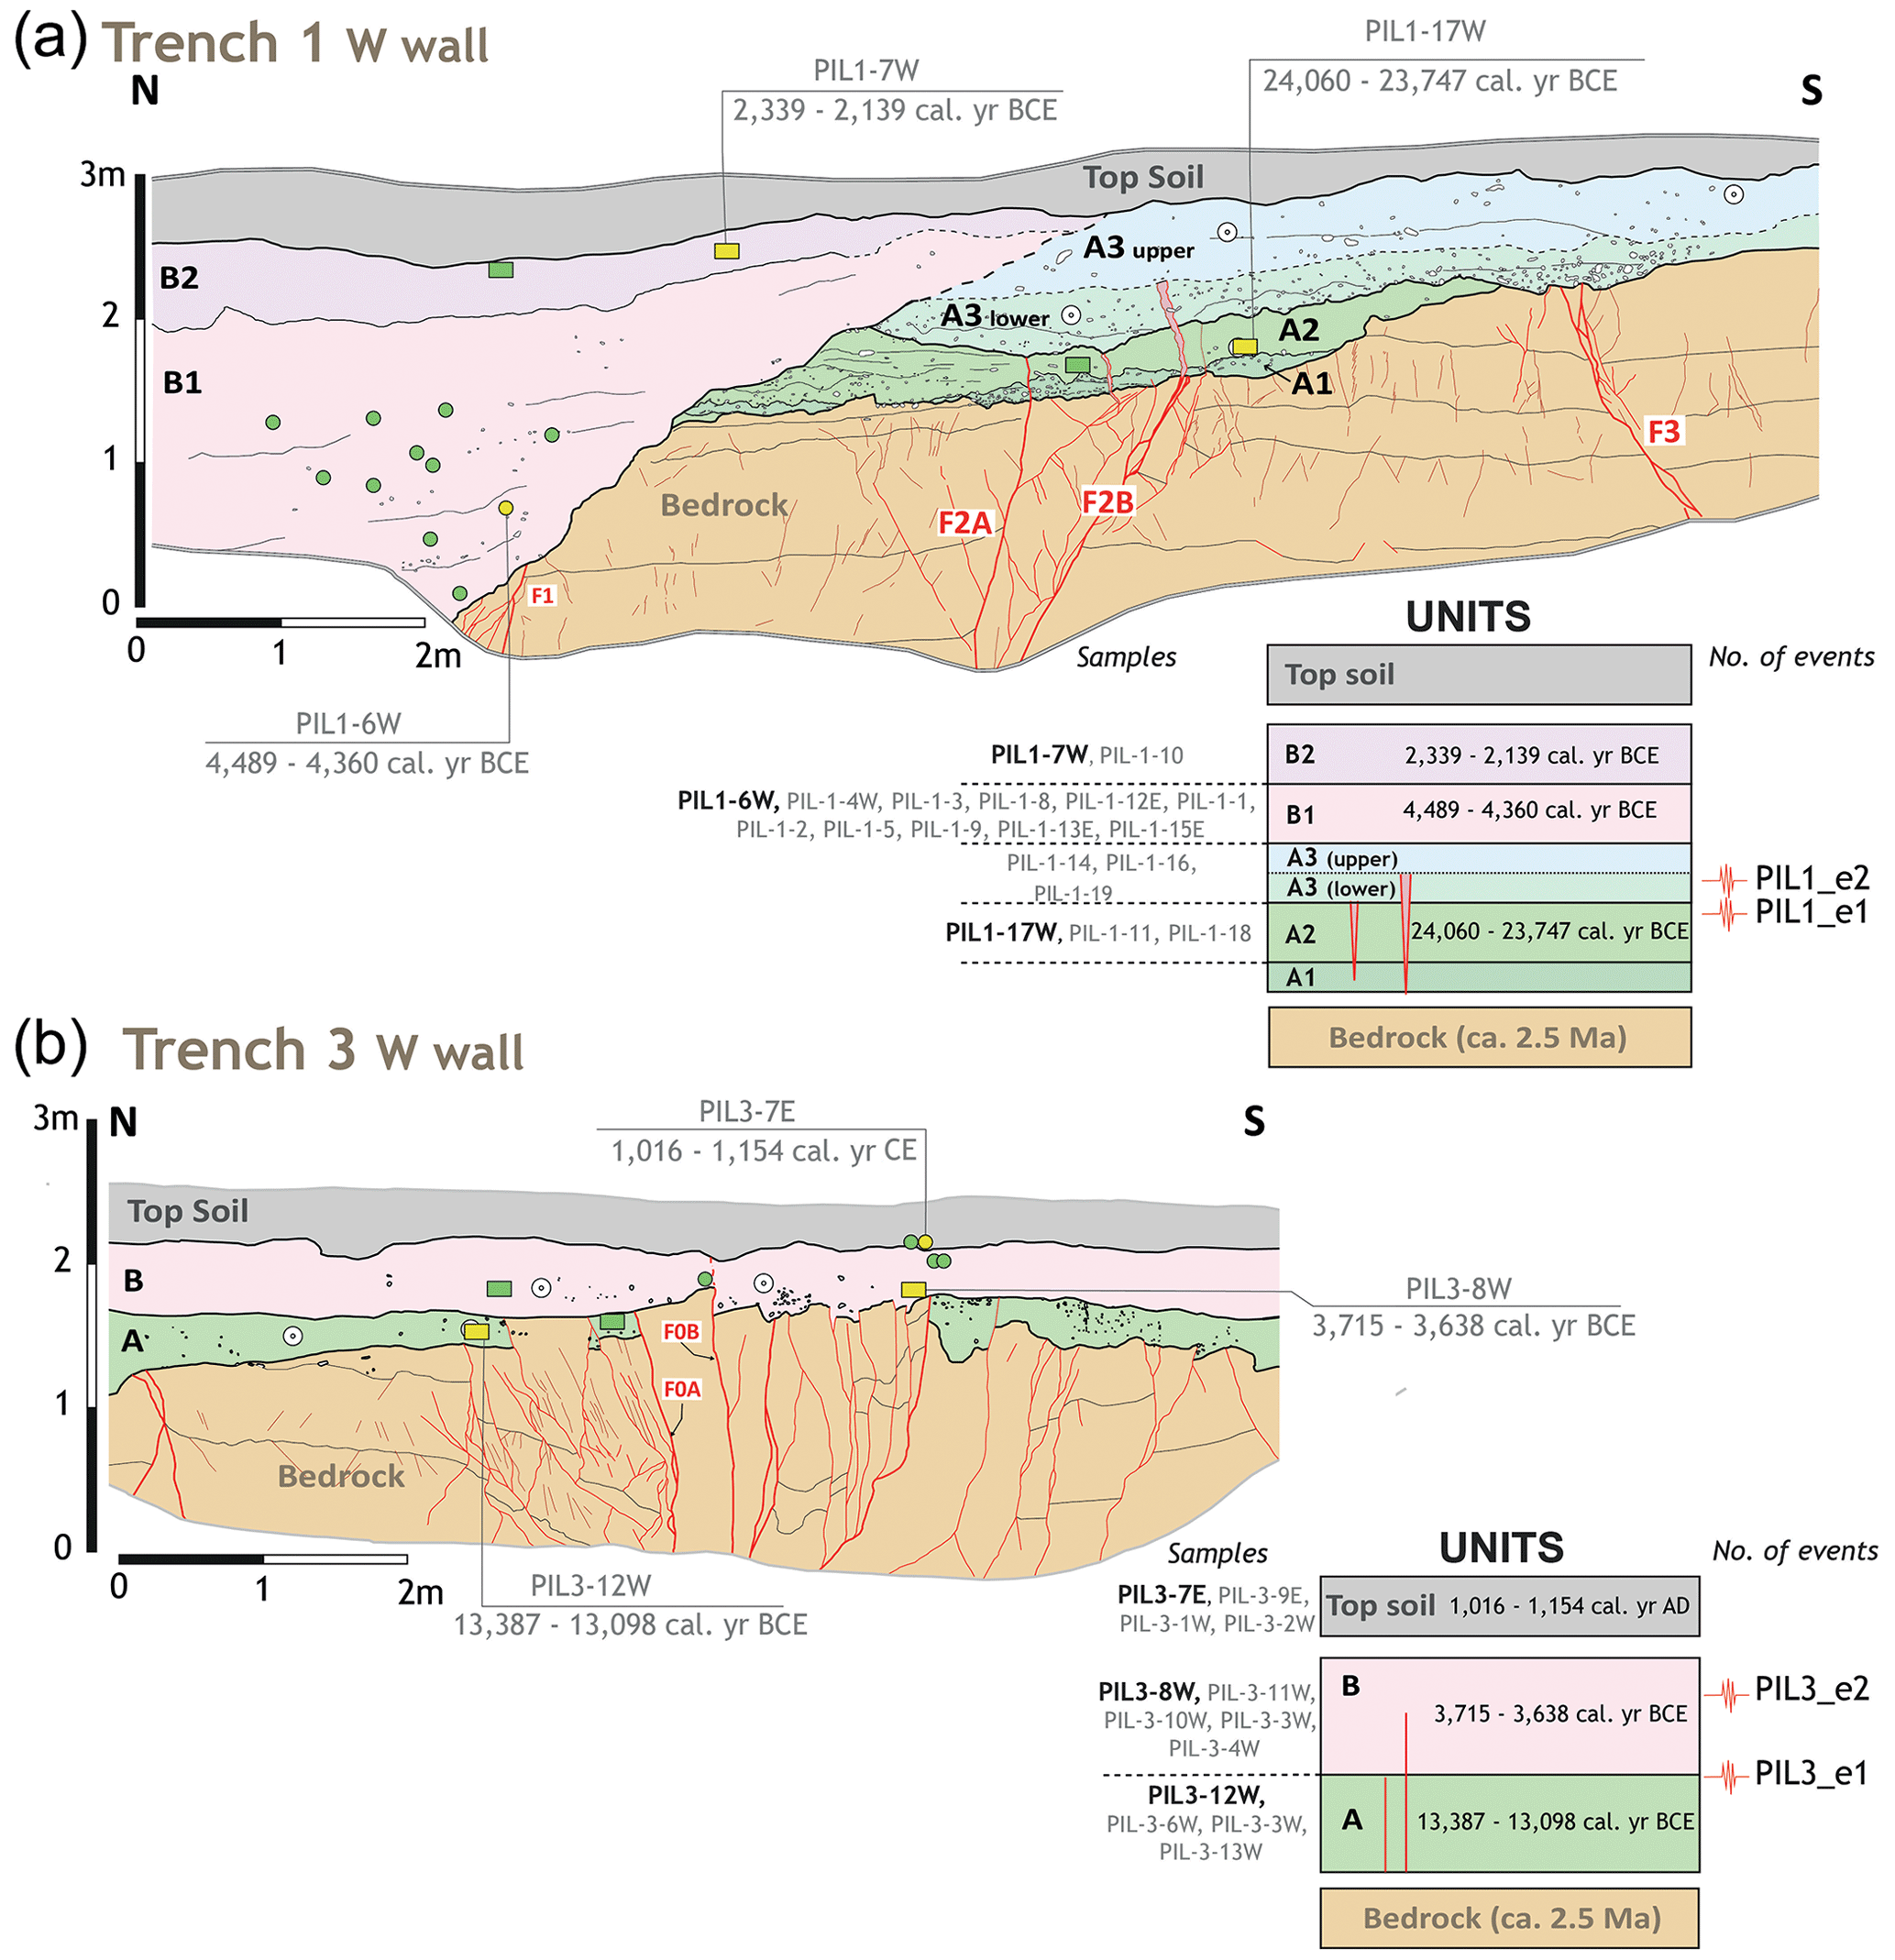
Figure 4Trench logs and their interpretation in terms of palaeoseismic stratigraphic units and events at the PIL site. Circles represent charcoal samples (yellow: dated; green non-dated). Rectangles represent bulk radiocarbon samples (yellow: dated; green: non-dated). White circles with grey dots represent optically stimulated luminescence (OSL) samples. F0A and F0B are the two main strands that offset the fluvial-terrace units.
3.1.1 Trench stratigraphy
A common stratigraphy is observed in the three excavated trenches (Fig. 4). We group stratigraphic units at the PIL site into bedrock units, fluvial-terrace deposits, and modern topsoil.
The bedrock units that we observe in the trench are lower Pleistocene lacustrine deposits. These consist of well-bedded sediments, including silts, clays, limestones, and gypsum veins (Fig. 4).
Fluvial-terrace deposits appear unconformably over the bedrock units (Fig. 4). These deposits are divided in two units: a lower unit (A) and an upper unit (B). In trench 1, three subunits are distinguished within unit A: A1, A2, and A3. Subunit A1 overlays the bedrock and is formed by small channel-shaped bodies with erosive basal contacts. They consist of massive, greyish, matrix-supported microconglomerates with irregular gypsum and carbonate clasts and a sandy matrix. Subunit A2 unconformably overlays subunit A1 and the Pleistocene bedrock. It consists of greenish, cemented fine-grained sands to sandy silts. Subunit A3 overlays subunit A2 and the bedrock and is made up of massive, greyish, gypsum-cemented breccia that is poorly sorted as well as irregular, centimetre-sized gypsum and carbonate clasts and a sandy matrix. In trench 2, unit A is represented only by subunit A3, while in trench 3, unit A is represented only by subunit A2. Unit B unconformably overlies both unit A and the bedrock units (Fig. 4). In trenches 1 and 2, unit B is a wedge-shaped deposit that is approximately 2.5 m and overlaps both the bedrock and unit A. We distinguish two subunits within unit B: B1 and B2. Both subunits are formed by massive brownish silts. Subunit B1 is characterized by a dark-brown colour and includes a level consisting of small channel-shaped bodies of microconglomerates and some layers consisting of carbonate pebbles. Moreover, at the bottom of subunit B1, a laterally continuous level rich in charcoal crops out. We interpret this level as a burn horizon. Subunit B2 overlies subunit B1 and is characterized by a light-brownish colour and an erosive base. In trench 3, unit B is represented only by a decimetre-thick bed of subunit B1.
Finally, overlying all the previously described units, a poorly sorted, loose sandy unit is identified, with an erosive base that includes plant roots (Fig. 4). We interpret this unit as a modern topsoil.
3.1.2 Trench structure and surface ruptures
Several fault strands are observed in the walls of the excavated trenches (Fig. 4). Maximum vertical separation of these fault strands is only a few centimetres. Moreover, this vertical separation varies as some strands lower the southern side, while others lower the northern side. We postulate that this is related to the major horizontal component of the Galera Fault and to irregularities in the base of the offset units. These fault strands offset bedrock beds and can be followed across terrace units as they produce a fabric that is subparallel to fault strands in the conglomerates, which we interpret as the result of coseismic shearing. Moreover, differential cementation that is responsible for higher resistance to erosion is also observed. We use cross-cutting relationships as the main evidence to identify palaeoseismic events at the PIL site. Only trenches PIL1 and PIL2 yield significant palaeoseismic results.
We identify three main faults (F1, F2, and F3) in trench PIL1 as these faults offset bedrock units (Fig. 4). F2 presents the largest offset of bedrock units and is the only fault cross-cutting the terrace units. In this trench, we recognize two palaeoseismic events. A first event (PIL1_e1) is evidenced by fault strand F2A, which cross-cuts subunit A2 and is capped by the bottom of subunit A3. A second (younger) event (PIL1_e2) is deduced because fault strand F2B intersects the lower part of subunit A3 and is capped by the upper part of this same unit.
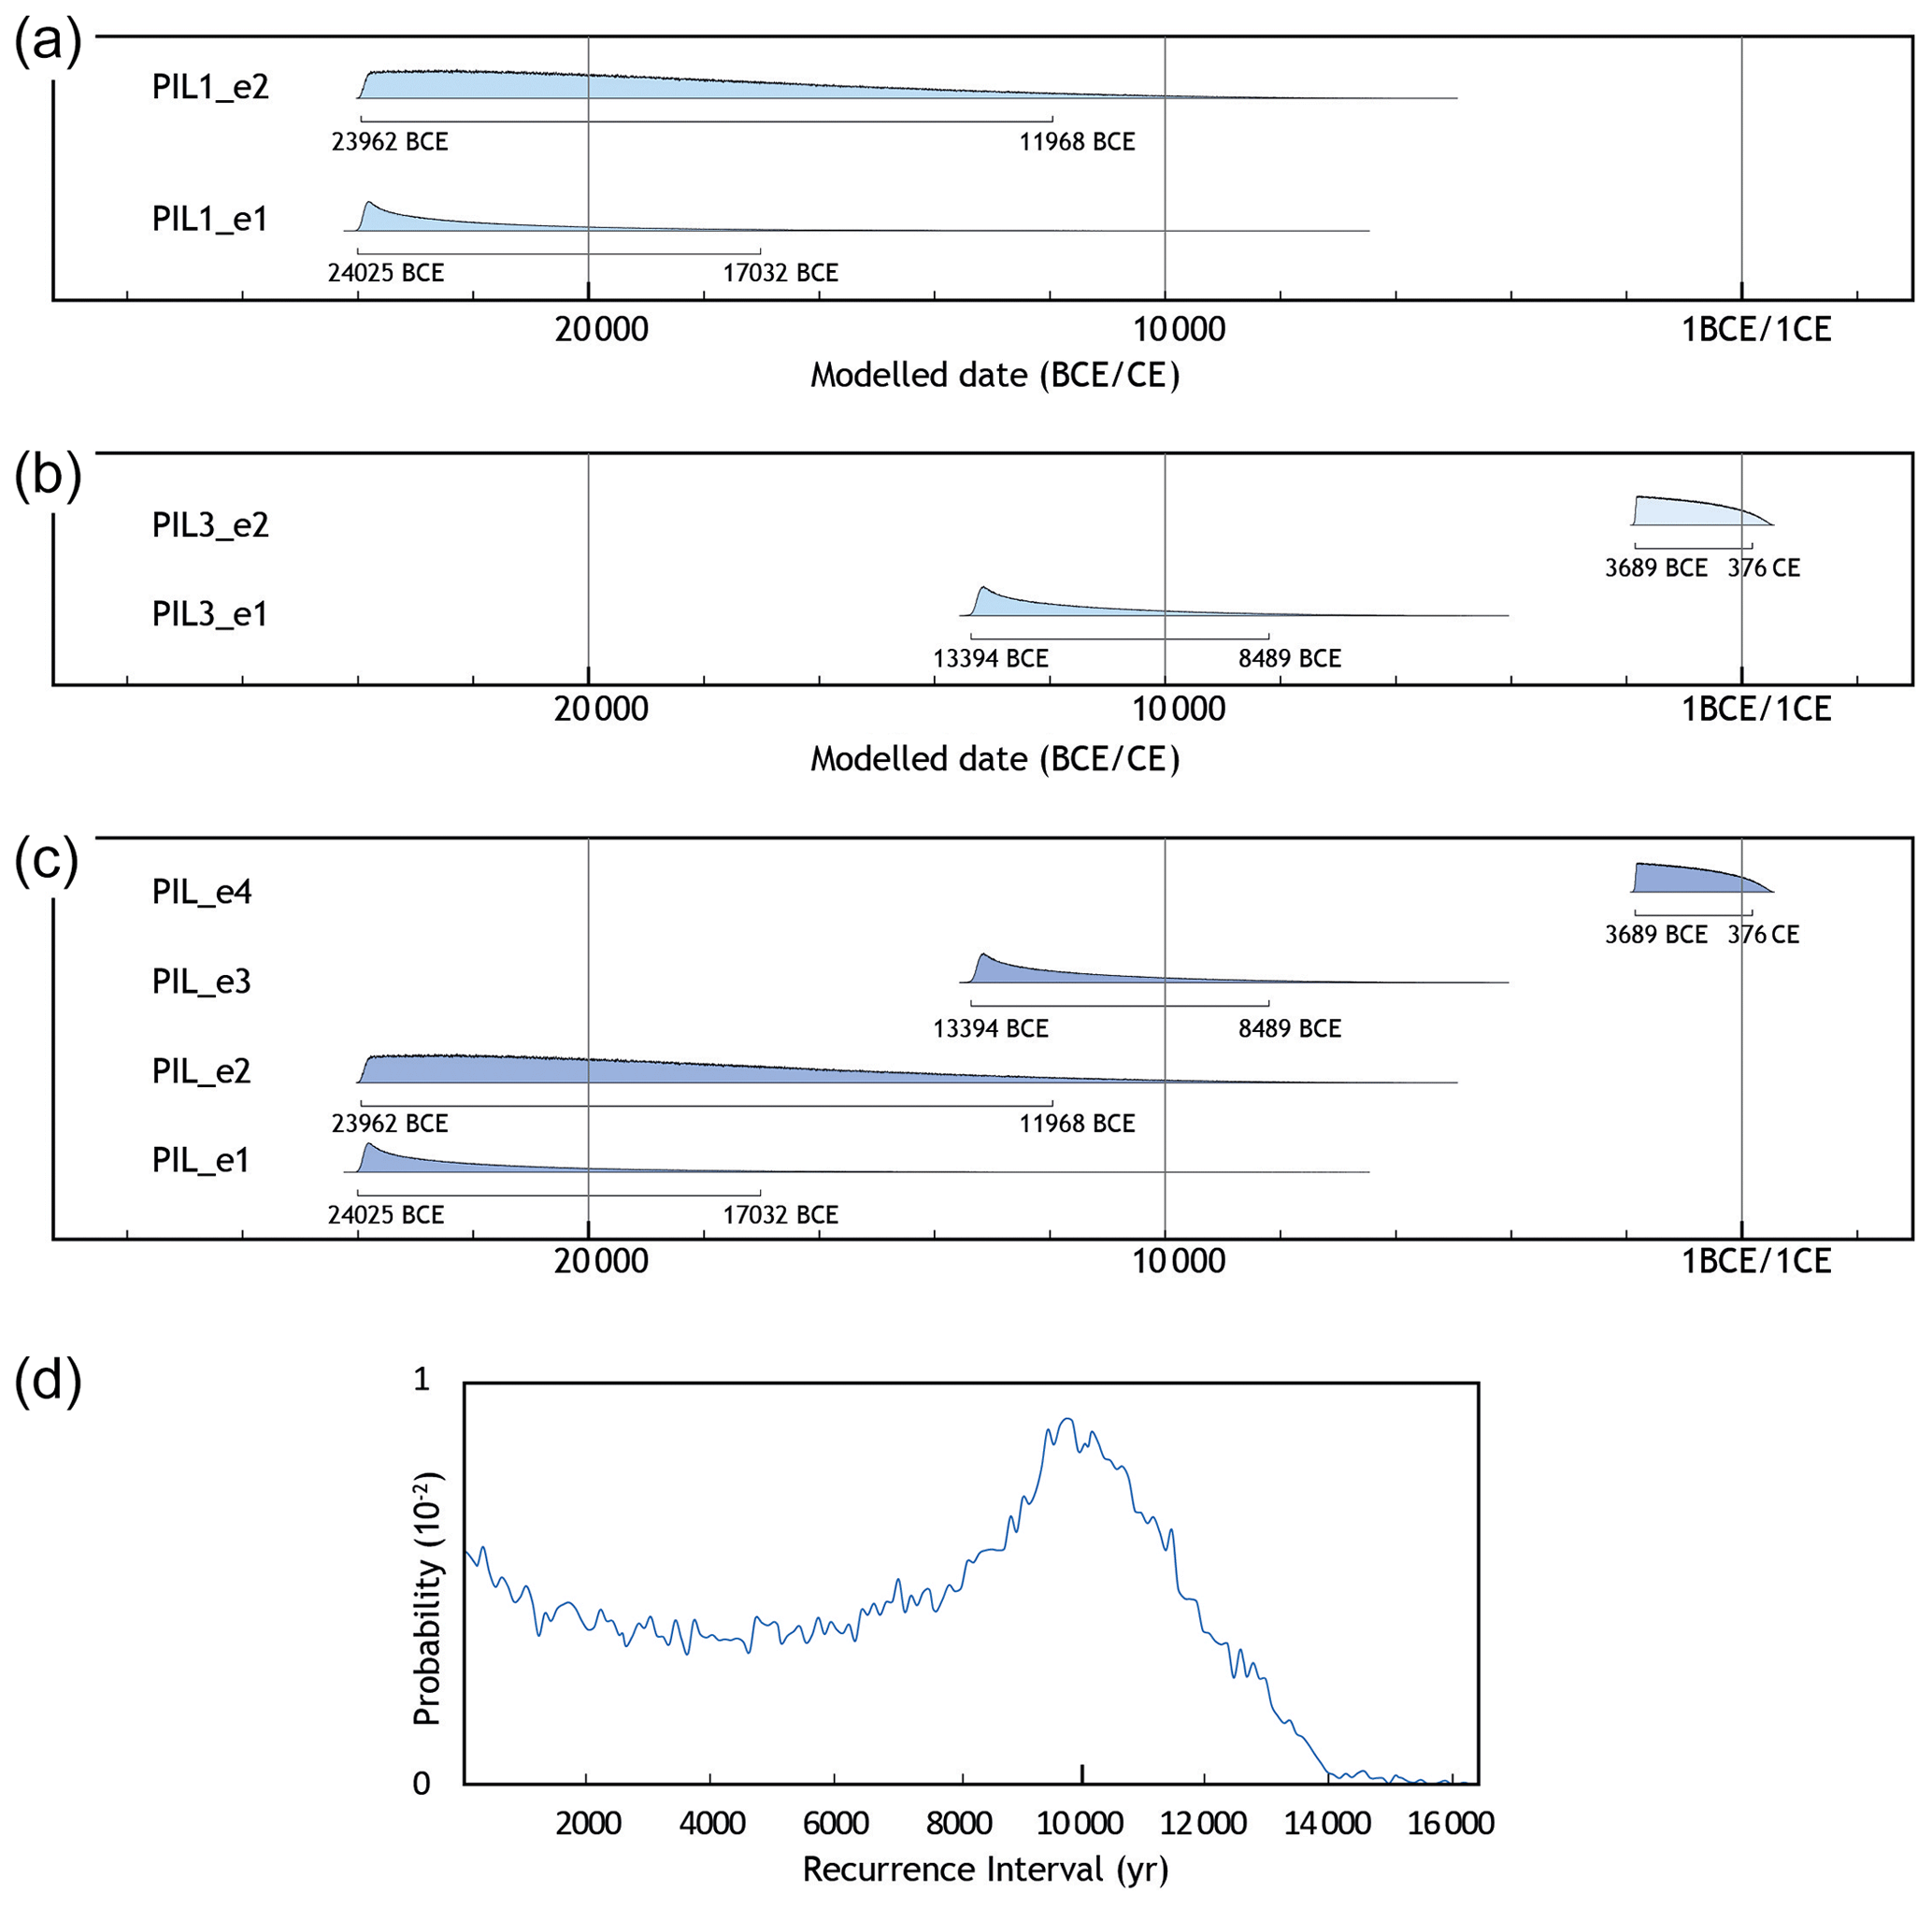
Figure 5Trench logs and their interpretation in terms of palaeoseismic stratigraphic units and events at the PIL site. Circles represent charcoal samples (yellow: dated; green: non-dated). Rectangles represent bulk radiocarbon samples (yellow: dated; green: non-dated). White circles with grey dots represent OSL samples.
We built a chronological model using the version 4.4.4 of the OxCal program (Bronk Ramsey, 2008; Bronk Ramsey, 2009; Reimer et al., 2020), which included all dated samples to better constrain the ages of the two events recognized in trench PIL1. In this model (see S5 in the Supplement), both events were modelled as a “Date”. Both events have a maximum age limited by the bulk radiocarbon sample PIL1-17W (24 031–23 804 BCE), collected from the older terrace (subunit A2). The minimum age of both events is constrained by the detrital charcoal sample PIL1-6W (4494–4355 BCE). As the latter was collected in subunit B1, which belongs to the younger terrace, we added a “Zero Boundary” to the OxCal model, accounting for the time elapsed between the deposition of units A and B. After running the model (Fig. 5), we obtained an age of 24 025–17 032 BCE for PIL1_e1 and an age of 23 962–11 968 BCE for PIL1_e2.
In trench PIL3, the fault zone consists of a central fault core that is approximately 0.5 m thick and bounded by two main strands (F0A and F0B) that offset the fluvial-terrace units. From this fault core, a large number of secondary fault strands branch out, some of which offset the lowermost unit of the terrace. We identified two events in trench PIL3 (Fig. 4). The first event (PIL3_e1) is evidenced by several fault strands (including F0A) cross-cutting unit A and being capped by unit B. A second (younger) event (PIL3_e2) is deduced because fault strand F0B offsets the base of unit B and is capped by the bottom of the topsoil.
We also constructed an OxCal model for this trench (see S6 in the Supplement). The bulk radiocarbon sample PIL3-12W represents a lower constraint for PIL3_e1 (modelled as a Date). This sample was collected in unit A. The upper constraint for this event is given by sample PIL3-8W. As the latter was collected from the younger terrace, we once again added a Zero Boundary to the OxCal model. PIL3_e2 (modelled as a Date) is constrained between samples PIL3-8W (lower constraint: unit B) and PIL3-7E (upper constraint: topsoil). The upper constraint is located in the topsoil unit; therefore, we also added a Zero Boundary to the OxCal model in this position. The OxCal model yielded an age of 13 394–8489 BCE for PIL3_e1 and an age of 3689 BCE–376 CE for PIL3_e2 (Fig. 5).
Therefore, in trenches PIL1 and PIL 3, we found four events. Despite being separated by only a few metres, we found two earthquakes in each trench but no common events in both trenches. This is because in trench 1, the fault zone offsets the lower terrace, while in trench 3, the fault zone mainly offsets the upper terrace. A visual analysis of the probability density functions (PDFs) of event ages obtained from running the OxCal models shows that PIL3_e1 partially overlaps with PIL1_e1 and PIL1_e2. Therefore, these three events could hypothetically be considered as only two events. We quantified the degree of overlap of these PDFs using the methodology proposed by DuRoss et al. (DuRoss et al., 2011). We obtained a very low degree of overlap (0.006 for the pair of PIL3_e1+PIL1_e1 and 0.08 for the pair of PIL3_e1+PIL1_e1), which means we consider these three events as independent surface ruptures. Therefore, we built a composite surface rupture history for the PIL site involving four events – two registered in trench PIL1 and two in trench PIL3 (Fig. 5c).
3.1.3 Palaeoseismic parameters: single-event displacement, fault slip rate, and recurrence intervals
As previously mentioned, fault strands in the PIL1 trench produce differential cementation and a fabric subparallel to the fault in recent deposits. This means no offset of these recent deposits is observed in this trench. Therefore, we cannot compute single-event displacement or slip rate. In the PIL3 trench, the bottom of unit A is vertically offset by 0.13 ± 0.05 m in the southern part of the trench (Fig. 4), which is one of the pieces of evidence for PIL3_e1. This offset is capped by unit B, indicating that this fracture was not displaced during the following event (PIL3_e2). Thus, the abovementioned offset of 0.13 ± 0.05 m accumulated in one event (PIL3_e1) and represents the vertical single-event displacement. As the fault strand was not reactivated in the successive event (PIL3_e2), we cannot compute the slip rate from this fracture.
Additionally, the bottom of unit B is vertically offset by 0.16 ± 0.05 m by fault strand F0B (Fig. 4). We identified one event offsetting this marker (PIL3_e2); consequently, we assumed 0.16 ± 0.05 m as the vertical single-event displacement. Furthermore, considering the age obtained for this event after our modelling (3689 BCE–376 CE for PIL3_e2), we obtained a vertical slip rate of 0.02–0.13 mm yr−1. As this slip rate is computed using one single event, it represents a maximum value as there is no evidence that even a complete seismic cycle has elapsed. However, these slip rate values are in good agreement with previously reported geological vertical slip rates of the Galera Fault (0.1–0.2 mm yr−1; García-Tortosa et al., 2008, 2011; Sanz de Galdeano et al., 2012). As our trenches are orthogonal to the fault strand and the main component of the Galera Fault is horizontal, we cannot directly calculate the fault slip rate. However, we get an approximation of the total slip rate using the vertical slip rate and the available kinematic indicators. Field data show that this strand is an oblique fault as slickenlines measured in several parallel fault strands present an average orientation of 24/235 (Medina-Cascales et al., 2021). Considering these oblique kinematic indicators and the parameters discussed above, we obtained a single-event displacement of 0.4 ± 0.1 m and a slip rate of 0.05–0.33 mm yr−1. These values agree with geodetic slip rates calculated for the Galera Fault (strike-slip rate of 0.5 ± 0.3 mm yr−1; Alfaro et al., 2021)
We calculated the recurrence interval for the composite surface rupture history at the PIL site. This composite history involves four events (PIL_e1 to PIL_e4). To compute the recurrence interval, we carried out a Monte Carlo analysis using the PDFs of the four events. We ran 10 000 simulations for each pair of events (PIL_e1–PIL_e2, PIL_e2–PIL_e3, and PIL_e3–PIL_e4). Each simulation calculated the difference between two random dates (one from each event involved in the simulation). In this way, we obtained 30 000 values (10 000 values for each pair of successive events) representing random elapsed times between events. Our Monte Carlo analysis yielded a recurrence interval of 0–12 340 years at a 95 % confidence interval (mode of 10 340 years; Fig. 5).
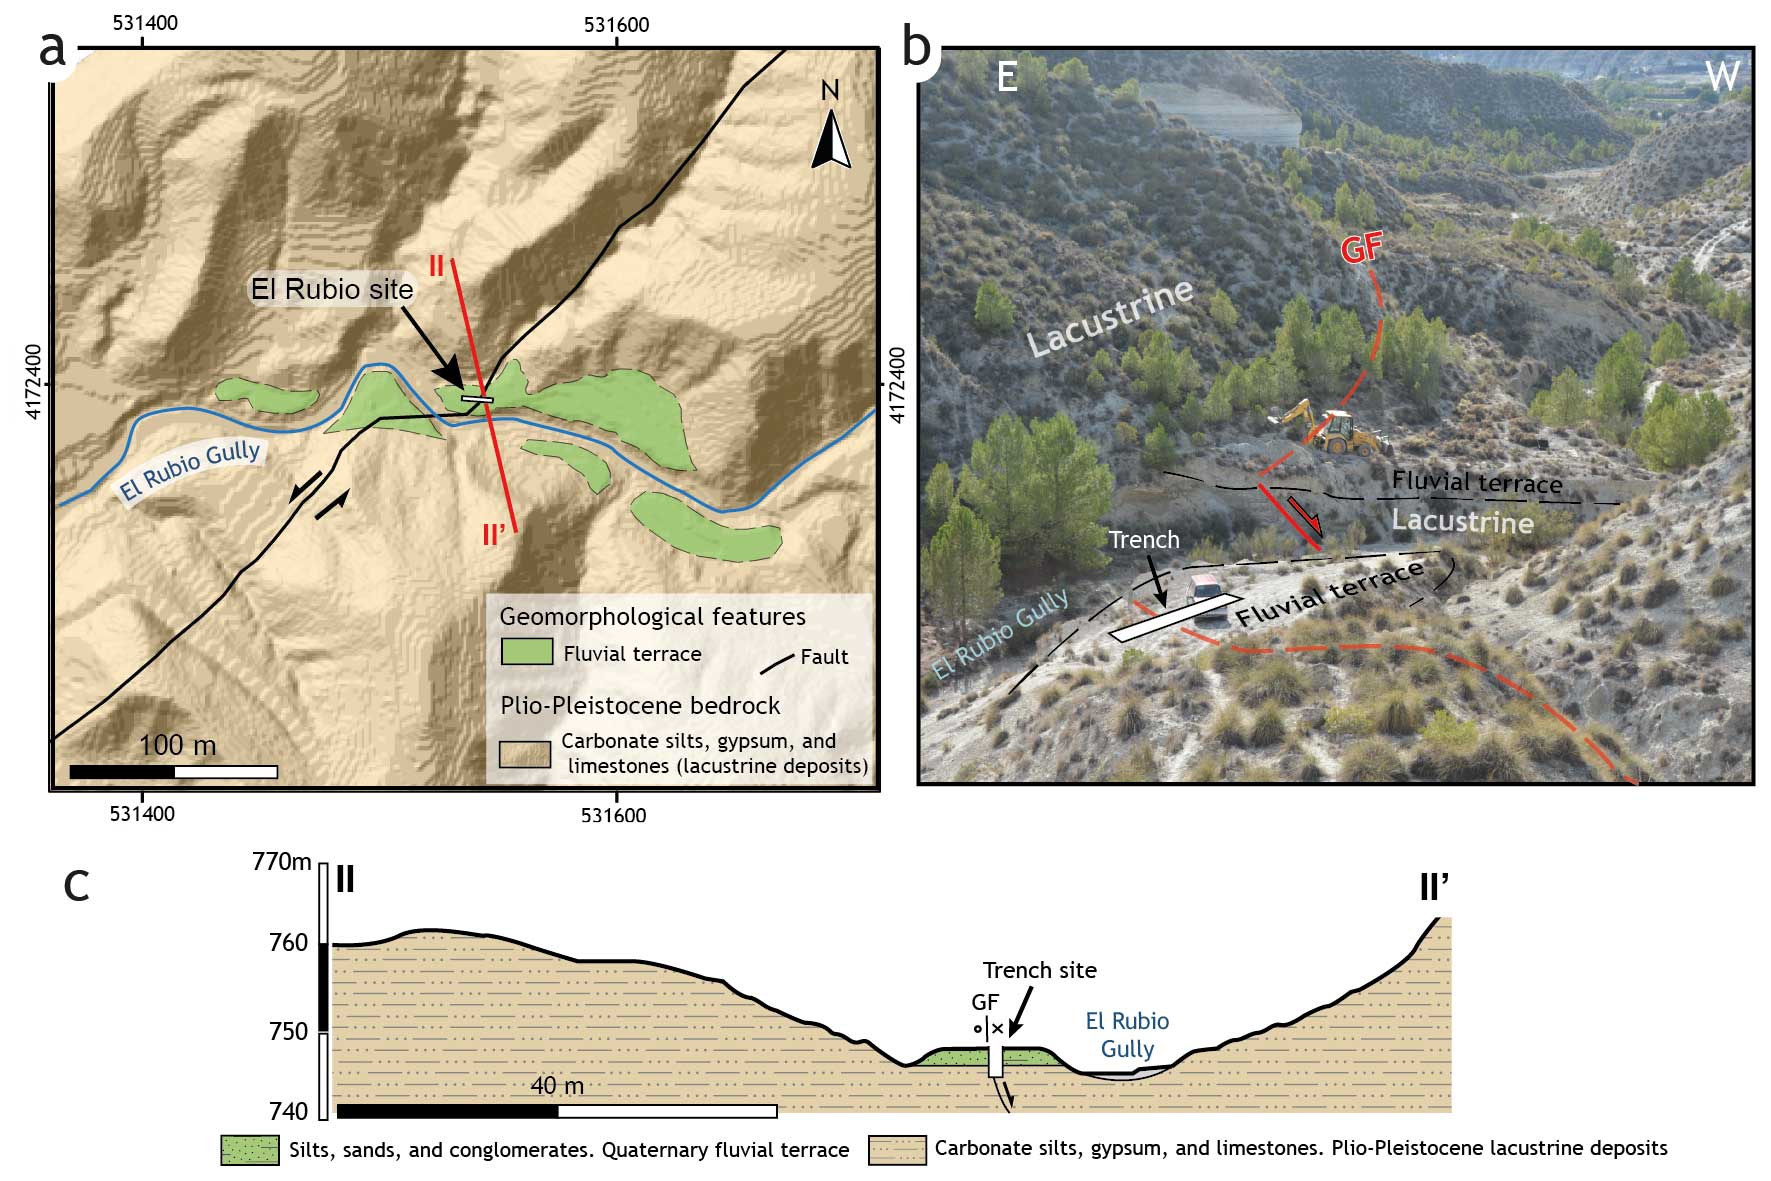
Figure 6(a) Geological and geomorphological map of the El Rubio site. (b) Oblique view of the trench site showing the GF cross-cutting the fluvial terrace. (c) Geological cross-section of the trench site.
3.2 Barranco del Rubio site
The Barranco del Rubio site (RUB site; UTM: 30S 534278 m E 4174615 m N; Fig. 2) is located south of the village of Castilléjar. In this sector, the GF consists of a 270 m wide band bounded by two N45° E-striking, steeply north-dipping fault strands: a main southern strand that juxtaposes lower Pleistocene deposits from 2.5 Ma against those from ca. 2 Ma and a northern strand with a lower vertical displacement that offsets rocks that are very similar in age (ca. 2 Ma). The RUB site is in the northern strand and is located in a gully that flows ESE–WNW, orthogonal to the fault (Fig. 6). Here, a flat, gently north-dipping landform appears on both sides of the gully. This flat landform is at the top of a Holocene depositional fluvial terrace that is approximately 10 m thick and located 5 m above the present thalweg. These deposits are intersected by the northern branch of the GF. Where the fault traverses the fluvial terrace, a subtle topographic scarp is observed. This scarp is highly modified due to agricultural activity (Fig. 6). A 12 m long and 3.5 m deep trench was excavated on the eastern side of the gully, on the fluvial-terrace surface, and orthogonal to the GF strand (Fig. 6). High-resolution orthophotomosaics of the RUB trench are included in the Supplement (Figs. S7 and S8). We describe the southern wall of the trench because sun exposition hindered the analysis of the northern wall.
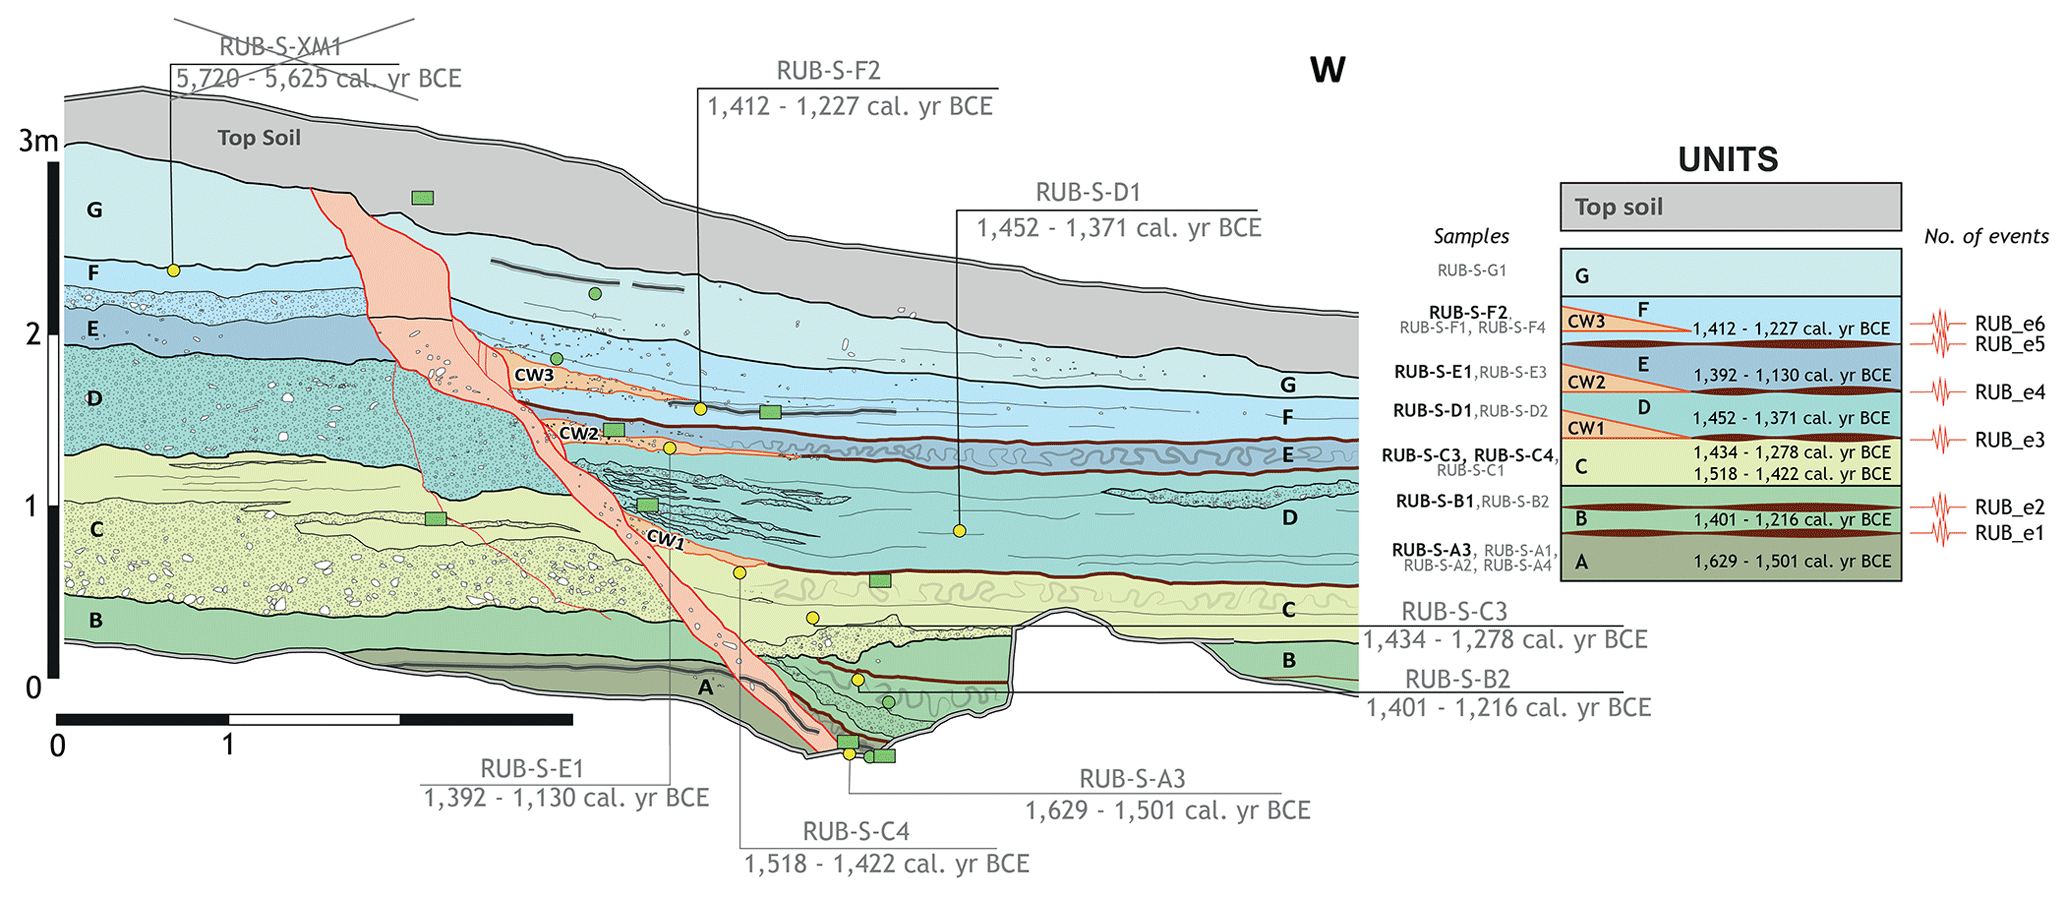
Figure 7Trench logs and their interpretation in terms of palaeoseismic stratigraphic units and events at the RUB site. Circles represent charcoal samples (yellow: dated; green: non-dated). Rectangles indicate bulk radiocarbon samples (yellow: dated; green: non-dated). White circles with grey dots represent OSL samples.
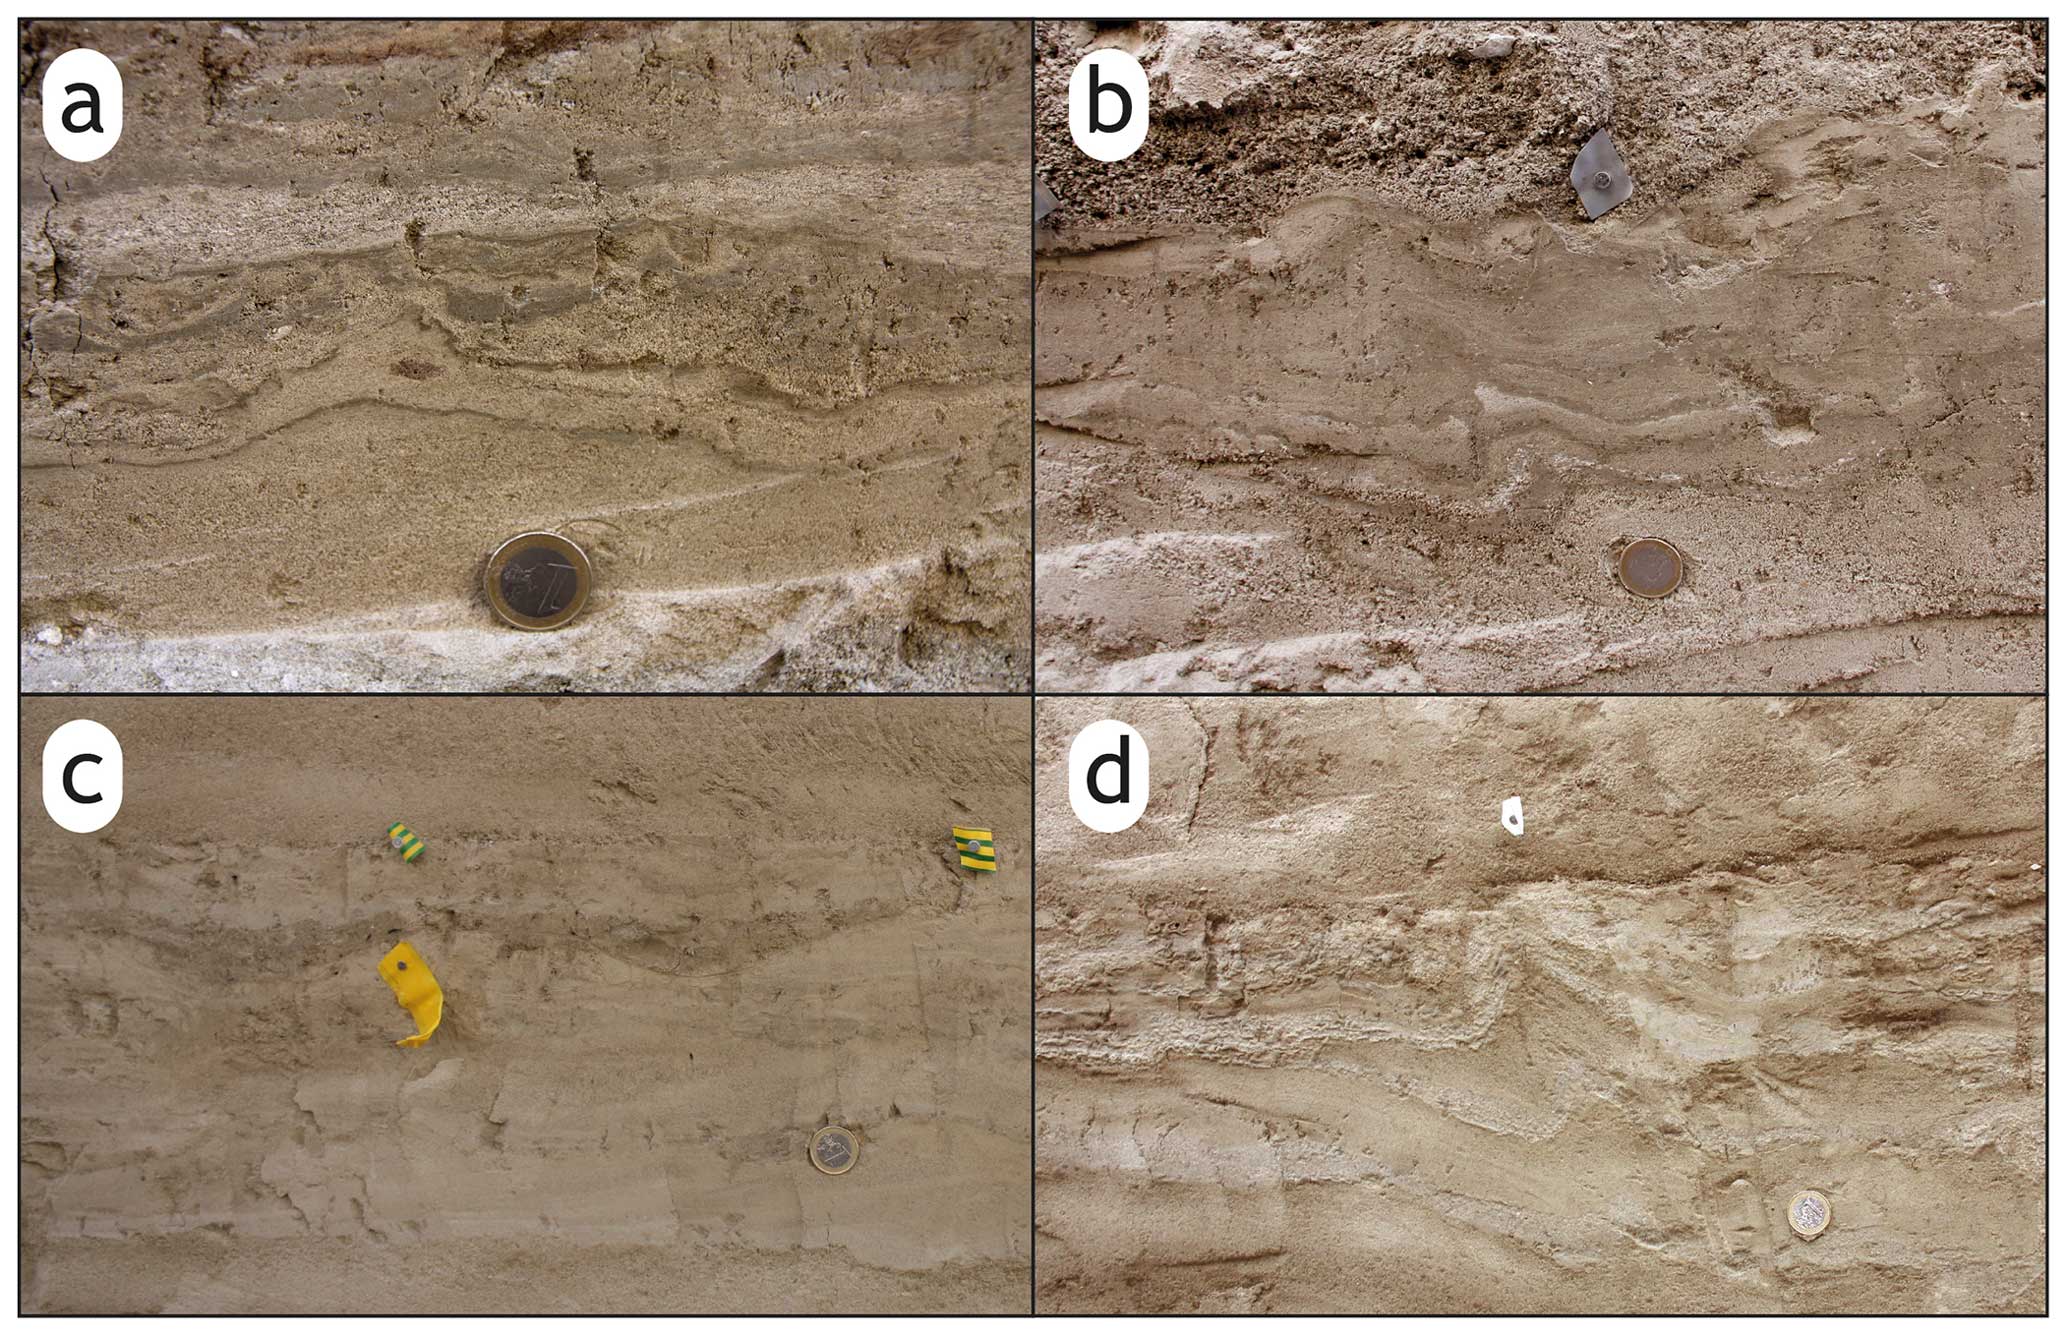
Figure 8Soft-sediment deformation structures interpreted as seismites in the RUB trench. These structures are mainly sagging load structures (a: unit A; c: unit C), contorted lamination (b: unit B; d: unit D), and fluid-escape structures (a: unit A).
3.2.1 Trench stratigraphy
The RUB trench exposes fluvial-terrace deposits that are 3.5 m thick (Fig. 7). This terrace is divided in two by a single fault zone that is 0.2–0.5 m thick. These deposits consist of silt and fine-sand beds with intercalated levels of fine conglomerates. We differentiated eight stratigraphic units as well as a topsoil level. Unit A, which is 0.25 m thick, consists of centimetric levels of fine sand with intercalations of silts. A black-silt level with a thickness of 1.5 cm appears near the base of this unit. Laterally to the west, the uppermost 0.1 m of unit A is organized in layers that are 1–2 cm thick, comprising interbedded fine sands and silts with millimetric lamination. This top level within unit A presents a flat bottom and top, but internal layering presents soft-sediment deformation structures (Fig. 8). These structures are mainly sagging load structures, contorted lamination, and fluid-escape structures. These soft-sediment deformation structures have been produced by liquefaction and fluidization of the sediment (Owen, 1987). Several processes can trigger sediment deformation, such as overloading or sudden changes in the groundwater level (Owen, 1987). In this case, we discard overloading since the fine sediments studied are not related to rapid sedimentation. In addition, soft-sediment deformation structures related to groundwater are morphologically different to those present in the RUB trench. Analogous soft-sediment deformation structures have been described in recent earthquakes (e.g. Tuttle et al., 2019) and in analogue models with digital shaking tables (Moretti et al., 1999), and they have been widely interpreted as seismites in the geological record and also in the Guadix–Baza Basin (Alfaro et al., 1997; Alfaro et al., 2010). Therefore, we interpret the soft-sediment deformation structures present in the RUB trench as result of earthquakes. The general threshold magnitude for sediment liquefaction corresponds to an Mw value of 5.0, although earthquakes with an Mw value of 4.5 can trigger liquefaction in extremely susceptible soil deposits. Unit B, which is 1 m thick, includes levels of fine light-brown deposits that are several centimetres thick and a bed of matrix-supported conglomerates. One of the layers within unit B presents soft-sediment deformation structures that we also interpret as seismites (Fig. 8). In the downthrown side, unit B varies in thickness along the section as it thins above structurally high parts and thickens in depressed areas. Moreover, dips decrease up-stratigraphy and increase up-dip. Furthermore, levels within unit B present an onlapping geometry. Considering these features, we interpret the geometry of unit B as a growth fold. Unit C, which is 0.75 cm thick, unconformably overlies unit B. Unit C consists of light-grey interbedded sands and silts with levels of matrix-supported conglomerates. Conglomerate clasts are rounded and centimetric in size. Clasts consist of carbonates and gypsum, probably derived from the Pleistocene basement. In the downthrown side, a level with a thickness of 0.15 cm and soft-sediment deformation structures occurs at the top of unit C (Fig. 8). Once again, we interpret these structures as seismites. Unit CW1 is formed by poorly sorted clast-supported gravels. Clasts are angular fragments of cemented grey silts and sands, as well as rounded carbonates, likely derived from lower units. This unit is thicker at the fault and thins away from the fault – that is, unit CW1 presents a wedge shape. Accordingly, we propose that unit CW1 is a scarp-derived colluvial wedge. No palaeosoil developed over unit CW1, probably due to a high sedimentation rate. Unit D, which is 0.7 m thick, conformably overlies units C and CW1. In the downthrown side, Unit D is formed by light-brown interbedded sands and silts with intercalated matrix-supported conglomerates. Conglomerates are well cemented, and their clasts are rounded and centimetric in size. Clast lithologies include carbonates and gypsum. The conglomerate levels exhibit lens shapes if they are not truncated by the fault. In the upthrown side, unit D consists of slightly cemented conglomerates with centimetric clasts. These clasts are rounded carbonate clasts and angular gypsum clasts. Unit CW2 presents the same features as unit CW1; therefore, we interpret unit CW2 as a second colluvial wedge. Unit E, which is 0.2 m thick, conformably overlies units D and CW2. Unit E consists of light-grey interbedded fine sands and silts. The presence of soft-sediment deformation structures in the downthrown side permits us to interpret this level as a seismite. Unit F, which is 0.45 m thick, is formed by brownish silts with occasional intercalated levels of very fine sand in the downthrown side. In the upthrown side, unit F also includes brownish matrix-supported conglomerates with dispersed centimetric clasts. The matrix consists of light-yellowish silts and fine sands. Unit CW3 presents the same features as units CW1 and CW2; thus, we also interpret this unit as a colluvial wedge. Unit G, which is 0.43 m thick and appears in the downthrown side, is formed by greenish sandy silts with no internal structure (massive), fine sands, and sporadic carbonate and gypsum clasts that are 1–2 cm in size. The topsoil unit, which is up to 0.9 m thick, is a poorly sorted, loose, and massive deposit containing whitish fine sand and silt. This unit presents abundant plant roots. We interpret this unit as modern topsoil.
Units A, B, and C can be correlated in both the downthrown and upthrown sides because they are observable across the fault zone (Fig. 7). This correlation is not as straightforward for the rest of the units. We suggest that this is because the fault zone developed in an area with changes in lateral facies. For instance, conglomerates pertaining to unit D in the upthrown side laterally transition into conglomerate levels interfingered with silts in the downthrown side (which is made up of silts with interfingered conglomerates). Similarly, the conglomerate level at the base of unit F in the upthrown side likely disappeared laterally around the present fault zone, and it was likely the source of the CW3 colluvial wedge. This would explain why unit F consists of silts in the downthrown side. In any case, these uncertainties do not compromise our palaeoseismological interpretation of the trench as this interpretation is based on observations and dates from the downthrown side (see below).
3.2.2 Trench structure and surface ruptures
A fault zone that is up to 0.5 m thick is observed on the wall of the trench (Fig. 7). This fault zone is limited by two slip surfaces. Within the fault zone, only minor shear is observed, and most of the primary rock structures are preserved. This fault zone clearly offsets all the identified units except the topsoil. We use direct and indirect criteria to identify palaeoseismic events at the RUB site, including cross-cutting relationships, colluvial wedges, and liquefaction levels. As previously mentioned, we interpret soft-sediment deformation structures observed in the trench as the result of liquefaction induced by earthquakes. Deformed beds remain as separate levels all along the trench (for approximately 12 m). Therefore, we consider each seismite level as an event horizon. However, we cannot completely rule out that all these features were produced by a single event (Gibert et al., 2011). Liquefaction-related distorted beds are usually formed at the time of deposition and are close to the sediment–water interface (Moretti et al., 1999; Sims, 1975). Therefore, the age of the causative earthquake can be constrained by dating the deformed bed or the levels below and above it. We are aware that liquefaction can occur far from the seismogenic source of the causative earthquake. In the study area, besides the GF, the Baza Fault is also present (Alfaro et al., 2008; García-Tortosa et al., 2011; Medina-Cascales et al., 2020). We cannot completely rule out the possibility that the Baza Fault was the source of the events that produced the observed liquefaction structures. However, due to the proximity to the GF, we assume the latter as the seismogenic source of these events. Distorted beds and convoluted laminations can form at Mercalli intensities of VIII–IX (Green and Bommer, 2019; Sims, 1975; Tuttle et al., 2019). Such intensities can be reached during earthquakes with a moderate magnitude, especially when shaking is amplified in sedimentary basins or unconsolidated soils, as is the case at the RUB site. Therefore, although we interpret liquefaction levels as event horizons, the causative earthquakes could have had a moderate magnitude – that is, these earthquakes may or may not have produced surface rupture.
In the RUB trench, we deduced seven palaeoseismic events (Fig. 7). The oldest event (RUB_e1) is evidenced by the seismite event horizon at the top of unit A. The minimum age for RUB_e1 is constrained by the deposition of unit B. The second identified event (RUB_e2) is recorded by the seismite event horizon within unit B. Therefore, the minimum age for this event is determined by the deposition of unit C. As they are the only criteria indicating that these two older events are liquefaction features, they could have been earthquakes with no surface rupture. The third event (RUB_e3) is recorded using two different criteria: the seismite event horizon located at the top of unit C and the CW1 colluvial wedge. In this case, the minimum age for this event is constrained by the deposition of unit D. Because of the presence of the CW1 colluvial wedge, we consider RUB_e3 to be a surface rupture event. Similarly, RUB_e4 is evidenced by the seismite event horizon at the top of unit D and the CW2 colluvial wedge. Therefore, we also consider RUB_e4 to be a surface rupture event, for which the minimum age is constrained by the deposition of unit E. RUB_e5 is recorded using the seismite level at the top of unit E. Therefore, this could be an event that may or may not have produced a surface rupture, with a minimum age constrained by the deposition of unit F. RUB_e6 is evidenced by the CW3 colluvial wedge. This is a surface rupture event constrained by the deposition of the upper part of unit F. Finally, RUB_e7 is recorded using the fault strand that offsets up to unit G. This younger event is constrained by the deposition of unit TS (top soil).
Two types of palaeoseismic events can be deduced from the RUB trench, as discussed above. These are events involving surface ruptures (RUB_e3, RUB_e4, RUB_e6, and RUB_e7) and events that may or may not involve surface ruptures (RUB_e1, RUB_e2, and RUB_e5). Therefore, we constructed two OxCal models for the RUB trench. The first model accounts for all the recorded events (see S9 in the Supplement), while the second model includes only events that have certain surface rupture (see S10 in the Supplement).
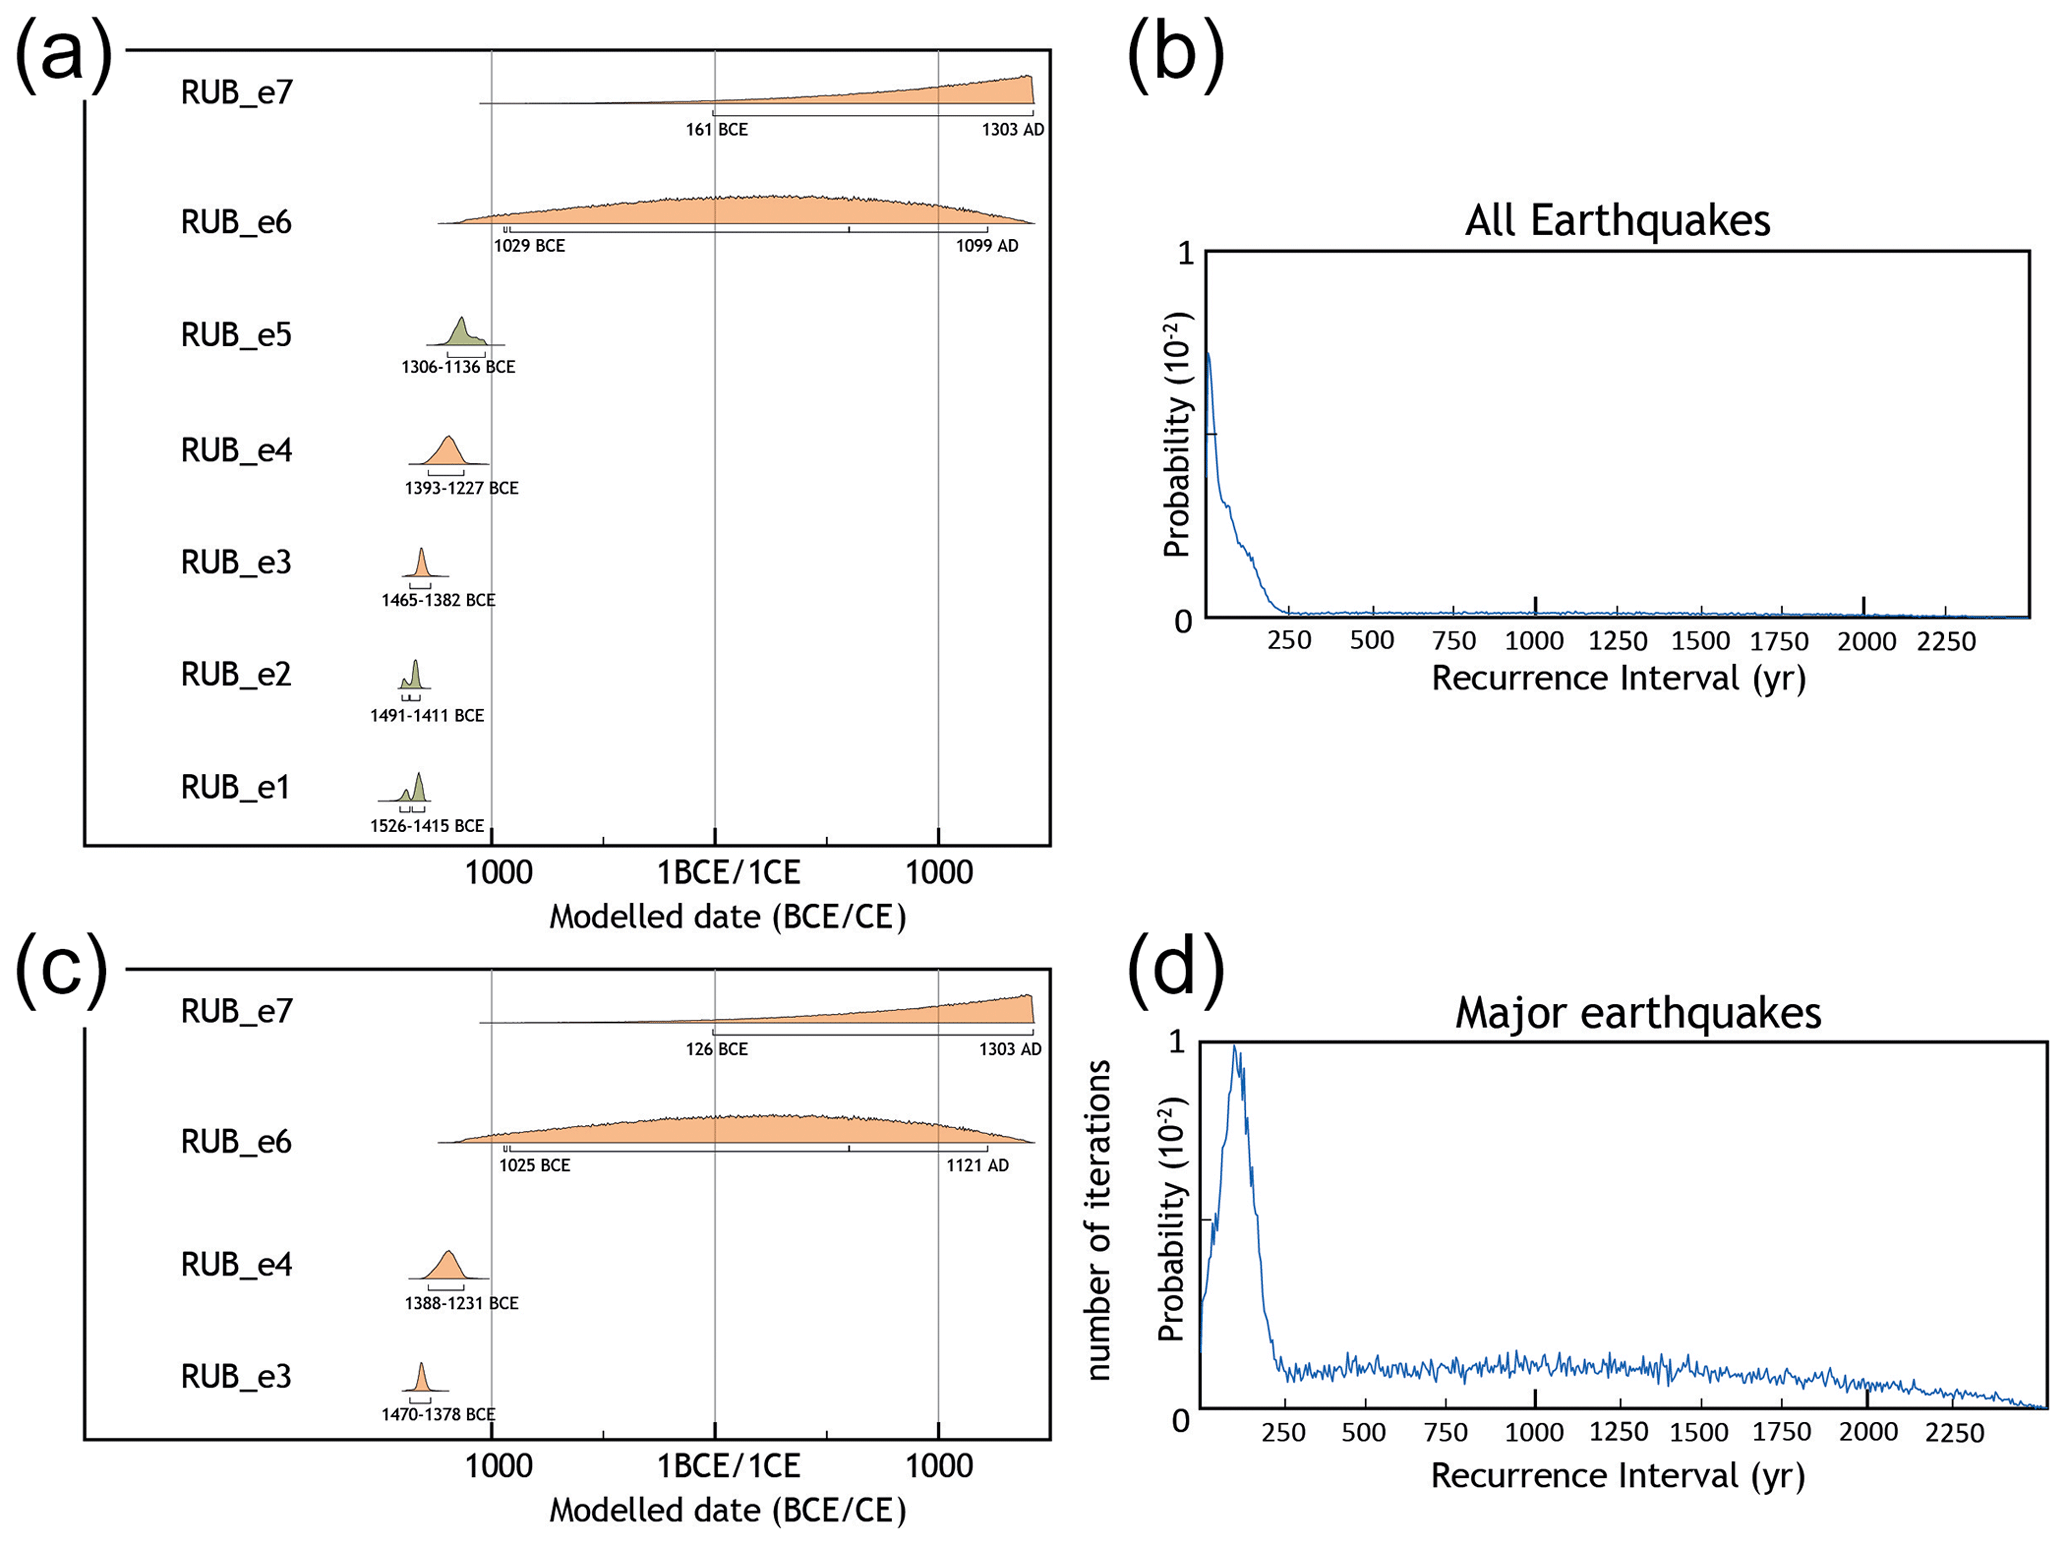
Figure 9PDFs from the OxCal models for the RUB trench. (a) PDFs accounting for all the recorded events. (b) PDFs accounting exclusively for the earthquakes with certain surface ruptures.
The first OxCal model for the RUB site accounts for all the recorded events (Fig. 9). In this model, RUB_e1 (modelled as a Date) is constrained by the charcoal radiocarbon samples RUB-A3 and RUB-B2 (maximum and minimum constraints, respectively). The OxCal model yields an age range of 1526–1415 BCE for RUB_e1. The same parameters were used in the OxCal model for RUB_e2. The age of this second event is constrained by the sample RUB-B2 (maximum constraint) and the charcoal samples RUB-C3 and RUB-C4 (minimum constraints). We obtained an age range of 1491–1411 BCE for RUB_e2. Similarly, RUB_e3 was also modelled as a Date. The maximum constraint for this event is provided by charcoal samples from unit C, as previously mentioned. The minimum constraint is provided by the charcoal sample RUB-D1. The model yields an age range of 1465–1382 BCE for RUB_e3. The next event (RUB_e4) was also modelled as a Date. The maximum constraint for this event is the charcoal sample RUB-D1. The minimum constraint is the charcoal sample RUB-E1, taken from the CW2 colluvial wedge. We consider this minimum constraint to be closer to the event age as colluvial wedges are deposited immediately after an earthquake. Therefore, we added a Zero Boundary to the model to account for this. The result is an age range of 1440–1322 BCE for RUB_e4. RUB_e5 (modelled as a Date) is constrained by the charcoal samples RUB-E1 and RUB-F2 (maximum and minimum constraints, respectively). The model yields an age range of 1306–1136 BCE for RUB_e5. The maximum constraint for RUB_e6 (modelled as a Date) is the RUB-F2 sample. However, no dated sample is available above the event horizon of this event. Similarly, no dated samples are available below or above the RUB_e7 horizon. To better constrain these two events, we added a “C_Date” command for 1520 CE to our OxCal model. This constraint accounts for the completeness of the Spanish earthquake catalogue in the study area (Martínez Solares and Mezcua, 2002). Using these parameters, the model yields an age range of 1029 BCE–099 CE for RUB_e6 and an age range of 161 BCE–1303 CE for RUB_e7. The ages obtained from this model shed light on our hypothesis that the Galera Fault is the causative fault of the liquefaction levels. The only potential source of these liquefaction features could be the Baza Fault (Figs. 1 and 2). Only one of the previously reported palaeoearthquakes from the Baza Fault (Castro et al., 2018) overlaps temporally with the events that we recognized in the RUB trench. The age of this Baza Fault event is poorly constrained (8485–785 BCE), meaning it could correspond to any of the seismite-related events in the GF. Therefore, we cannot completely rule out that the Baza Fault was responsible for these liquefaction structures. However, as previously mentioned, because of the proximity of the liquefaction features to the Galera Fault, we consider the latter to be the most likely seismogenic source.
The second OxCal model for the RUB site accounts exclusively for the earthquakes with certain surface ruptures – that is, RUB_e3, RUB_e4, RUB_e6, and RUB_e7 (Fig. 9). This second model is analogous to the first but eliminates the Date commands related to minor events (RUB_e1, RUB_e2, and RUB_e5). This model yields the following ages: 1470–1378 BCE for RUB_e3, 1388–1231 BCE for RUB_e4, 1051 BCE–1121 CE for RUB_e6, and 126 BCE–1303 CE for RUB_e7.
3.2.3 Palaeoseismic parameters: single-event displacement, fault slip rate, and recurrence intervals
Only the three lowermost units (unit A, unit B, and unit C) are recognized on both sides of the fault zone in the RUB trench (Fig. 7). To compute the single-event displacement, we use the black-silt level near the base of unit A and the top of the basal conglomerates of unit C. We selected these two horizons as they can be traced continuously from the upthrown side to the downthrown side across the fault zone (Fig. 7). The lowermost correlated level (the black-silt level near the base of unit A) should have accumulated the offsets from all the recognized events. The second correlated level (the top of the conglomerates at the base of unit C) is located below the event horizon of RUB_e3 (i.e. below the top of unit C). Therefore, this second level should accumulate the offsets of all the events except RUB_e2 and RUB_e1. However, the along-dip offset measured for both levels is the same (0.79 ± 0.07 m for the lower level and 0.79 ± 0.06 m for the upper level). We consider this to be evidence that events deduced only from liquefaction levels were of a moderate magnitude and did not produce surface ruptures.
The exposed trench wall shows a normal separation of this fault strand. However, once again, field data indicate that this strand is an oblique fault as slickenlines present an orientation of 24/235 (Medina-Cascales et al., 2021). Considering these oblique kinematic indicators and the aforementioned normal offset, we calculated a total offset of 1.64 ± 0.11 m. Dividing this value between the number of events with certain surface ruptures (a total of four events), we obtained a mean single-event displacement of 0.41 ± 0.11 m.
Using this same dataset and an analogous approach, we calculated the fault slip rate. For this calculation, we assumed that the total offset observed in the trench is the result of the cumulative displacement of all the recorded palaeoseismic events. Under this assumption, we divided 0.79 ± 0.06 m, the mean normal offset between the age of the older event and the surface rupture recorded in the trench (1470–1378 BCE; RUB_e3), to obtain a normal (dip) slip rate of 0.23 ± 0.07 mm yr−1, a strike-slip rate of 0.27 ± 0.07 mm yr−1, and a total slip rate of 0.49 ± 0.07 mm yr−1. These values agree with geodetic slip rates calculated for the Galera Fault (strike-slip rate of 0.5 ± 0.3 mm yr−1; Alfaro et al., 2021)
We calculated the recurrence interval for the RUB site following the same procedure as that used for the PIL site. In this case, we carried out three Monte Carlo analyses using the PDFs of the palaeoseismic events (Fig. 9). The first analysis includes all the recorded events, the second analysis includes only the earthquakes with certain surface ruptures, and the third analysis includes the events from RUB_e1 to RUB_e5 – that is, the events that took place in a concentrated period of time (see below). After running the Monte Carlo simulations that include all the events recorded in the RUB trench, we obtained a recurrence interval of 90 years (0–1790 years at a 95 % confidence interval). The second analysis yielded a mean recurrence interval of 575 years (0–2055 years at a 95 % confidence interval) for the events with certain surface ruptures. The third analysis indicated a mean recurrence interval of 50 years (0–155 years at a 95 % confidence interval) for the events from RUB_e1 to RUB_e5.
4.1 Composite surface rupture history of the Galera Fault
In this section, we discuss the composite surface rupture history of the GF over the last ∼14 000 years. We assumed that, because the Galera Fault is not divided into segments (Medina-Cascales et al., 2021) and is 30 km long, surface rupture events represent fault-wide earthquakes. Therefore, the proposed composite history involves events from both palaeoseismological sites, i.e. PIL and RUB.
As discussed above, we distinguished two different event types at the RUB site (Fig. 8): events with certain surface ruptures and events that may or may not produce surface ruptures. Therefore, to minimize uncertainties, we included in this composite history only RUB events with certain surface ruptures.
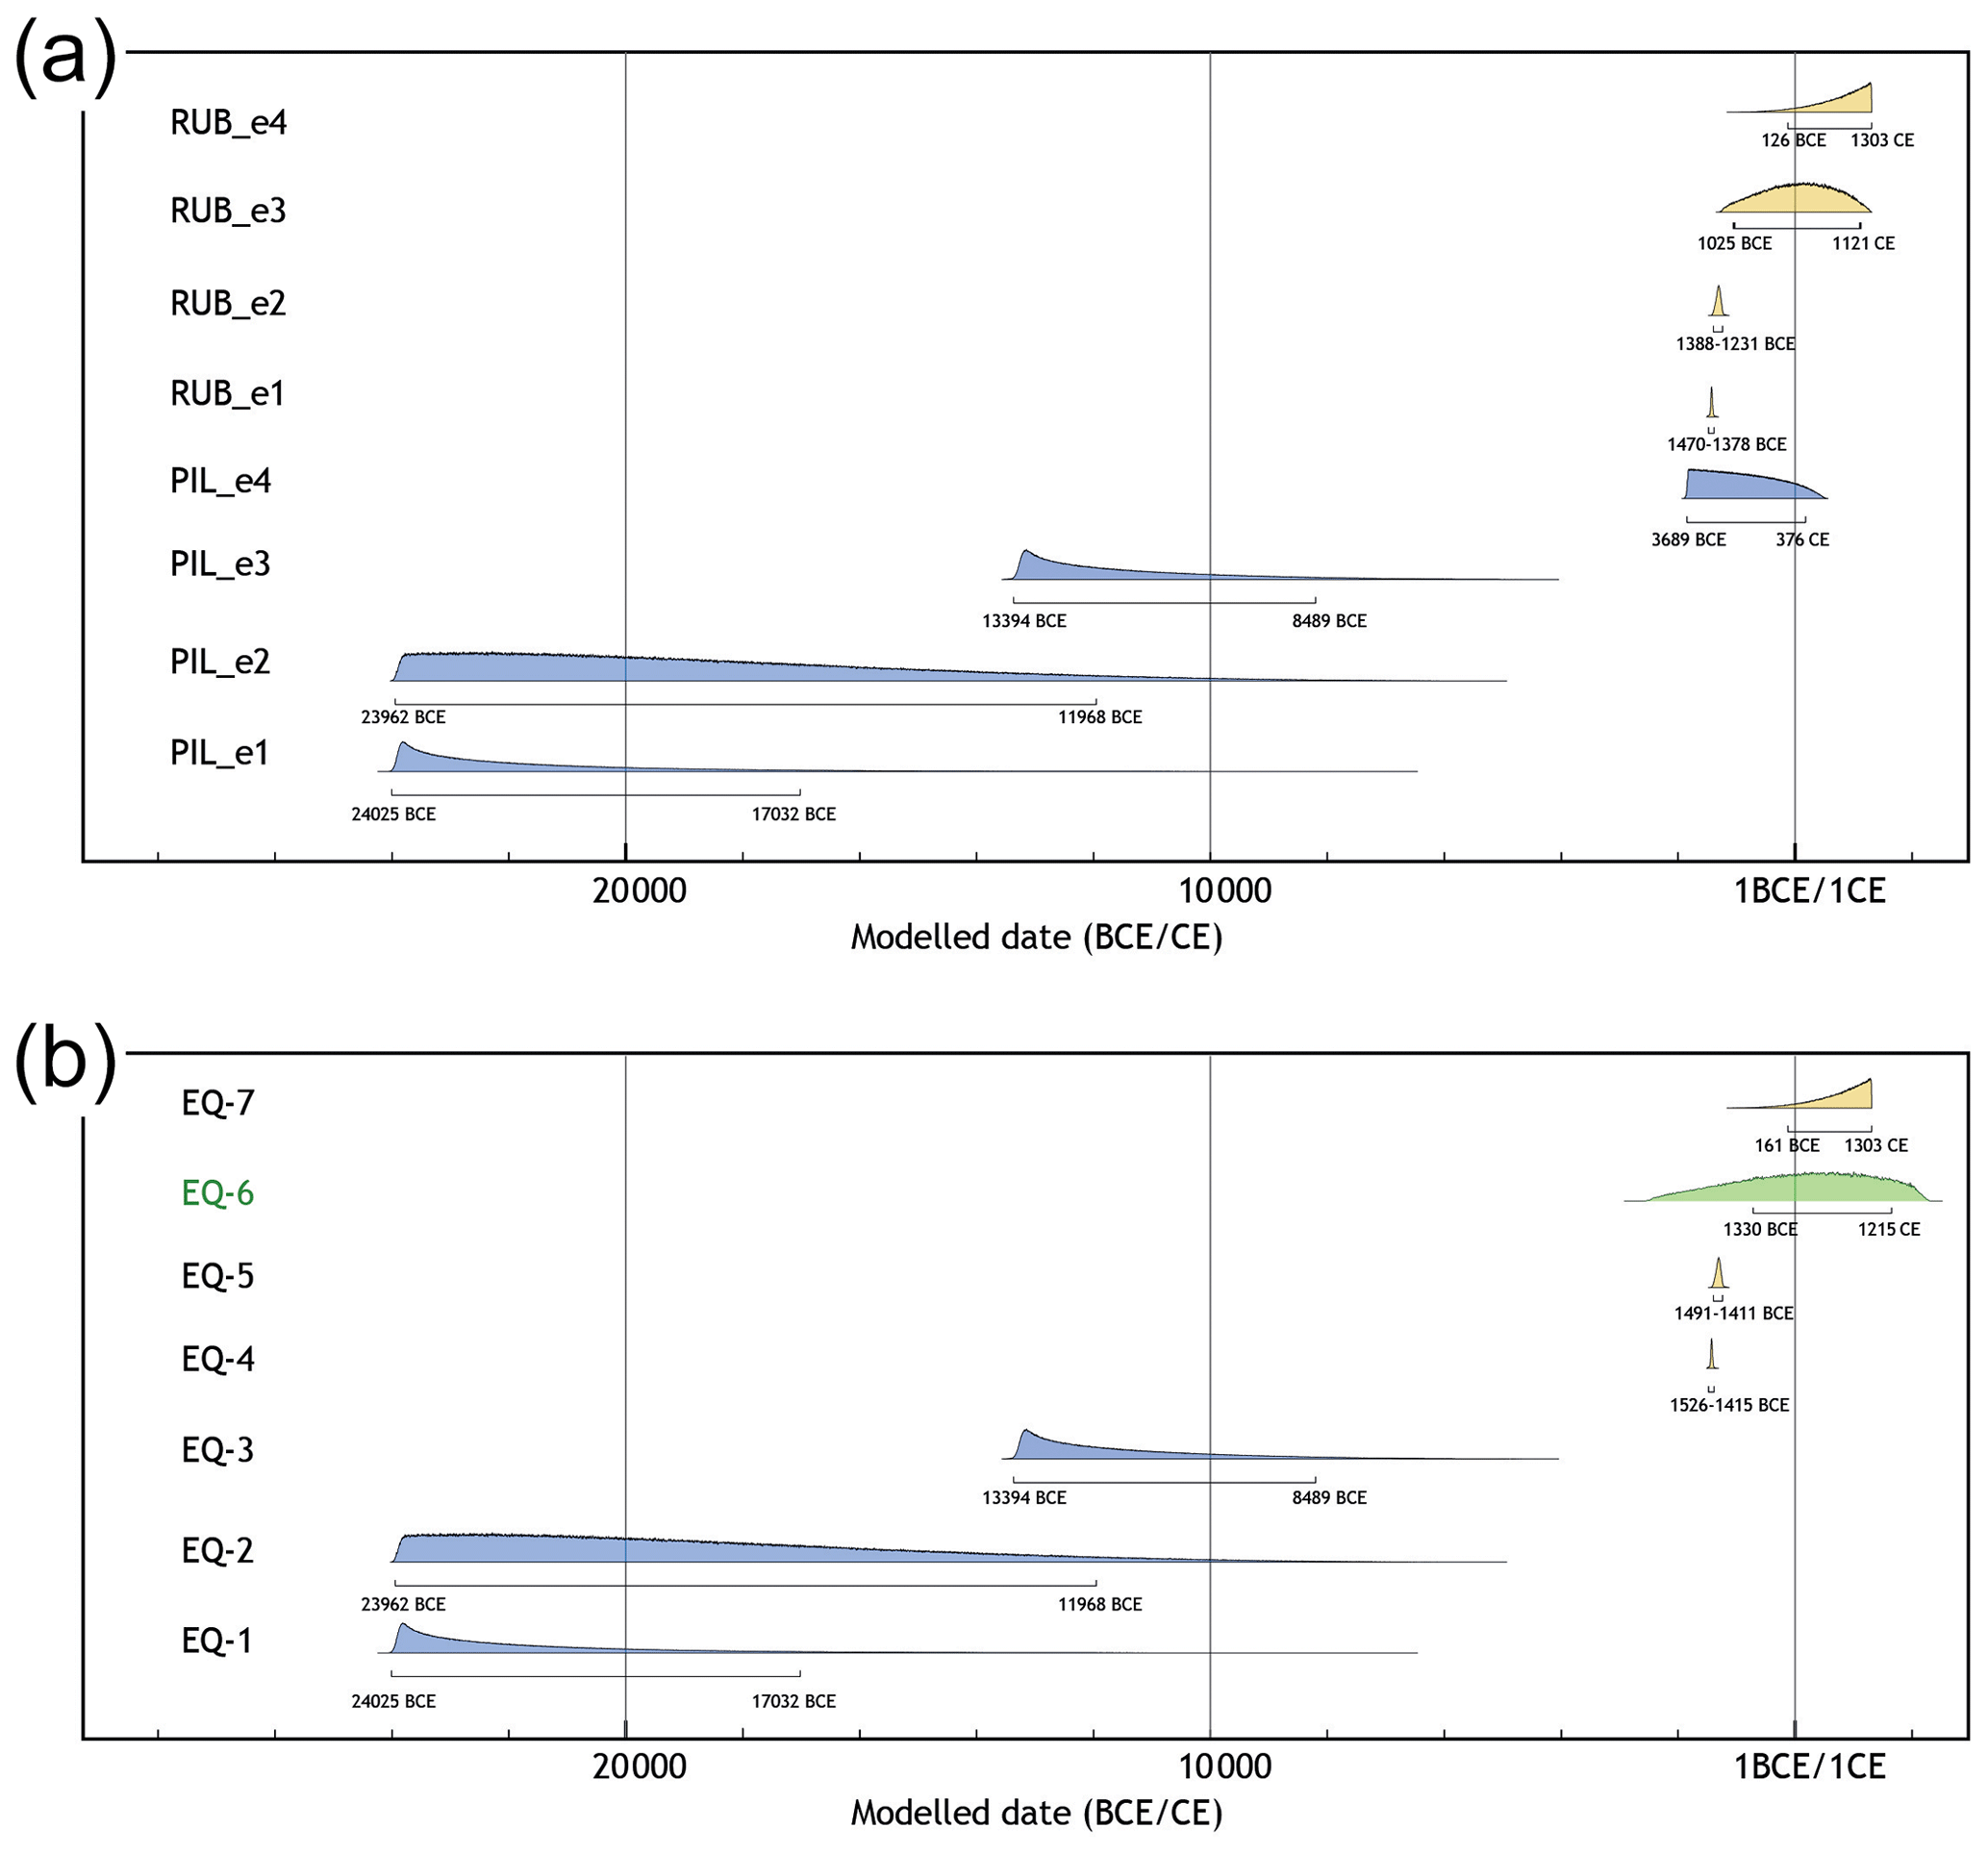
Figure 10Correlation of PDFs from OxCal models for the GF. (a) In the first scenario, PIL_e4 is considered a different event that is not registered in the RUB trench, leading to a surface rupture history for the GF involving eight events. (b) The second scenario considers that PIL_e4 is one of the events recorded in the RUB trench, yielding a total of seven events. EQ: earthquake.
The event age PDFs of the PIL and RUB trenches are highly heterogeneous. In the PIL trench, the ages of the single events obtained following our Bayesian analysis extend up to approximately 10 000 years (Fig. 5). In contrast, event ages in the RUB trench are much better constrained, with some of them extending up to approximately 100 years (Fig. 9). When incorporating this heterogeneity into a composite surface rupture history of the GF, we preferred to integrate our data into a logic tree rather than consider the overlap of PDFs for each event (DuRoss et al., 2011; Castro et al., 2018) (Fig. 10).
Our logic tree considers two main scenarios (Fig. 10). In the first scenario, PIL_e4 is a different event that is not registered in the RUB trench. In this case, we obtain a composite surface rupture history for the GF that encompasses eight events over the last ∼24 000 years. Alternatively, our second scenario considers that PIL_e4 is one of the events recorded in the RUB trench. This second scenario implies that a total of seven events have taken place over the last ∼24 000 years in the GF. As PIL_e4 is poorly constrained, it overlaps with all the events recorded in the RUB trench, leading to an additional four branches in our logic tree. This fact, together with the heterogeneous PDFs of both trenches mentioned above, led us to compute composite ages for all possible combinations in the second scenario (i.e. for the composite events involving PIL_e4+RUB_e1, PIL_e4+RUB_e2, PIL_e4+RUB_e3, and PIL_e4+RUB_e4) rather than only for that with the greatest overlap. However, because events from the RUB trench are much better constrained, the resulting composite ages are, in all cases, almost the same as those for the original RUB events (varying by only ∼20–40 years). This means that all the possibilities branching out from our second scenario yield almost identical results. Therefore, here we present only the results from the branch with the greatest overlap (composite event PIL_e4+RUB_e3; Fig. 10). However, we would like to emphasize that almost identical conclusions are obtained from the other branches.
In the first scenario (no common event between the PIL and RUB trenches and a total of eight events), we obtained a mean recurrence interval of 1520 years (0–2170 years at a 95 % confidence interval). In the second scenario (one common event between sites and a total of seven events), the mean recurrence interval obtained is 1720 years (0–2485 years at a 50 % confidence interval and 0–12 045 years at a 95 % confidence interval).
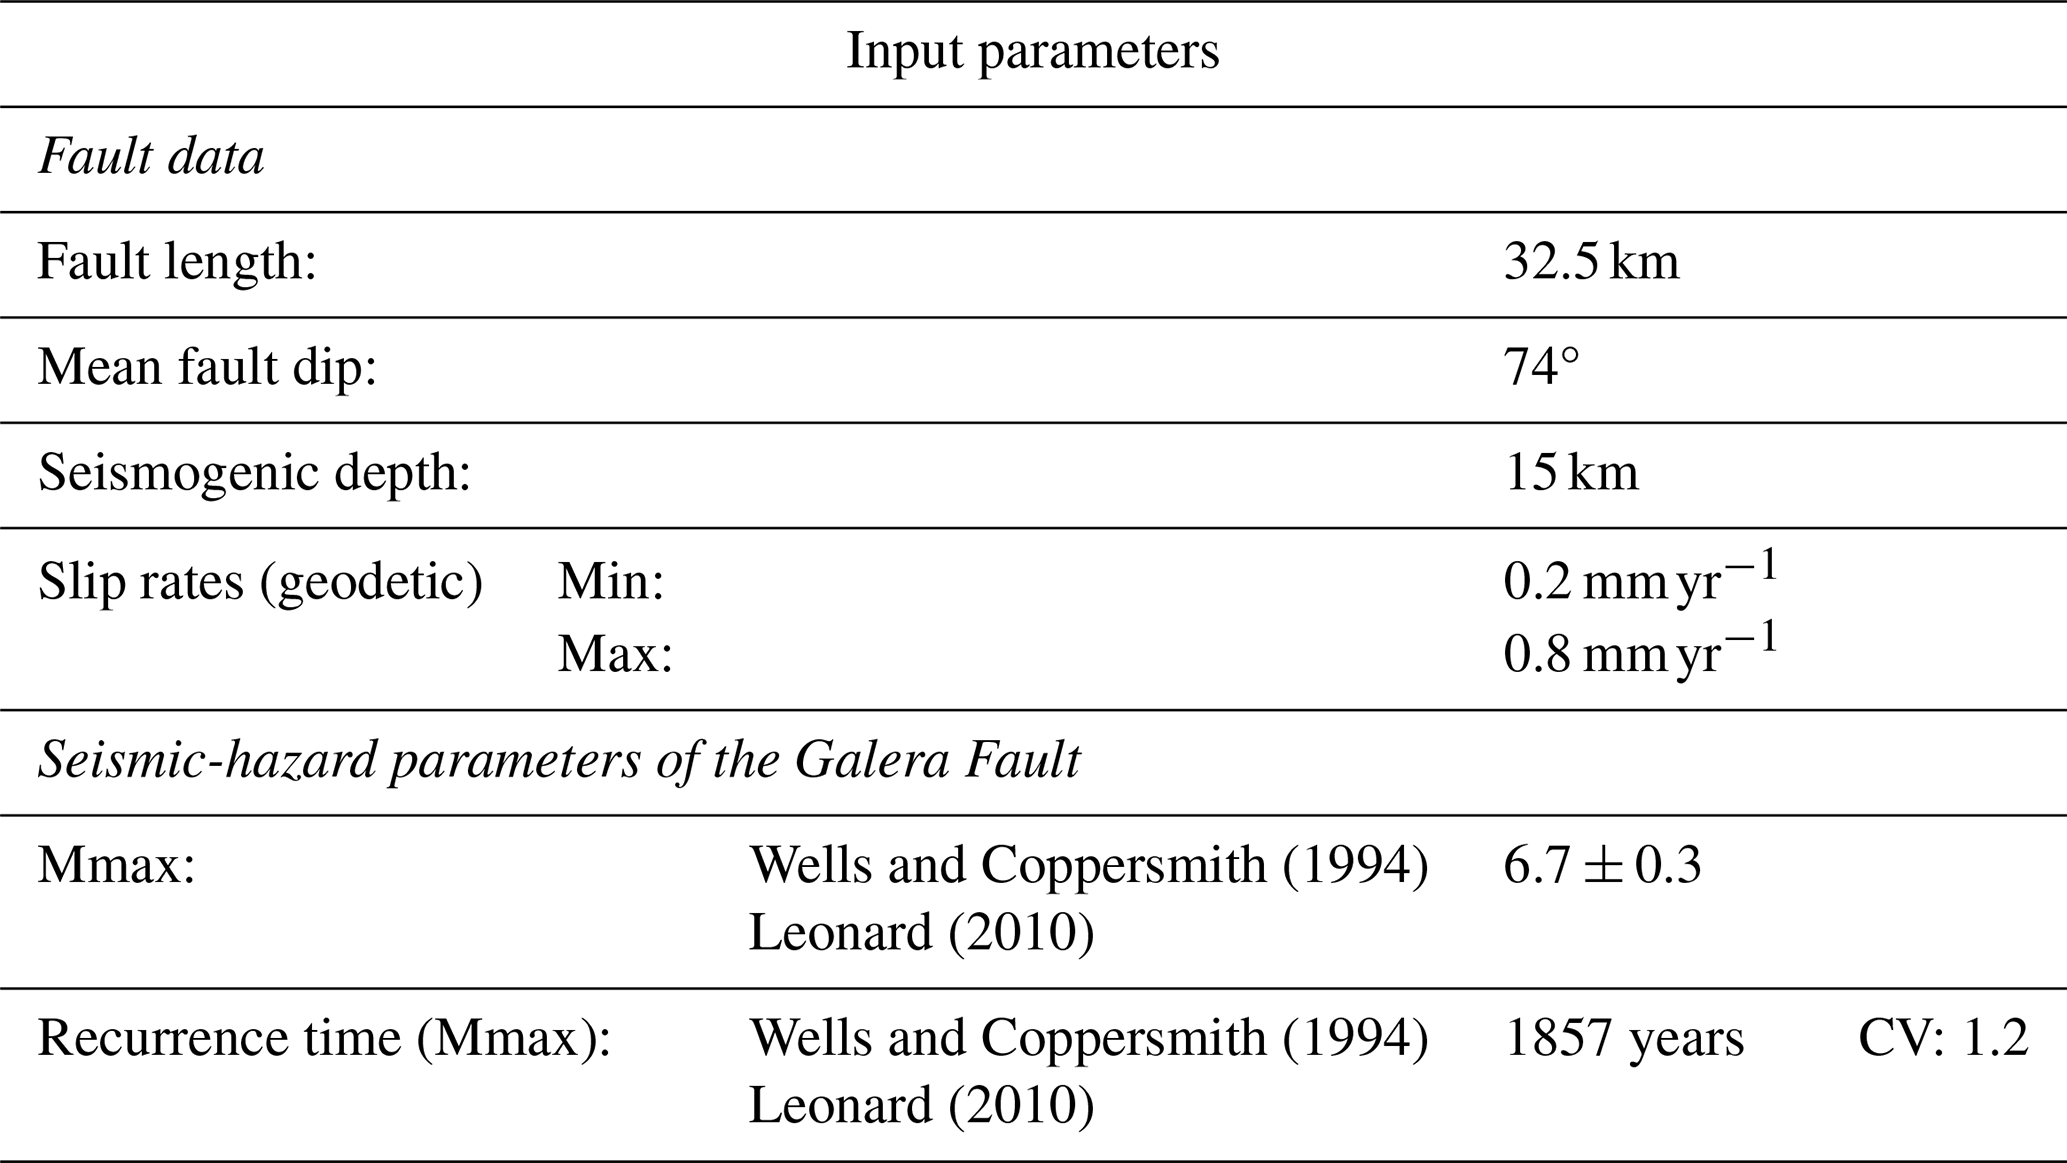
Table 1Input parameters and results of the seismic-hazard parameters obtained by applying the FiSH (Fault into Seismic Hazard) code (Pace et al., 2016). Mmax: maximum magnitude. CV: coefficient of variation.
4.2 Temporal distribution of the Galera Fault earthquakes
In this section, we discuss the hypothesis of temporal clustering of palaeoearthquakes in the GF. Historical and instrumental observations indicate that strike-slip faults commonly present short high-frequency seismic periods that alternate with longer periods with a lower earthquake rate (Barka, 1996; Chéry et al., 2001; Klinger et al., 2005; Marco et al., 2005; Rockwell et al., 2015). These observations seem to indicate that strike-slip faults are prone to temporal clustering of earthquakes. The lack of sufficiently long and consistent earthquake histories usually hampers the testing of this hypothesis in palaeoseismic records.
Data from the RUB trench indicate a short period of approximately 400 years (ca. 1536–1126 BCE) during which the GF produced five events with a mean recurrence interval of 50 years (0–155 years at a 95 % confidence interval; Fig. 9). Two of these events exhibit certain surface ruptures, while the other three probably did not produce surface ruptures. Evidence for these three events includes liquefaction features; therefore, we postulate a minimum threshold with a magnitude of 4.5 for these events (Green and Bommer, 2019; Moretti et al., 1999). In the ∼3200 years that followed, only two events were recorded, although the sedimentary conditions remained analogous. Therefore, these data seem to indicate that the GF might present a behaviour characterized by temporal clustering. This could be related to the sequential stress-triggering connection between earthquakes produced by other faults in the region (Yazdi et al., 2023). Such behaviour should be addressed in future seismic-hazard assessments.
4.3 Seismogenic characterization of the Galera Fault
In this section, we evaluate the seismic potential of the GF by determining its maximum expected magnitude and mean recurrence times between maximum events. Additionally, we simulate a geodetic rupture scenario, providing insights into the fault's behaviour.
4.3.1 Seismic-hazard parameters: maximum expected magnitude and mean recurrence times
To calculate the seismic-hazard parameters of the GF, we utilized the FiSH (Fault into Seismic Hazard) code (Pace et al., 2016). This code is designed for probabilistic seismic-hazard assessments (PSHAs) and models faults as seismogenic sources. We computed two key parameters: the maximum magnitude (Mmax) and the recurrence time between Mmax events, along with their associated uncertainties.
FiSH incorporates various approaches and scale relationships (Leonard, 2010; Wells and Coppersmith, 1994) to determine the Mmax that the fault can accommodate. These values, along with their uncertainties, are incorporated into a global normal distribution, generating mean values and standard deviations for the Mmax. Input parameters for FiSH include the fault's total length, mean dip, and seismogenic depth, as well as the maximum recorded event, if available (Table 1).
For the GF, we determined the fault length and dip based on structural data obtained from previous studies (Medina-Cascales et al., 2021). We set the seismogenic depth to 15 km, considering earthquake depths recorded in the area from the Spanish Instituto Geográfico Nacional (IGN) seismic catalogue (Martínez-Solares and Mezcua, 2002) and following criteria used by other researchers in the region (e.g. Galindo-Zaldivar et al., 1997). The maximum recorded event, the 1964 Galera earthquake, presents a magnitude of 4.7 mbLg. This value significantly deviates from the expected maximum magnitude for the fault. FiSH requires an input value close to the largest magnitude ever generated by the fault, representing its characteristic earthquake. A value of 4.7 mbLg is inappropriate because it lowers the mean when averaged with other maximum earthquakes calculated using different approaches. This may result in an unrealistically shorter recurrence period for large earthquakes. Therefore, we did not use the maximum recorded event as an input parameter in our calculations. The estimated maximum magnitude (Mmax) remains consistent regardless of the scale relationship that is used, yielding an Mw value of 6.7 ± 0.3 (Table 1).
Additionally, we computed the mean recurrence time between Mmax events. FiSH calculates this value by determining the seismic moment for an Mmax event and comparing it to the known slip rate, thereby determining the released moment rate. In this context, the Mmax event is considered a characteristic event that is expected to occur within a specific recurrence interval. The slip rate for the GF, obtained from geodetic data, is 0.5 ± 0.3 mm yr−1 (Alfaro et al., 2021) (Table 1). Based on the calculated Mmax values that we obtained from the scale relationships from Wells and Coppersmith (1994) and Leonard (2010), the estimated recurrence time between Mmax events for the GF is approximately 1857 years in both cases, with a coefficient of variation of 1.2 (Table 1). These values align with the recurrence times calculated using the Monte Carlo analysis based on palaeoseismological data from the two studied trenches.
4.3.2 Permanent displacements caused by an Mmax event
After estimating the magnitude of the Mmax earthquake, we proceeded to simulate a geodetic scenario for this event by calculating the permanent displacement caused by the earthquake. This simulation relied on the fault geometry and involved modelling the displacement between the two blocks along the fault slip surface. To evaluate this scenario, we used the Coulomb 3.3 code (Toda et al., 2011), which applies Okada's approach (Okada, 1985; Okada, 1992) to simulate the deformation of an elastic half-space with constant elastic properties.
Our model addresses the complexities of the GF by dividing the fault into four sections, with orientations ranging from N050° E to N000° E. We assigned different kinematics to these sections based on their orientation. Using this complex geometry, we modelled the Mmax by assuming a uniform displacement of 0.77 m between the blocks. This corresponds to a seismic moment of approximately 1.24 × 1026 dyn cm, equivalent to an event with an Mw value of 6.7, according to Wells and Coppersmith (1994). The simulation showed a westward movement of the NW fault block and an eastward movement of the SE fault block.
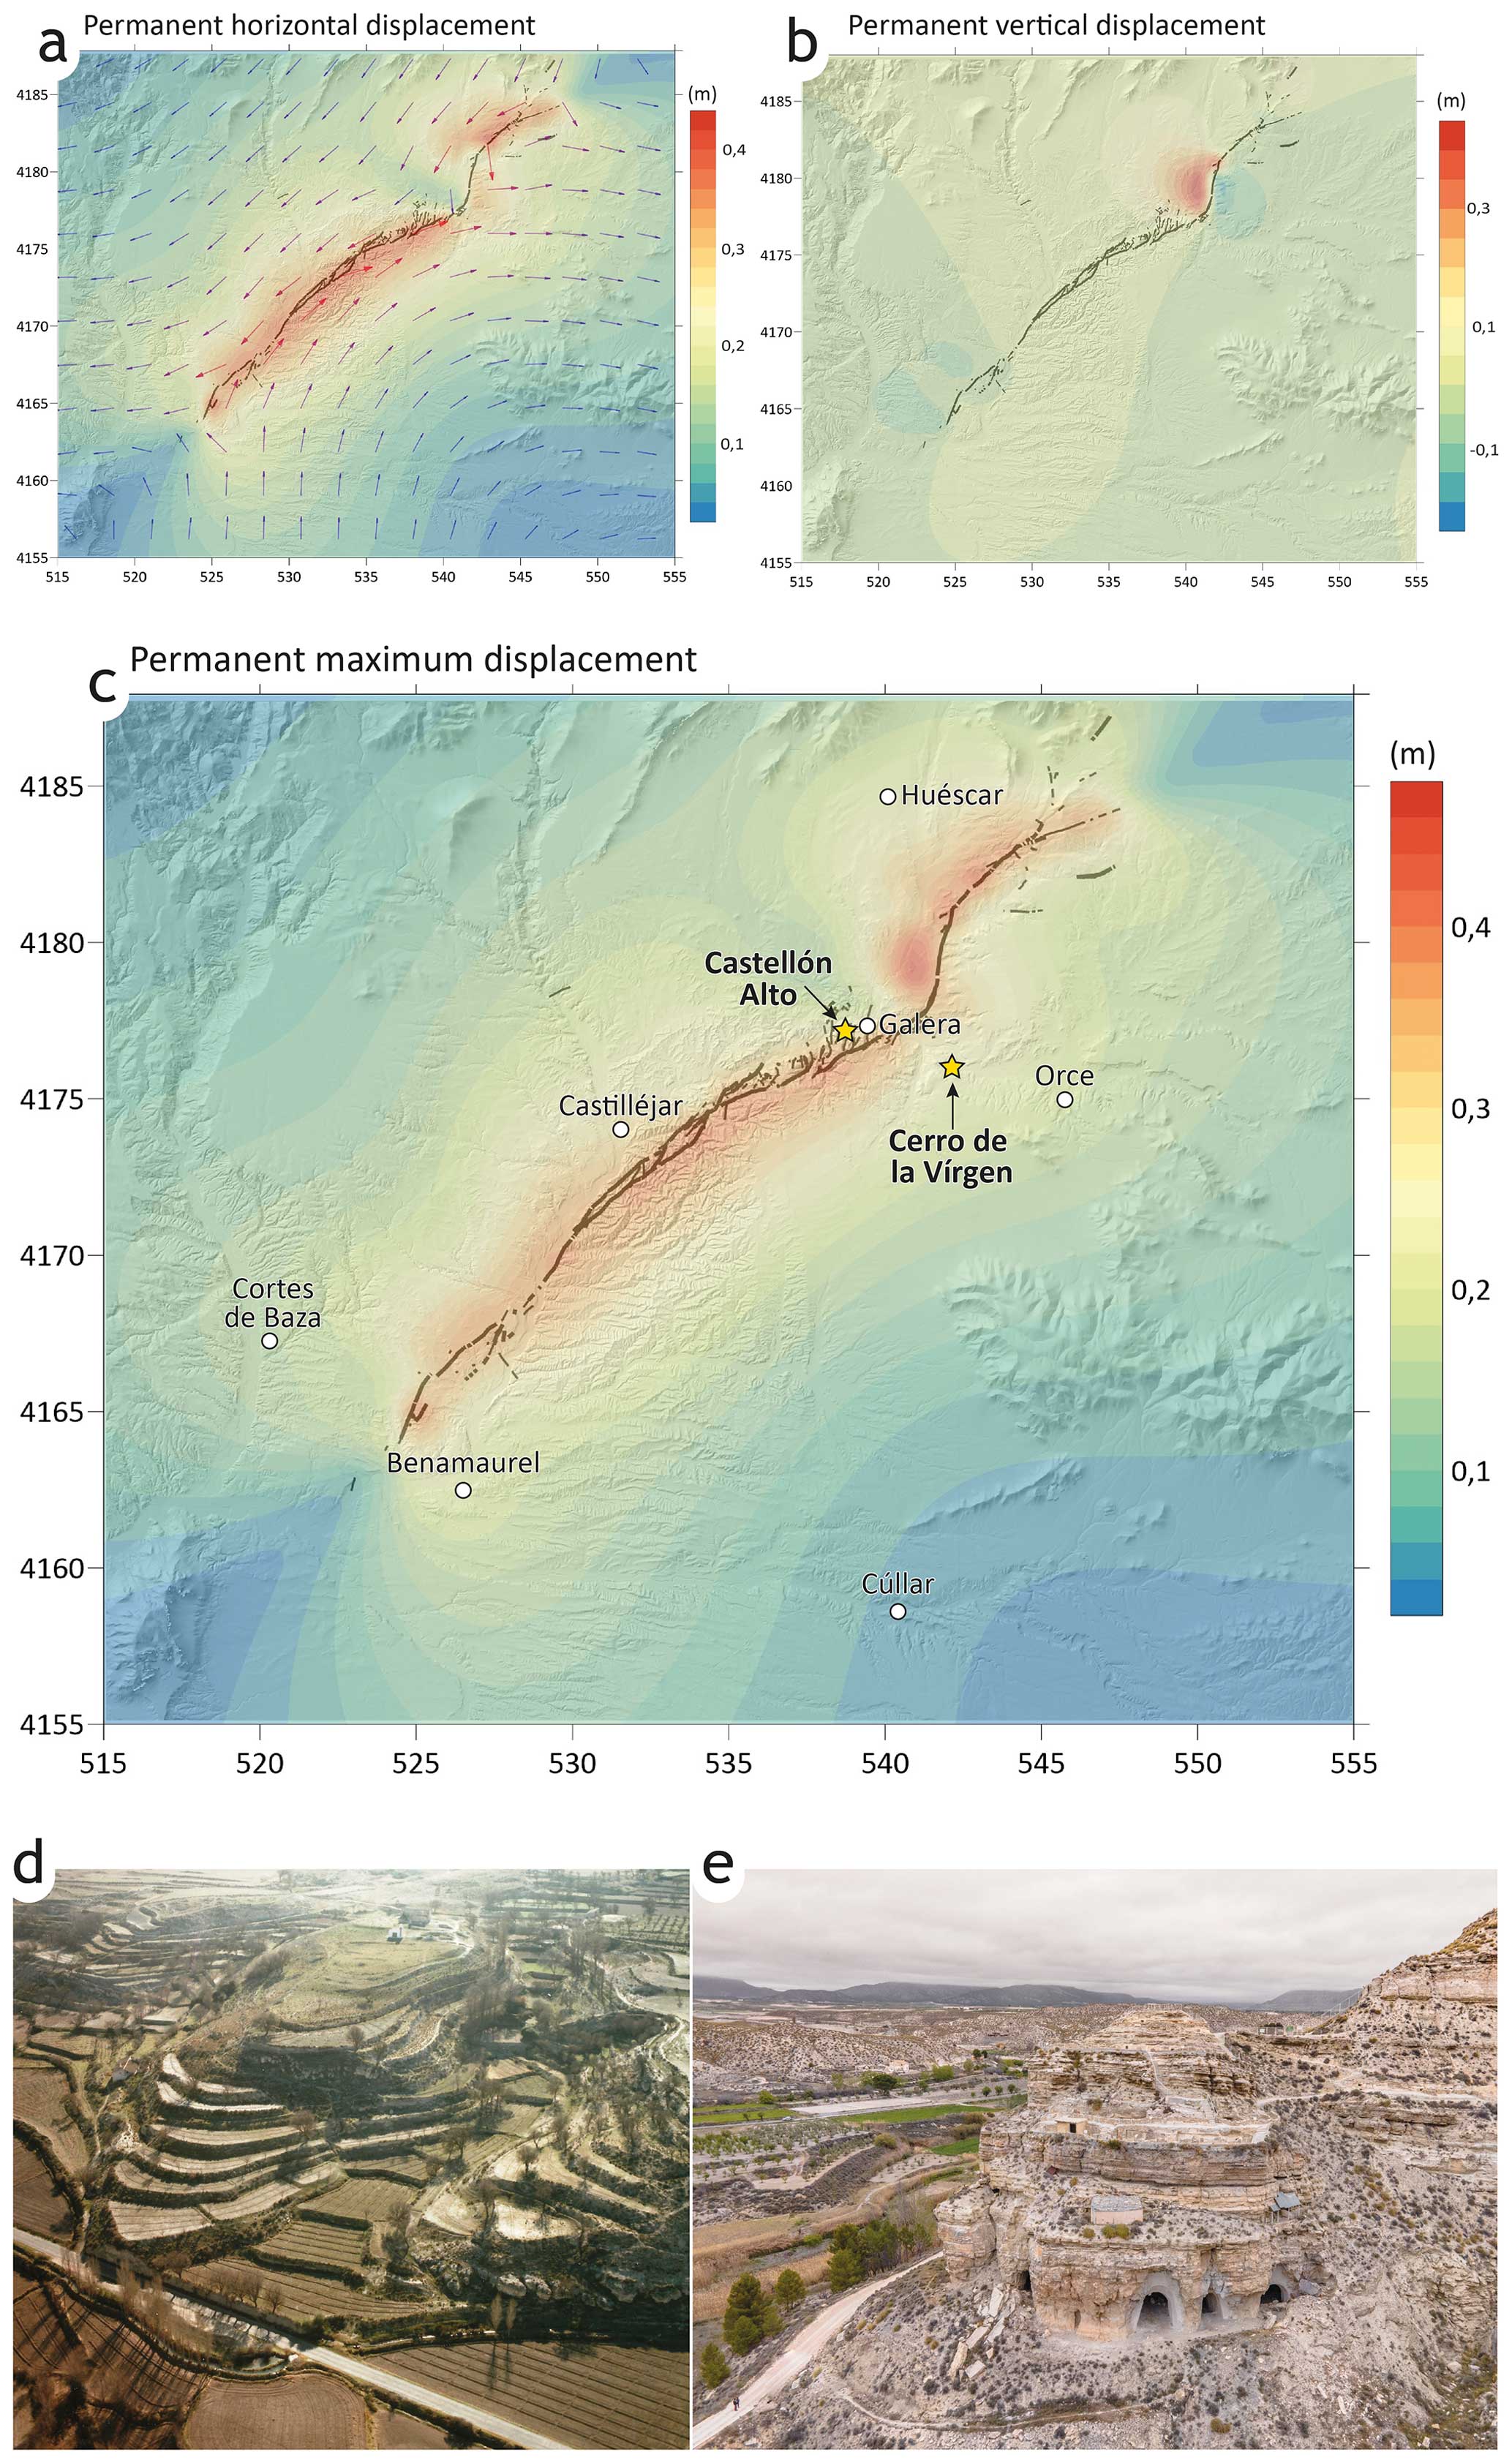
Figure 11Modelled geodetic scenario for the expected Mmax earthquake at the GF (Mw value of 6.7) illustrating horizontal (a), vertical (b), and maximum (c) displacements. Coloured contours represent the amounts of horizontal displacement. Stars show the locations of Bronze Age human settlements. (d, e) Aerial views of the Bronze Age settlements at the Cerro de la Virgen (photo: Paisajes Españoles) and Castellón Alto (photo: Paisajes Españoles) sites, respectively.
The results are illustrated in Fig. 11, which showcases the deformation field. These displacements reveal the extensive area affected by the maximum expected earthquake from a geodetic perspective. The NW fault block exhibited westward permanent displacements ranging from 0.40 to 0.50 m. In contrast, the SE fault block experienced lower eastward permanent displacements (0.3 to 0.4 m) near the fault trace. An area with maximum displacement was observed in the NW block, close to the town of Galera. Surprisingly, this highly affected area is not located in the central sector of the fault, which we initially assumed would experience the largest displacement. Therefore, we attribute this highly affected area to a main irregularity in the fault trace, specifically a fault bend. The curvature of this fault bend generates regions of maximum displacement, a phenomenon previously observed in the neighbouring Baza Fault (Medina-Cascales et al., 2020).
4.4 Implications for Bronze Age human settlements
Natural disasters have traditionally been proposed as important agents in past collapses, destructions, and major changes in human societies (Force, 2017; Mastrolorenzo et al., 2006; Oswald et al., 2021; Von Suchodoletz et al., 2022a; Walker et al., 2020). In this section, we discuss our palaeoseismic results in terms of the role that earthquakes could have played in the development of Bronze Age settlements near the GF.
As discussed above, data from the RUB trench indicate a temporal clustering of earthquakes between ca. 1536 BCE and 1126 BCE. In these ∼400 years, the GF was responsible for five events, with two of them having surface ruptures. This time span corresponds with the Bronze Age historic period. During this period, the Argaric culture developed in SE Spain and was characterized by its ceramic techniques and sophisticated pottery as well as other features (Castro et al., 2001). The Argaric culture flourished in 2200 BCE and was active until 1300 BCE (Aranda and Molina, 2006; Hernández Pérez et al., 2016; Molina, 1978; Schubart et al., 2000).
Two major Argaric archaeological sites are located near the GF (Fig. 11): the Castellón Alto and the Cerro de la Virgen sites. The Castellón Alto site (Molina and Cámara, 2004) is located very close to the GF trace (Fig. 11) and is situated in a steep hill facing a small ravine. This 170 m × 80 m site is divided into four distinct areas and distinguished by narrow streets lined with multi-room stone houses. Most of the burials in the Castellón Alto site consist of small lateral chambers at the bases of vertical pits under house floors or behind house walls (Cámara and Molina, 2011; Cámara et al., 2018; Molina, 1983). The Castellón Alto settlement had been inhabited since 1900 BCE and was abandoned in approximately 1500 BCE, as indicated by the more recent tombs dated to 1600 BCE. The Cerro de la Virgen site (Molina et al., 2016) is also located in a steep area and is situated at the confluence of two small ravines (Fig. 11). Three different phases are recognized in this 375 m × 160 m fortified settlement (Molina et al., 2018, 2017; Schüle, 1980). The third phase presents distinct features of the Argaric culture (Molina et al., 2014, 2016, 2018), including burials under house floors or behind house walls. The more recent tombs at the Cerro de la Virgen site can be dated to 1550 BCE, indicating that the site was abandoned in approximately 1500 BCE (Molina et al., 2014, 2016; Castro et al., 2009).
The end of the Argaric culture in southeastern Spain took place in ca. 1300 BCE because of a crisis probably related to its forms of social exploitation (Cámara and Molina, 2009; Lull et al., 2013; Risch and Meller, 2015). However, the two Bronze Age archaeological sites near the GF (Castellón Alto and Cerro de la Virgen) represent anomalies, as both were abandoned in approximately 1500 BCE, i.e. approximately 200 years before other Argaric settlements in southeastern Spain were abandoned (Aranda and Molina, 2006; Cámara and Molina, 2009; Hernández Pérez et al., 2016; Lull et al., 2013; Molina, 1978; Risch and Meller, 2015; Schubart et al., 2000). This early abandonment overlaps with the beginning of the seismic cluster recorded in the RUB trench. We hypothesize that the GF seismic crisis could have played a key role by adding extra stress to the societal crisis, thereby leading to an early abandonment of the settlements. In addition to the occurrence of several earthquakes that are temporally close, the impact of earthquakes on settlements could have been amplified due to the topographic effect (e.g. Geli et al., 1988) derived from their steep position. Earthquake clusters have also been postulated as triggers for the collapse and destruction of Bronze Age settlements in other regions, such as the Aegean, eastern Mediterranean (Nur and Cline, 2000), and Caucasus (Von Suchodoletz et al., 2022b). This hypothesis is in good agreement with our modelled deformation field as both archaeological sites are located in areas with expected major displacement (Fig. 11). However, we suggest that to further validate this hypothesis, complementary studies are necessary, including dating the more recent archaeological artefacts in the sites (other than tombs) and archaeoseismological analyses.
The palaeoseismological analysis presented here yields the first seismogenic characterization of the GF. Our results indicate that this active structure has ruptured at least seven or eight times during the last ∼24 000 years, with a recurrence interval ranging between 1520 and 1720 years. Our results seem to indicate that the GF is prone to producing earthquake clusters as we recorded five palaeoseismic events in ∼400 years (ca. 1536–1126 BCE) and only two events in the ∼3200 years that followed.
We also carried out a seismogenic characterization of the GF using various approaches and scale relationships incorporated into the FiSH code. With this approach, we obtained a maximum expected magnitude for the GF of 6.7 ± 0.3 and a recurrence interval of 1857 years (CV: 1.2), which is in good agreement with the palaeoseismological results. Furthermore, we followed Okada's approach to estimate the deformation field produced by a maximum earthquake in the GF. This simulation shows that maximum displacement would be experienced in the northern part of the fault and not in the central sector as expected. This could be related to a fault bend.
Finally, the abovementioned earthquake cluster of the GF partially overlaps with the abandonment of two Bronze Age settlements located close to the fault. We postulate that the seismic crisis could have added extra stress to these settlements, leading to an early abandonment.
The OxCal program can be accessed via the University of Oxford website at https://c14.arch.ox.ac.uk/oxcal.html (University of Oxford, 2024).
All datasets can be found in the Supplement.
The supplement related to this article is available online at: https://doi.org/10.5194/se-15-837-2024-supplement.
IMR, IMC, JFGT, and PA planned the campaign and performed the measurements. IMR, IMC, JFGT, MORA, FMG, JACS, and PA analyzed the data. IMR wrote the draft of the paper. IMR, IMC, JFGT, MORA, FMG, JACS, and PA reviewed and edited the paper.
The contact author has declared that none of the authors has any competing interests.
Publisher's note: Copernicus Publications remains neutral with regard to jurisdictional claims made in the text, published maps, institutional affiliations, or any other geographical representation in this paper. While Copernicus Publications makes every effort to include appropriate place names, the final responsibility lies with the authors.
We acknowledge the comments of the two anonymous referees and the editor Federico Rossetti, which significantly improved the quality of this paper.
This research has been supported by the Ministerio de Ciencia, Innovación y Universidades (grant nos. PID2021-127967NB-I00 and RTI2018-100737-B-I00); Conselleria de Innovación, Universidades, Ciencia y Sociedad Digital (Generalitat Valenciana; grant no. AICO2021/196); Universidad de Alicante (grant no. VIGROB053); and Consejería de Economía, Innovación, Ciencia y Empleo (Junta de Andalucía; grant no. RNM325). The Institut Cartogràfic Valencià, Agencia Valenciana de Seguridad y Respuesta a las Emergencias (Generalitat Valenciana), Consorcio Provincial para el Servicio de Prevención y Extinción de Incendios y Salvamento de Alicante, Excelentísimas Diputaciones Provinciales de Alicante y Castellón, and Ayuntamiento de Almoradí also provided partial funding.
This paper was edited by Federico Rossetti and reviewed by two anonymous referees.
Alfaro, P., Moretti, M., and Soria, J. M.: Soft-sediment deformation structures induced by earthquakes (seismites) in pliocene lacustrine deposits (Guadix-Baza Basin, central Betic Cordillera, Eclogae Geol. Helv., 90, 531, https://doi.org/10.5169/seals-168193, 1997.
Alfaro, P., Delgado, J., de Galdeano, C. S., Galindo-Zaldívar, J., García-Tortosa, F. J., López-Garrido, A. C., López-Casado, C., Marín-Lechado, C., Gil, A., and Borque, M. J.: The Baza Fault: a major active extensional fault in the central Betic Cordillera (south Spain), Int. J. Earth Sci. (Geol. Rundsch.), 97, 1353–1365, https://doi.org/10.1007/s00531-007-0213-z, 2008.
Alfaro, P., Gibert, L., Moretti, M., García-Tortosa, F. J., Sanz de Galdeano, C., Galindo-Zaldívar, J., and López-Garrido, Á C.: The significance of giant seismites in the Plio-Pleistocene Baza palaeo-lake (S Spain), Terra Nova, 22, 172–179, https://doi.org/10.1111/j.1365-3121.2010.00930.x, 2010.
Alfaro, P., Sánchez-Alzola, A., Martin-Rojas, I., García-Tortosa, F. J., Galindo-Zaldívar, J., Avilés, M., Garrido, A. C. L., de Galdeano, C. S., Ruano, P., Martínez-Moreno, F. J., Pedrera, A., Lacy, M. C., Borque, M. J., Medina-Cascales, I., and Gil, A. J.: Geodetic fault slip rates on active faults in the Baza sub-Basin (SE Spain): Insights for seismic hazard assessment, J. Geodyn., 144, 101815, https://doi.org/10.1016/j.jog.2021.101815, 2021.
Aranda, G. and Molina, F.: Wealth and power in the Bronze Age of the South-east of the Iberian Peninsula: the funerary record of Cerro de la Encina, Oxford J. Archaeol., 25, 47–59, https://doi.org/10.1111/j.1468-0092.2006.00248.x, 2006.
Barka, A.: Slip distribution along the North Anatolian Fault associated with the large earthquakes of the period 1939 to 1967, B. Seismol. Soc. Am., 86, 1238–1254, https://doi.org/10.1785/BSSA0860051238, 1996.
Bronk Ramsey, C.: Deposition models for chronological records, Quaternary Sci. Rev., 27, 42–60, https://doi.org/10.1016/j.quascirev.2007.01.019, 2008.
Bronk Ramsey, C.: Bayesian Analysis of Radiocarbon Dates, Radiocarbon, 51, 337–360, https://doi.org/10.1017/S0033822200033865, 2009.
Calvache Quesada, M. L. and Viseras, C.: Consecuencias geomorfológicas derivadas de un proceso de captura fluvial, Geogaceta, 18, 93–96, 1995.
Cámara, J. A., Molina, F., Spanedda, L., and Nájera, T.: Costruzione e perpetuazione delle identità sociali. L'utilizzo del rituale funerario nel sud-est della penisola iberica durante l'età del bronzo antico e medio (2100–1350 cal. A. C., in: Archeologia e antropologia della morte: 3. Costruzione e decostruzione del Sociale, edited by: Nizzo, V., Atti del 3° Incontro Internazionale di Studi di Antropologia e Archeologia a confronto, E. S. S. Editorial Service System, 237–262, http://hdl.handle.net/10481/65940 (last access: 28 June 2024), 2018.
Cámara, J. A. and Molina, F.: El análisis de la ideología de emulación. El caso de El Argar, http://hdl.handle.net/10481/14999 (last access: 28 June 2024), 2009.
Cámara, J. A. and Molina, F. R.: Jerarquización social en el mundo Argárico (2000–1300 aC), http://hdl.handle.net/10234/46733 (last access: 28 June 2024), 2011.
Castro, J., Martin-Rojas, I., Medina-Cascales, I., García-Tortosa, F. J., Alfaro, P., and Insua-Arévalo, J. M.: Active faulting in the central Betic Cordillera (Spain): Palaeoseismological constraint of the surface-rupturing history of the Baza Fault (Central Betic Cordillera, Iberian Peninsula), Tectonophysics, 736, 15–30, https://doi.org/10.1016/j.tecto.2018.04.010, 2018.
Castro, P. V., Chapman, R. W., Gili, S., Lull, V., Micó, R., Rihyete, C., Risch, R., and Sanahuja, M. E.: La sociedad argárica, in: La Edad del Bronce `Primera Edad de Oro de España?', edited by: Gálvez Priego, M., 11–21, http://hdl.handle.net/10481/67785 (last access: 28 June 2024), 2001.
Castro, P. V., Chapman, R. W., Gili Suriñach, S., Lull, V., Micó Pérez, R., Rihuete Herrada, C., Risch, R., and Sanahuja Yll, M. E.: Tiempos sociales de los contextos funerarios argáricos–tiempos sociales de los contextos funerarios argáricos, ANPARQ-Anales de Prehistoria y Arqueología, 9–10, http://revistas.um.es/index.php/apa/article/view/64001 (last access: 28 June 2024), 2009.
Chéry, J., Carretier, S., and Ritz, J.: Postseismic stress transfer explains time clustering of large earthquakes in Mongolia, Earth Planet. Sc. Lett., 194, 277–286, https://doi.org/10.1016/S0012-821X(01)00552-0, 2001.
Corbí, H., Lancis, C., García-García, F., Pina, J., Soria, J. M., Tent-Manclús, J. E., and Viseras, C.: Updating the marine biostratigraphy of the Granada Basin (central Betic Cordillera). Insight for the Late Miocene palaeogeographic evolution of the Atlantic – Mediterranean seaway, Geobios, 45, 249–263, https://doi.org/10.1016/j.geobios.2011.10.006, 2012.
DeMets, C., Gordon, R. G., Argus, D. F., and Stein, S.: Effect of recent revisions to the geomagnetic reversal time scale on estimates of current plate motions, Geophys. Res. Lett., 21, 2191–2194, https://doi.org/10.1029/94GL02118, 1994.
Diaz-Hernandez, J. and Julia, R.: Geochronological position of badlands and geomorphological patterns in the Guadix-Baza Basin (SE Spain), Quaternary Res., 65, 467–477, https://doi.org/10.1016/j.yqres.2006.01.009, 2006.
DuRoss, C. B., Personius, S. F., Crone, A. J., Olig, S. S., and Lund, W. R.: Integration of paleoseismic data from multiple sites to develop an objective earthquake chronology; application to the Weber Segment of the Wasatch fault zone, Utah, B. Seismol. Soc. Am., 101, 2765–2781, https://doi.org/10.1785/0120110102, 2011.
Force, E. R.: Seismic Environments of Prehistoric Settlements in Northern Mesopotamia: A Review of Current Knowledge, B. Am. Sch. Oriental Re., 378, 55–69, https://doi.org/10.5615/bullamerschoorie.378.0055, 2017.
Galindo-Zaldívar, J., González-Lodeiro, F., and Jabaloy, A.: Stress and palaeostress in the Betic-Rif cordilleras (Miocene to the present), Tectonophysics, 227, 105–126, https://doi.org/10.1016/0040-1951(93)90090-7, 1993.
Galindo‐Zaldívar, J., Jabaloy, A., González‐Lodeiro, F., and Aldaya, F.: Crustal structure of the central sector of the Betic Cordillera (SE Spain), Tectonics, 16, 18–37, https://doi.org/10.1029/96TC02359, 1997.
Galindo-Zaldívar, J., Jabaloy, A., Serrano, I., Morales, J., González-Lodeiro, F., and Torcal, F.: Recent and present-day stresses in the Granada Basin (Betic Cordilleras): Example of a late Miocene-present-day extensional basin in a convergent plate boundary, Tectonics, 18, 686–702, https://doi.org/10.1029/1999TC900016, 1999.
Galindo-Zaldívar, J., Gil, A. J., Sanz de Galdeano, C., Lacy, M. C., García-Armenteros, J. A., Ruano, P., Ruiz, A. M., Martínez-Martos, M., and Alfaro, P.: Active pSHAllow extension in central and eastern Betic Cordillera from CGPS data, Tectonophysics, 663, 290–301, https://doi.org/10.1016/j.tecto.2015.08.035, 2015.
García-Aguilar, J. M. and Martín, J. M.: Late Neogene to recent continental history and evolution of the Guadix-Baza basin (SE Spain), Rev. Soc. Geol. Esp., 13, 65–77, 2000.
García-Aguilar, J. M. and Palmqvist, P.: A model of lacustrine sedimentation for the Early Pleistocene deposits of Guadix-Baza basin (southeast Spain), Quatern. Int., 243, 3–15, https://doi.org/10.1016/j.quaint.2011.02.008, 2011.
García-Tortosa, F. J., Alfaro, P., Galindo-Zaldívar, J., Gibert, L., López-Garrido, A. C., Sanz de Galdeano, C., and Ureña, M.: Geomorphologic evidence of the active Baza Fault (Betic Cordillera, South Spain), Geomorphology, 97, 374–391, https://doi.org/10.1016/j.geomorph.2007.08.007, 2008.
García-Tortosa, F. J., Alfaro, P., Sanz de Galdeano, C., and Galindo-Zaldívar, J.: Glacis geometry as a geomorphic marker of recent tectonics: The Guadix-Baza basin (South Spain), Geomorphology (Amsterdam, Netherlands), 125, 517–529, https://doi.org/10.1016/j.geomorph.2010.10.021, 2011.
Geli, L., Bard, P.-Y. and Jullien, B.: The effect of topography on earthquake ground motion; a review and new results, B. Seismol. Soc. Am., 78, 42–63, https://doi.org/10.1785/bssa0780010042, 1988.
Gibert, L., Scott, G., Martin, R., and Gibert, J.: The Early to Middle Pleistocene boundary in the Baza Basin (Spain), Quaternary Sci. Rev., 26, 2067–2089, https://doi.org/10.1016/j.quascirev.2007.06.012, 2007a.
Gibert, L., Ortí, F., and Rosell, L.: Plio-Pleistocene lacustrine evaporites of the Baza Basin (Betic Chain, SE Spain), Sediment. Geol., 200, 89–116, https://doi.org/10.1016/j.sedgeo.2007.03.003, 2007b.
Gibert, L., Alfaro, P., García-Tortosa, F. J., and Scott, G.: Superposed deformed beds produced by single earthquakes (Tecopa Basin, California): Insights into paleoseismology, Sediment. Geol., 235, 148–159, https://doi.org/10.1016/j.sedgeo.2010.08.003, 2011.
Gil, A. J., Galindo-Zaldívar, J., Sanz de Galdeano, C., Borque, M. J., Sánchez-Alzola, A., Martinez-Martos, M., and Alfaro, P.: The Padul normal fault activity constrained by GPS data: Brittle extension orthogonal to folding in the central Betic Cordillera, Tectonophysics, 712–713, 64–71, https://doi.org/10.1016/j.tecto.2017.05.008, 2017.
Green, R. A. and Bommer, J. J.: What is the smallest earthquake magnitude that needs to be considered in assessing liquefaction hazard?, Earthq. Spectra, 35, 1441–1464, https://doi.org/10.1193/032218EQS064M, 2019.
Haberland, C., Giber, L., Jurado, M., Stiller, M., Baumann-Wilke, M., Scott, G., and Mertz, D. F.: Architecture and tectono-stratigraphic evolution of the intramontane Baza Basin (Betics, SE-Spain): constraints from seismic imaging, Tectonophysics, 709, 69–84, https://doi.org/10.1016/j.tecto.2017.03.022, 2017.
Hernández Pérez, M. S., Barciela González, V., and García Atiénzar, G.: Cabezo redondo (Primera edición ed.), Universidad de Alicante, http://hdl.handle.net/10045/60472 (last access: 28 June 2024), 2016.
Herraiz, M., De Vicente, G., Lindo-Ñaupari, R., Giner, J., Simón, J. L., González-Casado, J. M., Vadillo, O., Rodríguez-Pascua, M. A., Cicuéndez, J. I., Casas, A., Cabañas, L., Rincón, P., Cortés, A. L., Ramírez, M., and Lucini, M.: The recent (upper Miocene to Quaternary) and present tectonic stress distributions in the Iberian Peninsula, Tectonics, 19, 762–786, https://doi.org/10.1029/2000TC900006, 2000.
Klinger, Y., Xu Xiwei, X. X., Tapponnier, P., van der Woerd, J., Lasserre, C., and King, G.: High-resolution satellite imagery mapping of the surface rupture and slip distribution of the Mw ∼ 7.8, 14 November 2001 Kokoxili earthquake, Kunlun Fault, Northern Tibet, China, B. Seismol. Soc. Am., 95, 1970–1987, https://doi.org/10.1785/0120040233, 2005.
Leonard, M.: Earthquake fault scaling; self-consistent relating of rupture length, width, average displacement, and moment release, B. Seismol. Soc. Am., 100, 1971–1988, https://doi.org/10.1785/0120090189, 2010.
Lozano, L., Cantavella, J. V., Gaite, B., Ruiz-Barajas, S., Antón, R., and Barco, J.: Seismic analysis of the 2020–2021 Santa Fe seismic sequence in the Granada Basin, Spain; relocations and focal mechanisms, Seismol. Res. Lett., 93, 3246–3265, https://doi.org/10.1785/0220220097, 2022.
Lull, V., Micó, R., Rihuete, C., and Risch, R.: Political collapse and social change at the end of El Argar, in: 1600 – Kultureller Umbruch im Schatten des Thera-Ausbruchs?, edited by: Meller, H., Bertemes, F., Bork, H. R., and Risch, R., Landesmuseum für Vorgeschichte, 283–302, 2013.
Madarieta-Txurruka, A., Galindo-Zaldívar, J., González-Castillo, L., Peláez, J. A., Ruiz-Armenteros, A. M., Henares, J., Garrido-Carretero, M. S., Avilés, M., and Gil, A. J.: High- and Low-Angle Normal Fault Activity in a Collisional Orogen: The Northeastern Granada Basin (Betic Cordillera), Tectonics, 40, e2021TC006715, https://doi.org/10.1029/2021TC006715, 2021.
Madarieta-Txurruka, A., González-Castillo, L., Peláez, J. A., Catalán, M., Henares, J., Gil, A. J., Lamas-Fernández, F., and Galindo-Zaldívar, J.: The Role of Faults as Barriers in Confined Seismic Sequences: 2021 Seismicity in the Granada Basin (Betic Cordillera), Tectonics, 41, e2022TC007481, https://doi.org/10.1029/2022TC007481, 2022.
Marco, S., Rockwell, T. K., Heimann, A., Frieslander, U., and Agnon, A.: Late Holocene activity of the Dead Sea Transform revealed in 3D palaeoseismic trenches on the Jordan Gorge segment, Earth Planet. Sc. Lett., 234, 189–205, https://doi.org/10.1016/j.epsl.2005.01.017, 2005.
Martin-Rojas, I., Alfaro, P., Galindo-Zaldivar, J., Borque-Arancón, M. J., García-Tortosa, F. J., Sanz de Galdeano, C., Avilés, M., Sánchez-Alzola, A., González-Castillo, L., Ruano, P., Medina-Cascales, I., Tendero-Salmerón, V., Madarieta-Txurruka, A., Pedrosa-González, M. T., and Gil-Cruz, A. J.: Insights of Active Extension Within a Collisional Orogen From GNSS (Central Betic Cordillera, S Spain), Tectonics, 42, e2022TC007723, https://doi.org/10.1029/2022TC007723, 2023.
Martínez-Martínez, J. M., Booth-Rea, G., Azañón, J. M., and Torcal, F.: Active transfer fault zone linking a segmented extensional system (Betics, southern Spain): Insight into heterogeneous extension driven by edge delamination, Tectonophysics, 422, 159–173, https://doi.org/10.1016/j.tecto.2006.06.001, 2006.
Martínez-Solares, J. M. and Mezcua, J.: Catálogo sísmico de la Península Ibérica, Instituto Geográfico Nacional, Madrid, Spain, 2002.
Mastrolorenzo, G., Petrone, P., Pappalardo, L., and Sheridan, M. F.: The Avellino 3780-yr-B. P. Catastrophe as a Worst-Case Scenario for a Future Eruption at Vesuvius, P. Natl. Acad. Sci. USA, 103, 4366–4370, https://doi.org/10.1073/pnas.0508697103, 2006.
Medina-Cascales, I., Koch, L., Cardozo, N., Martin-Rojas, I., Alfaro, P., and García-Tortosa, F. J.: 3D geometry and architecture of a normal fault zone in poorly lithified sediments: A trench study on a strand of the Baza Fault, central Betic Cordillera, south Spain, J. Struct. Geol., 121, 25–45, https://doi.org/10.1016/j.jsg.2019.02.003, 2019.
Medina-Cascales, I., Martin-Rojas, I., García-Tortosa, F. J., Peláez, J. A., and Alfaro, P.: Geometry and kinematics of the Baza Fault (central Betic Cordillera, South Spain): insights into its seismic potential, Geol. Acta, 18, 1–25, https://doi.org/10.1344/GeologicaActa2020.18.11, 2020.
Medina-Cascales, I., García-Tortosa, F. J., Martin-Rojas, I., Pérez-Peña, J. V., and Alfaro, P.: Tectonic geomorphology of an active slow-moving, intrabasinal fault: The Galera Fault (Guadix-Baza Basin, central Betic Cordillera, southern Spain), Geomorphology, 393, 107941, https://doi.org/10.1016/j.geomorph.2021.107941, 2021.
Molina, F.: La Prehistoria, in: Historia de Granada I. De las primeras culturas al Islam, edited by: Molina, F. and Roldán, J. M., Don Quijote, 11–131, 1983.
Molina, F. and Cámara, J. A.: La Cultura del Argar en el área occidental del Sudeste, in: La Edad del Bronce en tierras valencianas y zonas limítrofes, edited by: Hernández, L. and Hernández, M. S., Ayuntamiento de Villena/Instituto Alicantino de Cultura Juan Gil-Albert, 455–470, https://rua.ua.es/dspace/bitstream/10045/9042/1/Lucentum_Anejo_1985_06.pdf (last access: 28 June 2024), 2004.
Molina, F.: Definición y sistematización del Bronce Tardío y Final en el Sudeste de la Península Ibérica, Cuadernos de prehistoria de la Universidad de Granada, 3, 159–232, https://search.proquest.com/docview/1303720145 (last access: 28 June 2024), 1978.
Molina, F., Cámara, J. A., Afonso, J. A., and Nájera, T.: Las sepulturas del Cerro de la Virgen (Orce, Granada). Diferencias cronológicas y sociales, RAMPAS-Revista Atlántica-Mediterránea de Prehistoria y Arqueología Social, 16, 121–142, https://doi.org/10.25267/Rev_atl-mediterr_prehist_arqueol_soc.2014.v16.13, 2014.
Molina, F., Cámara, J. A., Delgado, A., Jiménez, S. A., Nájera, T., Riquelme, J. A., and Spanedda, L.: Problemas cronológicos y análisis de dieta en la Edad del Bronce de los Altiplanos granadinos: El caso del Cerro de la Virgen (Orce, Granada, España), Museo de Prehistoria de Valencia, http://hdl.handle.net/10481/48129 (last access: 28 June 2024), 2016.
Molina, F., Cámara, J. A., Dorado, A., and Villarroya, M.: El fenómeno campaniforme en el Sudeste de la Península Ibérica: el caso del Cerro de la Virgen (Orce, Granada), in: Sinos e Taças. Junto ao Oceano e mais longe. Aspectos da presença campaniforme na Península Ibérica, edited by: Gonçalves, V. S., Lisboa: Universidade do Lisboa, 258–275, http://hdl.handle.net/10481/49777 (last access: 28 June 2024), 2017.
Molina, F., Pérez, C., Spanedda, L., and Cámara, J. A.: Una nueva lectura de las fortificaciones calcolíticas del Cero de la Virgen (Orce, Granada, España), Ophiussa, 2, 25–37, http://hdl.handle.net/10481/57581 (last access: 28 June 2024), 2018.
Morales, J., Serrano, I., Vidal, F., and Torcal, F.: The depth of the earthquake activity in the Central Betics (Southern Spain), Geophys. Res. Lett., 24, 3289–3292, https://doi.org/10.1029/97GL03306, 1997.
Moretti, M., Alfaro, P., Caselles, O., and Canas, J. A.: Modelling seismites with a digital pSHAking table, Tectonophysics, 304, 369–383, https://doi.org/10.1016/S0040-1951(98)00289-3, 1999.
Muñoz D. and Udías A.: Three large historical earthquakes in Southern Spain, in: Seismicity, Seismotectonics and Seismic Risk of the Ibero-Maghrebian Region, Monografia n. 8, edited by: Mezcua, J. and Udías, A., Instituto Geográfico Nacional, Madrid, 175–182, 1991.
Nocquet, J.: Present-day kinematics of the Mediterranean: A comprehensive overview of GPS results, Tectonophysics, 579, 220–242, https://doi.org/10.1016/j.tecto.2012.03.037, 2012.
Nur, A. and Cline, E. H.: Poseidon's Horses: Plate Tectonics and Earthquake Storms in the Late Bronze Age Aegean and Eastern Mediterranean, J. Archaeol. Sci., 27, 43–63, https://doi.org/10.1006/jasc.1999.0431, 2000.
Okada, Y.: Surface deformation due to shear and tensile faults in a half-space, B. Seismol. Soc. Am., 75, 1135–1154, https://doi.org/10.1785/BSSA0750041135, 1985.
Okada, Y.: Internal deformation due to shear and tensile faults in a half-space, B. Seismol. Soc. Am., 82, 1018–1040, https://doi.org/10.1785/BSSA0820021018, 1992.
Oswald, P., Strasser, M., Hammerl, C., and Moernaut, J.: Seismic control of large prehistoric rockslides in the Eastern Alps, Nat. Commun., 12, 1059, https://doi.org/10.1038/s41467-021-21327-9, 2021.
Owen, G.: Deformation processes in unconsolidated sands, in: Deformation of Sediments and Sedimentary Rocks, edited by: Jones, M. E. and Preston, R. M. F., Geological Society of London, Special Publication, 29, 11–24, 1987.
Pace, B., Visini, F., and Peruzza, L.: FiSH; MATLAB tools to turn fault data into seismic-hazard models, Seismol. Res. Lett., 87, 374–386, https://doi.org/10.1785/0220150189, 2016.
Pedrera, A., Marin-Lechado, C., Galindo-Zaldivar, J., Rodriguez-Fernandez, L. R., and Ruiz-Constan, A.: Fault and fold interaction during the development of the Neogene-Quaternary Almeria-Nijar basin (SE Betic Cordilleras), Geol. Soc. Spec. Publ., 262, 217–230, https://doi.org/10.1144/GSL.SP.2006.262.01.13, 2006.
Peña, J. A.: La depresión de Guadix-Baza – La depresión de Guadix-Baza, Estudios Geológicos, 41, 33–46, https://doi.org/10.3989/egeol.85411-2688, 1985.
Pérez-Peña, A., Martín-Davila, J., Gárate, J., Berrocoso, M., and Buforn, E.: Velocity field and tectonic strain in Southern Spain and surrounding areas derived from GPS episodic measurements, J. Geodyn., 49, 232–240, https://doi.org/10.1016/j.jog.2010.01.015, 2010.
Reicherter, K., Jabaloy, A., Galindo-Zaldívar, J., Ruano, P., Becker-Heidmann, P., Morales, J., Reiss, S., and González-Lodeiro, F.: Repeated palaeoseismic activity of the Ventas de Zafarraya fault (S Spain) and its relation with the 1884 Andalusian earthquake, Int. J. Earth Sci. (Geol. Rundsch.), 92, 912–922, https://doi.org/10.1007/s00531-003-0366-3, 2003.
Reimer, P. J., Austin, W. E. N., Bard, E., Bayliss, A., Blackwell, P. G., Bronk Ramsey, C., Butzin, M., Cheng, H., Edwards, R. L., Friedrich, M., Grootes, P. M., Guilderson, T. P., Hajdas, I., Heaton, T. J., Hogg, A. G., Hughen, K. A., Kromer, B., Manning, S. W., Muscheler, R., Palmer, J. G., Pearson, C., van der Plicht, J., Reimer, R. W., Richards,D. A., Scott, E. M., Southon, J. R., Turney, C. S. M., Wacker, L., Adolphi, F., Büntgen, U., Capano, M., Fahrni, S. M., Fogtmann-Schulz, A., Friedrich, R., Köhler, P., Kudsk, S., Miyake, F., Olsen, J., Reinig, F., Sakamoto, M., Sookdeo, A., and Talamo, S.: The IntCal20 Northern Hemisphere Radiocarbon Age Calibration Curve (0–55 cal kBP), Radiocarbon, 62, 725–757, https://doi.org/10.1017/RDC.2020.41, 2020.
Risch, R. and Meller, H.: Change and Continuity in Europe and the Mediterranean around 1600 bc, P. Prehist. Soc., 81, 239–264, https://doi.org/10.1017/ppr.2015.10, 2015.
Rockwell, T. K., Dawson, T. E., Young Ben-Horin, J., and Seitz, G.: A 21-Event, 4,000-Year History of Surface Ruptures in the Anza Seismic Gap, San Jacinto Fault, and Implications for Long-term Earthquake Production on a Major Plate Boundary Fault, Pure Appl. Geophys., 172, 1143–1165, https://doi.org/10.1007/s00024-014-0955-z, 2015.
Rodríguez-Fernández, J. and Sanz de Galdeano, C.: Late orogenic intramontane basin development: the Granada basin, Betics (southern Spain), Basin Res., 18, 85–102, https://doi.org/10.1111/j.1365-2117.2006.00284.x, 2006.
Ruano, P., Galindo-Zaldívar, J., and Jabaloy, A.: Recent Tectonic Structures in a Transect of the Central Betic Cordillera, Pure Appl. Geophys., 161, 541–563, https://doi.org/10.1007/s00024-003-2462-5, 2006.
Sanz de Galdeano, C. and Alfaro, P.: Tectonic significance of the present relief of the Betic Cordillera, Geomorphology, 63, 175–190, https://doi.org/10.1016/j.geomorph.2004.04.002, 2004.
Sanz de Galdeano, C. and Vera, J. A.: Stratigraphic record and palaeogeographical context of the Neogene basins in the Betic Cordillera, Spain, Basin Res., 4, 21–36, https://doi.org/10.1111/j.1365-2117.1992.tb00040.x, 1992.
Sanz de Galdeano, C., Peláez Montilla, J. A., and López Casado, C.: Seismic Potential of the Main Active Faults in the Granada Basin (Southern Spain), Pure Appl. Geophys., 160, 1537–1556, https://doi.org/10.1007/s00024-003-2359-3, 2003.
Sanz de Galdeano, C., García-Tortosa, F. J., Peláez, J. A., Alfaro, P., Azañón, J. M., Galindo-Zaldívar, J., López Casado, C., López Garrido, A. C., Rodríguez-Fernández, J., and Ruano, P.: Main active faults in the Granada and Guadix-Baza Basins (Betic Cordillera), J. Iber. Geol., 38, 209, https://doi.org/10.5209/rev_JIGE.2012.v38.n1.39215, 2012.
Sanz de Galdeano, C., Azañón, J. M., Cabral, J., Ruano, P., Alfaro, P., Canora, C., Ferrater, M., García Tortosa, F. J., García-Mayordomo, J., Gràcia, E., Insua-Arévalo, J. M., Jiménez Bonilla, A., Lacan, P. G., Marín-Lechado, C., Martín-Banda, R., Martín González, F., Martínez-Díaz, J. J., Martin-Rojas, I., Masana, E., . . . Simón, J. L.: Active Faults in Iberia, in: The Geology of Iberia: A Geodynamic Approach: Volume 5: Active Processes: Seismicity, Active Faulting and Relief, edited by: Quesada, C. and Oliveira, J. T., Springer International Publishing, 33–75, https://doi.org/10.1007/978-3-030-10931-8_4, 2020.
Schubart, H., Pingel, V., and Arteaga, O.: Fuente Álamo. Las excavaciones arqueológicas 1977–1991 en el poblado de la Edad de Bronce, Junta de Andalucía, 2000.
Schüle, W.: Orce und Galera. Zwei Siedlungen aus dem 3. bis 1. Jahrtausend v. Chr. im Südosten der Iberischen Halbinsel. I. Übersicht über die Ausgrabungen 1962–1970 (Book Review), Schwabe and Co., Basel, https://search.proquest.com/docview/1308882337 (last access: 28 June 2024), 1980.
Scott, G. R. and Gibert, L.: The oldest hand-axes in Europe, Nature, 461, 82–85, https://doi.org/10.1038/nature08214, 2009.
Serpelloni, E., Vannucci, G., Pondrelli, S., Argnani, A., Casula, G., Anzidei, M., Baldi, P., and Gasperini, P.: Kinematics of the Western Africa-Eurasia plate boundary from focal mechanisms and GPS data, Geophys. J. Int., 169, 1180–1200, https://doi.org/10.1111/j.1365-246X.2007.03367.x, 2007.
Silva, P. G., Rodríguez Pascua, M. A., Giner Robles, J. L., Pérez López, R., Lario Gómez, J., Perucha Atienza, M. A., Bardají Azcárate, T., Huerta Hurtado, P., Roquero García- Casal, E., and Bautista Davila, M. B.: Catálogo de los efectos geológicos de los terremotos en España, IGME, AEQUA, https://dialnet.unirioja.es/servlet/libro?codigo=765771&orden=0&info=open_link_libro (last access: 28 June 2024), 2014.
Sims, J. D.: Determining earthquake recurrence intervals from deformational structures in young lacustrine sediments, Tectonophysics, 29, 141–152, https://doi.org/10.1016/0040-1951(75)90139-0, 1975.
Soria, F. J., Lopez-Garrido, A. C., and Vera, J. A.: Análisis estratigráfico y sedimentológico de los depósitos neógeno-cuaternarios en el sector de Orce, depresión de Guadix-Baza, Paleontol. Evol. Mem. Esp., 1, 11–34, 1987.
Soria, J. M., Fernández, J., and Viseras, C.: Late Miocene stratigraphy and palaeogeographic evolution of the intramontane Guadix Basin (Central Betic Cordillera, Spain): implications for an Atlantic–Mediterranean connection, Palaeogeogr. Palaeocl., 151, 255–266, https://doi.org/10.1016/S0031-0182(99)00019-X, 1999.
Toda, S., Stein, R., Sevilgen, V., and Lin, J.: Coulomb 3.3 Graphic-rich deformation and stress-change software for earthquake, tectonic, and volcano research and teaching-user guide, Aquatic Science and Fisheries Abstracts (ASFA) Professional, https://pubs.usgs.gov/of/2011/1060/of2011-1060.pdf (last access: 28 June 2024), 2011.
Tuttle, M., Hartleb, R., Wolf, L., and Mayne, P.: Paleoliquefaction Studies and the Evaluation of Seismic Hazard, Geosciences, 9, 311, https://doi.org/10.3390/geosciences9070311, 2019.
University of Oxford: OxCal, https://c14.arch.ox.ac.uk/oxcal.html (last access: 28 June 2024), 2024.
Vera, J. A.: Estudio estratigráfico de la Depresión de Guadix-Baza, Bol. Geol. Min., 81, 429–462, 1970.
Vera, J. A., Fernandez, J., Lopez-Garrido, A. C., and Rodriguez-Fernandez, J.: Geologìa y estratigrafìa de los materìales plioceno-pleistoceno del sector Orde-Venta Micena, Prov. Granada, Paleontol. Evol., 18, 3–11, 1983.
Von Suchodoletz, H., Kirkitadze, G., Koff, T., Fischer, M. L., Poch, R. M., Khosravichenar, A., Schneider, B., Glaser, B., Lindauer, S., Hoth, S., Skokan, A., Navrozashvili, L., Lobjanidze, M., Akhalaia, M., Losaberidze, L., and Elashvili, M.: Human-environmental interactions and seismic activity in a Late Bronze to Early Iron Age settlement center in the southeastern Caucasus, Front. Earth Sci., 10, 964188, https://doi.org/10.3389/feart.2022.964188, 2022.
Walker, J., Gaffney, V., Fitch, S., Muru, M., Fraser, A., Bates, M., and Bates, R.: A great wave: the Storegga tsunami and the end of Doggerland?, Antiquity, 94, 1409–1425, https://doi.org/10.15184/aqy.2020.49, 2020.
Wells, D. L. and Coppersmith, K. J.: New empirical relationships among magnitude, rupture length, rupture width, rupture area, and surface displacement, B. Seismol. Soc. Am., 84, 974–1002, https://doi.org/10.1785/BSSA0840040974, 1994.
Yazdi, P., García‐Mayordomo, J., Álvarez‐Gómez, J. A., Gaspar‐Escribano, J. M., and Masana, E.: Exploring the Connection of XVI‐Century Major Historical Earthquakes in the Eastern Betic Cordillera, Spain: Insights From Viscoelastic Relaxation of the Lithosphere, Tectonics, 42, e2023TC007917, https://doi.org/10.1029/2023TC007917, 2023.