the Creative Commons Attribution 4.0 License.
the Creative Commons Attribution 4.0 License.
 | 26 May 2025
Reflection seismic imaging across the Thinia valley (Greece)
Alireza Malehmir
Haralambos Kranis
George Apostolopoulos
Myrto Papadopoulou
Kefalonia island, in front of the Greek west coast, is located in a peculiar tectonic setting characterized by a transition from an oceanic subduction contact to a continental collision. This tectonic setting makes the island a test bed for geological, geophysical, and archaeological studies. To improve the subsurface knowledge and shed light in the top hundreds of metres, we acquired three seismic profiles in the isthmus connecting the main part of the island to the Paliki peninsula, in the Thinia valley, where the presence of a possible channel has been disputed. A total of approximately 3.5 km of seismic data were acquired using a 5 m receiver and shot spacing and a 25 kg accelerated weight drop as the main source. The sharp topographic changes and morphological features of the valley made the survey challenging, limiting the spread, precluding uniform shot points, and resulting in crooked profiles. The acquired data, however, show visible reflections with variable quality down to 0.5 s and occasionally to 1 s. First-break travel time tomography and 3D reflection travel time modelling were performed to complement the seismic reflection processing work together with lithological columns from three boreholes located along the profiles. Results show a low-velocity zone with no reflectivity from the surface to approximately 100 m depth probably related to the presence of loose material, under which two main east-dipping reflections are imaged. Considering the surface geology and tectonic history of the valley, we interpret these reflections as the same lithological boundary displaced by three highly east-dipping thrust/reverse faults probably part of the Hellenide thrusts. These findings further constrain the contentious presence of a historic water channel in the valley.
- Article
(9595 KB) - Full-text XML
- BibTeX
- EndNote


Kefalonia is the largest of the Ionian islands. It is located across the Greek west coast, between Italy and the mainland of Greece. The island is one of the most seismically active locations in the world given its position on the boundary between the African and Eurasian plates, where the border switches from an oceanic subduction contact to a continental collision. The result of this transition is a dextral strike-slip fault system called the Kefalonia Transform Fault Zone (KTFZ), parallel to the western coast of the north-western peninsula of Paliki (Fig. 1) and mainly responsible for the strong seismicity in the region. Strong earthquakes, up to M 7.0, have historically been reported with a recent pair of strong events of M 6.1 in 2014 and an average of more than one M 6.5 earthquakes every 10 years (Karakostas et al., 2015, 2010; Lekkas and Mavroulis, 2016; Özbakır et al., 2020); the island thus is an ideal laboratory for seismological studies.
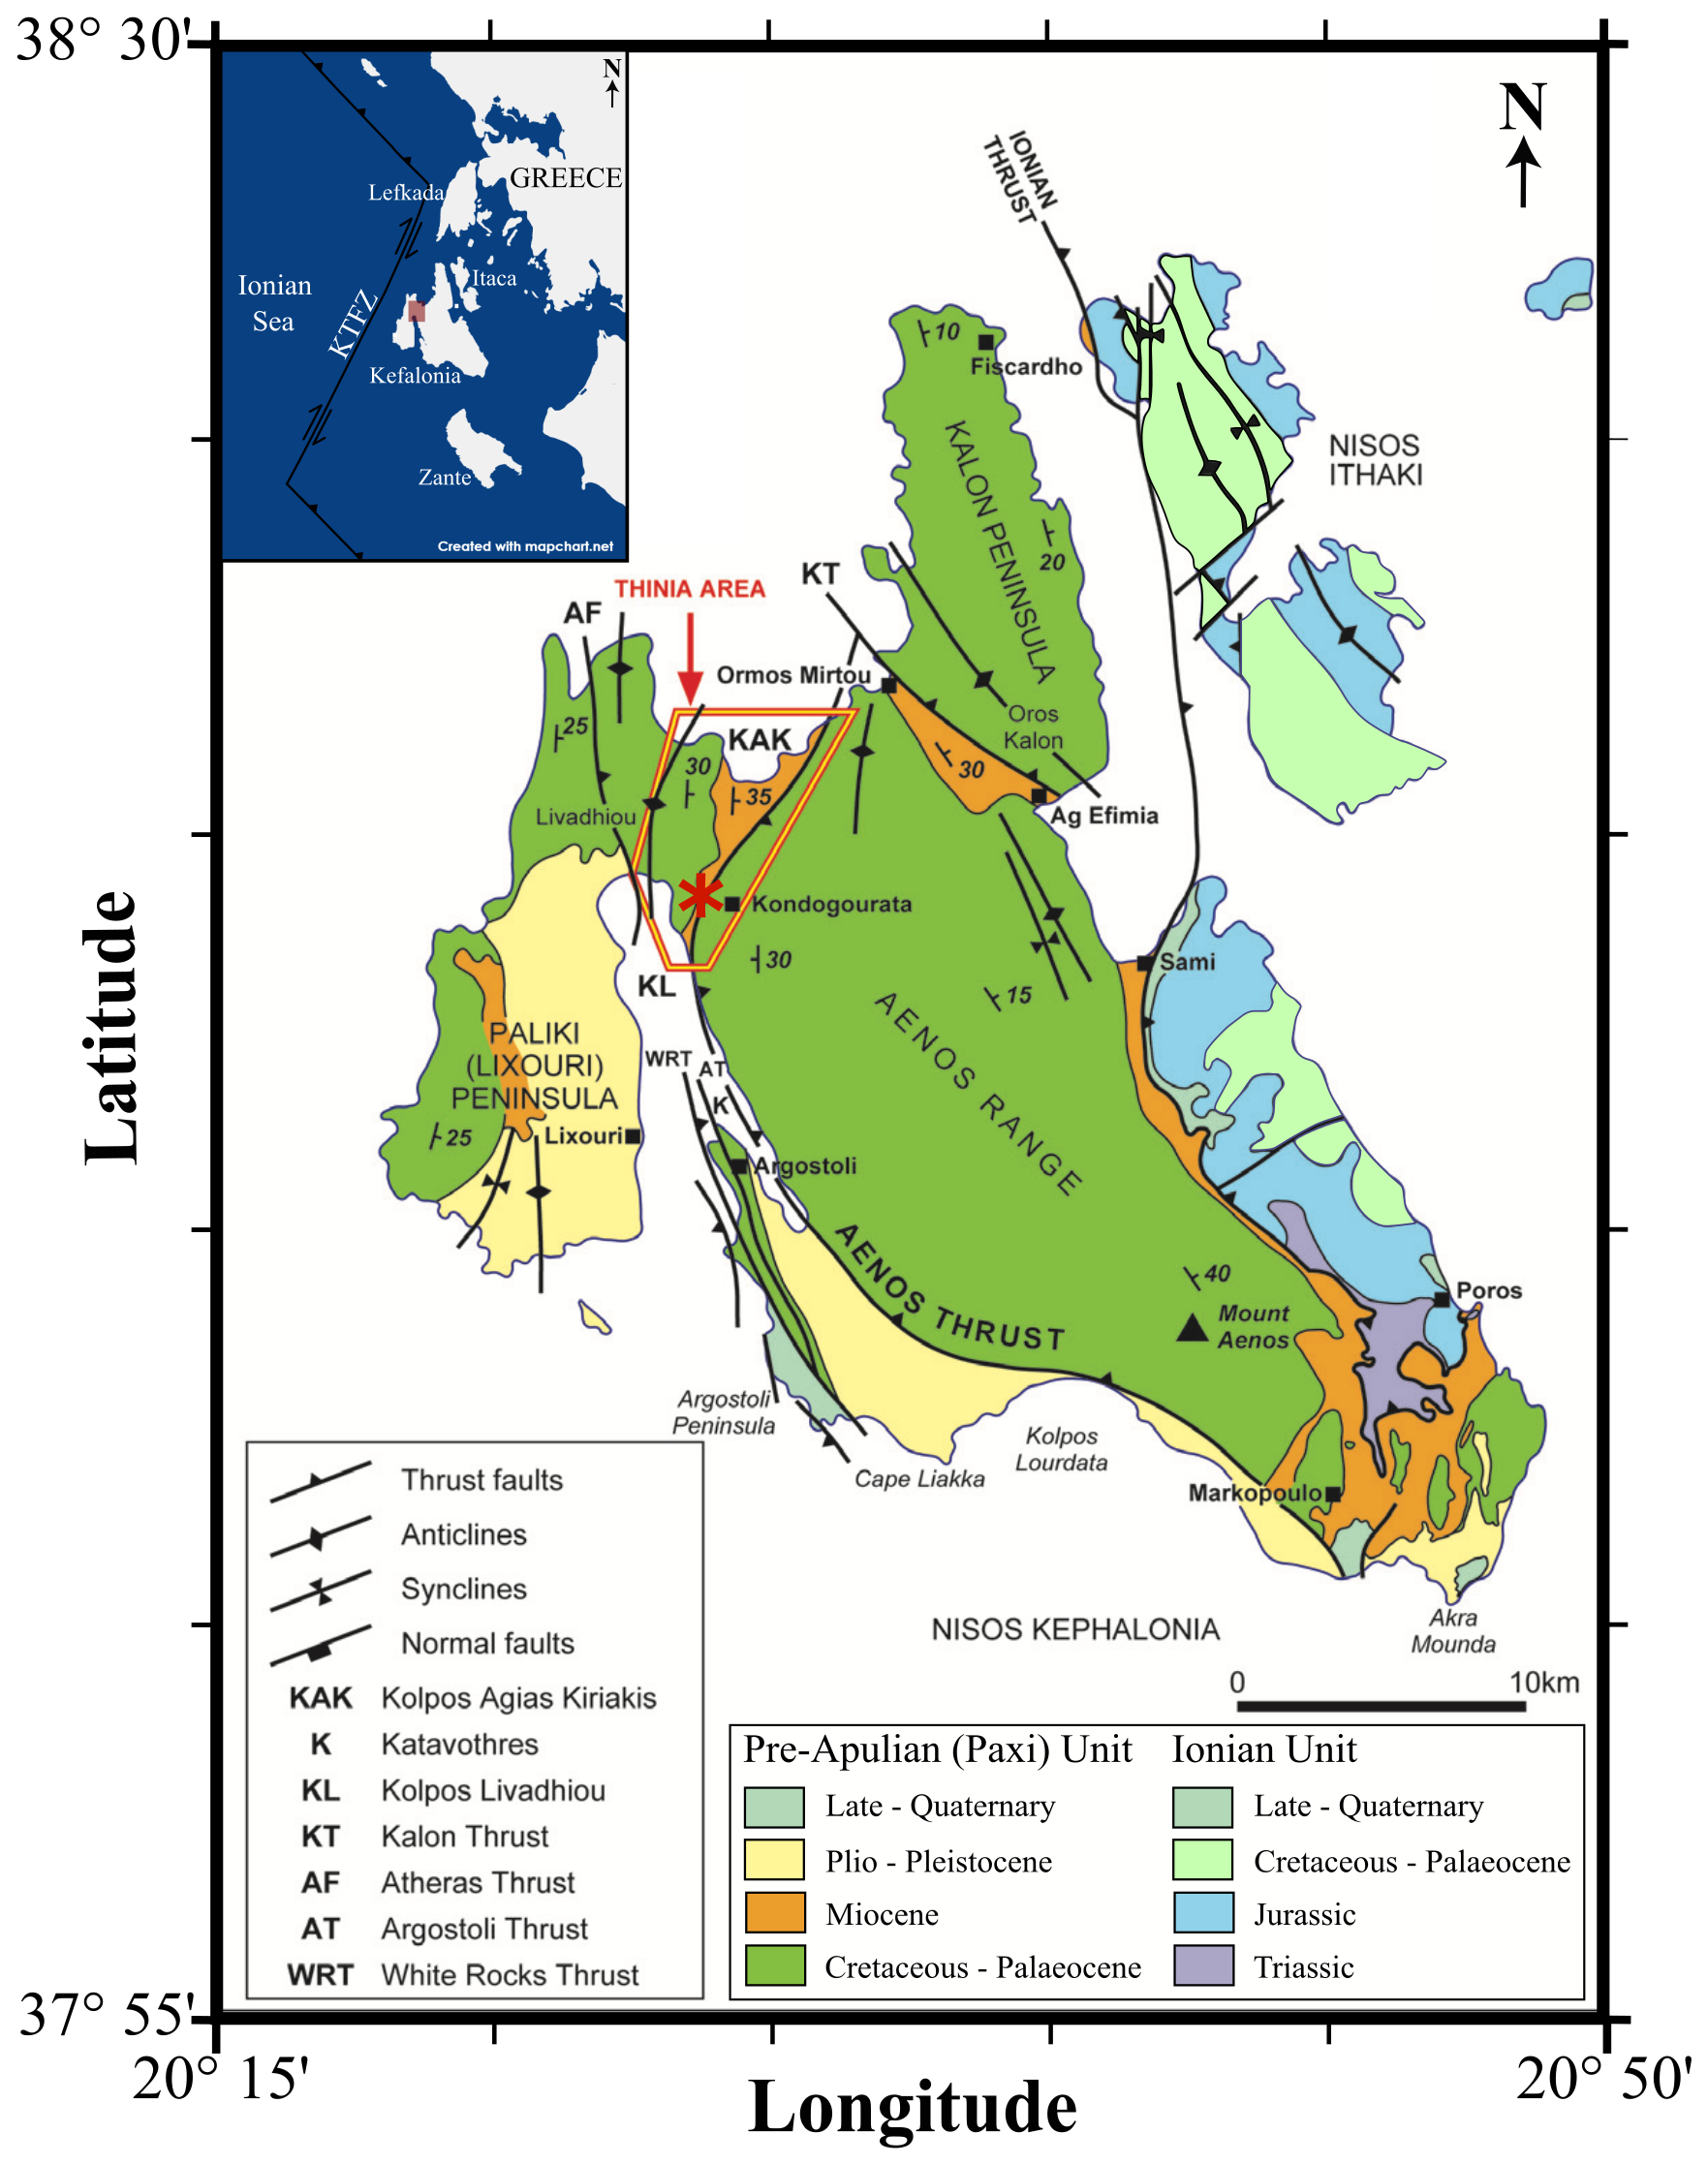
Figure 1Geological map showing the main tectonic features of Kefalonia island and the location of the survey (red asterisk) within the marked polygon (adapted from Underhill, 2006).
This geological setting and significant tectonic activity in the island have attracted international research interest, and a number of geological and geophysical studies have been conducted (Cushing et al., 2020; Gaki-Papanastassiou et al., 2010; Hunter, 2013; Sbaa et al., 2017; Stiros et al., 1994; Underhill, 1989). Analyses of the island's displacements from the observed seismicity have shown complex horizontal motion that suggests two separate crustal blocks in the island – the main island with a displacement towards the south-west and the Paliki peninsula with a displacement towards the north (Ganas et al., 2015). In addition, an unclear history of rotational movements characterized the island with both clockwise and anticlockwise rotational phases (Duermeijer et al., 2000; Sbaa et al., 2017). Geomorphological studies indicate that the evolution of the landscape has been controlled by neotectonics processes and eustatism (Karymbalis et al., 2013) and that during the Quaternary period there has been an average of 0.17 mm yr−1 long-term uplift (Gaki-Papanastassiou et al., 2010) with 1.4 ± 0.35 mm yr−1 uplift in the past 61 ± 5.5 thousand years (Tsanakas et al., 2022). Regarding the subsurface geology, offshore seismic surveys have shown anticline–syncline structures as well as a series of faults and tectonic boundaries (Hunter, 2013). The possibility of earthquake-triggered landslides which have contributed in the landscape evolution over the past few thousand years has been suggested by several onshore and offshore geophysical surveys (e.g. ERT and gravimetry; Hunter, 2013) with a focus on near-surface site characterization. These methods have also contributed to archaeological studies, some of them addressing whether a water channel was present across the north-west part of the island, along the Thinia valley (Fig. 1), as part of ongoing investigations for the possible location of Homer's Ithaca (Bittlestone et al., 2005; Gaki-Papanastassiou et al., 2011; Poulter et al., 2012; Underhill, 2009). More in detail, near-surface studies of the Thinia valley comprehend airborne gravity and resistivity measurements, as well as ground-based gravity, resistivity, and refraction seismic acquisitions. The airborne results show strong contrasts between the valley and the surrounding limestones, while the ground-based acquisition results show mostly loose material bounded by limestones in the near-surface (Hunter, 2013).
These studies partly constrain the geology of the Thinia valley at shallow depths, up to 50–100 m from the surface depending on the method, but do not constrain the relation between the bedrock and the loose material. Deeper portions, especially at depths deeper than the sea level, have not yet been studied onshore and across this speculated former water channel. To better understand the deeper tectonic history of the area and the structural relationship between the tectonic structures and the overburden loose material, a high-resolution seismic survey was performed along the central part of the Thinia valley (red asterisk in Fig. 1). The survey was designed to address the complex morphology and expected geological complexity of the area, and its results are presented in this study with the main goals of (1) showing the potential of the method in similar environments with possible further developments and (2) understanding the subsurface geology to distances below the current sea level. We use reflection seismic imaging and first-break travel time tomography to provide information down to 500 m depth and shed light on the subsurface geology of the area. The difficult environment and short profile acquisition, dictated by the extreme topography, influenced the final quality of the seismic data, but the applied processing was successful in enhancing different subsurface structures. Finally, an in-depth interpretation is proposed in accordance with the surface geology.
Kefalonia covers an area of 773 km2, and it is mostly mountainous, with steep coasts and a maximum elevation of 1628 m. On its western side, the island is split by the Argostoli gulf, forming the Paliki peninsula on the west side of the gulf with a connecting isthmus on its northern side (Fig. 1). This isthmus, the Thinia valley, is approximately 6 km long and 2 km wide (Underhill, 2009) and is the focus of this study. The Thinia valley is bounded on the north by Myrtos bay, on the south by the gulf of Livadi, on the west by the Paliki peninsula, and to the east by the main Kefalonia island. The valley is located at an elevation of around 200 m above sea level (m a.s.l.), with steep flanks reaching up to 500 m a.s.l. on the western side and 900 m a.s.l. on its eastern side.
The geological setting of Kefalonia is dominated by the Pre-Apulian (or Paxi) unit and partly by the Ionian unit; the latter crops out in the Poros town area and in the eastern coast of the island and is thrusted upon the former, through an east-dipping major thrust. The Pre-Apulian unit on Kefalonia consists of Late Cretaceous and Palaeogene limestones, followed by Late Oligocene to Miocene clastics, which include conglomerates and sandy marls. The whole stratigraphic sequence is intensely deformed, featuring kilometre-scale folding and related internal thrusts (Fig. 1). Quaternary marine terraces, which are present up to 400 m of elevation, reveal a long-term uplift of the area (Gaki-Papanastassiou et al., 2010, 2011).
The Thinia valley is surrounded by Late Cretaceous limestones on the east and west flanks, which are strongly deformed, presenting various dipping directions, consistent with major successive anticlines and synclines (Underhill, 1989). The Eocene–Oligocene limestones and Miocene clastics crop out in the central part of the valley, locally covered by alluvial deposits, scree, rockfall, and landslide material, especially along its eastern margin (IGME, 1985).
This plethora of geological and structural features suggest the intense tectonic activity of the area which, according to the relative 1:50 000 geological map from the Greek Institute of Geology and Mineral Exploration (IGME, 1985), is characterized by several fault systems, with varying strikes and dips. However, most faults that affect the carbonates of the Paxi unit in the mountainous part of Kefalonia are interpreted lineaments from aerial imagery, without any information on their geometric or kinematic characters. In a 1989 study, only the main NNE–SSW thrust structures dipping to the east are represented on the eastern end of the valley, juxtaposing the Cretaceous against the Paleogene formations (Underhill, 1989). The 1:100 000 map of Kefalonia island from IGME (1996) shows eastwards ancient dipping normal faults on the west of the valley which underwent tectonic inversion but lacks dip information on the eastern side. In this map, the thrust structures first mapped by Underhill (1989) are also shown. Finally, Gaki-Papanastassiou et al. (2011) indicate all the faults as normal, with no presence of thrust structures, thus characterizing the Thinia valley as a graben. The geological complexity of the area is evident, and the lack of deep subsurface information adds a further complication to this. The need for a detailed reflection seismic survey was realized and then carried out in spring 2022 in the challenging setting of the Thinia valley of Paliki.
The data acquisition in the Thinia valley was conducted during May 2022 and lasted for 10 d. This location was selected to complement and add on a number of previous geophysical investigations (e.g. boreholes, gravimetry, and ERT) aimed at understanding the geology of the area and unravel possible archaeological relations (Hunter, 2013). A total of three profiles were acquired: profiles 1 and 2 were oriented in the E–W direction, and profile 3 was oriented in the N–S direction, crossing the other two profiles (Fig. 2). Profiles 1 and 2 were approximately 1 km long each, and profile 3 was 1.5 km long. Due to the presence of a town within the survey area, all profiles were characterized by crookedness since existing roads and alleys were utilized to mitigate the topography of the area. A fixed spread of 432 wireless seismic recorders connected to 10 Hz vertical geophones, deployed at 5 m spacing, was used for data recording. Profiles 1 and 2 were surveyed simultaneously, aiming to exploit the cross-shooting technique (Rodriguez-Tablante et al., 2007) from profile 1 to profile 2, thus illuminating the in-between subsurface and resulting in a fourth profile, profile CS (Fig. 2). Due to the steep sides of the valley and the dense vegetation at the edges of the roads, the acquisition logistics were challenging. As a result, shots were skipped at some locations and recorders were not deployed in others. Nevertheless, a reasonable fold coverage was achieved in most places, thanks to the dense receiver spacing. Shallow boreholes are present along the profiles (Hunter, 2013), and three of them (C4b, C5a and C5c) are used as reference (green pins in Fig. 2).
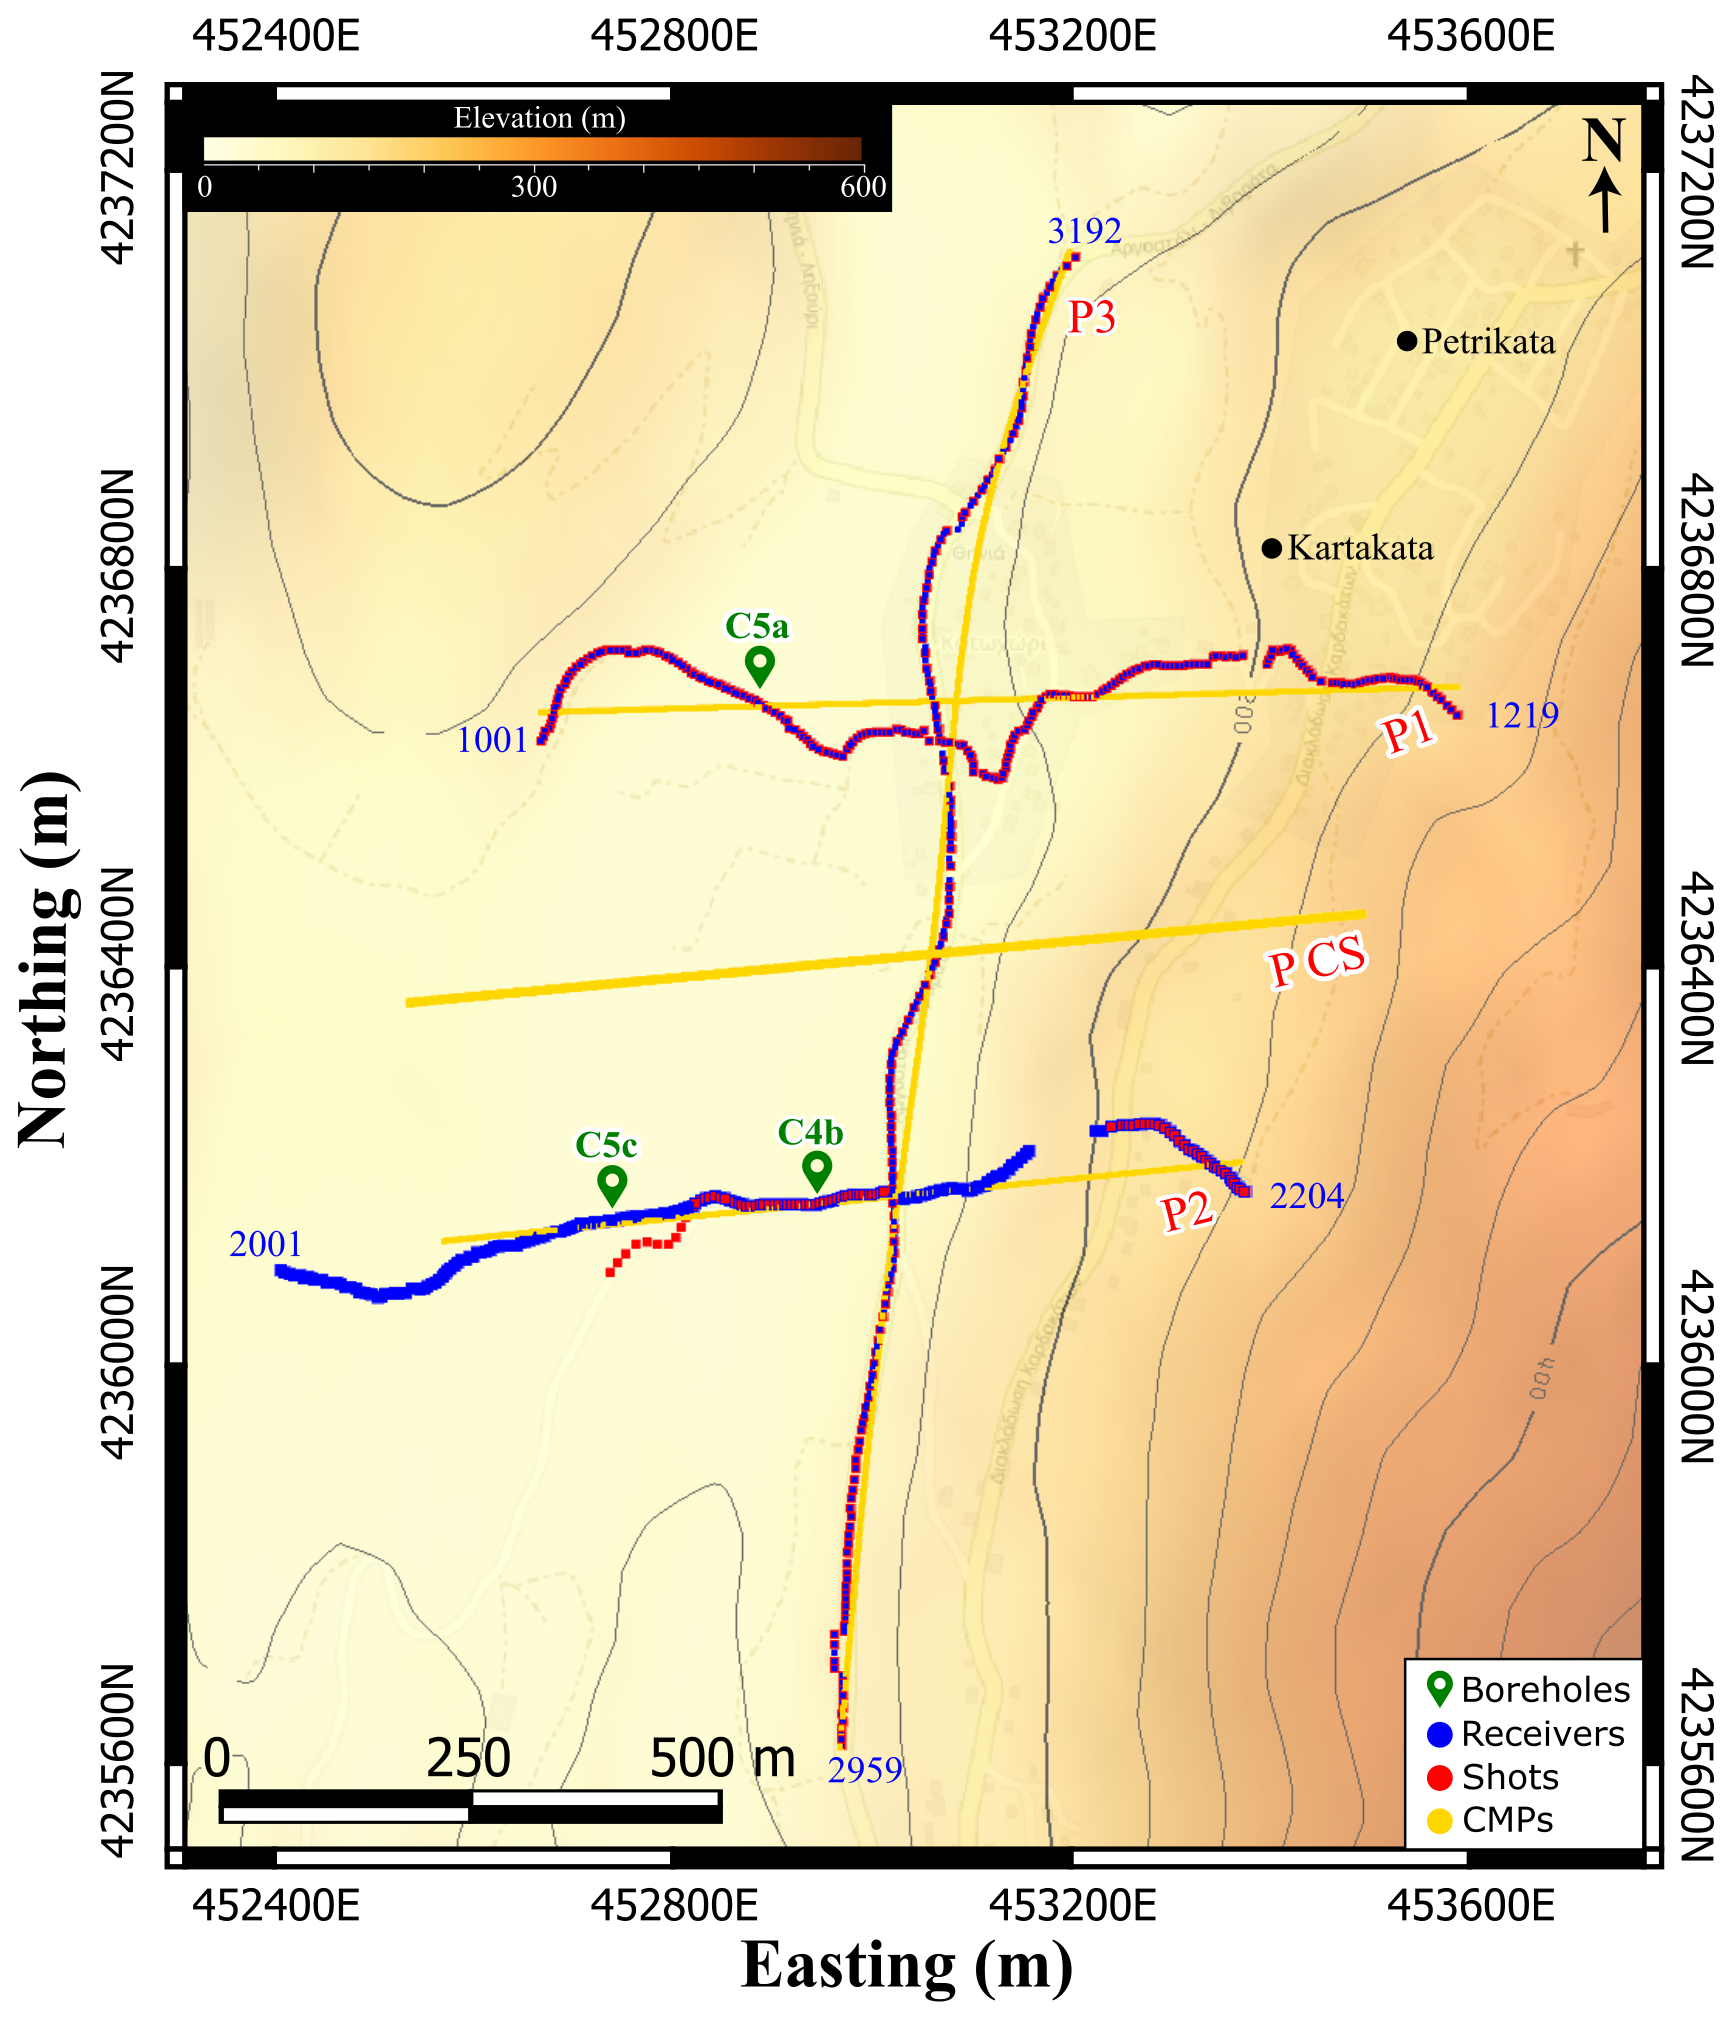
Figure 2Seismic profiles 1 (P1), 2 (P2), 3 (P3), and CS (P CS) shown with the surface topography. Red dots correspond to source positions, blue dots correspond to receiver positions, and yellow dots correspond to CMP positions used for data processing. Green pins correspond to boreholes C4b, C5a, and C5c. Contour lines on the surface topography are 40 m apart.
The employment of a small-size source was important to allow shooting in this environment, so an accelerated weight drop of 25 kg producing an energy of 210 J was chosen as seismic source and operated at every receiver location. Nevertheless, for the last 153 points of profile 3, the source was replaced by a 6 kg sledgehammer, shooting at every two receiver stations, due to a mechanical failure of the weight drop. To improve the signal-to-noise () ratio, five shots at every shot location were recorded with both sources. In total, 656 receiver points and 2225 shots in 445 shot points were acquired during the survey, for a total of 144 408 recorded traces after vertical stacking of the repeated shot records. All wireless receiver positions were surveyed using a centimetre accuracy differential global positioning system (DGPS) system. A seismic event recorder was used to GPS time-stamp the initiation time of every shot. The resulting times were subsequently used to harvest the data from the wireless recorders that were continuously and autonomously recording during the survey period. Table 1 shows details of the survey acquisition parameters.
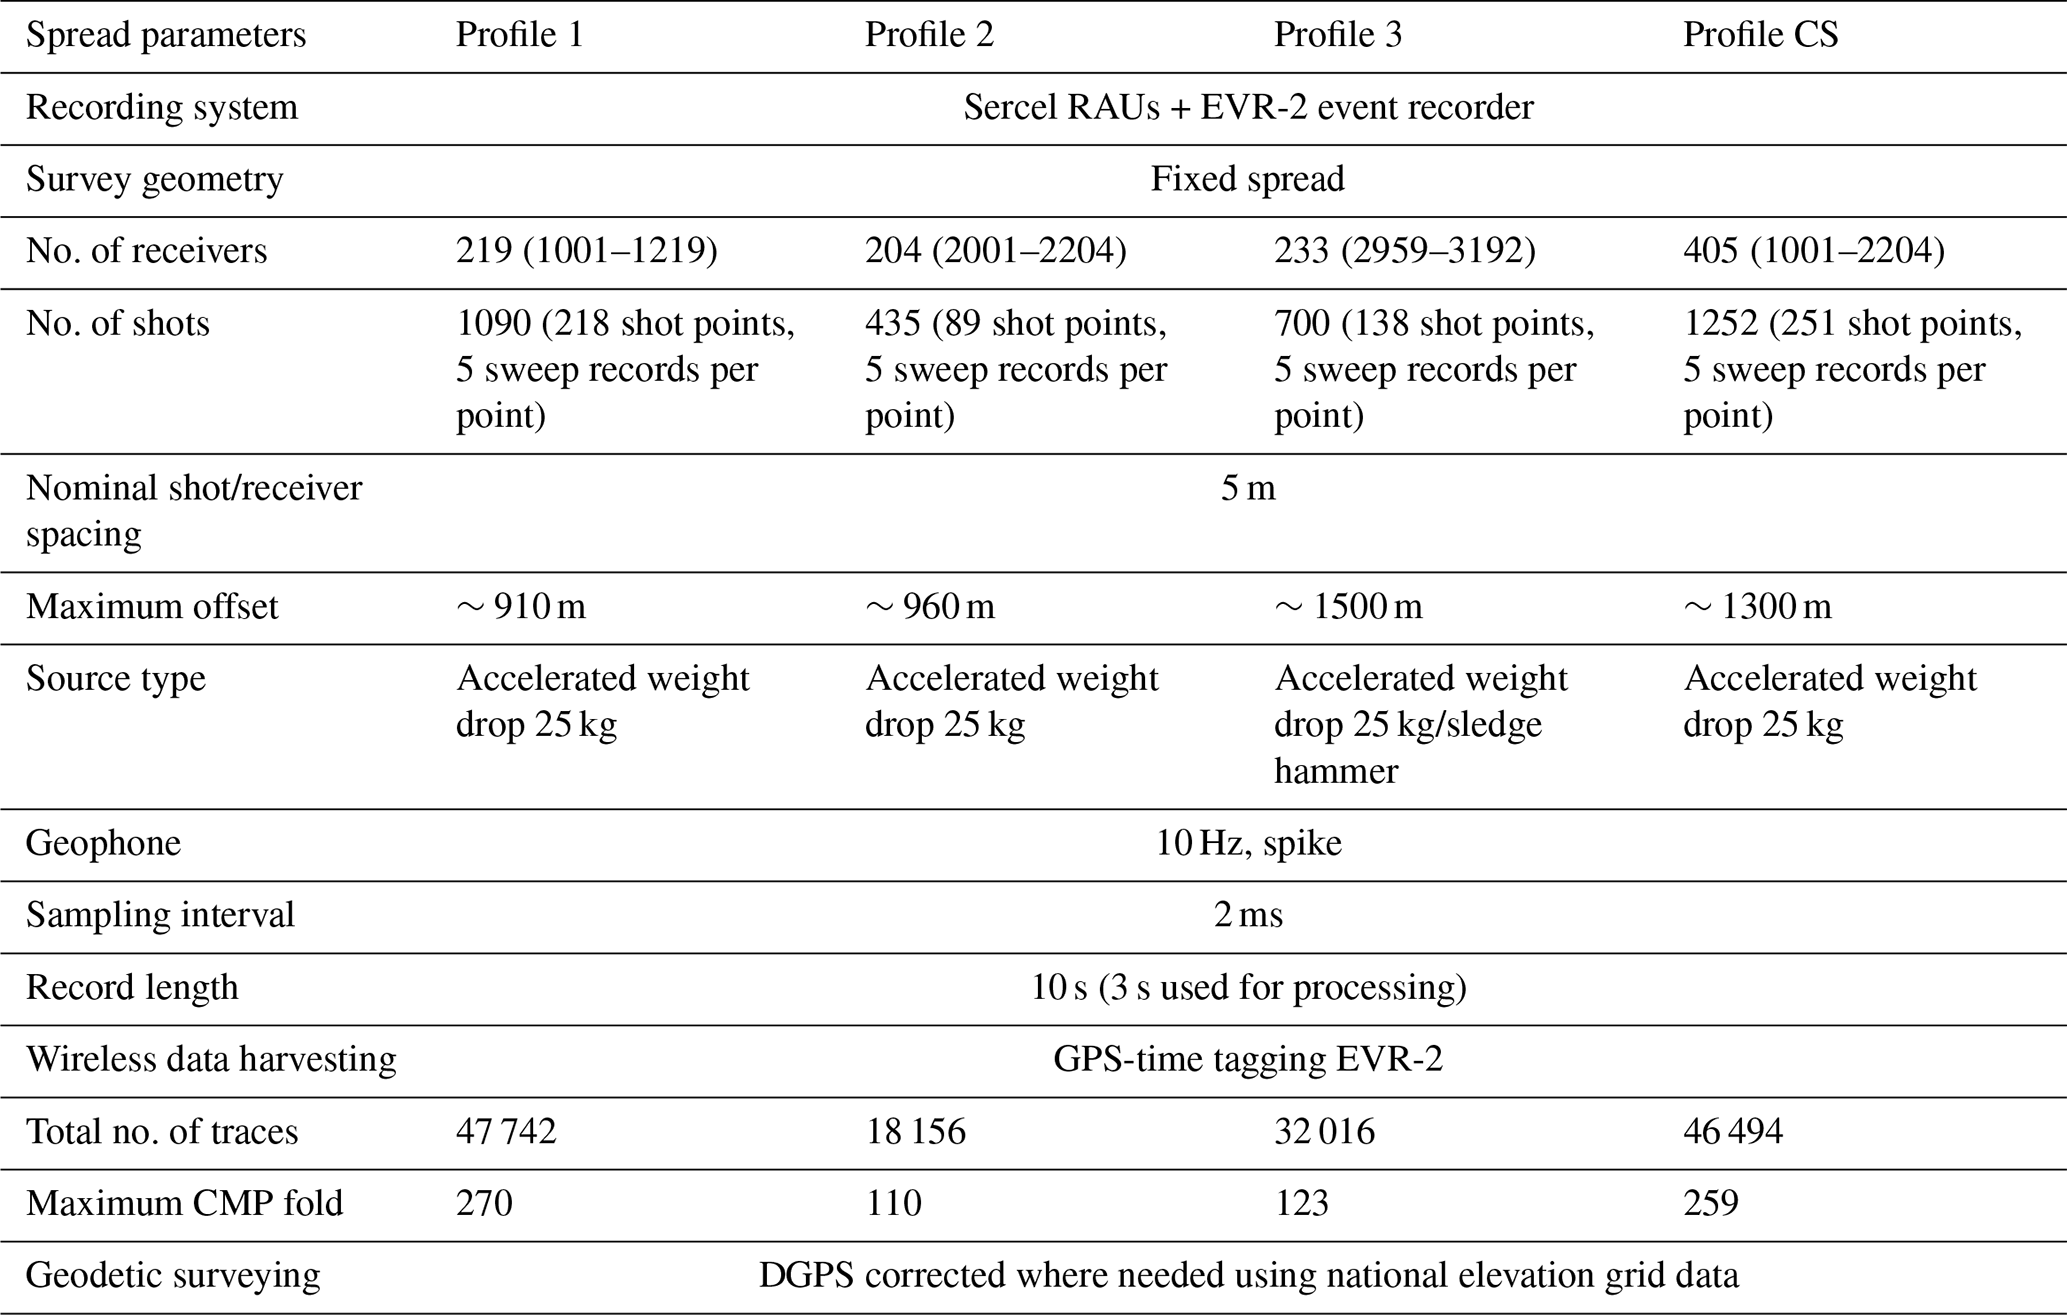
Table 1Main seismic data acquisition parameters, Kefalonia, Greece, May 2022.
4.1 Reflection data processing
Although the resulting data do not show a high ratio, some shot gathers reveal packages of reflections in the first 0.5 s and sporadically down to 1 s (red arrows in Fig. 3). Profile 1 has the highest ratio thanks to the higher common midpoint (CMP) fold coverage with the accelerated weight drop source with respect to the other profiles, and it shows two main reflections, R1 and R2 (red arrows in Figs. 3a and 4). Profile 2 is placed in the most topographically and logistically difficult area, with no roads in many sections of the line, leading to the lowest CMP fold coverage. Nonetheless, the data quality is reasonable (Fig. 3b) as proven by the strong first-break arrivals along most of the offset (blue arrows in Fig. 3b) and by the presence of shallow reflections (red arrows in Fig. 3b). Profile 3 shows strong reflections on the southern part of the profile (red arrows in Fig. 3c), but after the change of the source at receiver location 81, they are no longer visible. Profile CS shows a low ratio, with some sporadic first-break arrivals (blue arrows in Fig. 3d), and is dominated by ambient noise (Fig. 3d). The nominal fold coverage has an average of 100 traces per CMP for profiles 1 and CS and an average of 50 traces per CMP for profiles 2 and 3. This fold coverage drastically drops when only traces with reasonable data quality are considered. The first-break arrivals from the accelerated weight drop source are mostly visible along the entire offset for all profiles, apart from profile CS, where they are sporadically visible only on some shots (blue arrows in Fig. 3). For the shots generated with the sledgehammer source, the first-break arrivals are visible only at near offsets (up to 100–200 m).
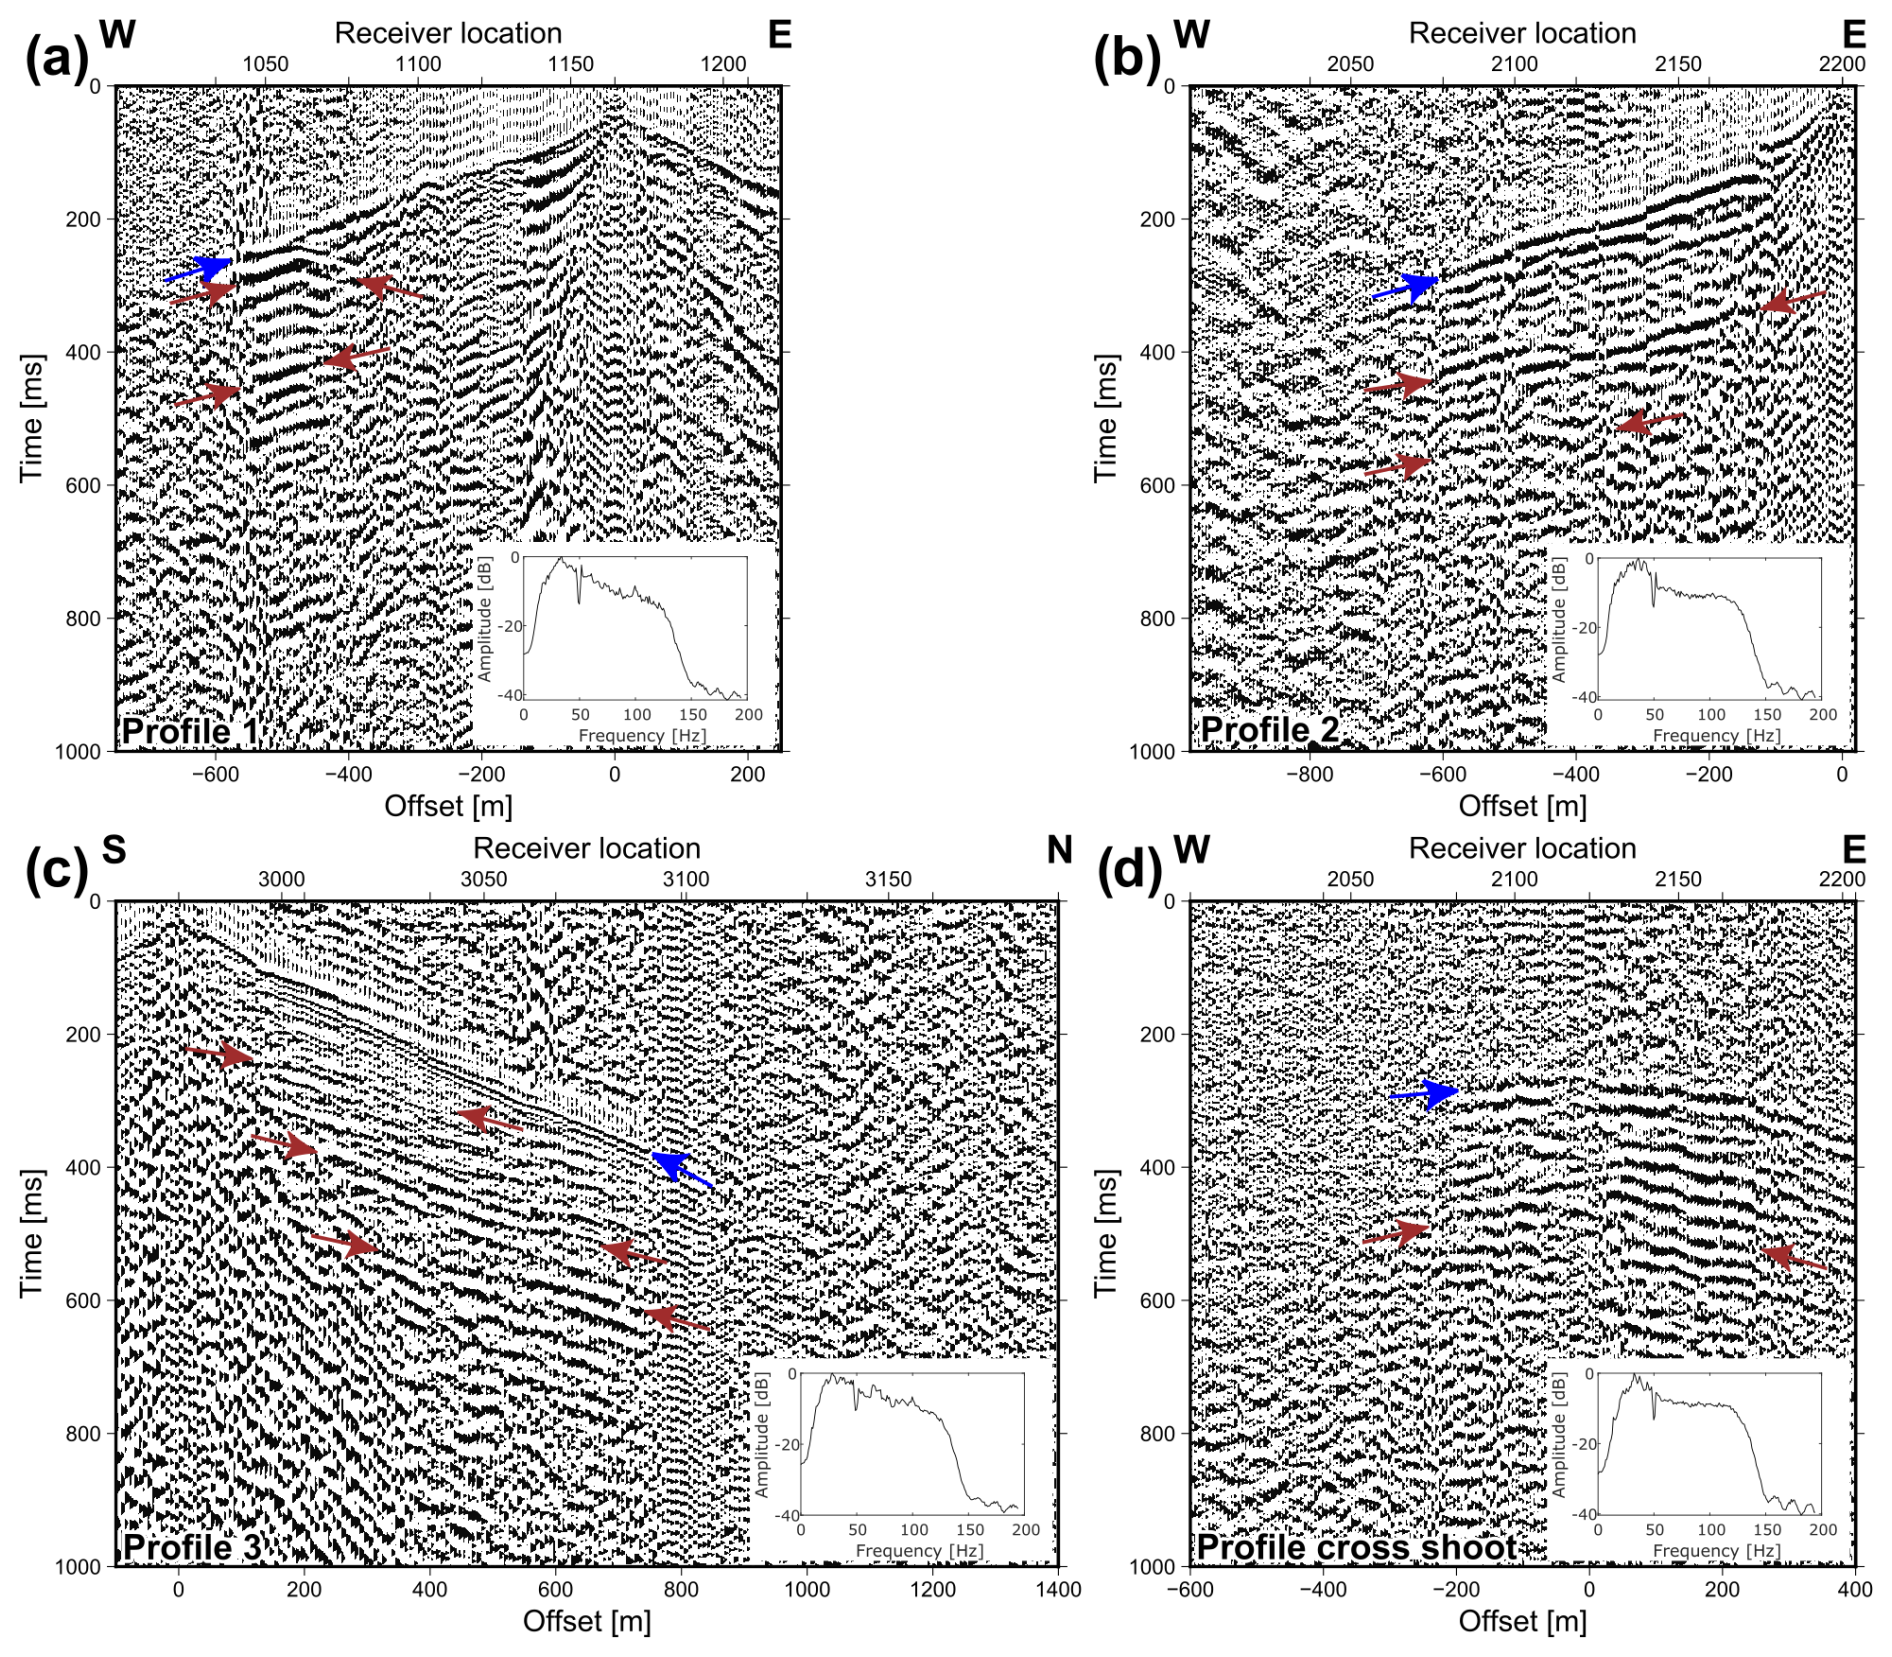
Figure 3Example shot gathers from the four different profiles, frequency filter, and automatic gain control (AGC) have been applied. (a) Shot gather at position 1164 from profile 1. (b) Shot gather at position 2195 from profile 2. (c) Shot gather at position 2980 from profile 3. (d) Shot gather at position 1031 from profile CS. Blue arrows indicate the first-break arrivals. Red arrows indicate main reflections. The shot gather from profile 3 (c) is representative of the portion of the profile where the accelerated weight drop source was used. Note the difference in the data quality despite the small distances between the profiles.
As the observed reflections have a low coherency in different shots and parts of the profile, it was necessary to maintain the processing flow simple in order to avoid data loss or artefact generation. The applied processing steps were similar for all the profiles, but parameters were tailored to and designed for each of them and are presented in detail in Table 2. The main differences between them are (1) the application of a median filter only on profile 3, aimed at reducing the presence of a strong signal with 800 m s−1 velocity, most likely originating from shear waves, visible only on this profile; (2) the different frequency filters applied in post-stack processing to boost the different reflections present in the profiles; and (3) the absence of refraction static corrections because of the not-visible first-break arrivals along profile CS. A major issue of profile CS is the lack of near-offset traces making it impossible to correctly identify different arrivals. Figure 4 illustrates different processing steps as applied to an example shot gather from profile 1.
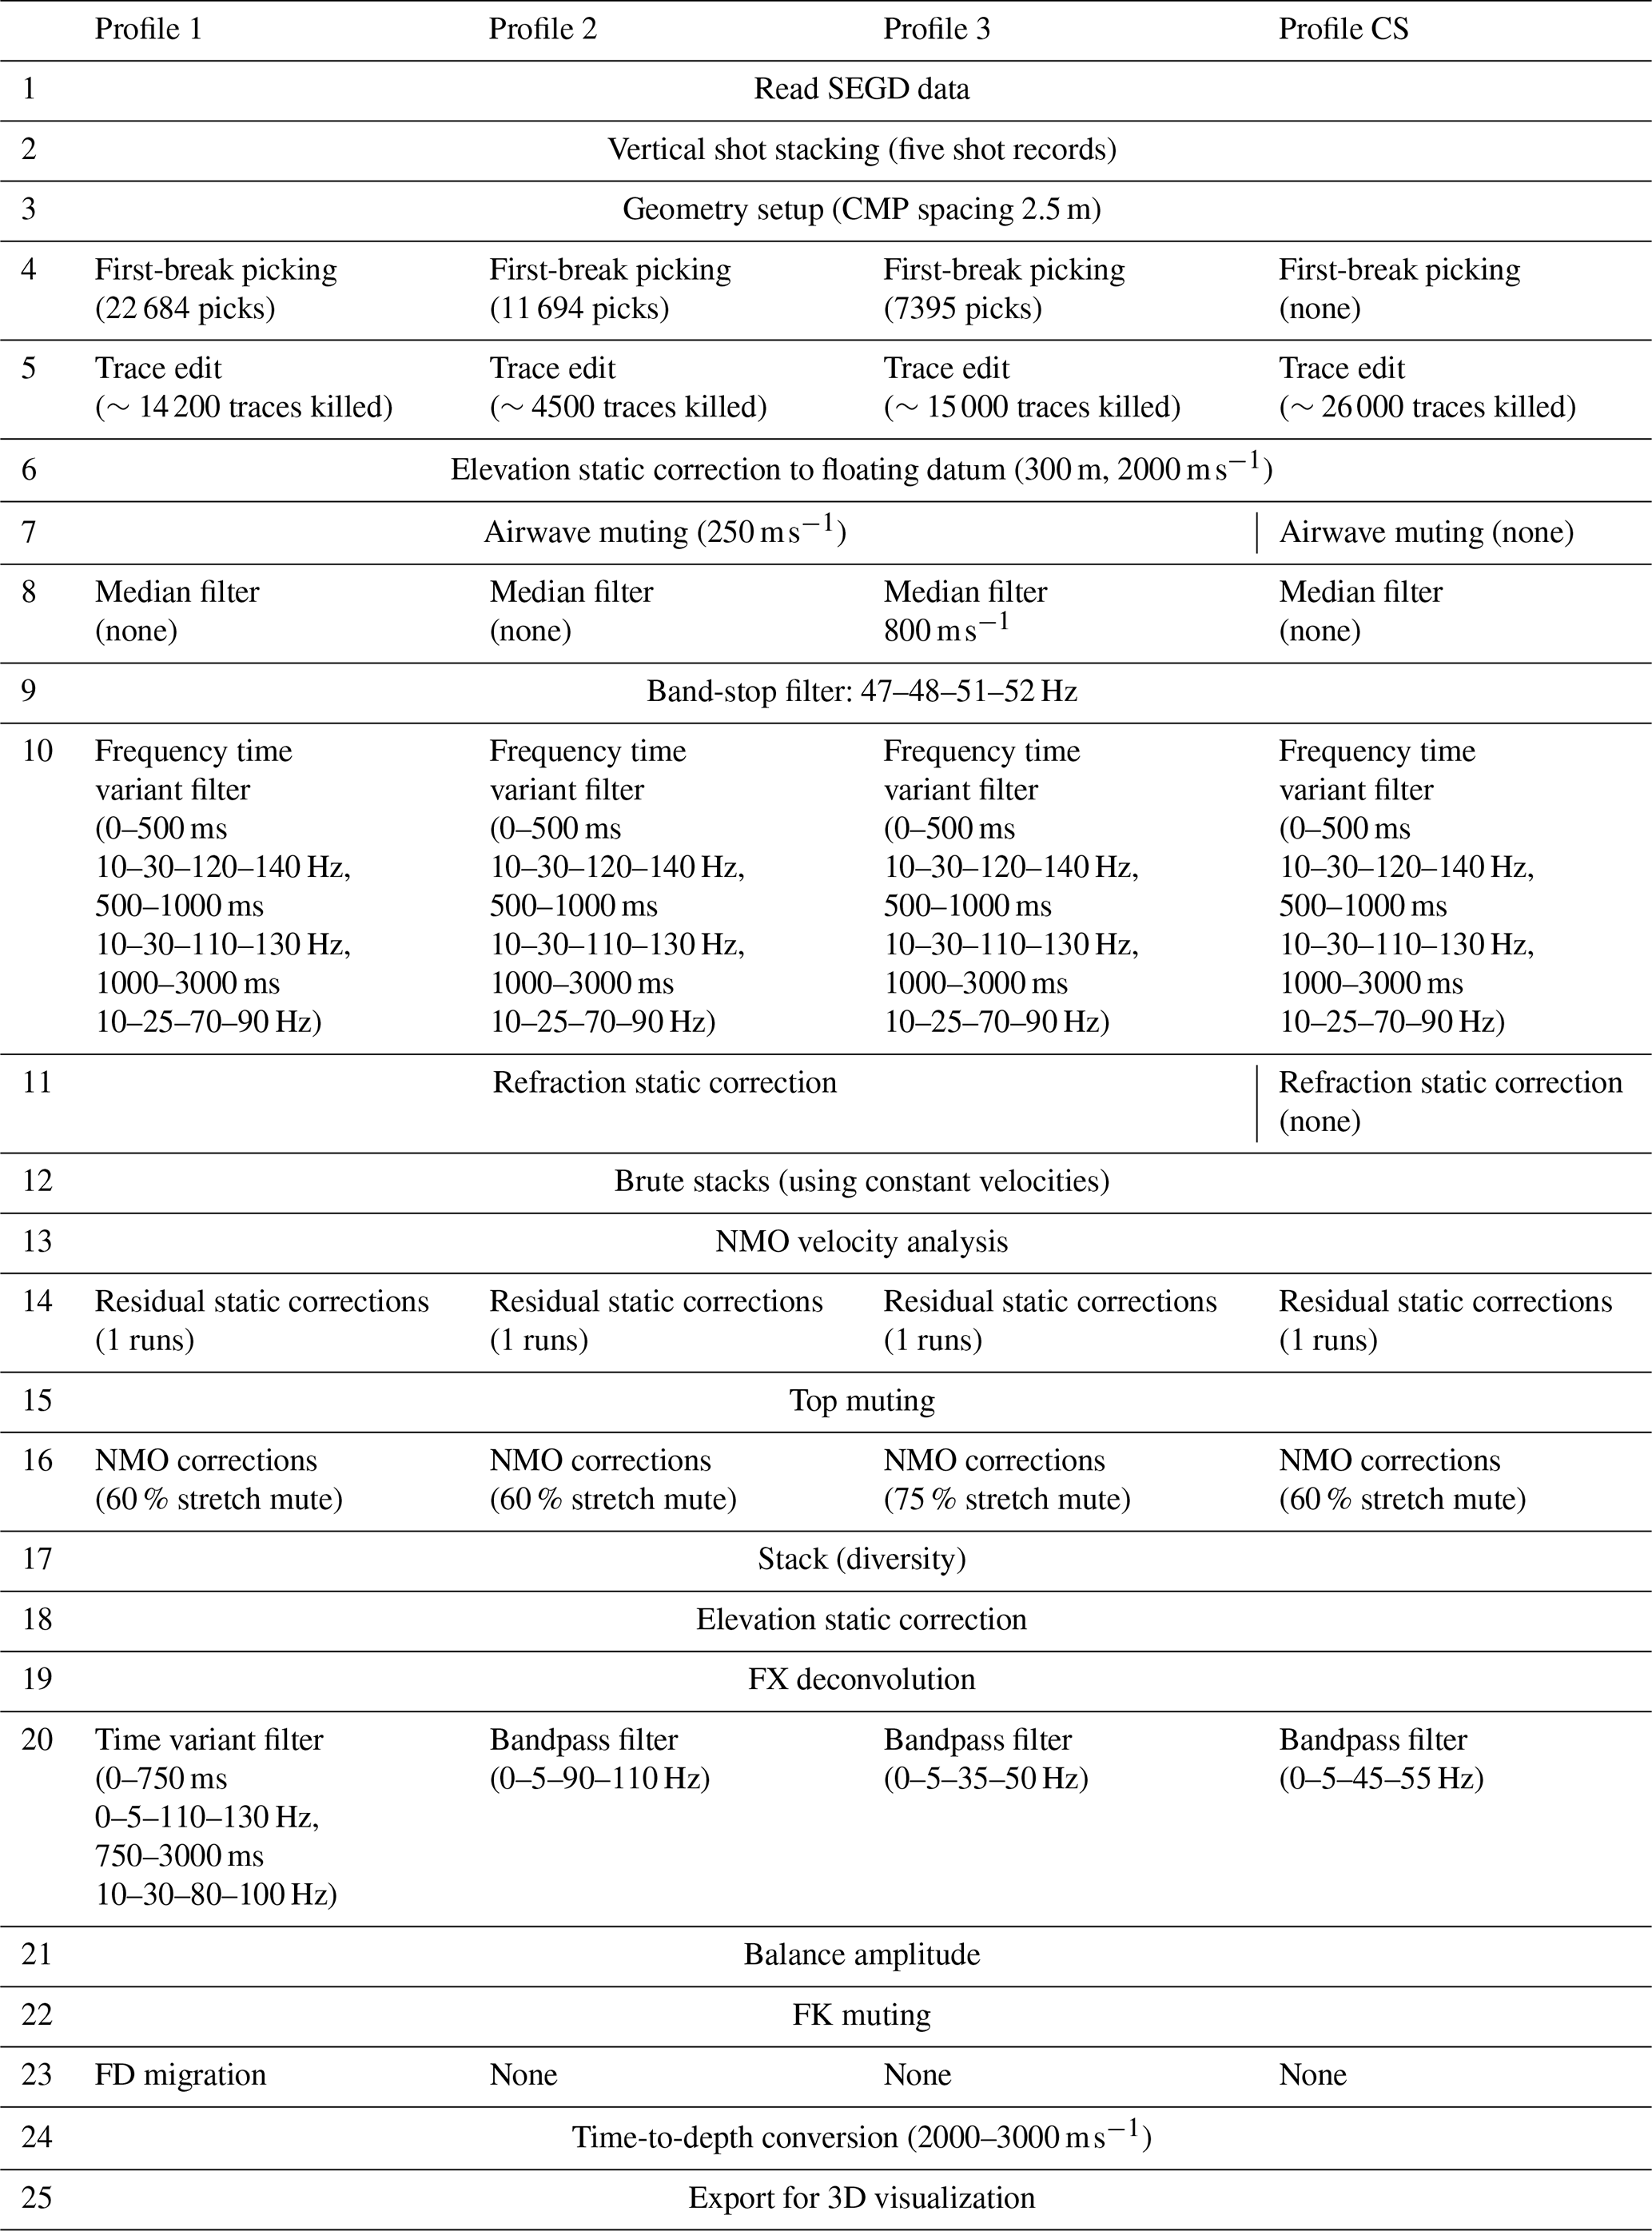
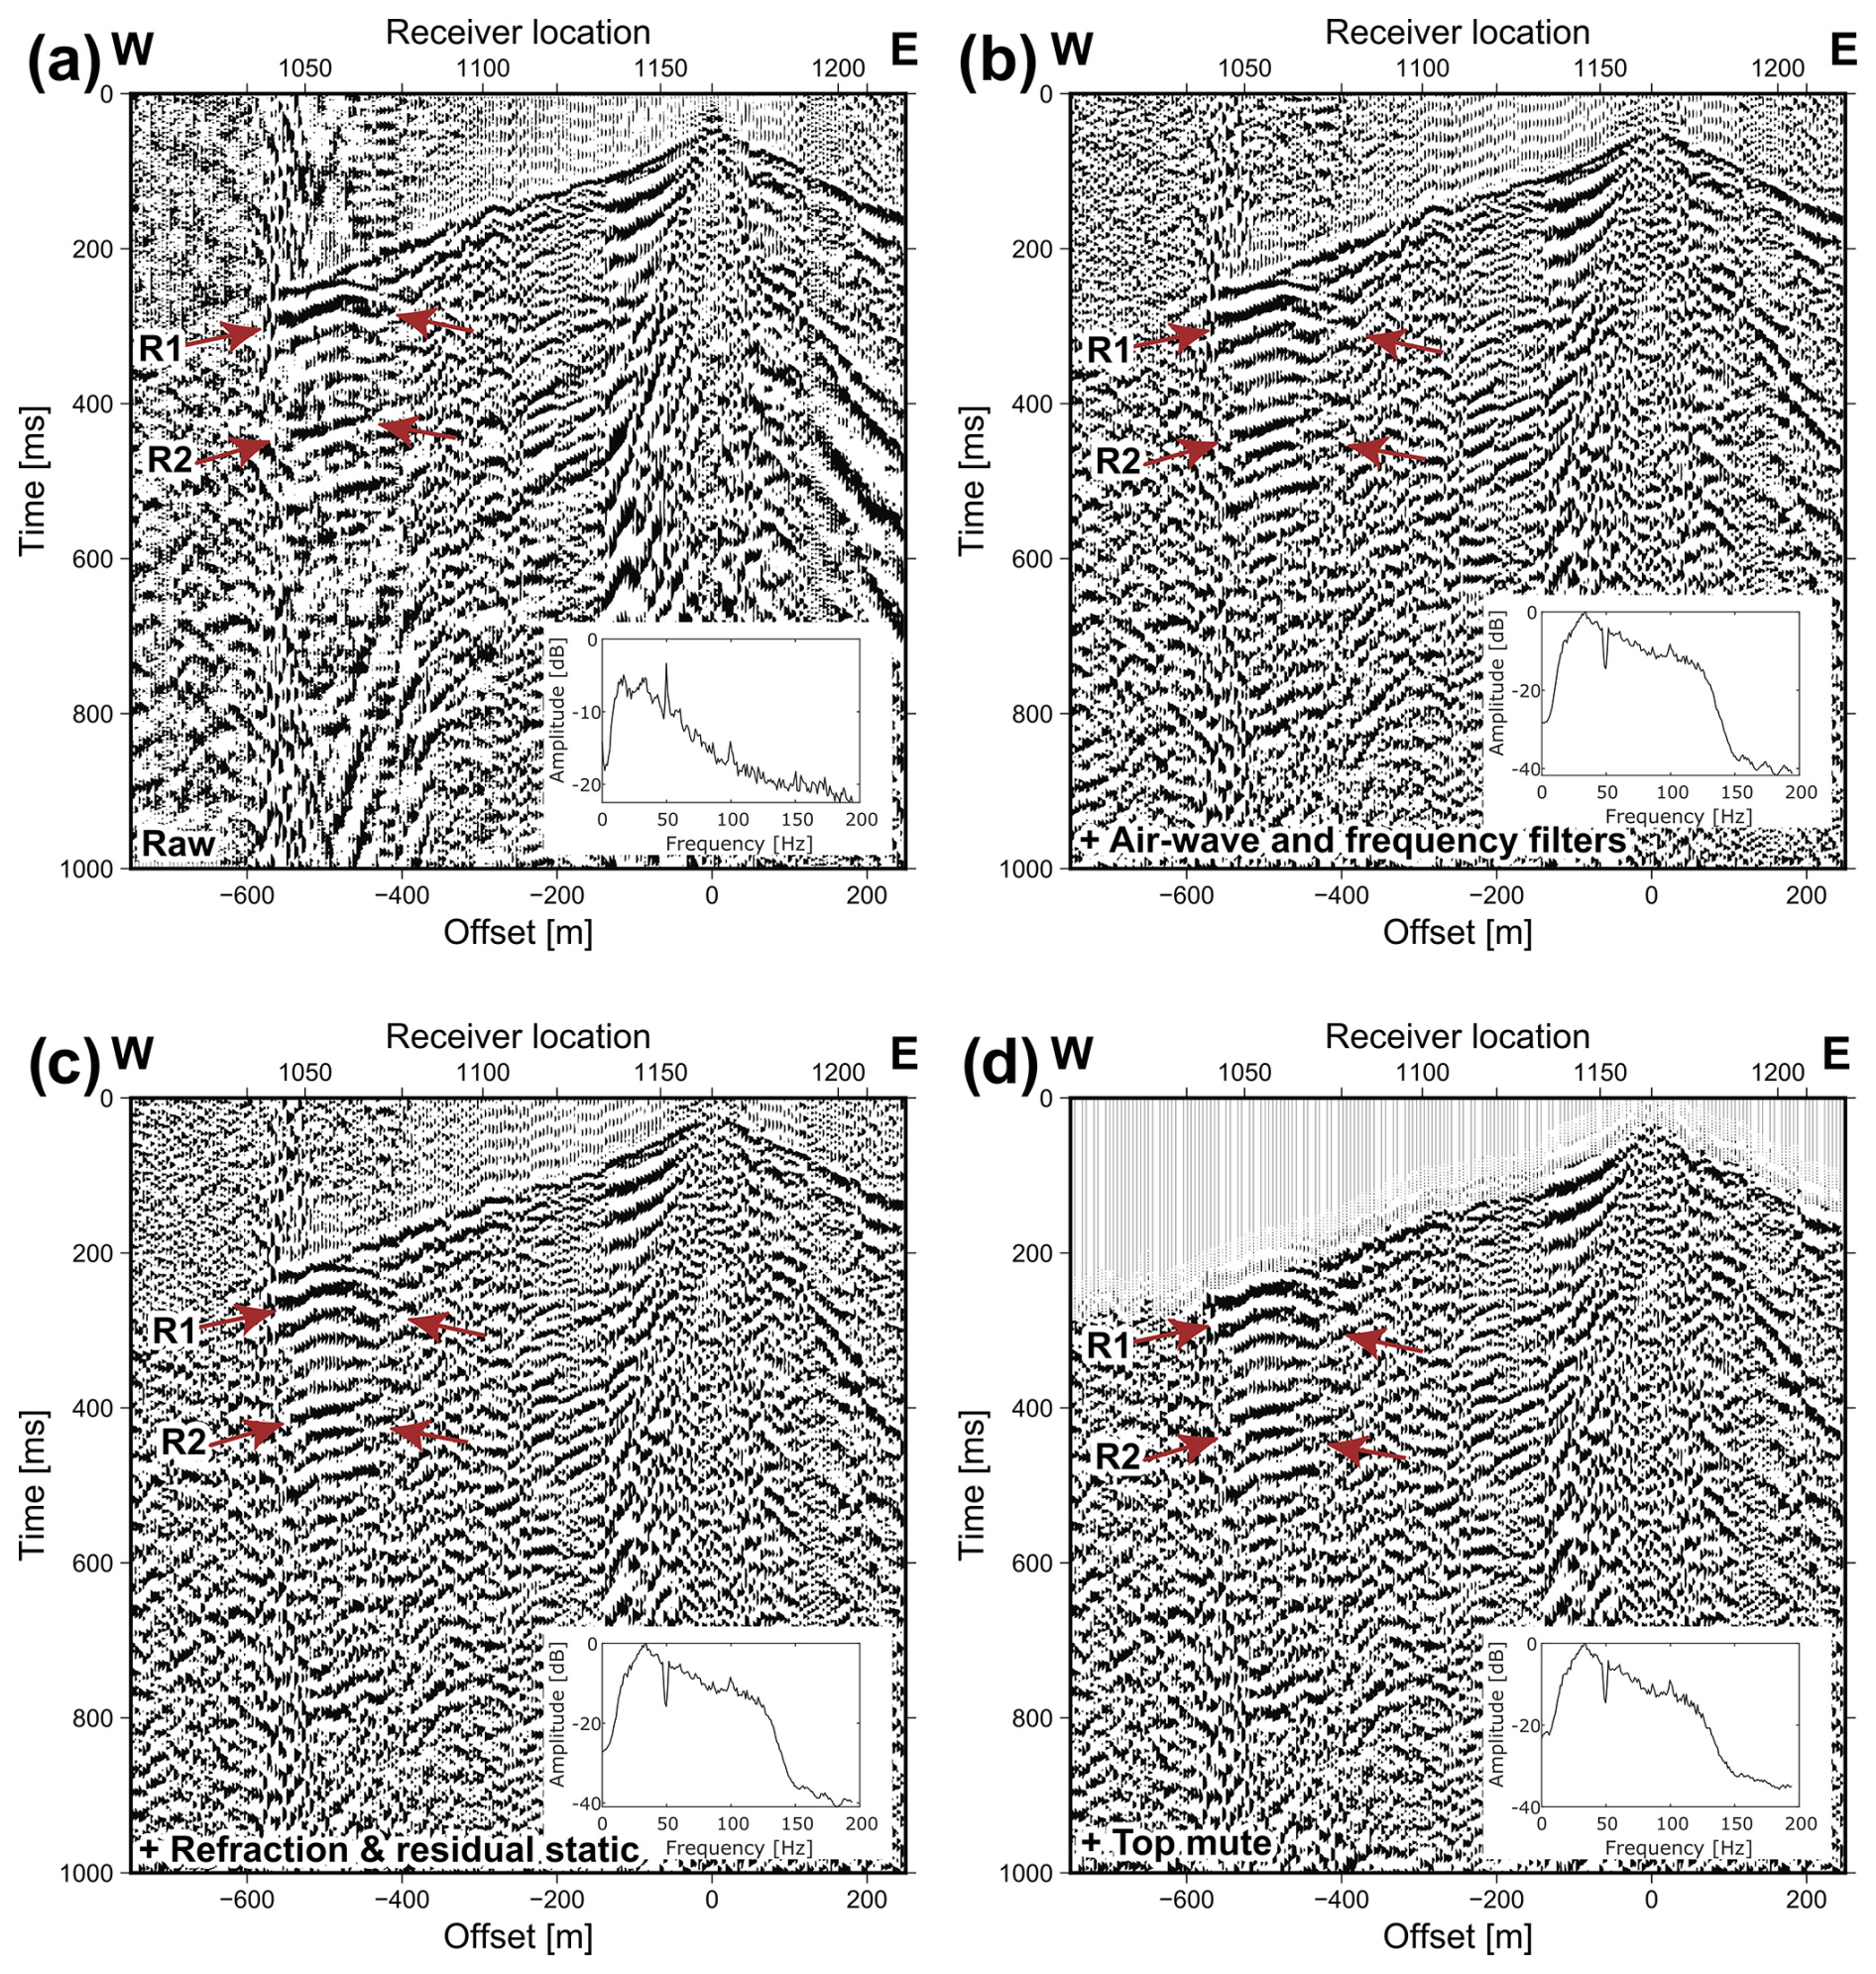
Figure 4Effect of different reflection processing steps on shot gather at position 1164 from profile 1; AGC is applied for display purposes. (a) Raw data after vertical stacking of repeated shot records and trace editing and after the application of (cumulatively) (b) airwave and frequency filters, (c) refraction and residual statics, and (d) top muting. The arrows point at two identified reflections, R1 and R2.
For all the profiles, 3 s data were used for processing, though no reflections were observed beyond 1 s. Trace editing, vertical stacking, and a geometry setup using 2.5 m CMP spacing were applied to the data (Fig. 4a). Then, an airwave muting filter, a 50 Hz band-stop filter, and a frequency time variant bandpass filter were applied in the pre-stack domain, aiming to reduce the recorded noise while enhancing the reflections (Fig. 4b). Static corrections were applied to compensate for near-surface differences (Fig. 4c), and subsequent top muting was applied to increase the signal continuity (Fig. 4d) prior to normal moveout (NMO) corrections and stacking. Estimation of the NMO velocities was the most challenging part since reflections are weak and incoherent in the data. Different constant velocities were first tested on the whole dataset to narrow the velocities of interest, and then a constant velocity stack (CVS) analysis was performed, resulting in a smooth velocity model ranging from 2400 m s−1 at the surface to 3300 m s−1 at 1000 ms. Coherency and frequency filters were used post-stack to boost and increase the continuity of the reflections. A finite-difference post-stack migration was tested on all profiles, first using the estimated NMO velocities and then refining them with the evaluation of smiles and frowns in the resulting migrated sections. The finite-difference migration was not able to handle the low ratio of profiles 2, 3, and CS. In fact, the resulting migrated sections did not show any coherent reflection of the ones identified in the unmigrated stack sections, and therefore the migration was not applied to these profiles. The higher ratio of profile 1 resulted in a migrated section where the reflections identified in the unmigrated stack section are visible and correctly migrated. Since it was not possible to estimate a deep accurate velocity model, a poorly accurate time-to-depth conversion was applied to all the stacked sections to assist the interpretation with respect to depth. After testing different velocities, a linear velocity model ranging from 2000 m s−1 at the top to 3000 m s−1 at the bottom was applied for the conversion, resulting in good reflection continuity.
4.2 The 3D reflection travel time modelling
The 3D reflection travel time modelling based on Ayarza et al. (2000) was applied to better evaluate the 3D nature of the strong reflection R1 reaching the surface along profile 1 (Fig. 5). Assuming an overlying fixed velocity of 2300 m s−1, measurable from the first arrival times in the shot gather, and an underlying velocity of 2500 m s−1, different strikes and dip angles were tested to find the best match to the observed reflection travel time. The calculation uses true 3D source and receiver coordinates for both expected first-break travel times and the reflection travel times. The first-break arrival times (blue in Fig. 5) were used to estimate the upper velocity, while the reflection arrival times (red in Fig. 5) were overlapped with the real data to find the best match. The weak reflection signal at the far offset reduced the accuracy and sensibility of the modelling, with reflection R1 considered to best match a model with a N23° strike and a 44° dip towards the east (red in Fig. 5). A horizon with the same geometries was modelled and compared with the migrated stacked section of profile 1, showing a match with the same R1 reflection. The obtained strike is consistent with the geological boundaries observed in the study area, while the high dip variability visible from the geological maps does not allow a direct comparison.
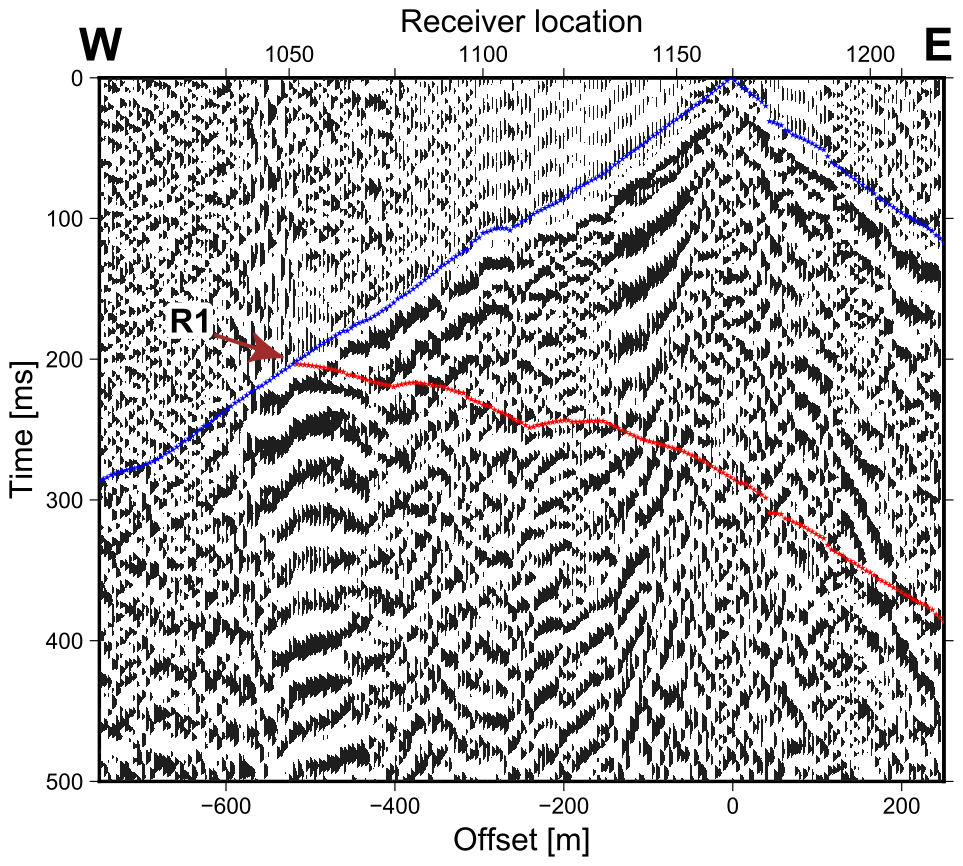
Figure 5Shot gather at position 1164 (as shown in Fig. 4c) with 3D reflection travel time modelling of the reflector R1. In blue are the modelled first-break arrivals, and in red is the modelled reflection travel time for R1 with a N23° strike and a dip angle of 44° towards the east. Both blue and red points are shifted up 10 ms for better comparisons.
4.3 First-break travel time tomography
First-break travel time tomography was performed to estimate near-surface velocity models along profiles 1, 2, and 3 (Fig. 6). No tomography work was conducted on profile CS due to the poor quality of first-break arrivals. A diving-wave, finite-difference-based travel time tomography code (Tryggvason et al., 2002) was used for this purpose. Similar to Zappalá et al. (2022), the model was forced to be 2D to allow high ray coverage. Different tests were done according to the expected velocities to remove possible dependencies of the results on the starting models and the choice of smoothing parameters. A starting model honouring the surface topography with velocities increasing linearly from 1500 m s−1 at the surface to 3500 m s−1 at the base of the model (400 m in total) was chosen. Similar starting velocity models were applied to all the profiles. The velocity above the topography was set to 330 m s−1 to make sure no ray would escape upwards.
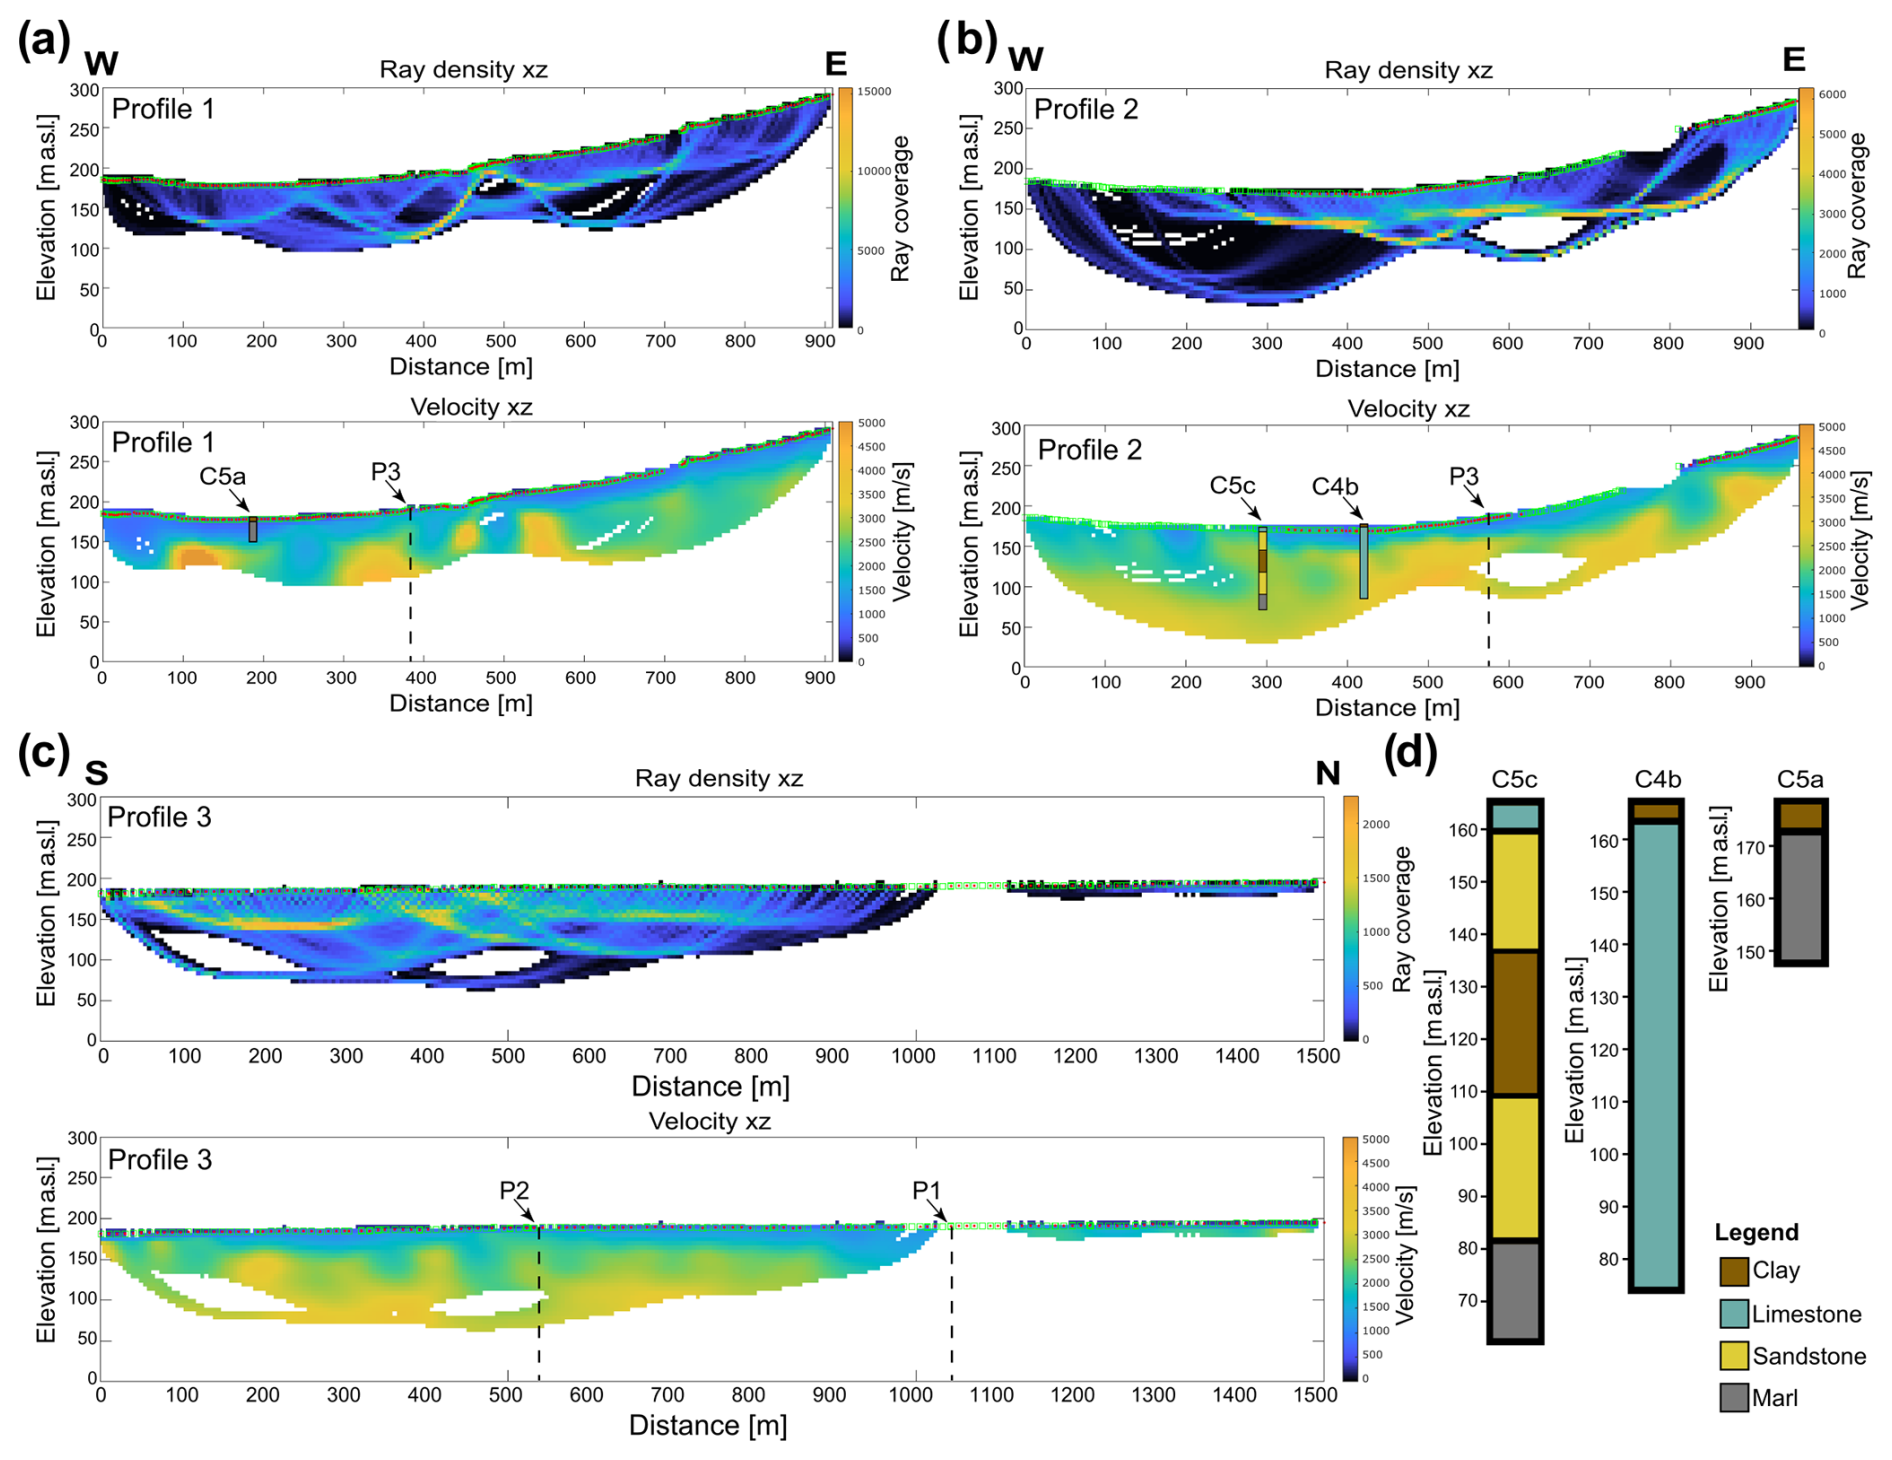
Figure 6Velocity model resulting from first-break travel time tomography for (a) profile 1, (b) profile 2, and (c) profile 3 with superimposed borehole lithologies. (d) Simplified lithologies logged in the boreholes (Hunter, 2013).
The unmigrated stacked sections show various features with different strength and continuity along the different profiles, reflecting the quality of the raw data (Fig. 7). In the unmigrated stacked section of profile CS (Fig. 7a), the absence of near offsets and the use of a relatively weak source for a cross-shooting acquisition led to the absence of reliable reflections/features. Some of the events observed in the section might be related to real features, but as the presence of true reflections cannot be guaranteed, we avoid interpreting this section.
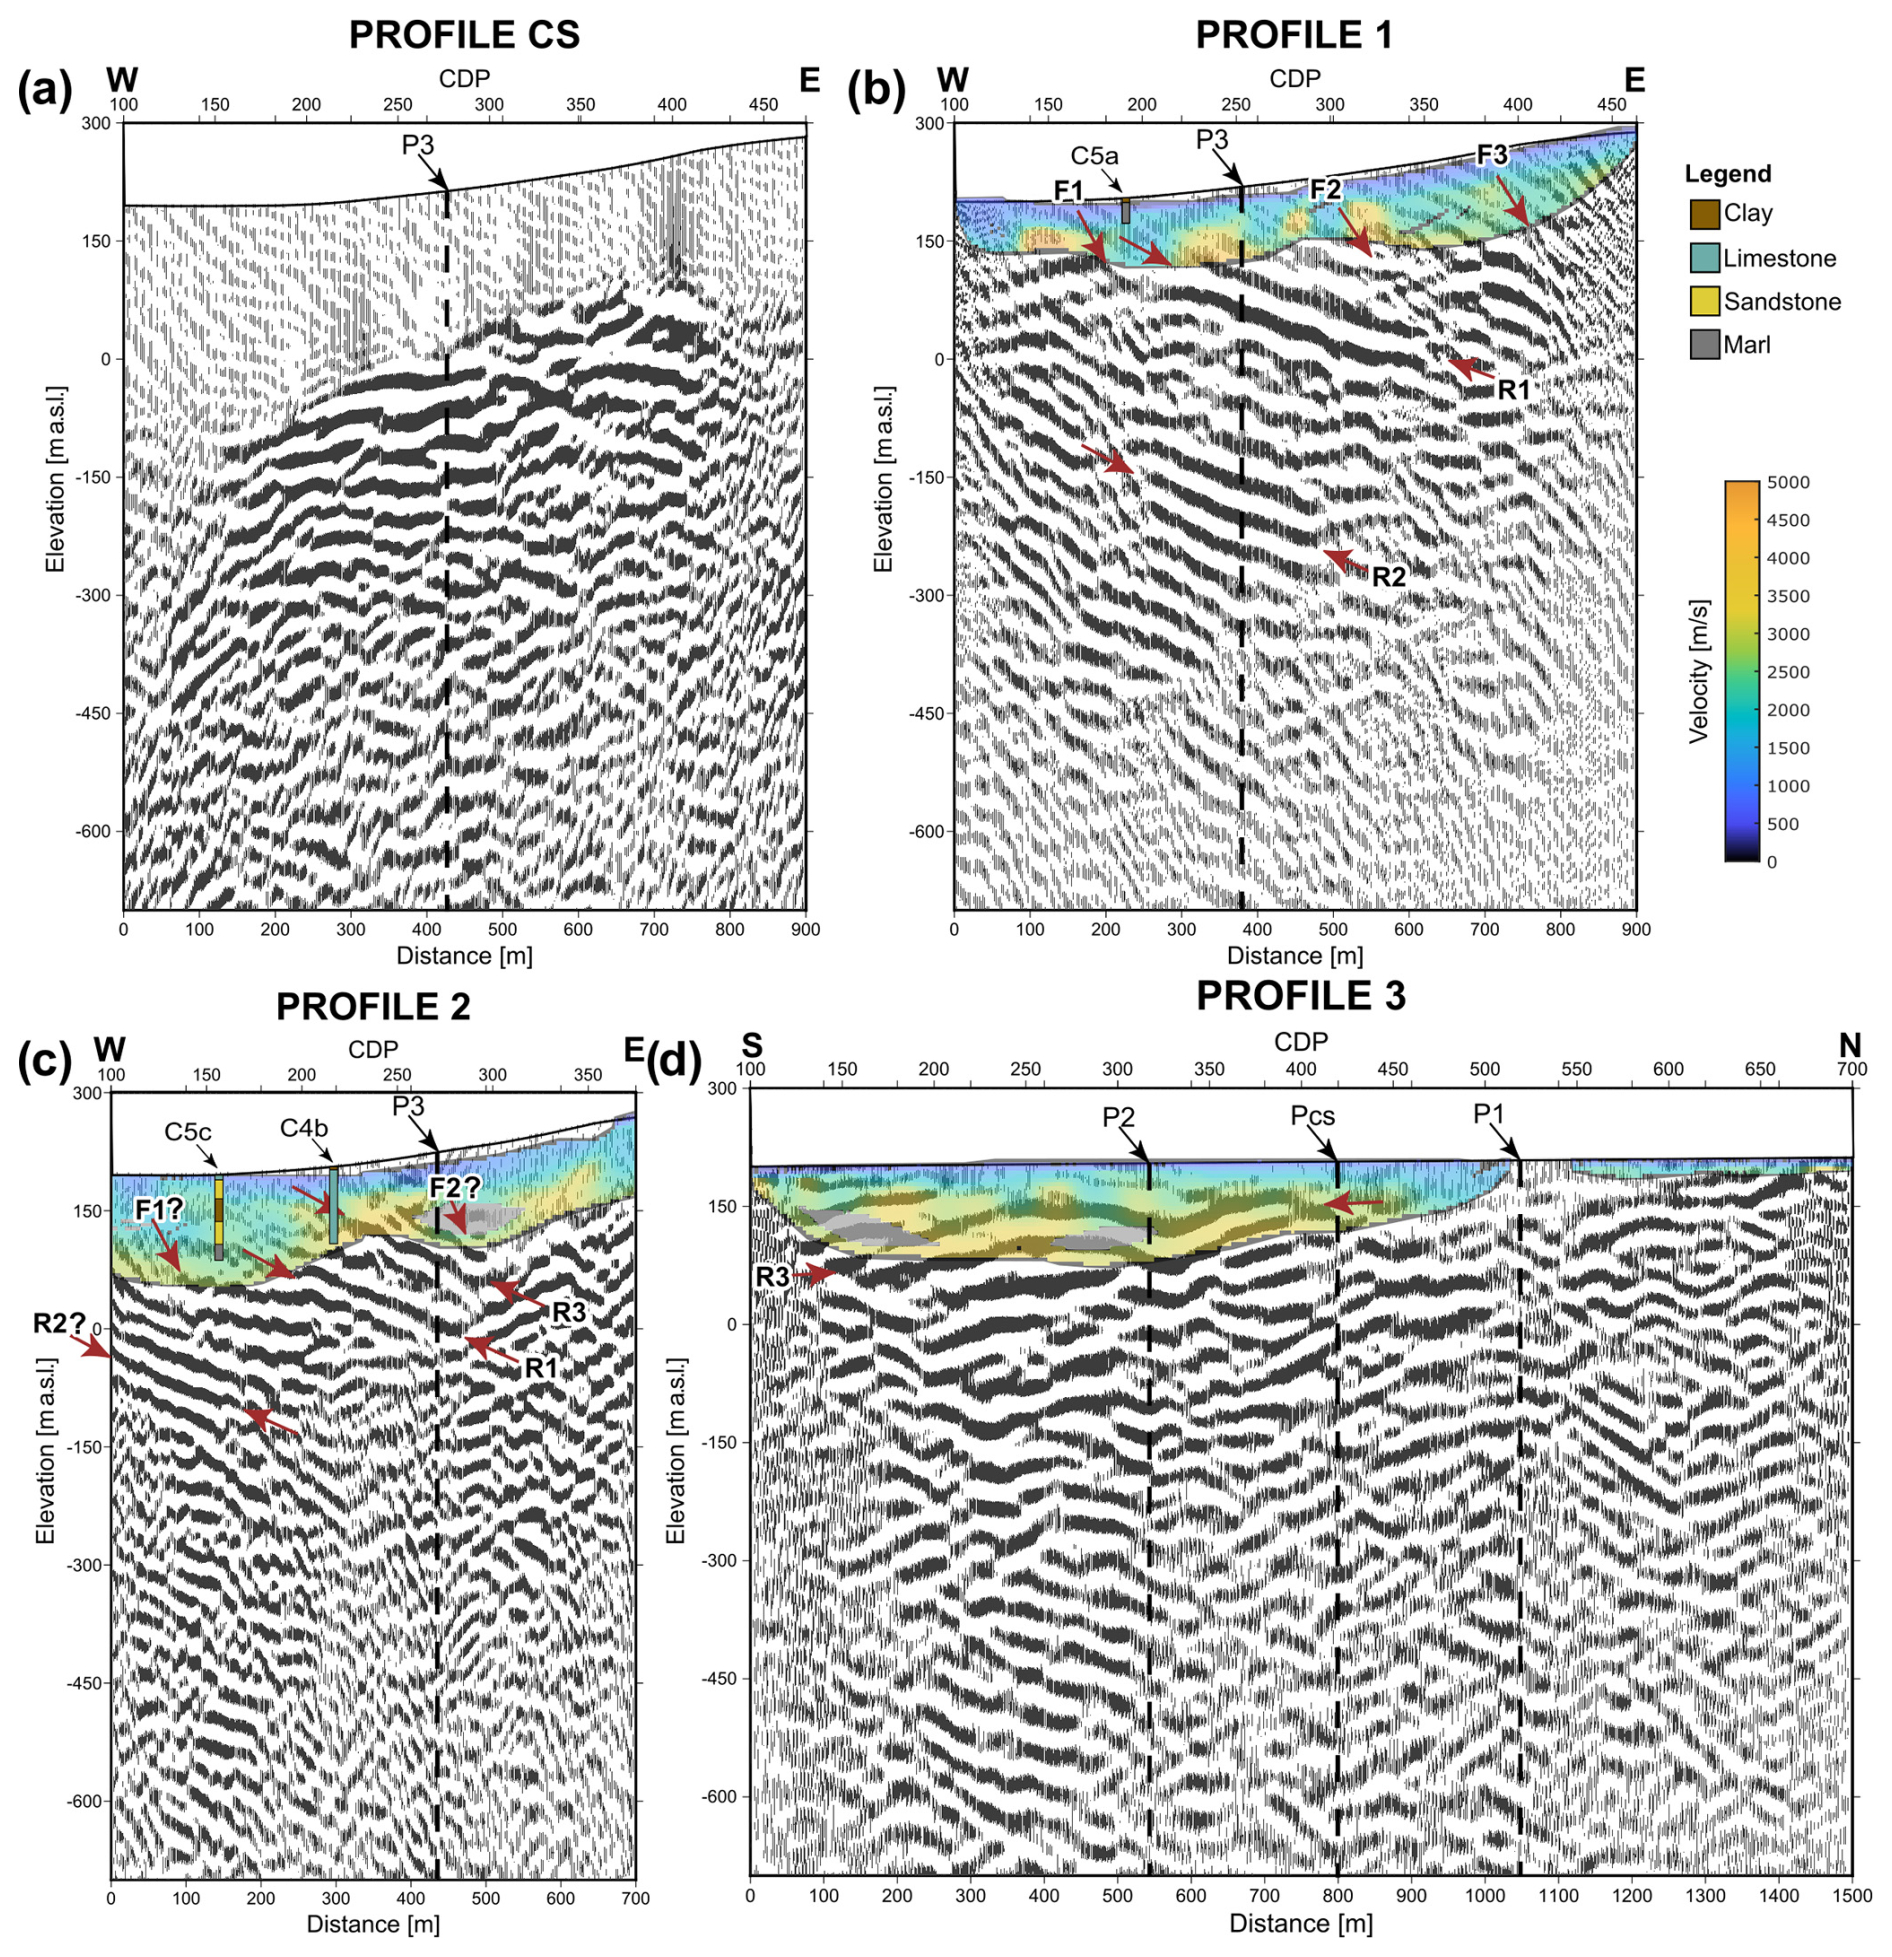
Figure 7Unmigrated stacked sections (with time-to-depth conversion) overlapped with the velocity model computed from first-break travel time tomography and with borehole lithologies intersected in the three boreholes. (a) Unmigrated stacked section from profile CS. Unmigrated stacked sections and velocity models of (b) profile 1, (c) profile 2, and (d) profile 3. In all the panels, dashed lines indicate the intersections between the profiles. Red arrows point to the main features identified in this study. Profile 1 shows rich reflectivity and is the base of the interpretations.
The unmigrated stacked section of profile 1 (Fig. 7b) shows a higher ratio and reflection continuity with respect to the other profiles. A prevailing east-dipping character is visible along the entire section, with more complex structures located on the two ends of the profile at shallow depths. Two continuous and strong east-dipping reflections can be seen in Fig. 7b. The first reflection (R1) is visible at a depth of 160 m a.s.l. on the western side of the profile, and it reaches sea level on its eastern side. The second feature (R2) appears as a package of several reflections visible from −100 to −300 m a.s.l. Both reflections are also observed in the shot gathers (R1 and R2 in Fig. 4b), where R1 modelling shows its relation with a N23° E/44° E reflector (Fig. 5). The main dipping structures of the section are perturbed by three features showing an higher east-dipping character identified and labelled as F1, F2, and F3. An area of no reflectivity, reaching down to approximately 100 m a.s.l., is observed at the top of the section (Fig. 7b).
The unmigrated stacked section of profile 2 is noisier than profile 1, especially at its edges. Profile 2 also shows a main east-dipping reflectivity character in agreement with profile 1, showing distinct sets of reflections (R1, R2, and R3 in Fig. 7c). The deepest of these reflections shows amplitude values, frequency content, and shape of the signal similar to the ones from R2 reflection of profile 1 (Fig. 7b), and considering its location (between 0 and −150 m a.s.l.), it could correspond to the same horizon. The reflection located at a depth of 150 to 50 m a.s.l. matches amplitude values, frequency content, and shape of the signal from reflection R1 of profile 1, suggesting their correspondence. The shallowest reflection (R3) is located between 100 and 0 m a.s.l. As also observed in profile 1, two highly east-dipping features perturbed the main reflectivity. These could correspond to F1 and F2 identified in profile 1, while there is no evidence of F3 in this profile, probably due to the low coverage obtained on its eastern side. Two shallow areas with no reflectivity down to approximately 100 m a.s.l. are visible in this section, and between them reflection R3 lies close to the surface (Fig. 7c).
The unmigrated stacked section of profile 3 shows variable quality (Fig. 7d). Strong shallow reflections appear continuous in the south, while weaker but continuous deeper features are also visible. Towards the centre of the profile, reflections are still strong but with a lower continuity, while on the northern side they are barely visible, displayed as weak amplitudes with low quality, which can be explained by the different seismic sources. The observed reflections reveal an anticline–syncline structure and match to some degree the corresponding horizons observed in the other two profiles. The shallow strong reflection R3, at a depth of 50–150 m a.s.l., intersects with reflection R3 observed in profile 2 (Fig. 7c), while, at the crossing point with profile 1, the same zone with no reflectivity as in profile 1 is visible down to 150 m a.s.l. (Fig. 7d).
To complement the reflection imaging work, the first-break travel time tomography results plotted in Fig. 6 are superimposed onto the unmigrated stacked sections in Fig. 7. Although the comparison is more accurate in Fig. 8 where migration was performed on profile 1, a good match between high-velocity zones (3000–4000 m s−1, yellow to orange in Figs. 7 and 8) and the imaged reflections is visible also for all the unmigrated stacked sections. The low-velocity areas (1500–2500 m s−1, blue to green in Figs. 7 and 8) instead match the shallow zones with no reflectivity. The thickness of these low-velocity zones is highly variable, ranging from 20 to 50 m along profile 3 to more than 100 m in portions of profiles 1 and 2. Profile 3 travel time tomography is unfortunately incomplete due to the poor-quality first-break arrivals from the sledgehammer source. Nevertheless, the good match observed in the areas where velocities were estimated increases our confidence in the reliability of the velocity features. Comparison with the borehole lithologies (Fig. 6) is more meaningful for profile 2 (Fig. 6b), where the available boreholes are 90 to 100 m deep and reach an elevation of approximately 60 and 70 m a.s.l. (Fig. 6d). A limestone layer at borehole C4b matches the high velocities at shallow depth, while for the borehole C5c it is possible to correlate the more complex structures both on the borehole and on the velocity model with generally lower velocities with respect to the borehole C4b. Borehole C5a along profile 1 (Fig. 6a) is 30 m deep and reaches an elevation of 150 m a.s.l. (Fig. 6d), showing low velocities corresponding to the logged marl. Finally, the identified east-dipping perturbations F1, F2, and F3 along profiles 1 and 2 correspond to areas where low-velocity zones propagate deeper between the high-velocity zones (Fig. 7b and c).
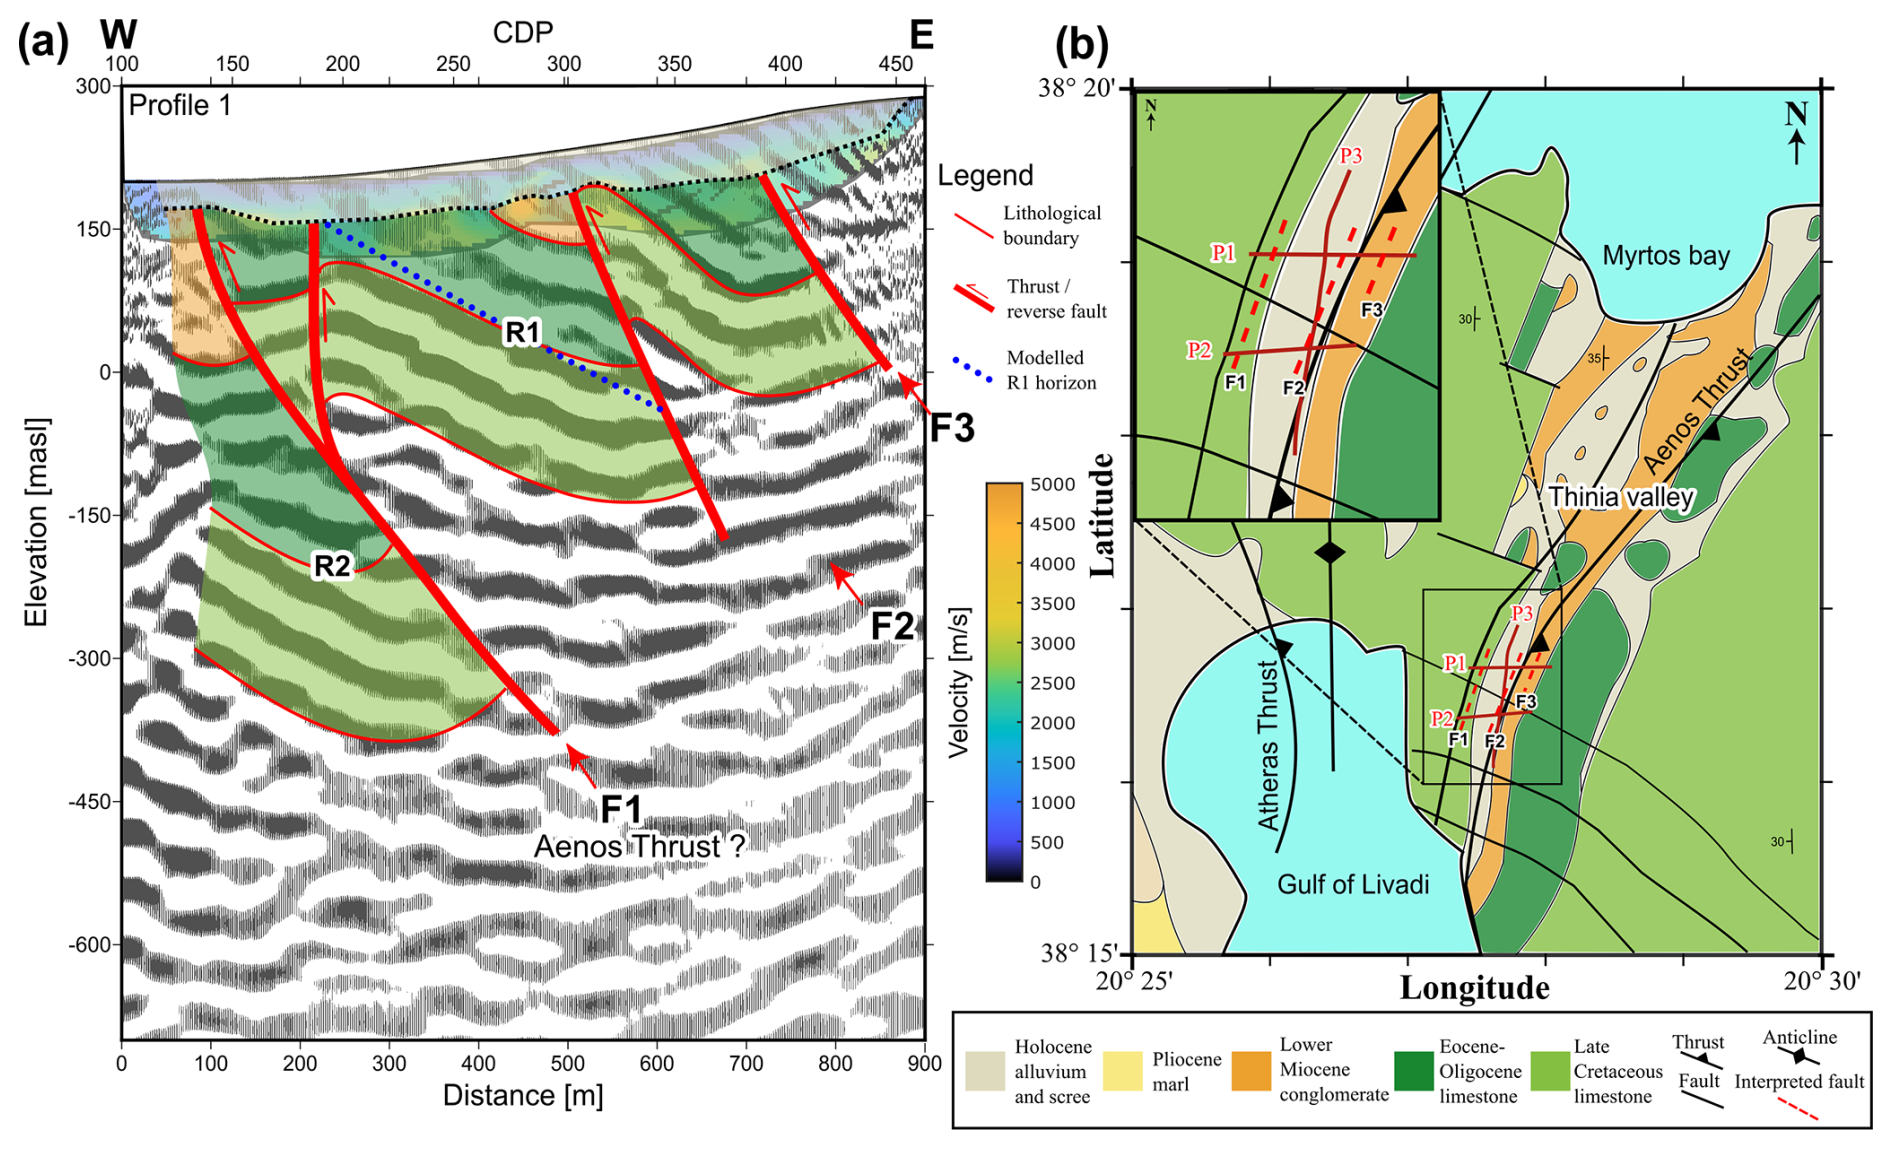
Figure 8Interpreted results. (a) Migrated stacked section of profile 1 with an interpreted thrust/reverse faults system and velocity model resulting from the first-break travel time tomography. Blue dots show the modelled horizon resulting from the 3D reflection travel time modelling. (b) Top view of the Thinia valley with geological reconstruction adapted from Underhill (2006) and IGME (1985). In red is the location of the seismic profiles, and the dashed line indicates the projection of F1, F2, and F3 to the surface.
The interpretation of the seismic results is not straightforward due to the variable quality of the data along different profiles. The achieved data quality is due to a number of reasons that should be considered for future studies in similar settings. The geology of the site, characterized by high-velocity contrasts and steep structures, poses inherent limitations to the reflection seismic method. The rugged topography of the area constrained the spread of the profiles, influencing the data quality. This effect was particularly evident in profile 2, where cliffs and unstable areas limited the acquisition of source and receiver positions, resulting in a shorter spread and lower fold coverage compared to profile 1. Consequently, profile 2 exhibits a lower signal-to-noise ratio. Furthermore, the use of a small, accelerating drop hammer as the seismic source, chosen for its manoeuvrability in this challenging environment, provided limited energy, which is adequate to partially image the subsurface. On the last day of acquisition on profile 3, a technical problem with the main source forced the use of a sledge hammer, which proved too weak to image the subsurface for that profile. Considering these limitations, the proposed interpretation is a possible scenario accounting for the available information from geophysical and geological data.
Figure 8a shows that, as expected, most of the features identified on P1 are steeper and moved westwards after migration of the stacked section. A similar behaviour is expected also for the features on the other profiles after migration. The good match between the horizon modelled from the 3D reflection travel time modelling and R1 reflection on the migrated section (blue dots in Fig. 8a) confirms the reliability of the corresponding estimated geometries. Regarding the near-surface geology, along all the three profiles a low-velocity medium covers most of the identified structures (transparent grey in Fig. 8a). Its range of velocity and the lack of reflectivity is typical of loose materials that may have originated from landslides from higher elevations and mixed with the Holocene alluvium (Figs. 7 and 8). Slope failure in the area is mainly triggered by earthquakes caused by rupturing of the nearby, offshore KTFZ (as was the case in the 1953 event; Mavroulis et al., 2022), and their occurrence coincides with areas of steep morphology, favourable lithology, bedding geometry, and bedding structure, such as the eastern flank of Thinia valley.
After the migration of profile 1, the three identified structures F1, F2, and F3 appear more continuous (Fig. 8a). The migrated section and the velocity values obtained from the travel time tomography reveal that these structures can be interpreted as thrust/reverse east-dipping faults (Fig. 8). Consequentially, reflections R1 and R2 appear to belong to the same lithological unit displaced by F1. Structure F1 is imaged as an upwards-steepening thrust fault that comprises a main branch and a secondary splay. The exact surface location of the Aenos Thrust (also known as Ainos Thrust, Aeanos Thrust, or Kontogourata–Agon Fault) is unclear and slightly changes among the different maps; on the suggested interpretation F1 appears to be the main structure, displacing R1 and R2 by ca. 300 m, and therefore it most probably corresponds to the Aenos Thrust. The footwall to F1 is characterized by NNE–SSW to N–S kilometre-scale folds, which are mapped both in the IGME (1985) map and by Underhill (1989), the easternmost of which displays steep easterly dips at its eastern limb, which is cut and displaced by F1. The interpreted fault F2 develops on the hanging wall to F1; it is associated with a ca. 250 m throw, judging from the displacement of the east-dipping R1. Its linkage at depth with F1 is postulated, but it cannot be confirmed by the available data. Structure F3, close to the eastern extremity of P1, is poorly imaged, probably because of its non-breaking surface and the steeply west-dipping geometry of the limestones that form its hanging-wall (eastern) block, which is not favoured by the acquisition geometries. Structure F3 may be associated with an incipient asymmetric syncline that develops at its up-dip termination, where its throw appears to be minimized. When compared with the broad work of Hunter (2013), the different resolution of the two studies is highlighted and prevents an exact comparison. The steep east-dipping thrusts and the main east-dipping stratigraphy are in accordance in both studies. Hunter (2013) shows a higher resolution at shallow depth due to the detailed geological and structural mapping, while the seismic results better constrain deeper geometries. The acquired seismic data provide no information regarding the reactivation of the identified thrusts by the recent seismic events related to the supposed landslides.
All three structures identified in the seismic section form part of the Hellenide thrusts, as most of the compressional structures mapped on Kefalonia. Structures F1 and F2 may link at depth, forming splay fault structures of the main Aenos Thrust (Underhill, 1989); F3 may represent a blind fault.
For future acquisitions, the use of accelerated weight drop with a bigger mass could improve the signal quality but may reduce the number of shot positions, while bigger sources such as small vibrator trucks may be impossible to drive in similar settings. Acquisition of longer spreads could be beneficial for imaging steep structures. However, the employment of lighter sources and sensors would be necessary to overcome the challenges of the site's topography and acquisition logistics.
The three seismic profiles acquired during this work show variable data quality. The acquisition and processing faced numerous challenges posed by the complex geology and extreme topography of the island. After a tailored processing work aimed at enhancing the weak signal, profile 1 showed a higher ratio and reflection continuity with respect to the other acquired profiles, displaying two main east-dipping reflections and three highly east-dipping structures. The reflections R1 and R2 are identified as the same lithological contacts displaced by F1, with structures F1, F2, and F3 interpreted as thrusts/reverse faults. The 3D travel time modelling of reflection R1 in the shot gather and in the unmigrated stack section suggests a N23° strike and 44° dip angle towards the east, which is consistent with the observed local geology. Results of the first-break travel time tomography suggest the presence of a low-velocity medium with highly variable thicknesses that cover the other identified reflectivity structures. The velocity ranges together with the absence of reflectivity suggest the presence of landslide materials mixed with the Holocene alluvium, which add additional value when studying the archaeology of the site – a topic we did not want to elaborate on given the quality of the data. The other two profiles, although showing weaker signal and lower reflection continuity, somewhat confirm profile 1 results specially along profile 2, with corresponding features such as R1 and the two highly dipping structures, most likely corresponding to F1 and F2. The attempt to use the cross-shooting technique proved unsuccessful and would require a stronger source for recording far-offset data.
The acquired seismic data provide insights into the geology of the Thinia valley, where complex thrust/reverse fault systems appear to contribute to the uplift of the area and overburden landslide materials are detected. Further investigations and a renewed seismic survey using stronger seismic sources and longer arrays are recommended to improve the imaging of the interpreted structures and to shed light both on the complex geology of the region and on its history.
Data are available after the publication of this work and upon request.
SZ was involved in the acquisition and was responsible for the data preparation, the data processing, the interpretations, and the writing of the article. AM led the data acquisition and helped with the overall processing and writing of the article, the interpretational aspects, and the discussion. HK led the geological interpretation and participated in the discussion of the results. GA initiated the project and was involved in the discussions of the results and their interpretations. MP helped with the interpretation and discussion of the results. All authors contributed to the final preparation of the paper.
The contact author has declared that none of the authors has any competing interests.
Publisher's note: Copernicus Publications remains neutral with regard to jurisdictional claims made in the text, published maps, institutional affiliations, or any other geographical representation in this paper. While Copernicus Publications makes every effort to include appropriate place names, the final responsibility lies with the authors.
This article is part of the special issue “Seismic imaging from the lithosphere to the near surface”. It is not associated with a conference.
John Crawshaw from OUF has substantially contributed to all the organizational matters of the field data acquisition, and John R. Underhill and Peter Styles provided helpful advice for which we are grateful. We thank the contributions during the planning and data acquisition from Valentina Socco and her collaborators Chiara Colombero and Farbod Khosro Anjom from Politecnico di Torino, as well as mining engineers Stavros Karizonis, Dimitris Karaiskos, and Antonis Kamilakis from the National Technical University of Athens. Uppsala University provided the seismic recording equipment, and several team members contributed to the data acquisition, namely Magdalena Markovic, Lea J. Gyger, and George Donoso, for which we are grateful. The authors are grateful to the reviewers and the editors for their valuable comments and contributions, which have contributed to improving the quality of our work.
This study was partly supported by the Odysseus Unbound Foundation (OUF).
The publication of this article was funded by the Swedish Research Council, Forte, Formas, and Vinnova.
This paper was edited by David Snyder and reviewed by Edward Marc Cushing and one anonymous referee.
Ayarza, P., Juhlin, C., Brown, D., Beckholmen, M., Kimbell, G., Pechnig, R., Pevzner, L., Pevzner, R., Ayala, C., Bliznetsov, M., Glushkov, A., and Rybalka, A.: Integrated geological and geophysical studies in the SG4 borehole area, Tagil Volcanic Arc, Middle Urals: Location of seismic reflectors and source of the reflectivity, J. Geophys. Res.-Sol. Ea., 105, 21333–21352, https://doi.org/10.1029/2000jb900137, 2000.
Bittlestone, R., Diggle, J., and Underhill, J.: Odysseus Unbound: The Search for Homer's Ithaca, Cambridge University Press, ISBN: 0521853575, 2005.
Cushing, E. M., Hollender, F., Moiriat, D., Guyonnet-Benaize, C., Theodoulidis, N., Pons-Branchu, E., Sépulcre, S., Bard, P. Y., Cornou, C., Dechamp, A., Mariscal, A., and Roumelioti, Z.: Building a three dimensional model of the active Plio-Quaternary basin of Argostoli (Cephalonia Island, Greece): An integrated geophysical and geological approach, Eng. Geol., 265, 105441, https://doi.org/10.1016/j.enggeo.2019.105441, 2020.
Duermeijer, C., Nyst, M., Mejer, P. T., Langeries, C. G., and Spakman, W.: Neogene evolution of the Aegean arc: paleomagnetic and geodetic evidence for a rapid and young rotation phase. Earth Planet. Sc. Lett., 176, 509–525, https://doi.org/10.1016/S0012-821X(00)00023-6, 2000.
Gaki-Papanastassiou, K., Karymbalis, E., Maroukian, H., and Tsanakas, K.: Geomorphic evolution of western (Paliki) Kephalonia island during the Quaternary, Bulletin of the Geological Society of Greece, 43, 418, https://doi.org/10.12681/bgsg.11193, 2010.
Gaki-Papanastassiou, K., Maroukian, H., Karymbalis, E., and Papanastassiou, D.: Geomorphological study and paleogeographic evolution of NW Kefalonia Island, Greece, concerning the hypothesis of a possible location of the Homeric Ithaca, in: Geoarchaeology, Climate Change, and Sustainability, edited by: Brown, A. G., Basell, L. S., and Butzer, K. W., special paper 476, Geological Society of America, 69–79, https://doi.org/10.1130/2011.2476(06), 2011.
Ganas, A., Cannavo, F., Chousianitis, K., Kassaras, I., and Drakatos, G.: Displacements recorded on continuous GPS stations following the 2014 M 6 Cephalonia (Greece) earthquakes: Dynamic characteristics and kinematic implications, Acta Geodyn. Geomater., 12, 5–27, https://doi.org/10.13168/AGG.2015.0005, 2015.
Greek Institute of Geology and Mineral Exploration (IGME): Geological map 1 : 50.000, Cephalonia island (northern part), 1985.
Greek Institute of Geology and Mineral Exploration (IGME): Geological map 1 : 100.000, Cephalonia island, 1996.
Hunter, K. L.: Evaluating the geological, geomorphic and geophysical evidence for the re-location of Odysseus' homeland, “Ancient Ithaca,” Unpublished PhD Thesis, University of Edinburgh, 482 pp., http://hdl.handle.net/1842/8002 (last access: 16 May 2025), 2013.
Karakostas, V., Papadimitriou, E., Mesimeri, M., Gkarlaouni, C., and Paradisopoulou, P.: The 2014 Kefalonia Doublet (Mw 6.1 and Mw 6.0), central Ionian Islands, Greece: Seismotectonic implications along the Kefalonia transform fault zone, Acta Geophys., 63, 1–16, https://doi.org/10.2478/s11600-014-0227-4, 2015.
Karakostas, V. G., Papadimitriou, E. E., Karamanos Ch. K., and Kementzetzidou, D. A.: Microseismicity and seismotectonic properties of the Lefkada-Kefalonia seismic zone, Bulletin of the Geological Society of Greece, XLIII, 2053–2063, https://doi.org/10.12681/bgsg.11395, 2010.
Karymbalis, E., Papanastassiou, D., Gaki-Papanastassiou, K., Tsanakas, K., and Maroukian, H.: Geomorphological study of Cephalonia Island, Ionian Sea, Western Greece, J. Maps, 9, 121–134, https://doi.org/10.1080/17445647.2012.758423, 2013.
Lekkas, E. L. and Mavroulis, S. D.: Fault zones ruptured during the early 2014 Cephalonia Island (Ionian Sea, Western Greece) earthquakes (January 26 and February 3, Mw 6.0) based on the associated co-seismic surface ruptures, J. Seismol., 20, 63–78, https://doi.org/10.1007/s10950-015-9510-3, 2016.
Mavroulis, S., Diakakis, M., Kranis, H., Vassilakis, E., Kapetanidis, V., Spingos, I., Kaviris, G., Skourtsos, E., Voulgaris, N., and Lekkas, E.: Inventory of Historical and Recent Earthquake-Triggered Landslides and Assessment of Related Susceptibility by GIS-Based Analytic Hierarchy Process: The Case of Cephalonia (Ionian Islands, Western Greece), Appl. Sci.-Basel, 12, 2895, https://doi.org/10.3390/app12062895, 2022.
Özbakır, A. D., Govers, R., and Fichtner, A.: The Kefalonia Transform Fault: A step fault in the making, Tectonophysics, 787, 228471, https://doi.org/10.1016/j.tecto.2020.228471, 2020.
Poulter, S., Underhill, J. R., Kilcoyne, D., and Hodges, G.: Locating Ithaca: Continuing the search for Odysseus' island kingdom, Leading Edge, 31, 932–939, https://doi.org/10.1190/tle31080932.1, 2012.
Rodriguez-Tablante, J., Tryggvason, A., Malehmir, A., Juhlin, C., and Palm, H.: Cross-profile acquisition and cross-dip analysis for extracting 3D information from 2D surveys, a case study from the western Skellefte District, northern Sweden, J. Appl. Geophys., 63, 1–12, https://doi.org/10.1016/j.jappgeo.2007.03.001, 2007.
Sbaa, S., Hollender, F., Perron, V., Imtiaz, A., Bard, P. Y., Mariscal, A., Cochard, A., and Dujardin, A.: Analysis of rotation sensor data from the SINAPS@ Kefalonia (Greece) post-seismic experiment – Link to surface geology and wavefield characteristics 4. Seismology Effect of Surface Geology on Seismic Motion: Challenges of Applying Ground Motion Simulation to Seismology and Earthquake Engineering, Earth Planets Space, 69, 124, https://doi.org/10.1186/s40623-017-0711-6, 2017.
Stiros, S. C., Pirazzoli, P. A., Laborel, J., and Laborel-Deguen, F.: The 1953 earthquake in Cephalonia (Western Hellenic Arc): coastal uplift and halotectonic faulting, Geophys. J. Int., 117, 834–849, https://doi.org/10.1111/j.1365-246X.1994.tb02474.x, 1994.
Tryggvason, A., Rögnvaldsson, S. T., and Flóvenz, G.: Three-dimensional imaging of the P-and S-wave velocity structure and earthquake locations beneath Southwest Iceland, Geophys. J. Int., 848–866, https://doi.org/10.1046/j.1365-246X.2002.01812.x, 2002.
Tsanakas, K., Saitis, G., Evelpidou, N., Karymbalis, E., and Karkani, A.: Late Pleistocene Geomorphic Evolution of Cephalonia Island, Western Greece, Inferred from Uplifted Marine Terraces, Quaternary, 5, 35, https://doi.org/10.3390/quat5030035, 2022.
Underhill, J.: Quest for Ithaca, Geoscientist – The magazine of the geological society of London, 16, https://ermis.comitech.gr/files/Underhill_Geoscientist_Sep_2006_Ithaca_low_res.pdf (last access: 20 May 2025), 2006.
Underhill, J. R.: Late Cenozoic deformation of the Hellenide foreland, western Greece, Geol. Soc. Am. Bull., 101, 613–634, 1989.
Underhill, J. R.: Relocating Odysseus' homeland, Nat. Geosci., 2, 455–458, https://doi.org/10.1038/ngeo562, 2009.
Zappalá, S., Malehmir, A., Hong, T. K., Juhlin, C., Lee, J., Papadopoulou, M., Brodic, B., Park, S., Chung, D., Kim, B., and Lee, J.: Crustal-Scale Fault Systems in the Korean Peninsula Unraveled by Reflection Seismic Data, Earth and Space Science, 9, e2022EA002464, https://doi.org/10.1029/2022EA002464, 2022.
- Abstract
- Introduction
- Geology and seismicity of Kefalonia
- Seismic data acquisition
- Seismic data analysis
- Results
- Interpretation and discussion
- Conclusions
- Data availability
- Author contributions
- Competing interests
- Disclaimer
- Special issue statement
- Acknowledgements
- Financial support
- Review statement
- References