the Creative Commons Attribution 4.0 License.
the Creative Commons Attribution 4.0 License.
 | 25 Jul 2025
Poro–perm relations of Mesozoic carbonates and fault breccia, Araxos Promontory, NW Greece
Sergio C. Vinciguerra
Federico Vagnon
Irene Bottero
Jerome Fortin
Angela Vita Petrullo
Dimitrios Spanos
Aristotelis Pagoulatos
Fabrizio Agosta
Fault zones in carbonates control the storage and transport fluid properties. Their physical state can be very complex due to the interplay of diagenetic processes and multiple deformation episodes, leading to complex pore spaces given by overlapping voids space and crack damage. Aiming to assess key physical properties such as porosity and permeability for fault zones in the Araxos Promontory (Greece), we present the results of microstructural and laboratory measurements, including density, porosity, VP, VS and electrical resistivity for 54 blocks of Mesozoic carbonate host rocks and fault breccias originating from high-angle extensional and strike-slip fault zones. The host rocks consist of carbonate mudstones, wackestones, packstones, and sedimentary breccias from the Senonian and Vigla formations (Ionian zone) and include vugs due to selective dissolution. These rocks exhibit average density values, low porosity values, and medium-to-high P- and S-wave velocities. In contrast, fault breccia samples feature microfractures and display a wider range of density and porosity values, up to 5–10 times higher than those of the host rock, and a higher degree of anisotropy. To assess rock permeability and porosity-permeability relations, three different workflows were employed: (i) using Effective Medium Theory, inverting ultrasonic measurements; (ii) modelling a constant crack aperture of 1 µm; and (iii) using crack density values obtained from 2D image analysis. Selected samples were also tested in pressure vessels with confining pressure up to 80 MPa to reproduce in situ conditions. The application of the first two workflows showed a systematic variation of permeability with porosity. In contrast, the results of the third workflow, based solely on the outcomes of the digital image analysis, did not exhibit systematic variation. This behaviour is interpreted as a result of the non-selective dissolution of the outcropping carbonates, which causes a wide range of measured fracture aperture values and a lack of a clear poro–perm trend for host rocks due to the presence of stiff, sub-rounded pores and small vugs. On the contrary, the fault breccia exhibits a linear increase in permeability with porosity due to a connected pore network including microfractures.
- Article
(25794 KB) - Full-text XML
- BibTeX
- EndNote


Geophysical exploration methods commonly employed for the analysis of potential geofluid reservoirs include seismic survey, gamma ray logging, stress field detection survey and controlled source electromagnetic data surveys (Unz, 1959; Wang et al., 2021). Typically, the petrophysical analyses are performed on well logs or on undisturbed core samples directly retrieved from wells. However, prior to subsurface investigations, laboratory and field measurements are performed on outcropping analogues of deep reservoirs to identify fractures and faults and to assess their role in transport properties (Simmons and Cooper, 1987; Walsh, 1965). It is understood that isolated fractures such as cracks (referred to as joints for geologists) make rocks more compliant, while connected cracks make rocks more permeable and anisotropic when aligned to each other (Nelson, 2001). The superposition of multiple deformation mechanisms over extended periods of time may give rise to a complex rock fabric, thereby making the interpretation of field-scale seismic surveys highly challenging unless a priori knowledge of the physical state of the rock is established and understood. Moreover, the rock fabric is also affected by the diagenetic processes (Laubach et al., 2010; Bailly et al., 2019a, b, 2022), particularly in carbonates, where physical/chemical compaction and pervasive cementation occur (Ferraro et al., 2018; Regnet et al., 2019).
At a larger scale, fault zones in cemented carbonates may exert significant control on both storage and transport fluid properties (Ferraro et al., 2020; Chicco et al., 2023). Fault zones often include fault cores (FCs) consisting of fault rocks and main slip surfaces, as well as fault damage zones (DZs) consisting of fractured carbonates crosscut by small, subsidiary faults (Agosta and Aydin, 2006; Giuffrida et al., 2019). These zones form combined barrier–conduit permeability structures (Caine et al., 1996), where low-permeability FCs are flanked by fault zones (FZs), enhancing fault-parallel fluid flow (Rawling et al., 2001; Ferraro et al., 2018; Volatili et al., 2022). In the case of non-cohesive and permeable fault rocks, FCs also conduct fluids, allowing entire fault zones to function as distributed fluid conduits (Caine et al., 1996; Agosta et al., 2021).
However, estimating the permeability of both FCs and DZs is a complex task due to the heterogeneity and anisotropy of rock masses (Piscopo et al., 2018). Consequently, a large number of theoretical models have been proposed to predict changes in one property of cracked rocks based on the measurement of another property (Benson et al., 2006). Nonetheless, to apply any of these models, it is necessary to verify them by performing systematic control experiments in which all the relevant properties are measured on the same sample under the same experimental conditions. This approach eliminates possible errors arising from depositional and structural heterogeneities that form prominent anisotropies within carbonate rocks. To date, such systematic studies have been infrequent (Baud et al., 2017; Vincent et al., 2025).
In this work, we focus on the petrophysical characterisation of rock samples collected from the Araxos Promontory, in western Greece. This region, characterised by the presence of major petroleum systems extending into the Ionian Sea (Karakitsios, 2013), has been the subject of recent studies documenting the sedimentary infill of the Ionian Basin (Bourli et al., 2019a, b) and its tectonic evolution (Tavani et al., 2019; Smeraglia et al., 2023). Aiming to define the poro–perm relations for both host and fault rocks, we investigate a variety of carbonate lithofacies by integrating the results of 2D image and petrophysical analyses to compute permeability values and compare them with experimental measurements. Results are discussed in light of the direct observation of connected pore space, presenting a protocol for petrophysical carbonate analysis. The findings have potential applications in many geo-engineering fields, including CO2 storage in fractured carbonate reservoirs, geothermal energy production from low-middle enthalpy sites and the preservation of deep aquifers during fossil energy production.
At a larger scale, the study area of the Araxos Promontory is part of the Dinarides–Albanides–Hellenides orogenic belt, which formed as a consequence of the Cenozoic collision between the Adriatic–African and Eurasian continental plates (Papanikolaou, 2021; Robertson and Shallo, 2000; Roure et al., 2004; Underhill, 1989). The Hellenides Fold and Thrust Belt (FTB) is made up of four main structural domains, which respectively consist from west to east of (Fig. 1a) (i) Apulian carbonate platform, (ii) Ionian pelagic basin, (iii) Gavrovo carbonate platform and (iv) Pindos oceanic basin (Karakitsios, 2013; Underhill, 1989). These structural domains were tectonically juxtaposed during late Eocene–Miocene piggy-back thrusting tectonics (Robertson and Dixon, 1984; Clew, 1989) with occasional out-of-sequence thrusting (Sotiropoulos et al., 2003). Currently, the outer domain of the Hellenides FTB is subjected to an active compression (Kiratzi and Louvari, 2003; Jolivet and Brun, 2010).
The Araxos Promontory pertains to the Internal Ionian Zone, east to the Gavrovo thrust (Fig. 1a). It is bounded northward by the roughly WNW-striking and seismically active normal faults of the Gulf of Patras and Corinth (Jolivet et al., 2015), and flanked by Holocene continental deposits both eastward and southward. The studied area is made up of an E–SE-dipping carbonate monocline including Lower Cretaceous, chert-bearing, deep-water limestones (Danelian et al., 2018; Skourtsis-Coroneou et al., 1995) and Upper Cretaceous–Eocene pelagic and hemipelagic limestones with frequent calciturbidites and sedimentary breccias interlayers (Bourli et al., 2019a; Karakitsios and Rigakis, 2007). The latter breccias and calciturbidites are made up of Vigla-derived clasts, with minor intercalations of thinly bedded pelagic limestones. A detailed lithostratigraphic representation of the Ionian carbonates is reported in Fig. 1b (Karakitsios, 2013). Stampfli (2005) assessed that the Triassic–Early Jurassic succession is also part of the syn-rift sequence. Altogether, the Triassic–Early Jurassic pre-rift and the Early Jurassic–Late Jurassic syn- and the younger post-rift sequences were later deformed during thrusting tectonics by means of NNW–SSE-striking thrust faults and folds, which solved a WSW–ENE shortening direction (Tavani et al., 2019; Underhill, 1989). Smaller-scale folds associated with N–S shortening were also documented east of the island of Lefkada, throughout the Hellenides, and in the Araxos Promontory (Smeraglia et al., 2023).
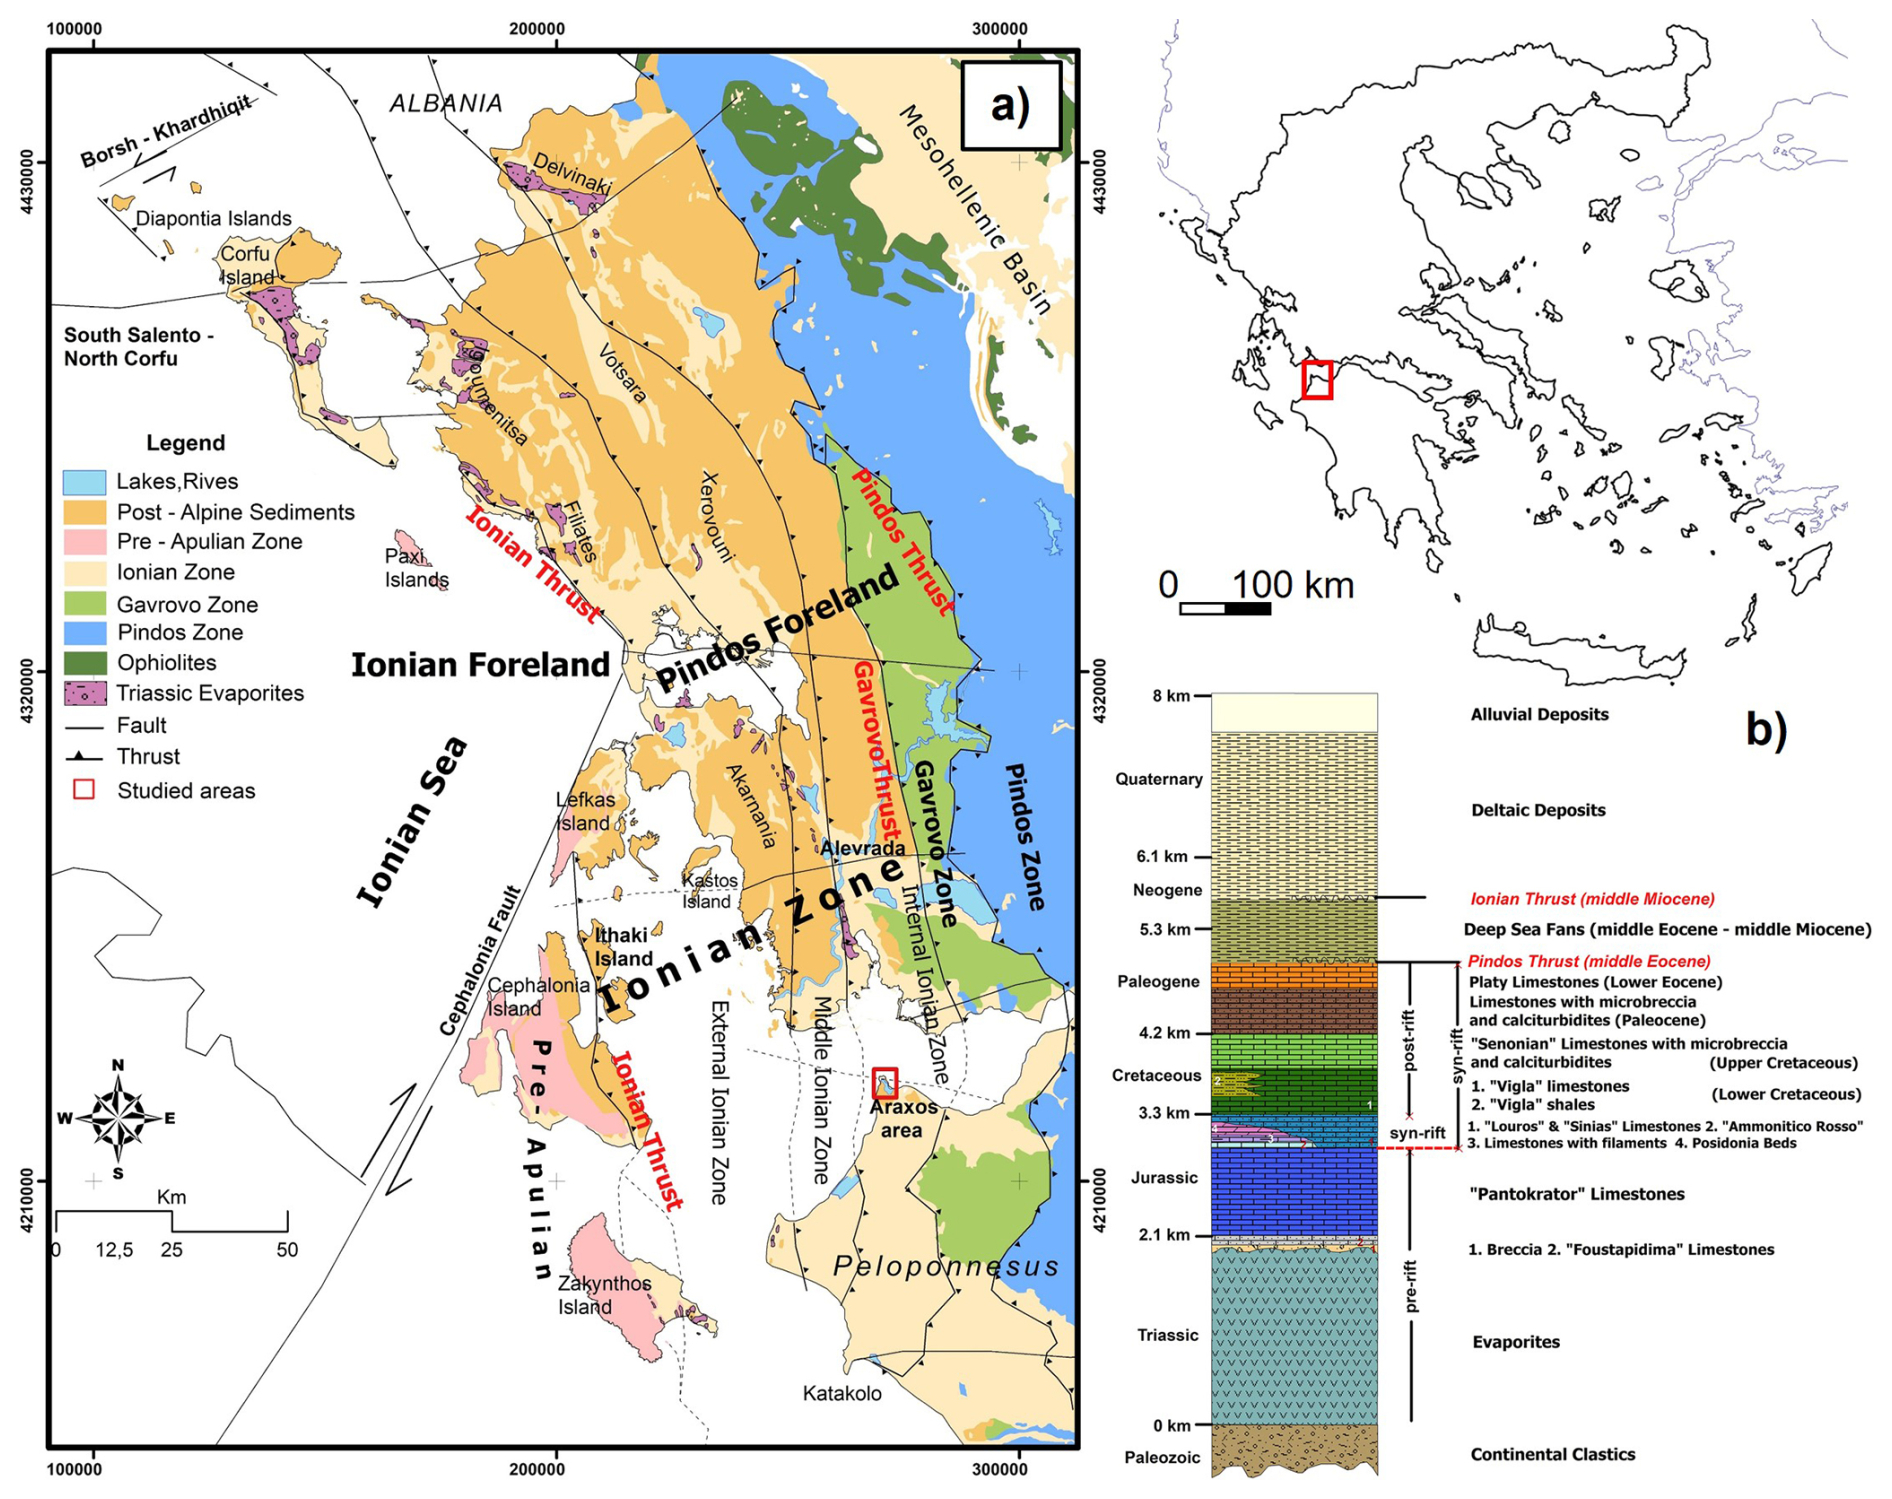
Figure 1(a) Geological sketch of western Greece and (b) the lithostratigraphic column of the Ionian zone (modified from Bourli et al., 2019a).
3.1 Sampling strategy and classification
Cubes and parallelepipeds with sides measuring 6–10 cm, hereafter named rock blocks, were saw-cut from the oriented hand specimens collected in the field. The rock blocks were used to perform experimental analyses aiming at measuring the values of porosity, density, ultrasonic velocities and electrical resistivity at room pressure and temperature.
The rock blocks were collected in the same study area along different fault zones (further details in Appendix A), characterised by different kinematics (normal vs strike-slip), ages and dimensions in order to be representative of the five different structural domains identified (Woodcock and Mort, 2008):
-
17 host rocks exposed away from major fault zones (HR-AFZ),
-
7 host rocks in proximity to fault zones (HR-PFZ),
-
5 fragmented host rocks from fault zones (FHR-FZ),
-
10 crush fault breccia from fault zones (CFB-FZ),
-
15 fine-crush fault breccia and fault microbreccia from fault zones (FCFB-FZ).
The collected blocks were oriented with reference to the north and perpendicular to the stratification or fault direction, depending on whether they belonged to the host rocks or fault breccias. To ensure representativity of the blocks collected, no fixed sampling distance was set from the main slip surfaces because of the varying properties of the fault zones considered (e.g. kinematics, size). See Fig. 4 for a schematic cross-section. Additionally, in Sect. 4.1, further details of the classification based on the study of matrix versus clasts for each structural domain are provided.
3.2 Rock texture digital analysis
For rock texture digital analysis, 48 rock slabs obtained from the same hand specimens employed for petrophysical analyses were selected for microstructural analysis, detailed as follows:
-
6 host rock samples collected either away (HR-AFZ) from or in proximity to fault zones (HR-PFZ),
-
5 fragmented host rock samples (FHR-FZ) collected from fault zones,
-
19 crush fault breccia samples (CFB-FZ) from fault zones,
-
18 fine-crush fault breccia and fault microbreccia samples (FCFB-FZ) collected from fault zones.
The rock slabs were saw-cut either parallel or perpendicular to bedding/slip surfaces, while those taken away from the fault zones were parallel to the strike of single beds. Each rock slab was manually polished, in order to acquire good-quality digital images, and then scanned using a high-resolution, 2400 dpi scanner. As a result, a detailed textural analysis was conducted aiming at assessing the main rock textures, as well as the shape, size, sphericity, and roundness of both clasts (host rock samples) and survivor grains (fault-related samples). After preliminary qualitative analyses, a discrete 1 cm2-wide area was selected from the individual textures documented in single rock slabs to perform quantitative image analysis. This means that rock slabs with homogeneous texture were analysed by selecting one representative area; those with multiple textures were analysed by selecting two or more representative areas. In all cases, centimetre-sized clasts/grains were avoided. The digital images were processed using both Gimp and ImageJ software applications, which allow us to manually draw the individual clasts/survivor grains and carefully trace their individual shapes. As a result, a bitmap image was obtained for each 1cm2 area; there, clast/survivor grains were shown in black, while both carbonate matrix and cement were shown in white (Fig. 2a). Pores were not considered at this stage of the work. Afterwards, using the command “analyse particles” of the ImageJ software, all clasts/survivor grains were automatically processed to measure the following parameters: (i) particle count, (ii) total particle area, (iii) average particle size, (iv) area fraction representative of the percentage of clasts/survivor grains (pixels highlighted in black using the Threshold command), (v) percentage of matrix and (vi) perimeter of the clast/survivor grains. Here we focused on the computation of the box-counting dimension D0(grains) (Fig. 2b). The resulting plot of box size versus the number of boxes containing at least one portion of a clast or survivor grain is shown in Fig. 2b. Data points were fitted by a power-law function (Mandelbrot, 1985; Falconer, 2003), and the angular coefficient of the best-fit line represented the D0 value. Specifically, D0 is equal to the ratio between log N (N: number of boxes including the given object) and log r (r: inverse of the box size). We note that this digital image analysis is quite common in the case of cohesive rocks (Ferraro et al., 2018), when the traditional sieving technique cannot be performed.
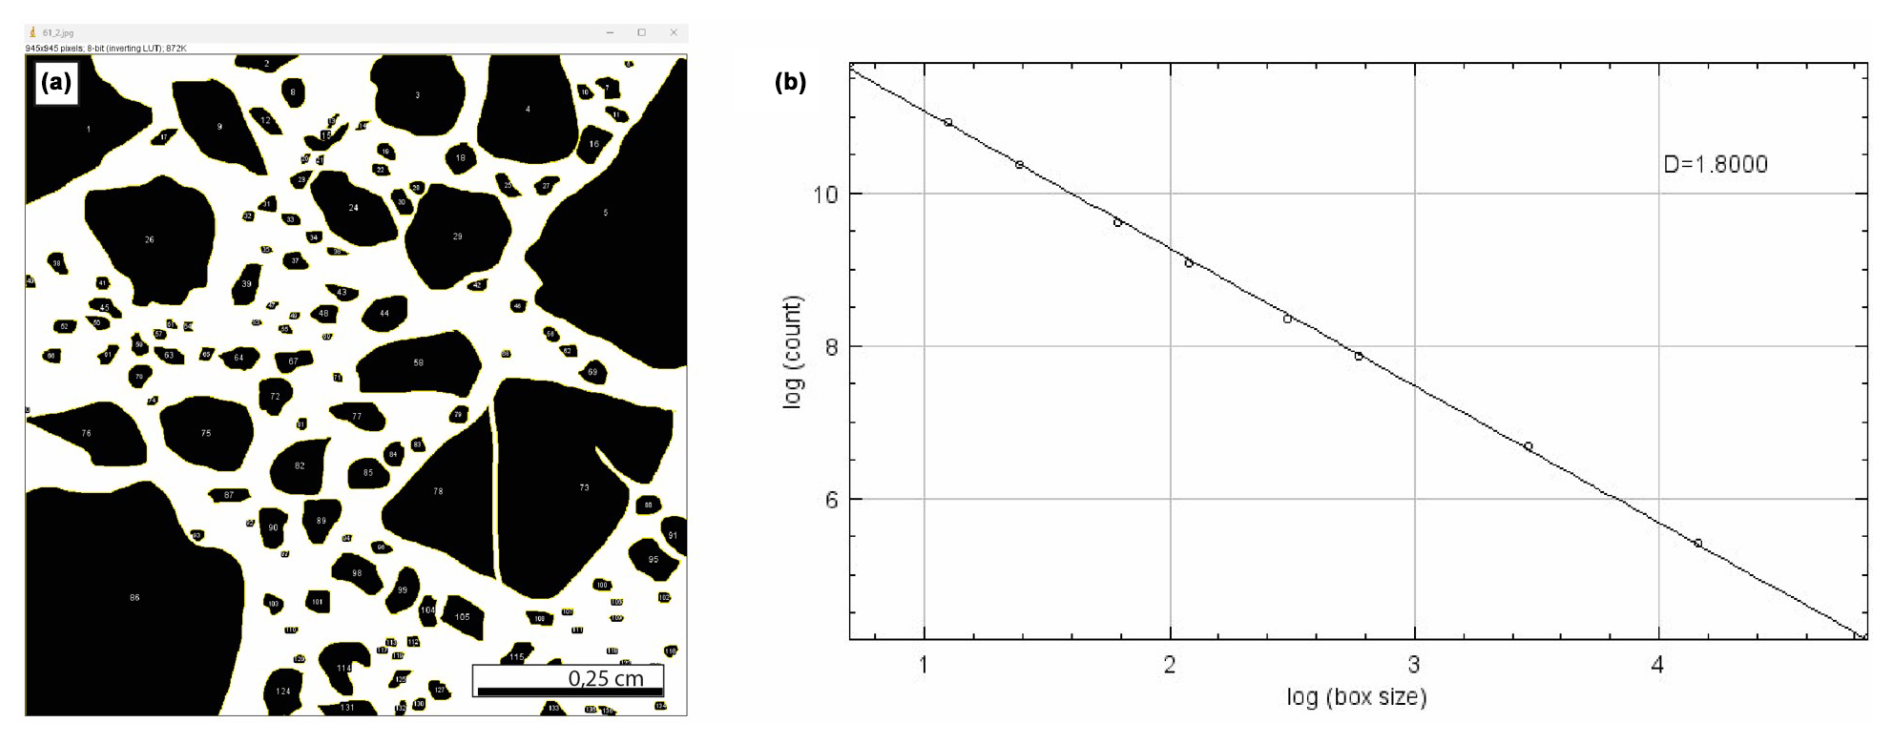
Figure 2(a) Example of the scanning of a polished plate, in which a representative, homogeneous area of 1 cm2 is highlighted in the enlargement. In the corresponding bitmap image of the enlargement, the surviving grains or clasts are black, while the carbonate matrix, cements and pores are white. (b) Example of a plot of box size vs. number of counts, in a log–log space, which allows computation of the box-counting fractal dimension, D0, which represents the angular coefficient of the best-fit line. D0 is therefore equal to the ratio between log N (number of boxes including the given object) and log r (inverse of the box size). We note that the box-counting fractal dimension, D0, is automatically reported as D by the ImageJ software.
Aiming at assessing the 2D pore properties, a 4 × 6.5 cm wide thin section impregnated with a blue-dyed epoxy resin was then obtained from the single 48 rock slabs. Images of 6.17 × 4.55 mm wide areas selected from individual thin sections were taken by means of a Nikon Eclipse E600 optical microscope equipped with a Nikon E4500 camera. Areas were chosen to fully characterise the textural heterogeneities observed in the thin sections. Areas containing macropores were excluded to prevent any potential bias in the calculated values. Afterward, applying the “select colour” command of the Gimp software, the blue portions filled with the epoxy resin were selected. The obtained bitmap images highlighted the pores, shown with a black colour, with respect to the clasts, survivor grains, and matrix and cement shown with a white colour. Then, using the command “analyse particles” of ImageJ software (see Fig. 3), all black objects (pores) included in the 6.17 × 4.55 mm wide binary images were automatically counted to compute the following: (i) 2D-connected porosity (percentage of pixels highlighted in black using threshold), (ii) circularity (shape factor, with 1.0 indicating a perfect circle and values close to zero indicating a very elongated shapes) and (iii) aspect ratio (ratio between longest and shortest axes of ellipses inscribed within each pore). The box-counting dimension, D0(pores), was then computed. This dimension therefore had a physical meaning similar to the fractal dimension related to pore throat distributions (Thompson, 1991; Ferraro et al., 2020).
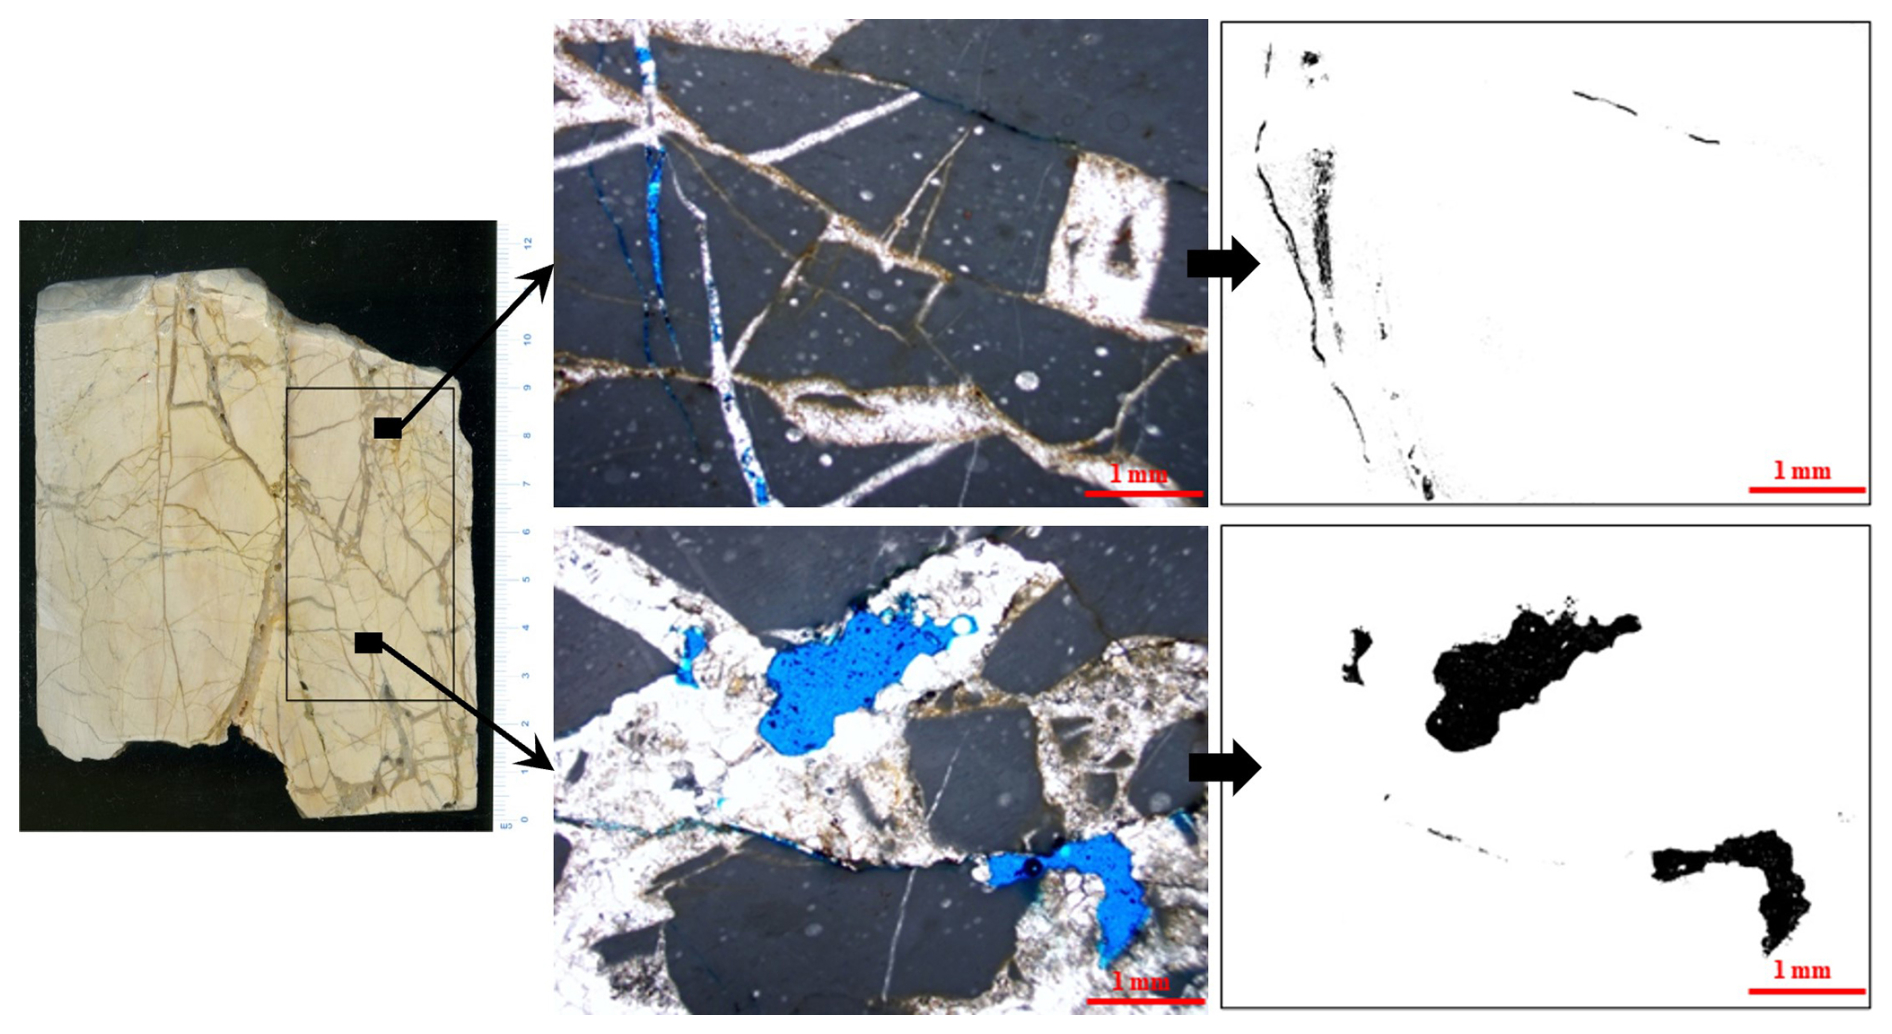
Figure 3Example of thin sections, in which two representative homogeneous areas of 1 cm2 are highlighted in the enlargements. In the corresponding bitmap image of the enlargement, pores are black, while clast, survivor grains, rock fragments, matrix and cements are white.
3.3 Petrophysical characterisation at room pressure and temperature
3.3.1 Dimensions, weight and volume
The measurement of physical properties such as density, ρ, and porosity, n, provides information on the mechanical characteristics of rocks. The presence of pores in the rock fabric decreases the strength and increases the deformability. Carbonates usually exhibit a wide range of porosities and hence various mechanical properties. Since the tested rock blocks were considered with a regular geometry and consisted of non-friable and coherent rocks (not appreciably swelling or disintegrating when immersed in water), density and porosity were determined following the “Suggested methods for determining water content, porosity, density, absorption and related properties” of ISRM (1979). With this aim, the bulk volume, V, of each specimen was calculated using the water displacement method with a precision of 10−4 m3. The specimens were saturated by water immersion and repeated shaking (to removing trapped air) for 1 week. Tap water with an electrical conductivity of 300 µS cm−1 was used as the saturating fluid. This choice was preferred over distilled water, as the latter typically exhibits very low electrical conductivity values, which could influence the electrical resistivity measurements performed on the same rock blocks (see Sect. 3.3.3). The aforementioned methodology was previously employed by the authors (Vagnon et al., 2019), yielding satisfactory results comparable with other independent rock porosity measurements, even in rock with low porosity values. The saturated-surface-dry mass, Msat, was then determined by drying the surface with a moistened cloth, taking care to remove only the surface water, and weighting the samples. The grain mass, Ms, was evaluated in natural conditions without a drying process in an oven to avoid any thermal alterations. Porosity and density (under dry, ρdry, and saturated, ρwet, sample conditions) were then obtained by employing the following Eqs. (1) to (4):
3.3.2 Ultrasonic-pulse-velocity (UPV) measurements
UPV measurements were performed using an ultrasonic-pulse generation and acquisition system (Pundit Lab, Proceq). Two Cylindrical 250 kHz tx-rx probe transmitter–receiver (tx-rx) transducers were used for P-wave (VP) and S-wave (VS) measurements, along the three orthogonal directions of each oriented block. Measurements were conducted following ASTM D2845-08 standard requirements (2008). For each sample, 11 ultrasonic traces were recorded on each direction, using a sampling frequency of 2 MHz. Manual picking of the first arrival times of the P-waves and S-waves was performed. The determination of the P- and S- wave ultrasonic velocity was then straightforward as the dimensions of each block were previously measured. The representative velocity of each sample was chosen as the average of the measurements along the three directions. By employing Eqs. (5) to (7), the combined measurement of both P- and S-wave velocities allowed us to retrieve the low-deformation (initial deformation phase of strain–stress curve) dynamic elastic parameters (Young modulus, E; shear modulus, G; and Poisson's ratio, ν) from indirect and non-destructive tests:
3.3.3 Electrical resistivity (ER) measurements
ER measurements were carried out with a measuring quadrupole connected to a Syscal-Pro (@Iris instruments) acquisition system. The instrumentation consisted of a rubber string with four steel electrodes (2 mm diameter and 40 mm length), equally disposed (3 cm). The electric measurement sequence was based on both Wenner–Schlumberger and dipole–dipole quadrupoles. The sequence was repeated three times on each block to obtain the apparent resistivity along the same directions used for VP–VS determinations and then averaged to obtain a representative electrical resistivity value of the sample. From the ratio between the measured electric potential difference, ΔV, and the injected current, I, the value of apparent resistivity, Rapp, was obtained as follows:
where k is a geometric factor, depending on the geometry of the adopted quadrupole. For Wenner–Schlumberger and dipole–dipole sequences, k is respectively equal to
where a is the electrode space of 3 cm, and n is equal to 1 because the electrodes are equally spaced.
The measurements were performed both in dry conditions and after saturation with tap water (electrical conductivity of 300 µS cm−1). These repeated measurements, along with porosity and ultrasonic velocity measurements, were useful for better understanding rock matrix permeability and the degree of fracturing/effective porosity. If the rock block exhibits high electrical resistivity in dry conditions and high resistivity in saturated conditions, it is plausible to consider it homogeneous, with resistivity close to the average of the minerals that compose the rock matrix. This holds true even with a high number of pores that are not interconnected. Conversely, a high resistivity value in dry conditions and low resistivity in saturated conditions indicate that the rock matrix contains a high number of connected pores, voids or fractures that can be saturated with air in dry conditions and with the saturating fluid in wet conditions (water with electrical conductivity of 300 µS cm−1 in this study). While in dry conditions, the resistivity is hypothetically close to air resistivity if the fracturing is very high, in saturated conditions, resistivity approaches the resistivity of the saturating fluid.
3.4 Permeability and UPV measurement at increasing confining pressure
Three samples, two CFB-FZs and one AFZ-HR, were selected and then tested in a pressure vessel at incremental effective pressures up to 80 MPa to measure permeability and UPV variation. Cylindrical shape samples with diameter equal to 40 mm and height of 80 mm were cored from the original cubic samples. Given the centimetre-scale sample size, the aim of these measurements was to determine the permeability of the matrix. During coring, fractures or obvious heterogeneities were avoided, focusing on capturing the pristine matrix. It is worth noting that the two CFB samples were sourced from different fault rock blocks characterised by a different amount of cementation. Measurements were performed at the Laboratoire de Géologie of École Normale Supérieure in Paris with a gas permeameter at different confining pressure steps (0.5, 2, 5, 10, 20, 40, 60, 80 MPa) to guarantee a gradual and progressive closure of the voids space.
Permeability measurements were performed using the constant-flow method under a fixed pressure gradient for permeability m2 (10−2 mD) and using the pulse decay method (PDM), for permeability m2 (10−2 mD). The PDM is based on the transient state induced in a porous media when the equilibrium state is perturbed by suddenly setting a pressure gradient in the sample. Typically, the upstream pressure (Pu) is increased, while downstream pressure (Pd) remains unchanged (). Upon perturbation, both up- and downstream pressures evolve with time (ΔP(t)) following an inverse exponential trajectory (transient state) in their natural seeks for the restoration of an apparent equilibrium condition (i.e. steady state). The time (α) needed by the system to restore the apparent equilibrium condition depends on the dimensions of the sample, its properties, the volumes of the up- and downstream reservoirs (Vu,Vd), the physical characteristics of the fluid, and the applied pressure gradient (ΔP0).
Since the time decay α is function of (i) permeability, (ii) viscosity of the pore fluid, (iii) the geometry of the sample, and (iv) the storage of the upstream (Cu) and downstream (Cd) reservoirs, permeability values can be calculated via α for each step of increasing pressure. Cu and Cd are defined as the ratios of the change of fluid volume to the corresponding pore pressure variation (%). It is well known that gas can cause problems at low pore pressure due to the Klinkenberg effect, as follows:
where k denotes the “true” permeability, pf the mean pore pressure inside the sample and b the so-called Klinkenberg correction coefficient. Following Li et al. (2009) we assumed that b follows a power law with , with b in megapascals (MPa) and k in millidarcy (mD). This relation is close to the power law found by Jones (1972) and Tanikawa and Shimamoto (2006) obtained on a large variety of rocks, resulting in and , respectively. Using Eq. 12 and the power law, the Klinkenberg effect was taken into account, and k was calculated for each relevant value of pf by solving Eq. (12) numerically (e.g., by means of Newton's method).
For the UPV measurements, a 250 V pulse with a rise time of 1 s was generated and transmitted to 2 Vp and Vs piezoelectric transducers placed at the top of each cylindrical sample. Each piezoceramic converted this electrical pulse into a mechanical vibration that propagated into the medium. Two receiving piezoceramics then converted the received mechanical waveform into an electrical signal that was amplified at 40 dB with a sampling frequency of 50 MHz.
4.1 Microstructural analyses
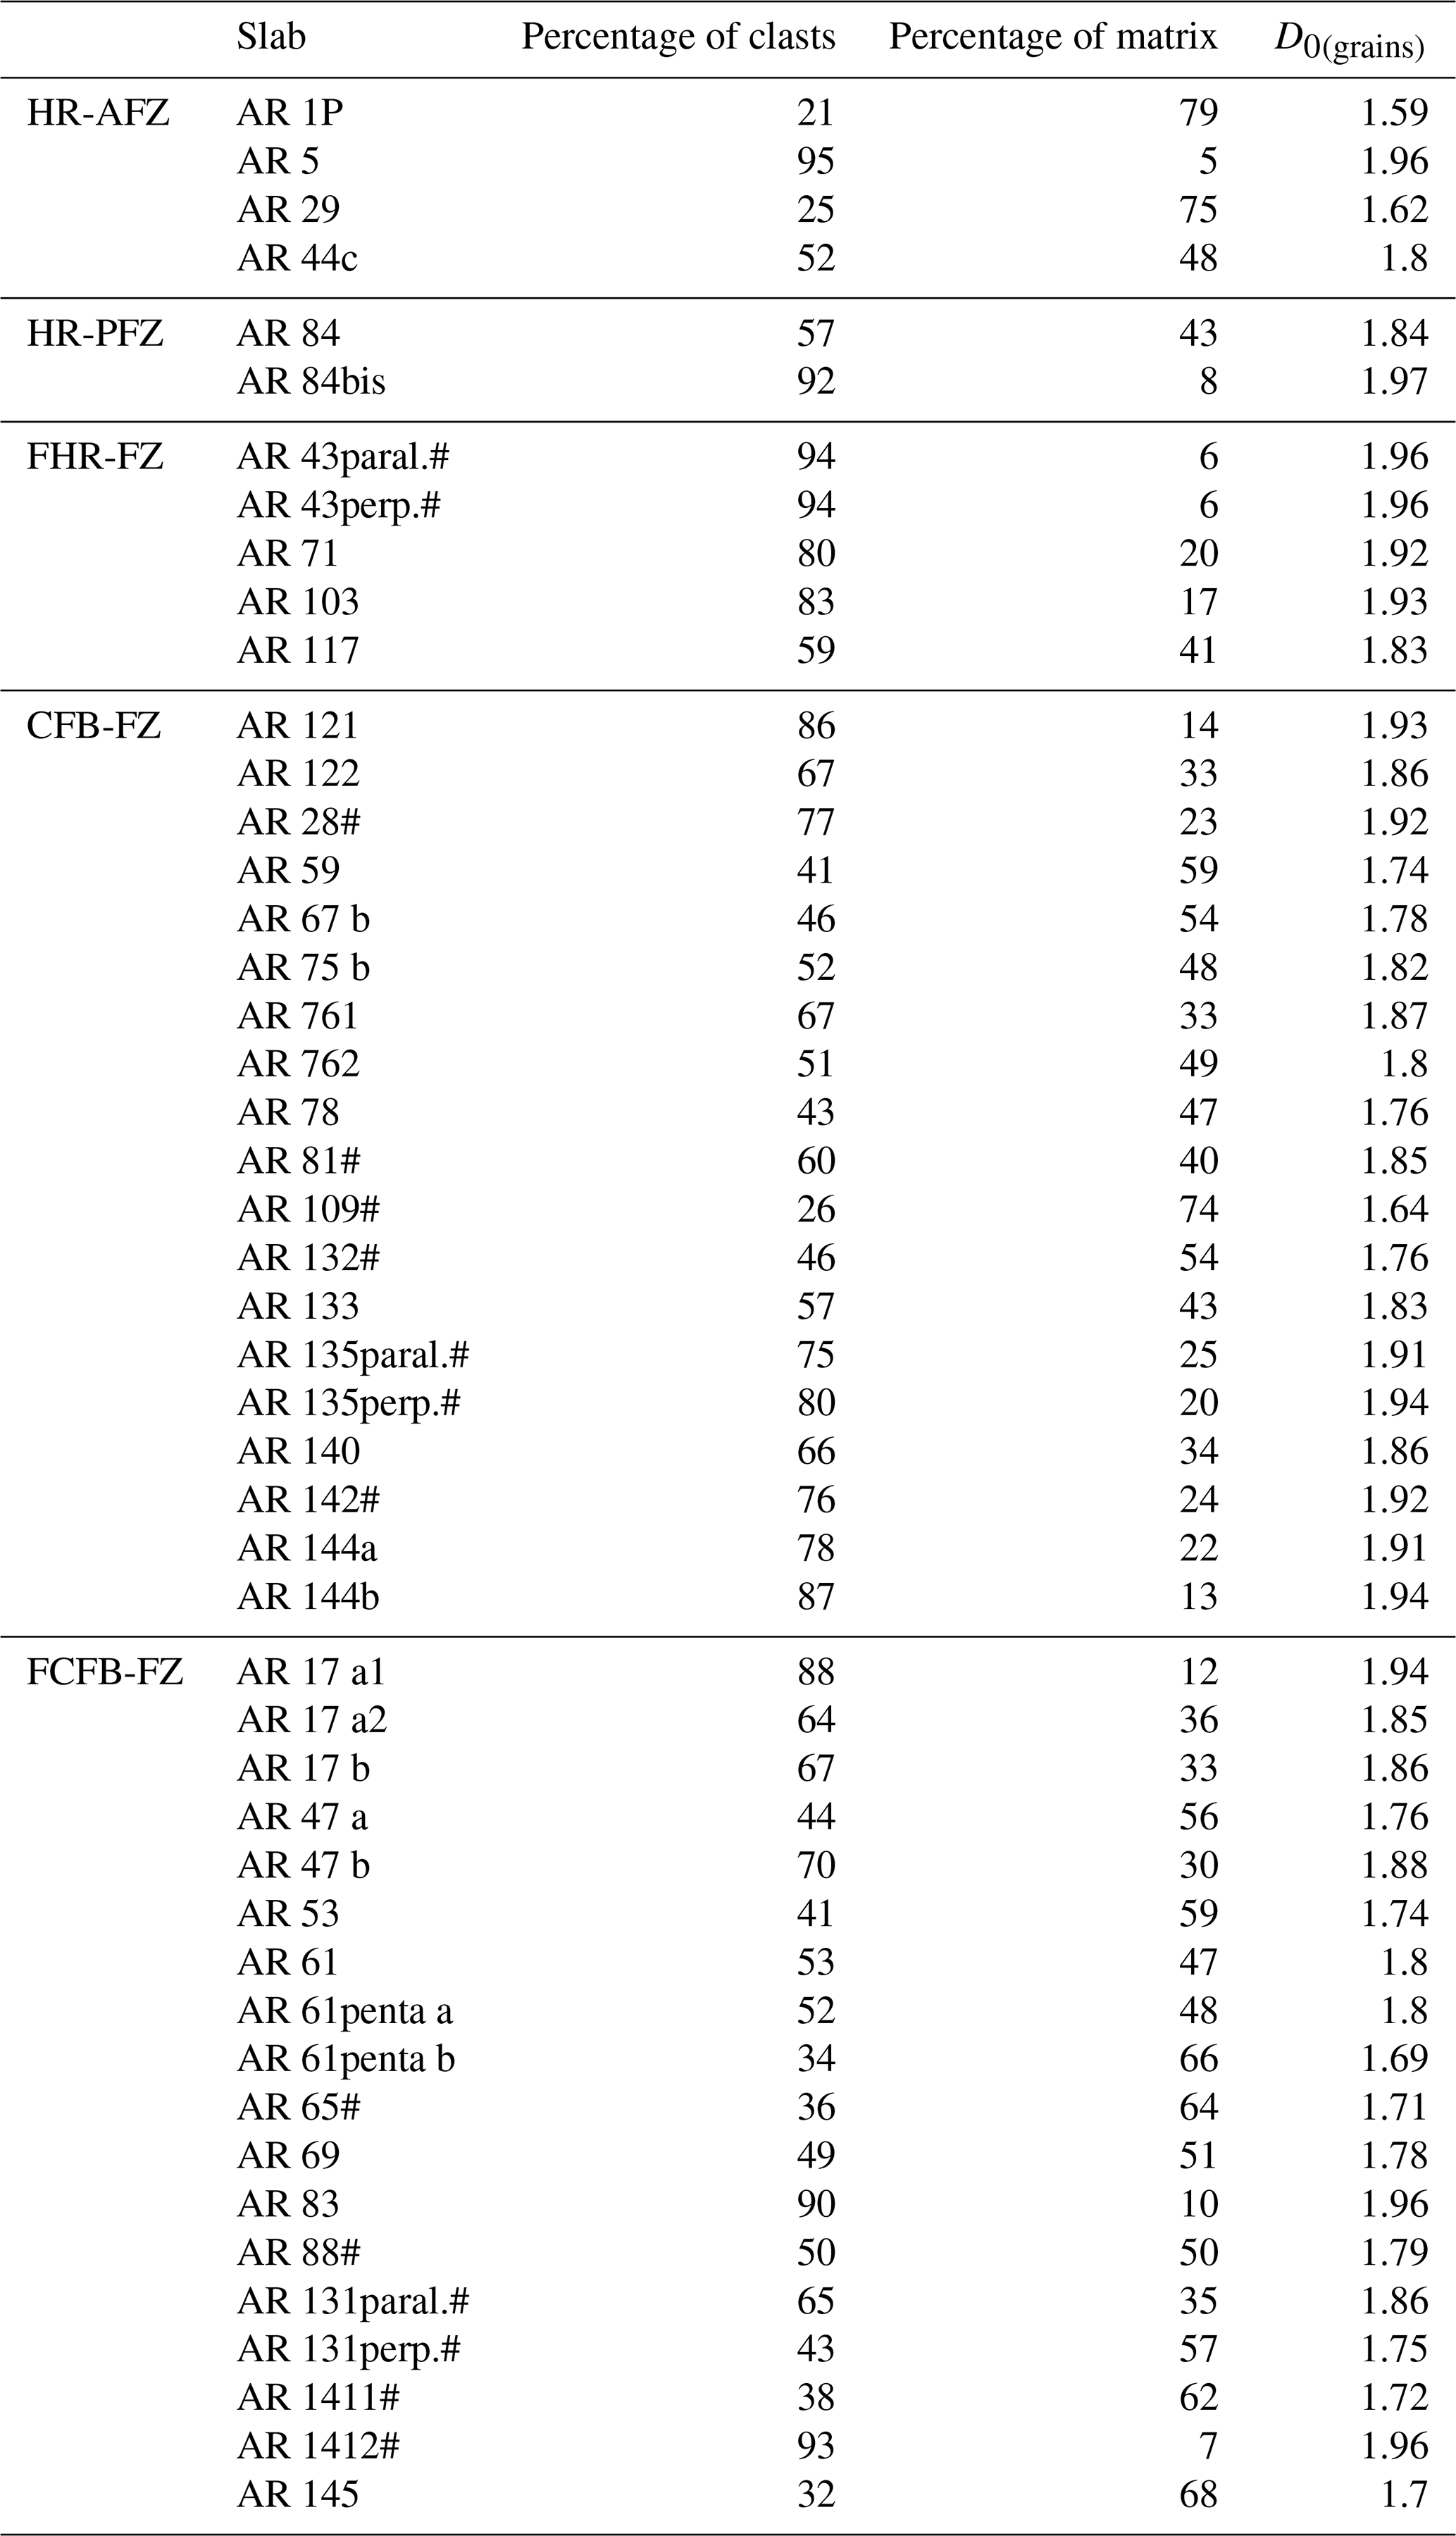
Figure 4 displays examples of the different analysed textures of the block samples. Rocks collected from the various structural domains are classified into five groups based on the percentage of matrix versus clasts and the values of the calculated D0(pores). Specifically, the main textures consist of (i) matrix-supported carbonates (both host and fault-related rocks, Fig. 4a and b), (ii) cement-supported carbonates (fault-related rocks, Fig. 4c), (iii) clast-supported carbonates (host rocks, Fig. 4d), (iv) survivor grain-supported carbonates (fault-related rocks, Fig. 4e) and (v) fragmented carbonates (host rocks, Fig. 4f). Table 1 summarises the main results obtained from digital image analyses performed on the rock slabs. Specifically, it reports the percentage of matrix versus clasts and the value of D0(grains).
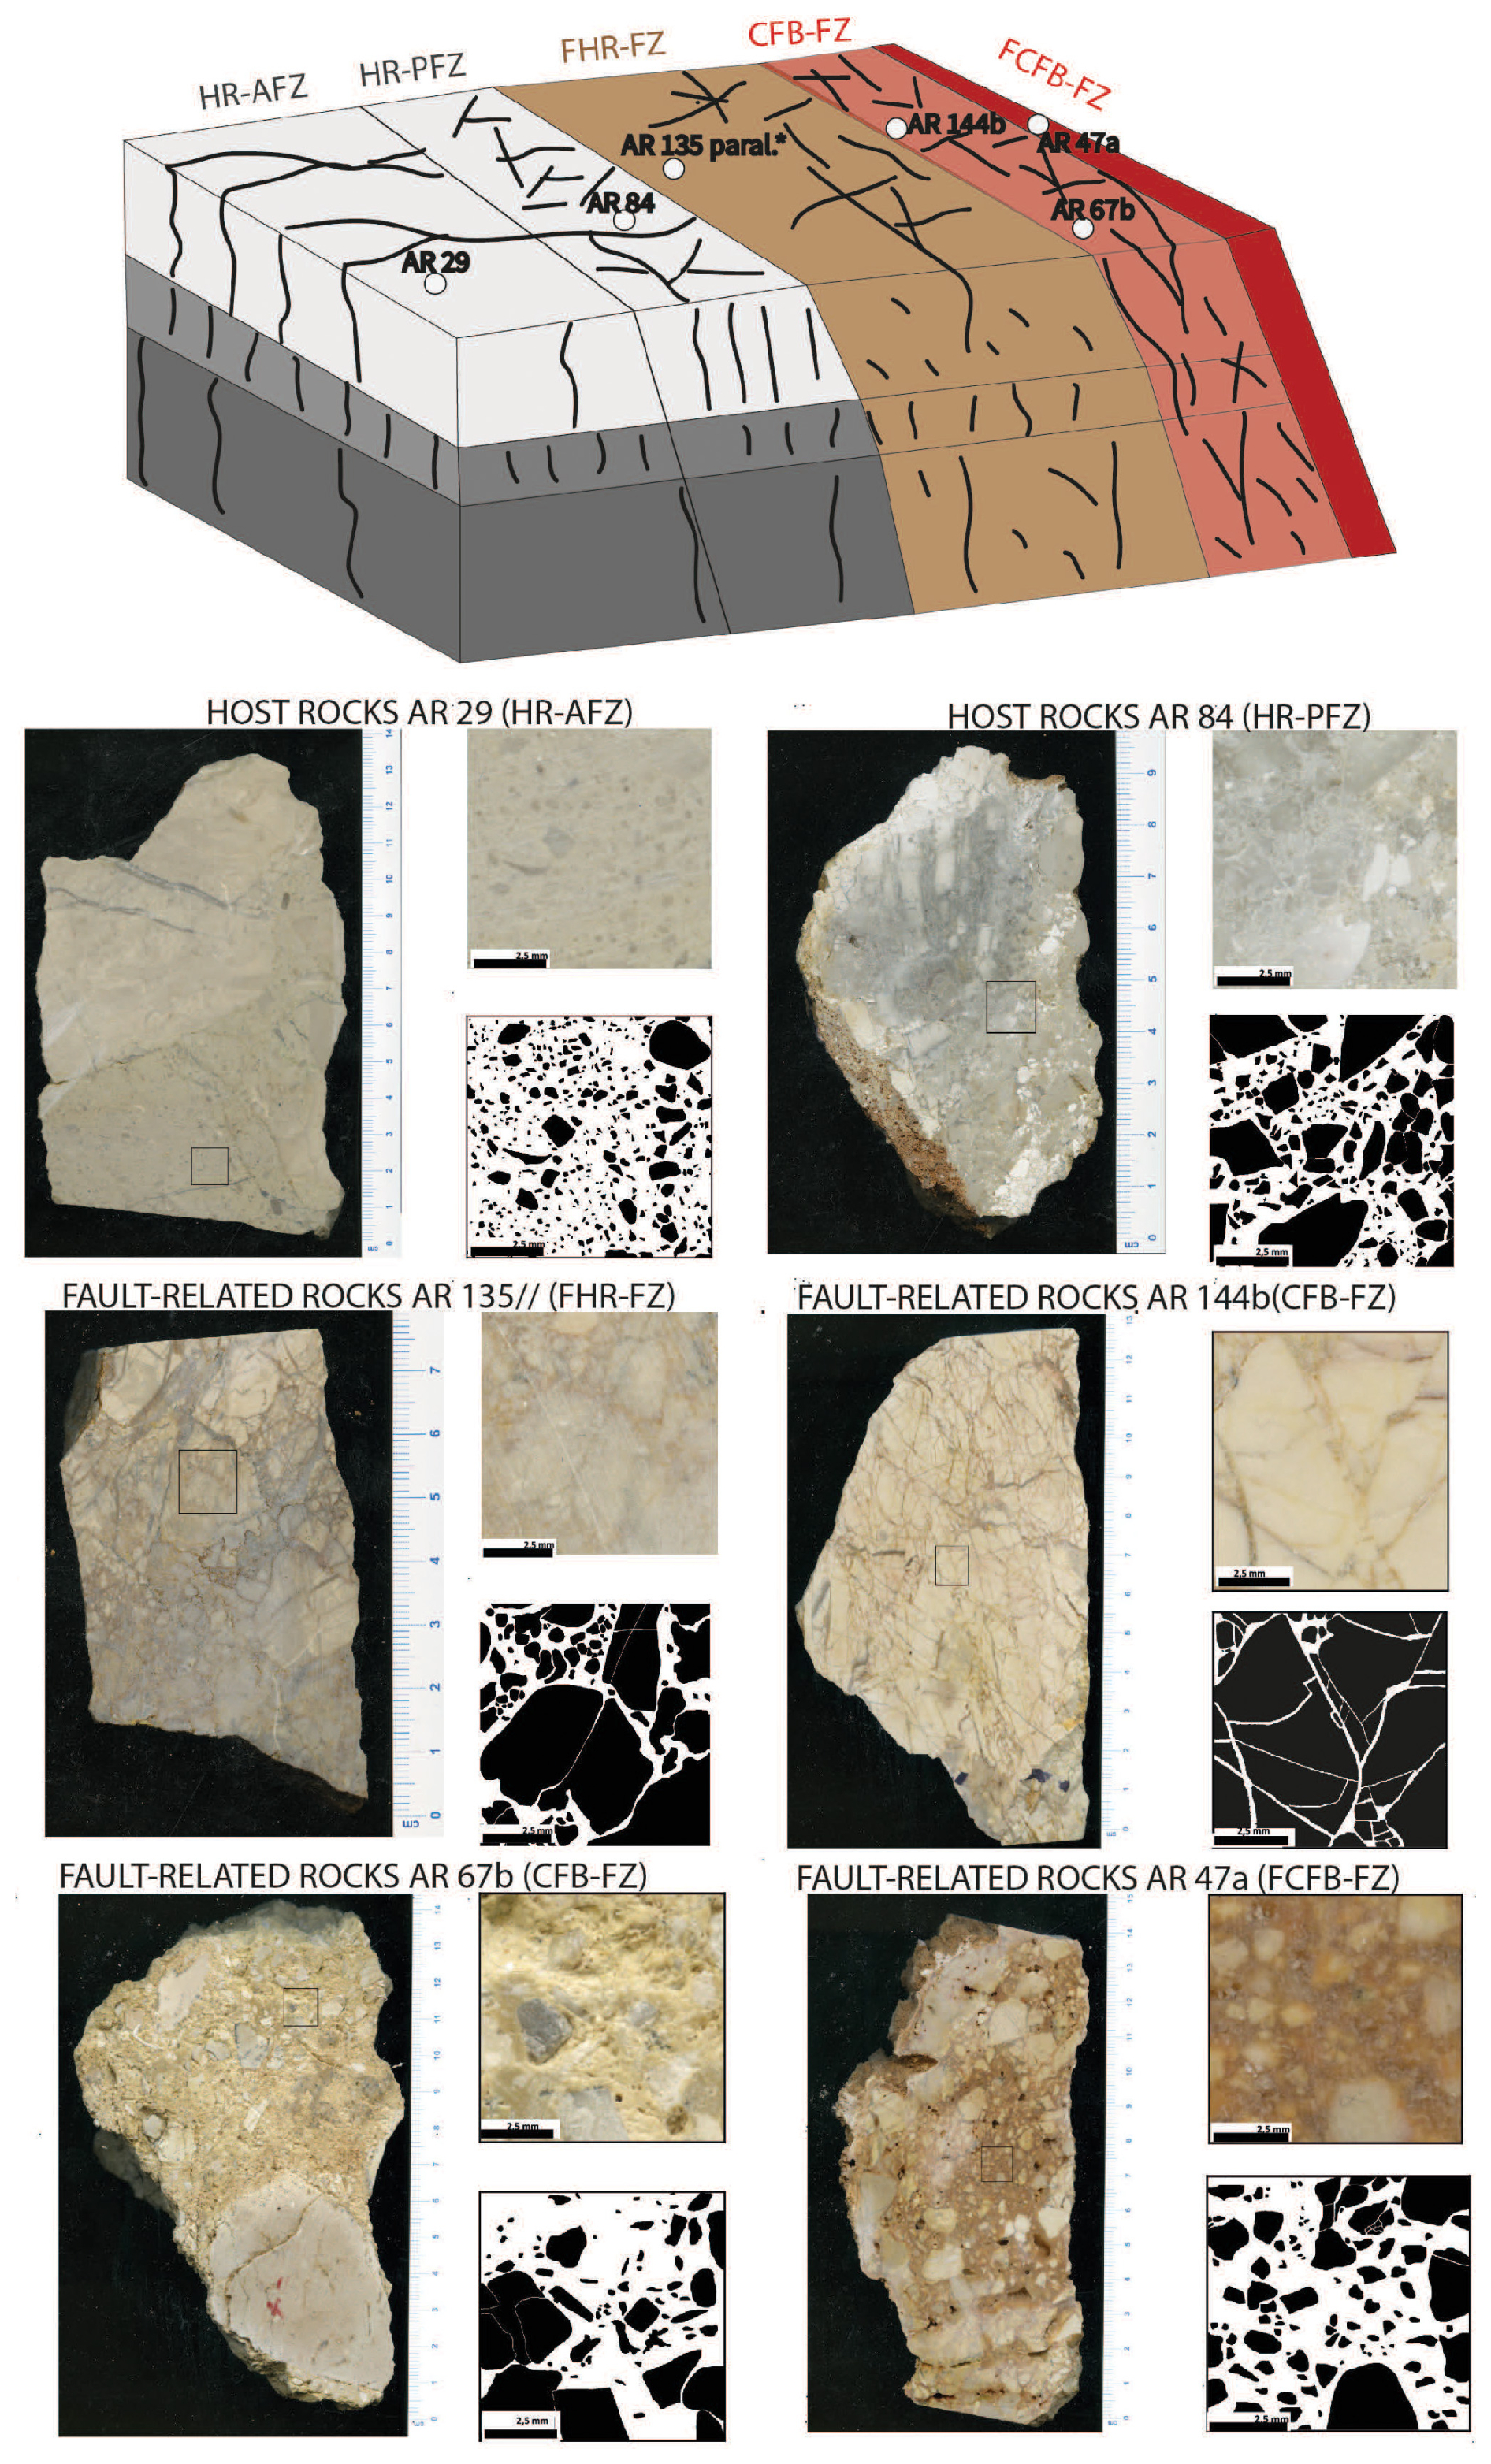
Figure 4Schematic cross-section of the footwall damage zone of the studied carbonate fault zones, in which the main structural domains are highlighted. Names of representative samples are reported for the single domains. The prevalent textures of the carbonate samples are the following: (a) matrix-supported carbonates (host rocks), (b) matrix-supported carbonates (fault-related rocks), (c) cement-supported carbonates (fault-related rocks), (d) clast-supported carbonates (host rocks), (e) survivor grain-supported carbonates (fault-related rocks) and (f) fragmented carbonates (fault-related rocks). The black square represents the 1 cm2 selected image for subsequent digital analysis. Upper right: 1 cm2 image for subsequent digital analysis.
Table 1Summary of image analyses performed on both host rocks and fault rocks.
The 2D digital image analyses of selected thin sections impregnated in epoxy resins are performed to quantify 2D optical porosity, D0(pores), and other pore characteristics such as aspect ratio and width. The six host rock samples collected either away from (HR-AFZ) or in proximity to fault zones (HR-PFZ) consist of four Senonian limestone and sedimentary breccia and of two Vigla limestone. All six samples include stylolite, microfractures and calcite veins. Pores very often align along microfractures but also form vugs due to non-selective dissolution of both clasts and matrix–cements (Fig. 5a and b). These samples show a mean 2D optical porosity ≤0.7 %, and D0(pores)≤1.15.
The five FHR-FZ samples collected from mesoscale fault zones consist of one Senonian limestone (two rock slabs) collected from a N110E-striking fault zone, FZ; one Senonian limestone collected from a N90E-striking fault zone; one Senonian sedimentary breccia collected from a N110E FZ; and one Vigla limestone collected from a N150E FZ. All five samples include microfractures and veins. Pores mainly align along the former structural elements. Both small and large vugs due to non-selective dissolution of both clasts and matrix–cements are present (Fig. 5c). Most of the samples show a mean 2D optical porosity from ∼ 4.12 % to ∼ 7.71 %, and D0(pores) ranges from ∼ 1.24 to ∼ 1.56. Differently, the fractured carbonate packstone is characterised by average values 2D optical porosity ∼ 0.21 % and a mean D0(pores) equal to 1.4.
The 19 CFB-FZ samples from fault zones consist of 2 samples collected from a N10E FZ, 2 samples from a N20E FZ, 7 samples from a N45E FZ, 4 samples from a N100E FZ, 3 samples from a N110E FZ and 1 sample from a N130E FZ. The cement–matrix-supported fault rock textures include vugs due to non-selective dissolution of both clasts and matrix–cements and pores that often align around the edges of survivor grains (Fig. 5d). Most of the samples show a mean 2D optical porosity 3 %, with some values ≥5; D0(pores) ranges from ∼ 0.6 to ∼ 1.62.
The 18 FCFB-FZ samples from fault zones consist of 1 sample collected from a N10E FZ, 2 samples from a N20E FZ, 3 samples from a N45E FZ, 1 sample from a N100E FZ, 9 samples from a N110E FZ and 2 samples from a N130E FZ. The samples include numerous microfractures and veins. Pores are mainly aligned along the former structural elements. Vugs due to non-selective dissolution of both survivor grains and matrix–cements are present (Fig. 5e). The 2D optical porosity ranges from ∼ 0.31 % to 8.52 % and D0(pores) from ∼ 0.91 to ∼ 1.76.
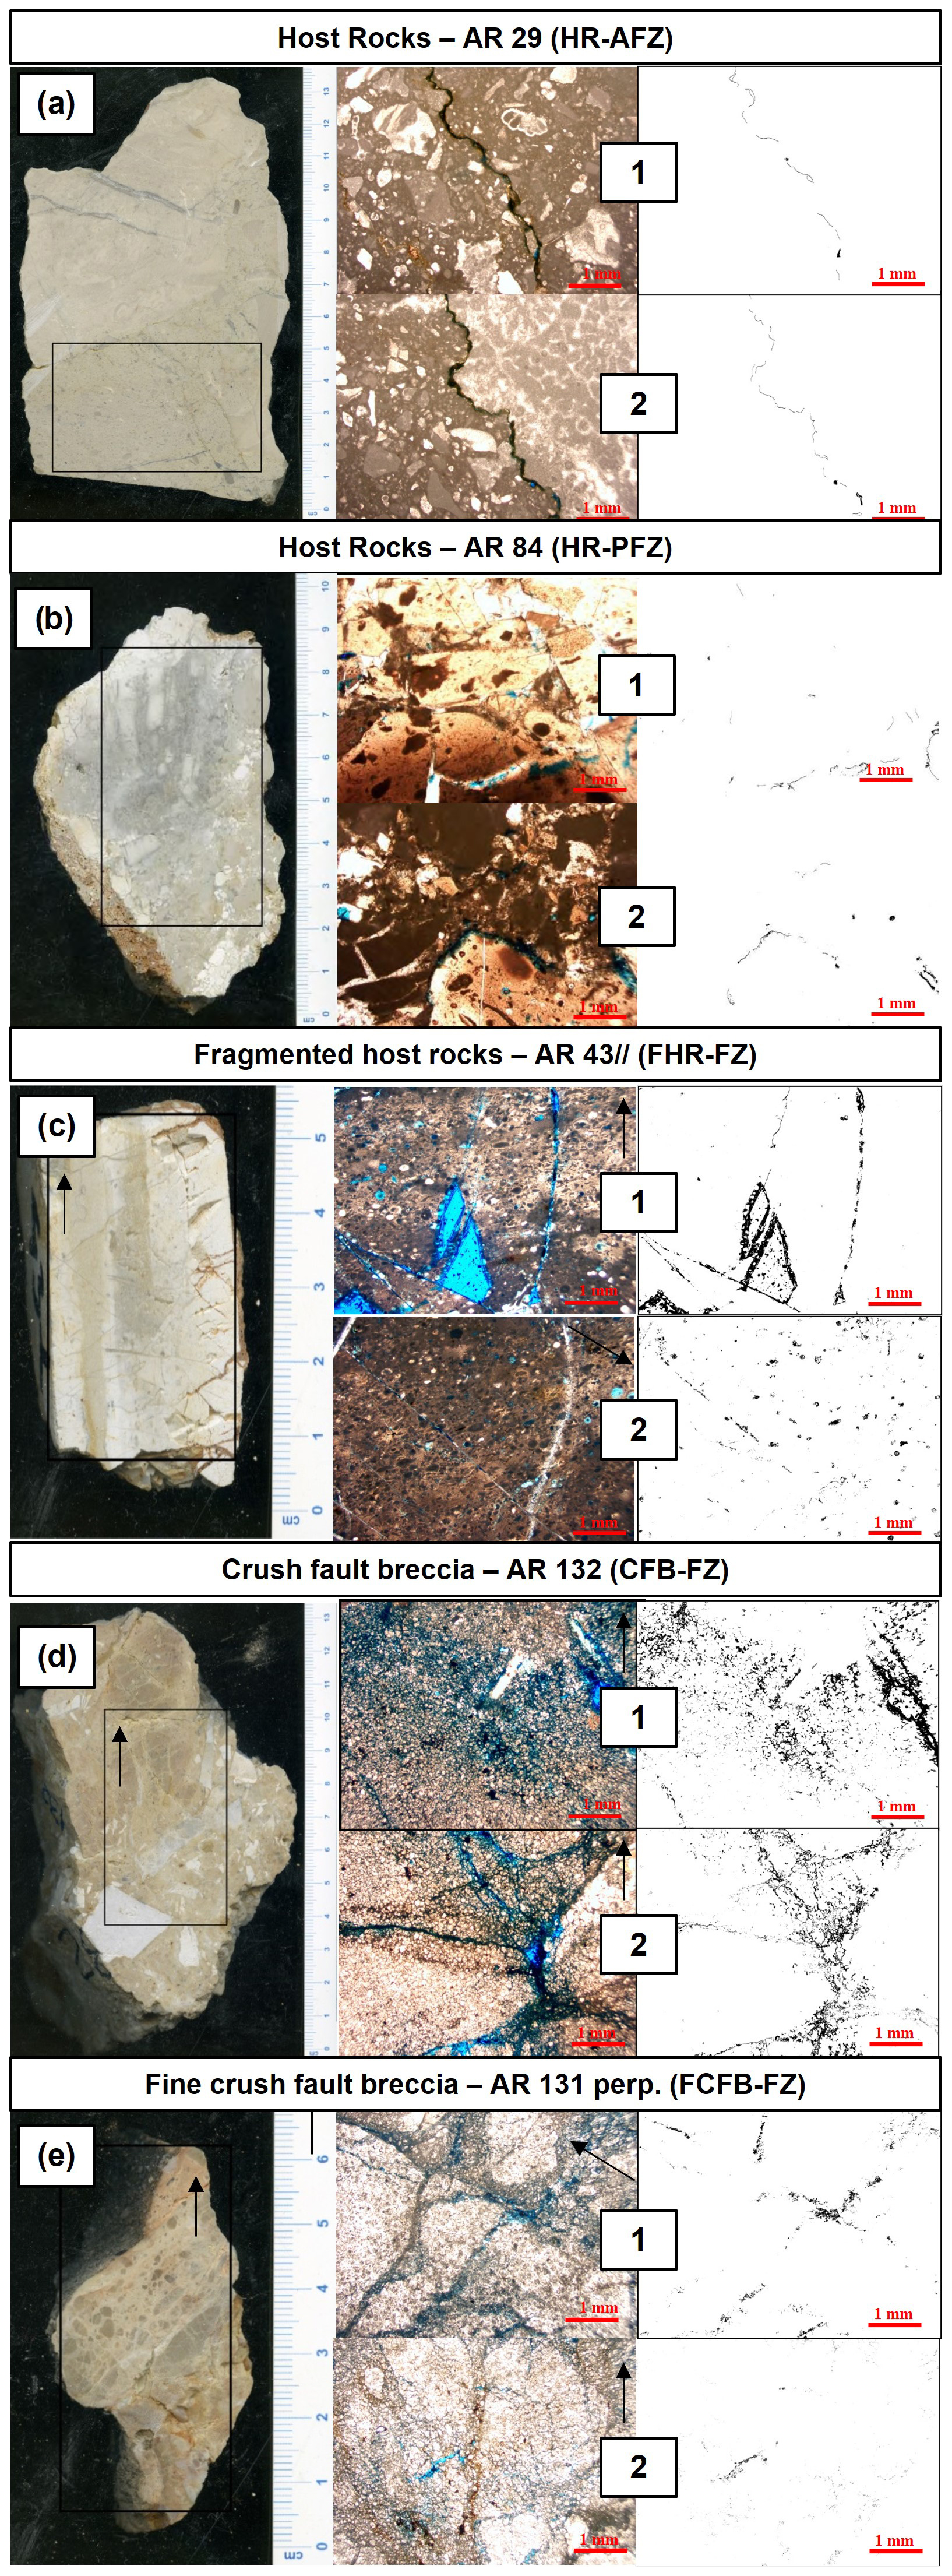
Figure 5The main pore types documented in (a) host rocks, (b) fragmented host rock, (c) crush fault breccia and (d) fine-crush fault breccia. The black square on the rock slab represents the thin section area. In the digital images, pores are in black and clasts, matrix and cement in white.
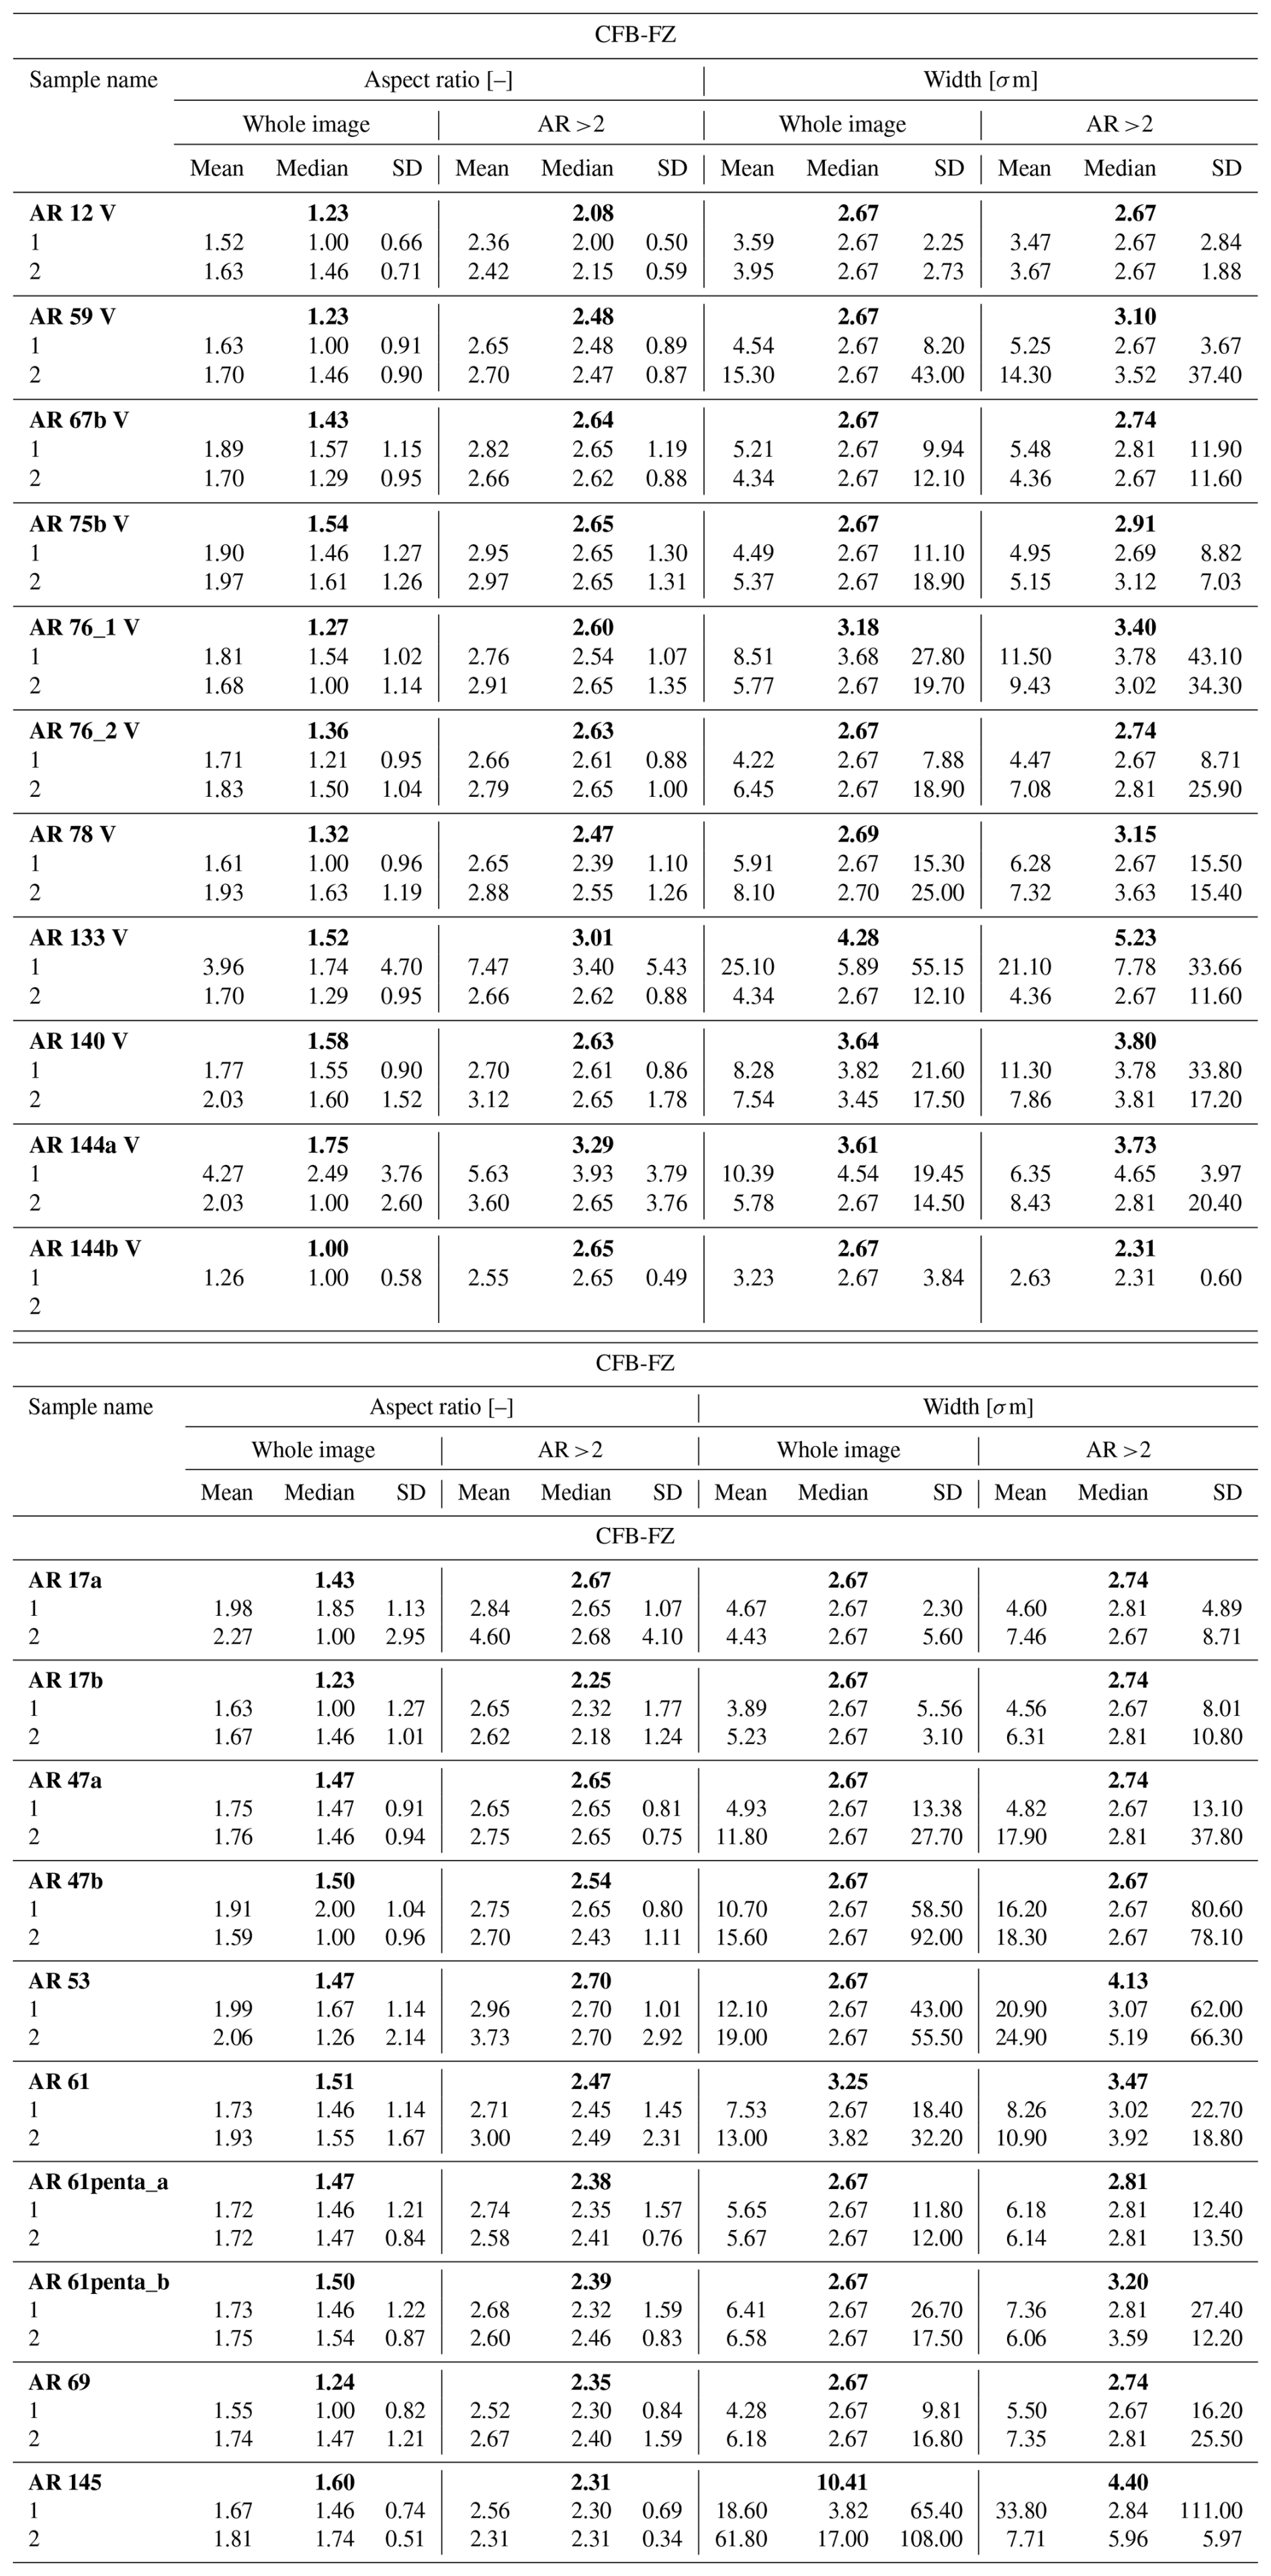
Data obtained via digital image analysis of the pore space characteristics are computed in order to obtain the average, median and 1σ standard deviation values of both pore aspect ratio (AR) and pore aperture (width, in σm) for host rocks (HR-AFZ, HR-PFZ, FHR-FZ, Table 2) and for fault rocks (CFB-FZ, FCFB-FZ, Table 3). Data are reported for all pores and for those with AR >2. The mean values of median AR and width are in bold for both tables. The latter values correspond to the minor axis of the ellipse automatically inscribed within each individual pore.
Table 2Summary of the main pore characteristics (aspect ratio, AR, and width, in σm) computed for the samples collected either away from or in proximity to mesoscale fault zones. The characteristics for all pores depicted in the whole images and for pores with AR >2 are reported. Numbers in bold represent the mean values computed for single thin sections.
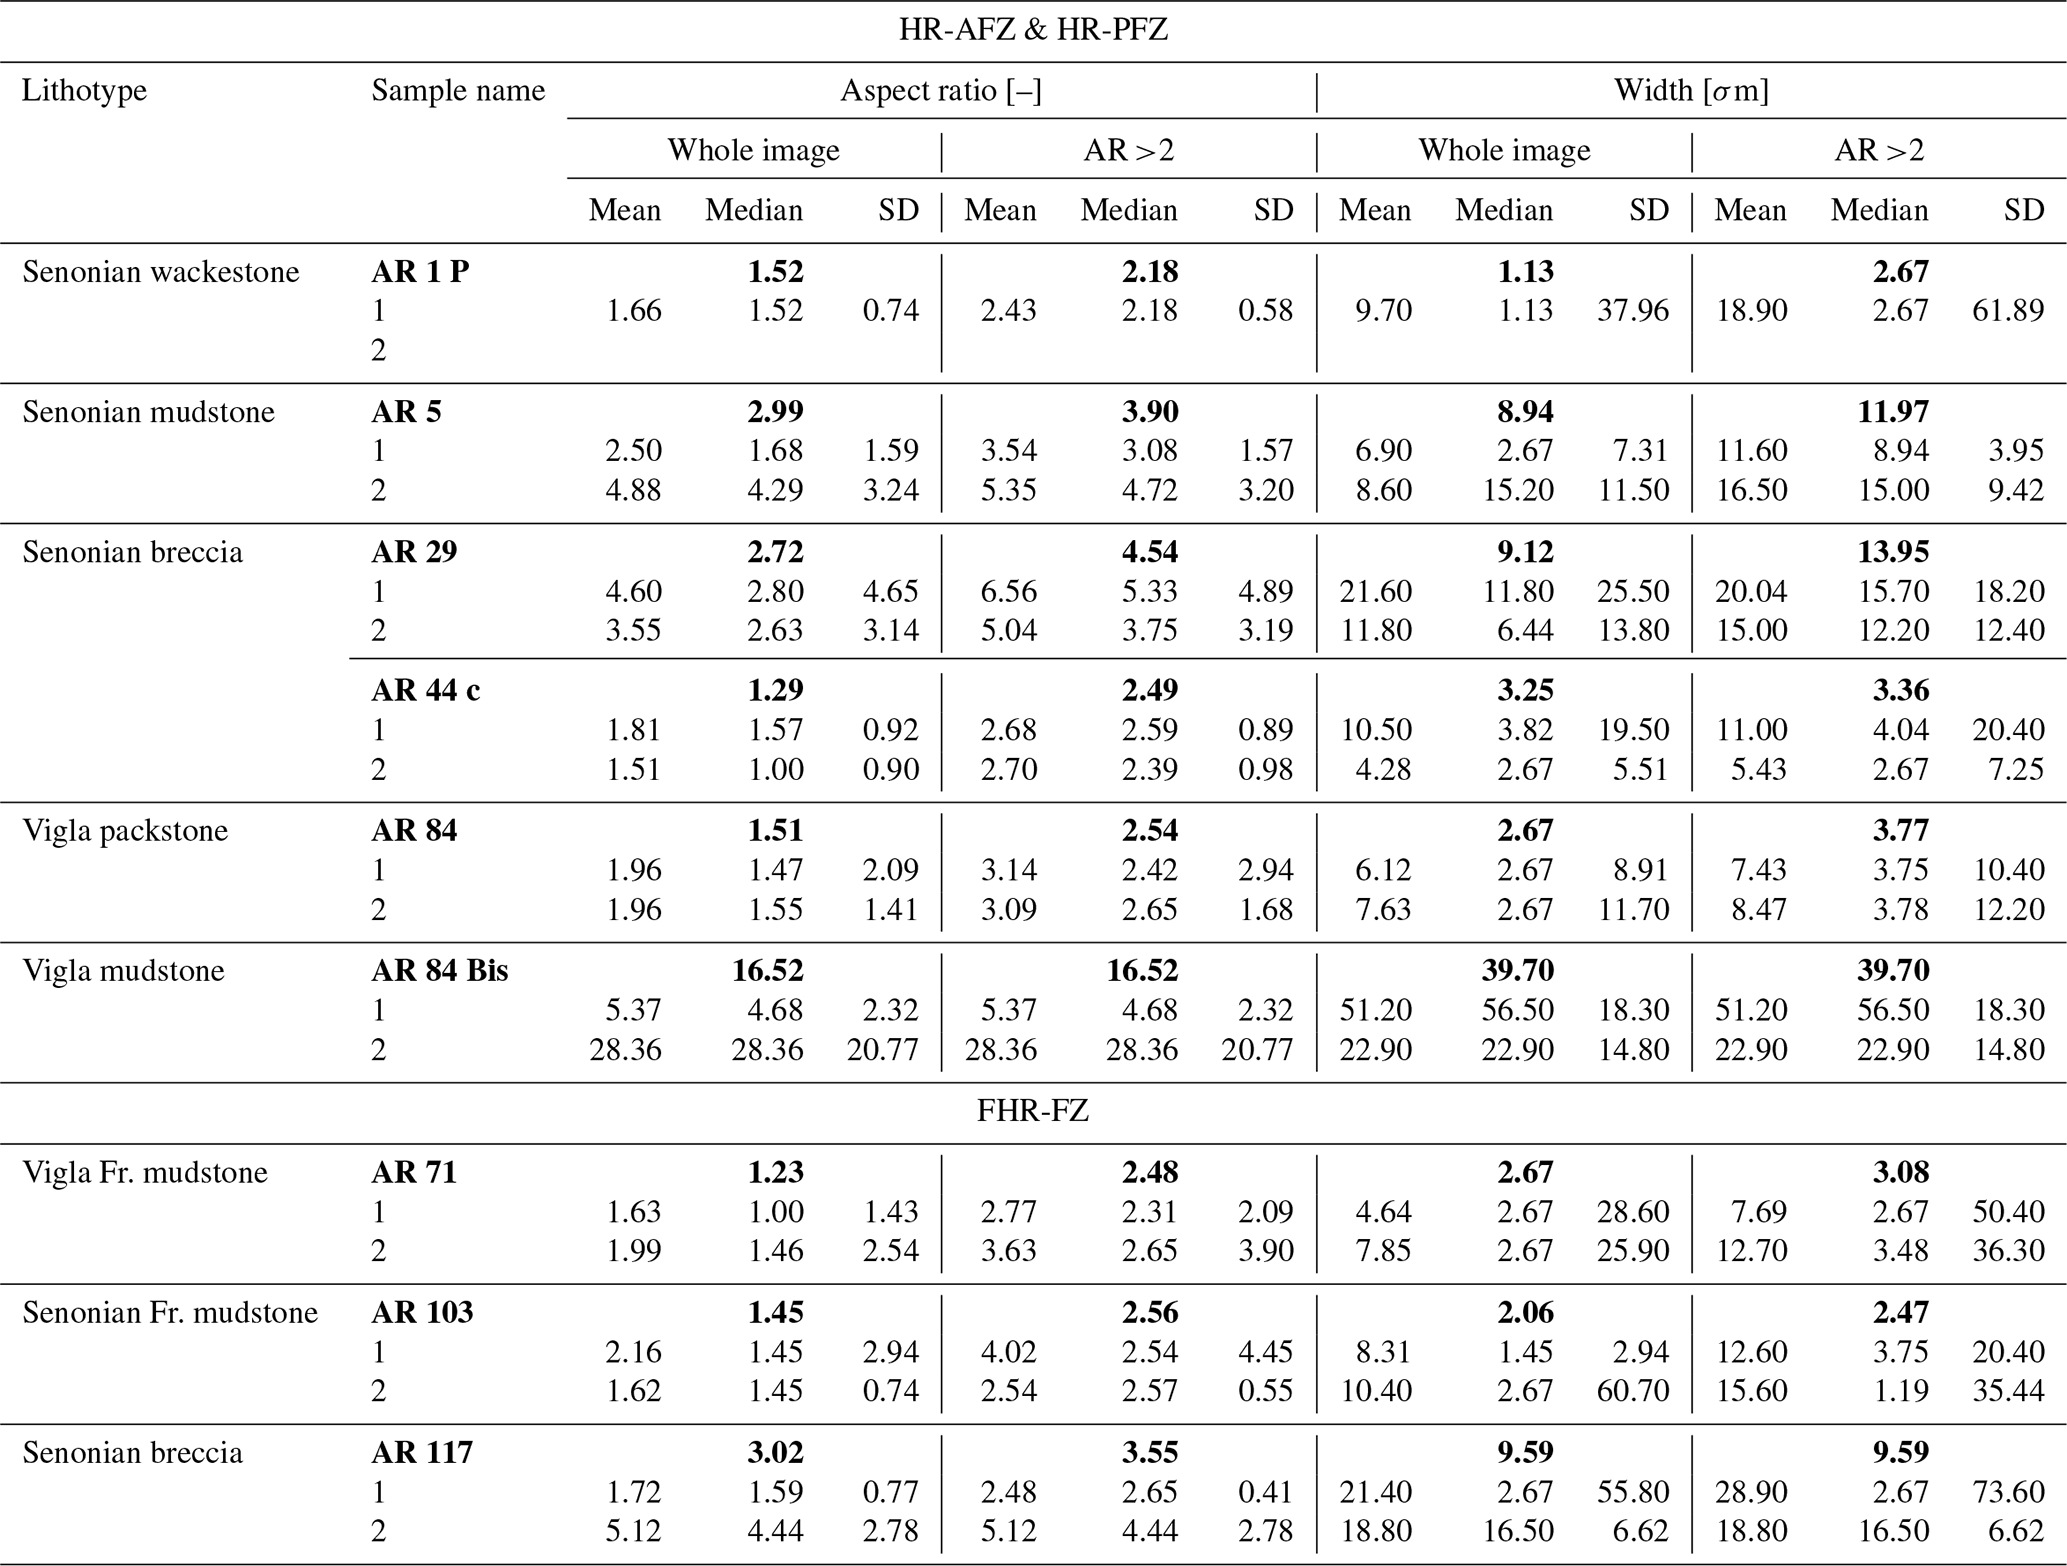
Table 3Summary of the main pore characteristics (aspect ratio, AR, and width, in µm) computed for the fault breccia and fine-crush fault breccia and fault microbreccia samples collected from mesoscale fault zones. The characteristics for all pores depicted in the whole images and for pores with AR >2 are reported. Numbers in bold represent the mean values computed for single thin sections.
4.2 Petrophysical characterisation at room pressure and temperature
Figures 6 and 7 show the density and porosity values measured for each rock sample. The average normalised value obtained for each rock block group (HR-AFZ to FCFB-FZ) is summarised in Table 4. Normalisation of the average values is achieved by considering the maximum and minimum values among all rock blocks in both dry and wet conditions. In general, density of both host rocks (HR-AFZ and HR-PFZ) and fractured host rock (FHR-FZ) varies between 2500 and 2900 kg m−3, and porosity is on average lower than 3 %. A few samples from the Vigla and Senonian formations show porosity values up to 6 %. Differently, CFB-FZ and FCFB-FZ samples show lower values of density, ranging from 2200 to 2900 kg m−3. These samples also show higher porosity, with some values up to 25 %. Overall, both CFB-FZ and FCFB-FZ samples are quite heterogeneous in terms of petrophysical characteristics depending upon distance from the main slip surfaces and pervasiveness of reddish carbonate cements. In general, porosity increases (dashed trend line in Fig. 7) approaching the main slip surfaces.
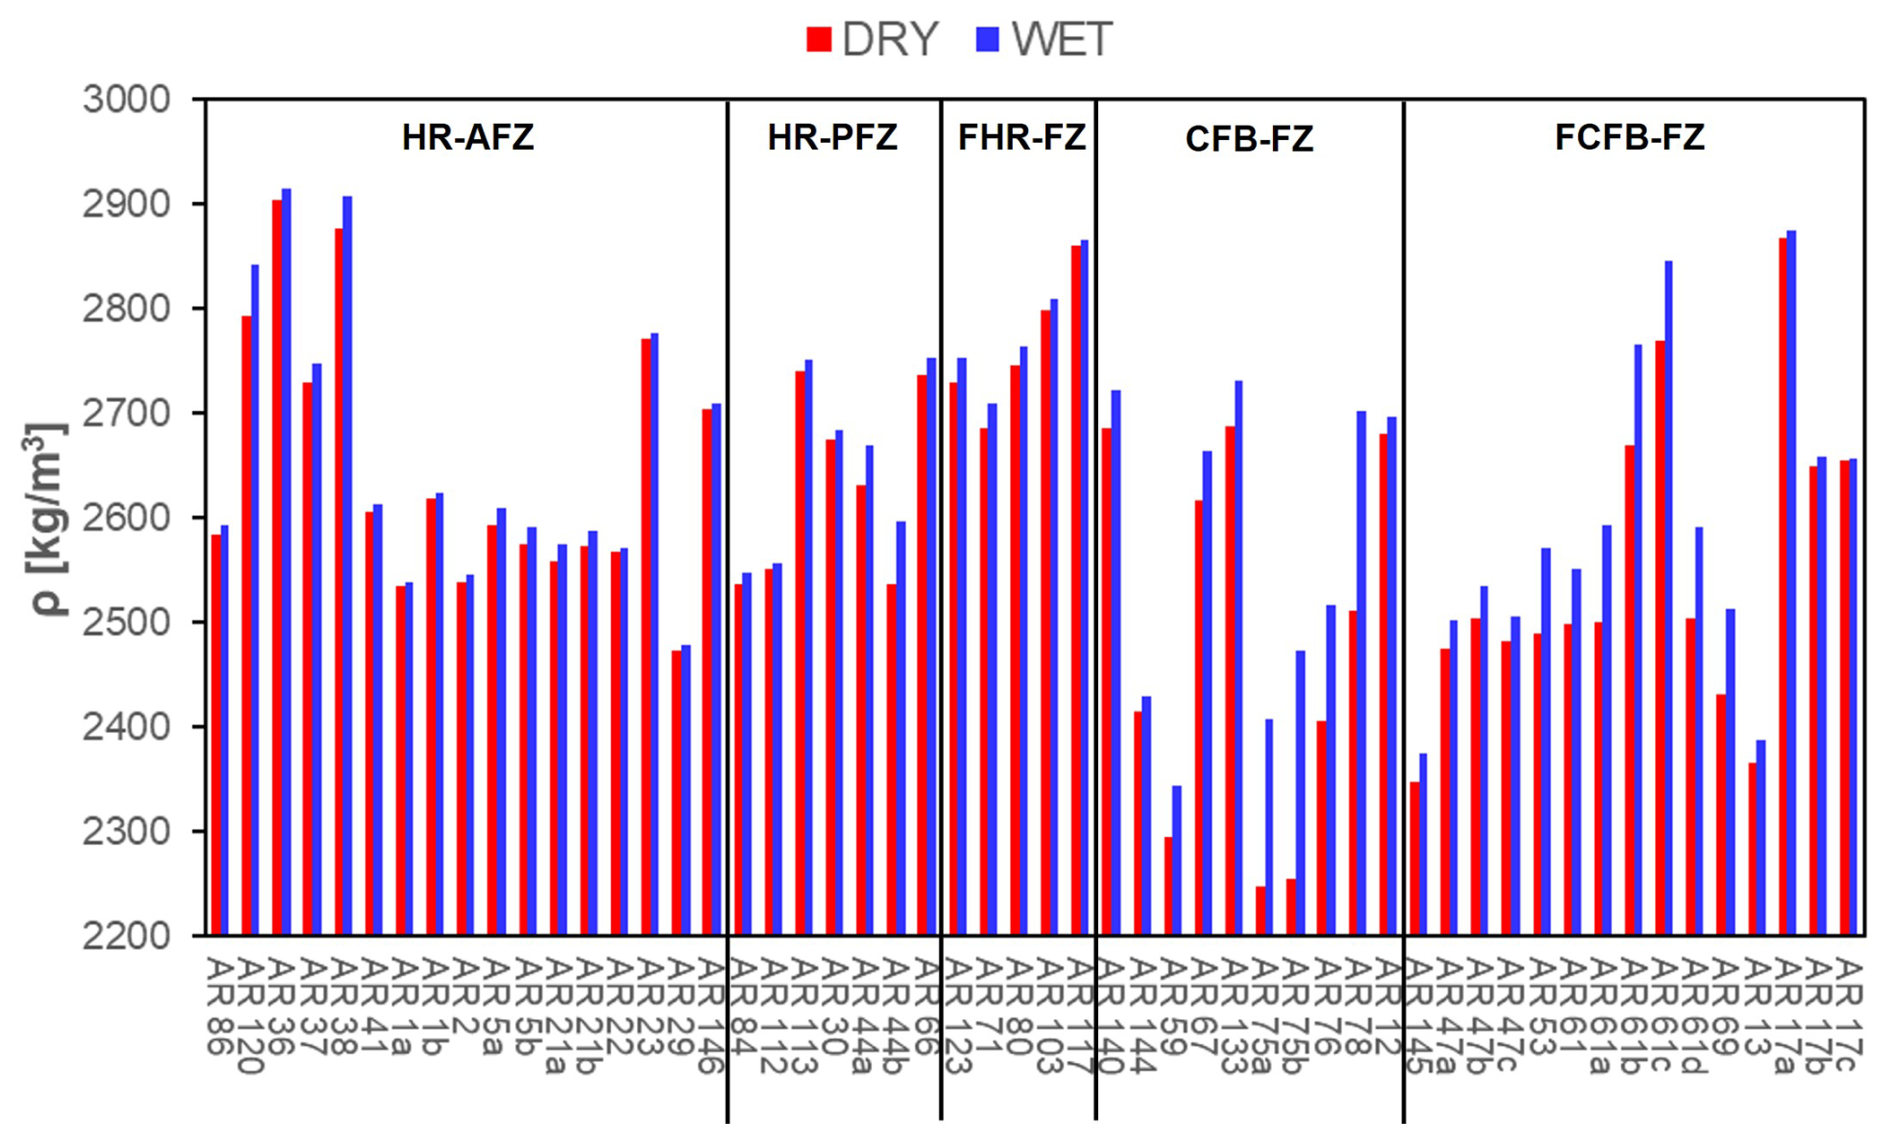
Figure 6Dry (red bars) and saturated (blue bars) density values for all the rock samples collected in the surrounding of the fault zone.
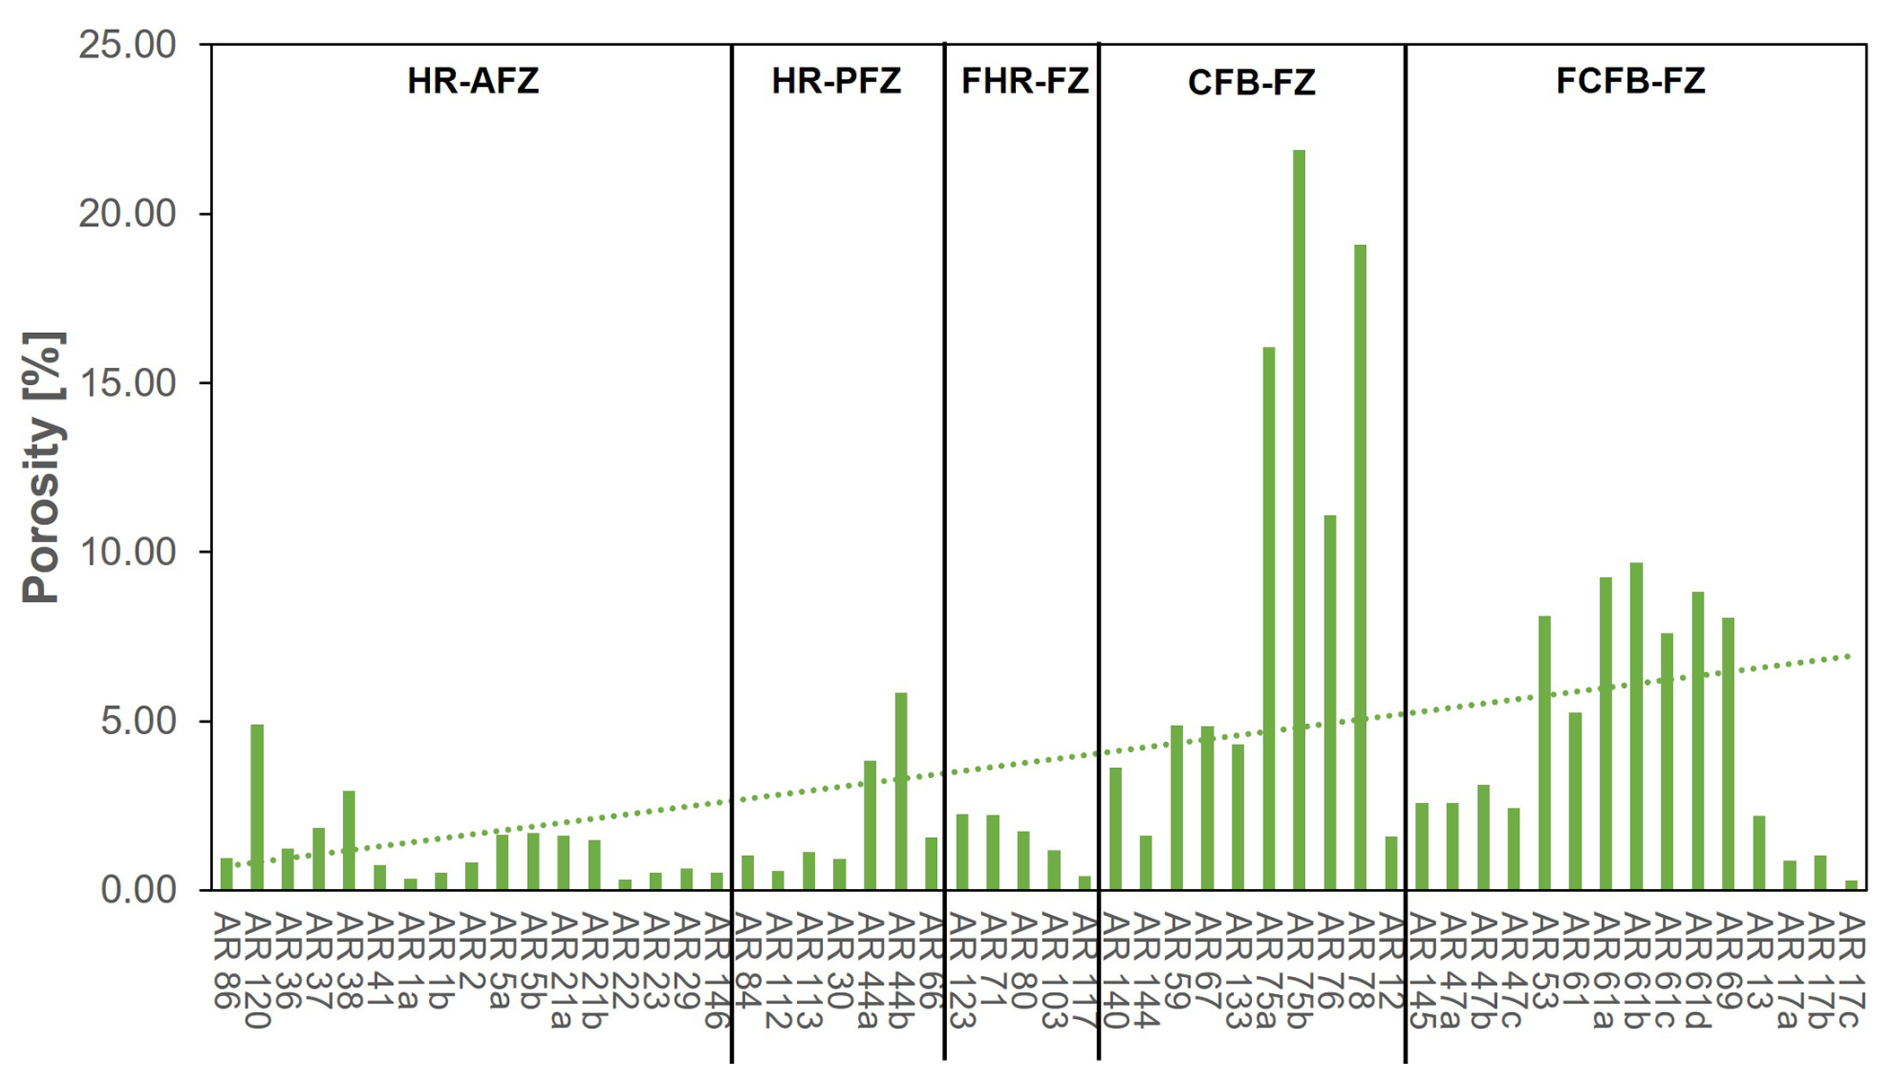
Figure 7Porosity values for all the rock samples collected in the surrounding of the fault zone.
UPV measurements are performed both in dry and in saturated conditions along three orthogonal directions. The obtained values are averaged to provide a mean value for each sample. Similarly, the wave velocities of each samples are averaged to obtain a mean normalised value representative of the rock block group (Table 4), employing the method previously described. Figures 8 and 9 show the VP and VS values. VP (dry conditions) varies between 6400 and 2600 m s−1. VS (dry conditions) ranges between 3600 and 1200 m s−1. VP (wet conditions) varies between 6700 and 2700 m s−1, meanwhile for VS in wet conditions, there are no appreciable differences compared to the values in dry conditions. Considering the ultrasonic data, VP WET is always greater than the VP DRY. This discrepancy is higher for samples collected close to the main slip surfaces, mirroring the increase in porosity shown in Fig. 7. Conversely, the VS values remain almost unchanged (see Fig. 9).
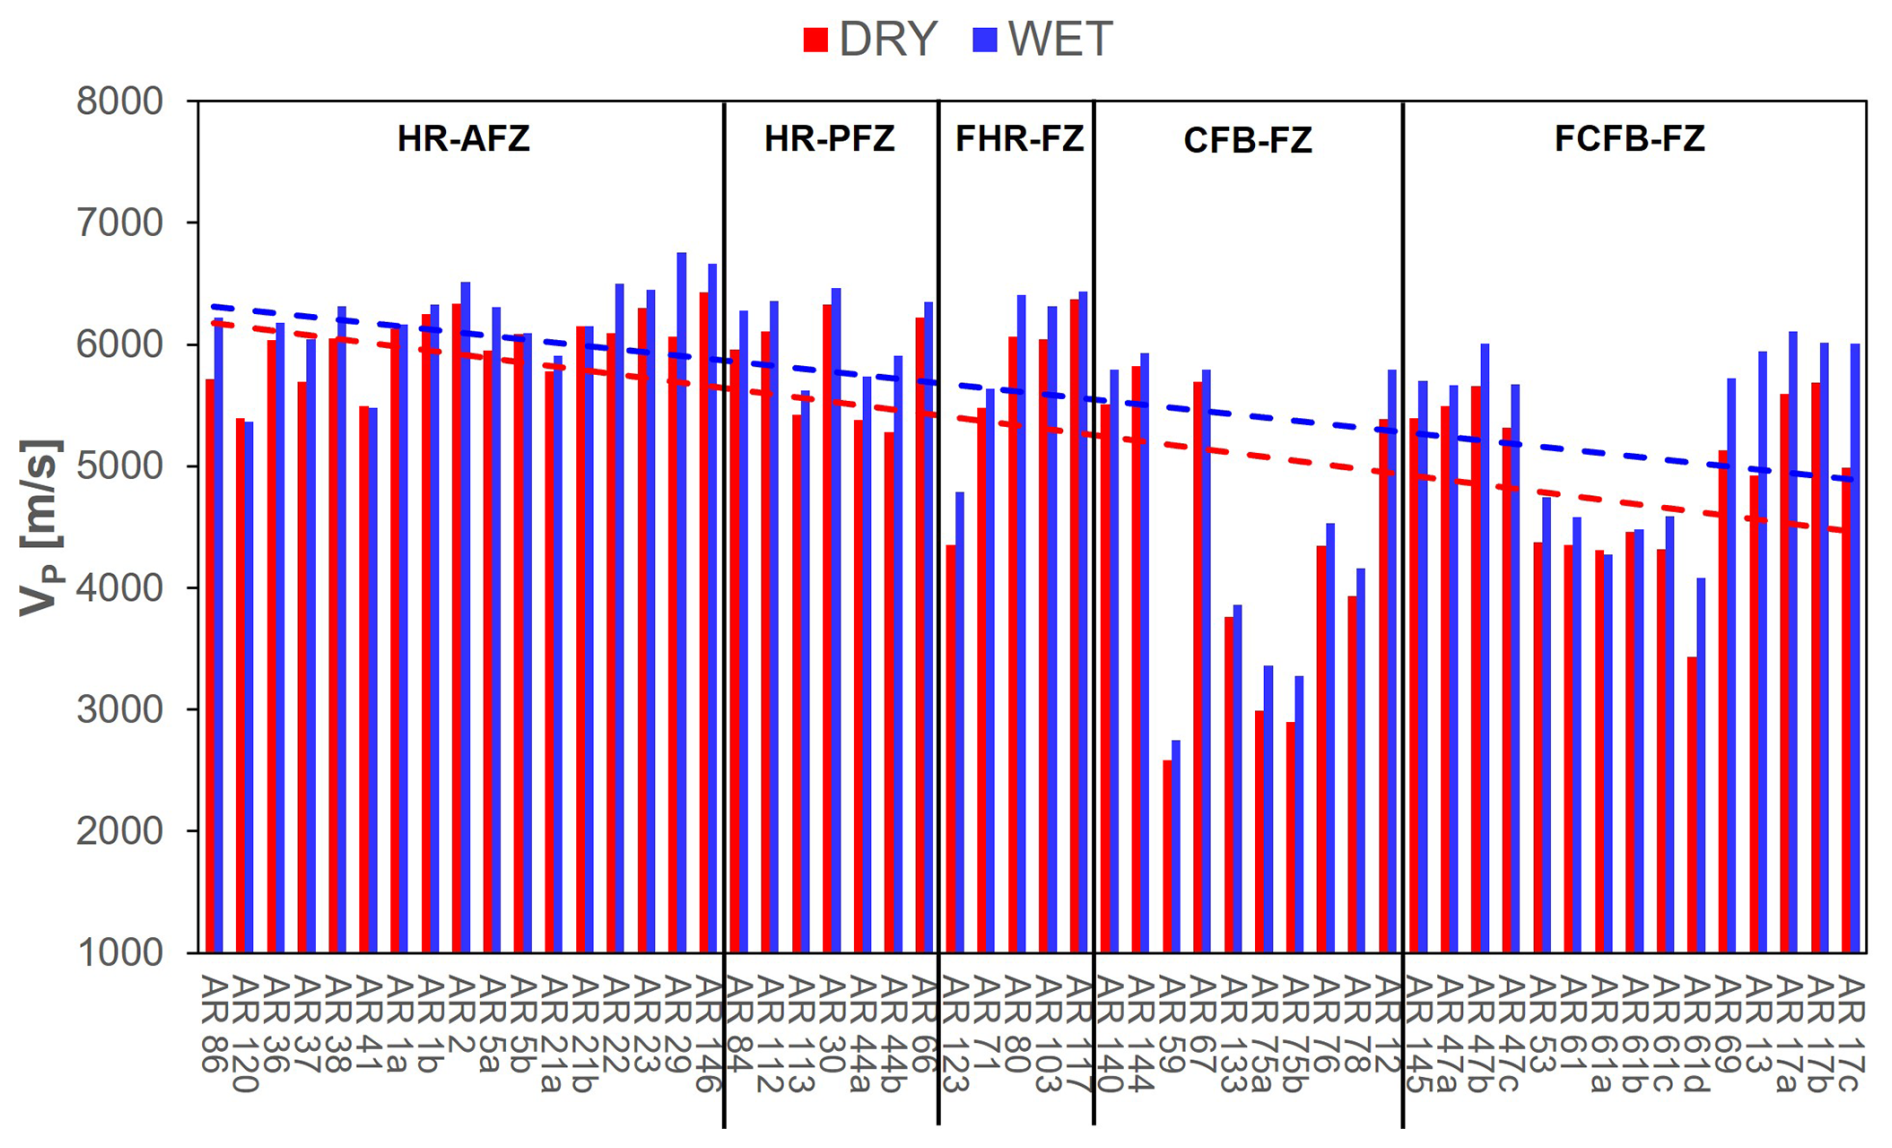
Figure 8VP values in dry (red bars) and saturated (blue bars) conditions evaluated as the average of the measurements along the three directions for each rock sample collected in the surrounding of the fault zone.
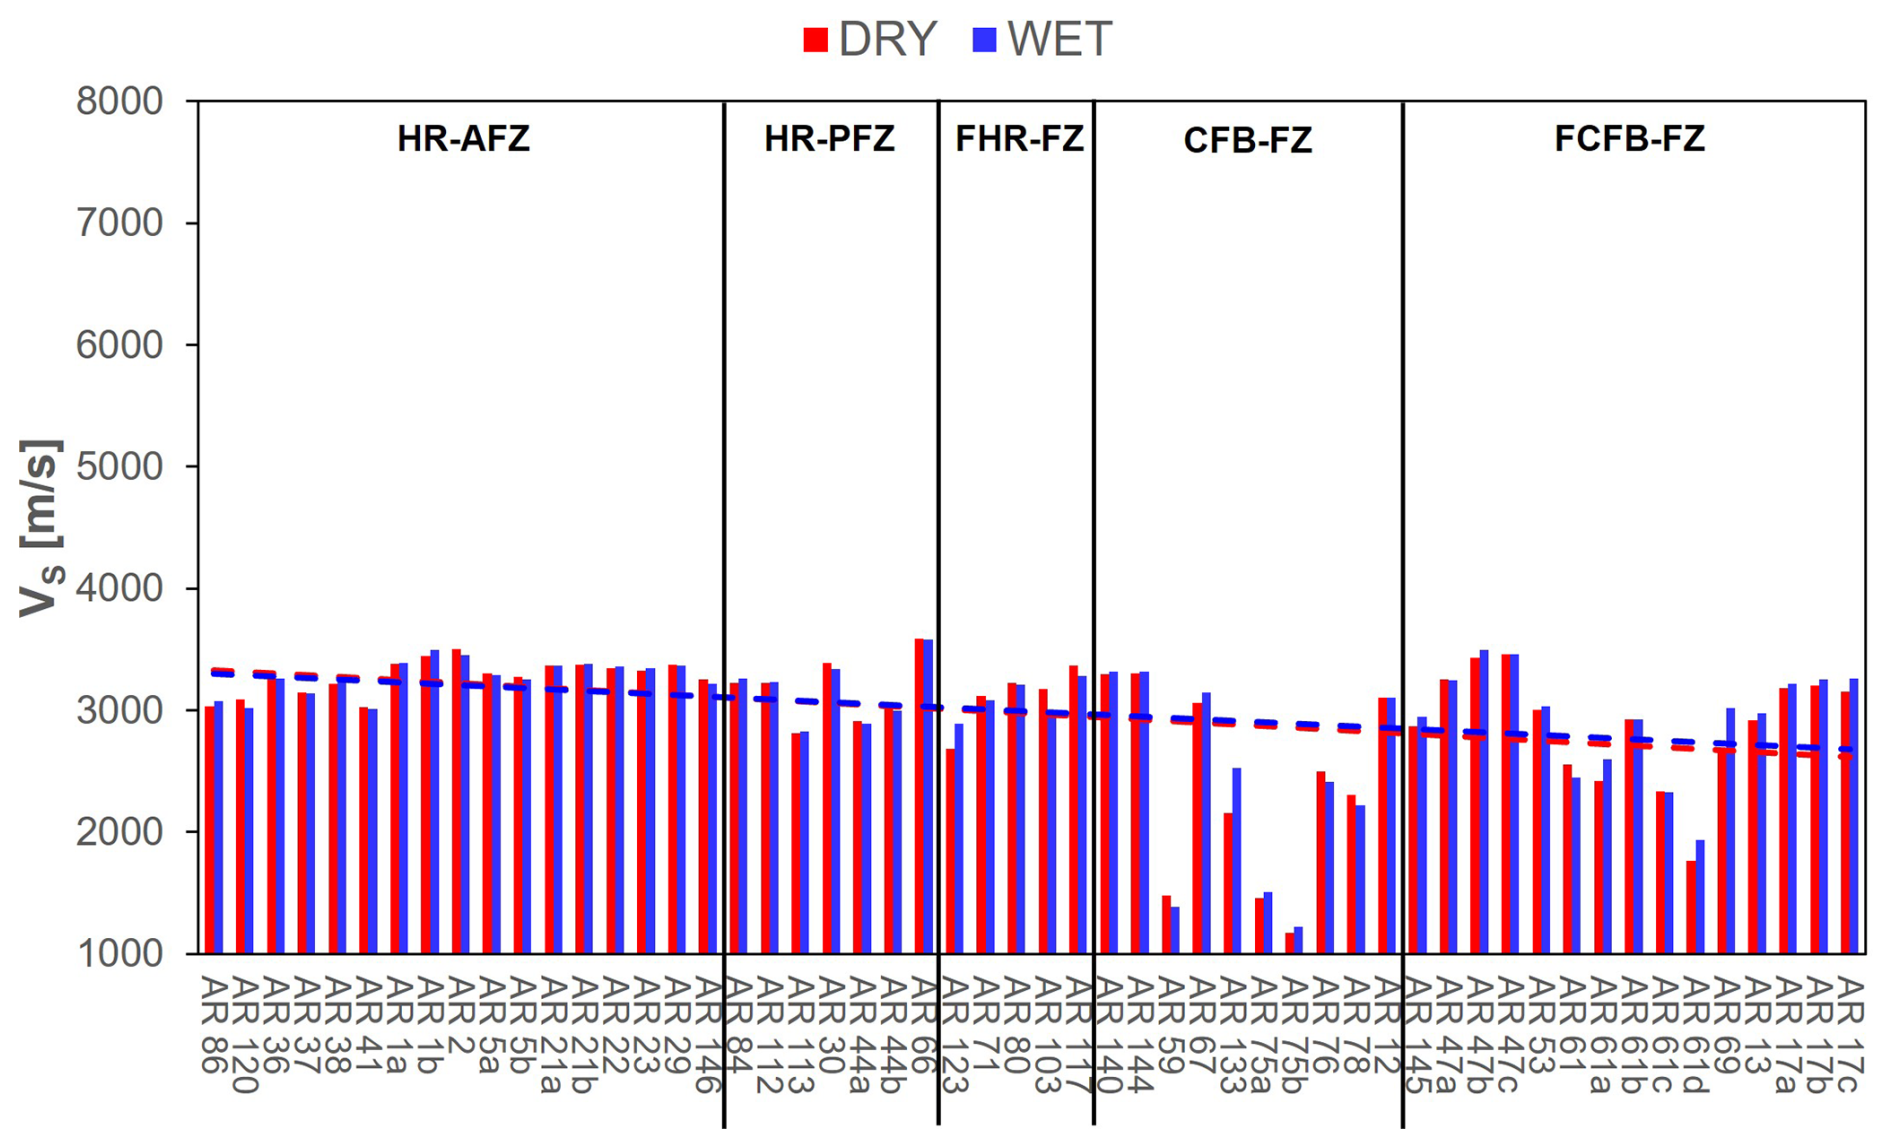
Figure 9VS values in dry (red bars) and saturated (blue bars) conditions evaluated as the average of the measurements along the three directions for each rock sample collected in the surrounding of the fault zone.
Figure 10 shows VP DRY–VS DRY computed for each rock sample variations and reported as coefficient of anisotropy, K. For the sake of simplicity and readability, only the results obtained in dry conditions are presented in the figure, as the results in wet conditions are almost identical. Additional details are provided in the Appendix B of this paper. K is estimated as follows:
with Vi being ultrasonic velocity (both P and S) in dry or wet conditions. The lower limit of K is 1, indicating no differences between the wave velocities in the three directions and hence an isotropic rock behaviour. Higher values reflect anisotropy, which can be transversal isotropic (textural anisotropy compatible to a preferential orientation of grains or planar anisotropy compatible to bedding interfaces, fractures, slip surfaces) if there is a marked velocity in one direction, while the other two directions exhibit the same values, or due to higher complexity given to the overlap of different micromechanisms acting on the rock texture and thus undefined if the three direction values are different. Figure 10 provides general information on the isotropic or anisotropic behaviour of the rock. However, if considered to be a standalone observation, it cannot reveal the nature of the anisotropy measured.
Indeed, there is not a clear directivity in the trend of the coefficient of anisotropy. Overall, the highest K values are observed in the carbonate fault rocks relative to the host rocks. Such a result is consistent with a textural anisotropy profoundly affected by tectonic fractures and slip surfaces. In detail, K is up to 1.2 in HR-AFZ and up to 1.4 in HR-PFZ. For the latter rocks, the highest computed values are for blocks AR 113 (Fig. 10) and AR 44, which correspond to Senonian microbreccia samples collected in proximity to N110E FZs, each crosscutting the topmost and bottom portions of the Senonian carbonates. The microstructural analysis suggests that these anisotropies are due to mesoscale fractures dissecting the host rock blocks. FHR-FZ samples are also characterised by K values up to 1.2, confirming their close similarities with the previous ones. Regarding both CFB-FZ and FCFB-FZ, K values are respectively up to 1.8 (AR 59) and 2.3 (AR 69). The AR 59 block derives from a N110E FZ crosscutting the bottom Senonian succession, whereas the AR69 block derives from a small N130E FZ adjacent to the previous one. The microstructural analysis shows that these anisotropies can be associated with mesoscale fractures and/or sheared fractures that are sub-parallel to the main slip surfaces.
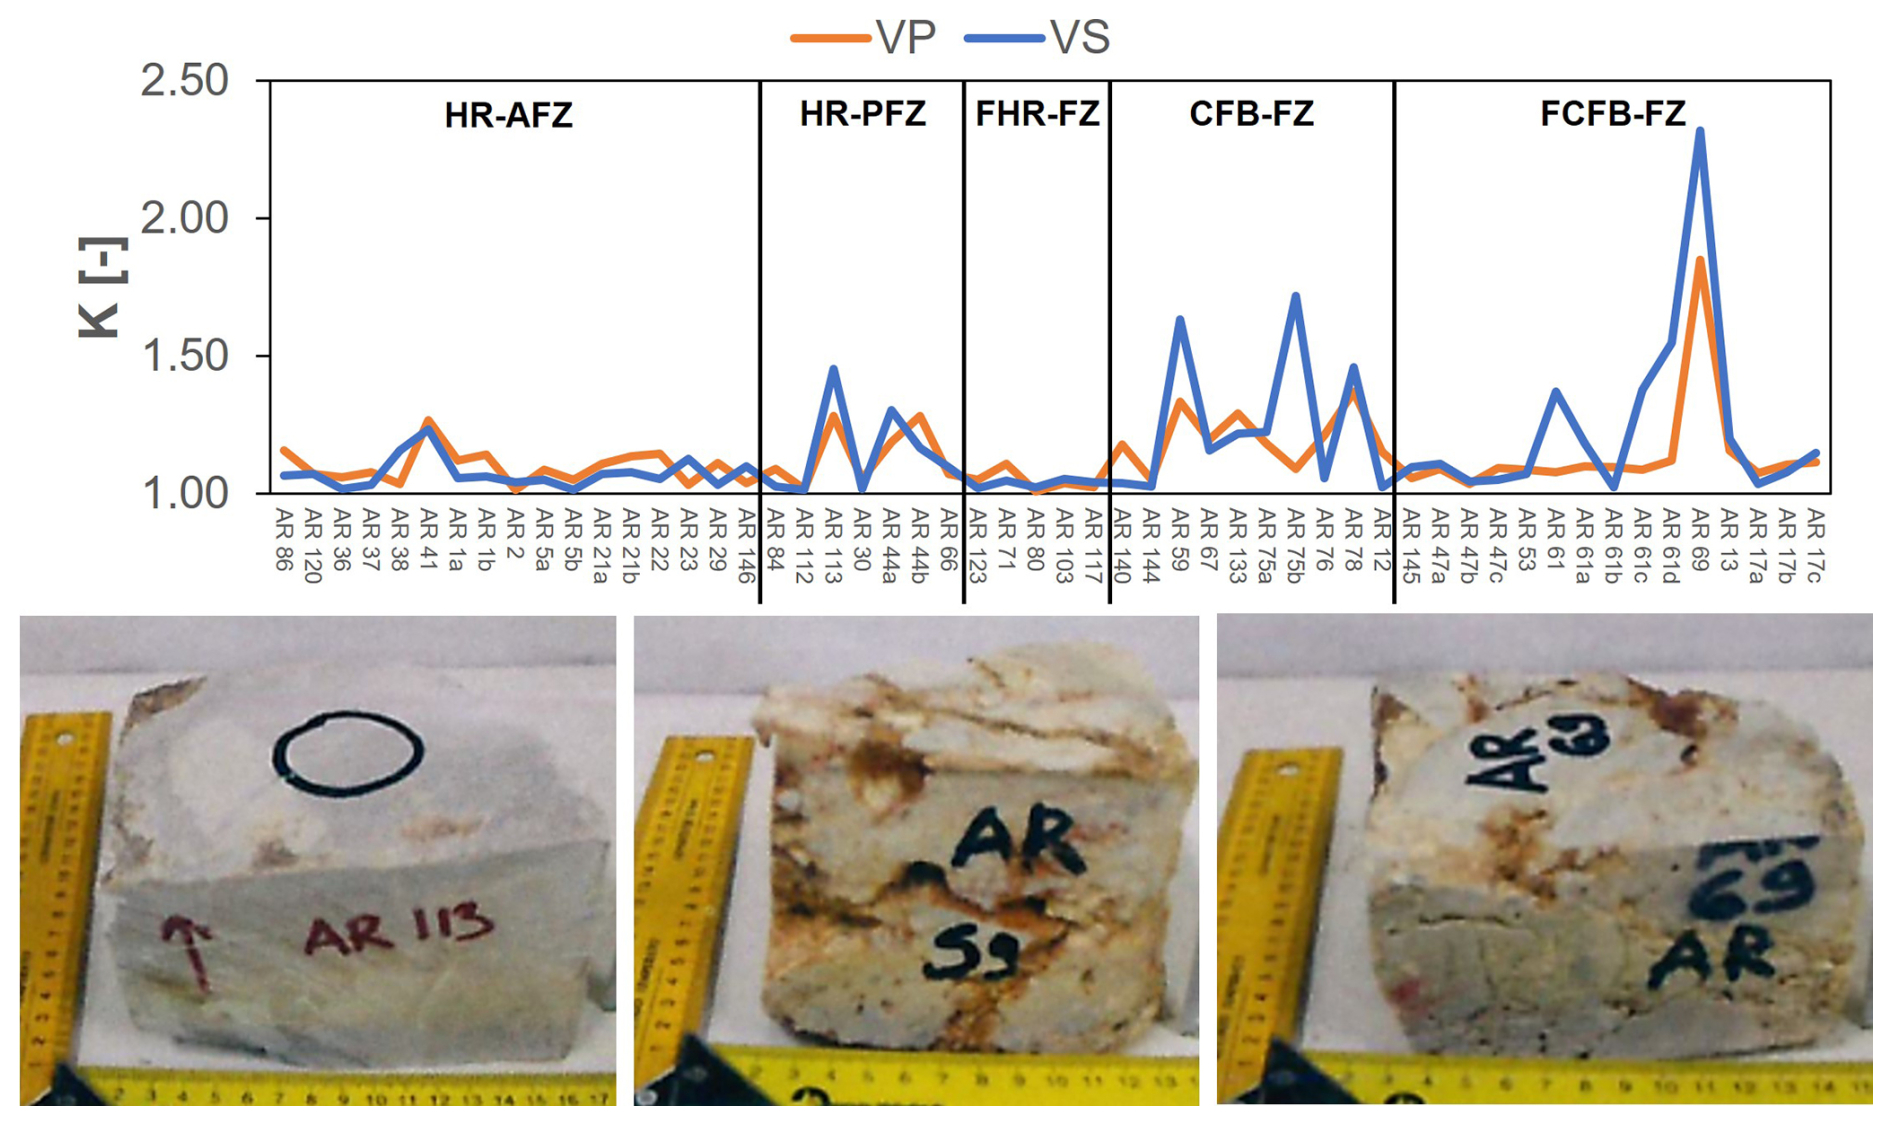
Figure 10Trend of the coefficient of anisotropy, K, evaluated considering seismic properties for all blocks, along with photographs of the three representative rock blocks with the highest K value.
The dynamic Young's and shear moduli, as well as Poisson's ratio, are evaluated from the seismic values obtained for the single structural domains and shown as average normalised values (Table 4). It is noteworthy that the dynamic moduli computed for the host rock blocks (HR-AFZ, HR-PFZ and FHR-FZ) are higher than those obtained for the fault rock blocks (CFB-FB and FCFB-FZ). These variations match the rock properties highlighted by the ultrasonic pulse velocity and electrical resistivity tests and show an inverse correlation with the effect of fracturing (porosity). These values will therefore be useful for the indirect estimation of the evolution of crack density at the mesoscale and site scale using the theory proposed by Nasseri et al. (2007), as discussed in Sect. 5.
The electrical resistivity (ER) values measured for the carbonate rock blocks are summarised in Table 4. There, the average normalised resistivity values obtained for both dry, RDRY, N, and saturated conditions, RWET, N, are reported. Data show that while resistivity in dry condition remains relatively constant with a slight increase approaching the fault zone, the resistivity in saturated conditions shows a marked decrease, in good agreement with a high degree of fracturing.
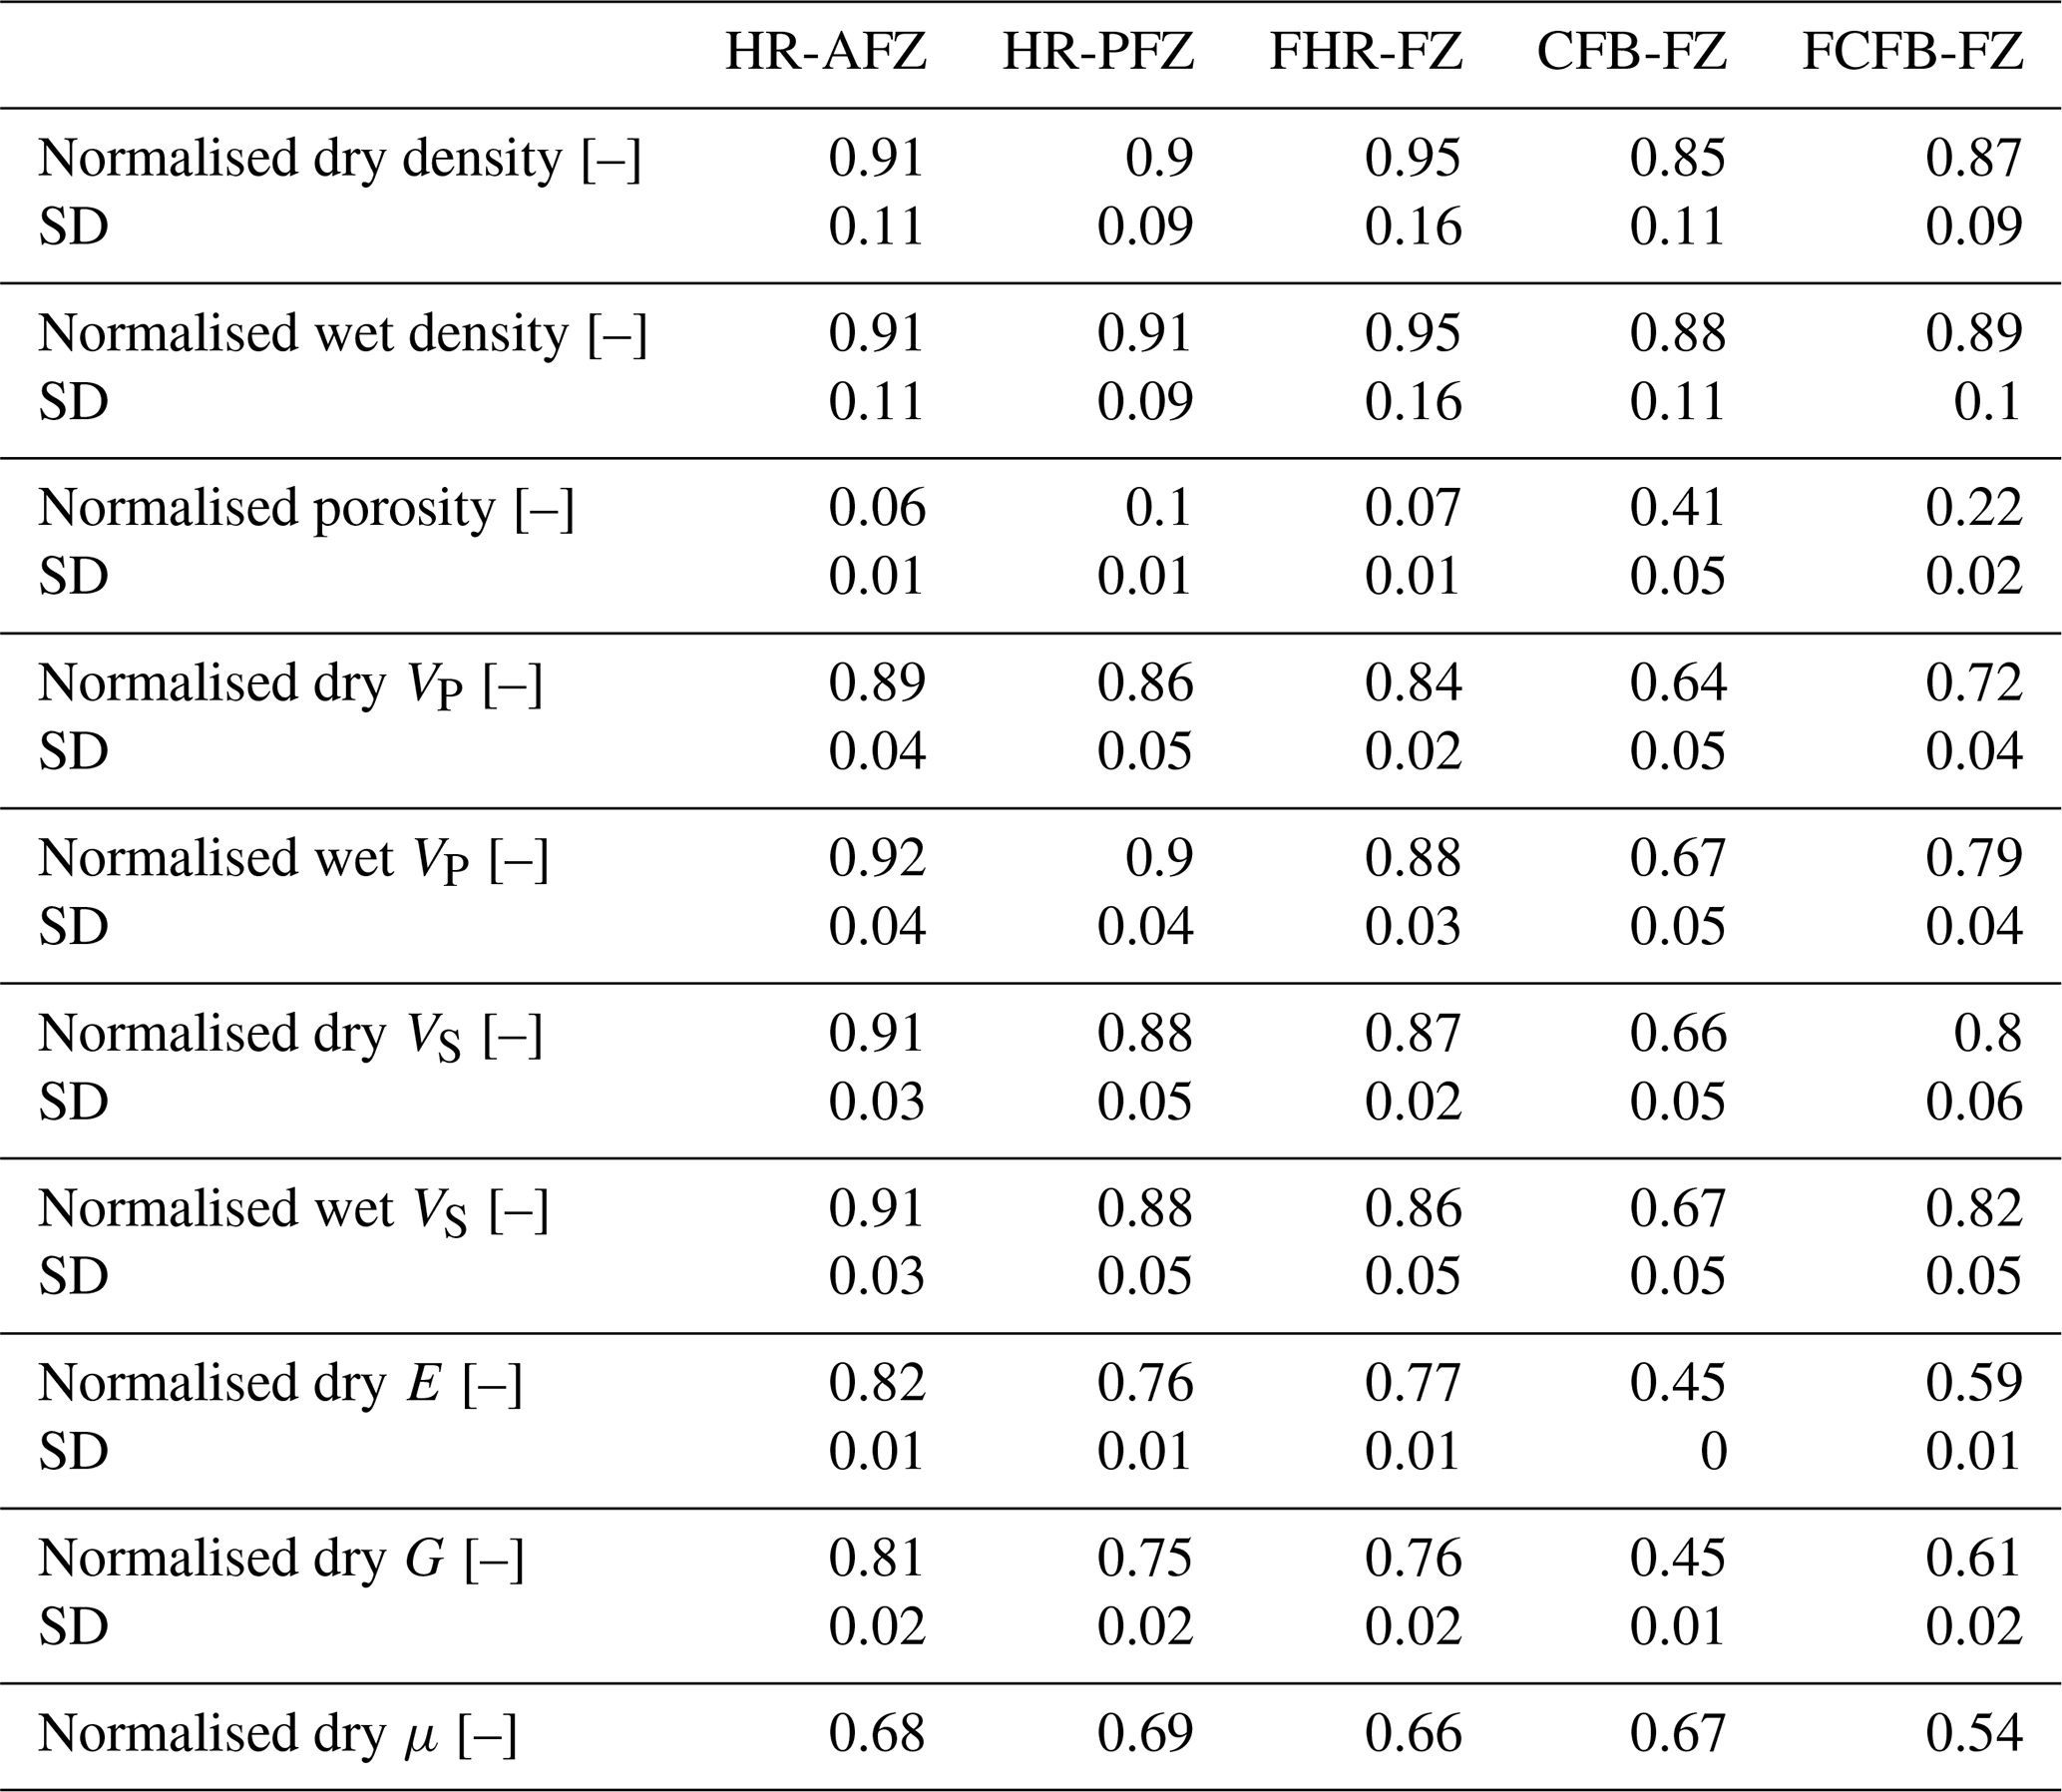
Table 4Average normalised physical values for each rock group.
4.3 Permeability and UPV measurement at confining pressure
Figure 11 shows permeability (k), corrected for the Klinkenberg effect, and UPV determination under different target confining pressure during gas permeameter tests. Good agreement between UPV measurements performed at room pressure (Figs. 8 and 9) and those at the first confining step (0.5 MPa) is found for each tested sample. As a general pattern, permeability decreases with increasing VP and VS at increasing confining pressures. We note that the permeability of sample AR78 (Fig. 11b) is higher than all others due to lack of any cement within the collected CFB-FZ specimen, which is also characterised by higher values of porosity and crack density (see Fig. 7). Also, sample AR12 (CFB-FZ, Fig. 11c) shows similar values of both permeability and velocity to sample AR41 (HR-AFZ, Fig. 11a) due to cementation processes.
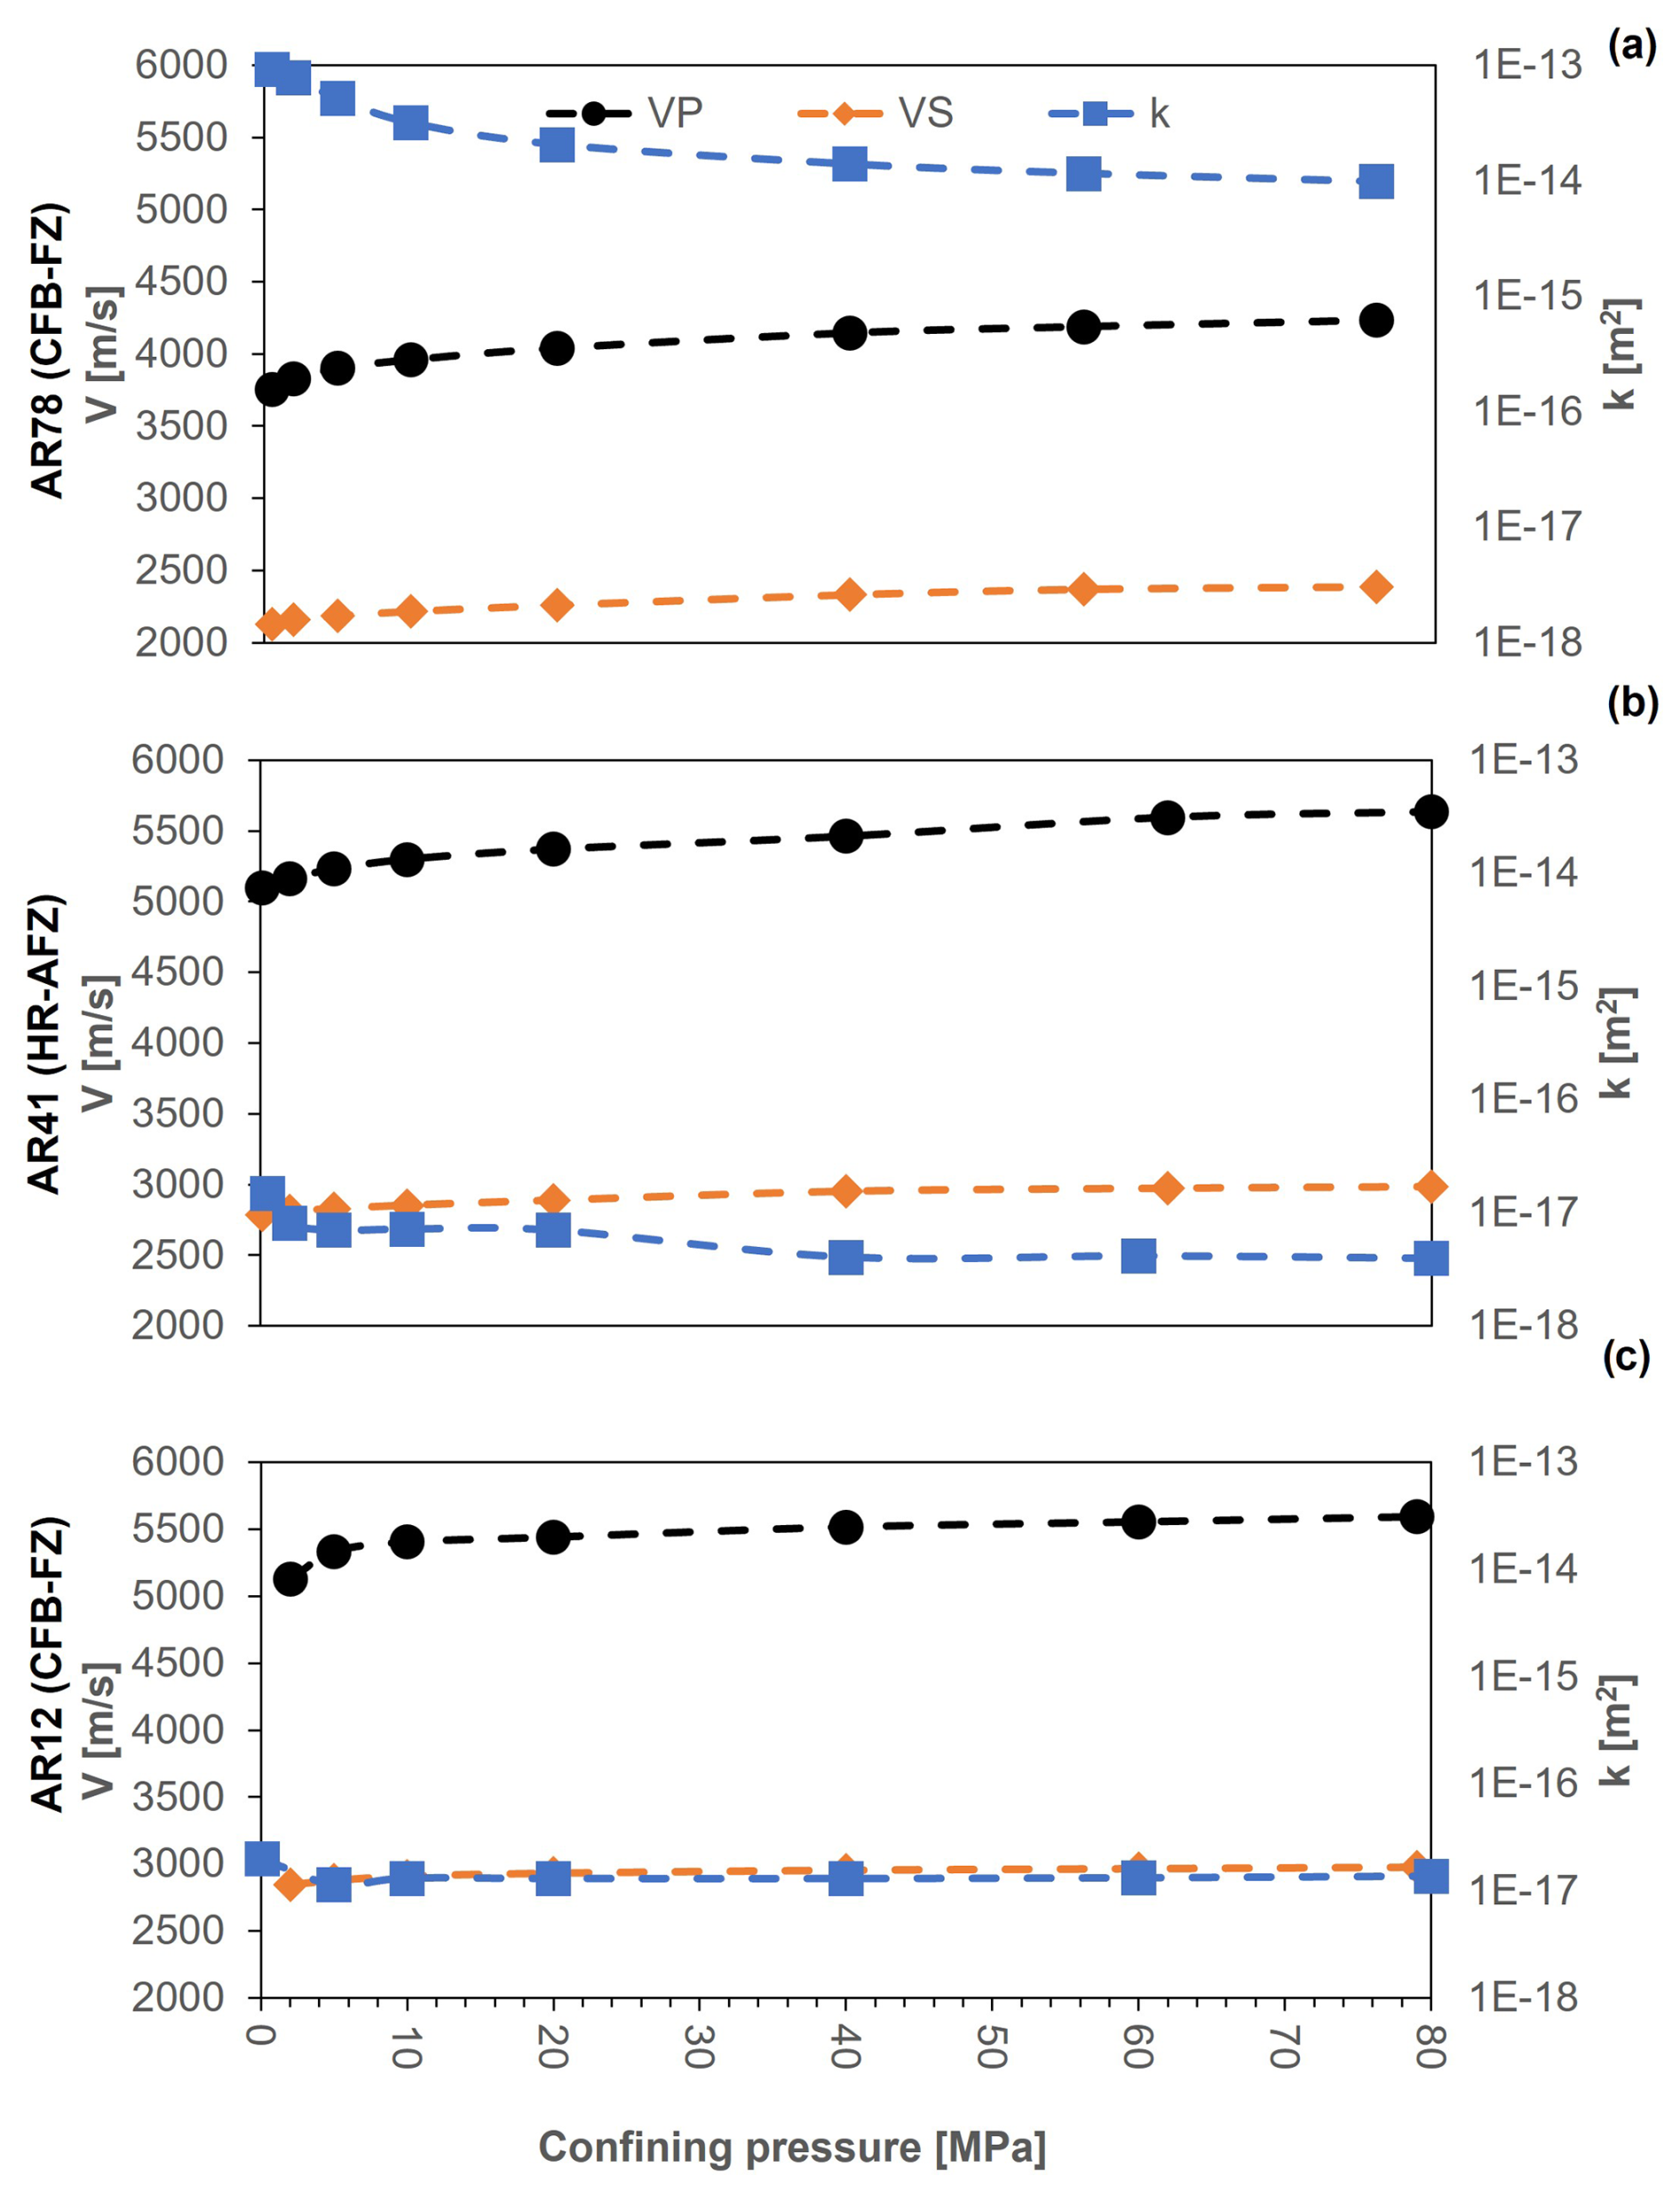
Figure 11Evolution of permeability (blue symbols), VP (black symbols) and VS (orange symbols) as a function of confining pressure during gas permeameter tests on sample (a) AR78 (CFB-FZ), (b) AR41 (HR-AFZ) and (c) AR12 (CFB-FZ).
Fluid flow is controlled by the connected network of cracks. Consequently, defining the key features describing the crack network geometry such as crack density, size, aspect ratio and alignment is essential in any attempt of permeability prediction. Gueguen and Dienes (1989) showed that permeability of cracked rocks can be well represented by that of an array of penny-shaped cracks embedded in an impermeable host matrix. Using the isotropic formulation of their percolation model, the bulk rock permeability, k, can be expressed as follows:
where f is the percolation factor, w is the crack average width, ζ is the average aspect ratio and ρ is the crack density. f can vary between 0 and 1. When f is equal to 0, it means that all cracks are isolated and unconnected; consequently, rocks can be considered intact with a very low degree of fracturing. Conversely, when f corresponds to the unity, all cracks are connected into the network. Guéguen et al. (1997) showed that the percolation threshold (defined as the minimum crack density required to establish a complete path for a fluid to flow) for microscopic permeability is reached at values of crack density equals to 0.14. Differently, the percolation threshold for macroscopic fractures is reached at values of crack density close to 1. The percolation factor may be approximated by the connectivity factor, f′, as defined by (Gueguen and Dienes, 1989)
Since changes in dynamic elastic properties are correlated to the amount of damage within rocks, it is possible to invert the elastic wave velocity field into a non-dimensional crack density, ρ, as defined by the following equation:
where ci is the radius of the ith crack, and N is the total number of cracks embedded in the representative elementary volume V.
Effective Medium Theory (EMT) introduces the concept of “no-stress interaction approximation” by neglecting, as a simple assumption, the stress interactions among cracks. In this case, the effective elastic moduli of a cracked solid can be exactly and rigorously calculated by solely considering crack orientation and distribution (Bristow, 1960; Kachanov, 1993). The theory states that for cracks randomly oriented and distributed (perfect isotropic configuration), stress interactions are partially geometrically compensated for so that the effective Young's modulus, E*, of a dry rock can be obtained as follows:
where E0 and ν0 are the petrophysical Young's modulus and Poisson ratio of the un-cracked material, respectively, and E* is the Young's modulus calculated using the ultrasonic pulse measurements.
The crack aspect ratios, ζ, can also be evaluated from results of digital image analysis, as described in Sect. 3.2, or it may be calculated by simply applying the following equation:
We recall that for penny-shaped cracks with a constant aspect ratio distribution, the total crack porosity, n, is also equal to
The aspect ratios, ζ, can therefore be expressed as a function of both porosity, n, and crack density, ρ, as shown by the following equation:
Two workflows (WFs) are followed to estimate permeability (k) from seismic measurements. WF1 applies the Gueguen and Dienes (1989) and EMT theories; the values of aspect ratio and crack width are assessed on the results of seismic measurements. WF2 assumes a constant crack aperture (width) of 1 µm, which is typical of a crack network geometry. For both WFs, crack density of the analysed rock blocks is evaluated by inverting Eq. (16), using E* from seismic measurements, and assuming representative petrophysical values of E0 and ν0 for matrix-supported carbonates (host rocks, fault rocks), cement-supported carbonates (fault rocks), clast-supported carbonates (host rocks) and survivor grain-supported carbonates (fault rocks) on the basis of a bibliographic review of similar lithologies (Mavko et al., 2009, Table 5). The crack aspect ratio is estimated using Eq. (19). For WF1, once crack density (ρ) was calculated, the crack average width is obtained from Eqs. (17) and (18). Conversely, following WF2, the crack average width (w) is considered constant and equal to 1 µm. Finally, permeability (k) is evaluated using Eq. (13); since the percolation factor (f) is extremely complex to measure, and k is sensitive to its variation, an interval analysis by considering lower and upper limits in the interval of f variation (f equal to 0 and 1) and an intermediate value provided by Eq. (14) was performed. Moreover, WF3, employing the crack density (ρ) values obtained from digital image analyses, is applied.
Table 5Summary of the representative petrophysical E0 and ν0 values used for the crack density estimation.
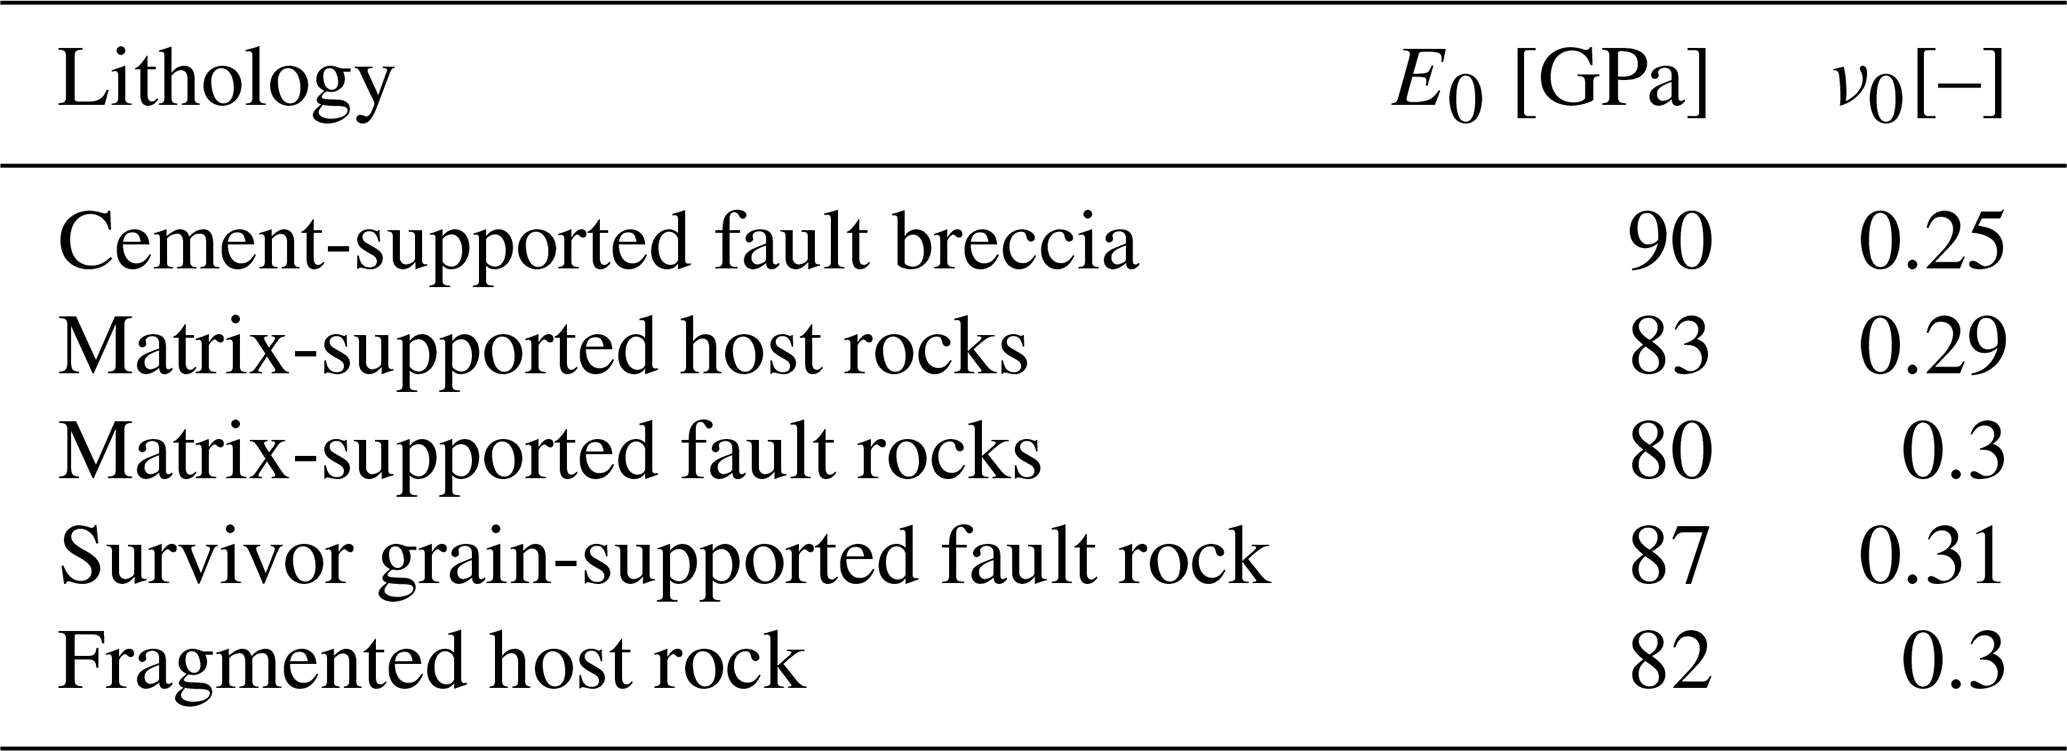
Figure 12 shows the variation of k, by considering the three workflows, and f of 0.01 (blue line) and 1 (orange line). k values obtained by considering the percolation factor equal to the connectivity factor (f′) are also reported (grey line). k values experimentally obtained on three samples (see Sect. 4.3) at the lowest confining pressure are also shown with black symbols for comparison. Overall the host rock permeability (HR-AFZ, HR-PFZ, FHR-FZ) varies between 10−17 and 10−14 m2 (0.01 and 10 mD), with a few samples exhibiting k values falling outside this range. Differently, CFB-FZ and FCFB-FZ samples shows higher-permeability values up to 10−13 m2 (100 mD). Even considering the natural variability of the samples, the estimations shown in Fig. 12 highlight that XFB-FZ samples exhibit permeability up to 2 orders of magnitude greater than HR-AFZ and HR-PFZ samples, reflecting their higher porosity values. This aspect is more pronounced in the findings of workflows 2 and 3 compared to workflow 1, where the average velocity values used in the ETM theory likely tend to smooth this effect.
Concerning the comparison with k values from laboratory tests, the k values inferred from seismic measurements (WF1) best reproduce the experimental results, especially when the percolation factor is evaluated with Eq. (14) (grey line in Fig. 12a). WF2 and WF3 do not reproduce the higher-permeability values (up to 10−13 m2–100 mD). Considering WF2 (Fig. 12b), the calculated k values are generally lower, ranging between 10−18 and 10−15 m2 (0.001 and 1 mD), with a slight increase for the fault rock samples. A constant crack aperture not only determines lower values of calculated k, but it also tends to smooth out the differences. The results obtained by following WF3 (Fig. 12c) show a very slight increase in fault rock k with respect to the previous case.
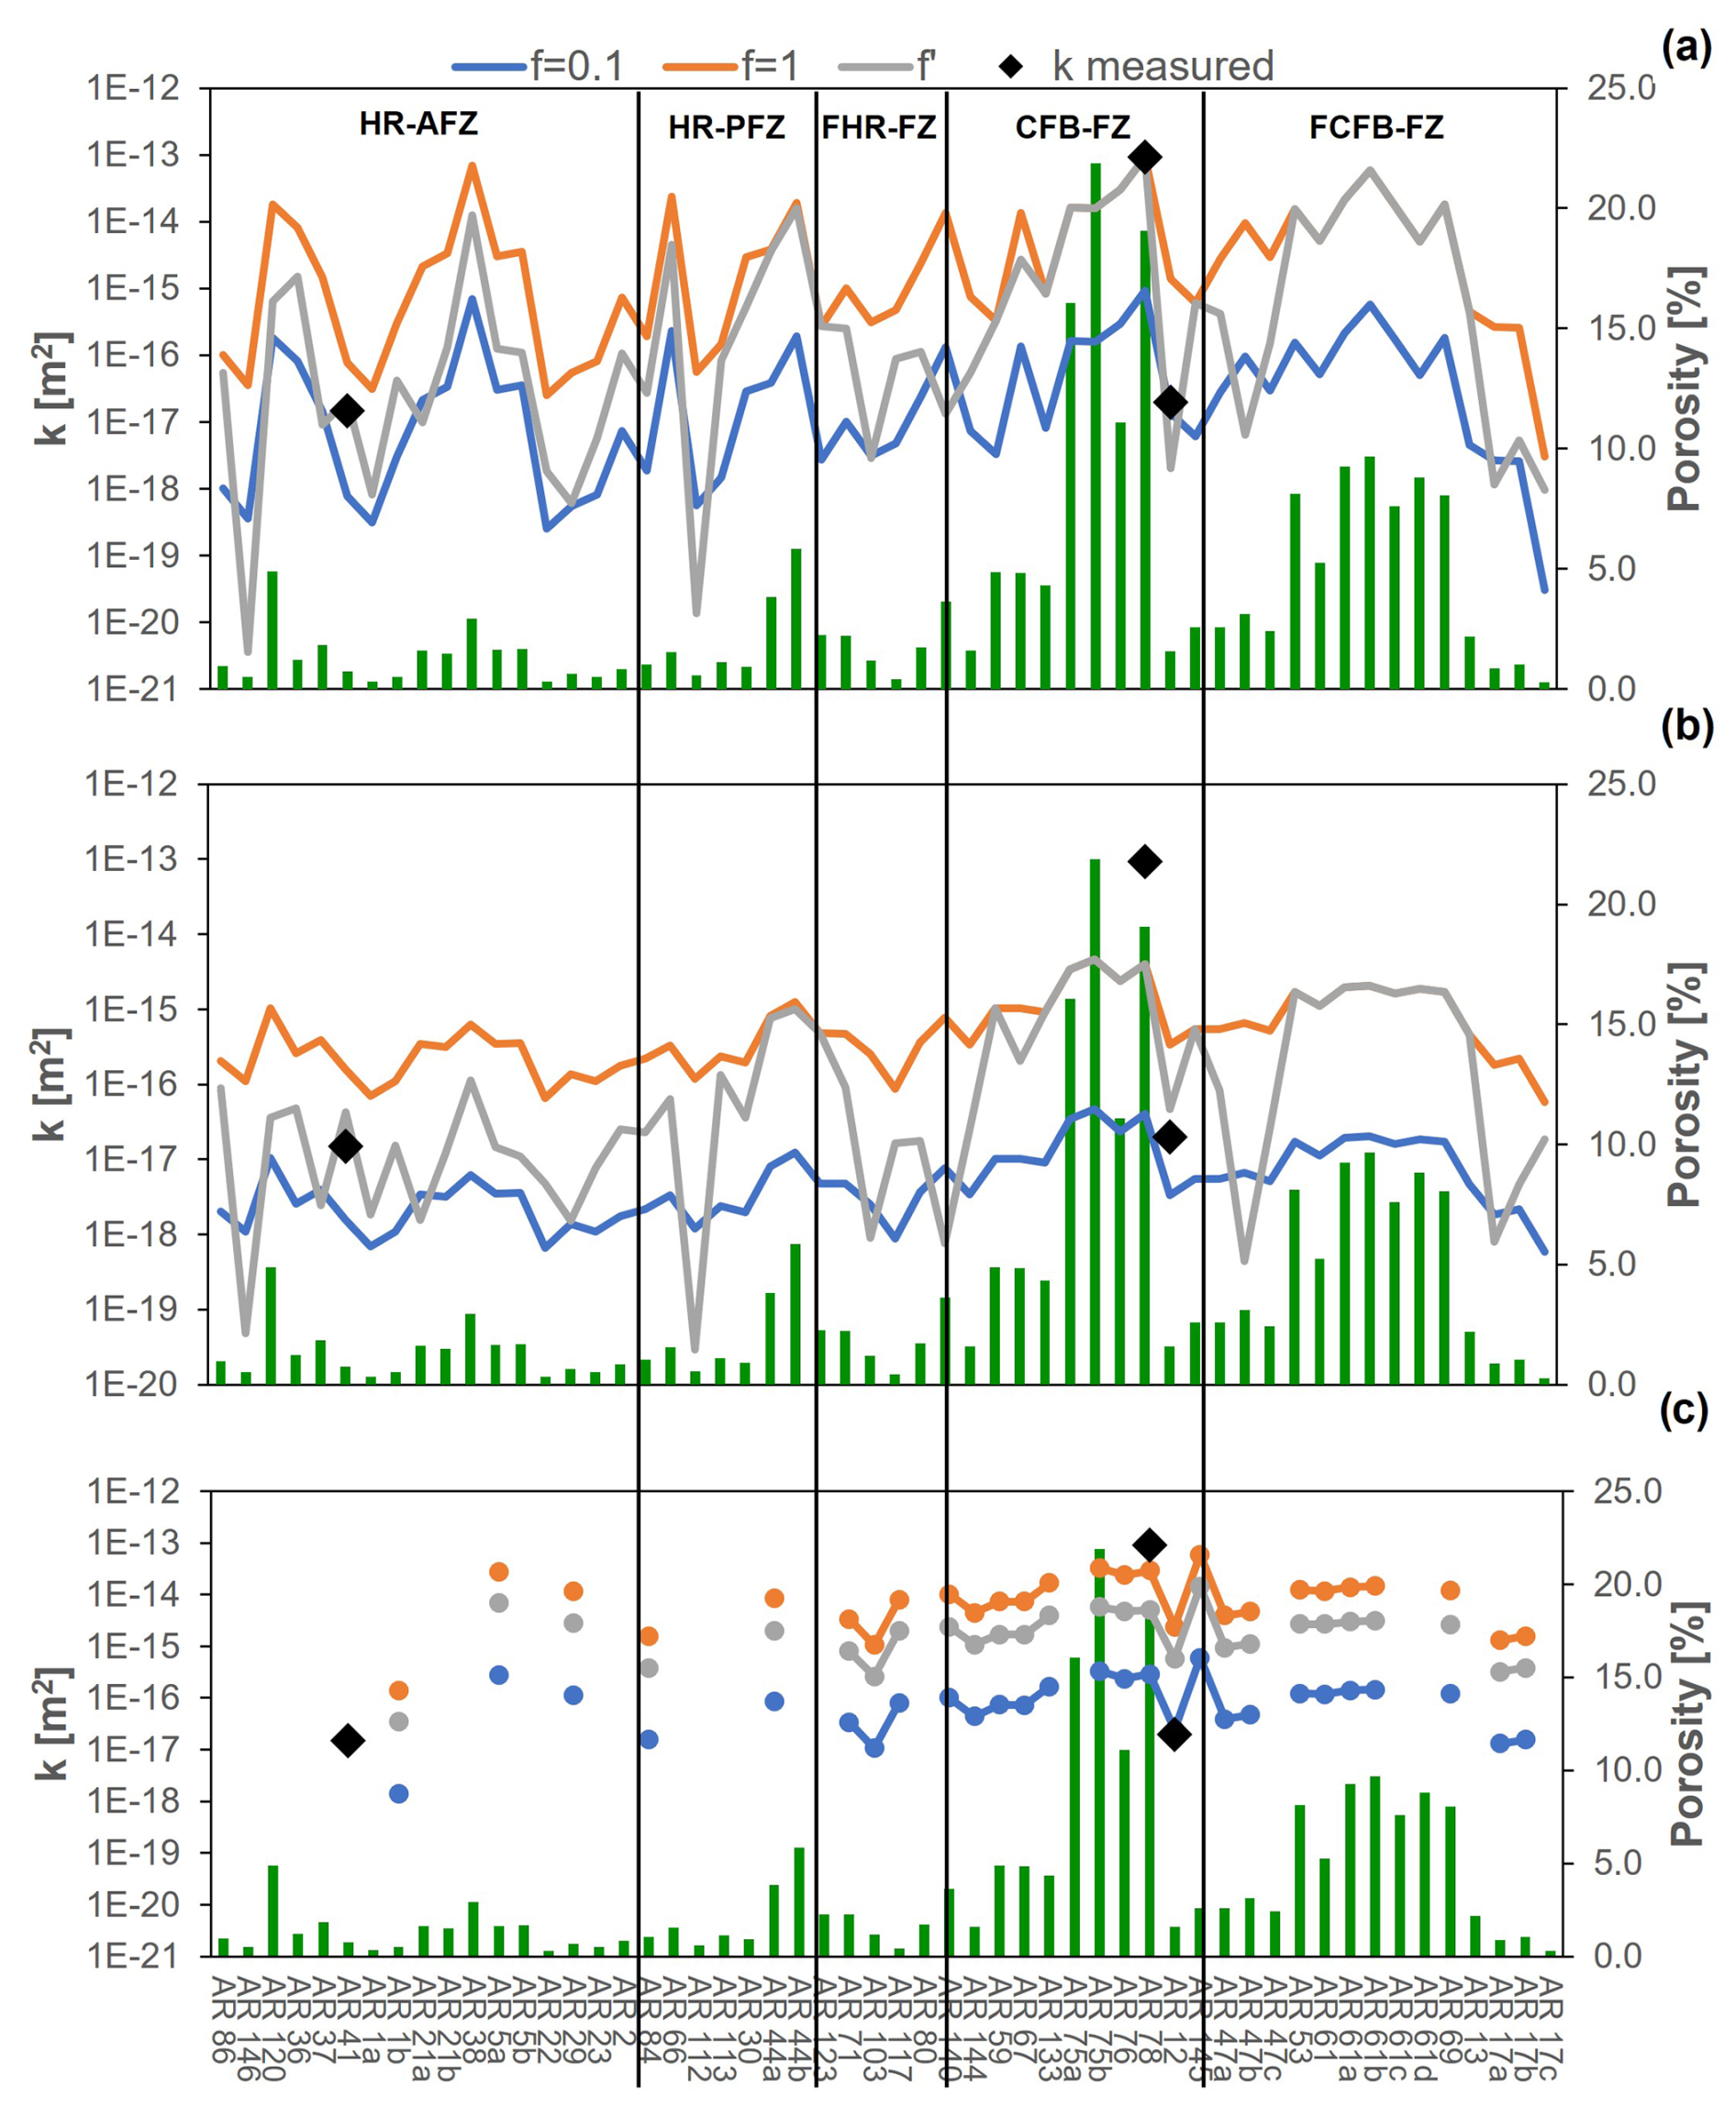
Figure 12Trend of permeability (orange, grey and blue lines) and porosity (green bars) values evaluated for each rock block by following (a) workflow 1 (EMT theory), (b) workflow 2 (w=1 µm) and (c) workflow 3 (2D image analysis). The three reported permeability trends are the results of different percolation factor values: 0.01 for the blue lines, 1 for the orange lines and estimated using Eq. (15) for grey lines. The black diamonds identify the rock block permeability measured with gas permeameter.
In this section, the results of laboratory analyses performed at both the micro- and mesoscale were compared to understand the nature and geometrical characteristics of the pores, in order to establish poro–perm relations for the lithologies of the Araxos Promontory. In particular, microscale analyses allowed the definition of the main mechanisms that rock samples underwent during deformation phases. Mesoscale correlation between physical and estimated mechanical parameters and porosity is provided to assess the properties of single structural domains and validate the hypotheses made on permeability estimation from indirect measurements, as discussed previously.
6.1 Deformation mechanisms
In order to document the scale-invariant process of deformation documented at the Araxos Promontory, and the progressive comminution of the carbonate fault breccia, we plot D0(grains) vs. percentage of matrix values obtained after digital images (Fig. 16). Data show a very good fitting (R2=0.99) and no significant change of its slope. Any slope change would have produced lower R2 values, related to a variation of the deformation mechanisms during fault rock comminution (Ferraro et al., 2018). This very good correlation is interpreted as being due to diffused bulk crushing (see Figs. 4 and 5), which is localised in the narrow rock volumes encompassing the major slip planes pertaining to the high angle faults (Bourli et al., 2019a; Smeraglia et al., 2023). In fact, on the basis of the microstructural evidence (see Sect. 4.1), the study fault rocks show rock textures predominantly including fault breccia and fine-crush fault breccia and fault microbreccia, which commonly form at very shallow crustal depths due to localised brittle strain (Ferraro et al., 2018, and references therein). It is also highlighted that the cementation process might have coated together the pre-existing survivor grains, obliterating therefore the possible effects of chipping and, eventually, shear fracturing in the study fault rocks (Ferraro et al., 2020). The cements documented within the study fault breccia, as well as the mineralisation sampled from coated slickensides and fault-related veins, have been recently analysed by Smeraglia et al. (2023). The results also pointed out the major control exerted by mineral precipitation from fault fluids on the diagenetic evolution of the carbonate fault breccia.
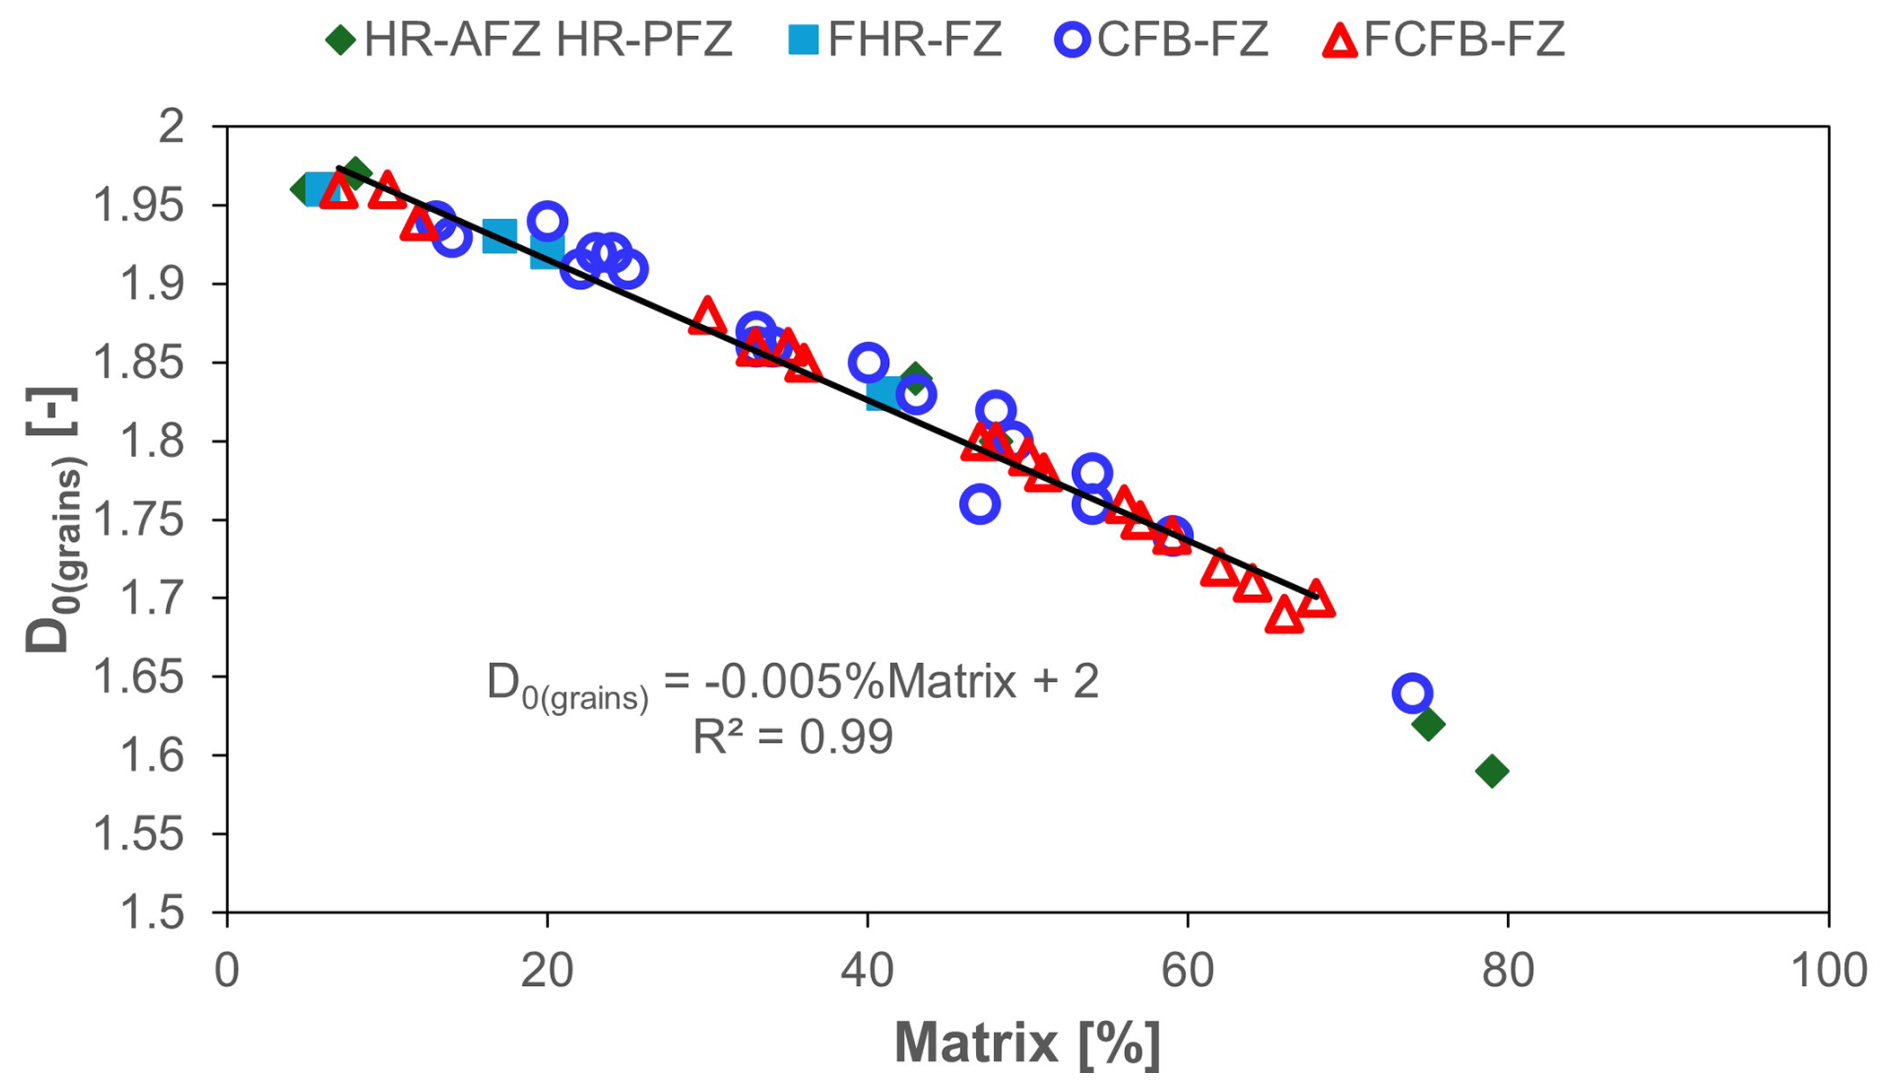
Figure 13Plots of box-counting dimension, D0(grain), vs. percentage of matrix for all host rock and fault-related rock samples. Data points related to the single measurements are reported in the log–log diagram according to the single lithologies.
6.2 Pore properties
In order to assess the pore types, we plot the average VP in dry conditions versus porosity values with respect to the Hashin Strickman upper and lower bounds (HS+ and HS−, respectively), the time-average equation (Wyllie et al., 1958, 1956), and the empirical best-fit line proposed by Anselmetti and Eberli (2001, 1997, 1993) for carbonates (Fig. 14). The HS+, HS− and time-average equations are calculated for a monomineralic, calcite-rich rock. The former parameters represent the narrowest possible bounds for elastic moduli calculated for an isotropic material by only knowing the volume fractions of the constituents (Mavko et al., 2009), whereas the time-average equation relates the VP of an isotropic, fluid-saturated, consolidated rock to its porosity, assuming that the total travel time can be approximated as the volume-weighted average of travel times through the individual rock constituents. The best-fit curve predicts the P-wave velocity of carbonates at any given porosity. Values of VP higher than the best fit are due to presence of moulds, which form by selective dissolution on the carbonates not affecting their elastic frame and thus enhancing porosity but not permeability; values lower than the best fit are due to vugs and microfractures.
According to the results of Fig. 14, data are consistent with the vast majority of the blocks being affected by vug porosity due to a non-selective dissolution of the carbonates and microfractures. Some of the host rock data points lie along Anselmetti and Eberli's (2001) best-fit line, whereas all fault rock data points show presence of vugs/microfractures.
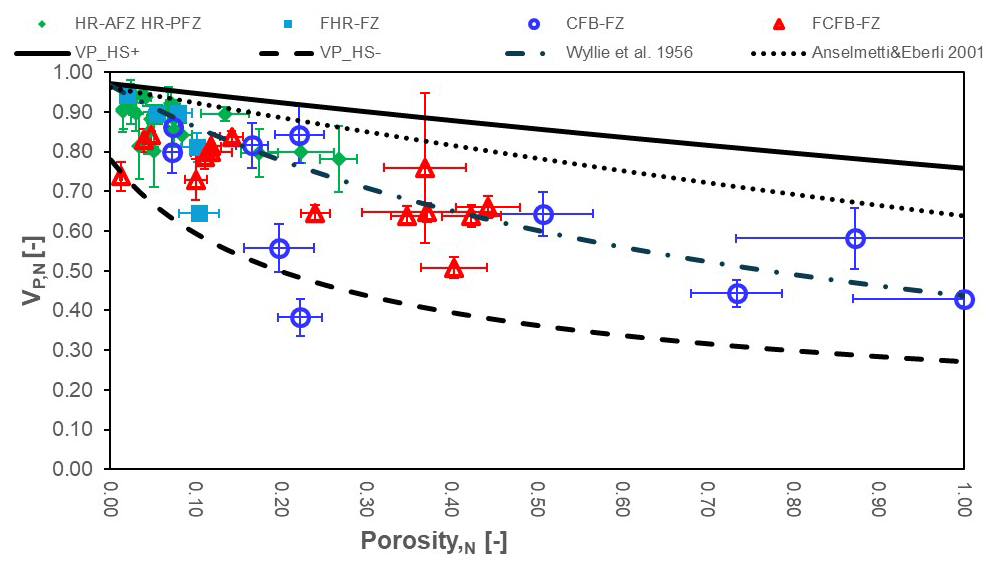
Figure 14Pore type of carbonate host rocks and fault rocks deciphered after the comparison between normalised VP,DRY and porosity values. The Hashin Strickman upper (H+) and lower bounds (H−), Wyllie's time average equation (Wyllie et al., 1956), and the linear best-fit equation proposed by Anselmetti and Eberli (2001) for carbonates of Italy and Bahamas are also reported.
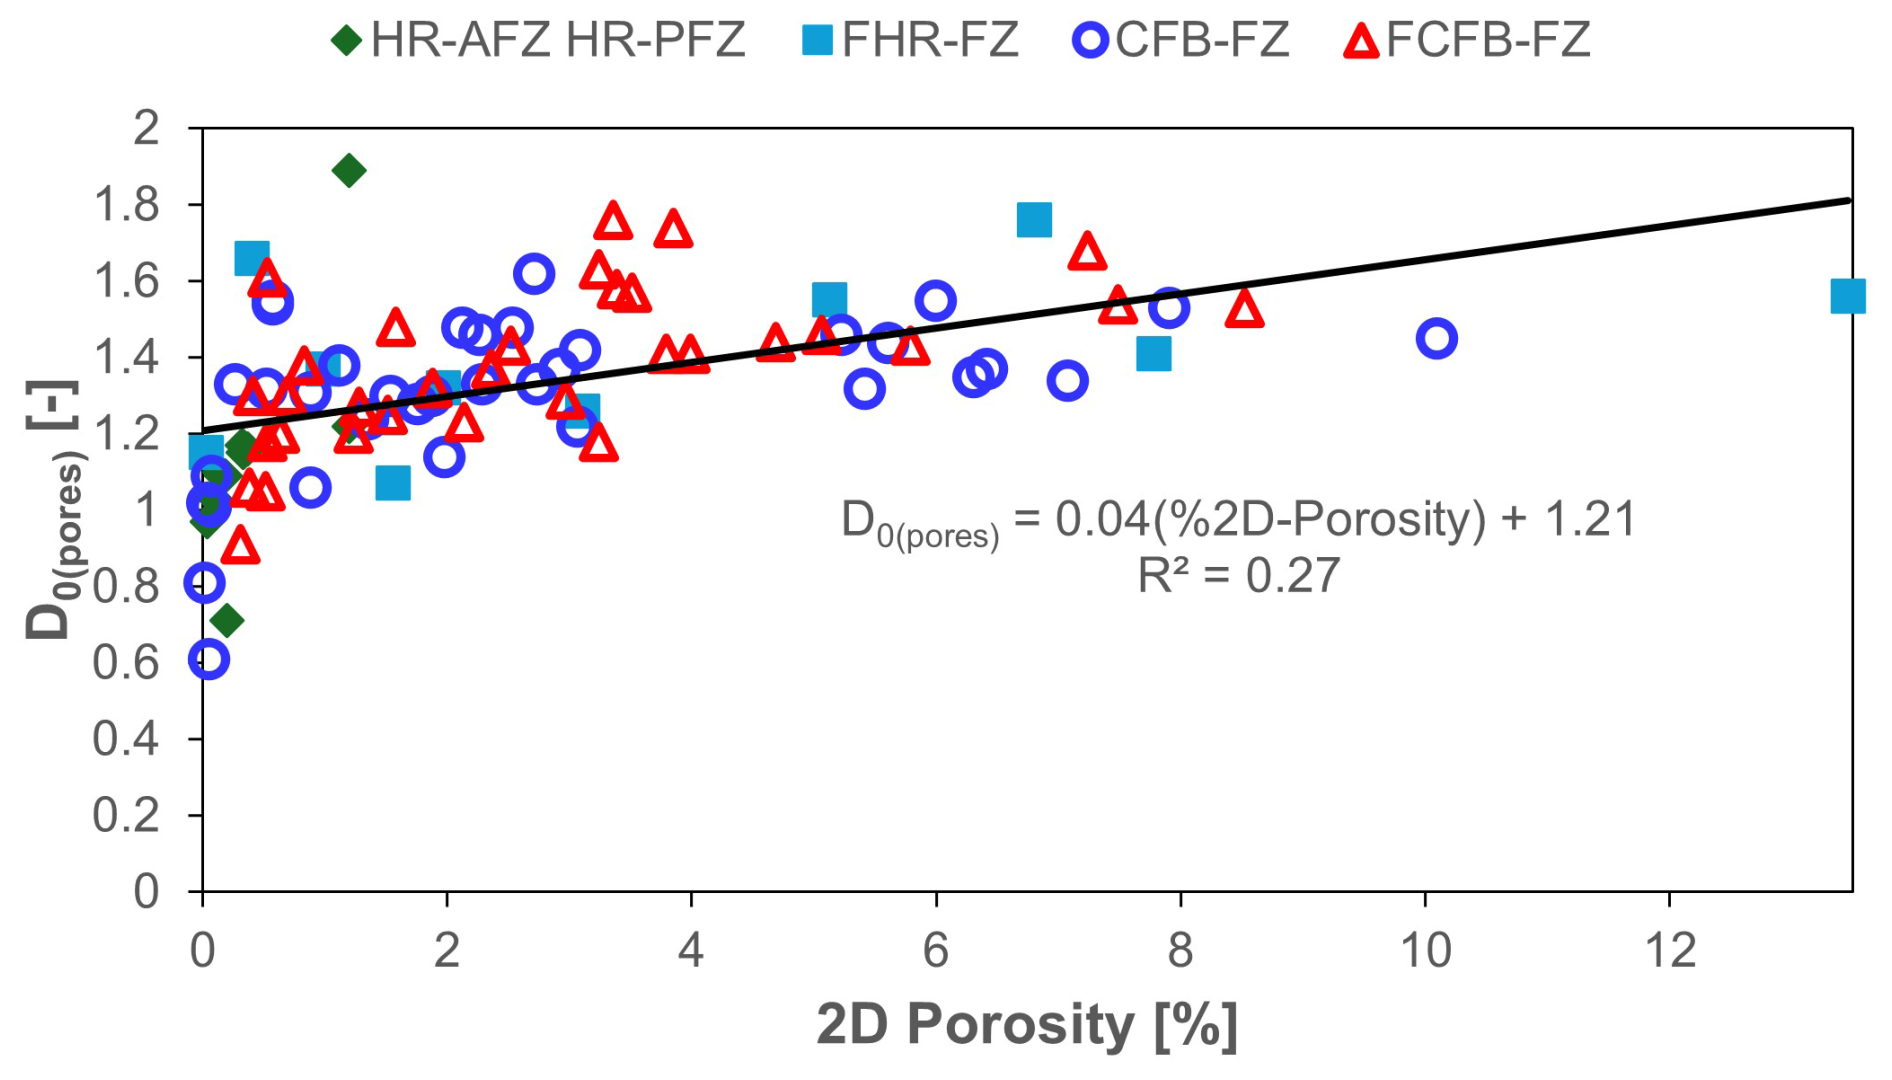
The pore volume distribution in carbonates can be fractal (Wu et al., 2019, and references therein) and statistically described by a power-law function (Mandelbrot, 1985). If the spatial pattern of the pores is also fractal, the plot of the box size versus the filling frequency is a power law and corresponds to the angular coefficient of the best-fit line (D0(pores), Falconer, 2003; Ferraro et al., 2018). Considering D0(pores) vs. 2Dφ (Fig. 15), they show a positive correlation. D0(pores) increases with higher 2D φ, meaning that pores are more uniformly distributed in higher-porosity carbonates, which correspond to the fault rocks. In other words, we observe that rock comminution due to brecciation caused a more homogeneous distribution of the microfractures throughout the investigated 1 cm2 areas. We also note that the very low value of the fitting coefficient (R2=0.27, Fig. 15) is due to outliers likely associated with the effect of non-selective dissolution of the carbonates, which affected both host rocks and fault rocks.
6.3 Physico-mechanical parameters vs porosity
Figure 16 illustrates the variation of the normalised petrophysical and mechanical parameters (, EDRY,N and νDRY,N), estimated from UPV measurements, along with the electrical properties, , with respect to the normalised porosity for each studied rock group. We only report the trend of parameters estimated in dry conditions, since the trend in saturated conditions fully reproduces the same behaviour.
Outcomes strengthen our findings based on microstructural analyses. In fact, the trend, which provides information on the stiffness and, to some extent, the poro-elasticity of the rock, is constant over the range of normalised porosity, with a slight increase for both host rocks (HR-AFZ and HR-PFZ) and CFB-FZ samples. This trend reflects two opposite physical and mechanical behaviours: (1) host rocks hold stiff properties, with high Young's modulus (Fig. 16c) and a low RDRY/RWET, indicating a low difference between electrical resistivity in dry and saturated conditions. This also suggests a higher homogeneity and isotropy of the pore distribution, as also evidenced by the microstructural analysis and the lowest values of anisotropy coefficient (Fig. 17). Conversely, (2) fault rocks such as CFB-FZ and FCFB-FZ samples exhibit very low mechanical properties (Fig. 16c) and high deformability due to higher values of Poisson's ratio (Fig. 16b), as well as a high electrical , due to the high degree of fracturing (Fig. 17). In terms of estimated permeability (Fig. 12), regardless of the chosen workflow, CFB-FZ samples have higher values. Interesting is their behaviour, which, from a mechanical and permeability point of view, is similar to CFB-FZ samples. In terms of porosity, the distribution of FCFB-FZ samples appears to be more uniform with respect to CFB-FZs, which show preferred directionality (refer to Fig. 5).
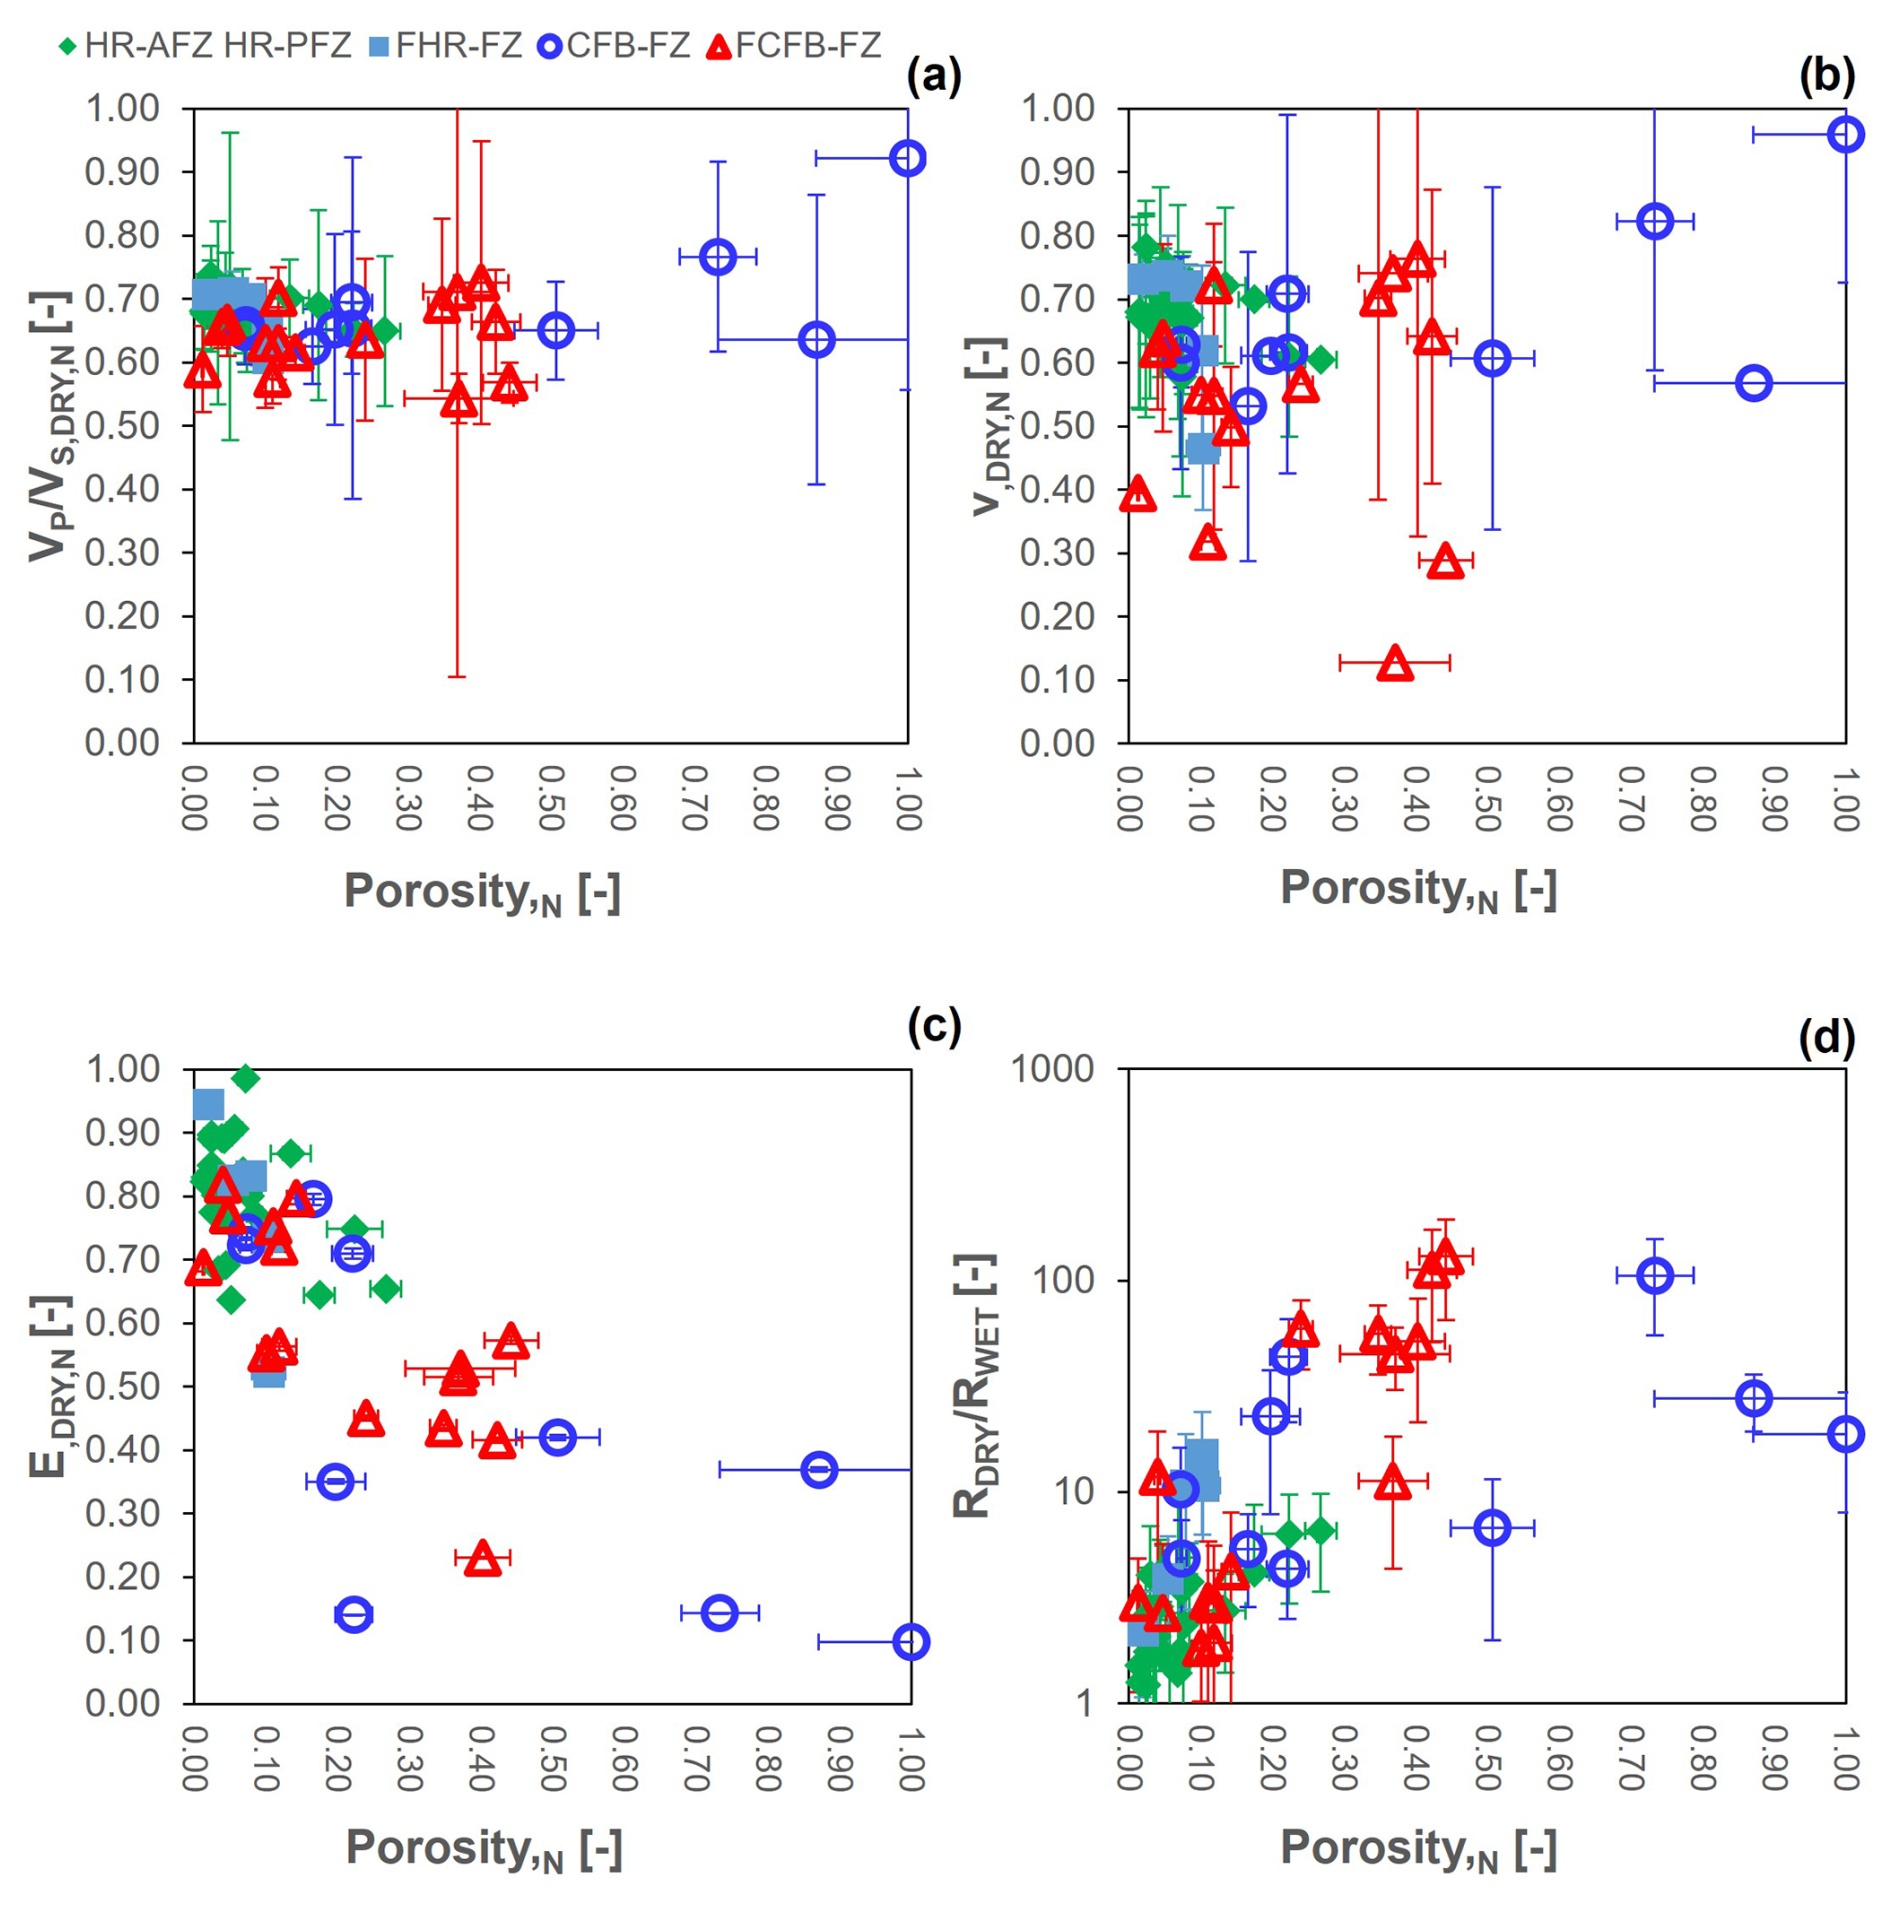
Figure 16Relationship between normalised (a) in dry conditions, (b) normalised Poisson's ratio, ν, (c) normalised Young's modulus, E, and (d) ratio between electrical resistivity in dry condition and in saturated conditions, , and porosity for the studied rock blocks.
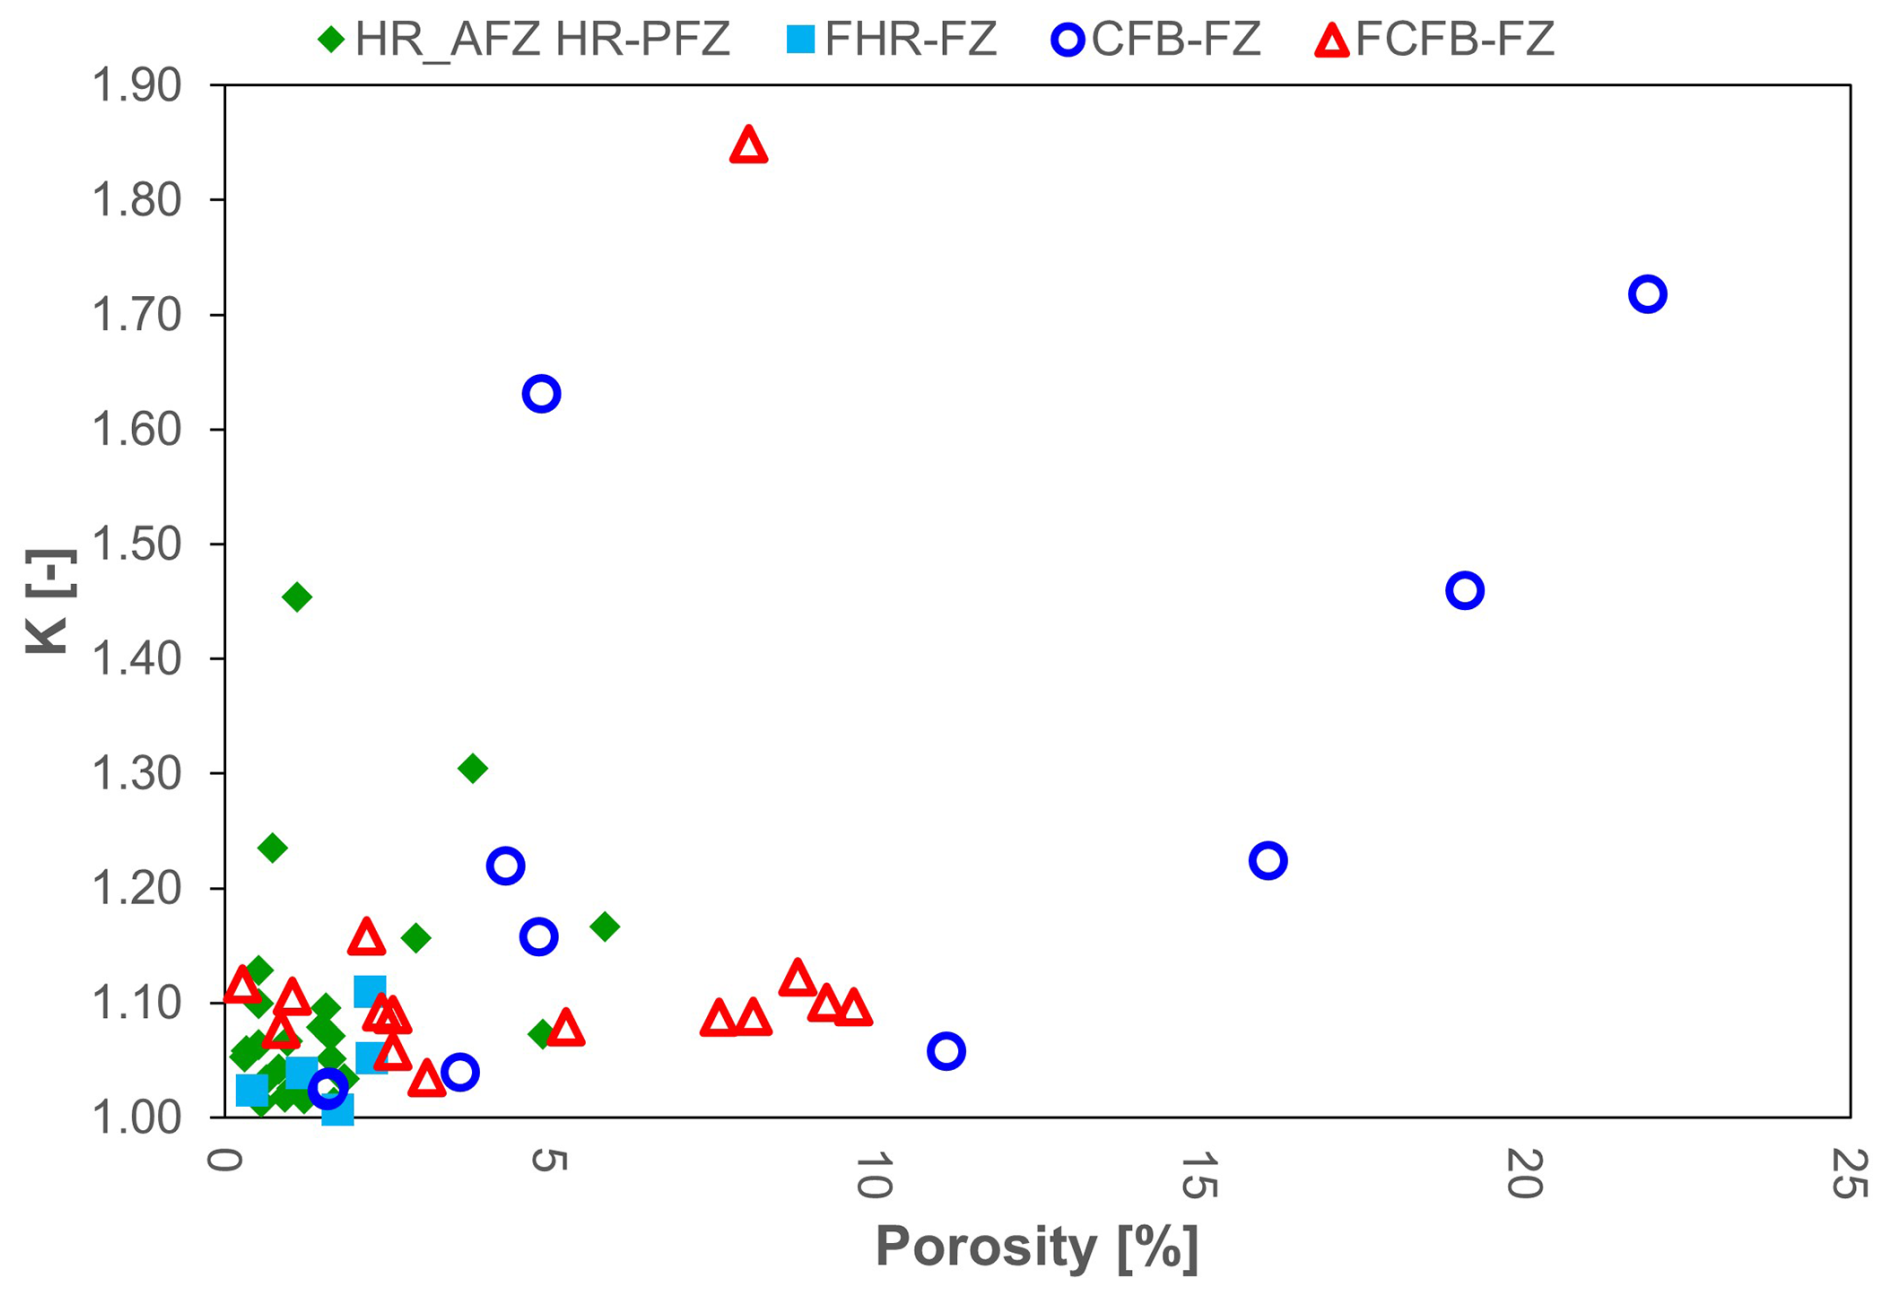
Figure 17Relationship between the coefficient of anisotropy, K, and porosity for the studied rock blocks.
6.4 Poro–perm relations
The poro–perm relations (Fig. 18) are assessed for each workflow described in Sect. 5 by considering the percolation factor, f′, defined in Eq. (14). The grey continuous lines represent the variability domain defined by considering the upper (f=1) and lower (f=0.01) edges of the range of variability of percolation factor f. As shown in Fig. 18, the carbonate host rocks (HR-AFZ, HR-PFZ, FHR-FZ – green and cyan markers) do not show any significant poro–perm relation. In fact, the calculated k values exhibit a large permeability variation, up to 4 orders of magnitude, and do not vary proportionally with porosity.
The lack of relation is interpreted as being due to the presence of both stiff, sub-rounded pores and vugs/microfractures in the carbonate host rocks (Agosta et al., 2007; Ferraro et al., 2020). Accordingly, the host rock data points show a wide dispersion in the plot of Fig. 18. Conversely, the calculated k values of fault rocks log-linearly increase with porosity. Although fault rocks (CFB-FZ and FCFB-FZ) show a very large permeability variation, by up to 5 orders of magnitude, the log-linear relation is interpreted as being due to a connected pore network (Ehrenberg et al., 2006), which mainly includes vugs/microfractures (refer to Sect. 6.2).
The poro–perm relations are in good agreement, regardless of the WF chosen for their determination. There is also a good correspondence with the laboratory tests, although not completely exhaustive due to the limited number, supporting the hypothesis that expedite methodologies, such as those via geophysical methods supported by micro-structural analyses, are reliable for evaluating permeability.
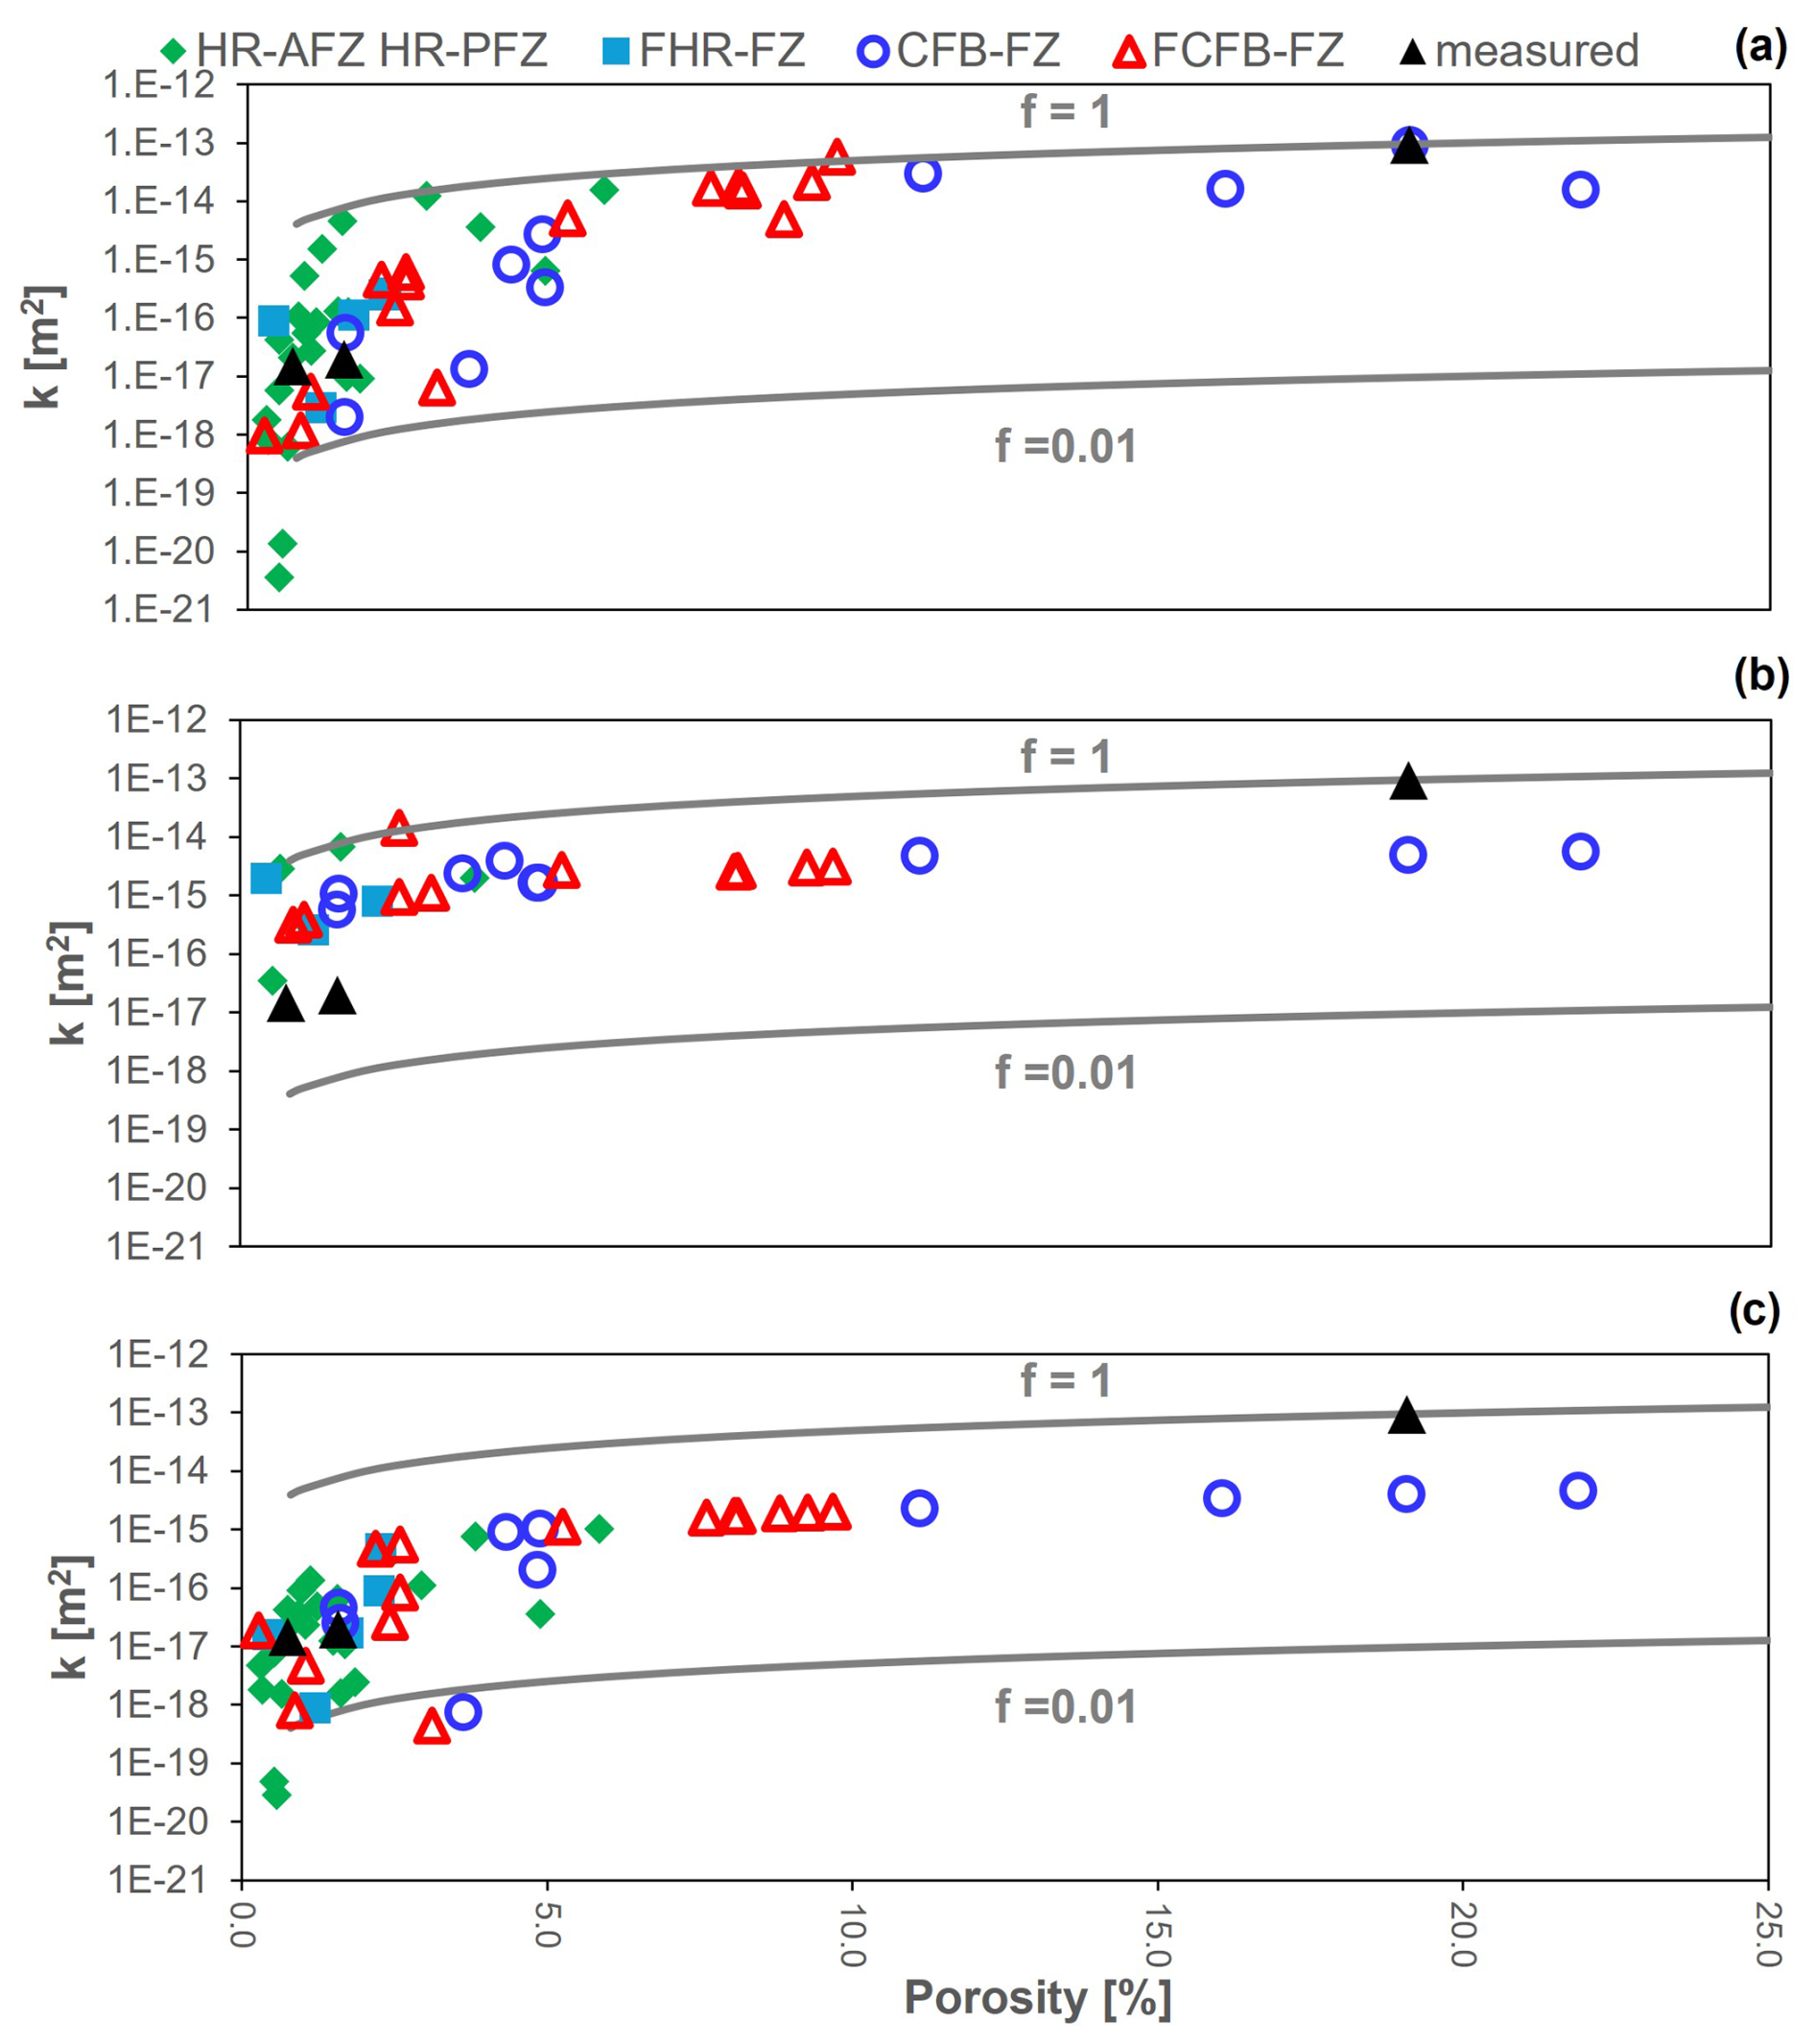
Figure 18Poro–perm relations for both host rocks (HR-AFZ and HF-PFZ) and fault rocks (FHR-FZ, CFB-FZ, FCFB-FZFR) considering the connectivity factor, f′ (Eq. 14), and adopting (a) workflow 1 (EMT theory), (b) workflow 2 (w=1 µm) and (c) workflow 3 (2D image analysis).
We present the results of a petrophysical characterisation of Mesozoic carbonate rocks collected from outcrops of the Araxos Promontory, northwest Greece, aiming to define the poro–perm relation of both host rocks and fault rocks. Rock samples consist of Senonian and Vigla formations made of carbonate mudstones, wackestones, packstones and sedimentary breccias and of fault breccias collected from high-angle extensional and strike-slip fault zones. Compared to the host rocks, results show that the fault breccias exhibit a wider range of density, up to 5–10 times greater porosity and lower ultrasonic velocities. A slight textural anisotropy is documented in the carbonate host rocks, whereas a more evident anisotropy characterises the fault rocks mirroring the increase in porosity. Regardless of lithology, the carbonate host rocks include small vugs, whereas the fault breccias also include microfractures. Selected samples were also tested in pressure vessels with confining pressure up to 80 MPa, showing that transport properties along microcracks in fault breccias can significantly increase with increasing depth.
To compute the poro–perm relations, three different workflows (WFs) were employed to estimate permeability: (i) from Effective Medium Theory, by considering the results of ultrasonic measurements; (ii) a constant crack aperture of 1 µm; and (iii) crack density values from 2D image analysis. The results highlighted that the carbonate host rocks did not show a clear poro–perm trend due to the presence of stiff, sub-rounded pores and small vugs. The fault breccia showed a linear increase in permeability with porosity due to a connected pore network built by microfractures. Regarding the employed WF, good correspondence between theoretical calculations and gas permeability measurements was observed. These findings support the reliability of using expedited analyses, such as geophysical methodologies supported by microstructural analyses, for the determination of permeability in fault zones. In particular, this methodology is useful for detailed outcrops characterisation or for a preliminary analysis of retrieved rock samples. The results provide a protocol of investigative tools that can be employed in similar case studies. Of course, a potential limitation is the specificity of the findings, which are undoubtedly dataset dependent. However, the goal of this study is to establish a working protocol that can be applied to the analysis of fractured and faulted carbonates, with particular emphasis on improving geological modelling in engineering geology, where understanding fluid dynamics is crucial. These findings may have important implications for both CO2 storage and geothermal energy applications since the characterisation of porosity and permeability in faulted carbonate rocks is crucial for evaluating their potential as reservoirs or seals in subsurface CO2 storage projects. The observed increase in permeability with porosity in fault breccias suggests that fractured carbonate formations could serve as effective migration pathways for injected CO2, emphasising the need for careful reservoir characterisation to assess caprock integrity and leakage risks. Additionally, the study's methodology and results are relevant for geothermal applications, where fluid flow dynamics play a key role in heat extraction efficiency. The identified poro–perm relationships and the pressure-dependent transport properties of fault breccias suggest that fractured carbonate reservoirs could enhance geothermal fluid circulation at depth, potentially improving the performance of geothermal systems. The proposed investigative protocol also provides a valuable tool for the preliminary assessments of permeability in geothermal reservoirs and CO2 storage sites, helping to optimise site selection and geological modelling.
Figures A1 to A4 represent the sampling areas in the Araxos Promontory (NW Greece).
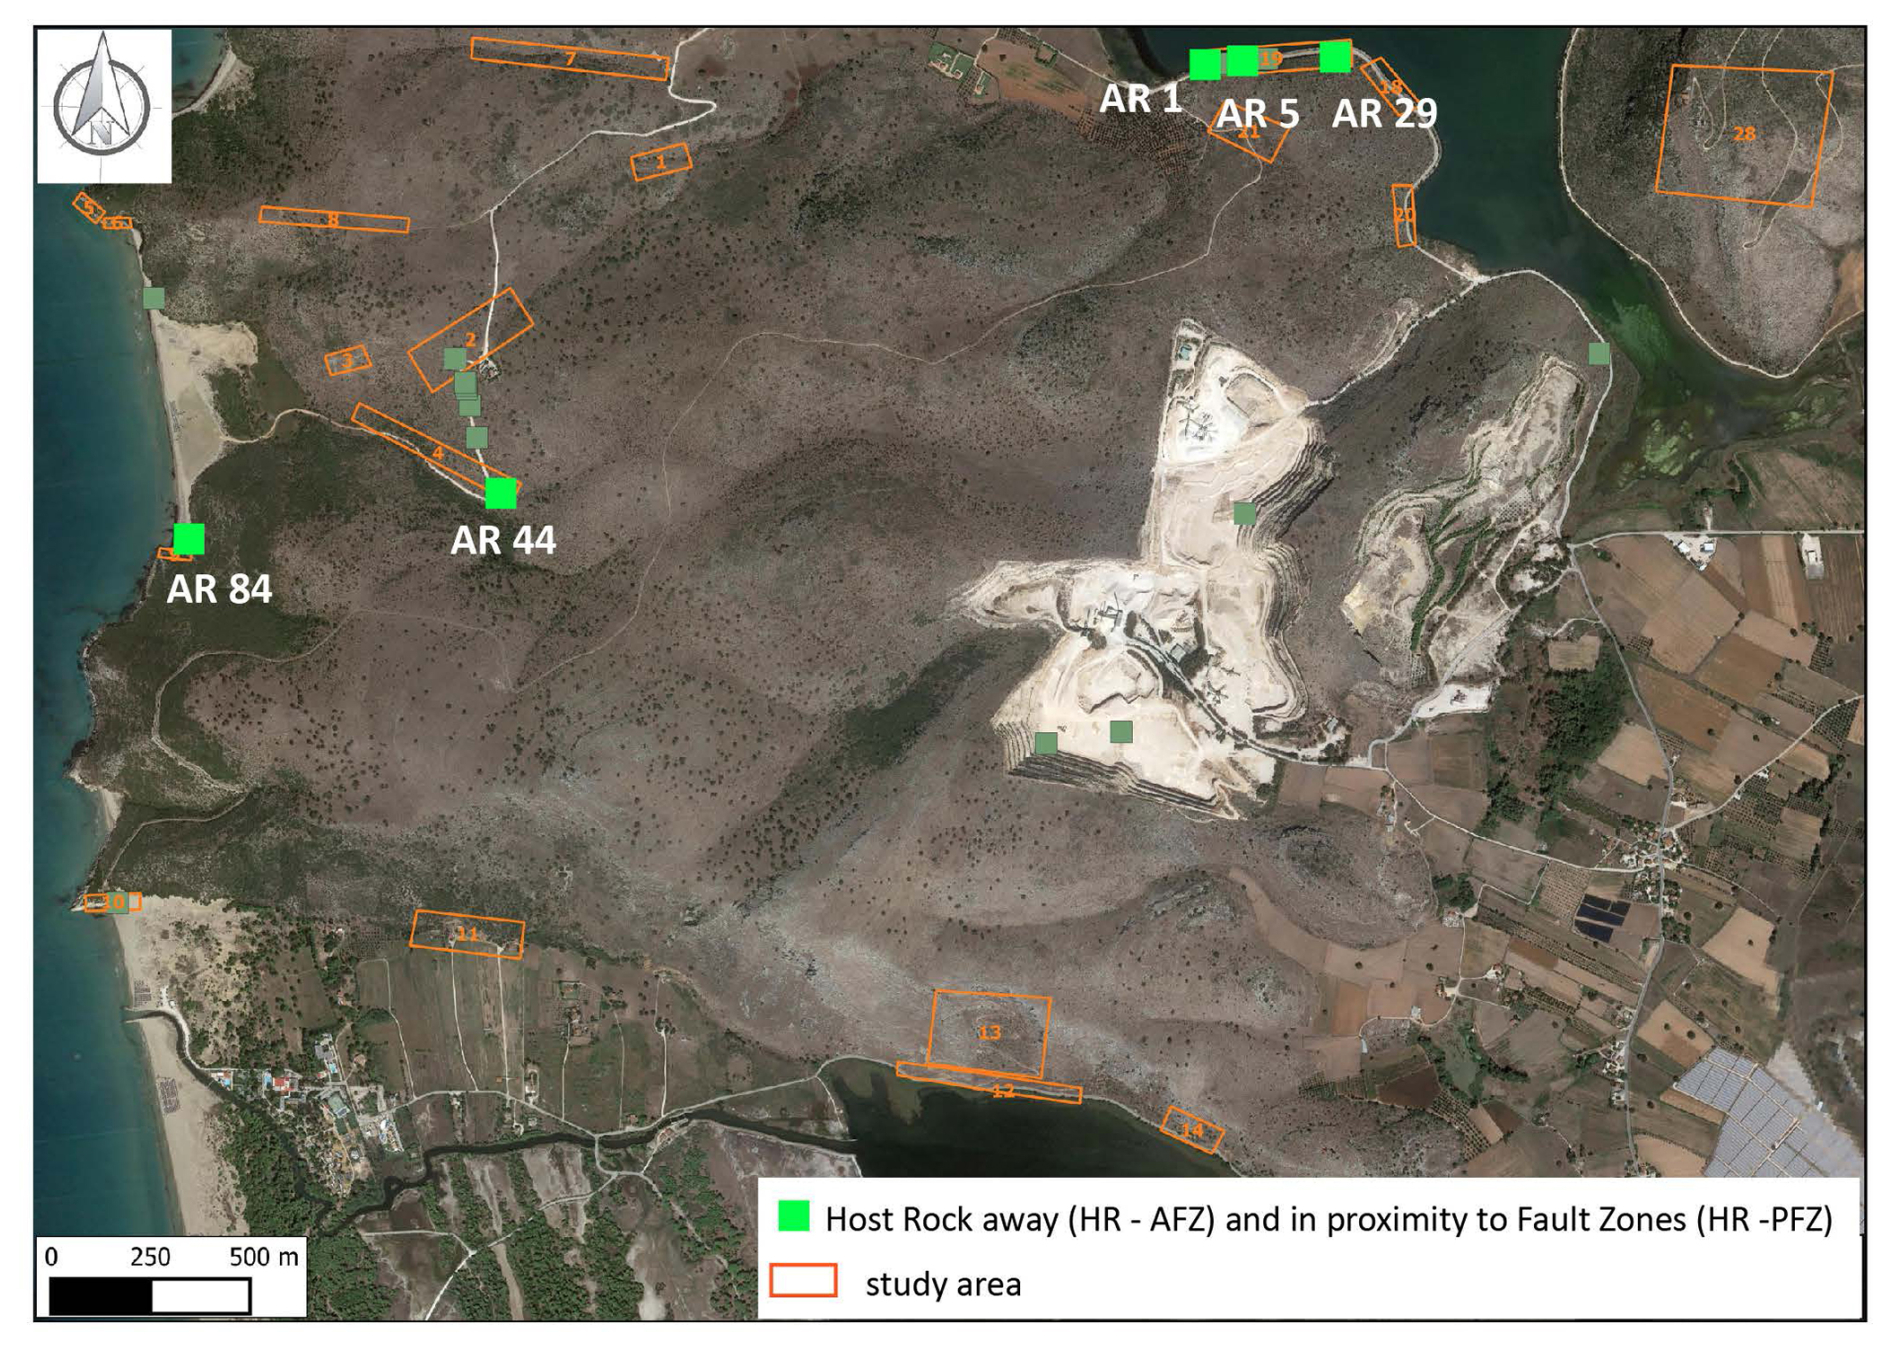
Figure A1(Map data: © Google Earth 2025) Sampling areas for the HR-AFZ and HR-PFZ, along with the location (orange polygons) of the host rock samples used for digital image analysis (green markers).
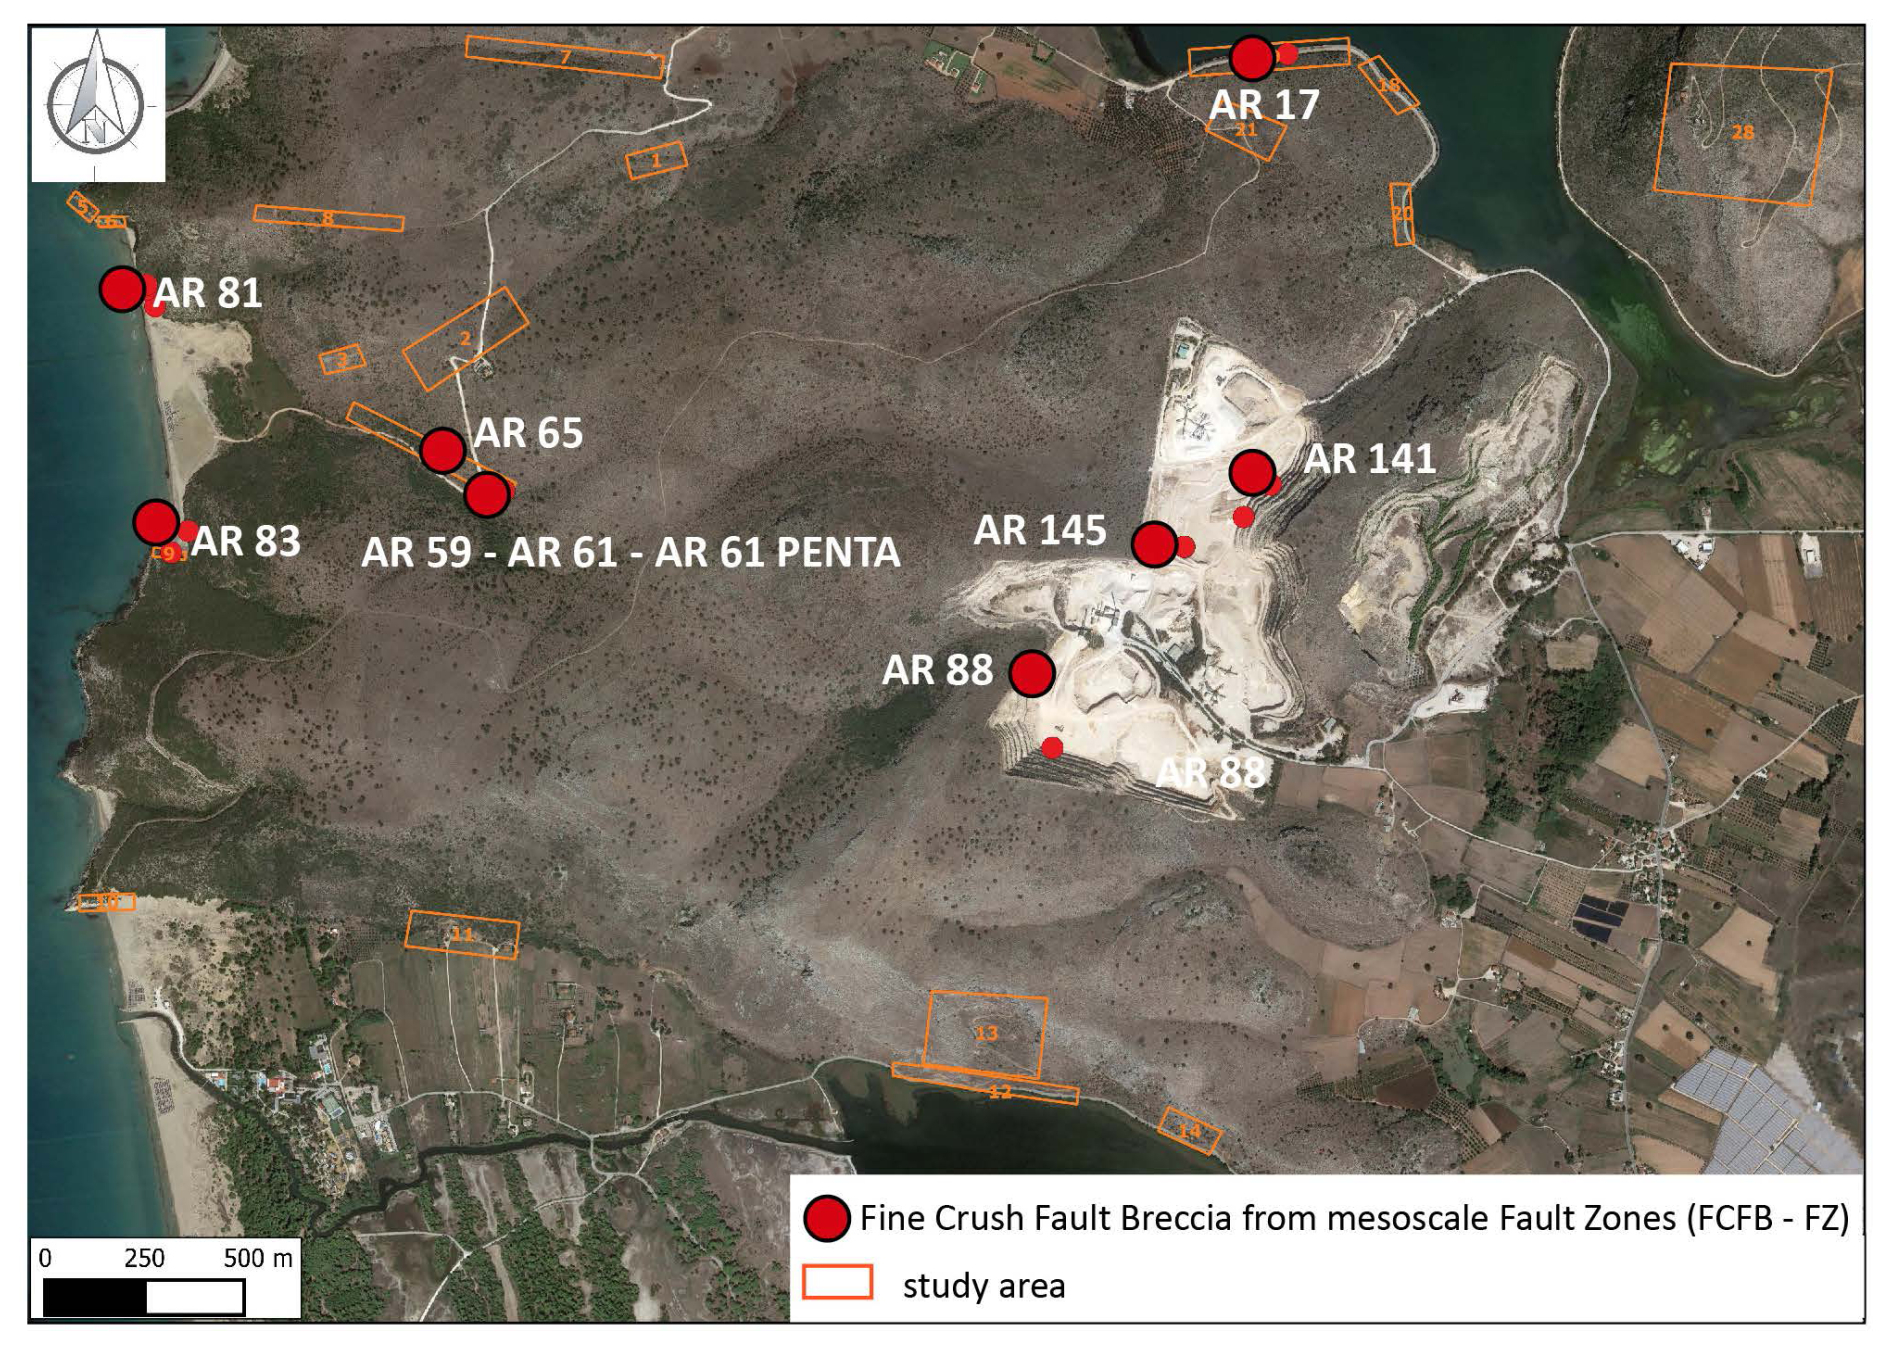
Figure A2(Map data: © Google Earth 2025) Sampling areas for the FHR-FZ, along with the location (orange polygons) of the host rock samples used for digital image analysis (violet markers).
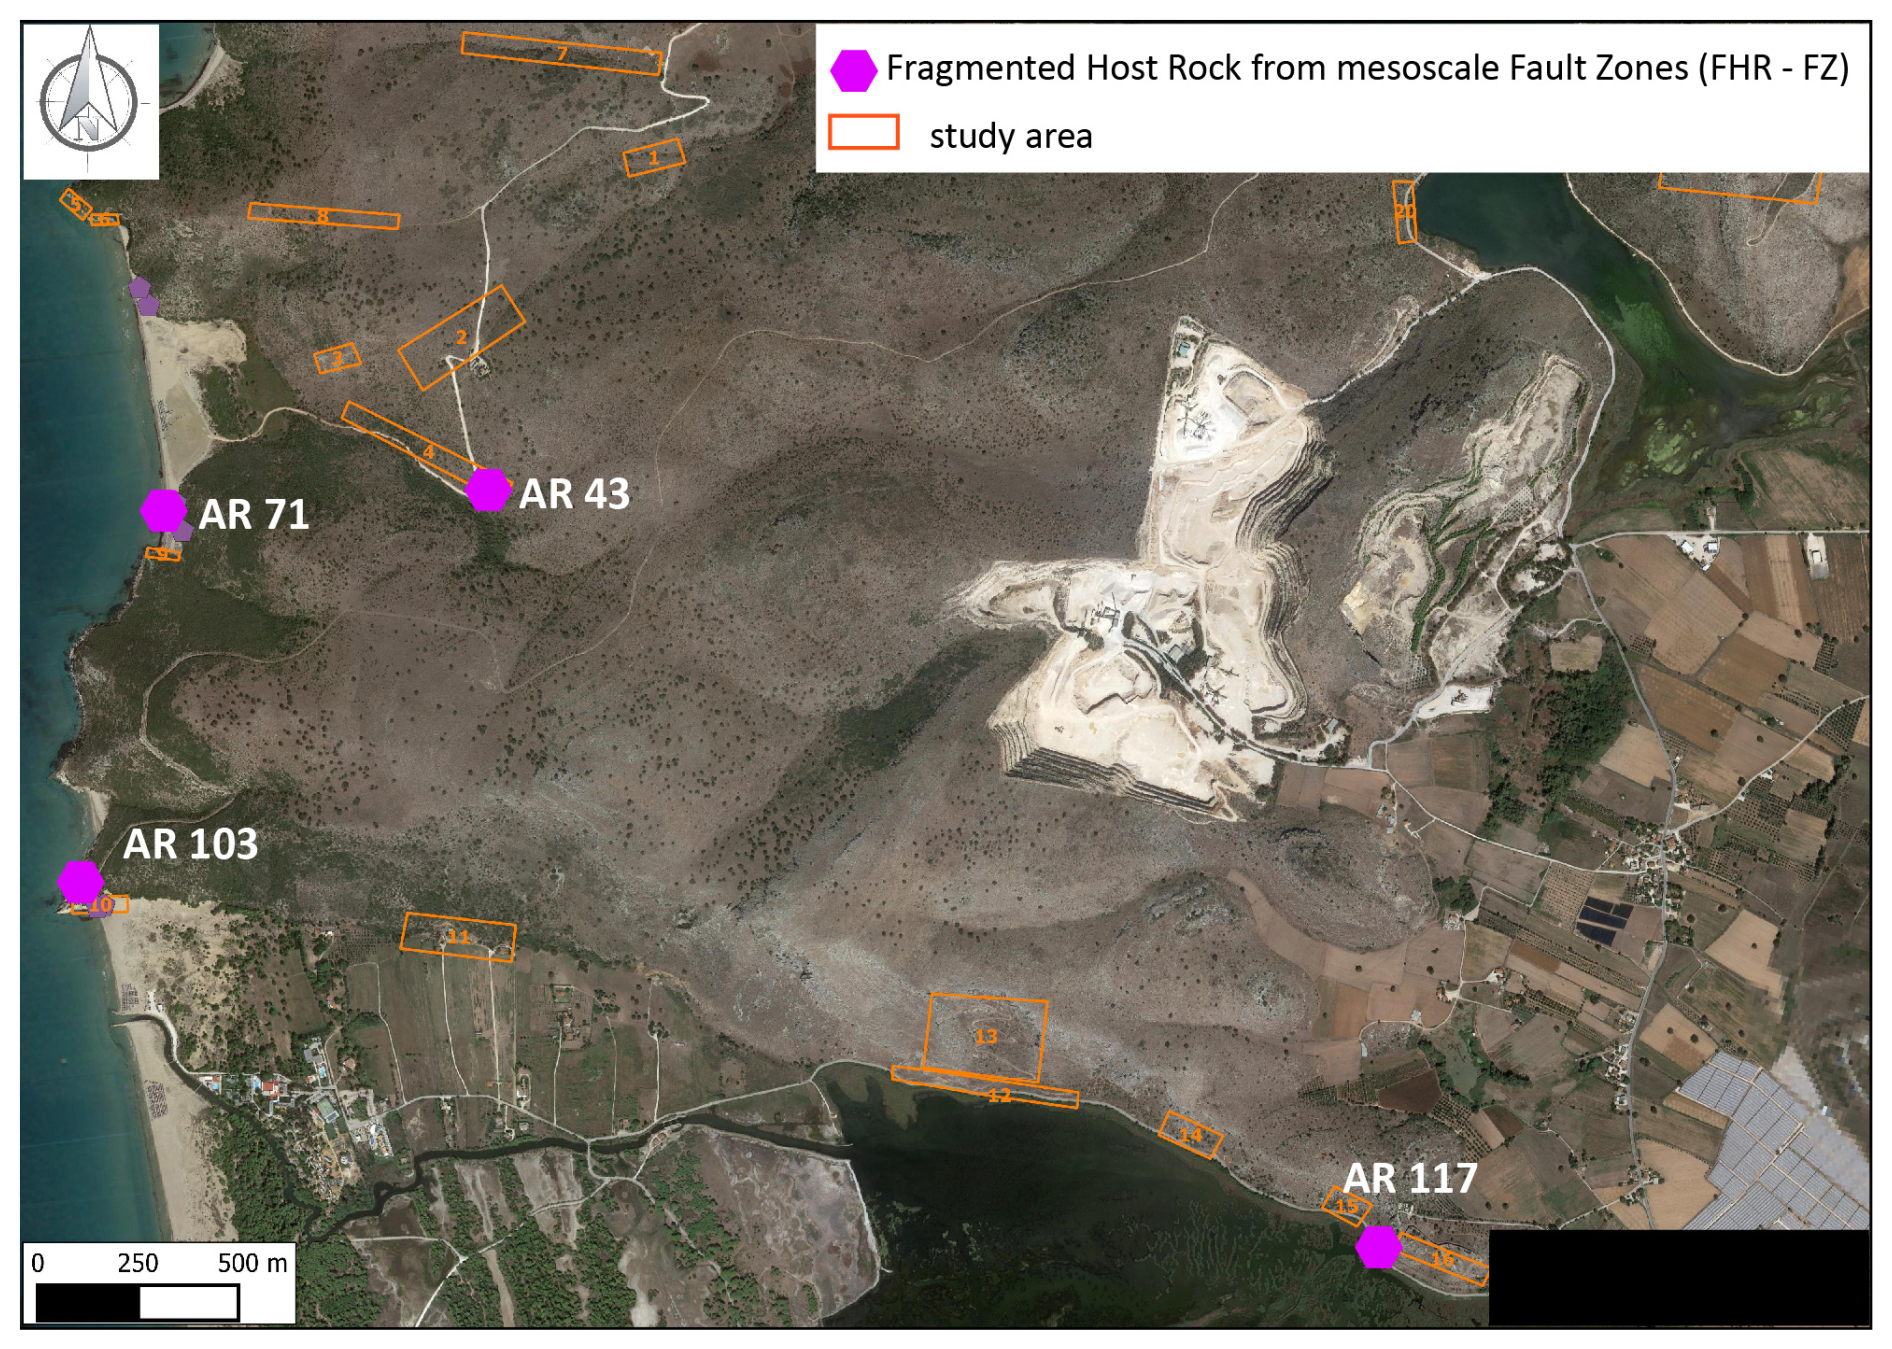
Figure A3(Map data: © Google Earth 2025) Sampling areas for the CFB-FZ, along with the location (orange polygons) of the host rock samples used for digital image analysis (brown markers).
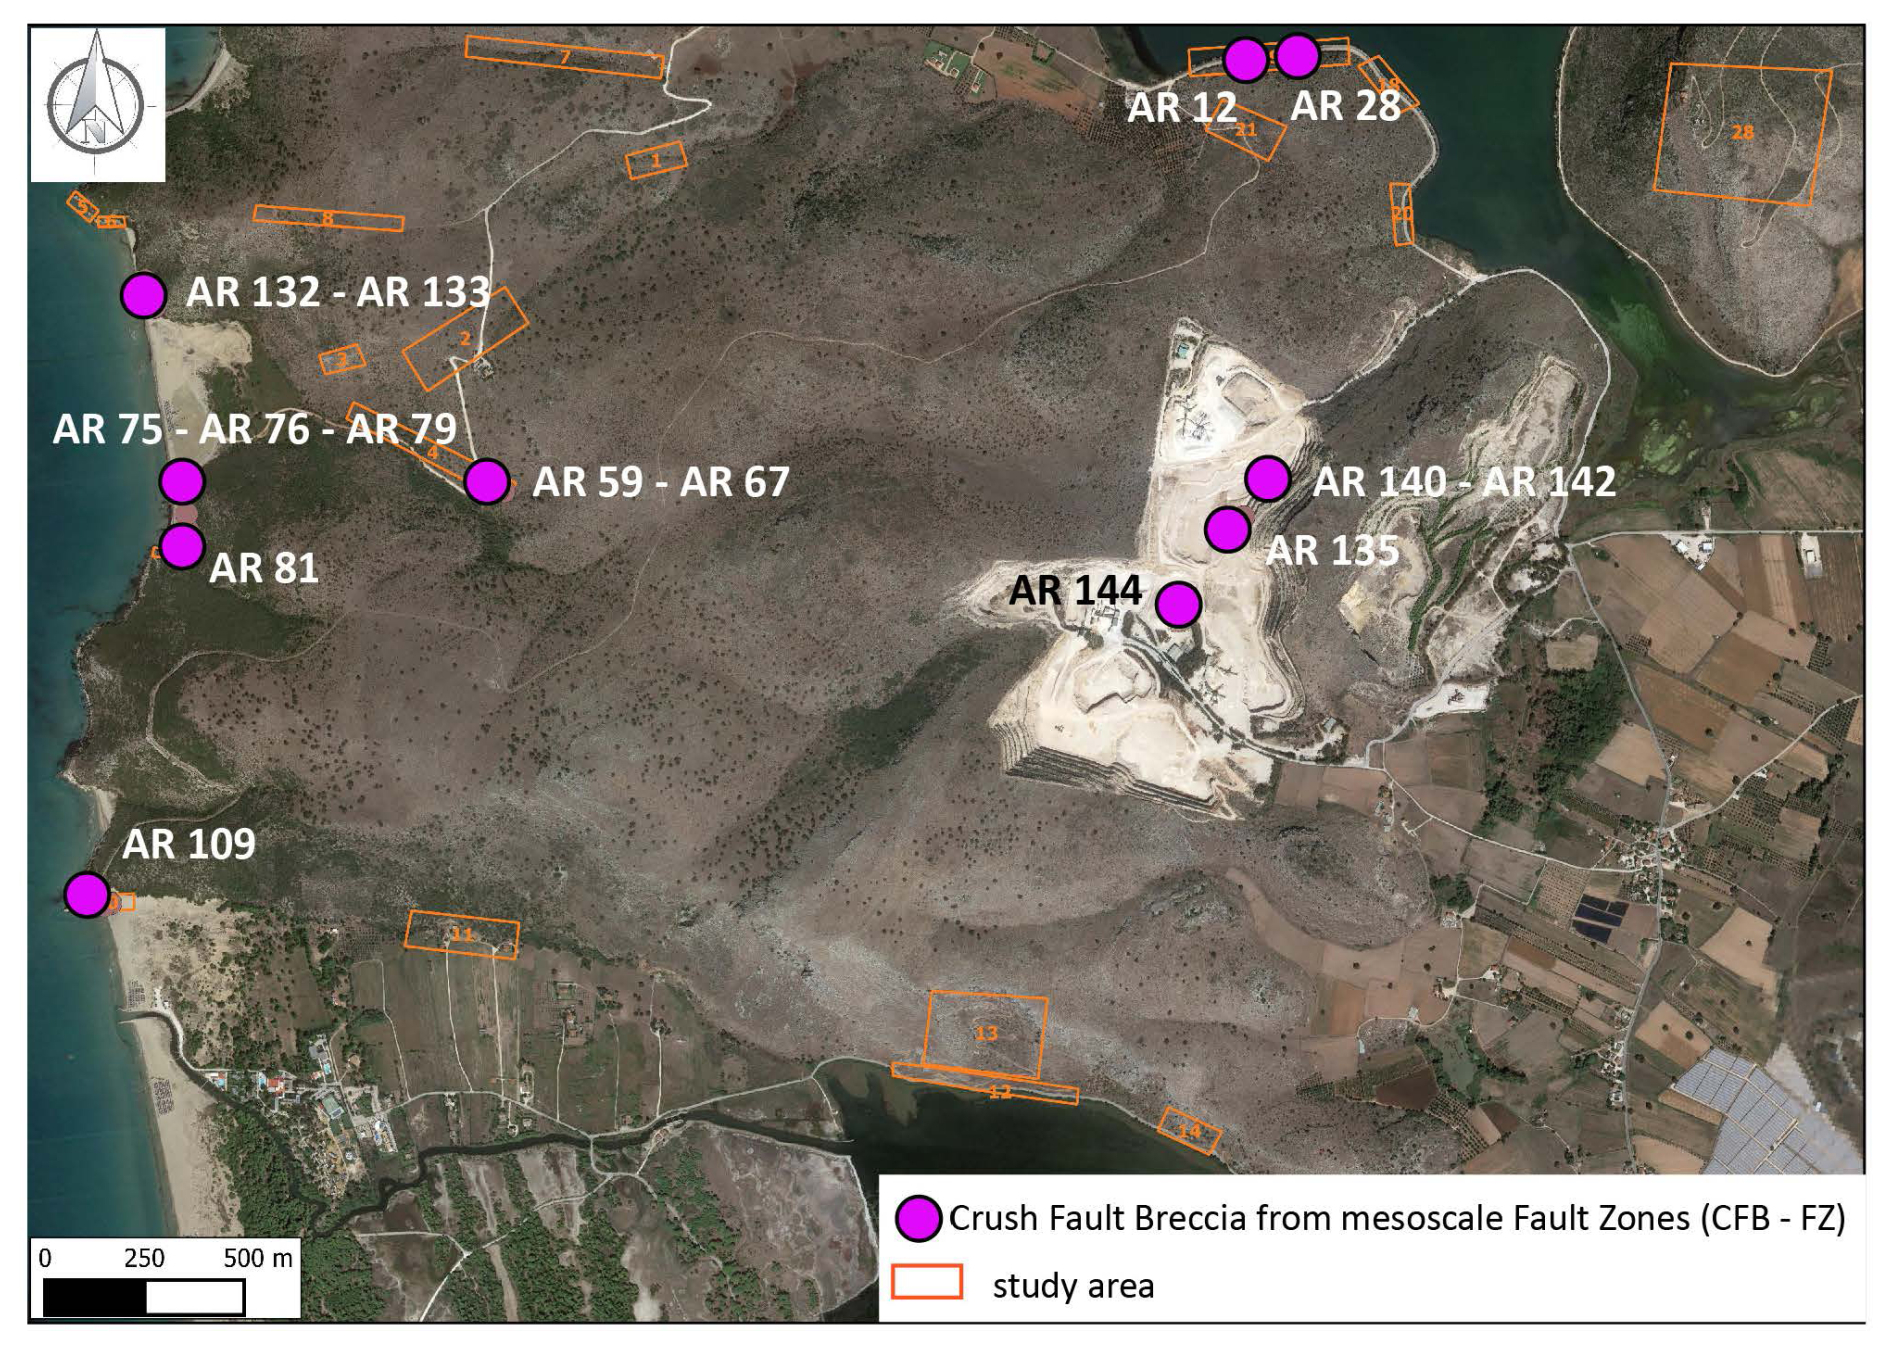
Figure A4(Map data: © Google Earth 2025) Sampling areas for the FCFB-FZ, along with the location (orange polygons) of the host rock samples used for digital image analysis (red markers).
Figure B1 shows the variation of P-wave (Fig. B1a) and S-wave (Fig. B1b) velocities evaluated for each rock block along each orthogonal direction. Both P- and S-wave trends are in agreement: anisotropy within the rock samples is more pronounced in HR-FZ, CFB-FZ and FCFB-FZ, as already discussed in Sect. 4.2 and Fig. 10. The other samples exhibit less pronounced anisotropy, as it falls within the natural variation of the material.
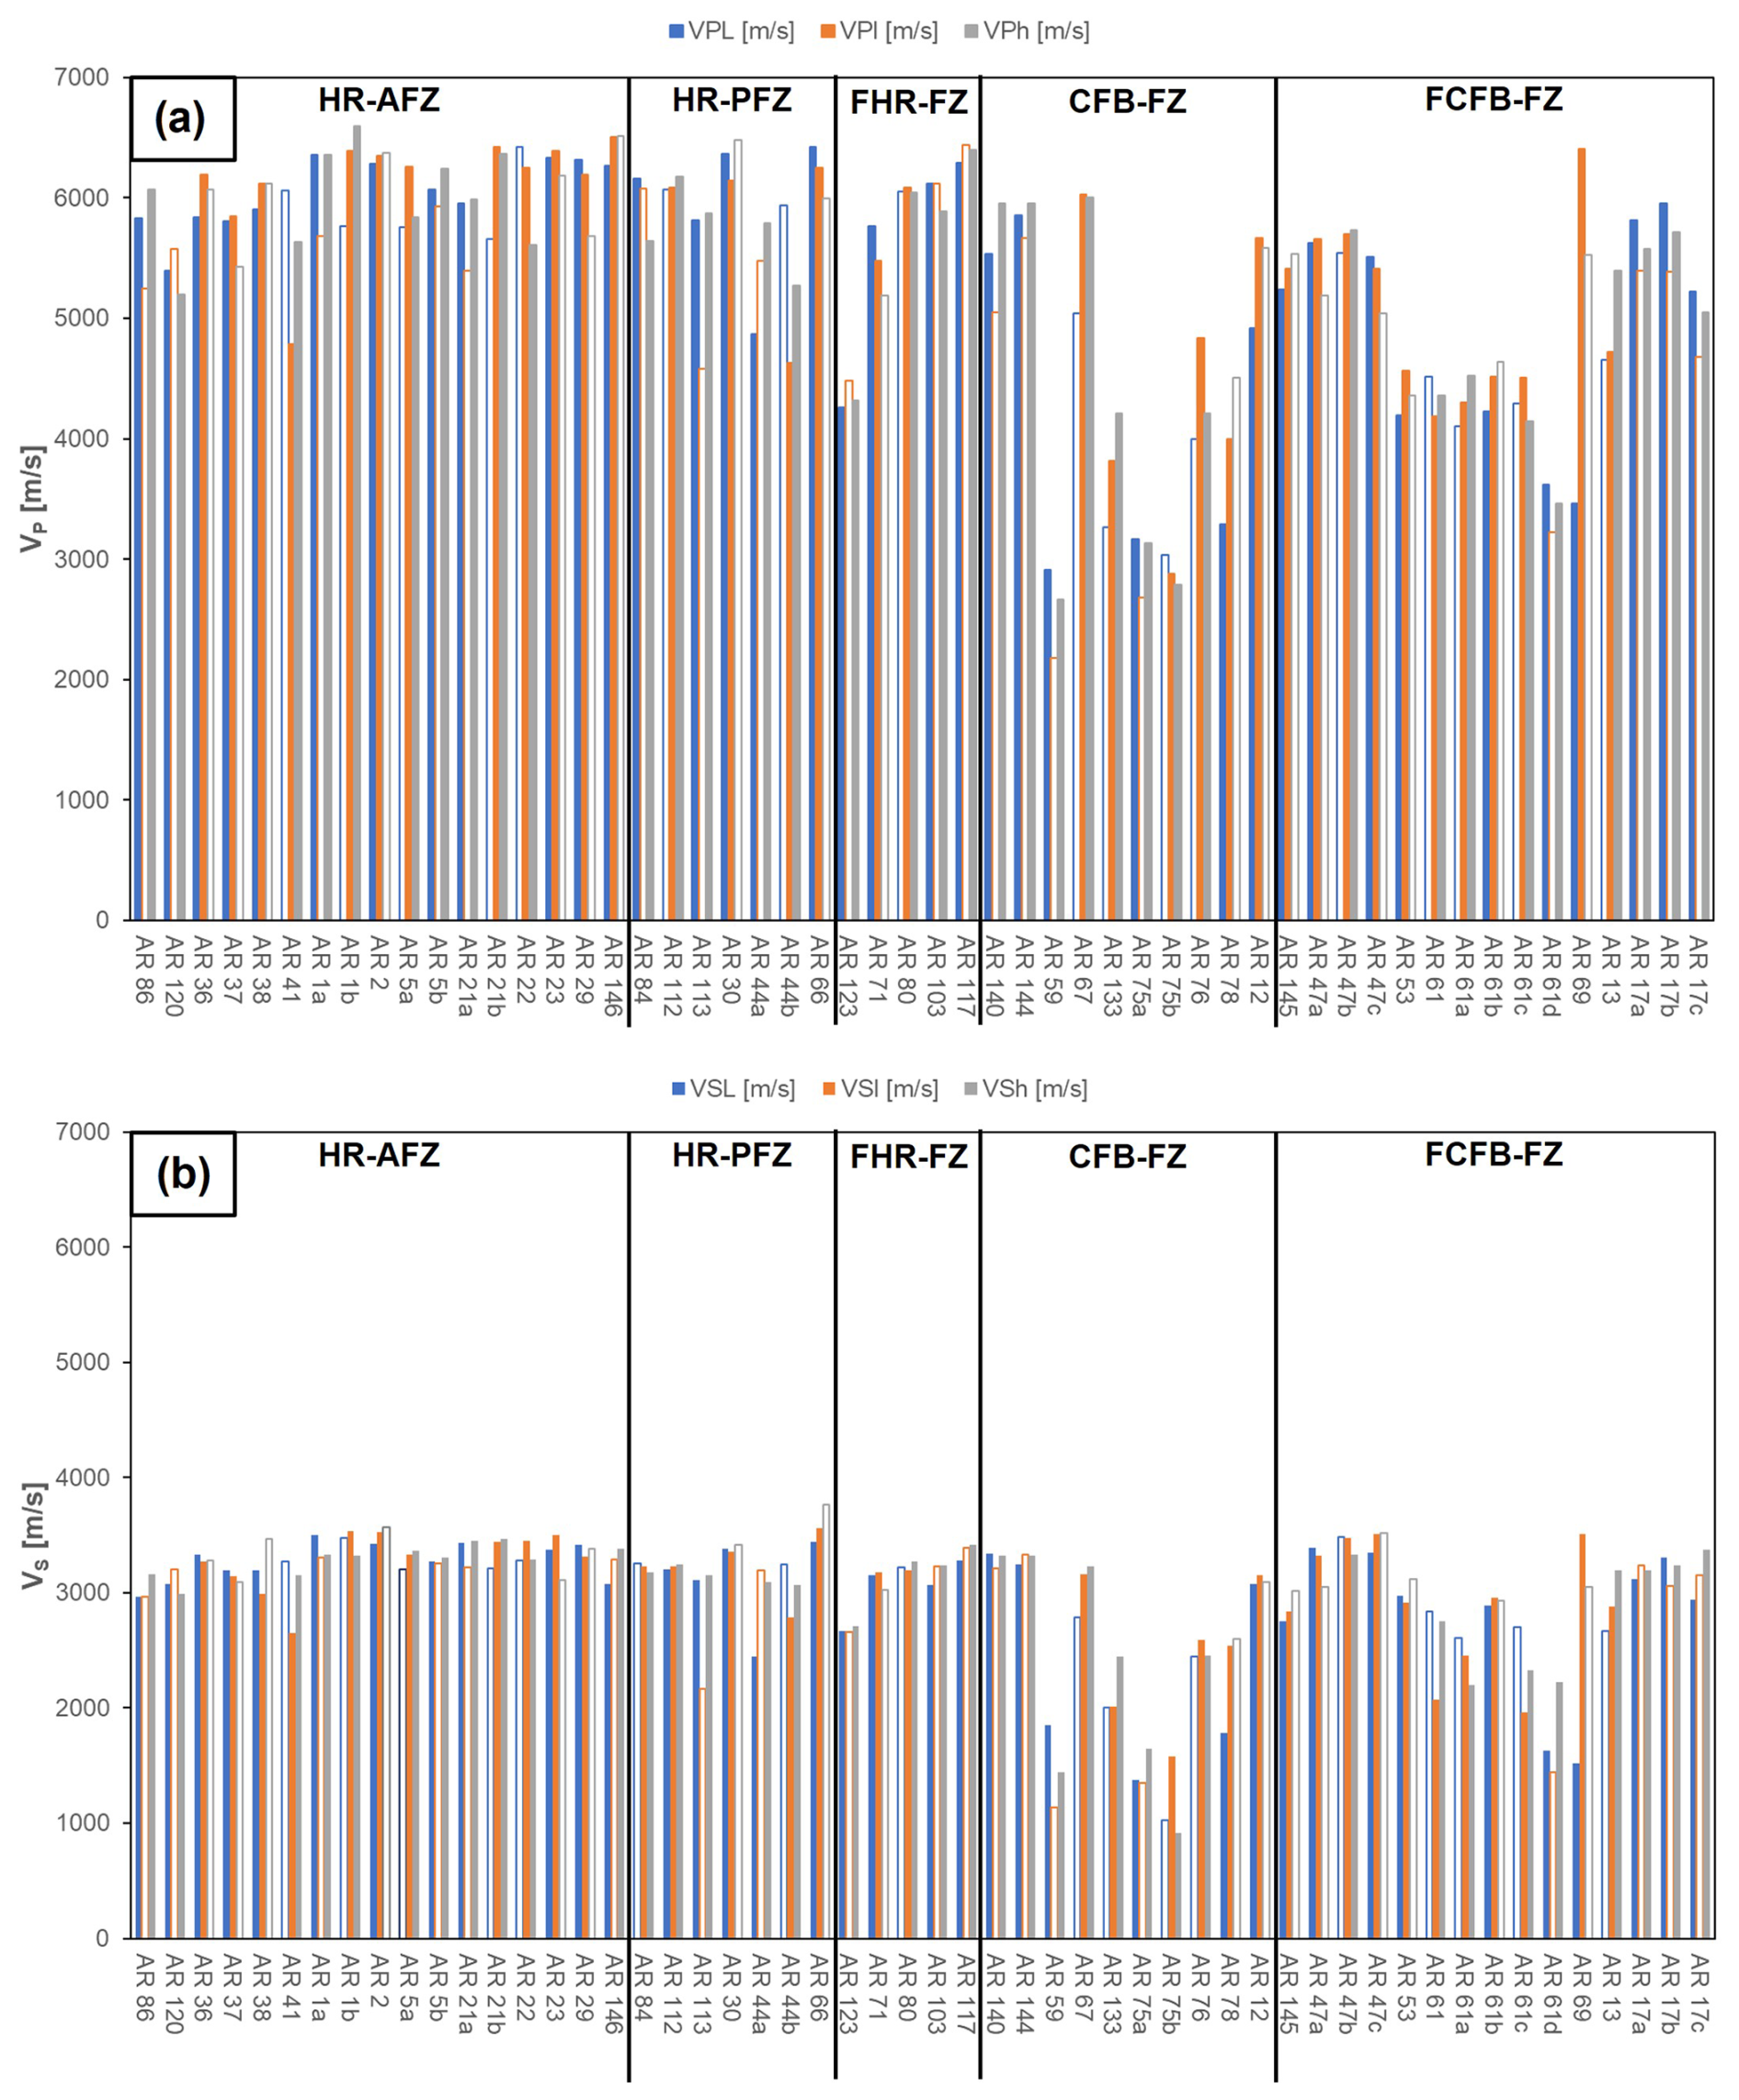
Figure B1Variation of (a) P-wave and (b) S-wave velocities evaluated for each sample in each direction. The subscripts L, l and h refer to the dimensions of the block sample: specifically, L represents the maximum dimension, and h represents the minimum one. Empty bars represent the values obtained along the dimension perpendicular to the stratification or fault direction.
The copyright of the data pertains to the Hellenic Petroleum West Patraikos Exploration and Production of hydrocarbons single member SA (Greece), who commissioned the laboratory work and fieldwork and allowed the publication. Data can be made available upon request.
Conceptualisation: SCV, FV, DS, AP and FA. Data curation: SCV, DS, AP and FA. Formal analysis: FV, IB, JF and AVP. Funding acquisition: SCV, DS, AP and FA. Investigation: SCV, FV, IB, JF, AVP and FA. Methodology: SCV, FV, JF and FA. Supervision: SCV, FV, DS, AP and FA. Validation: FV, IB, JF and AVP. Writing (original draft preparation): SCV, FV, IB and FA. Writing (review and editing): SCV, FV and FA.
The contact author has declared that none of the authors has any competing interests.
Publisher's note: Copernicus Publications remains neutral with regard to jurisdictional claims made in the text, published maps, institutional affiliations, or any other geographical representation in this paper. While Copernicus Publications makes every effort to include appropriate place names, the final responsibility lies with the authors.
Scientific discussion with Claudio Turrini and Elisa Panza is acknowledged. We thank Salvatore Grimaldi and Canio Manniello for the help provided during fieldwork activities. Financial support from Hellenic Petroleum is acknowledged. Fieldwork activities and laboratory analyses were also supported by the Reservoir Characterization Project (http://www.rechproject.com, last access: 2 July 2025).
This research has been supported by the Hellenic Petroleum West Patraikos Exploration and Production (grant no. 2020026).
This paper was edited by Florian Fusseis and reviewed by Nicolas Beaudoin and two anonymous referees.
Agosta, F. and Aydin, A.: Architecture and deformation mechanism of a basin-bounding normal fault in Mesozoic platform carbonates, central Italy, J. Str. Geo., 28, 1445–1467, 2006.
Agosta, F., Prasad, M., and Aydin, A.: Physical properties of carbonate fault rocks, Fucino basin (central Italy): implications for fault seal in platform carbonates, Geofluids, 7, 19–32, 2007.
Agosta, F., Manniello, C., Cavalcante, F., Belviso, C., and Prosser, G.: Late Cretaceous transtensional faulting of the Apulian Platform, Italy, Mar. Pet. Geo., 127, 104889, https://doi.org/10.1016/j.marpetgeo.2020.104889, 2021.
Anselmetti, F. S. and Eberli, G. P.: Controls on sonic velocity in carbonates, Pur. App. Geo., 141, 287–323, https://doi.org/10.1007/BF00998333, 1993.
Anselmetti, F. S. and Eberli, G. P.: Sonic Velocity in Carbonate Sediments and Rocks, in: Carbonate Seismology, Society of Exploration Geophysicists, 53–74, https://doi.org/10.1190/1.9781560802099, 1997.
Anselmetti, F. S. and Eberli, G. P.: Sonic velocity in carbonates – a combined product of depositional lithology and diagenetic alteration, in: Subsurface Geology of a Prograding Carbonate Platform Margin Great Bahama Bank, Soc. Sed. Geo., 193–216, https://doi.org/10.2110/pec.01.70.0193, 2001.
ASTM D2845-08: Standard Test Method for Laboratory Determination of Pulse Velocities and Ultrasonic Elastic Constants of Rock, ASTM, International (Ame. Soc. Test. Mat.), West Conshohocken, Pennsylvania, USA, https://store.astm.org/d2845-08.html (last access: 13 March 2025), 2008.
Bailly, C., Adelinet, A., Hamon, Y., and Fortin, J.: Combined controls of sedimentology and diagenesis on seismic properties in lacustrine and palustrine carbonates (Upper Miocene, Samos Island, Greece), Geo. J. Int. 219, 1300–1315, 2019a.
Bailly, C., Fortin, J., Adelinet, M., and Hamon Y.: Upscaling of elastic properties in carbonates: A modeling approach based on a multiscale geophysical data set, J. Geophys. Res.-Sol. Ea., 124, 13021–13038, 2019b.
Bailly, C., Kernif, T., Hamon, Y., Adelinet, M., and Fortin J.: Controlling factors of acoustic properties in continental carbonates: Implications for high-resolution seismic imaging, Mar. Pet. Geo., 137, 105518, https://doi.org/10.1016/j.marpetgeo.2021.105518, 2022.
Baud, P., Exner, U., Lommatzsch, M., Reuschlè, T., and Wong, T.-F.: Mechanical behavior, failure mode, and transport properties in a porous carbonate, J. Geophys. Res.-Sol. Ea., 122, 7363–7387, https://doi.org/10.1002/2017JB014060, 2017.
Benson, P., Schubnel, A., Vinciguerra, S., Trovato, C., Meredith, P., and Young, R. P.: Modeling the permeability evolution of microcracked rocks from elastic wave velocity inversion at elevated isostatic pressure, J. Geophys. Res., 111, B04202, https://doi.org/10.1029/2005JB003710, 2006.
Bourli, N., Pantopoulos, G., Maravelis, A. G., Zoumpoulis, E., Iliopoulos, G., Pomoni-Papaioannou, F., Kostopoulou, S., and Zelilidis, A.: Late Cretaceous to early Eocene geological history of the eastern Ionian Basin, southwestern Greece: a sedimentological approach, Cre. Res., 98, 47–71, 2019a.
Bourli, N., Kokkaliari, M., Iliopoulos, I., Pe-Piper, G., Piper, D. J., Maravelis, A. G., and Zelilidis, A.: Mineralogy of siliceous concretions, cretaceous of ionian zone, western Greece: Implication for diagenesis and porosity, Mar. Pet. Geo., 105, 45–63, 2019b.
Bristow, J. R.: Microcracks and the static and dynamic elastic constants of annealed and heavily cold-worked metals, Brit. J. App. Phys.,, 11, 81, https://doi.org/10.1088/0508-3443/11/2/309, 1960.
Caine, J. S., Evans, J. P., and Forster. C. B.: Fault zone architecture and permeability structure, Geology, 24, 1025–1028, https://doi.org/10.1130/0091-7613(1996)024<1025:FZAAPS>2.3.CO;2, 1996.
Clew, J.: Structural Controls on Basin Evolution. Neogene to Quaternary of the Ionian Zone, Western Greece, Journal of the Geological Society, 146, 447–457, https://doi.org/10.1144/gsjgs.146.3.0447, 1989.
Chicco, J. M., Comina, C., Mandrone, G., Vacha, D., and Vagnon, F.: Field surveys in heterogeneous rock masses aimed at hydraulic conductivity assessment, SN Appl. Sci., 5, 374, https://doi.org/10.1007/s42452-023-05578-3, 2023.
Danelian, T., Bonneau, M., Cadet J. P., Poisson, A., and Vrielynck, B.: Palaeoceanographic implications of new and revised bio-chronostratigraphic constraints from the Profitis Ilias Unit (Rhodes, Greece), Bulletin of the Geological Society of Greece, 34, 619, https://doi.org/10.12681/bgsg.17111, 2018.
Ehrenberg, S. N., Eberli, G. P., Keramati, M., and Moallemi, S. A.: Porosity-permeability relationships in interlayered limestone-dolostone reservoirs, Am. Assoc. Pet. Geol. Bull., 90, 91–114, https://doi.org/10.1306/08100505087, 2006.
Falconer, K.: Fractal Geometry: Mathematical Foundations and Applications, John Wiley and Sons, London, United Kingdom, 400, ISBN 0-470-84861-2 (Cloth), ISBN 0-470-84862-6 (Paper), 2003.
Ferraro, F., Grieco, D. S., Agosta, F., and Prosser, G.: Space-time evolution of cataclasis in carbonate fault zones, J. Struct. Geol., 110, 45–64, 2018.
Ferraro, F., Agosta, F., Prasad, M., Vinciguerra, S., Violay, M., and Giorgioni, M.: Pore space properties in carbonate fault rocks of peninsular Italy, J. Struct. Geol., 130, 10391, https://doi.org/10.1016/j.jsg.2019.103913, 2020.
Giuffrida, A., La Bruna, V., Castelluccio, P., Panza, E., Rustichelli, A., Tondi, E., Giorgioni, M., and Agosta, F.: Fracture simulation parameters of fractured reservoirs: analogy with outcropping carbonates of the Inner Apulian Platform. southern Italy, J. Struct. Geol., 123, 18–41, 2019.
Gueguen, Y. and Dienes, J.: Transport properties of rocks from statistics and percolation, Math. Geol., 21, 1–13, https://doi.org/10.1007/BF00897237, 1989.
Guéguen, Y., Chelidze, T., and Le Ravalec, M.: Microstructures, percolation thresholds, and rock physical properties, Tectonophysics, 279, 23–35, https://doi.org/10.1016/S0040-1951(97)00132-7, 1997.
ISRM: Commission on standardization of laboratory and field tests, suggested methods for determining water content, porosity, density, absorption and related properties and swelling and slake durability index properties, Int. J. Rock Mech. Min. Sci. Geom. Abstr., 16, 141–156, 1979.
Jolivet, L. and Brun, J.-P.: Cenozoic geodynamic evolution of the Aegean, Int. J. Ear. Sci. 99, 109–138, https://doi.org/10.1007/s00531-008-0366-4, 2010.
Jolivet, L., Menant, A., Sternai, P., Rabillard, A., Arbaret, L., Augier, R., Laurent, V., Beaudoin, A., Grasemann, B., Huet, B., Labrousse, L., and Le Pourhiet, L.: The geological signature of a slab tear below the Aegean, Tectonop., 659, 166–182, https://doi.org/10.1016/j.tecto.2015.08.004, 2015.
Jones, S. C.: A rapid accurate unsteady-state Klinkenberg permeater, SPE J., 3535, 383–397, 1972.
Kachanov, M.: Elastic solids with many cracks and related problems, Adv. App. Mec., 30, 445, https://doi.org/10.1016/S0065-2156(08)70176-5, 1993.
Karakitsios, V.: Western Greece and Ionian Sea petroleum systems, Am. Ass. Pet. Geol. Bull., 97, 1567–1595, https://doi.org/10.1306/02221312113, 2013.
Karakitsios, V. and Rigakis, N.: Evolution and petroleum potential of Western Greece, J. Petrol. Geol., 30, 197–218, https://doi.org/10.1111/j.1747-5457.2007.00197.x, 2007.
Kiratzi, A. and Louvari, E.: Focal mechanisms of shallow earthquakes in the Aegean Sea and the surrounding lands determined by waveform modelling: a new database, J. Geodyn., 36, 251–274, https://doi.org/10.1016/S0264-3707(03)00050-4, 2003.
Laubach, S. E., Eichhubl, P., Hilgers, C., and Lander, R. H.: Structural diagenesis, J. Struct. Geol, 32, 1866–1872, 2010.
Li, M., Bernabé, Y., Xiao, W. I., Chen, Z.-Y., and Liu, Z.-Q.: Effective pressure law for permeability of E-bei sandstones, J. Geophys. Res., 114, B07205, https://doi.org/10.1029/2009JB006373, 2009.
Mandelbrot, B. B.: Self-affine fractals and fractal dimension, Phys. Scri., 32, 257–260, 1985.
Mavko, G., Mukerji, T., and Dvorkin, J.: The Rock Physics Handbook, Cambridge University Press, https://doi.org/10.1017/CBO9780511626753, 2009.
Nasseri, M. H. B., Schubnel, A., and Young, R. P.: Coupled evolutions of fracture toughness and elastic wave velocities at high crack density in thermally treated Westerly granite, International Journal of Rock Mechanics and Mining Sciences, 44, 601–616, https://doi.org/10.1016/J.IJRMMS.2006.09.008, 2007.
Nelson, R. A.: Geologic Analysis of Naturally Fractured Reservoirs, second edn., Gulf Prof. Pub., Woburn, ISBN 978-0-88415-317-7, 2001.
Papanikolaou, D. I.: The Geology of Greece, Springer, Cham, https://doi.org/10.1007/978-3-030-60731-9, 2021.
Piscopo, V., Baiocchi, A., Lotti, F., Ayan, E. A., Biler, A. R., Ceyhan, A. H., Cüylan, M., Dişli, E., Kahraman, S., and Taşkın, M.: Estimation of rock mass permeability using variation in hydraulic conductivity with depth: experiences in hard rocks of western Turkey, Bul. Eng. Geo. Env., 77, 1663–1671, https://doi.org/10.1007/s10064-017-1058-8, 2018.
Rawling, G. C., Goodwin, L. B., and Wilson, J. L.: Internal architecture, permeability structure, and hydrologic significance of contrasting fault-zone types, Geol., 29, 43, https://doi.org/10.1130/0091-7613(2001)029<0043:IAPSAH>2.0.CO;2, 2001.
Regnet, J. B., David, C., Robion, P., and Menéndez, B.: Microstructures and physical properties in carbonate rocks: A comprehensive review, Mar. Petr. Geol., 103, 366–376, https://doi.org/10.1016/j.marpetgeo.2019.02.022, 2019.
Robertson, A. and Shallo, M.: Mesozoic–Tertiary tectonic evolution of Albania in its regional Eastern Mediterranean context, Tectonophysics, 316, 197–254, https://doi.org/10.1016/S0040-1951(99)00262-0, 2000.
Robertson, A. H. F. and Dixon, J. E.: Introduction: aspects of the geological evolution of the Eastern Mediterranean, Geological Society, London, Special Publications, 17, 1–74, https://doi.org/10.1144/GSL.SP.1984.017.01.02, 1984.
Roure, F., Fili, I., Nazaj, S., Cadet, J.-P., Mushka, K., and Bonneau, M.: Kinematic Evolution and Petroleum Systems – An Appraisal of the Outer Albanides, in: Thrust Tectonics and Hydrocarbon Systems, Ame. Ass. Petr. Geo., 82, 485–504, https://doi.org/10.1306/M82813C25, 2004.
Simmons, G. and Cooper, H. W.: Thermal cycling cracks in three igneous rocks, Int. J. Rock Mech. Min., 15, 145–148, https://doi.org/10.1016/0148-9062(78)91220-2, 1987.
Skourtsis-Coroneou, V., Solakius, N., and Constantinidis, I.: Cretaceous stratigraphy of the Ionian Zone, Hellenides, western Greece, Cret. Res., 16, 539–558, https://doi.org/10.1006/CRES.1995.1035, 1995.
Smeraglia, L., Bernasconi, S., Manniello, C., Spanos, D., Pagoulatos, A., Aldega, L., Kylander-Clark, A., Jaggi, M., and Agosta, F.: Regional scale, fault-related fluid circulation in the Ionian Zone of the External Hellenides fold-and-thrust belt, western Greece: clues for fluid flow in fractured carbonate reservoirs, Tectonics, 42, e2023TC007867, https://doi.org/10.1029/2023TC007867, 2023.
Sotiropoulos, S., Kamberis, E., Triantaphyllou, M. V., and Doutsos, T.: Thrust sequences in the central part of the External Hellenides, Geol. Mag., 140, 661–668, https://doi.org/10.1017/S0016756803008367, 2003.
Stampfli, G. M.: Plate tectonic of the Apulia-Adria microcontinents, in: CROP PROJECT Deep Seismic Exploration of the Mediterranean and Italy, edited by: Finetti, I. R., Elsevier, 747–766, 2005.
Tanikawa, W. and Shimamoto, T.: Klinkenberg effect for gas permeability and its comparison to water permeability for porous sedimentary rocks, Hydrol. Earth Syst. Sci. Discuss., 3, 1315–1338, https://doi.org/10.5194/hessd-3-1315-2006, 2006.
Tavani, S., Corradetti, A., De Matteis, M., Iannace, A., Mazzoli, S., Castelluccio, A., Spanos, D., and Parente, M.: Early-orogenic deformation in the Ionian zone of the Hellenides: Effects of slab retreat and arching on syn-orogenic stress evolution, J. Str. Geo., 124, 168–181, 2019.
Thompson, A. H.: Fractals in rock physics, Ann. Rev. Ear. Pla. Sci., 19, 237–262, 1991.
Underhill, J. R.: Late Cenozoic deformation of the Hellenide foreland, western Greece, Geol. Soc. Am. Bul., 101, 613–634, https://doi.org/10.1130/0016-7606(1989)101<0613:LCDOTH>2.3.CO;2, 1989.
Unz, M.: Interpretation methods for geophysical exploration of reservoirs, Geophysics, 24, 12–171, 1959.
Vagnon, F., Colombero, C., Colombo, F., Comina, C., Ferrero, A. M., Mandrone, G., and Vinciguerra, S. C.: Effects of thermal treatment on physical and mechanical properties of Valdieri Marble – NW Italy, Int. J. Rock. Mech. Min. Sci., 116, 75–86, https://doi.org/10.1016/j.ijrmms.2019.03.006, 2019.
Vincent, B., Rigollet, C., Cochard, J., Khalil, S., Mejia-Duran, A.F., Grégoire, D., Beaudoin, N. E., Brigaud, B., Blaise, T., Reuschle, T., Pellenard, P., and Landrein, P.: Multi-stage micrite diagenesis in the late Jurassic of the Eastern Paris Basin: petrophysical and mechanical properties for engineering purposes, Geological Society, London, Special Publications, 548, https://doi.org/10.1144/SP548-2023-139, 2025.
Volatili, T., Agosta, F., Cardozo, N., Zambrano, M., Lecomte, I., and Tondi, E.: Outcrop-scale fracture analysis and seismic modelling of a basin-bounding normal fault in platform carbonates, central Italy, J. Struct. Geol., 155, 104515, https://doi.org/10.1016/j.jsg.2022.104515, 2022.
Walsh, J. B.: The effect of cracks on the compressibility of rock, J. Geophys. Res., 70, 381–389, https://doi.org/10.1029/JZ070i002p00381, 1965.
Wang, H., Li, M., Wu, Y., and Gao, J.: Geophysical Exploration Methods for Lithological Reservoirs, in: Practical Geophysical Technology and Application for Lithological Reservoirs. SpringerBriefs in Petroleum Geoscience & Engineering, Springer, Singapore, https://doi.org/10.1007/978-981-16-4197-8_2, 2021.
Woodcock, N. H and Mort, K.: Classification of fault breccias and related fault rocks, Geol. Mag. 145, 435–440, 2008.
Wu, J., Fan, T., Rivas, E.G., Gao, Z., Yao, S., Li, W., Zhang, C., Sun, Q., Gu, Y., and Xiang, M.: Impact of pore structure and fractal characteristics on the sealing capacity of Ordovician carbonate cap rock in the Tarim Basin, China, Mar. Pet. Geol., 102, 557–559, 2019.
Wyllie, M. R. J., Gregory, A. R., and Gardner, L. W.: Elastic wave velocity in heterogeneous and porous media, Geophysics, 21, 41–70, https://doi.org/10.1190/1.1438217, 1956.
Wyllie, M. R. J., Gregory, A. R., and Gardner, G. H. F.: An experimental investigation of factors affecting elastic wave velocities in porous media, Geophysics, 23, 459–493, https://doi.org/10.1190/1.1438493, 1958.