the Creative Commons Attribution 4.0 License.
the Creative Commons Attribution 4.0 License.
 | 05 Aug 2025
High-resolution seismic reflection surveying to delineate shallow subsurface geological structures in the karst area of Shenzhen, China
Zhihui Wang
Christopher Juhlin
Qingtian Lü
Xiaoming Ruan
Zhendong Liu
Chenghua Yu
Mingchun Chen
Near-surface seismic reflection surveys can produce high-resolution geological structural images for engineering and hydrological investigations. To help delineate shallow subsurface complex geological structures in a karst area and to better understand limestone cave formation, a high-resolution 2D seismic reflection profile was acquired and processed in the urban area of Shenzhen, China. The stacked images detail subsurface structures down to depths of 80–90 m, including a concave shaped reflection that curves upwards, two thrusts and one normal fault, as well as a hard rock basement reflection at the southern end of the profile which could not be mapped by borehole investigations due to the limited drilling depth. Our interpretations correlate well with borehole data and were supported by synthetic seismic modelling. Limestone caves are mainly found along faults and near rivers in this area. The results provide new insight on the formation mechanism and distribution of the karst caves. Movement along faults and erosion generated fractures and fissures in the limestone that provide channels for rainwater and groundwater to circulate. These waters, rich in carbonic acid, dissolve minerals in the limestone, resulting in the formation of underground cavities.
- Article
(16168 KB) - Full-text XML
- BibTeX
- EndNote


Karst landscapes, characterized by their unique geological formations shaped by dissolution of soluble rocks, such as limestone and dolomite, are renowned for their beauty and ecological significance. However, beneath the surface hidden dangers are present. Karst hazards pose challenges for various industries, particularly those dependent on stable ground conditions, such as construction, agriculture, and infrastructure development (Chen et al., 2019; Medici et al., 2024). Losses due to the fast-acting nature of karst encounters can be direct (e.g. human casualties and damage to property), indirect (e.g. interruption to businesses, transport infrastructure and communication networks), or intangible, especially if they occur in areas of high population density (Galve et al., 2012; Bobrowsky, 2013; Intrieri et al., 2015; Sevil et al., 2017; Pazzi et al., 2018).
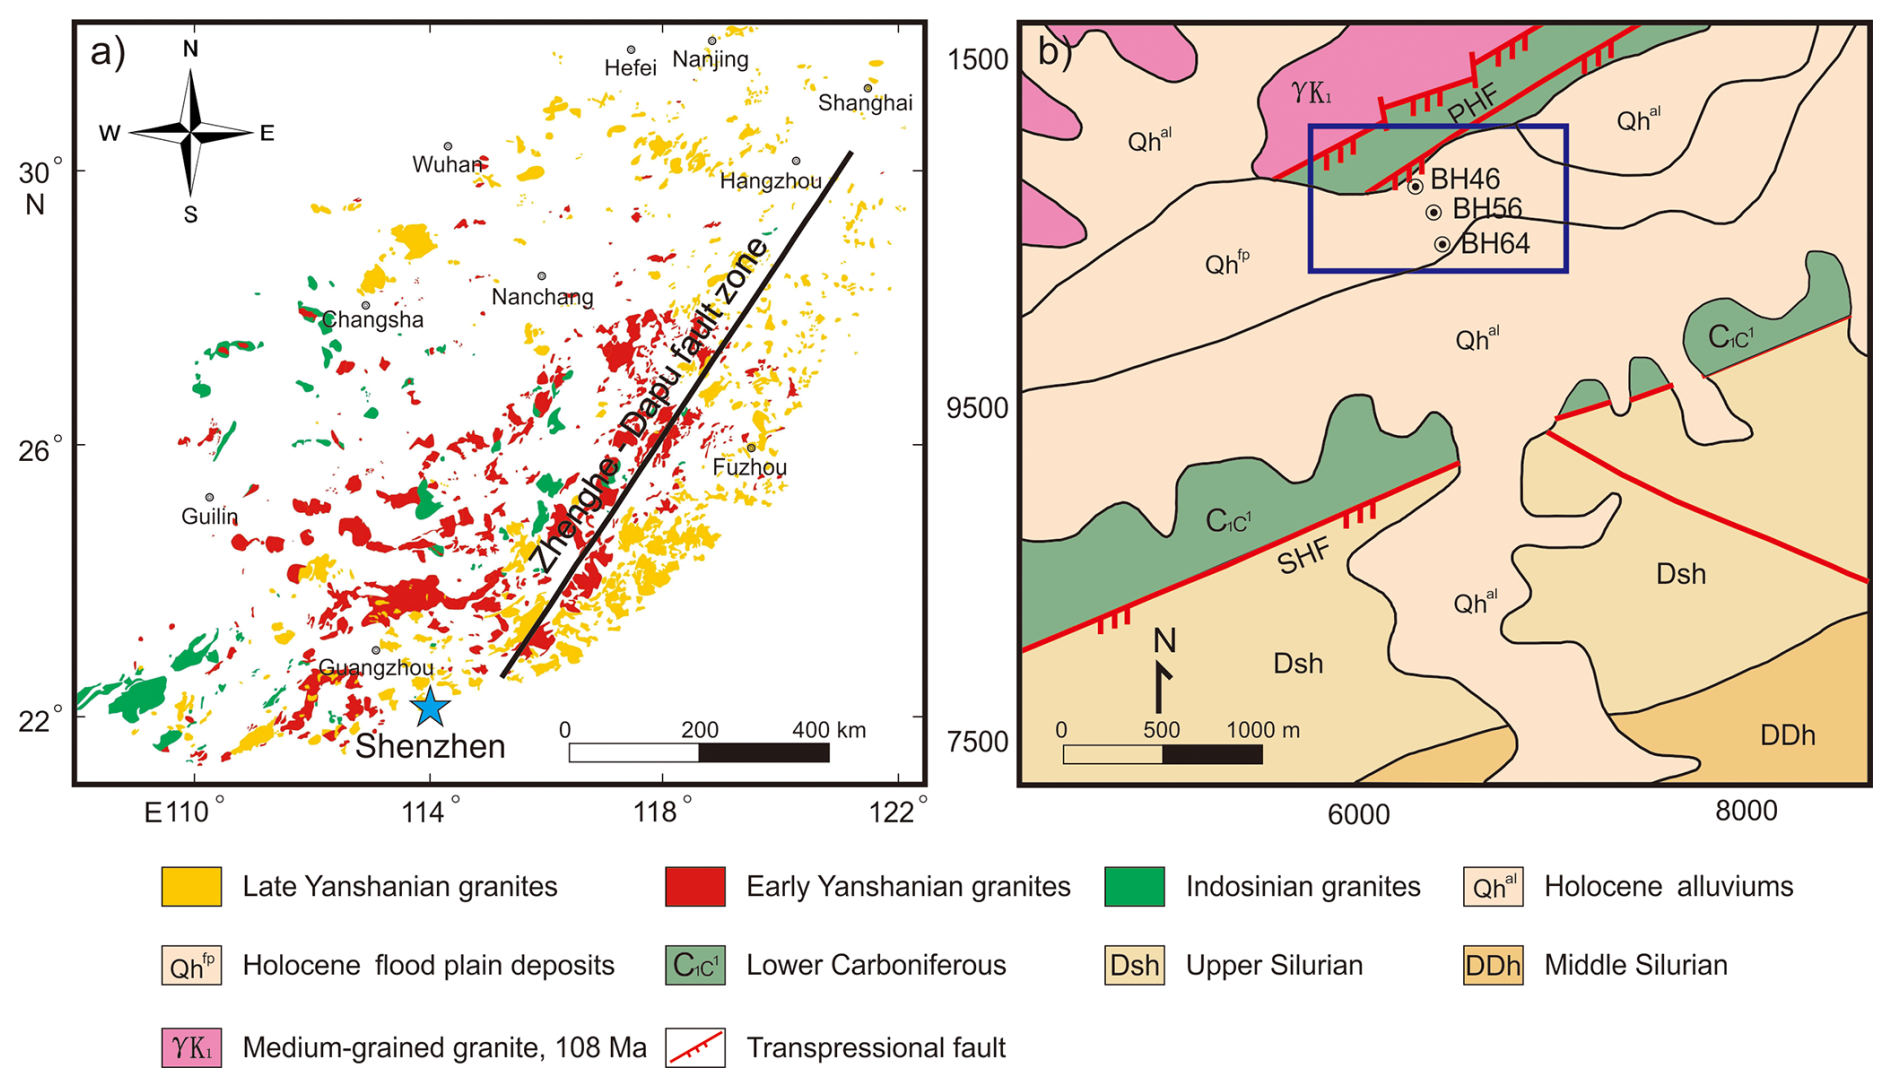
Figure 1Regional (a) and local (b) geological map of the Pingshan district, Shenzhen (after Mao et al., 2014 and Shenzhen Geology Writing Group, 2009). Blue rectangle (Fig. 3a) shows study area location.
In southeast China, buried karst, with high fissure water content, high permeability, and variable shapes, is widely distributed (Cui et al., 2015). Shenzhen, a world-scale metropolis, located in the southern part of the Guangdong province (Fig. 1a), has significant areas of Carboniferous rock distributed in the Longgang, Pingshan, and Dapeng districts where karst features are a hazard. During metro, railway, and building construction, karst and karst caves at depths from 2 to 50 m are found in dolomite, dolomitic limestone, dolomitic marble, marble, crystalline limestone, and breccia limestone (Li et al., 2011; He et al., 2020). Its presence challenges the construction of tunnels and use of shield tunnelling machines. For example, the disturbance produced by a shield tunnelling machine may induce the ceiling of a karst cave to collapse, with water present in the cave damaging the machine and constructed tunnel. Furthermore, diaphragm wall collapse, water or mud ingression, ground collapse, and long-term instability are often encountered in karst regions (Cui et al., 2015). Currently, many direct and indirect techniques to detect buried karst and karst caves have been proposed (Lolcama et al., 2002; Hoover, 2003; Kaufmann and Romanov, 2009; Kaufmann, 2014; Samyn et al., 2014; Putiška et al., 2014; Kaufmann and Romanov, 2016; Sevil et al., 2017; Pazzi et al., 2018; Hussain et al., 2020; Wang et al., 2020; Muzirafuti et al., 2020; Stan-Kłeczek et al., 2022; Yordkayhun et al., 2022; Liu et al., 2023). Among the direct methods, drilling and electric cone penetration tests are the most common and useful. On the other hand, indirect techniques can be employed to delineate subsurface karst size and distribution and extrapolate borehole data to a wider area. Geophysical techniques based on a physical contrast between a cave and the surrounding rocks provide an economical and non-invasive alternative, or complement, for mapping geological structures, and are often used in attempts to detect the presence of karst caves and voids below the surface. Methods include seismic reflection/refraction, multichannel analysis of surface waves (MASW), the H V spectral ratio method, electrical resistivity tomography (ERT), induced polarization (IP), self-potential (SP), ground penetrating radar (GPR), and micro-gravity. In recent years, with a focus on improving resolution, efficiency, and cost-effectiveness (Juhlin et al., 2000; Martinez and Mendoza, 2011; Brodic et al., 2015; Yilmaz, 2021; Sun et al., 2022; Pertuz and Malehmir, 2023), the high-resolution seismic reflection method for shallow exploration and imaging of local subsurface heterogeneities has emerged as a powerful technique to identify and map near surface geological structures with good precision and depth penetration.
In this study, we delineate the near surface geological structures in a karst area with high-density and -resolution seismic reflection data to carry out the research specific objectives as follows: (i) testing of the reflection seismic method over karst terrain; (ii) comparison of reflection seismic results with geotechnical drilling; (iii) integration of physical properties of samples with reflection seismic modelling; and (iv) delineating shallow subsurface complex geological structures in a karst area and understanding limestone cave formation better. Our seismic results are correlated with borehole data and synthetic modelling simulated by the 2D elastic wave equation. The seismic reflection images provide new insight in understanding the formation mechanism and distribution of karst and karst caves.
Geologically, Shenzhen is located in the South China Block southwest of the Zhenghe-Dapu fault (Fig. 1a). It consists of a multi-stage, complex formation of folds, faults, and intensive metamorphism which took place in the pre-Caledonian, Caledonian, and Hercynian to Indosinian orogenies (Cui et al., 2015), with the area having undergone a complex tectonic evolution from assembly to break-up to re-assembly (Shu et al., 2014). The early activity along the Zhenghe-Dapu fault zone was formed through ductile shear, and the middle and late stages are composed of thrusting with a mid-development detachment. The conspicuous Lianhuashan fault zone in Shenzhen is interpreted as the southern extension of the lithosphere-scale Zhenghe-Dapu fault zone, considered as the boundary between the late Mesozoic Coastal terrane and the early Paleozoic Wuyi-Yunkai orogen (Li et al., 2020). The sedimentary units affected by the Lianhuashan fault zone include Paleozoic and Early to Middle Jurassic rocks. Due to significant magmatic activity, granite and igneous rocks that formed during the Yanshanian period are the dominant rock type. The Yanshanian orogeny involved tectonic movement that mainly included block orogeny and the development of deep faults and wide folds, along with significant intrusions of granitic magma, massive acidic volcanic eruptions, and magmatism-related mineralization (Li et al., 2020).
On a local scale (Fig. 1b), the Paleozoic sequence comprises Silurian-Carboniferous sandstone, shale, slate, limestone, siltstone, gritstone, and coal seams (Shenzhen Geology Writing Group, 2009) that are distributed along the NE-striking and NW-dipping Paotaishan-Hengtougang transpressional fault (PHF) and the Shijingling-Huangzhukeng transpressional fault (SHF). The Lower Carboniferous comprises two units, the Shidengzi formation (C1s1) and the Ceshui formation (C1c1). C1s1 is buried under the Ceshui formation and not exposed in the area. There are shallow marine facies carbonate rocks, consisting of grey and dark grey crystalline limestone which mostly have been metamorphosed into off-white marble and dolomitic marble, with a thickness of more than 340 m. C1c1 contains coastal facies carbonaceous clastic rocks, composed of argillaceous shale, siltstone, fine sandstone, etc., with a thickness of more than 1200 m. Holocene alluviums and flood plain deposits affected by the PHF and SHF consist of gravel, silty sand, sandy clay, silty clay, and other unconsolidated deposits. Medium-grained granites are present northwest of the study area with U–Pb zircon crystallization ages of about 108 Ma (Shenzhen Geology Writing Group, 2009). The seismic survey line is located on Holocene flood plain deposits, as shown by the blue rectangular area in Fig. 1b.
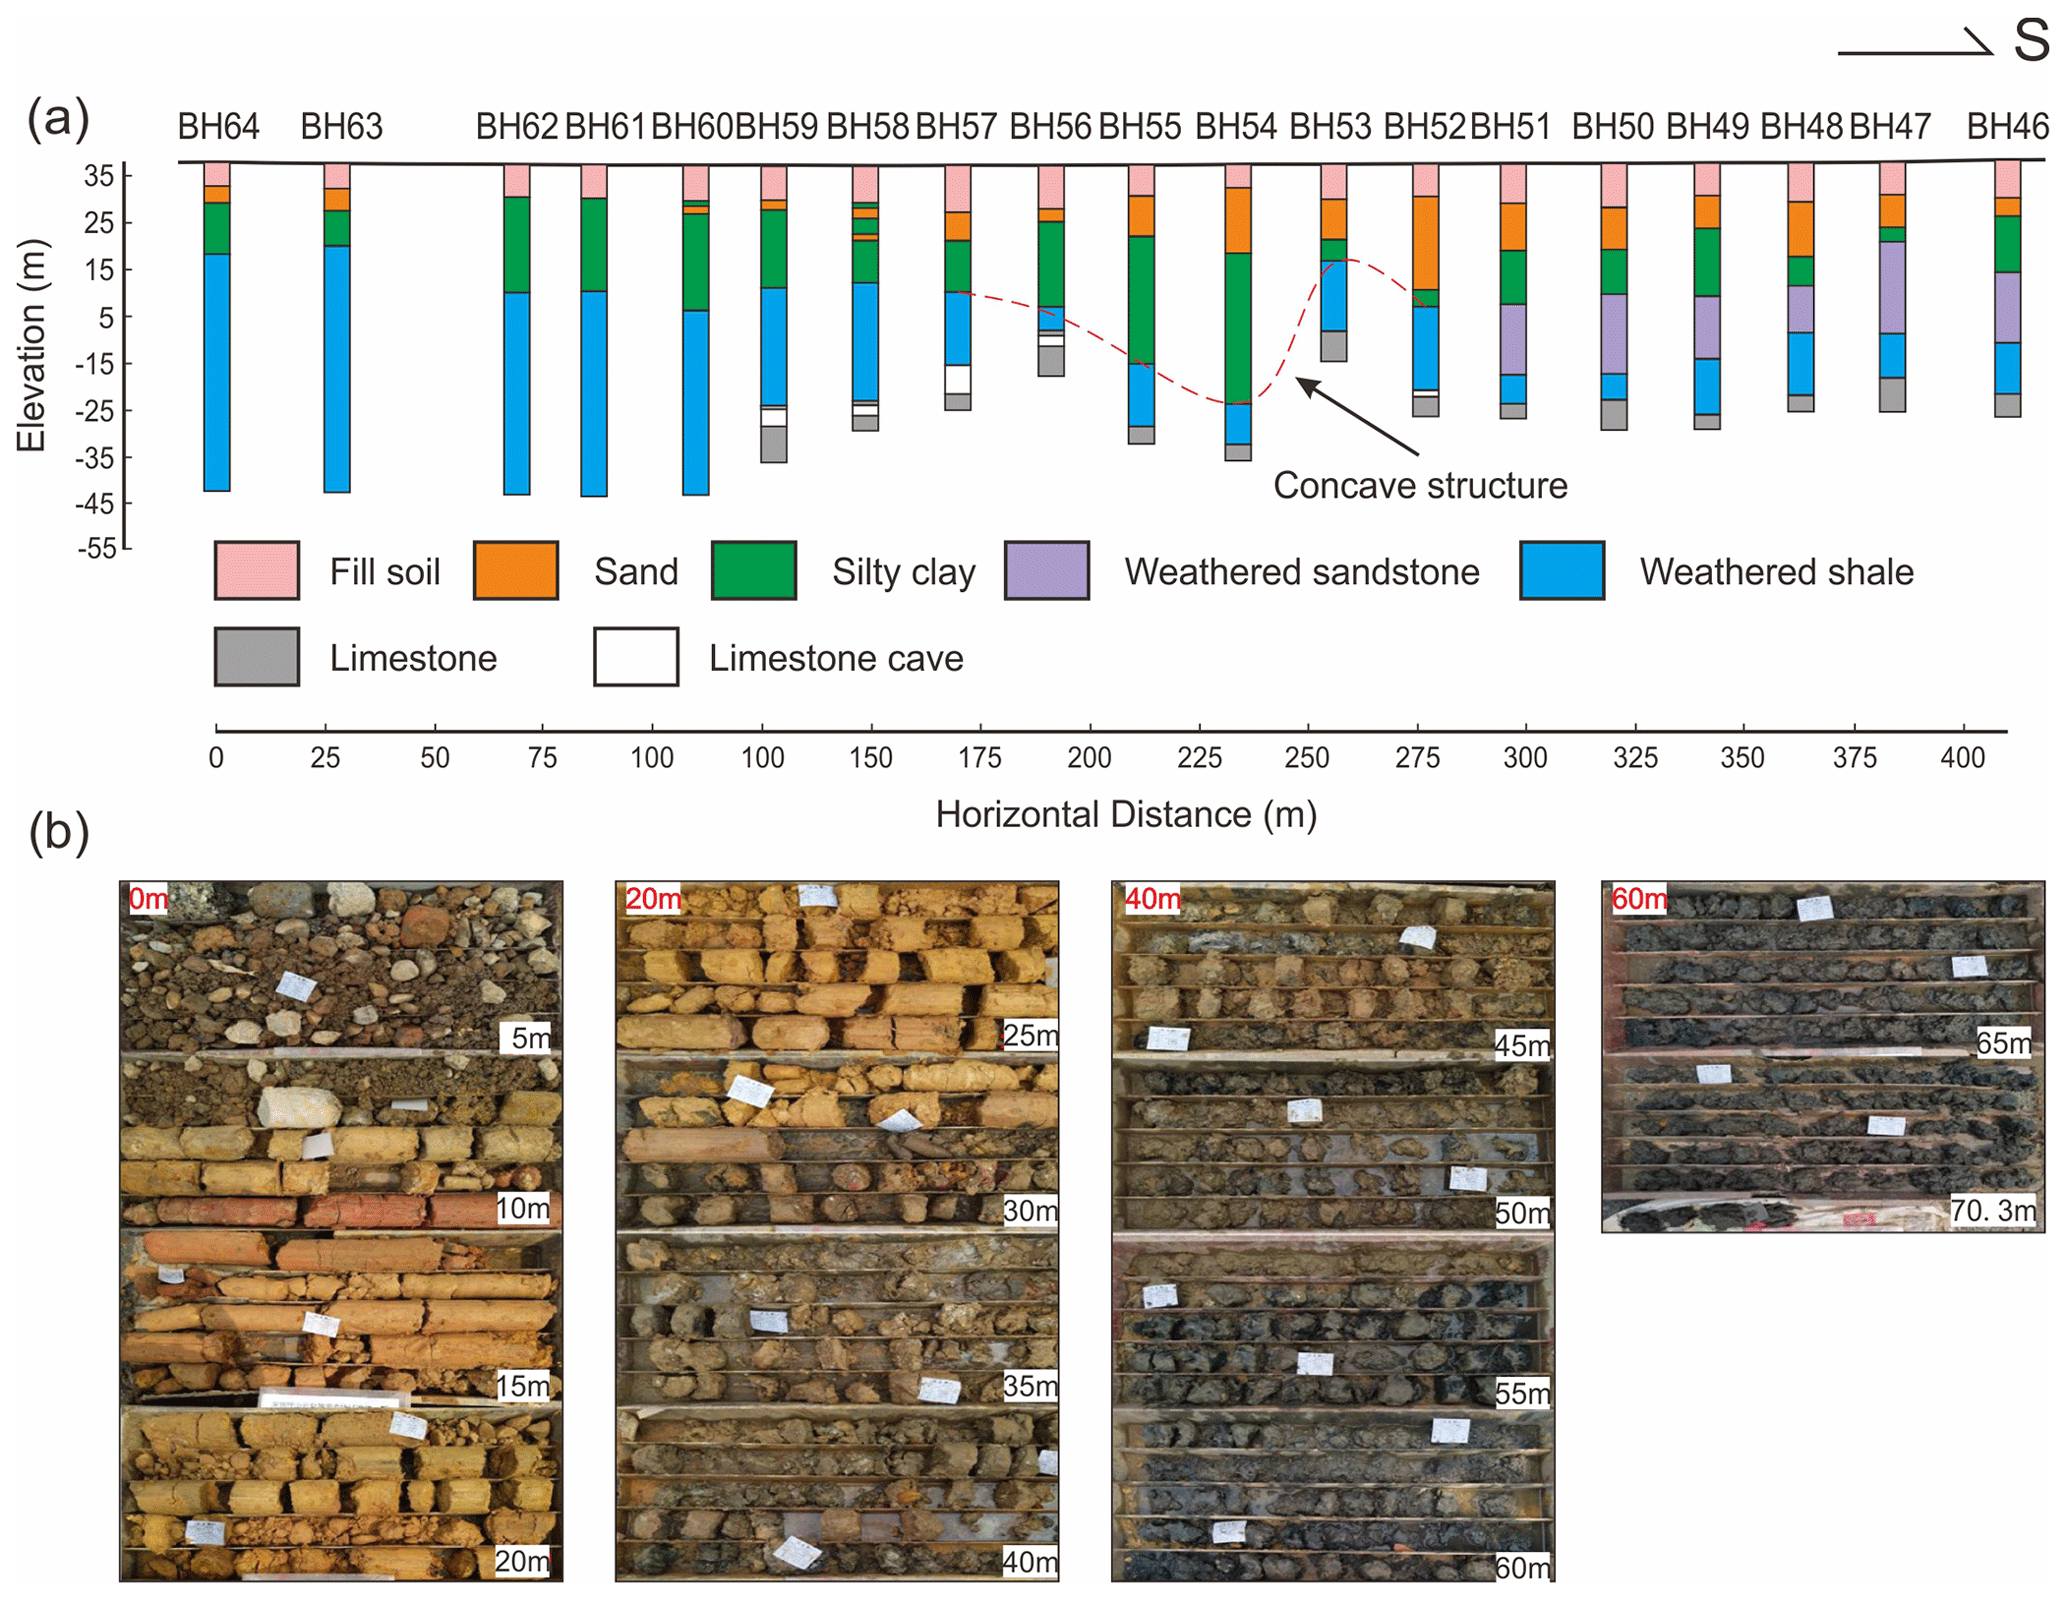
Figure 2Borehole lithology and representative core photos. (a) Borehole section consists of 19 boreholes down to a maximum depth of 70 m, located about 20 m away from the seismic survey line. (b) Core box images from BH62 borehole, 0–6.9 m, fill soil; 6.9–27.3 m, silty clay; 27.3–70.3 m, weathered shale, some weathered into clay and some are still hard rocks.
The geological section is based upon 19 engineering geology boreholes that provide more detailed information on lithology down to 70 m (Fig. 2). There are six main geological units from the top to the bottom of the section, including fill soil, sand, silty clay, weathered sandstone, and shale, and limestone. Limestone caves were found in boreholes BH52 and in BH56 to BH59 in the vicinity of the interface between weathered shale and limestone. The fill soil has a relatively constant thickness of ca. 10 m in all boreholes. The thickness of the sand layer increases from north to south, however, weathered shale shows the opposite trend. Weathered sandstone is only present from BH46 to BH51. Limestone is present from BH46 to BH59 and absent from BH60 to BH64. Thickness variations of the different sedimentary deposits in the horizontal direction suggest that multi-stage tectonic events occurred in this area. The top of the weathered shale has a concave upward shape between BH53 to BH57. Based on borehole sampling, the groundwater table is present at the top of the sand layer. Due to the different compositions of the inner shale, differential weathering is suggested to have occurred at the southern end as indicated in BH60 and shown in Fig. 2b; it is a potential source for seismic reflections.
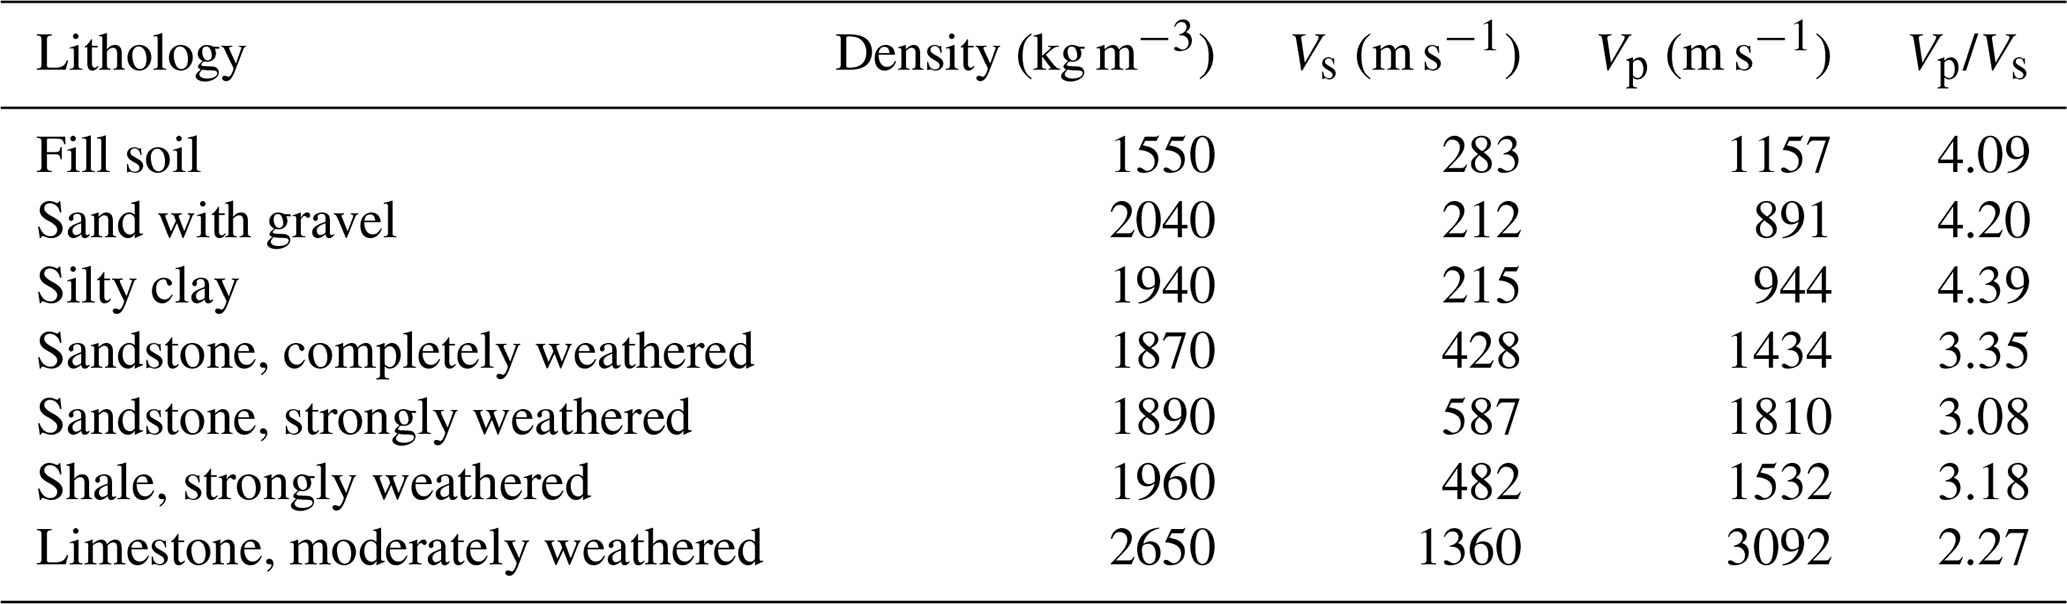
Compressional and shear velocity data were acquired by velocity logging and density data was obtained by the volumetric cylinder method in the lab using samples from the vicinity of study area. These measurements provide information on the physical properties of the subsurface soils and rocks (Table 1) and can help identify where reflection impedance changes may be located. Fill soil with a density of 1550 kg m−3 has the lowest density and limestone with 2650 kg m−3 has the highest value; the density of sand with gravel is somewhat higher than silty clay and other weathered rocks. Compressional and shear velocities have similar variational trends, however, compressional velocity is 3–4 times faster than shear velocity. Limestone compressional velocity is up to 3125 m s−1; sand with gravel and silty clay have the lowest compressional velocity. Unconsolidated soils including fill soil, sand with gravel, and silty clay have the highest ratio of compressional to shear velocity; the ratio of compressional and shear velocity of weathered rocks is higher than limestone. A four-layer seismic reflection model is suggested in this area based on the velocity and density data. The first layer consists of fill soil, the second is made up of gravel and silty clay, the third is completely and strongly weathered rocks (including sandstone and shale), and the fourth is limestone.
Table 1Compressional velocity (Vp), shear velocity (Vs), and density of soil and rock collected from the adjacent area. Vp and Vs are from logging velocity and density from geotechnical testing of borehole samples.
High-resolution seismic data were acquired in November 2022 in the Pingshan district of Shenzhen, southeast China (Fig. 1). The survey line is located along Longping Road and lies between light rail transit line 1 and the Ciao river (Fig. 3a, c). The surface topography from south to north varies smoothly with an elevation difference of about 2 m. The geological section from the 19 boreholes allows a comparison with the seismic results, however, they were drilled at an elevation ca. 5 m higher than the seismic survey line (Fig. 3c) and 20 m offset from it. A 5 kg sledgehammer with a 4 cm thick metal plate was used as the seismic source along with 5 Hz SmartSolo 3C nodal units for recording. The seismic data were acquired using five segments. Every segment consisted of 148 units with a fixed geometry of 1 m receiver spacing and 2 m source spacing with 74 units overlapping (Fig. 3b). The total length of the survey line is 417 m. A sampling rate of 1 ms was used and 1000 ms of data were retrieved from the nodes for each source point. Table 2 shows the seismic acquisition parameters. Three raw shot gathers recorded at different locations along the survey line show some of the characteristics of the seismic wave field (Fig. 4). Direct waves, surface waves, reflections, and air waves are present in all gathers. Reflections dominate in the time window of 50–150 ms; shallower reflections are masked by surface waves, air waves, and direct waves at the near offsets.
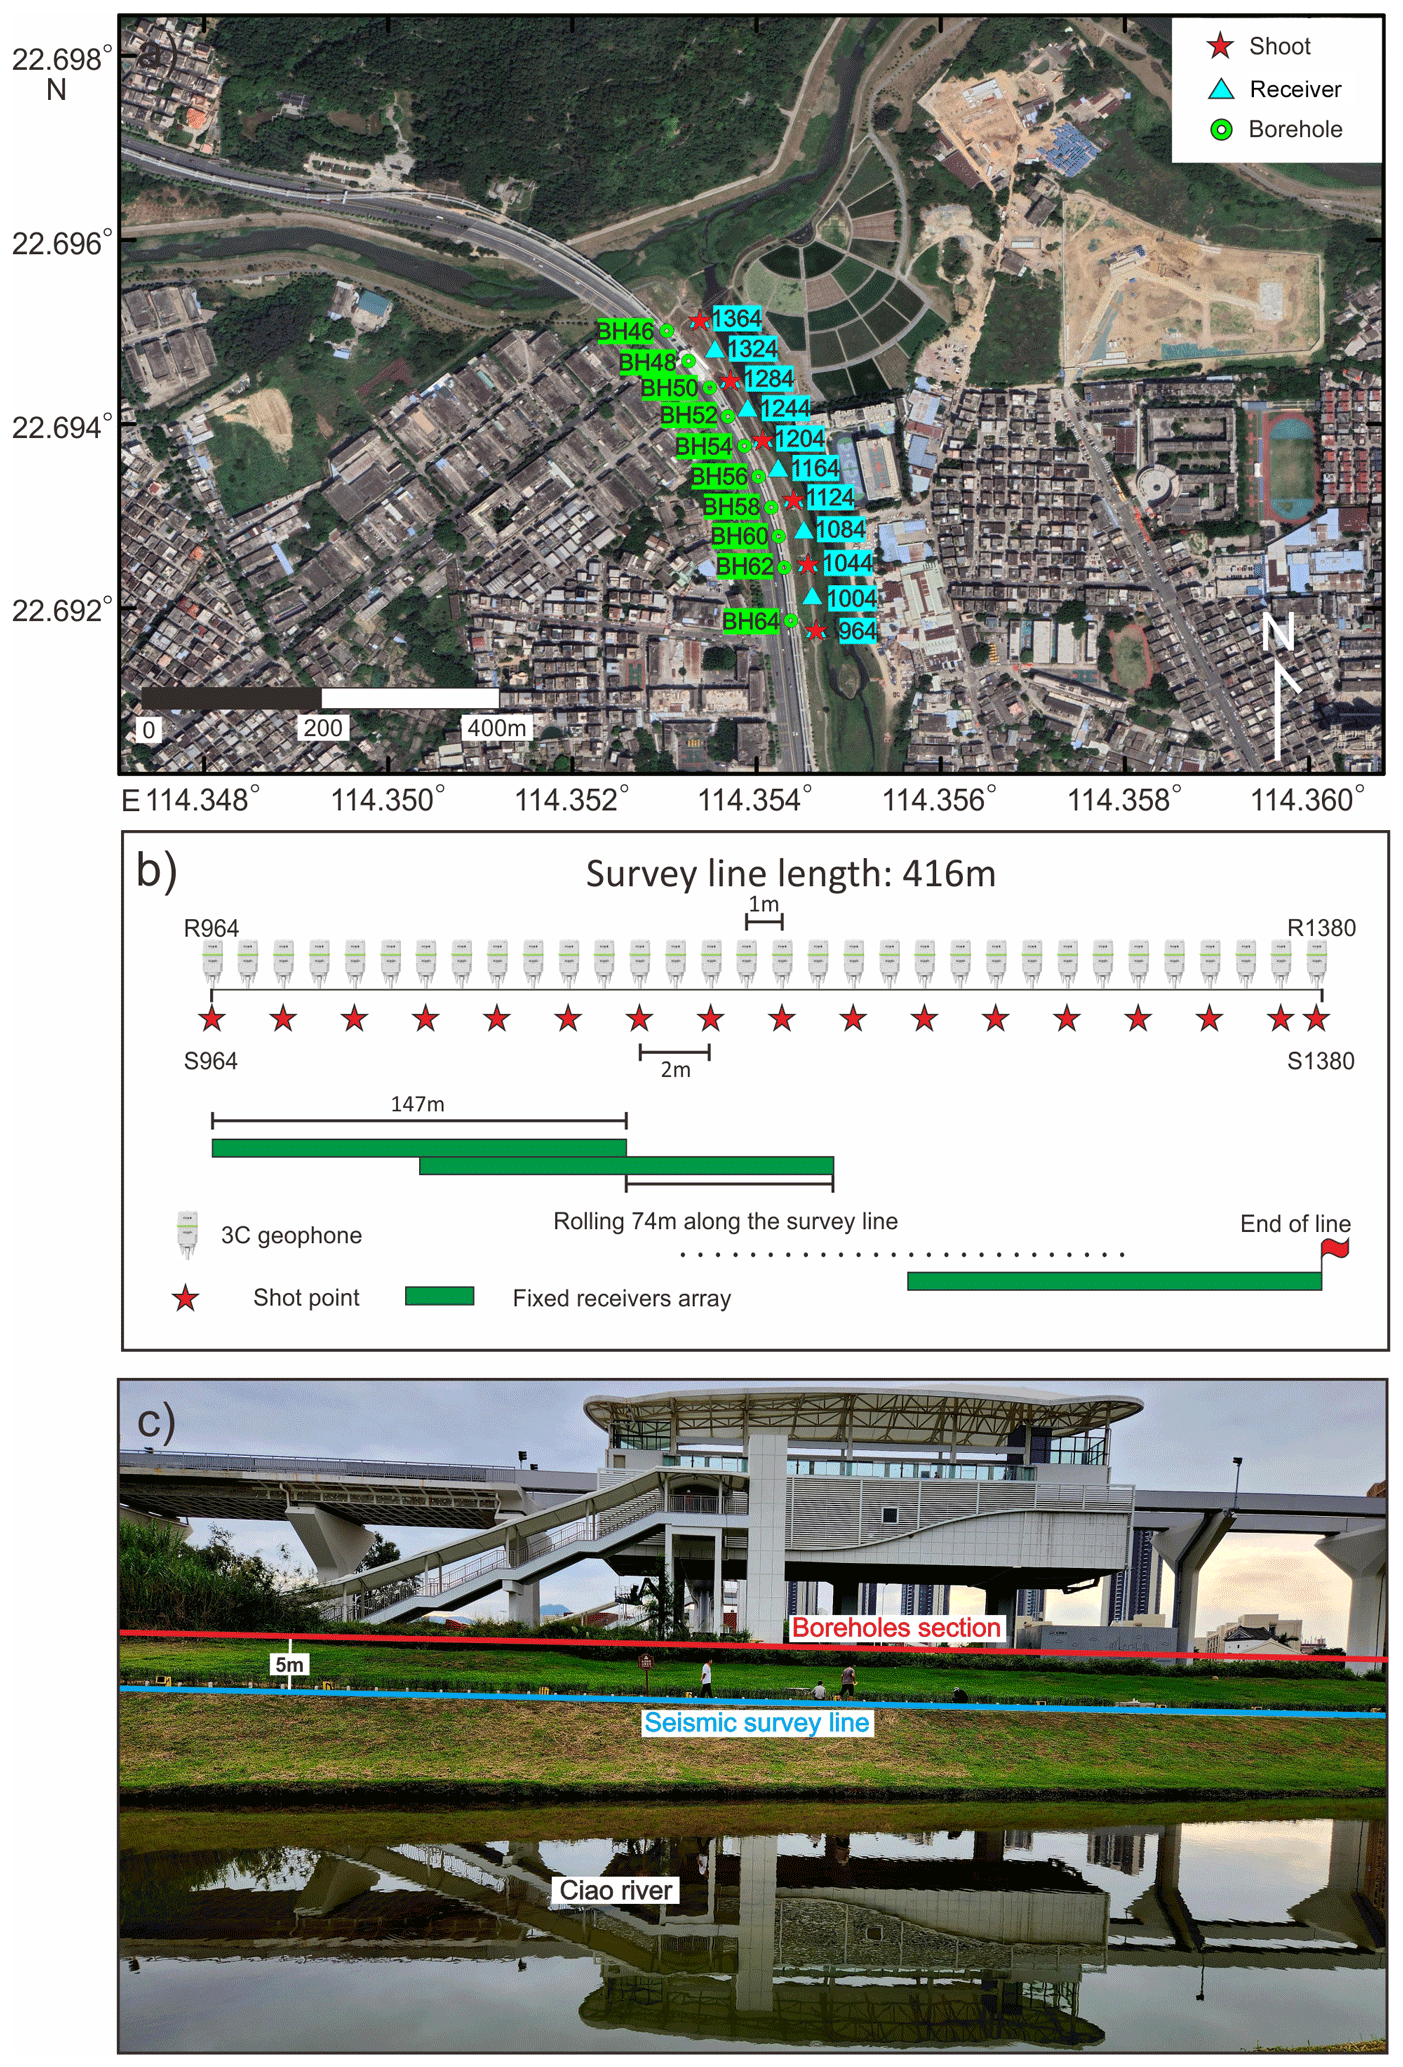
Figure 3(a) Locations of receivers (cyan triangles), shots (red stars), and boreholes (green dots). (b) Geometry of the seismic acquisition profile, receiver spacing 1 m, shot spacing 2 m, separated into five segments, each segment consisted of 148 fixed units with 74 units overlapping. (c) Field work photo of the seismic survey line (cyan line) and geological section consisting of 19 boreholes (red line); the geological section is 5 m higher than the seismic survey line (the aerial image from © Google Maps).
Table 2Acquisition parameters for the high-density and -resolution seismic data in the municipality of Shenzhen, southeast China.
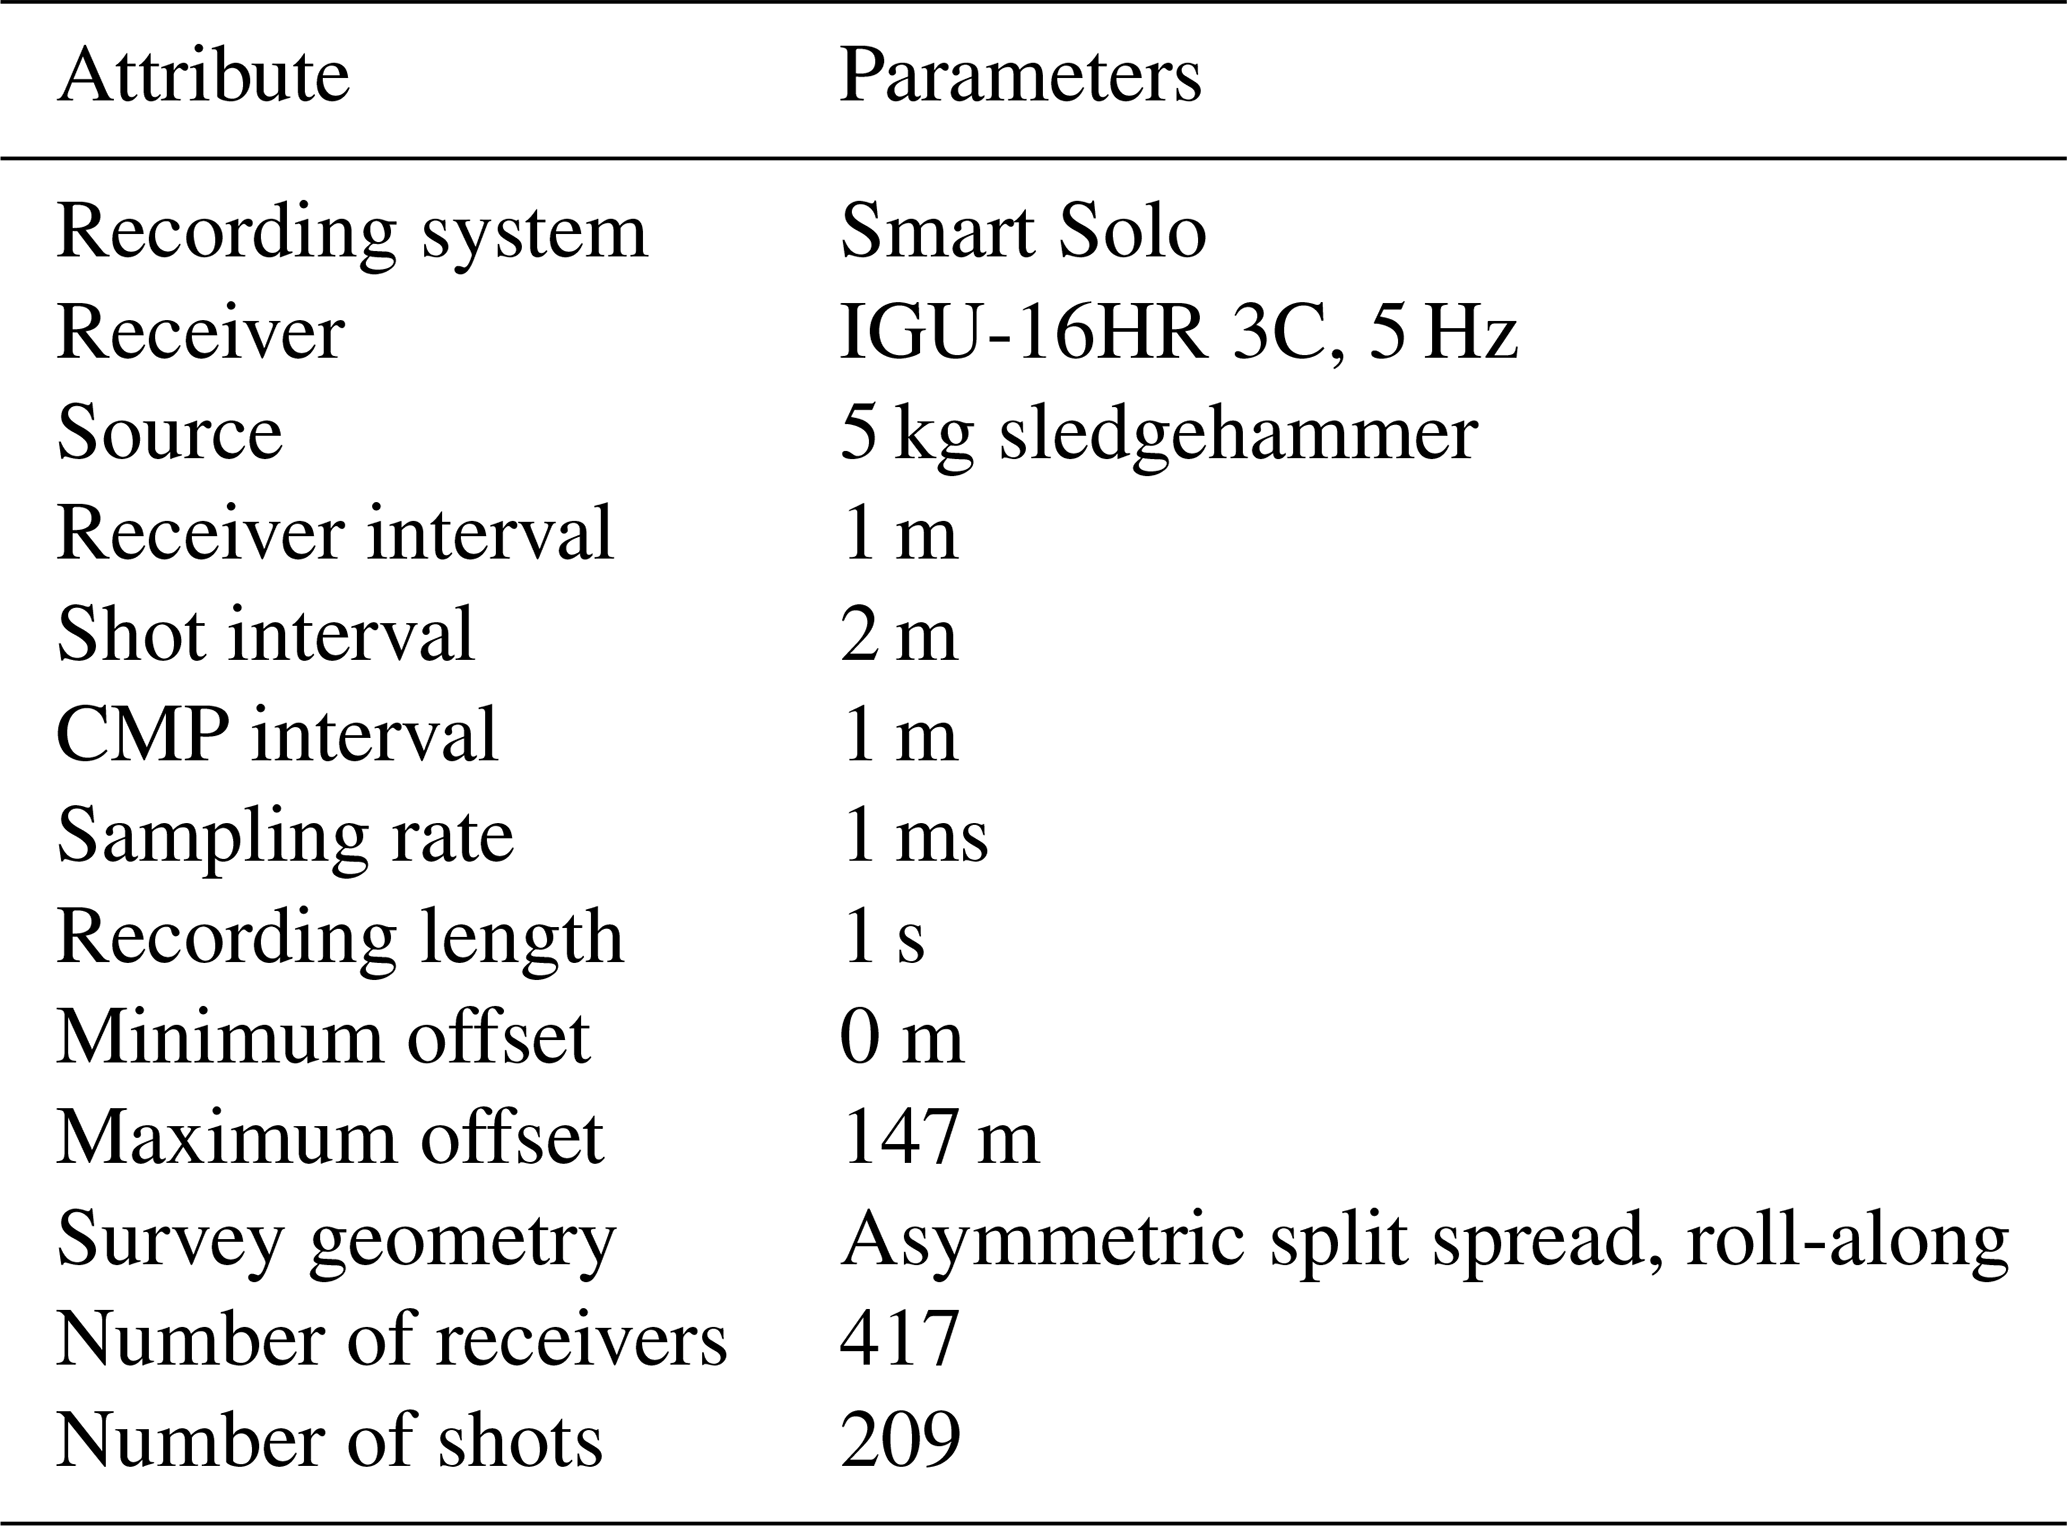
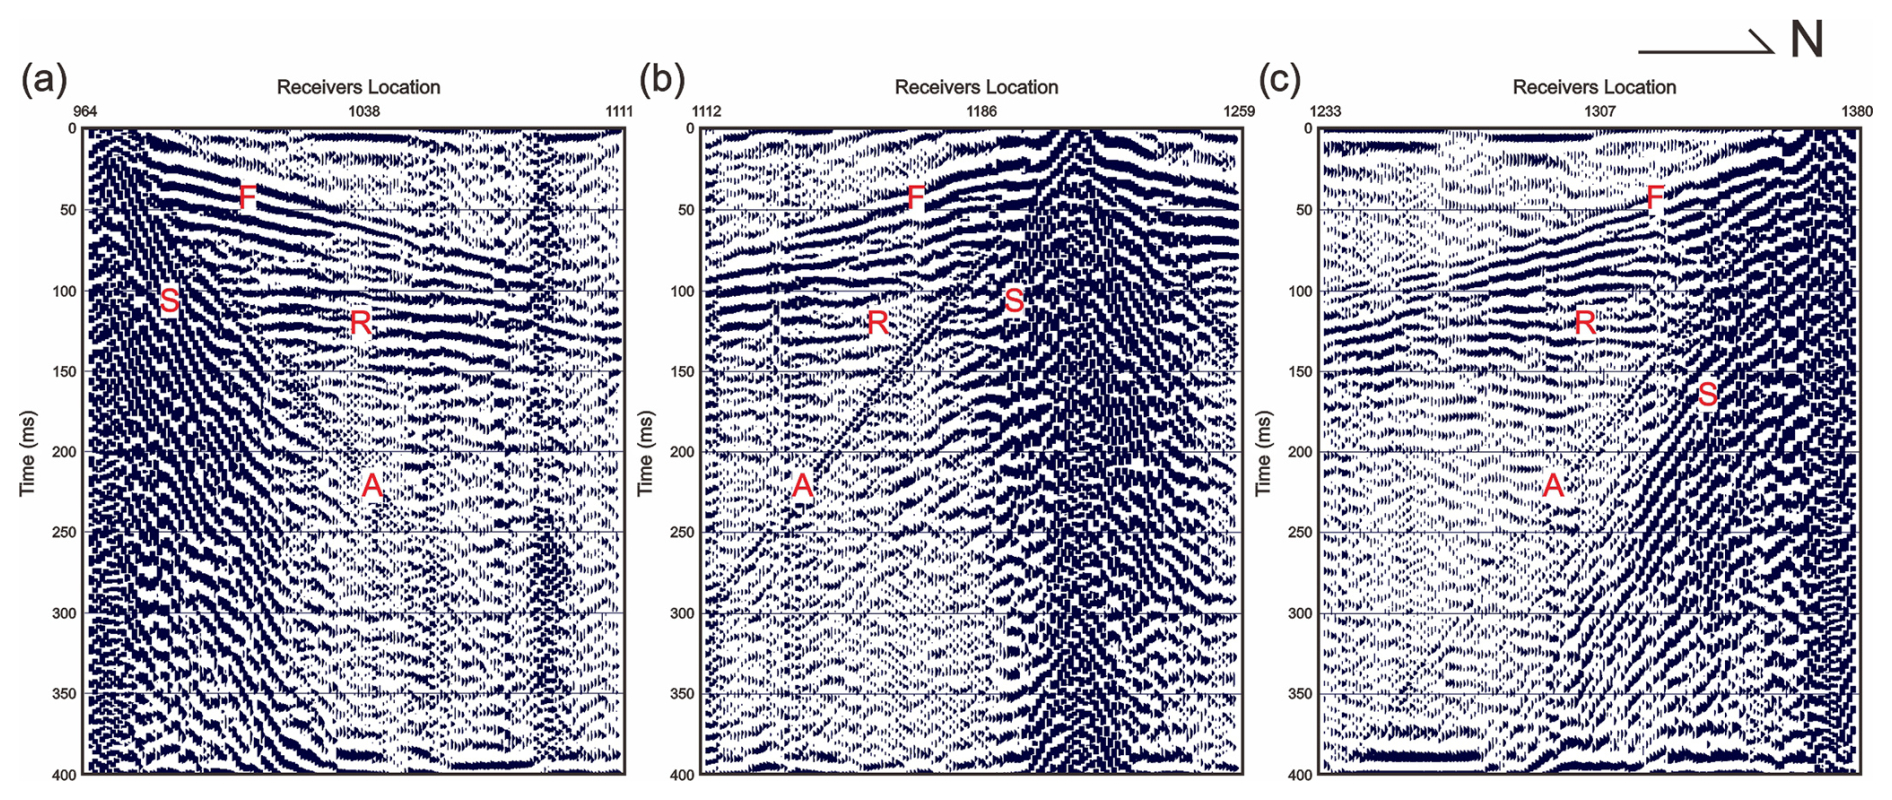
Figure 4Three typical shot gathers from different locations along the seismic survey line: (a) located in the south (shot No. 968), centre (shot No. 1214), and north (shot No. 1374). Reflections from the time window of 50–150 ms are notable, shallower reflections are masked by surface waves, air waves, and direct waves at the near offsets. F, S, R, and A represent first breaks, surface waves, reflections, and air waves, respectively.
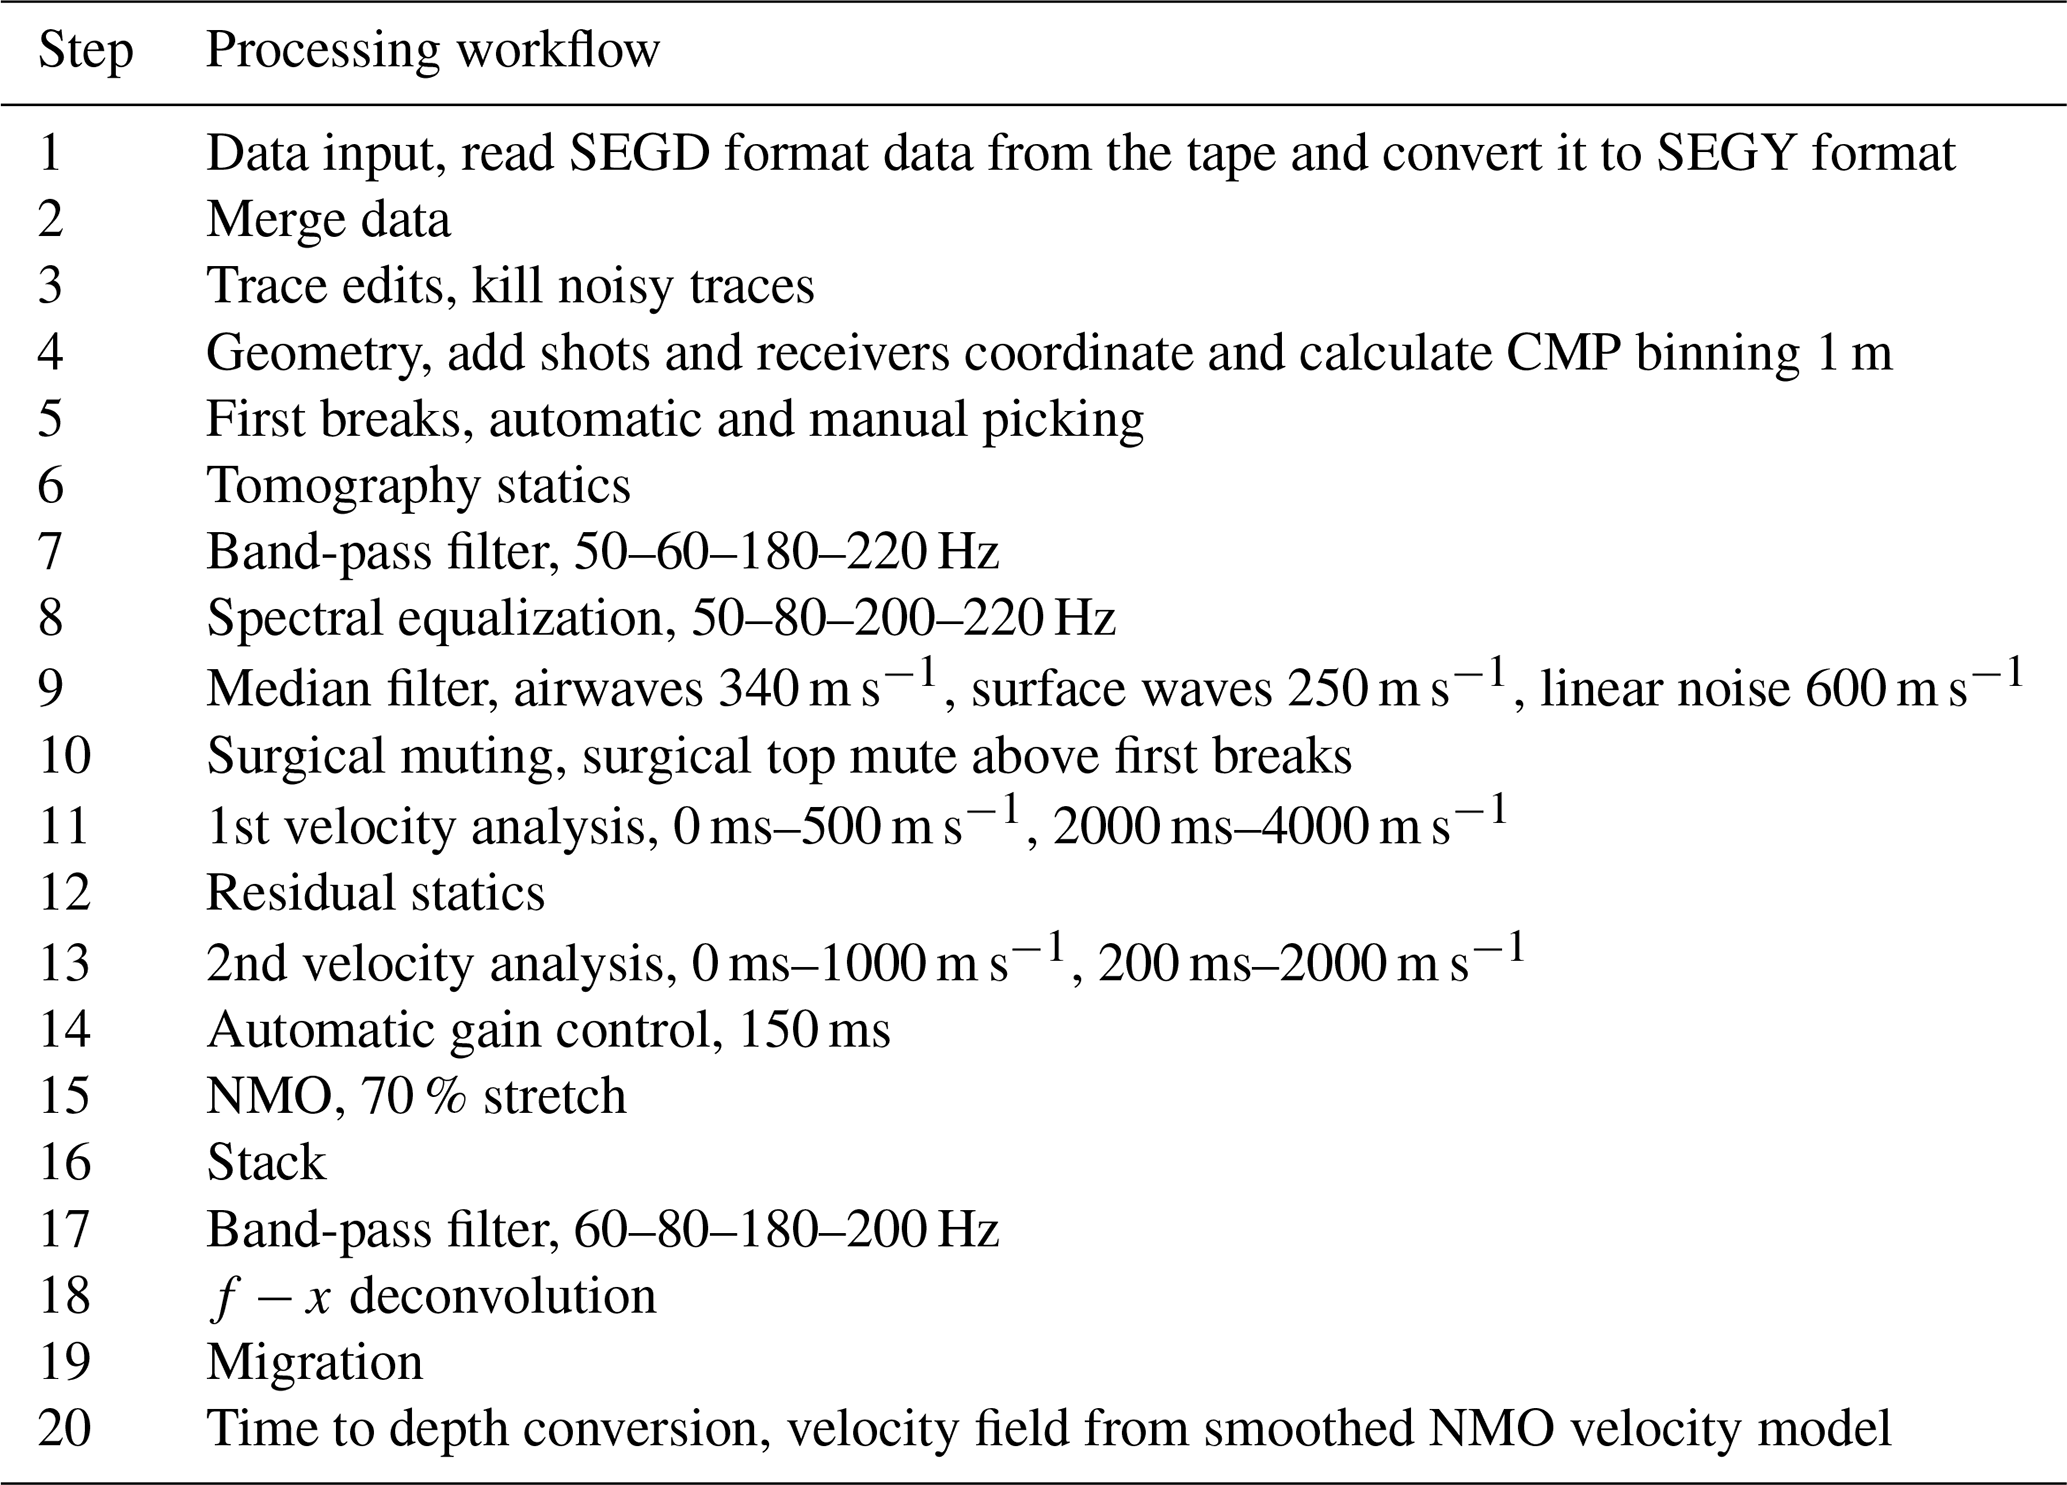
Data processing followed a standard workflow to improve the signal-to-noise ratio and resolution after stacking vertically repeated shot records (twice at each shot location). Tomographic refraction statics were applied to account for travel time variations in the very near surface, while band-pass filtering, spectral equalization, and linear noise suppression were applied to remove different types of noise, including air waves, surface waves, and coherent noise with low frequency. An iterative velocity analysis was performed to obtain the best velocity model and continuity of reflections. The continuity was improved further through surface-consistent residual static corrections. After stacking, band-pass filtering and f−x domain deconvolution were used to further reduce random noise and enhance the coherency of reflections. A finite difference time migration routine was used to move dipping reflectors to their true subsurface positions and collapse diffractions after stacking. Finally, time to depth conversion with the smoothed NMO velocity field was performed to obtain an approximate depth model and to help in interpreting geological structures. Processing steps and parameters are shown in Table 3, while two important steps are discussed in detail below.
Table 3Processing workflow and parameters for the high-density and -resolution seismic data in the municipality of Shenzhen, southeast China.
4.1 Noise attenuation
Raw shot gather recordings are dominated by low frequency and strong amplitude noise, such as surface waves and coherent noise. A typical power spectrum shows that the data contain frequencies in the range 5–440 Hz (Fig. 5a). To suppress the low frequencies and strong amplitude noise, a band-pass filter with corner frequencies of 50–80–180–220 Hz was applied to the raw data after carrying out different frequency ranges tests (Fig. 5b). Direct waves, refractions, reflections, air waves, and surface waves are recognized with apparent velocities of approximately 1000, 1800, 2200, 340, and 220 m s−1, separately. After band-pass filtering, a spectrum equalization process was used to further reduce noise and enhance the weaker amplitude signals. Compared with Fig. 5b, two sets of reflections are notable in Fig. 5c and marked with arrows. Finally, the air waves, surface waves, and other linear noise were attenuated by median filters at velocities of 340, 250 and 600 m s−1, respectively. Reflections are now clearly observed in Fig. 5d.
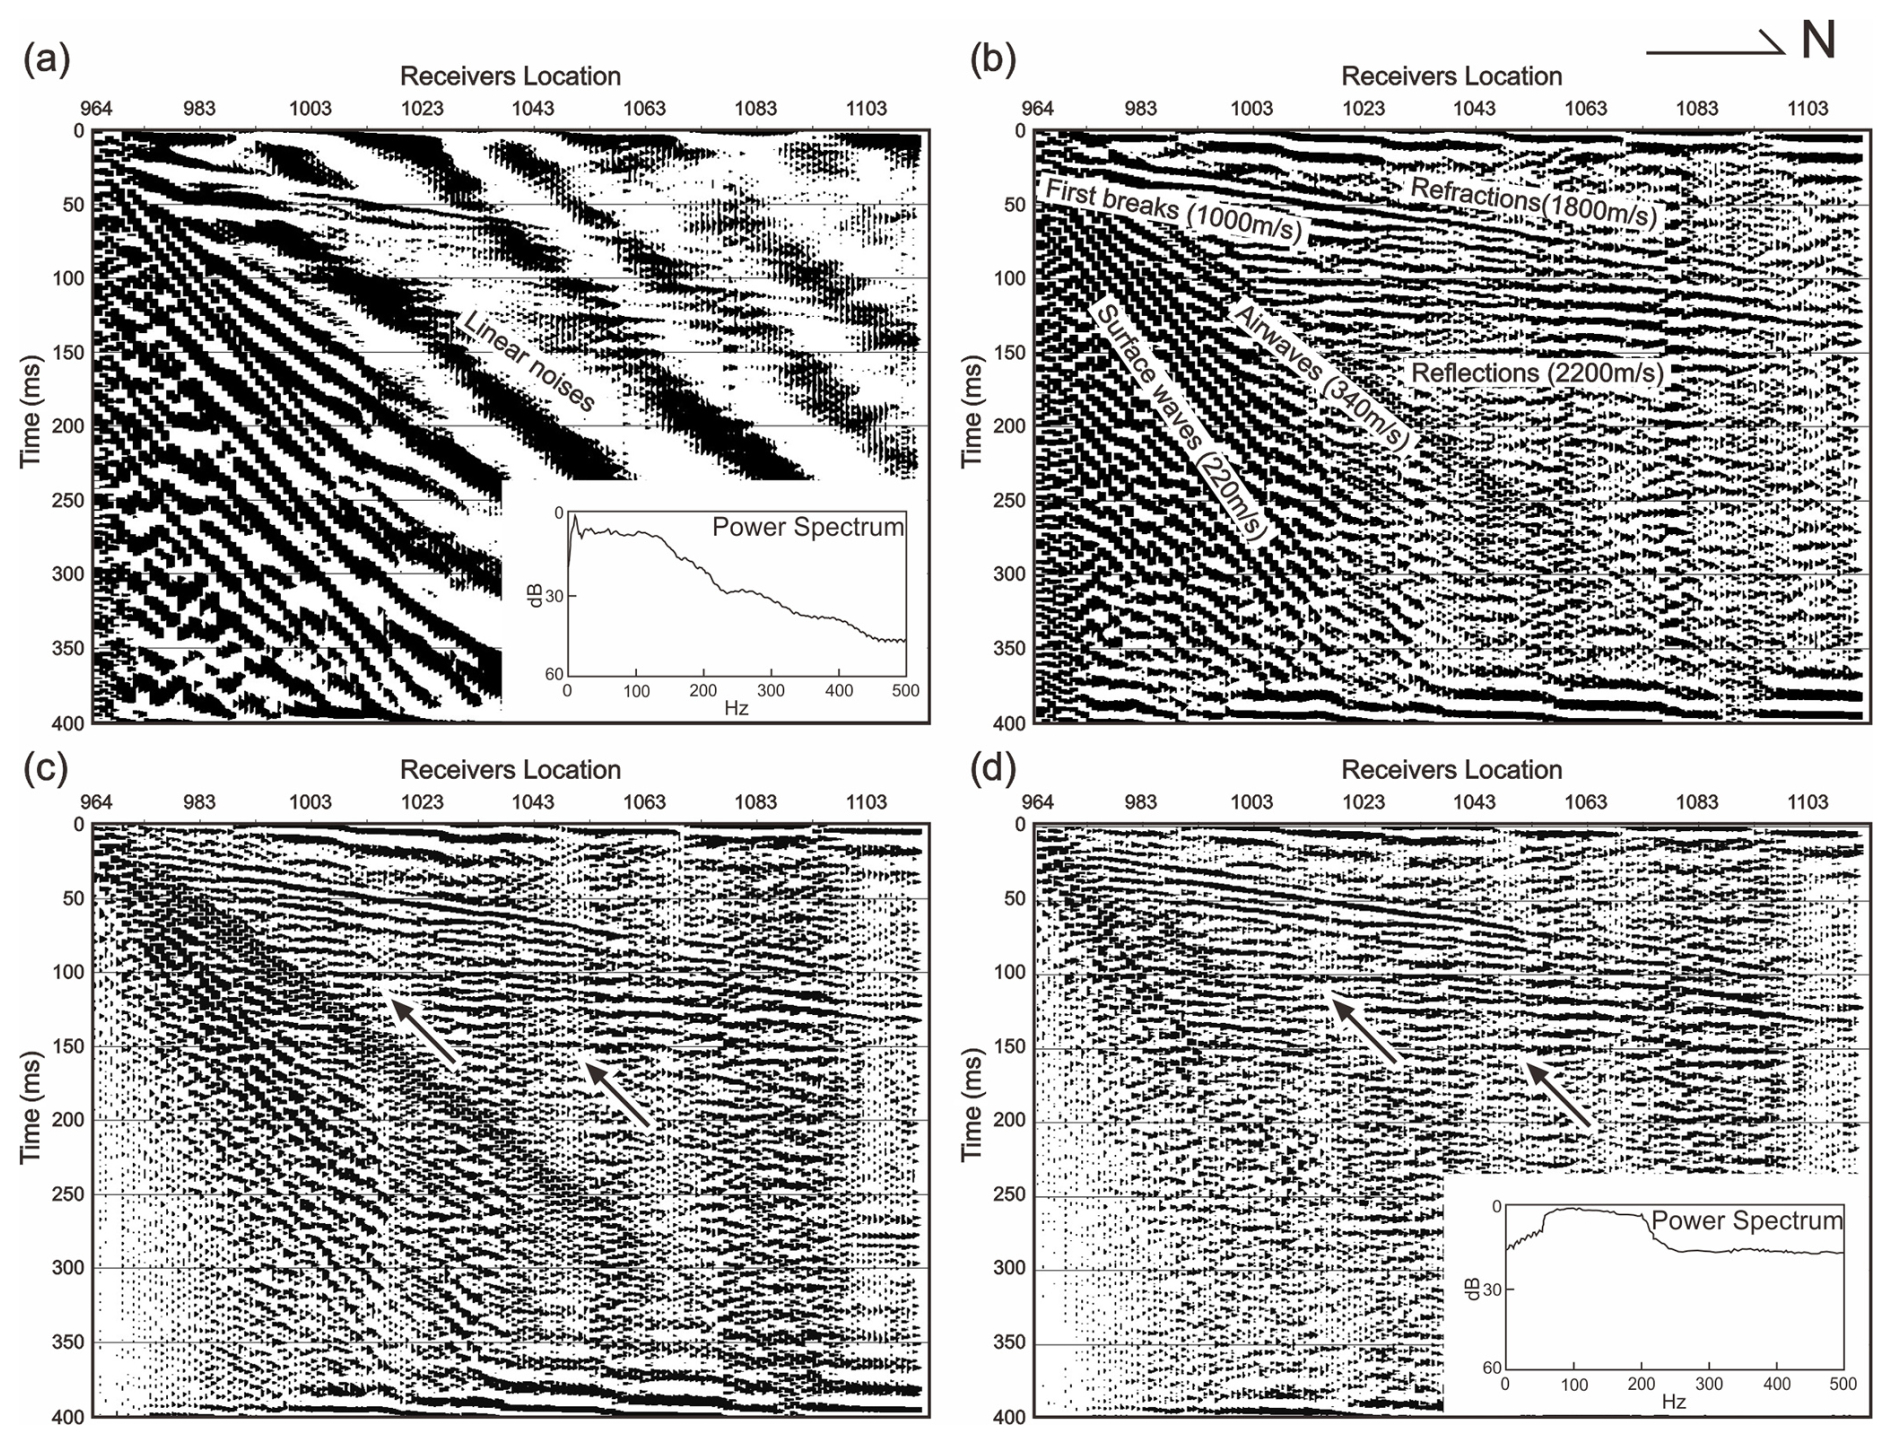
Figure 5Noise attenuation processing steps for the No. 964 shot gather. (a) Raw shot gather and its power spectrum; (b) after a band-pass filter (50–80–180–220 Hz), typical apparent velocities for direct waves, refractions, reflections, air waves, and surface waves are about 1000, 1800, 2200, 340, and 220 m s−1, respectively; (c) after spectrum equalization (50–60–200–220 Hz); (d) after median filtering to remove noise, air wave 340 m s−1, surface wave 250 m s−1, and linear noise 600 m s−1.
4.2 First break travel time tomography
First break picking and travel time tomography were performed to correct for the seismic wave travel time delays in the very near surface low velocity zone and to build a P-wave velocity model. Based on the picked first breaks, a two-layer model was chosen as the initial velocity model, with apparent velocities of about 700 and 1650 m s−1 (Fig. 6a). The ray density plot shows an even distribution in most regions except at about 100–240 m along the profile and at elevations of 20–28 m (Fig. 6b). Root-mean-square errors are approximately 2.4 ms after the fifth iteration (Fig. 6c), indicating a stable result has been attained. The inverted velocity model suggests a two-layer structure over the depth of investigation, the top one with low P-wave velocity is consistent with the fill soil layer; the bottom one with a high P-wave velocity may be correlated to the sand-silty clay layer (Fig. 6d).
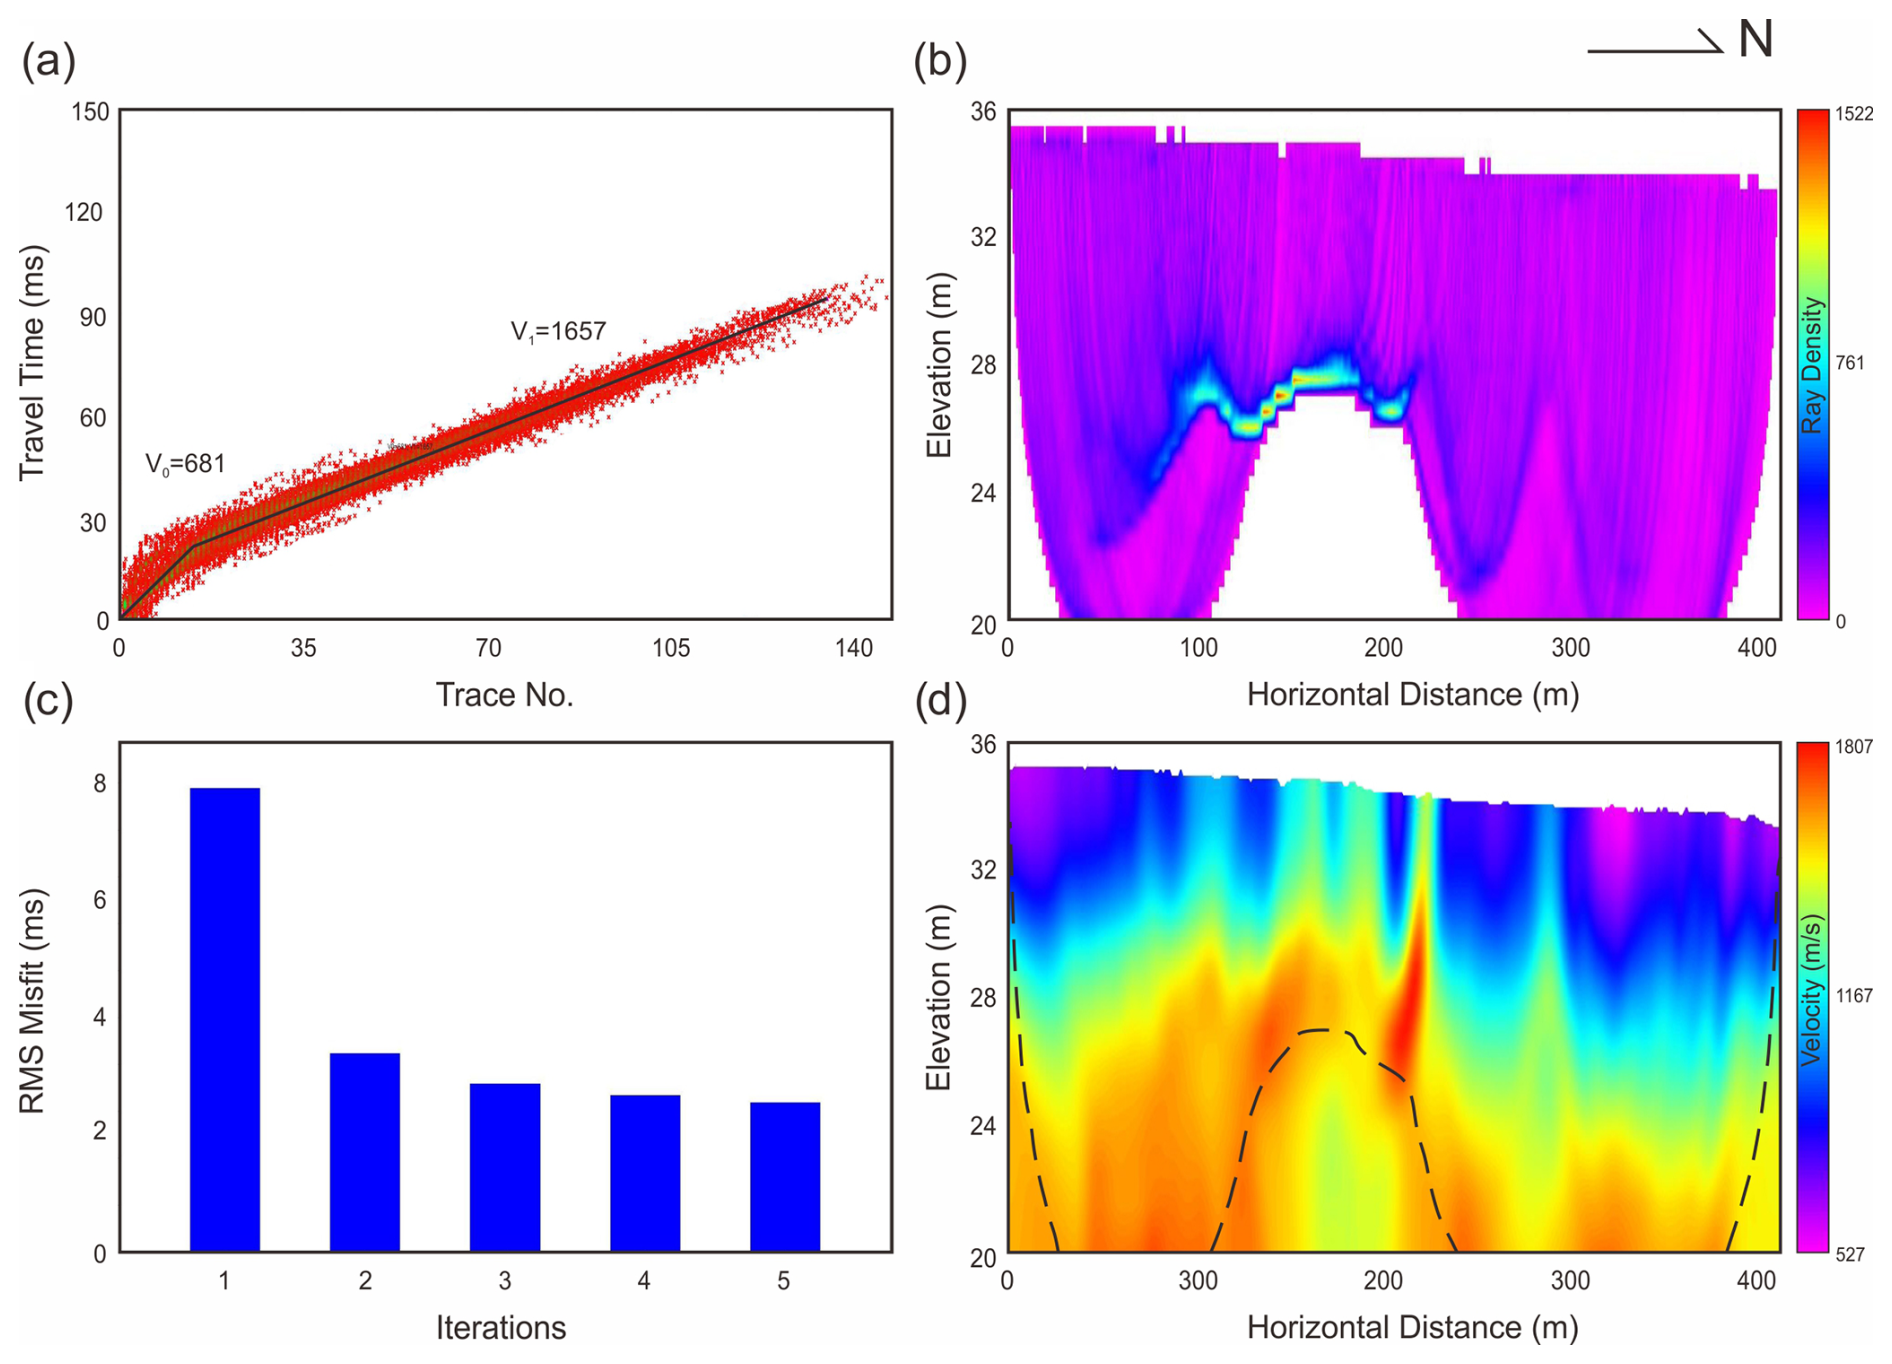
Figure 6Travel time tomography for first breaks. (a) First break travel times for all shots, a two-layer model with apparent velocities of 681 and 1667 m s−1 was taken as the initial velocity model. (b) Ray density model of 20–36 m above sea level. (c) Root mean square (RMS) errors for different iterations. (d) Inverted P-wave model, the black dashed lines represent no rays in the area and velocity is interpolated below it.
2D synthetic seismic modelling was carried out using a finite-difference solution of the elastic wave equation (Juhlin, 1995). A four-layer model (Fig. 7a) with fill soil (Layer 1), sand and silty clay (Layer 2), weathered shale (Layer 3), and limestone (Layer 4) was used to simulate the subsurface geological structures. The model parameters for the compressional velocity, shear velocity, and density are based on the values in Table 1 and first break velocities of the compressional and shear waves using the vertical and radial components, respectively. The 417 m length model is the same as for the real data and the depth is to set to 300 m to mitigate reflections from the bottom of the model. The model was discretized to a 0.15 m × 0.15 m grid size. A Ricker wavelet with a central frequency of 70 Hz was used as a source. In order to be consistent with the field data, the geometry and recording parameters were identical with Fig. 3b and Table 2.
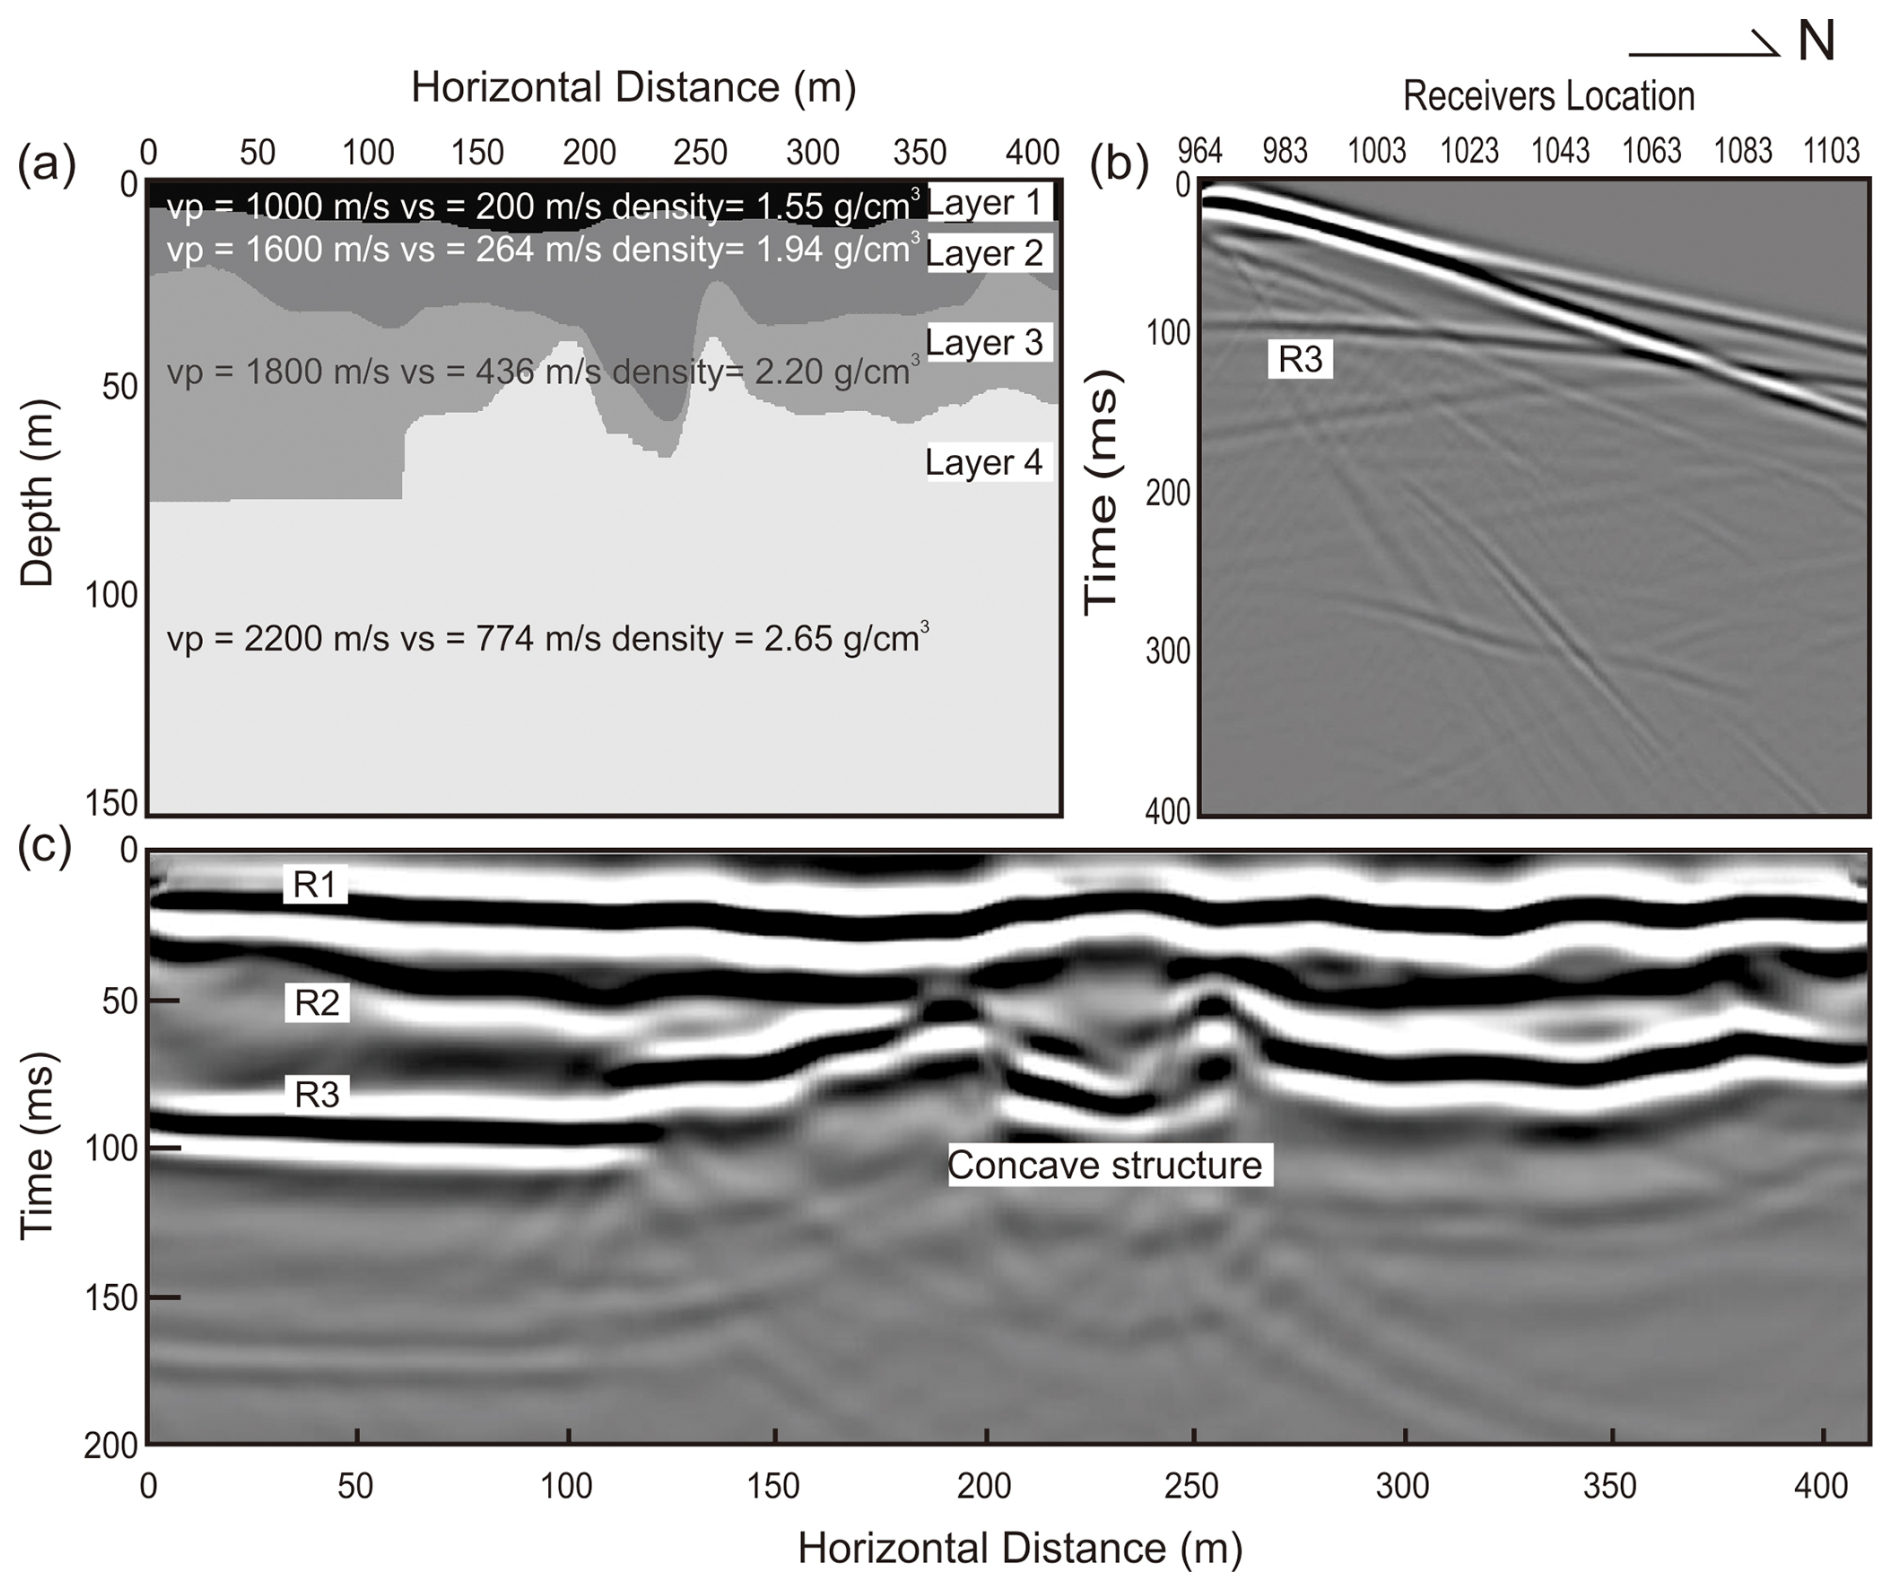
Figure 7Synthetic model and results. (a) the model of P-wave, S-wave, and density based on borehole data and field raw data, Layer 1, Layer 2, Layer 3, and Layer 4 represent fill soil, sand and silty clay, weathered shale, and limestone, respectively, and can be correlated with borehole data. (b) Synthetic shot gather at shot No. 964, the same location as Fig. 5a–d. (c) Pre-stack time migration section.
Figure 7b shows one synthetic shot gather, which has the same location as the real gather in Fig. 5a–d. The R3 reflection is generated from the top of the limestone and matches well the real data gather. Pre-stack reverse time migration was applied using the CREWES MATLAB Toolbox (Fig. 7c). The reflections from the top of sand and silty clay (R1), weathered shale (R2), and limestone (R3) are clearly visible. The result also suggests the presence of a concave shaped structure consistent with the borehole section (Fig. 2a) and real data (Fig. 8). At a distance 0–100 m along the profile and a time of ca. 100 ms, a strong amplitude reflection indicates the limestone which is not mapped by the borehole data due to the limited borehole depth. This reflection is clear in the real data and provides added constraints on the geological structure of the area (Fig. 8).
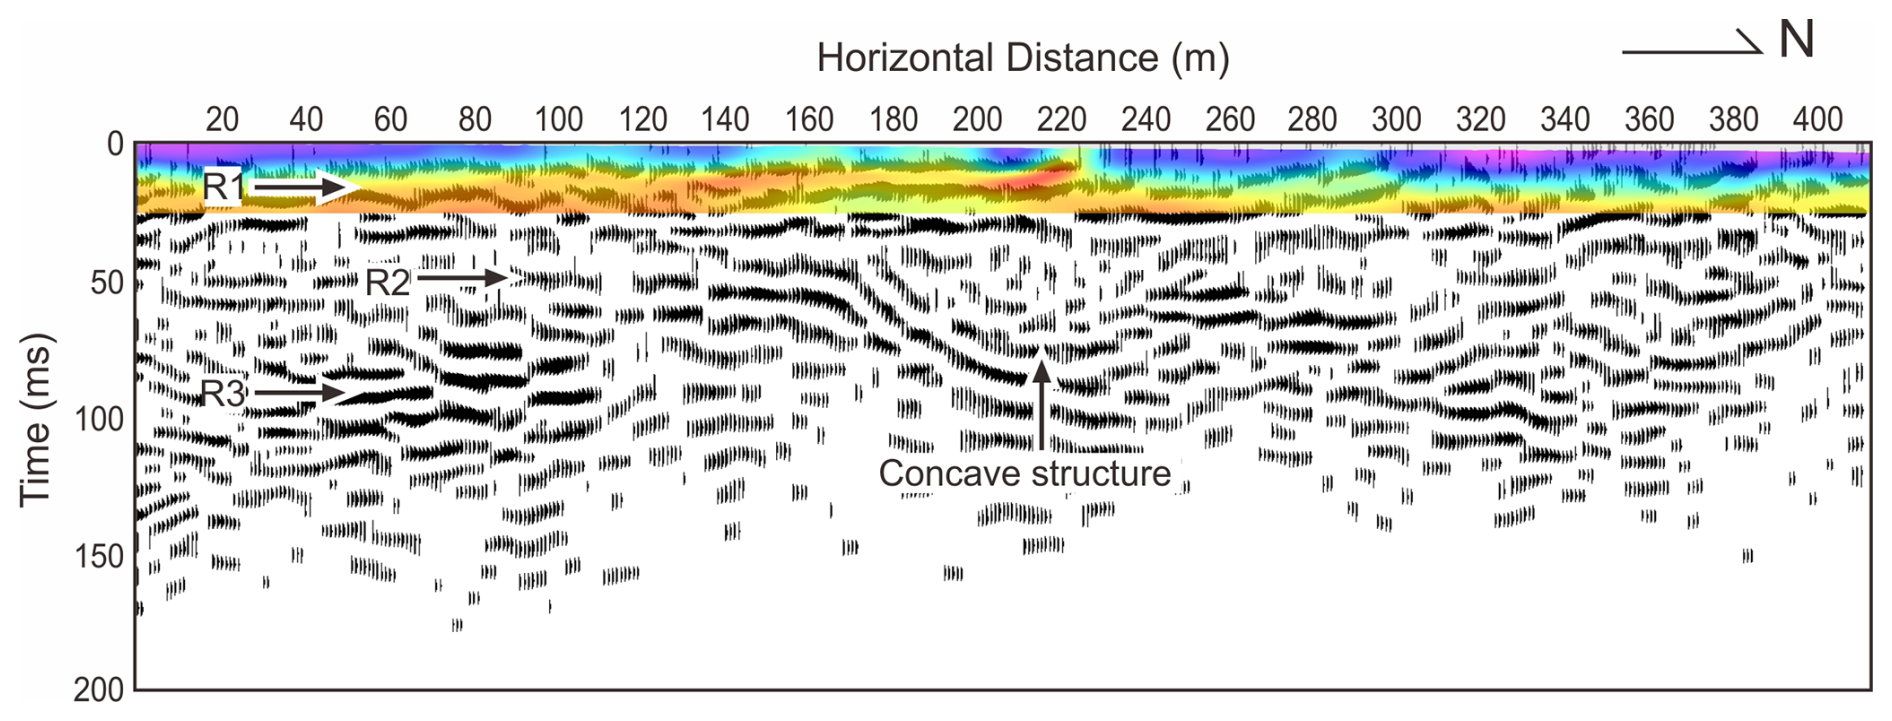
Figure 8Seismic reflection migrated image overlaid with the time converted tomography result; an apparent discontinuity of reflections and velocity at horizontal distance 220 m is observed. R1 and R2 represent reflections from the top and bottom of the sand and silty clay layer, respectively; R3 originates from the top of the limestone. At horizontal distance 220 m and time 75 ms, a concave shaped structure exists that correlates with the borehole section.
6.1 Reflection characteristics from the migrated seismic section
Reflection seismic processing steps focused on removing random and coherent noise and imaging high-frequency reflections in order to resolve the near-surface geological structure. The seismic tomography image suggests that the uppermost reflection horizon on the real data can be interpreted as the fill soil – sand and silty clay interface (Fig. 8). Furthermore, the physical property sample analyses indicated that three seismic interfaces can be mapped in the area and we interpret our seismic section accordingly. In addition to the top of the sand and silty clay unit (R1) two other sets of reflections are imaged down to depths of 80–90 m. These reflections, labelled R2 and R3, represent reflections from the weathered shale and the bedrock interface, consistent with the borehole data and synthetic modelling. Between R2 and R3, some reflections are produced by clay from the weathered and unweathered shale, as shown in Fig. 2b. The R1 reflection is distorted at a distance of 220 m. When compared to the near surface velocity model from first break tomography (Fig. 8), there is also a variation in velocity at this location. This suggests that the thickness of fill soil varies due to palaeotopography or fault slipping. However, it is not possible at present to determine which factor is correct. We have interpreted three faults in the middle part of the seismic section, F1, F2 and F3 (Fig. 9). Seismic reflections show an apparent offset at the locations of these suggested faults; together they form the upward concave structure seen in the seismic image and in the seismic modelling. The locations also correlate with where karst caves are found in the borehole section. If correctly interpreted as faults, this indicates a connection between the karst caves and faulting in this area.
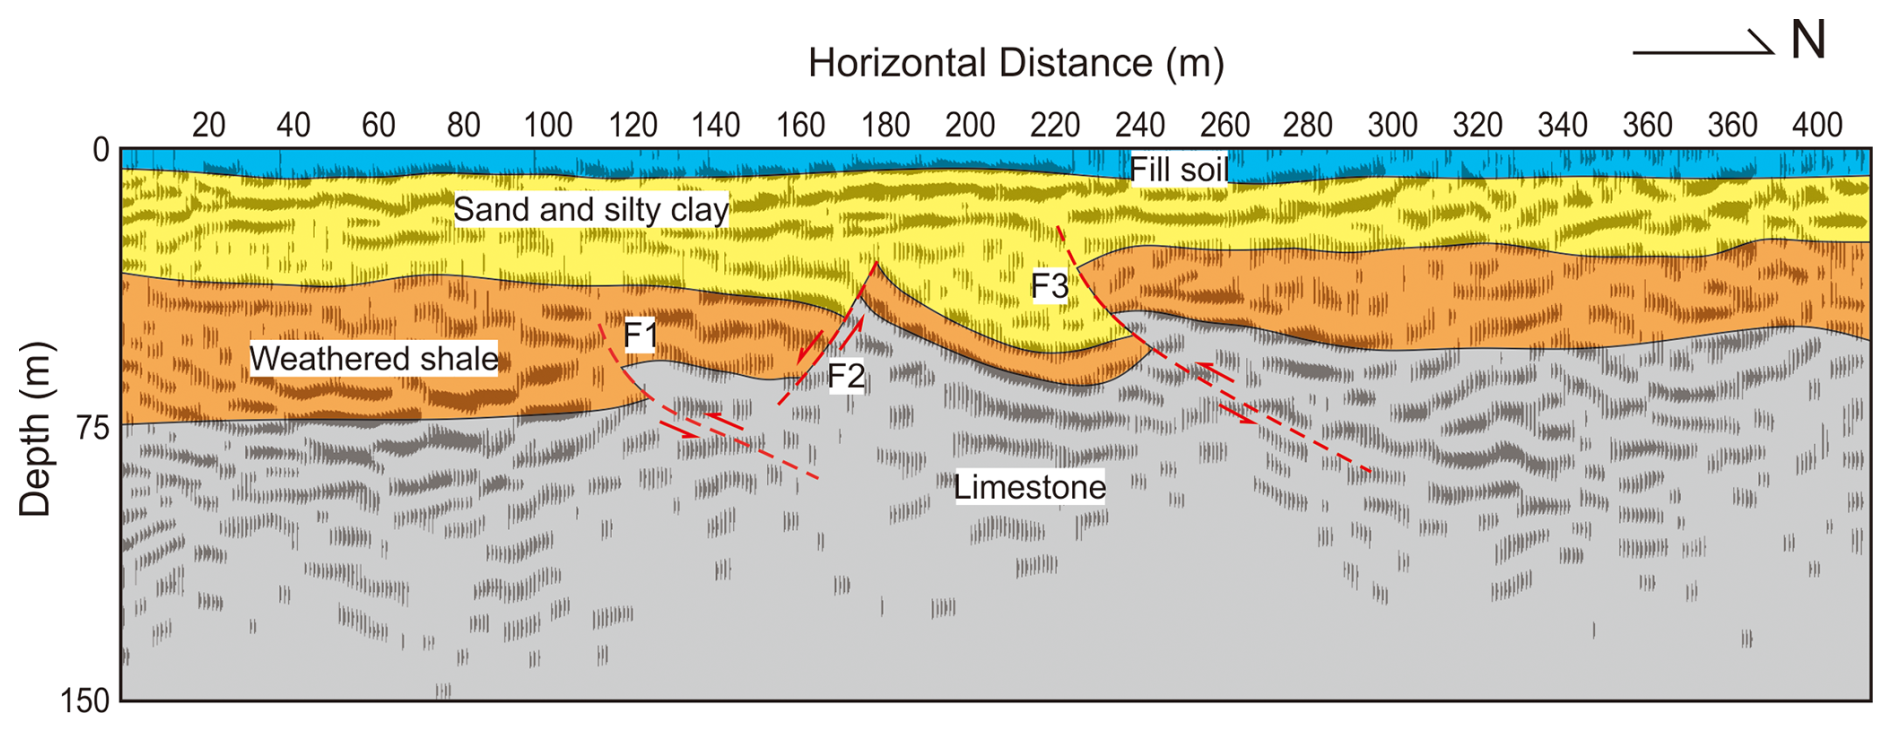
Figure 9Geological interpretation of the depth converted seismic reflection section. Four-layer model as indicated by the seismic data with fill soil, sand and silty clay, weathered shale, and limestone. Two thrusts and one normal fault are shown and labelled by F1, F3, and F2, respectively.
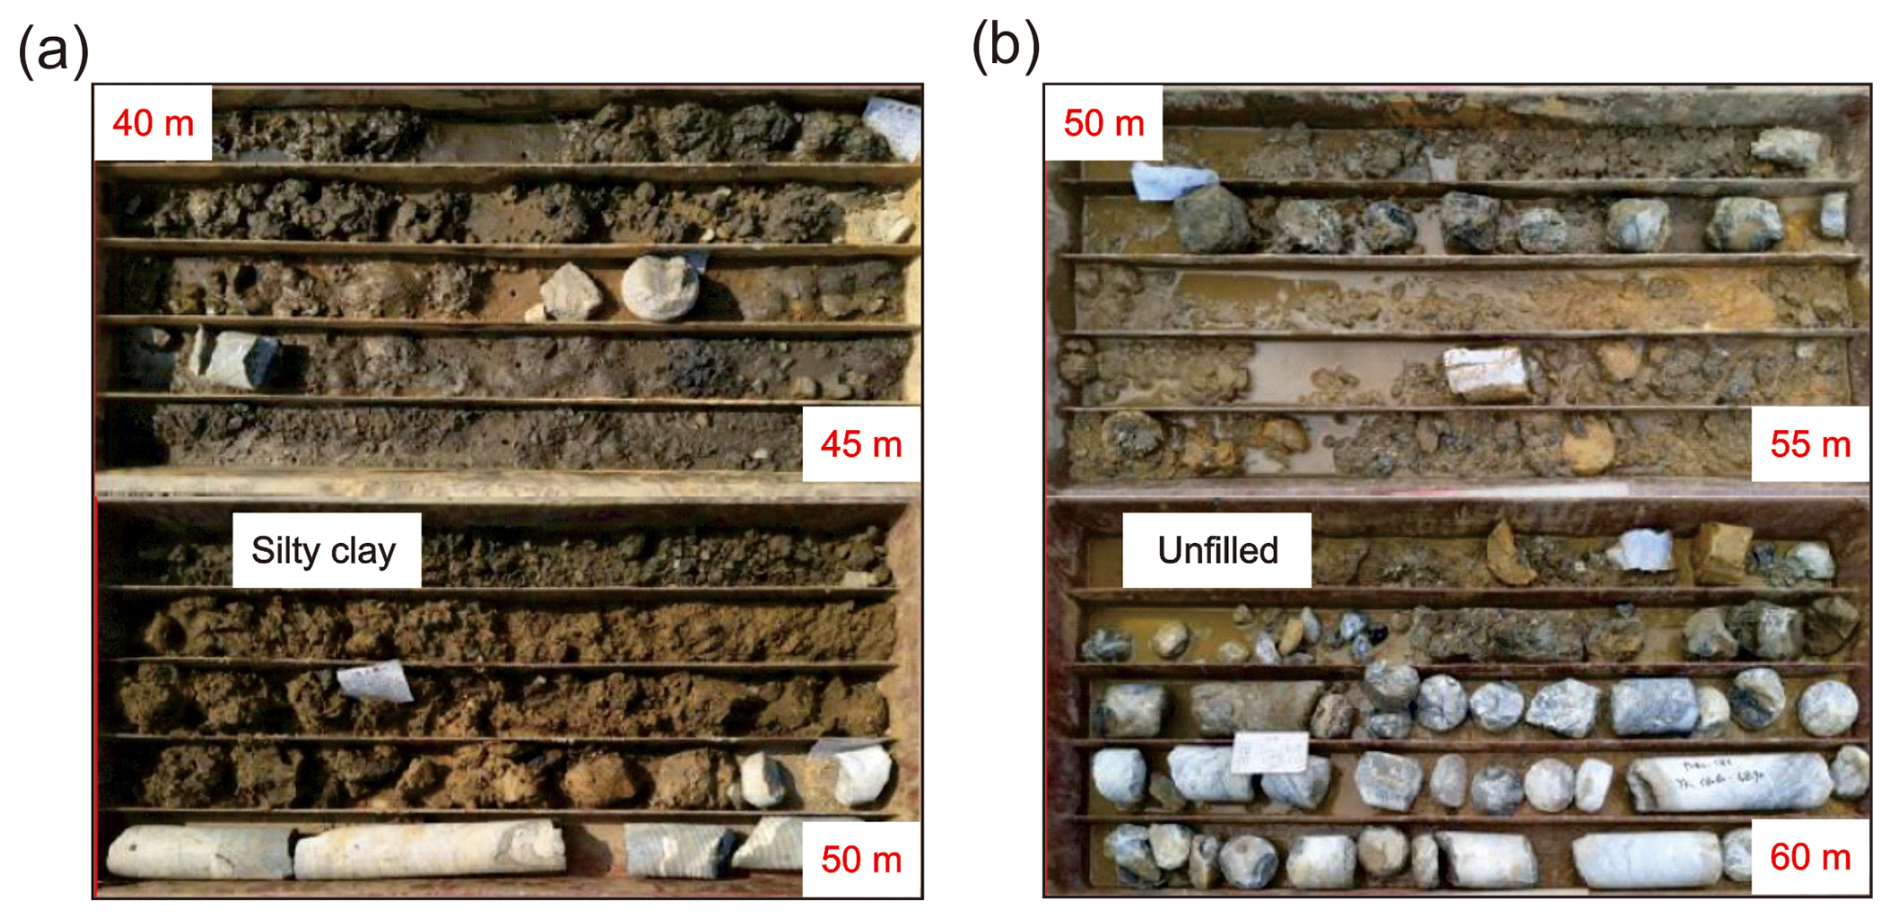
Figure 10Core box images from BH57 (a) and BH59 (b). Karst cave filled with silty clay was developed at depths of 42.8–48.8 m in the borehole BH57 and unfilled at depths of 52–55.9 m in the borehole BH59.
6.2 Formation mechanism and distribution area of karst caves
Karst distributed in the eastern part of Longgang, Pingshan, and Dapeng districts, Shenzhen, can be classified as covered karst with a buried depth of 4–40 m and buried karst with a buried depth of greater than 40 m (He et al., 2020). Buried karst is developed in dolomitic limestone in the research area. Karst caves, unfilled and filled with silty clay, were revealed from the drill cores of BH52, BH56, BH57, BH58, and BH59 (Fig. 10). The discovery rate of karst caves and the linear karst rate of boreholes were 26.31 % and 1.38 %, respectively. No sinkholes and dolines were developed at the surface. Karst caves and sinkholes are usually localized along distinct lines situated along the lithological and tectonic discontinuities (Putiška et al., 2014). A limestone micro-scale cavity readily develops along the fault planes and joints due to weathering and chemical corrosion (Song et al., 2012). Groundwater flows along discontinuities such as bedding planes, joints, and faults. Preferential structural deformation along faults or bedding can enhance dissolution during subsequent interaction with groundwater, so physical rather than chemical properties of some carbonates can control karstification (Lolcama et al., 2002). Previous studies suggest that at least four stages of regional scale tectonic and magmatic events have taken place in South China (Shu et al., 2014), forming sets of transpressional fault structures, N to NW dipping (Fig. 1a). As shown in Fig. 9, two thrusts labelled as F1 and F3 and one normal fault (F2) are suggested to be present, which may help in understanding the formation and distribution of karst caves in this area. Slipping along these faults and erosion generated fractures and fissures in the limestone that probably provided channels for rainwater and groundwater to enter the subsurface from the Ciao river (Fig. 3c). Carbonic acid in the water dissolved the limestone until it became saturated with carbonate minerals. As saturated groundwater flowed away from the area, unsaturated underground water flowed in and further dissolved the limestone. Finally, underground cavities were formed (Fig. 11a). This may give a reasonable explanation why limestone caves developed along the faults and near the rivers in the Pingshan district, Shenzhen (Fig. 11b), however, this needs to be proved by further work.
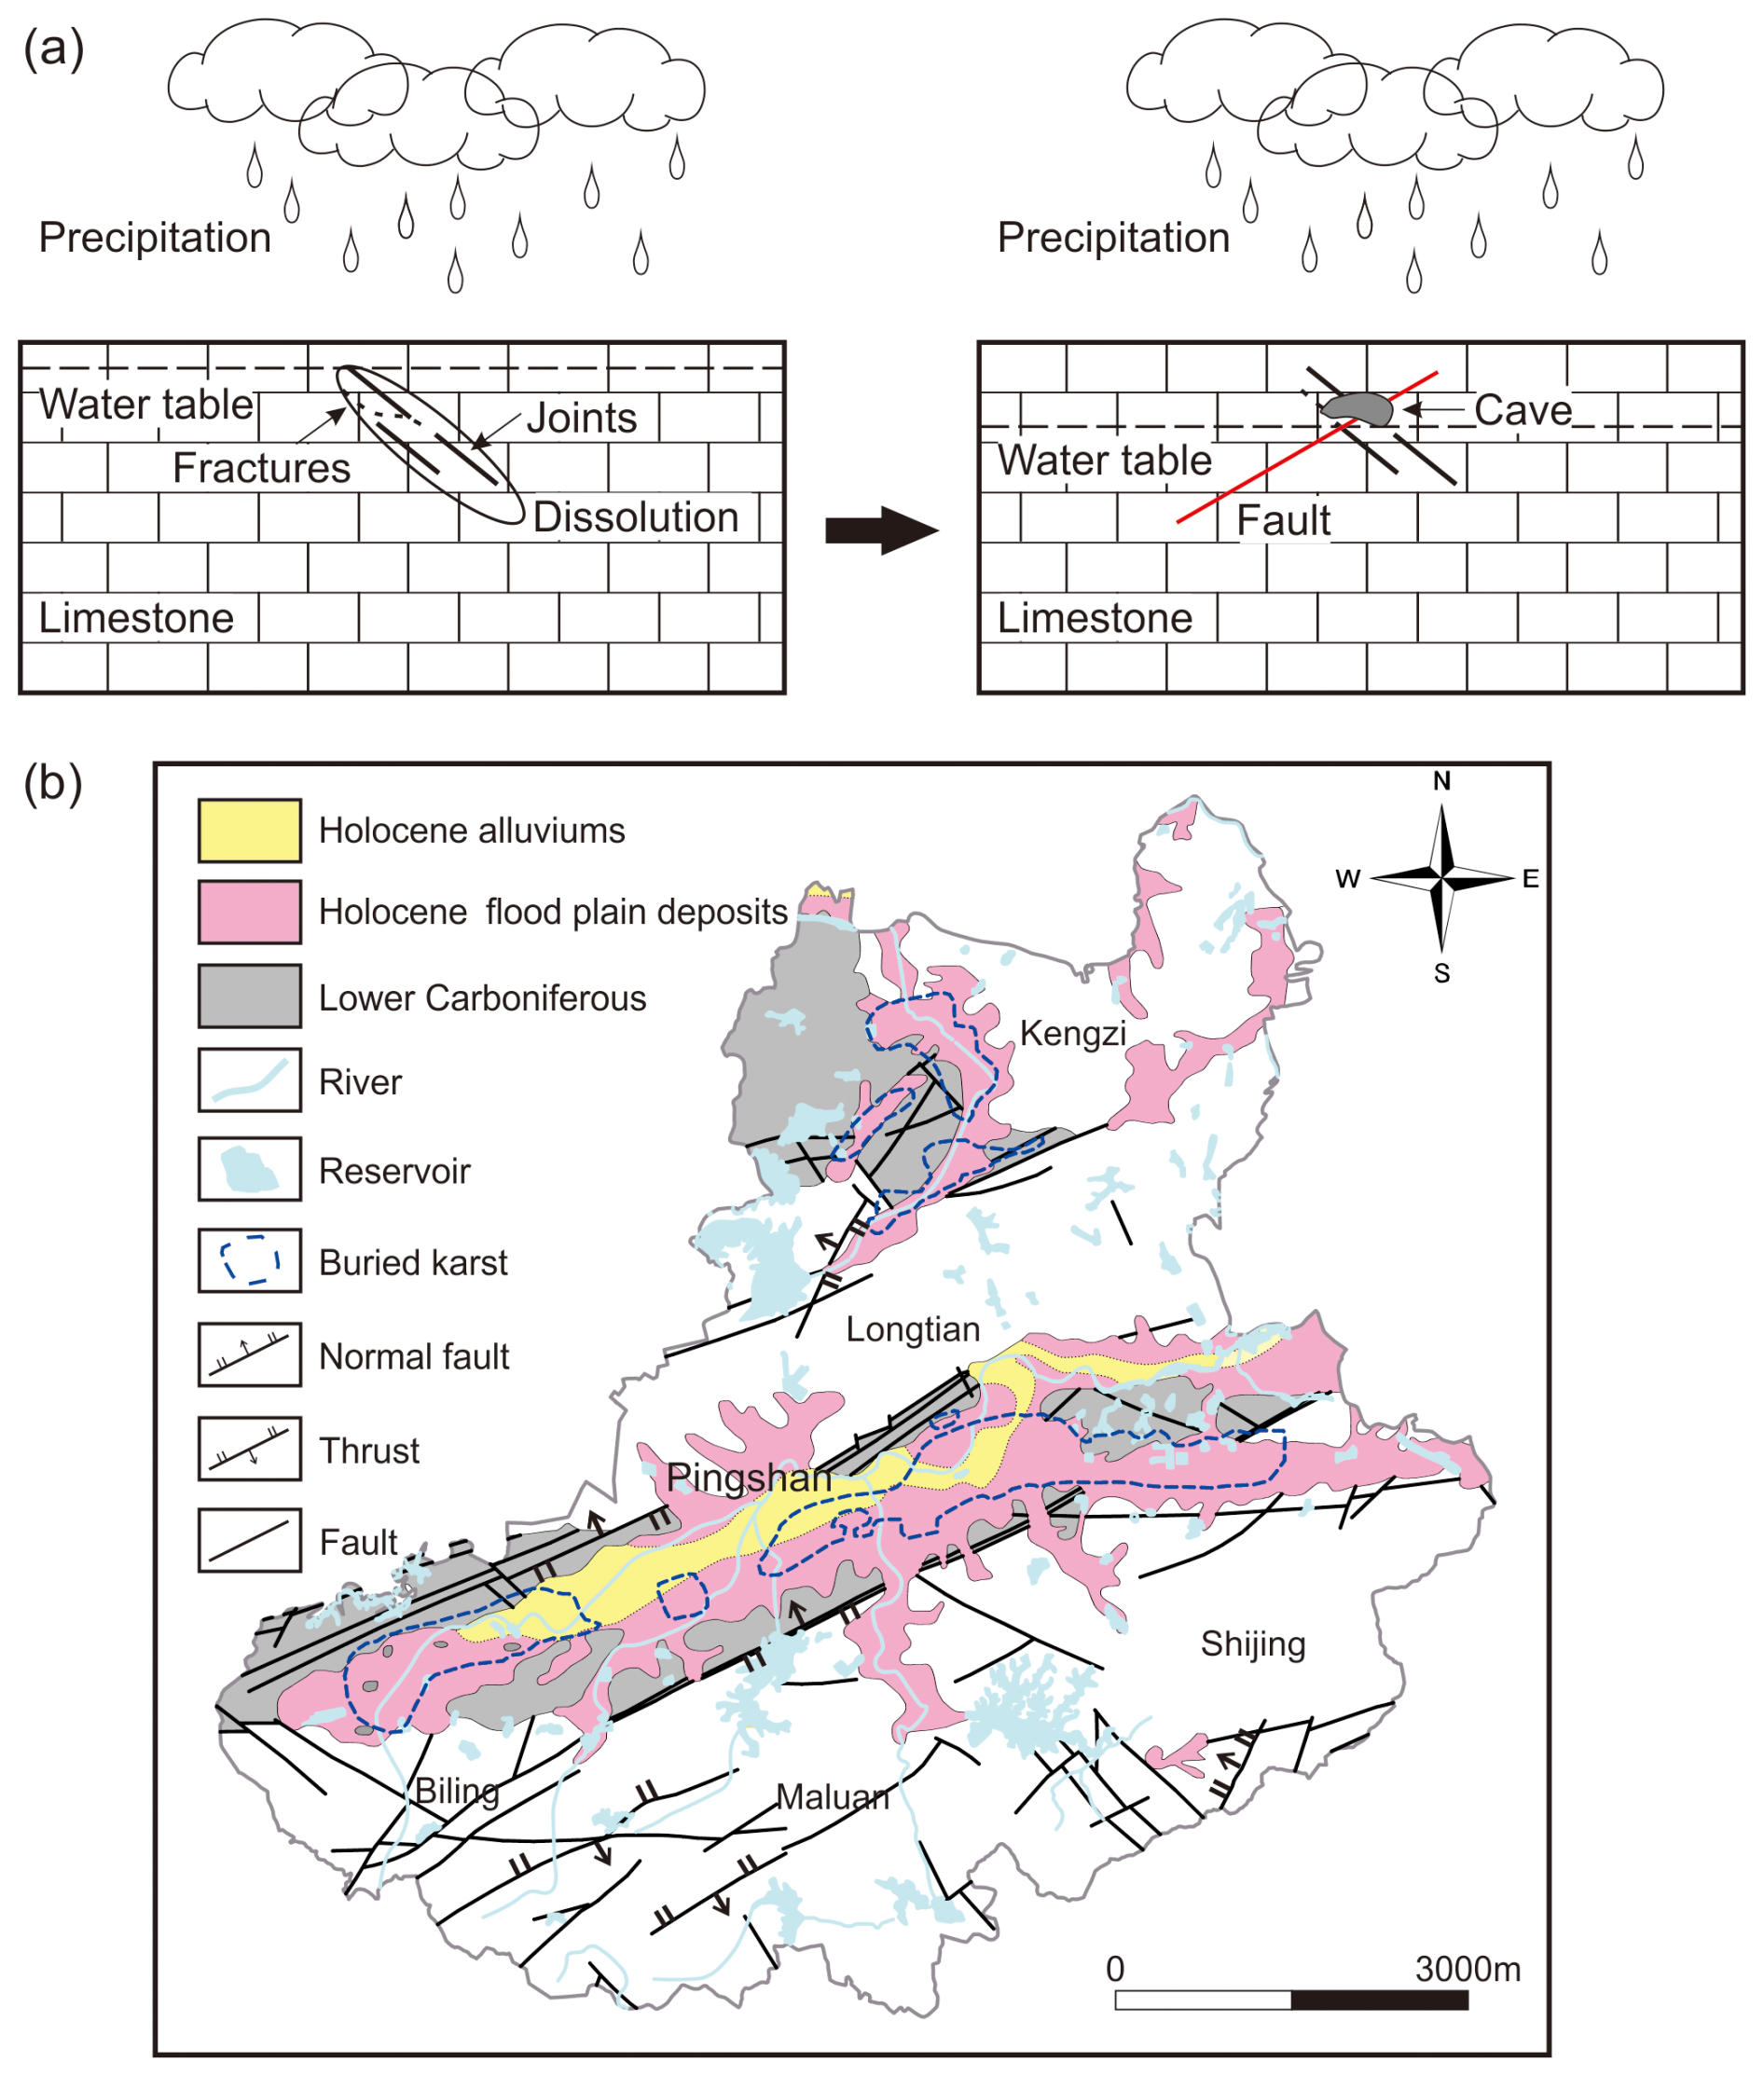
Figure 11Schematic model of karst cave formation in the study area (a) and Karst distribution in the Panshan district, Shenzhen (b). Karst is not only correlated with carbonate rocks, but also faults and rivers (after Shenzhen Geology Writing Group, 2009).
A 417 m long high-resolution seismic reflection profile was acquired to image shallow subsurface geological structures in a karst area. Notably, four layers with fill soil, sand and silty clay, weathered shale, and the bedrock are imaged in high resolution on the stacked seismic section. Also, three small-scale faults are delineated which are closely related to karst caves. To validate the seismic image, synthetic modelling using the elastic wave equation was conducted to compare with the real data and help in the geological interpretation. Furthermore, a near surface velocity model from first break tomography, coincident with a borehole section 20 m away from the seismic line, correlates well with the seismic reflection image and confirms the reliability of it. Integrating the geology and geophysics results in the delineation of the fine subsurface geological structure and provides a better understanding of the formation process and spatial distribution of karst caves in the Pingshan district, Shenzhen. Multi-stage regional scale tectonic and magmatic events produced cracks, fractures, and fissures in the limestone that formed channels where rainwater and groundwater with carbonic acid could circulate and form caves and voids. This interpretation provides valuable insight into the development of karst caves and the research contributes to the mitigation of karst hazards.
To request the data associated with this research, contact the corresponding author of the article after the publication of this work.
ZW and QL conceptualized and designed this study. ZW, ZL, and XR were involved in the data acquisition. ZW, CJ, ZL, XR, and MC were responsible for the data processing. CY provided borehole data. ZW, CJ, and QL led the geological interpretation. ZW wrote the initial draft and CJ reviewed it. All authors participated to the results discussion and approved the submission of this paper.
The contact author has declared that none of the authors has any competing interests.
Publisher’s note: Copernicus Publications remains neutral with regard to jurisdictional claims made in the text, published maps, institutional affiliations, or any other geographical representation in this paper. While Copernicus Publications makes every effort to include appropriate place names, the final responsibility lies with the authors.
This article is part of the special issue “Seismic imaging from the lithosphere to the near surface”. It is not associated with a conference.
This research was funded by the National Natural Science Foundation of China (42174119) and China Geological Survey Project (DD20211314). We acknowledge researchers and students from the Chinese Academy of Geological Sciences who contributed to the data acquisition and Hemin Koyi and Alireza Malehmir from Uppsala University for helpful discussions. Globe Claritas™ under the academic licence from Petrosys Ltd. and Seismic Unix was used for the data processing.
This research has been supported by the National Natural Science Foundation of China (grant no. 42174119) and the China Geological Survey, Ministry of Natural Resources (grant no. DD20211314).
This paper was edited by Michal Malinowski and reviewed by two anonymous referees.
Bobrowsky, P. T. (Ed.): Encyclopedia of natural hazards, 1135, 573–577, Dordrecht, Springer, https://doi.org/10.1007/978-1-4020-4399-4, 2013.
Brodic, B., Malehmir, A., Juhlin, C., Dynesius, L., Bastani, M., and Palm, H.: Multicomponent broadband digital-based seismic landstreamer for near-surface applications, J. Appl. Geophys., 123, 227–241, https://doi.org/10.1016/j.jappgeo.2015.10.009, 2015.
Chen, N. X., Valdes, D., Marlin, C., Blanchoud, H., Guerin, R., Rouelle M., and Ribstein, P.: Water, nitrate and atrazine transfer through the unsaturated zone of the Chalk aquifer in northern France, Sci. Total Environ., 652, 927–938, https://doi.org/10.1016/j.scitotenv.2018.10.286, 2019.
Cui, Q. L., Wu, H. N., Shen, S. L., Xu, Y. S., and Ye, G. L.: Chinese karst geology and measures to prevent geohazards during shield tunnelling in karst region with caves, Nat. Hazards, 77, 129–152, https://doi.org/10.1007/s11069-014-1585-6, 2015.
Galve, J.P., Gutiérrez, F., Guerrero, J., Alonso, J., and Ignacio, D.: Application of risk, cost-benefit and acceptability analyses to identify the most appropriate geogrid so-lution to mitigate sinkhole damage on roads, Eng. Geol., 145–146, 65–77, https://doi.org/10.1016/j.enggeo.2012.07.002, 2012.
He, X. C., Xu, Y. S., Shen, S. L., and Zhou, A. N.: Geological environment problems during metro shield tunnelling in Shenzhen, China, Arab. J. Geosci., 13, 1–18, https://doi.org/10.1007/s12517-020-5071-z, 2020.
Hoover, R. A.: Geophysical choices for karst investigations, In Sinkholes and the engineering and environmental impacts of karst, American Society of Civil Engineers, 529–538, https://doi.org/10.1061/40698(2003)48, 2003.
Hussain, Y., Uagoda, R., Borges, W., Nunes, J., Hamza, O., Condori, C., Aslam K., Dou J., and Cárdenas-Soto, M.: The potential use of geophysical methods to identify cavities, sinkholes and pathways for water infiltration, Water, 12, 2289, https://doi.org/10.3390/w12082289, 2020.
Intrieri, E., Gigli, G., Nocentini, M., Lombardi, L., Mugnai, F., Fidolini, F., and Casagli, N.: Sinkhole monitoring and early warning: an experimental and successful GB-InSAR application, Geomorphology, 241, 304–314, https://doi.org/10.1016/j.geomorph.2015.04.018, 2015.
Juhlin, C.: Finite difference elastic wave propagation in 2-D heterogeneous transversely isotropic media, Geophys. Prospect., 43, 843–858, https://doi.org/10.1111/j.1365-2478.1995.tb00284.x, 1995.
Juhlin, C., Palm, H., Müllern, C.-F., and Wållberg, B.: High-resolution reflection seismics applied to detection of groundwater resources in glacial deposits, Sweden, Geophys. Res. Lett., 27, 1575–1578, https://doi.org/10.1029/1999GL011295, 2000.
Kaufmann, G. and Romanov, D.: Geophysical investigation of a sinkhole in the northern Harz foreland (North Germany), Environ. Geol., 58, 401–405, https://doi.org/10.1007/s00254-008-1598-0, 2009.
Kaufmann, G.: Geophysical mapping of solution and collapse sinkholes, J. Appl. Geophys., 111, 271–288, https://doi.org/10.1016/j.jappgeo.2014.10.011, 2014.
Kaufmann, G. and Romanov, D.: Structure and evolution of collapse sinkholes: Combined interpretation from physico-chemical modelling and geophysical field work, J. Hydrol., 540, 688–698, https://doi.org/10.1016/j.jhydrol.2016.06.050, 2016.
Li, J., Cawood, P. A., Ratschbacher, L., Zhang, Y., Dong, S., Xin, Y., Yang H., and Zhang, P.: Building Southeast China in the late Mesozoic: Insights from alternating episodes of shortening and extension along the Lianhuashan fault zone, Earth-Sci. Rev., 201, 103056, https://doi.org/10.1016/j.earscirev.2019.103056, 2020.
Li, X., Zhou, S., and Xu, G.: GIS-based risk assessment to karst susceptibility of Shenzhen Universiade Center (China), Procedia Environ. Sci., 10, 1389–1395, https://doi.org/10.1016/j.proenv.2011.09.222, 2011.
Liu, R., Sun, H., Qin, J., and Zheng, Z.: A multi-geophysical approach to assess potential sinkholes in an urban area, Eng. Geol., 318, 107100, https://doi.org/10.1016/j.enggeo.2023.107100, 2023.
Lolcama, J. L., Cohen, H. A., and Tonkin, M. J.: Deep karst conduits, flooding, and sinkholes: lessons for the aggregates industry, Eng. Geol., 65, 151–157, https://doi.org/10.1016/S0013-7952(01)00122-3, 2002.
Mao, J., Li, Z., and Ye, H.: Mesozoic tectono-magmatic activities in South China: Retrospect and prospect. Sci. China Earth Sci. 57, 2853–2877, https://doi.org/10.1007/s11430-014-5006-1, 2014.
Martinez, K. and Mendoza, J. A.: Urban seismic site investigations for a new metro in central Copenhagen: Near surface imaging using reflection, refraction and VSP methods, Phys. Chem. Earth, 36, 1228–1236, https://doi.org/10.1016/j.pce.2011.01.003, 2011.
Medici, G., Munn, J. D., and Parker, B. L.: Delineating aquitard characteristics within a Silurian dolostone aquifer using high-density hydraulic head and fracture datasets, Hydrogeol. J., 32, 1663–1691, https://doi.org/10.1007/s10040-024-02824-9, 2024.
Muzirafuti, A., Boualoul, M., Barreca, G., Allaoui, A., Bouikbane, H., Lanza, S., Crupi, A., and Randazzo, G.: Fusion of remote sensing and applied geophysics for sinkholes identification in Tabular Middle Atlas of Morocco (the Causse of El Hajeb): Impact on the protection of water resource, Resources, 9, 51, https://doi.org/10.3390/resources9040051, 2020.
Pazzi, V., Di Filippo, M., Di Nezza, M., Carlà, T., Bardi, F., Marini, F., Fontanelli, K., Intrieri, E., and Fanti, R.: Integrated geophysical survey in a sinkhole-prone area: Microgravity, electrical resistivity tomographies, and seismic noise measurements to delimit its extension, Eng. Geol., 243, 282–293, https://doi.org/10.1016/j.enggeo.2018.07.016, 2018.
Pertuz, T. and Malehmir, A.: Ultrahigh-resolution 9C seismic survey in a landslide prone area in southwest of Sweden, Geophys. J. Int., 235, 2094–2106, https://doi.org/10.1190/geo2021-0832.1, 2023.
Putiška, R., Kušnirák, D., Dostál, I., Lačný, A., Mojzesš, A., Hok, J., Pašteka, R., Krajnák, M., and Bošanský, M.: Integrated geophysical and geological investigations of karst structures in komberek, slovakia, J. Cave Karst Stud., 76, 155–163, https://doi.org/10.4311/2013ES0112, 2014.
Samyn, K., Mathieu, F., Bitri, A., Nachbaur, A., and Closset, L.: Integrated geophysical approach in assessing karst presence and sinkhole susceptibility along flood-protection dykes of the Loire River, Orléans, France, Eng. Geol., 183, 170–184, https://doi.org/10.1016/j.enggeo.2014.10.013, 2014.
Sevil, J., Gutiérrez, F., Zarroca, M., Desir, G., Carbonel, D., Guerrero, J., Linares, R., Roqué, C., and Fabregat, I.: Sinkhole investigation in an urban area by trenching in combination with GPR, ERT and high-precision leveling, Mantled evaporite karst of Zaragoza city, NE Spain, Eng. Geol., 231, 9–20, https://doi.org/10.1016/j.enggeo.2017.10.009, 2017.
Shenzhen Geology Writing Group: Shenzhen Geology, Geology Press, Beijing, People's Republic of China, ISBN 9787116060128, 2009 (in Chinese).
Shu, L. S., Jahn, B. M., Charvet, J., Santosh, M., Wang, B., Xu, X. S., and Jiang, S. Y.: Early Paleozoic Depositional Environment and Intraplate Tectono-Magmatism in the Cathaysia Block (South China): Evidence From Stratigraphic, Structural, Geochemical and Geochronological Investigations, Am. J. Sci., 314, 154–186, https://doi.org/10.2475/01.2014.05, 2014.
Song, K.-I., Cho, G.-C., and Chang, S.-B.: Identification, remediation, and analysis of karst sinkholes in the longest railroad tunnel in South Korea, Eng. Geol., 135–136, 92–105, https://doi.org/10.1016/j.enggeo.2012.02.018, 2012.
Stan-Kłeczek, I., Pierwoła, J., Marciniak, A., Sutkowska, K., and Tomaszewska, R.: Multimethod geophysical investigation in karst areas: case studies from Silesia, Poland, B. Eng. Geol. Environ., 81, 230, https://doi.org/10.1007/s10064-022-02726-8, 2022.
Sun, R., Kaslilar, A., and Juhlin, C.: High resolution seismic reflection PP and PS imaging of the bedrock surface below glacial deposits in Marsta, Sweden, J. Appl. Geophys., 198, 104572, https://doi.org/10.1016/j.jappgeo.2022.104572, 2022.
Wang, Y., Anderson, N., and Torgashov, E.: Condition Assessment of Building Foundation in Karst Terrain Using both Electrical Resistivity Tomography and Multi-channel Analysis Surface Wave Techniques, Geotechnical and Geological Engineering, 38, 1839–1855, https://doi.org/10.1007/s10706-019-01133-3, 2020.
Yilmaz, Ö.: Land seismic case studies for near-surface modeling and subsurface imaging, SEG Books, https://doi.org/10.1190/1.9781560803812, 2021.
Yordkayhun, S., Wattanasen, K., and Thungprue, N.: Geophysical investigation of the karst geosites in Satun UNESCO Global Geopark, Thailand: Implication for sinkhole hazard assessment, Geosci. J., 26, 249–266, https://doi.org/10.1007/s12303-021-0025-3, 2022.
- Abstract
- Introduction
- Geological setting and physical properties
- Data acquisition and geometry
- Data processing
- Synthetic modelling
- Results and discussion
- Conclusions
- Data availability
- Author contributions
- Competing interests
- Disclaimer
- Special issue statement
- Acknowledgements
- Financial support
- Review statement
- References