the Creative Commons Attribution 4.0 License.
the Creative Commons Attribution 4.0 License.
 | 24 Jan 2025
Luminescence and a new approach for detecting heat treatment of geuda sapphire
Teerarat Pluthametwisute
Lutz Nasdala
Chutimun Chanmuang N.
Manfred Wildner
Eugen Libowitzky
Gerald Giester
E. Gamini Zoysa
Chanenkant Jakkawanvibul
Waratchanok Suwanmanee
Tasnara Sripoonjan
Thanyaporn Tengchaisri
Bhuwadol Wanthanachaisaeng
Chakkaphan Sutthirat
For decades, unraveling the heat treatment of sapphire has been a challenging issue. The present study offers new aspects that support the detection of heat treatment of sapphire. Natural geuda sapphire exhibits orange to red luminescence under longwave ultraviolet (LWUV; 365 nm) light, while heated geuda sapphire shows blue luminescence under shortwave ultraviolet (SWUV; 225 nm) light. The presence of melt inclusions in dissolved silks serves as an indicator of sapphire heat treatment. Fourier-transform infrared (FTIR) spectroscopy alone is insufficient for distinguishing unheated from heated sapphire. By combining orange to red luminescence with blue luminescence and melt inclusions, we provide a practical method for accurately differentiating natural gem-quality sapphire and heated gem-quality sapphire.
- Article
(10675 KB) - Full-text XML
- BibTeX
- EndNote


Since the 1970s, Sri Lanka has been renowned for its gemstone resources, particularly geuda sapphire, a milky or silky corundum variety that is frequently heat-treated to enhance color and clarity (Ediriweera and Perera, 1989; Perera et al., 1991; Soysa and Fernando, 1992). High-temperature treatment of corundum (including ruby and sapphire) can significantly alter its milkiness, asterism, color, and internal features such as mineral inclusions (Nassau, 1981; Ediriweera and Perera, 1989; Hughes, 1997, 2017; Kyi et al., 1999; Pisutha-Arnond, 2017; Themelis, 2018). Key factors in these transformations include the temperature, duration, and atmospheric conditions of the heating process (Nassau, 1981; Emmett and Douthit, 1993; Peiris, 1993; Emmett et al., 2003; Hughes, 2017; Pisutha-Arnond, 2017; Soonthorntantikul et al., 2019).
One of the first-rank challenges encountered by gemologists nowadays is the precise and reliable identification of heat-treated ruby and sapphire. Blue luminescence under shortwave ultraviolet (SWUV) light, observed in heated sapphire for over 50 years (Crowningshield, 1966, 1970), can extend into the green region (Nassau, 1981) and has been extensively studied (Evans, 1994; Wong et al., 1995a, b; Hughes, 1997; McClure and Smith, 2000; Page et al., 2010; Alombert-Goget et al., 2016a; Alombert-Goget et al., 2016b; Hughes, 2017; Vigier et al., 2021a, b, 2023). This luminescence may relate to rutile inclusions commonly found in natural blue sapphire (Hughes, 2017). During heating at around 1600 °C, rutile decomposes, incorporating Ti4+ ions into the sapphire structure (Sutthirat et al., 2006). Blue luminescence serves as a key indicator of heat treatment in sapphire (Crowningshield, 1966; McClure and Smith, 2000; Hughes, 2017; Hughes and Perkins, 2019). However, changes in original brown silk inclusions and orange luminescence in natural unheated sapphire, relative to blue luminescence in heated sapphire, have not been thoroughly explored. The present study provides a novel approach by observing the transformations in silk inclusions and luminescence in sapphire before and after heating.
Natural unheated geuda sapphire (A-type) samples (as described by Vertriest et al., 2019) were separated based on the appearance of silk inclusions into three distinctive groups, i.e., high-density-silk (HS), low-density-silk (LS), and silk-free (SF) specimens (Fig. 1). Using an Enraf-Nonius Kappa single-crystal X-ray diffractometer with a charge-coupled device (CCD) area detector, these samples were oriented (based on 10 frames at a crystal detector distance of 35 mm), cut, and polished into wafers with surfaces parallel to the c axis. For chemical analysis using an electron probe micro-analyzer (EPMA) system, slabs were coated with carbon for conductivity.
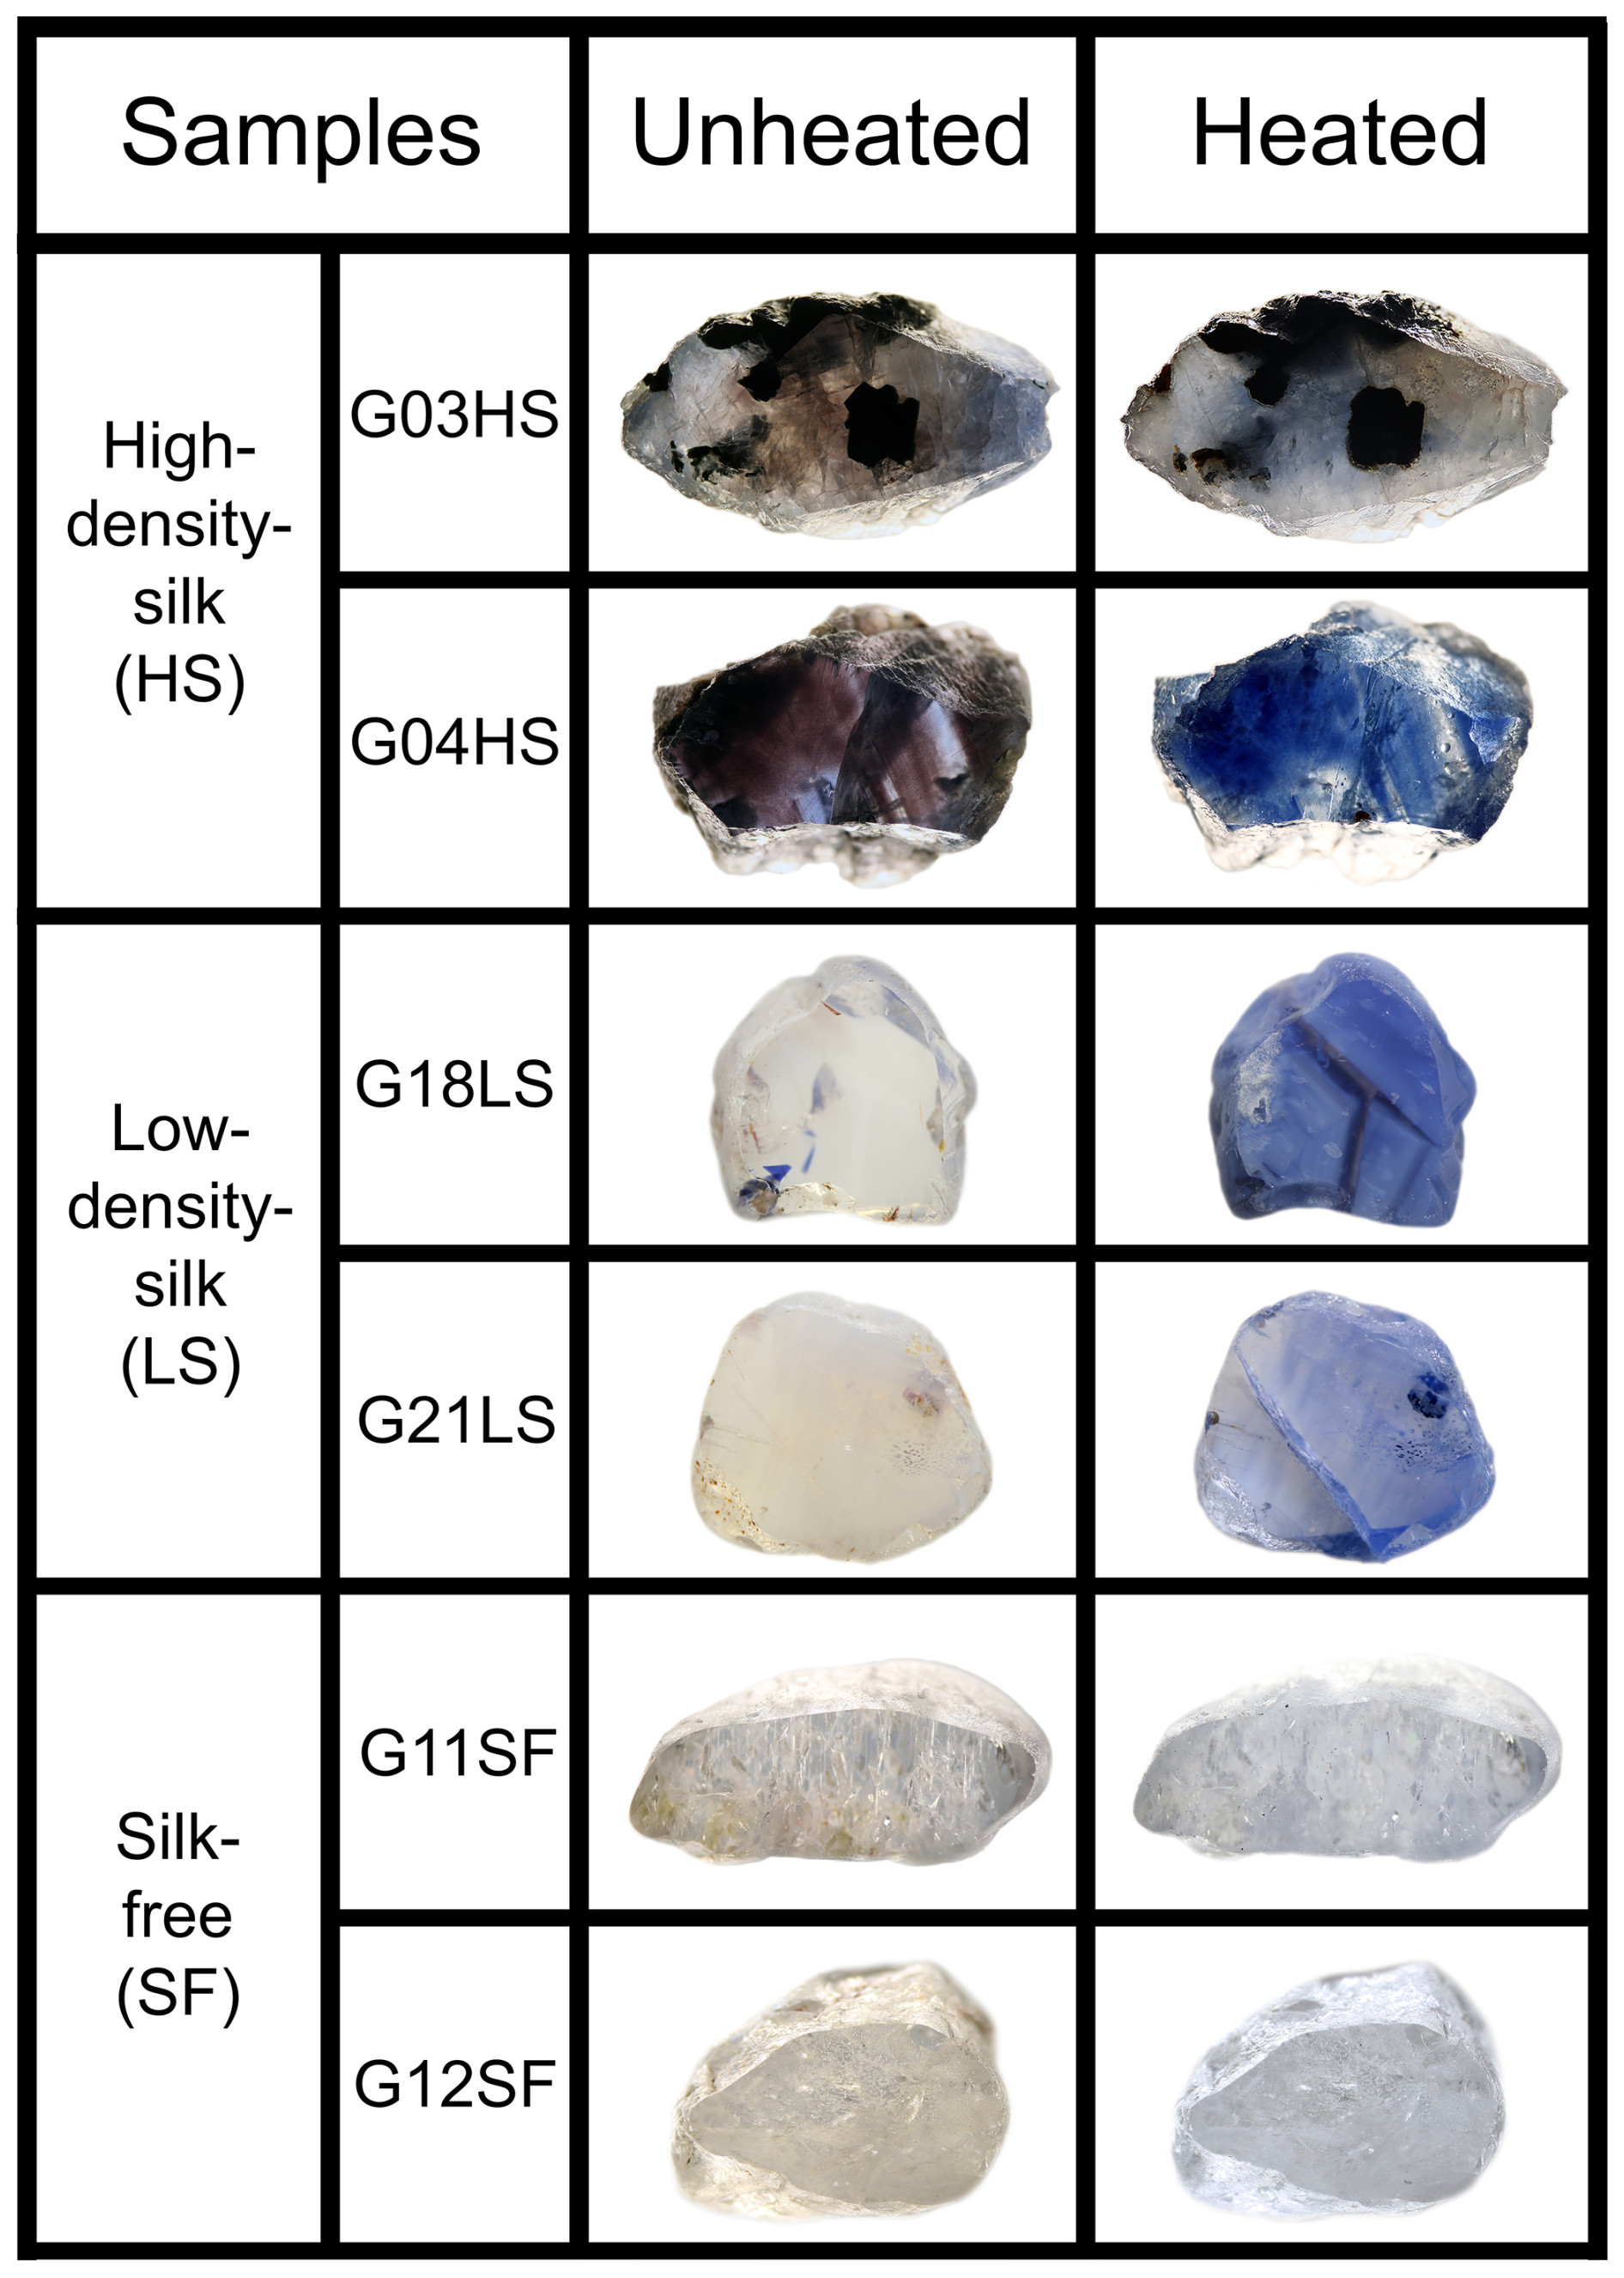
Figure 1Representatives of natural unheated geuda sapphire samples within three separate groups, i.e., HS (G03HS, G04HS), LS (G18LS, G21LS), and SF (G11SF, G12SF) groups, and their appearances after heating. Sizes of stones range between 4 and 12 mm.
Heating experiments were conducted using a high-temperature electric furnace, Linn HT-1800-Vac. Heating was performed under ambient atmospheric conditions without any additional oxygen buffer. Experimental conditions involved the maximum temperature of 1650 °C, which was maintained for 10 h prior to natural cooling down in the furnace. A heating rate of 300 °C per hour was set to reach the maximum temperature. To minimize surface contamination, the samples were placed into a highly purified alumina (Al2O3) crucible.
The refractive index of samples was measured by a gemological refractometer (Krüss, model ER605) with 1.81 refractive index liquid. Specific gravity was determined by a hydrostatic weighing balance by weighing samples in water (with a drop of dishwashing detergent added to reduce surface tension) and in air.
Micro-inclusions in all samples were imaged using an Olympus BX series microscope equipped with an Olympus DP27 digital camera. The camera was operated using the Olympus Stream micro-imaging software. Raman spectra of inclusions were acquired using a confocal Raman spectrometer, HORIBA Jobin Yvon LabRAM HR Evolution. Using 473 nm laser excitation (15 mW at the sample) and a 50×/0.50 objective lens, a spectral range of 100–1350 cm−1 Raman shift was recorded. Wavenumber calibration was done using the Rayleigh line, resulting in a wavenumber accuracy of better than 0.5 cm−1. A spectral resolution of ca. 1.2 cm−1 resulted from 800 mm focal length and an 1800 grooves mm−1 optical grating in the monochromator system. For more details, see Zeug et al. (2018).
Chemical compositions of the samples were determined using a JEOL JXA-8100 EPMA. Analytical conditions were set to 15 kV accelerating voltage and a probe current of about 2.5 × 10⁻⁸ A with an electron beam focused to < 1 µm. Natural mineral and synthetic oxide references were suitably selected for calibration, including fayalite (Fe2SiO4) for Fe, wollastonite (CaSiO3) for Ca, synthetic corundum (Al2O3) for Al, synthetic periclase (MgO) for Mg, synthetic quartz (SiO2) for Si, potassium titanyl phosphate (KTiOPO4) for K and Ti, synthetic manganosite (MnO) for Mn, synthetic eskolaite (Cr2O3) for Cr, synthetic gadolinium gallium garnet (Gd3Ga5O12) for Ga, and synthetic lead vanadium germanium oxide for V. The counting times were 600 s peak and 300 s background for all elements. The K-α line was analyzed for all elements except for Ga, where the L-α line was measured. Analytical crystals were appropriately selected, including thallium acid phthalate (TAP) crystal for Si and Al; pentaerythriol (PET) crystal for Ti, Mg, K, and Ca; and lithium fluoride (LIF) crystal for V, Cr, Ga, Fe, and Mn. The detection limit (estimated from 3-fold background noise) is approximated at 0.005 wt % or 50 ppm. Three spots in each sample were analyzed.
Polarized optical absorption (also referred to as UV–Vis–NIR) spectra of samples were recorded on double-sided polished crystal slabs in the spectral range of 35 000–3500 cm−1, covering the near-ultraviolet (UV), visible (Vis), and near-infrared (NIR) ranges. The measurements were performed in the sample chamber of a Bruker VERTEX 80 Fourier-transform infrared (FTIR) spectrometer at 2 mm measuring spot, using a calcite Glan-prism polarizer and appropriate combinations of light sources (Xe or W lamp), beam splitters (CaF2-Vis/UV or CaF2-NIR), and detectors (GaP, Si, or InGaAs diodes) to cover the desired spectral range. Hence, each full spectrum was combined from three partial spectra: (1) 35 000–18 000 cm−1 with 40 cm−1 spectral resolution and averaged from 256 scans, (2) 18 000–9500 cm−1 with 20 cm−1 resolution and 256 scans, and (3) 9500–3500 cm−1 with 10 cm−1 resolution and 128 scans.
Fourier-transform infrared spectra were acquired by means of a Bruker Tensor 27 FTIR spectrometer attached to a Bruker HYPERION microscope in the spectral range from 4000 cm−1 to 1600 cm−1. A globar light source, a KBr beam splitter, and a deuterated L-alanine doped triglycene sulfate (DLATGS; Tensor 27) or mercury cadmium telluride (MCT) detector (HYPERION) were employed. The spectral resolution was 4 cm−1, and the sample and reference spectra were averaged from 128 scans.
Luminescence phenomena were observed and photo-captured both before and after heat treatment. The images were obtained under longwave ultraviolet (LWUV) illumination using a ZEISS Stemi 508 microscope with 0.63× magnification. The images were captured in a darkened room using a Canon digital single-lens reflex (DSLR) EOS 80D camera (24.2 MP resolution), which was mounted on top of the microscope. The Superfire S11-UV (365 nm) mini flashlight, 3W (max), DC 3.7 V, was held approx. 15 cm above the samples. The camera settings involved an exposure time of 5 s, an exposure bias of 0 steps, and an ISO speed of 200. The aperture was adjusted to , with a focal length of 0 nm. For SWUV illumination (approximately 225 nm), a DiamondView™ device was used. The parameter settings for DiamondView™ were established as follows: integration duration, 2.83 s; minimum excitation status, off. Power settings ranged from 50 % to 80 %, contingent upon the intensity of luminescence. A gain of 13.85 dB was measured. The aperture was set to 80 %, and the field stop was set to 67 %. Gamma was disabled. Photoluminescence (PL) spectra in the visible and near-infrared ranges were acquired using a confocal HORIBA Jobin Yvon LabRAM HR 800 spectrometer. Spectra were excited using the 325 nm emission of an He–Cd laser (ca. 10 mW at the sample surface). The system was calibrated using emission lines of a Kr lamp. The spectral resolution was in the range of 0.07 nm (violet) to 0.02 nm (NIR range). All the spectra were acquired at the same position both before and after heating experiments.
3.1 Heating-induced property changes and alteration
Representatives of natural unheated and their heated counterparts of all groups are shown in Fig. 1. All the samples ranged from a specific gravity of 3.83 to 4.08 and refractive indices of 1.760 to 1.770, falling well within the range of corundum properties. Before heating, samples showed varying natural appearances based on inclusion density. Geuda samples with HS inclusions (e.g., G03HS and G04HS; Fig. 1) exhibited brown-silk and brown-color banding or zoning, while a few samples also displayed a natural blue color. Samples with LS inclusions (e.g., G18LS and G21LS; Fig. 1) generally appeared milky with yellowish or brownish tints. After heating, most samples turned blue, ranging from pale to dark shades, with the milky appearance and yellowish or brownish tints significantly reduced. On the other hand, the SF group usually showed a slightly yellowish appearance (Fig. 1; samples G11SF and G12SF). After the heating experiment, they had changed slightly to a very pale blue color.
3.2 Mineral chemistry
Chemical compositions of samples in the three distinct groups are summarized in Tables 1 to 3. The Al2O3 contents range between 98.2 wt % and 99.5 wt %. Other elements are found as trace contents only, particularly Fe, Ti, and Ga. Fe and Ti are essential coloring elements in sapphire. The HS group contained the highest Fe contents of 0.32 wt %–0.36 wt % FeO, together with 0.02 wt %–0.04 wt % TiO2 and < 0.7 wt % Ga2O3. The LS group had a high Ti content of 0.02 wt %–0.51 wt % TiO2 with ≤ 0.06 wt % FeO and ≤ 0.8 wt % Ga2O3. The SF group contained 0.06 wt %–0.26 wt % FeO, ≤ 0.04 wt % TiO2, and < 1 wt % Ga2O3.
Table 1Representative chemical compositions (EPMA results) and calculated mineral formulae of HS sapphire samples.
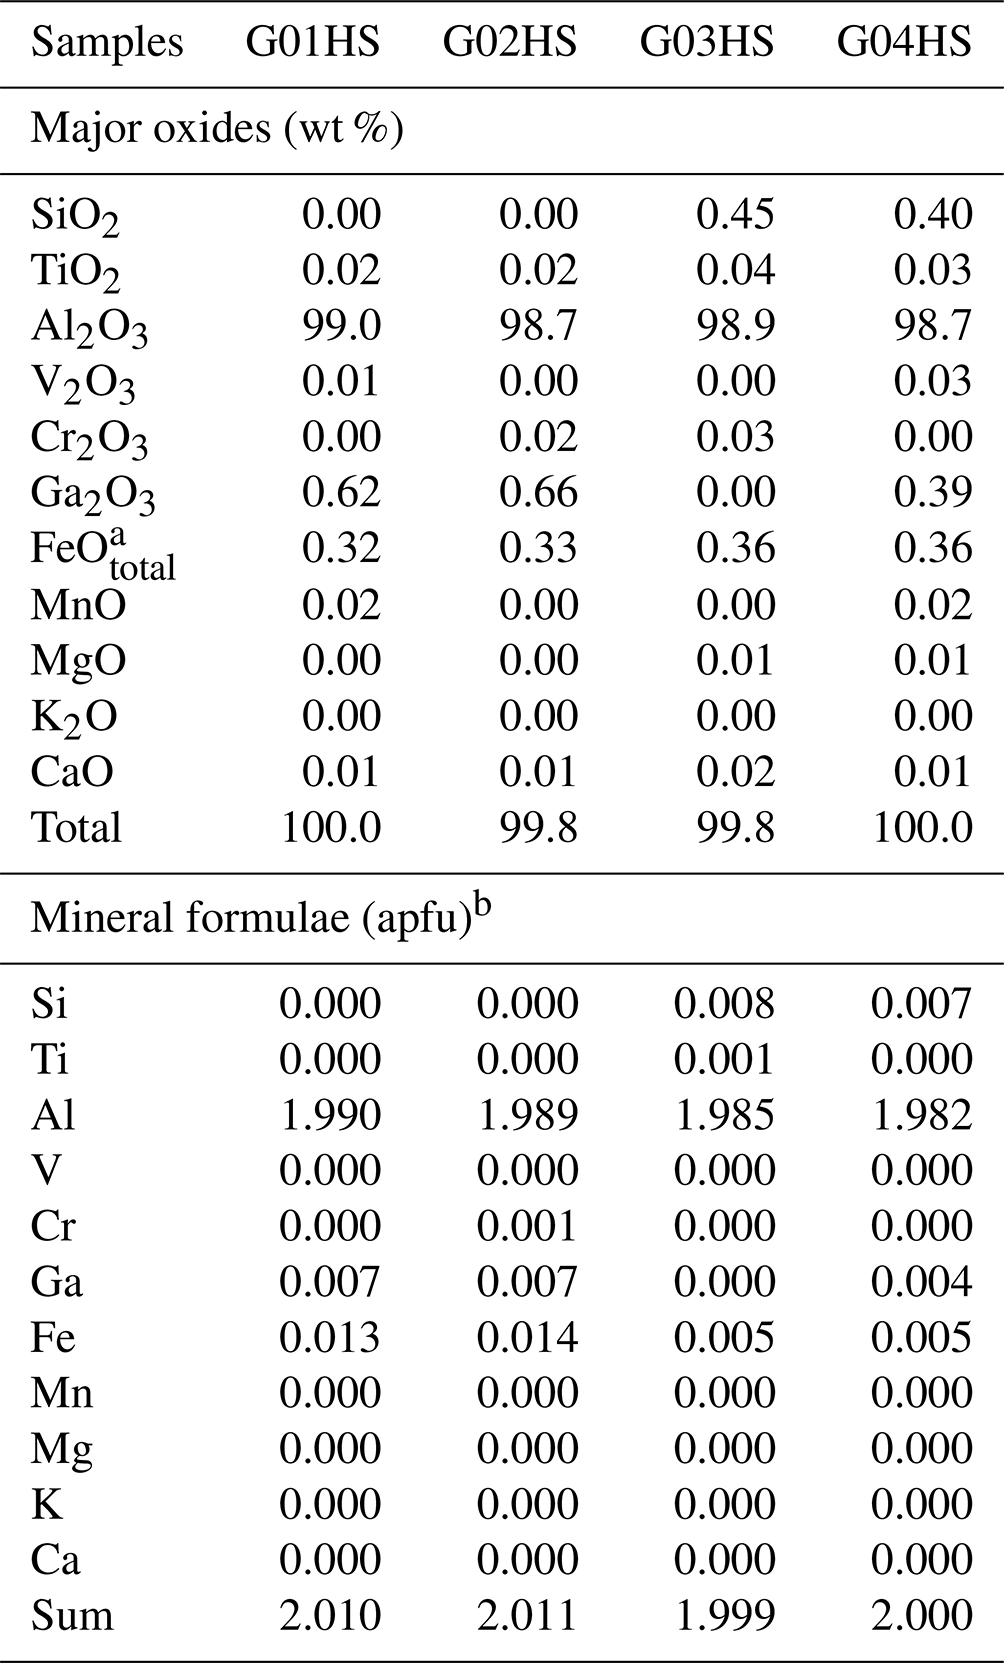
a FeOtotal: total Fe oxide, assuming all Fe to be ferrous. b Calculated based on three O atoms per formula unit.
Table 2Representative chemical compositions (EPMA results) and calculated mineral formulae of LS sapphire samples.
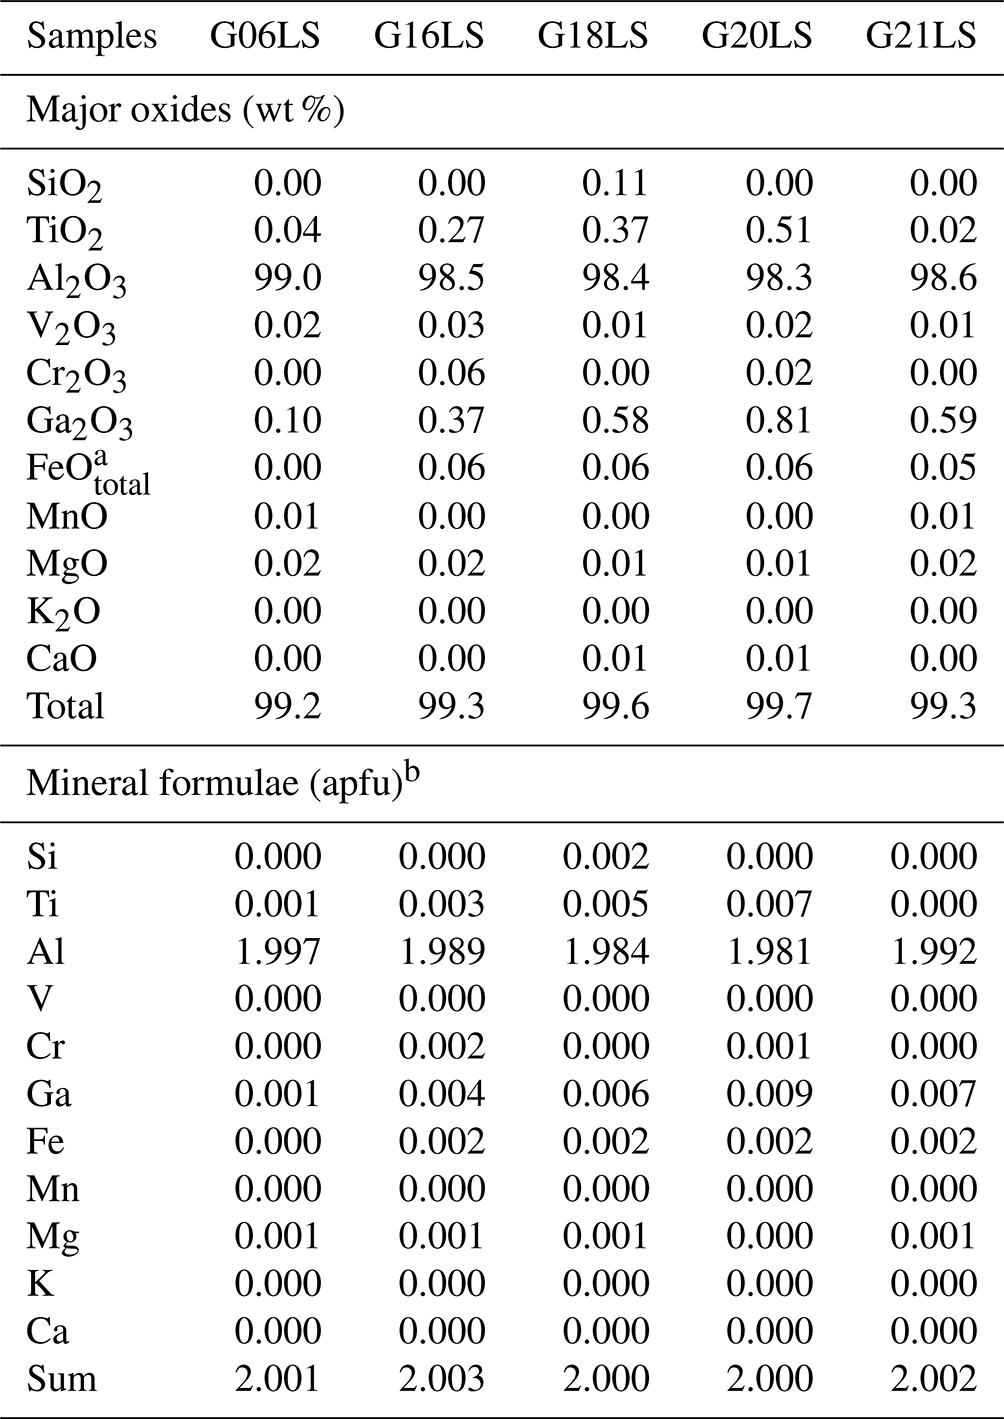
a FeOtotal: total Fe oxide, assuming all Fe to be ferrous. b Calculated based on three O atoms per formula unit.
Table 3Representative chemical compositions (EPMA results) and calculated mineral formulae of SF sapphire samples.
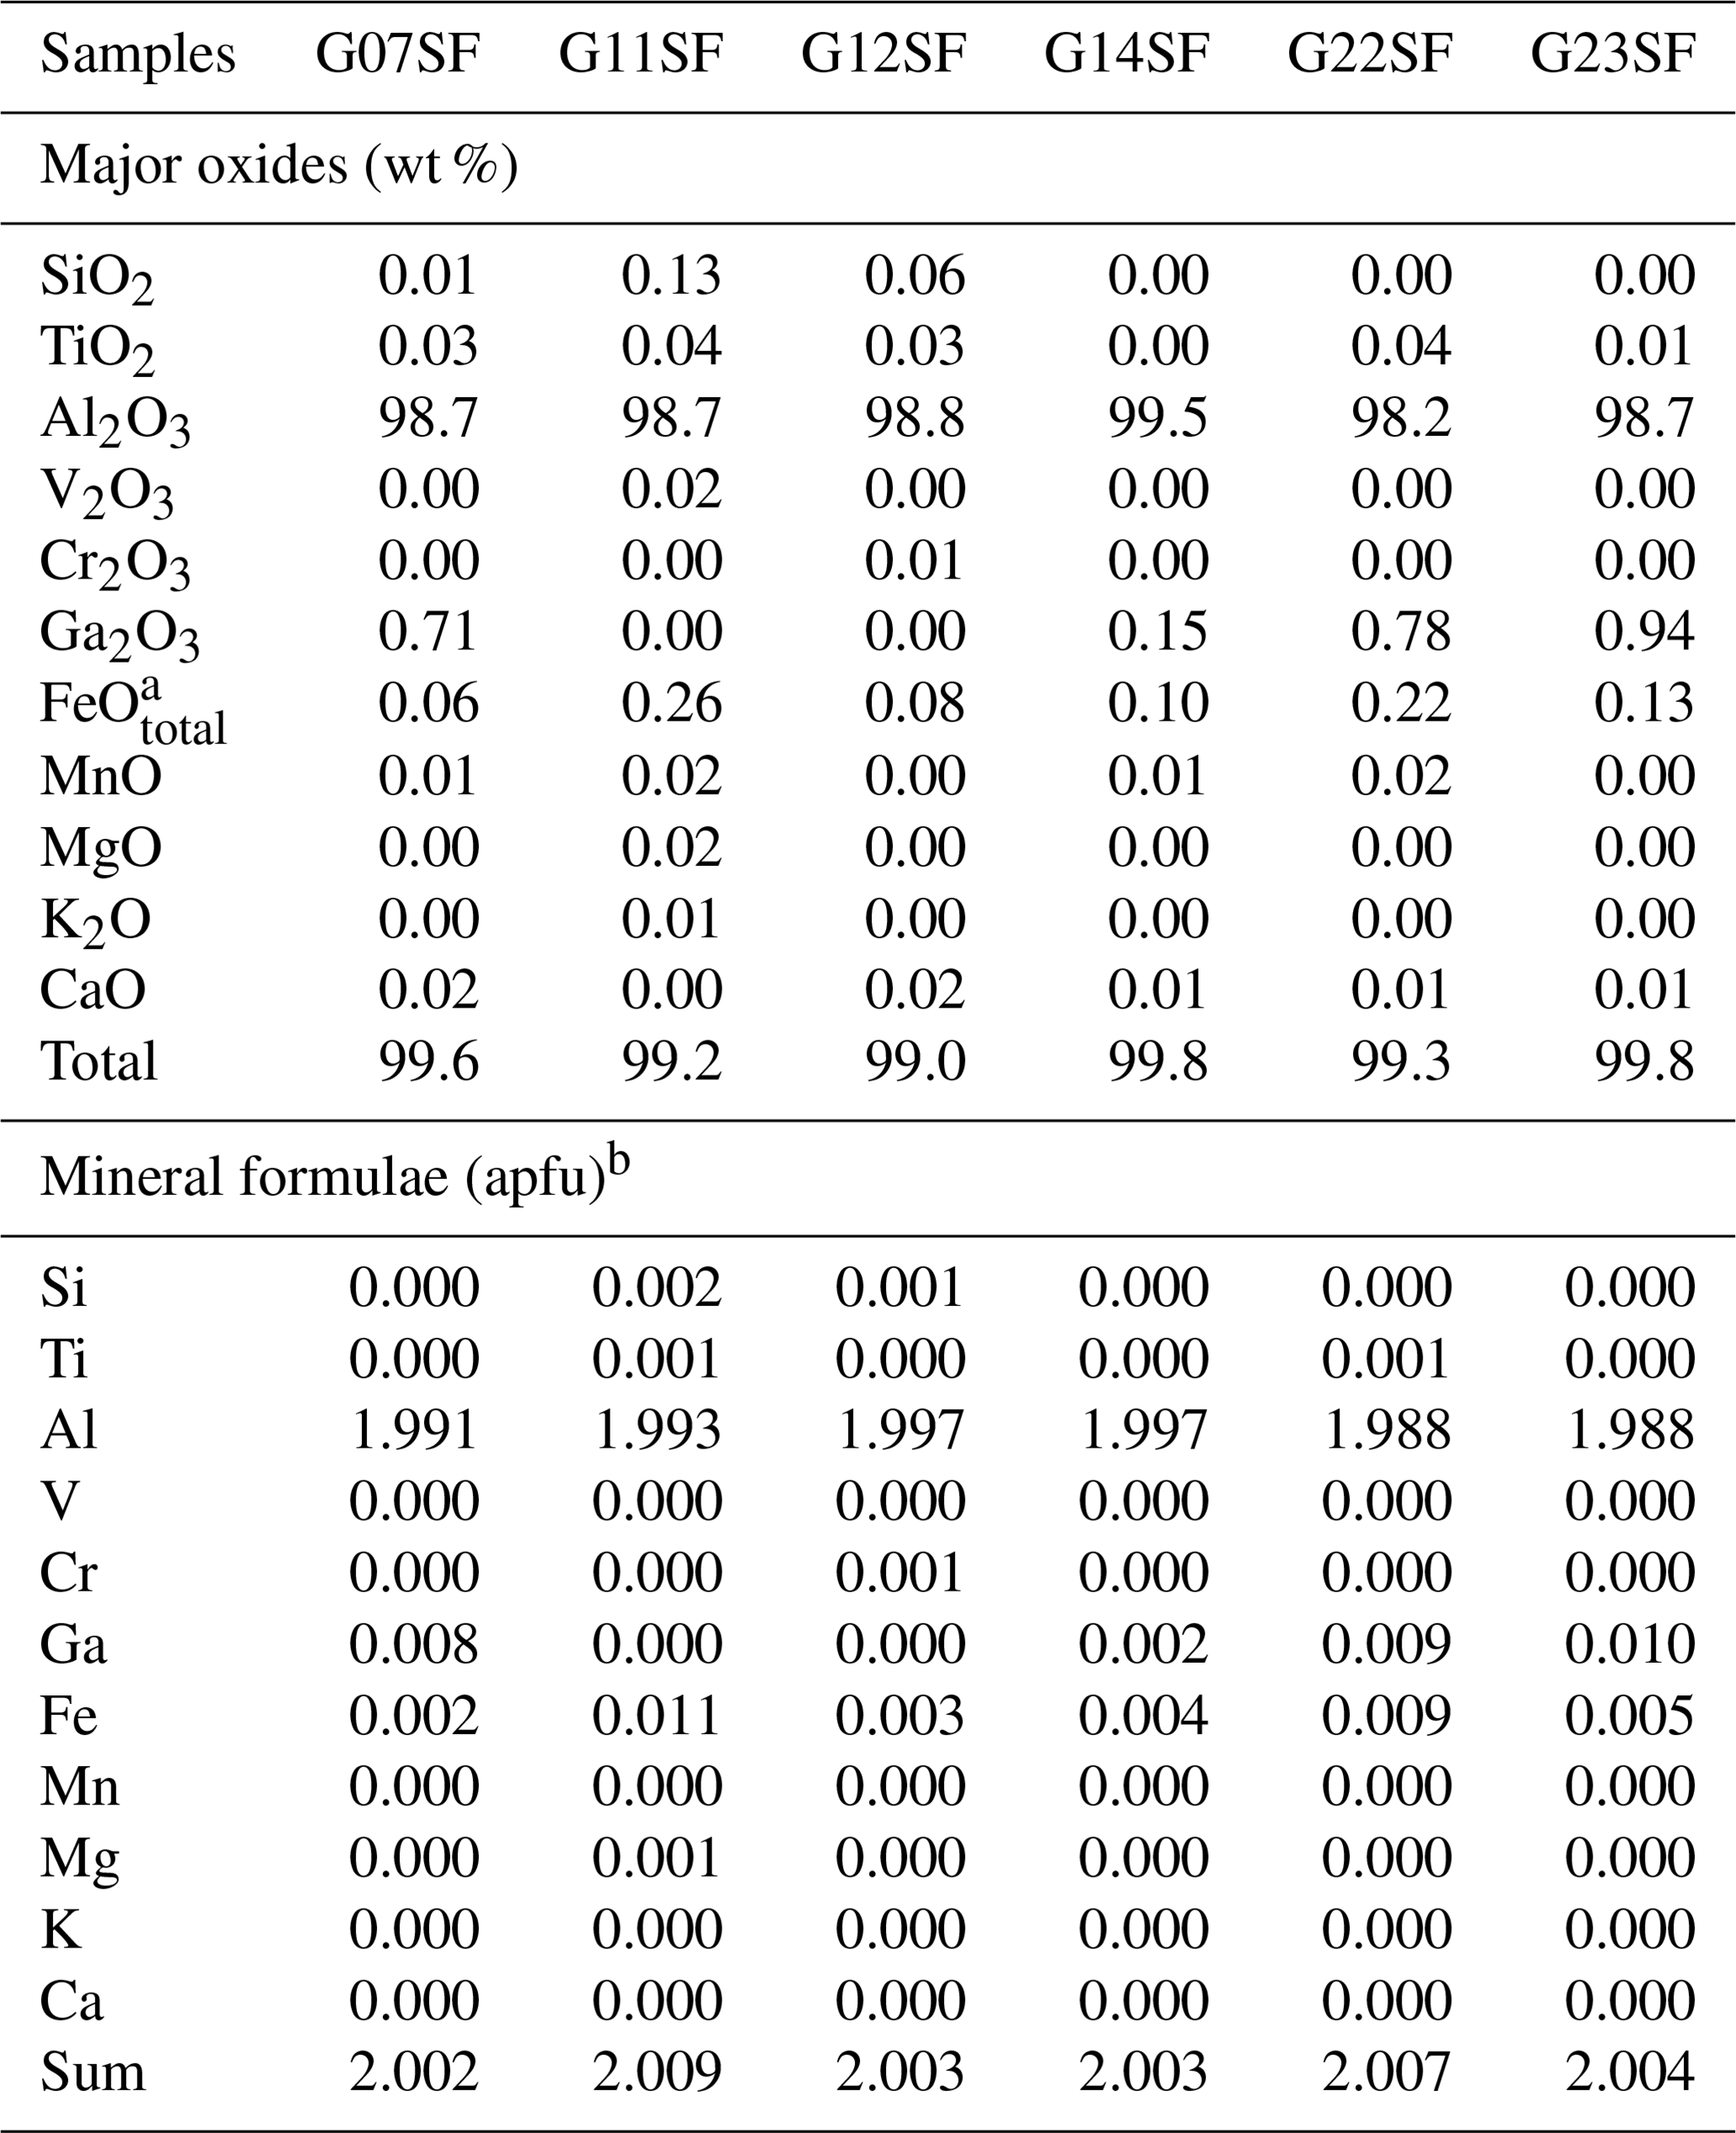
a FeOtotal: total Fe oxide, assuming all Fe to be ferrous. b Calculated based on three O atoms per formula unit.
3.3 Microscopic features
Negative crystals, with or without CO2 gas bubbles, were commonly observed alongside mineral inclusions, such as oligoclase feldspar, calcite, and muscovite, in these sapphire samples. Brown silk inclusions were prominent in both HS and LS groups, as shown in Fig. 2 (G22SF, G18LS, and G04HS for Fig. 2a, b–c, and d–f, respectively). Micro-Raman spectroscopy was used to identify CO2 and mineral inclusions. Although brown silk inclusions, typically needle-shaped and aligned with color banding (Fig. 3a), were often less than 1 µm in diameter and difficult to identify, irregular or flaky platelet forms (Fig. 3c) were also noted.
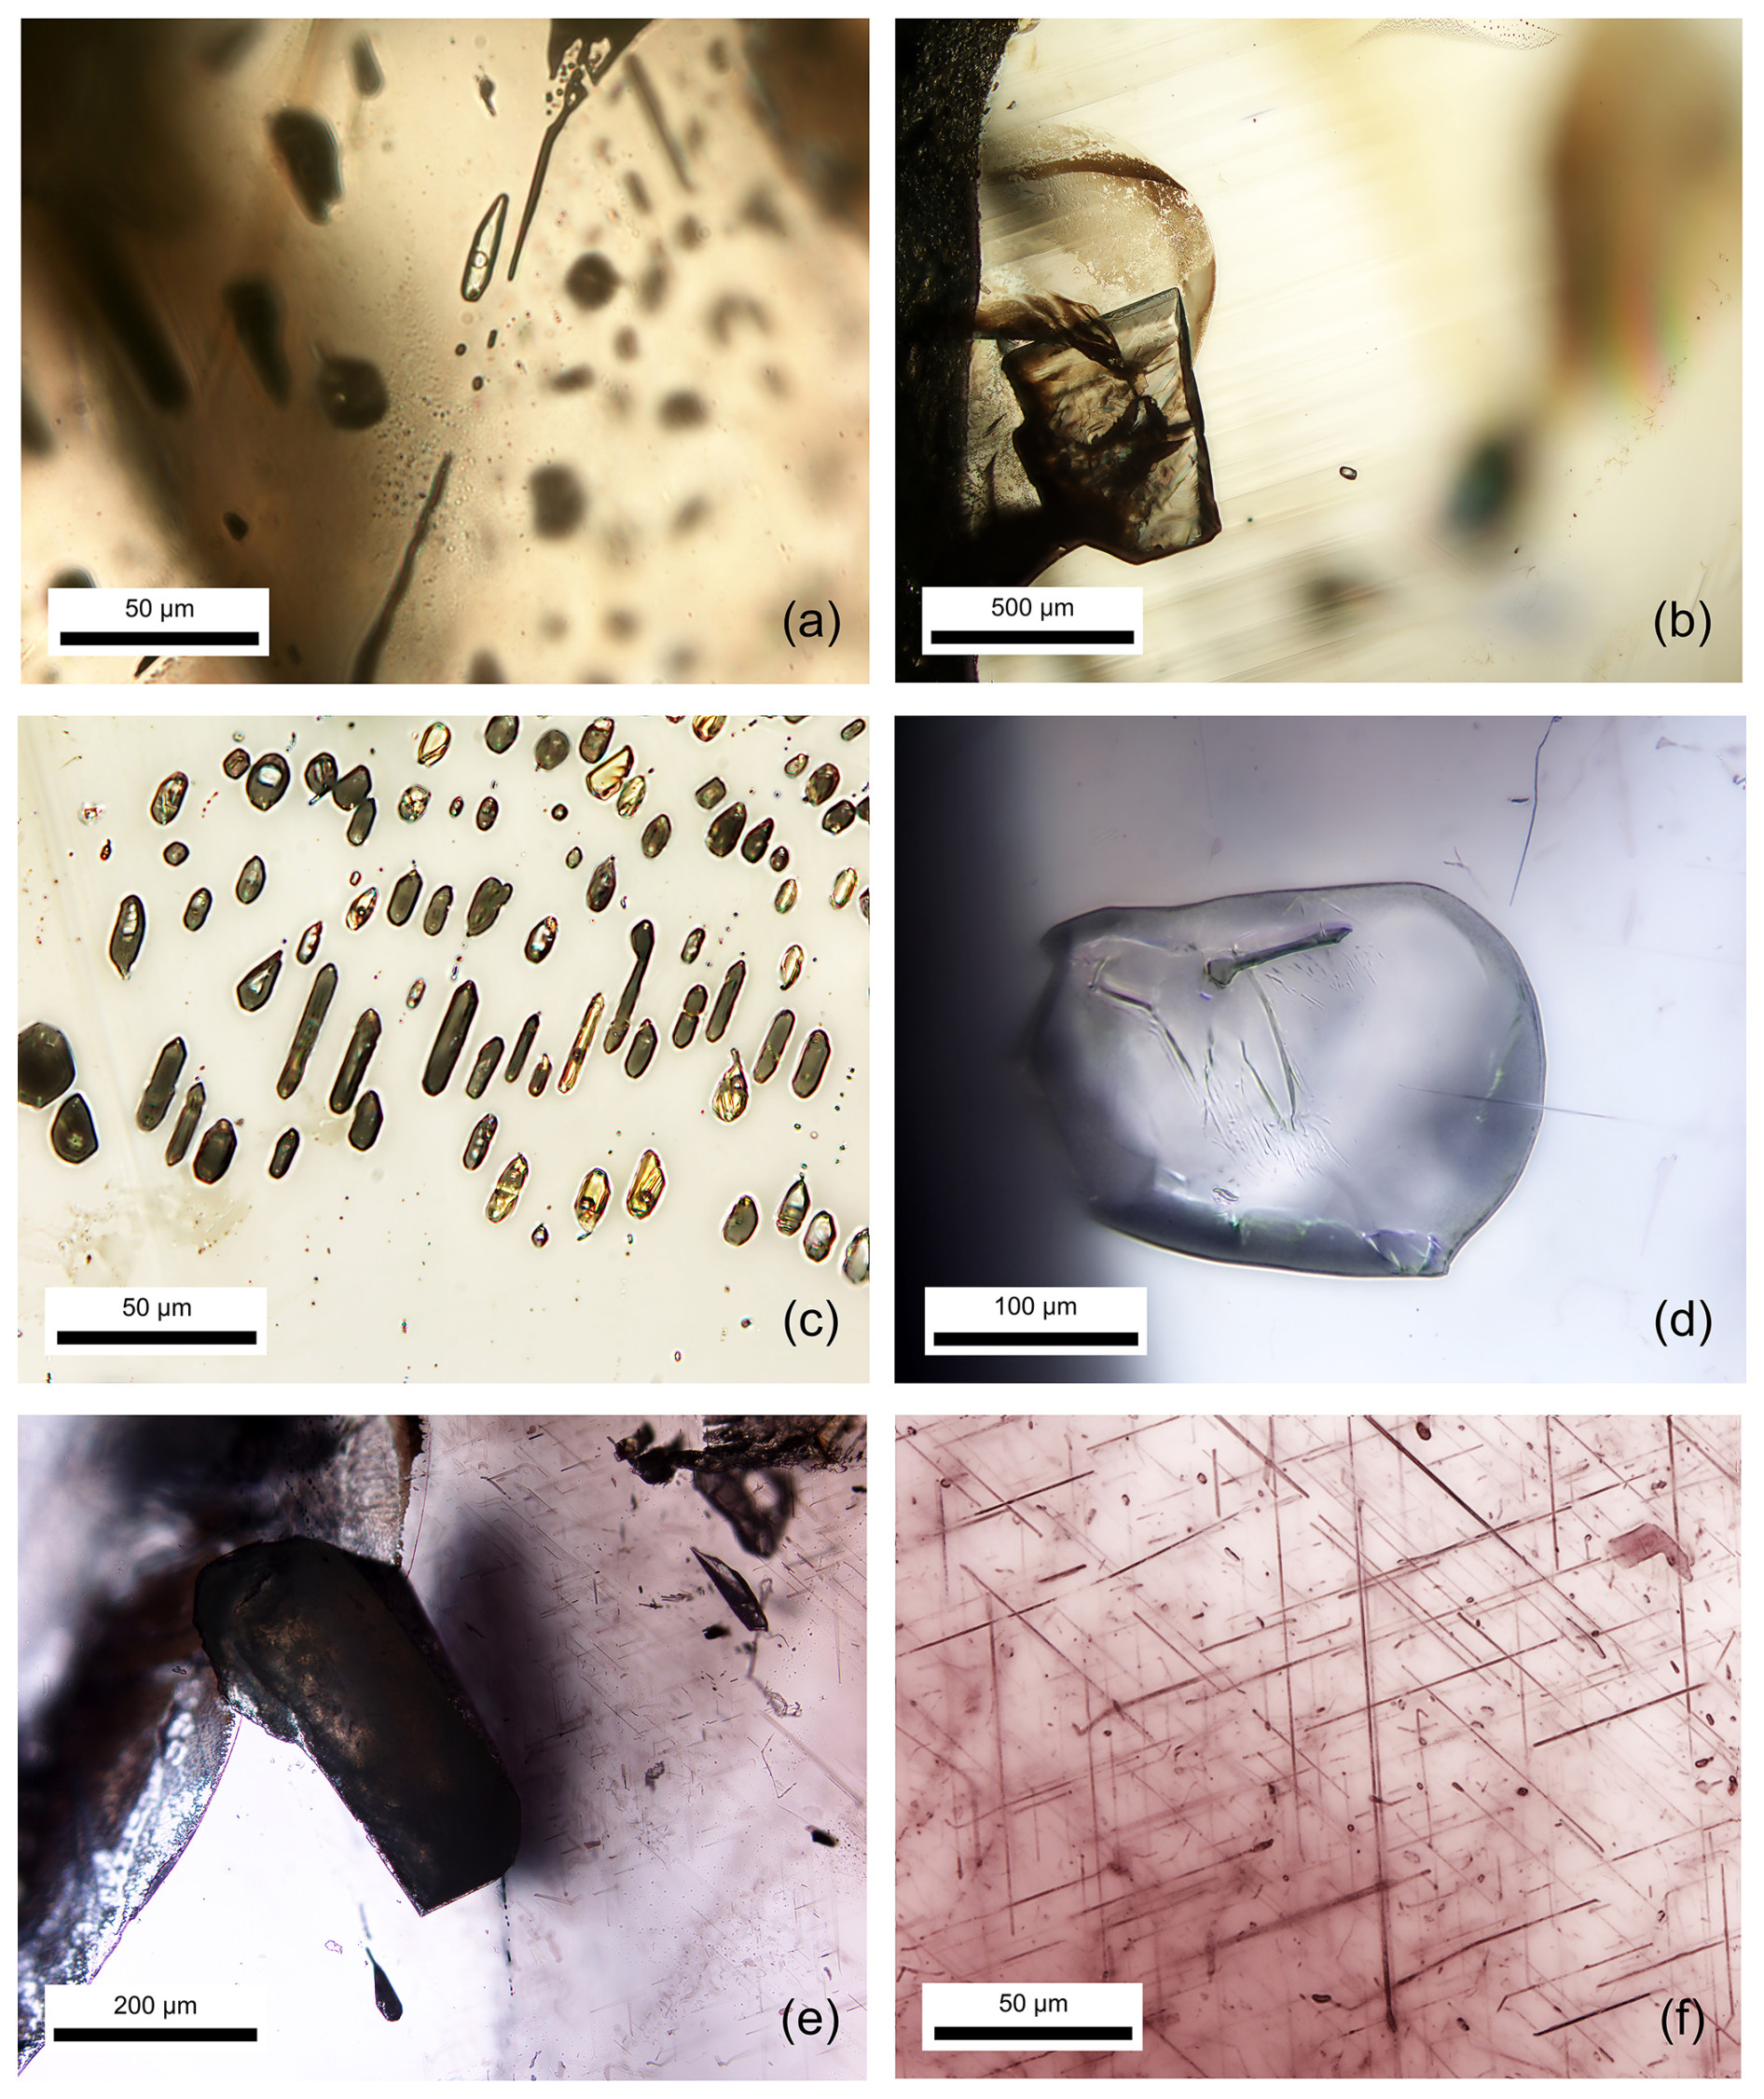
Figure 2Transmitted-light photomicrographs of inclusions, including CO2-containing negative crystals (a), calcite (b), a cluster of negative crystals (c), oligoclase (d), muscovite (e), and brown silks (f), in natural unheated sapphire.
After high-temperature heating, molten surfaces (Fig. 3e) and decomposed crystal inclusions were commonly observed in these samples. The most notable alteration was also detected in the initial area of brown silks (Fig. 3a), which exhibited distinct bluish color banding/zoning (Fig. 3b) after heating.
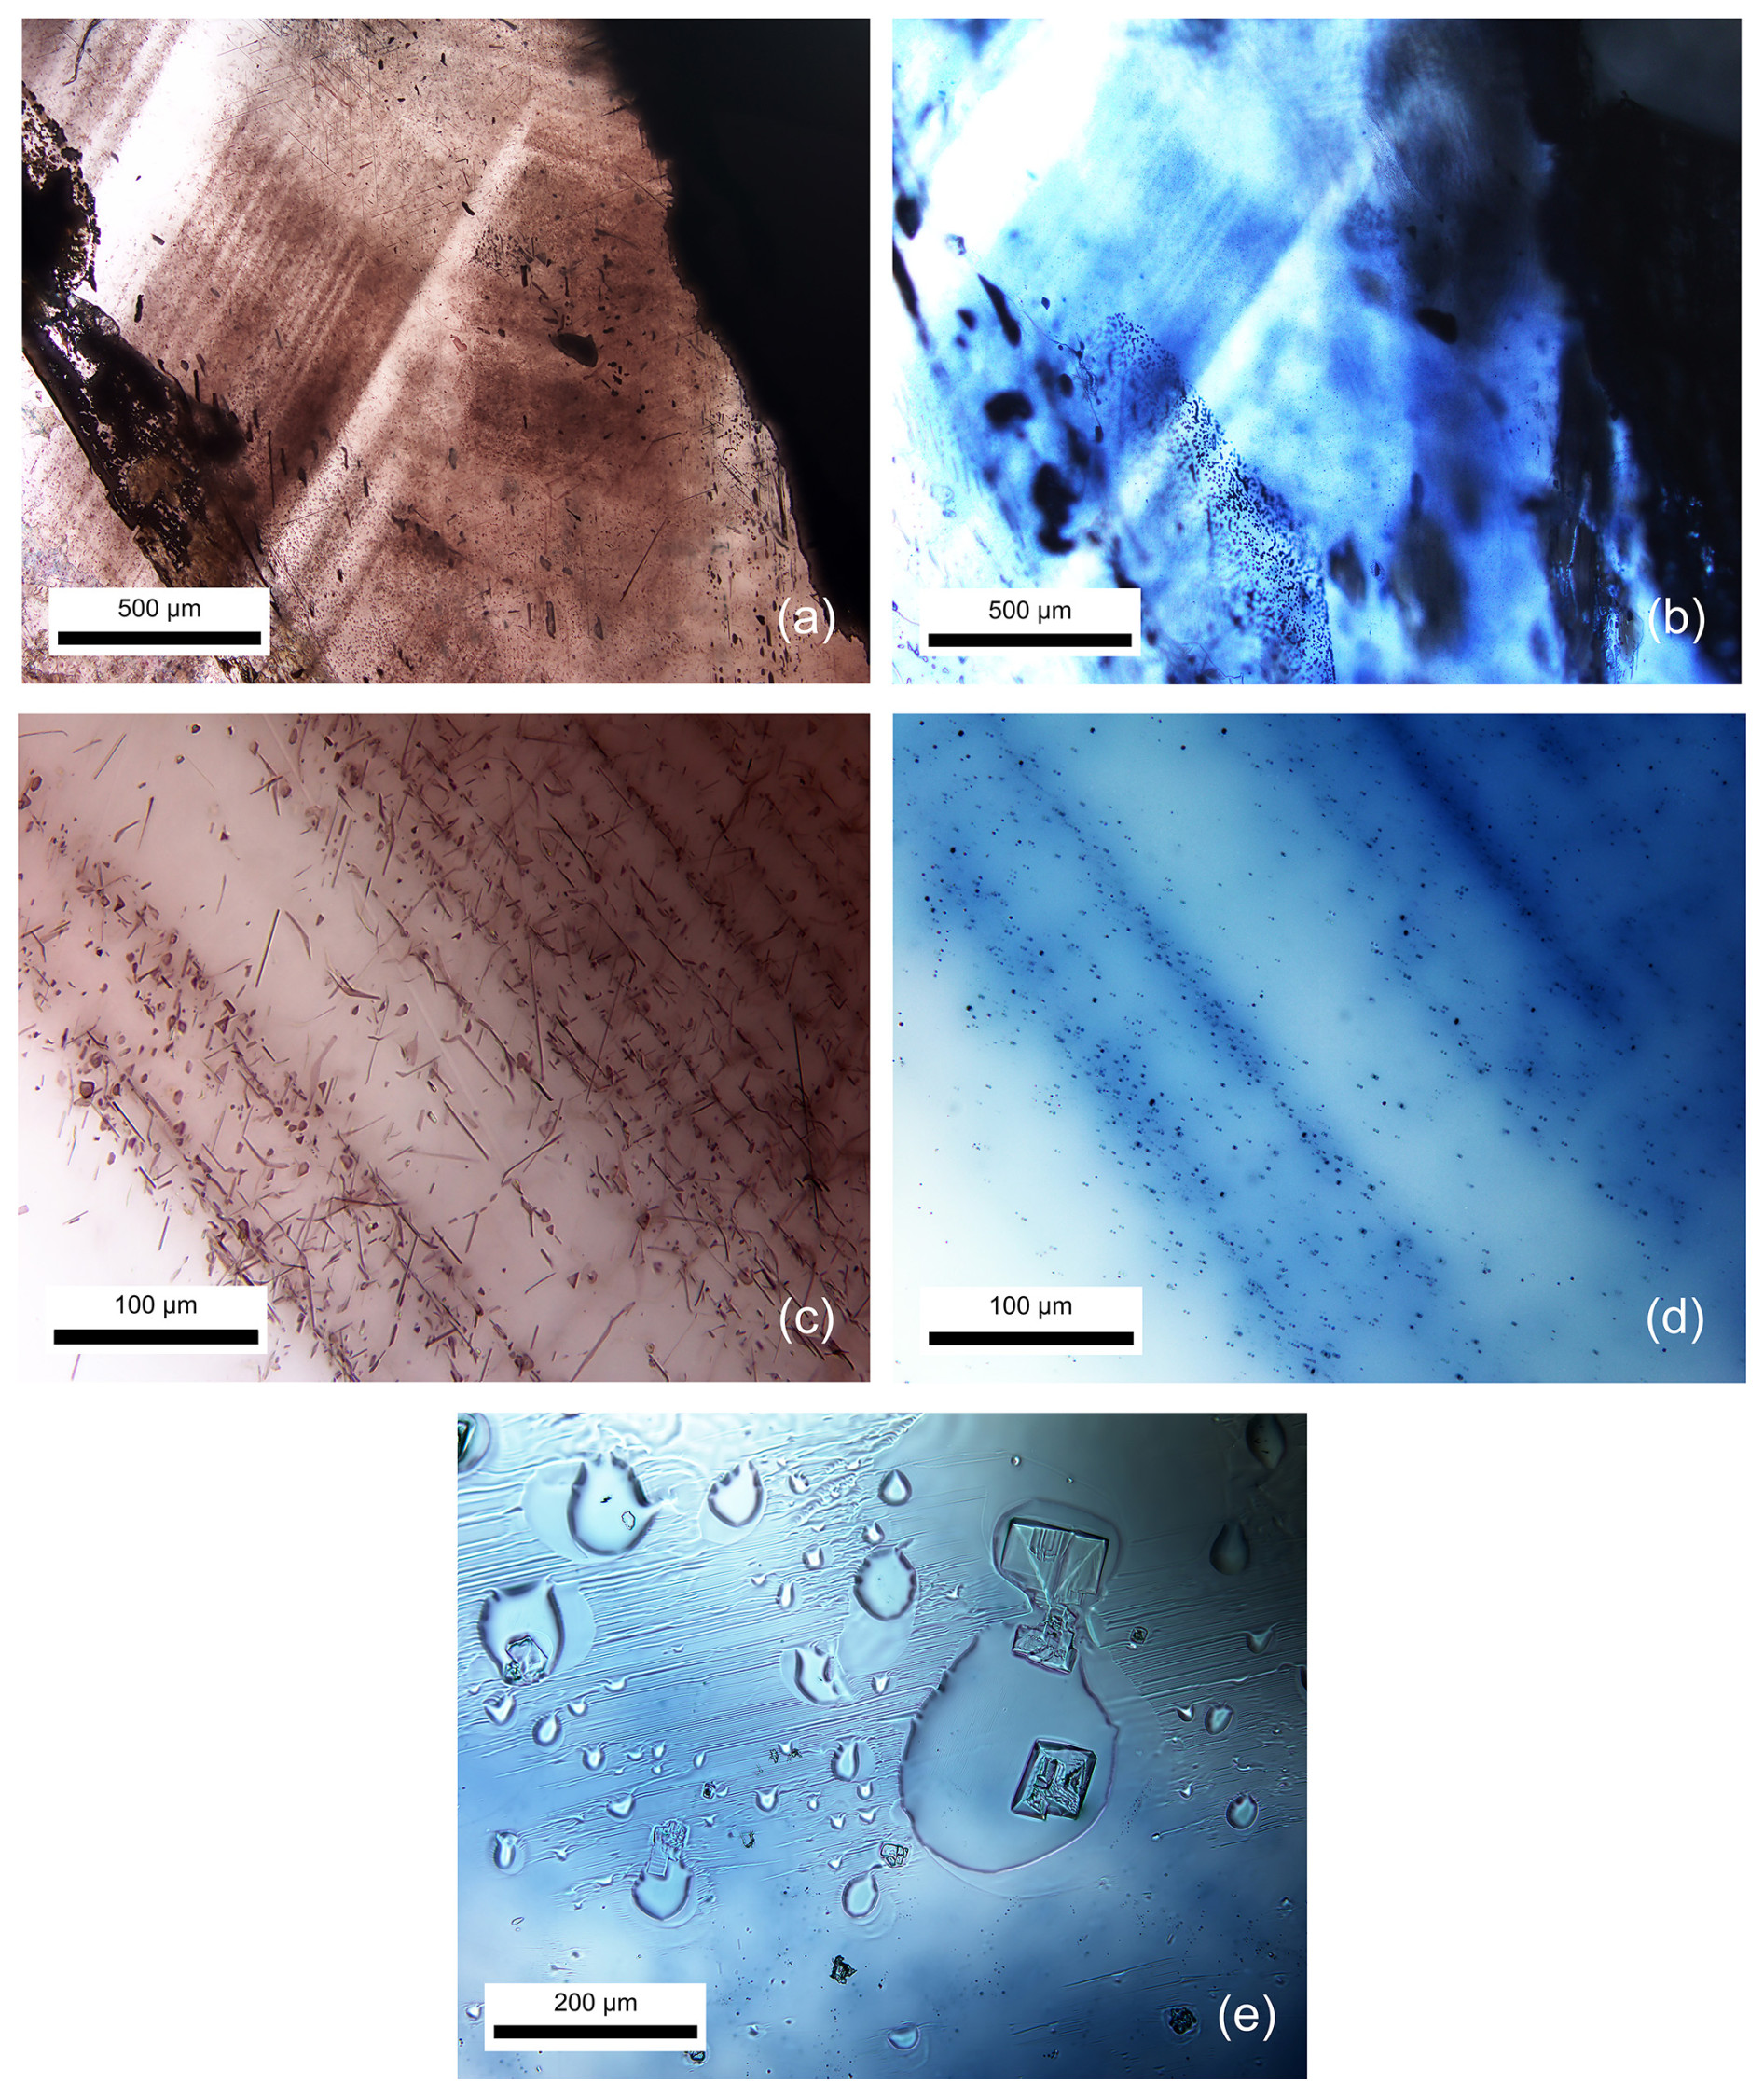
Figure 3Transmitted-light photomicrographs showing that brown banding (a) with irregular platy brownish flakes and tiny needles (c) in natural unheated sapphire sample G04HS turned into blue color banding (b) with blue dots (d) upon heating. A melted surface (e) was also observed after heat treatment.
The brown silks (Fig. 3c) experienced a transformation upon heating into blue dots (Fig. 3d). Additionally, melt inclusions among blue dots were likely developed by the melting of brown silks of the sapphire host, which have never been reported elsewhere, becoming significantly noticeable and useful for indicating the heat treatment of sapphire (Fig. 4).
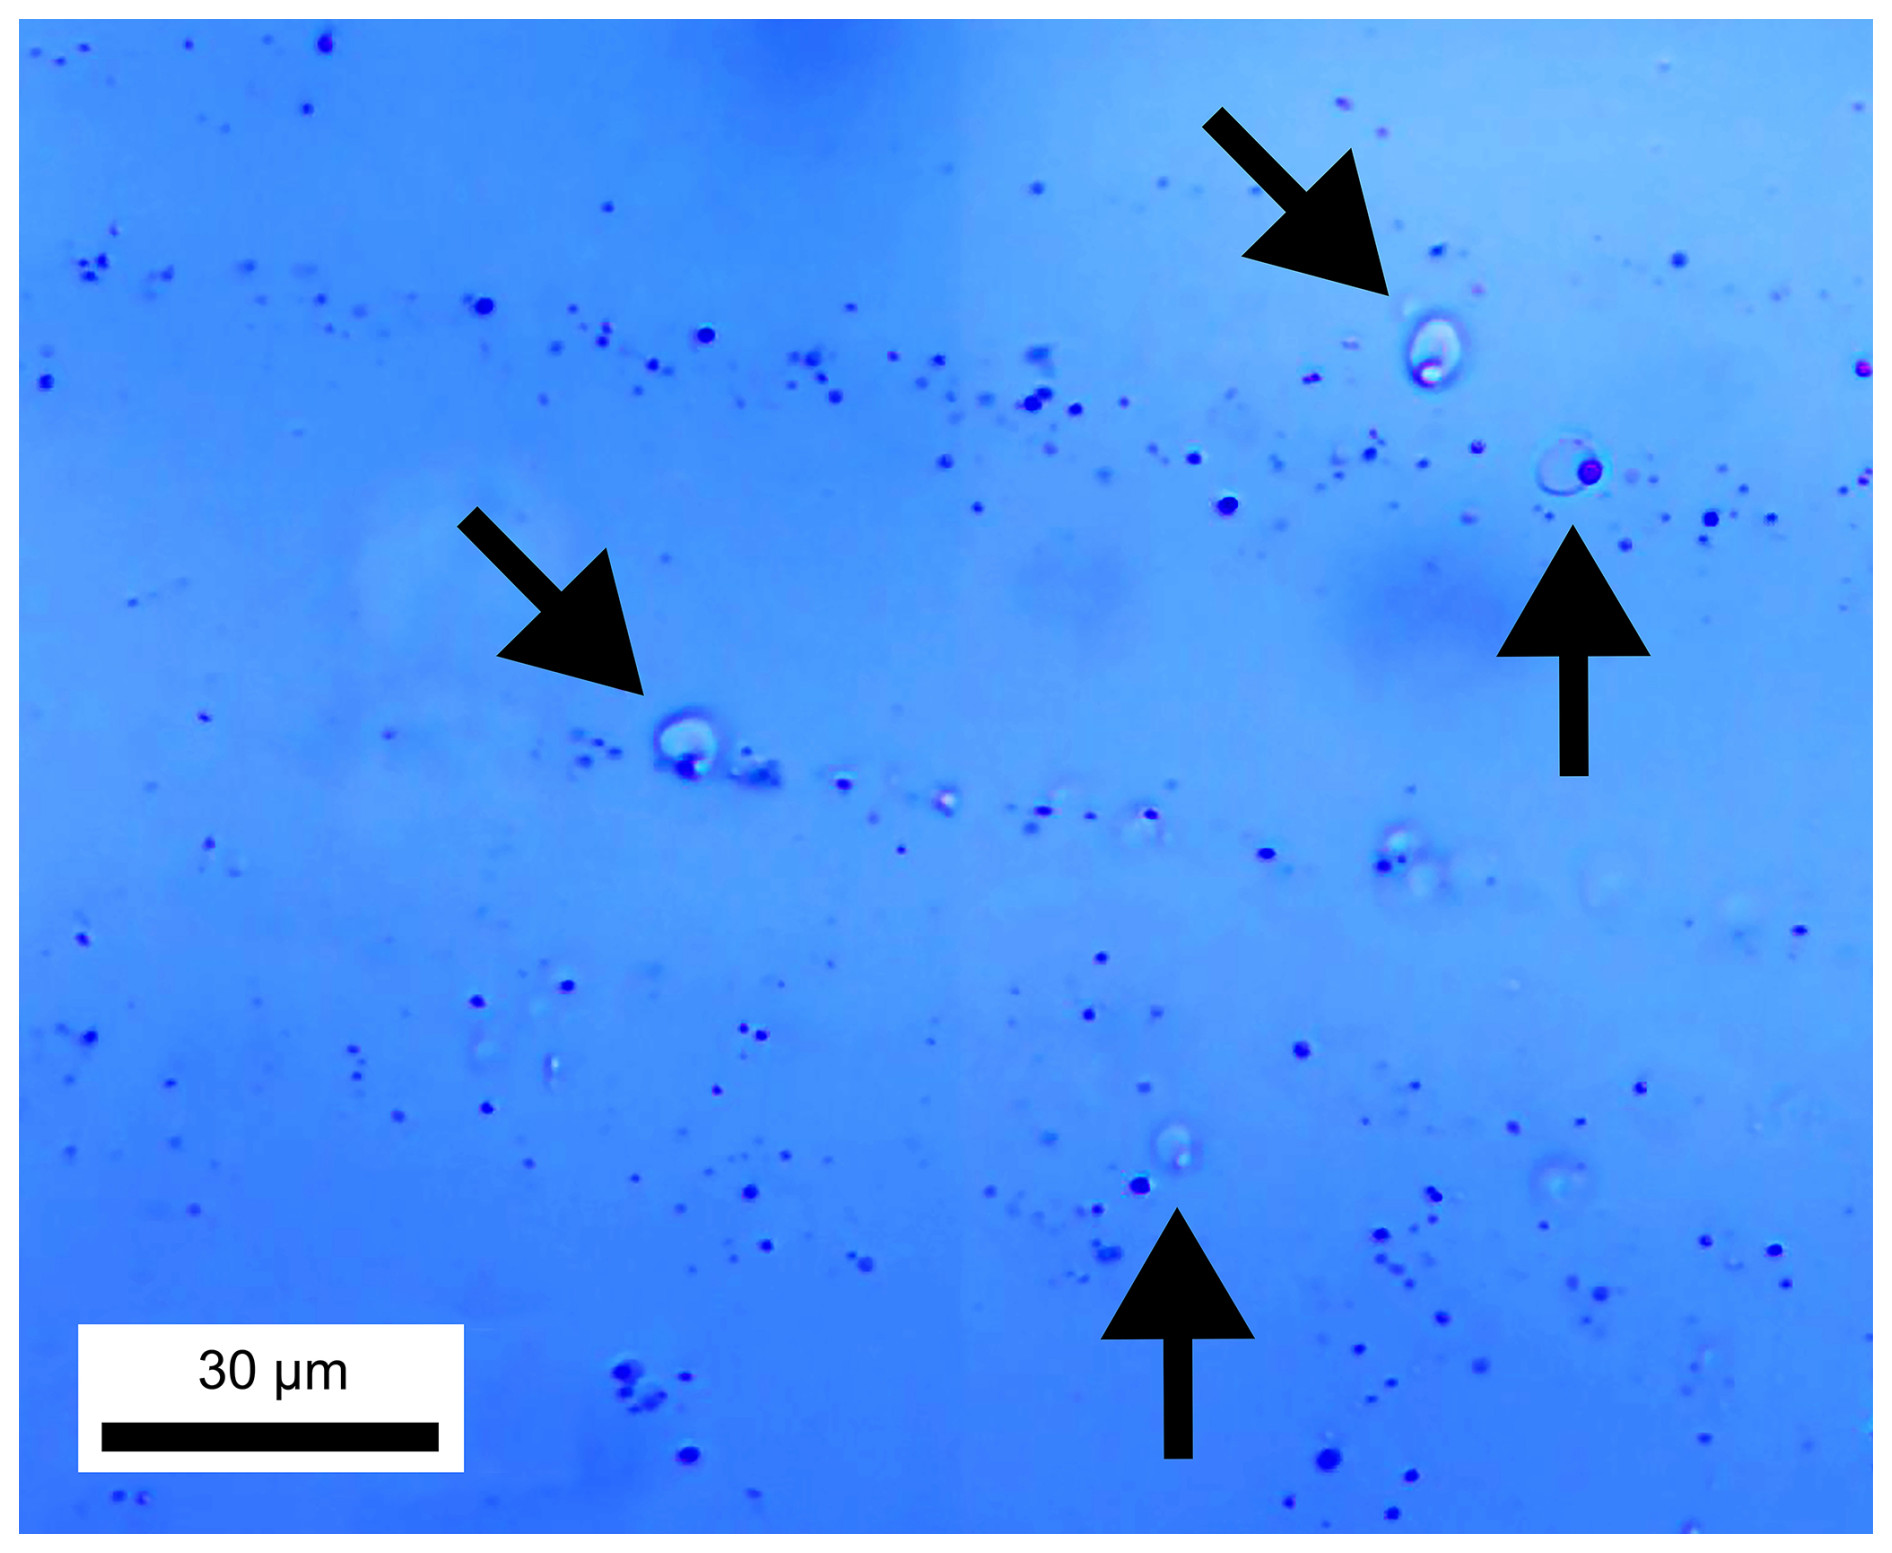
Figure 4Transmitted-light photomicrograph showing melt inclusions (arrows) among blue dots transformed from silk inclusions in sapphire after heating (sample G04HS).
3.4 Optical (UV–Vis–NIR) spectroscopy
The optical spectra of representative sapphire samples are presented in Fig. 5. Absorption peaks at 374, 388, and 450 nm and (broad) bands around 580 and 880 nm were observed. Optical spectra have been studied on unheated and heated sapphire by numerous previous researchers (e.g., Ediriweera and Perera, 1989; Perera et al., 1991; Emmett and Douthit, 1993; Hughes, 1997; Kyi et al., 1999; Emmett et al., 2003; Sripoonjan et al., 2014; Hughes, 2017; Pisutha-Arnond, 2017; Themelis, 2018; Palke et al., 2019; Soonthorntantikul et al., 2019; Dubinsky et al., 2020). The 374, 388, and 450 nm peaks and the 880 nm band were proposed to be attributed to Fe and the 580 nm band to the Fe–Ti pair. After heating, all samples showed a significant increase in the main Fe–Ti-related absorption band at around 580 nm (Fig. 5a–c), whereas Fe–Fe-related absorption at around 880 nm was only increased in some samples (i.e., Fig. 5a and c). The intensified absorption of the 580 nm band in these samples is referred to an increase in Fe–Ti pairs after heating, which leads to enhanced blue coloration in heated sapphires.
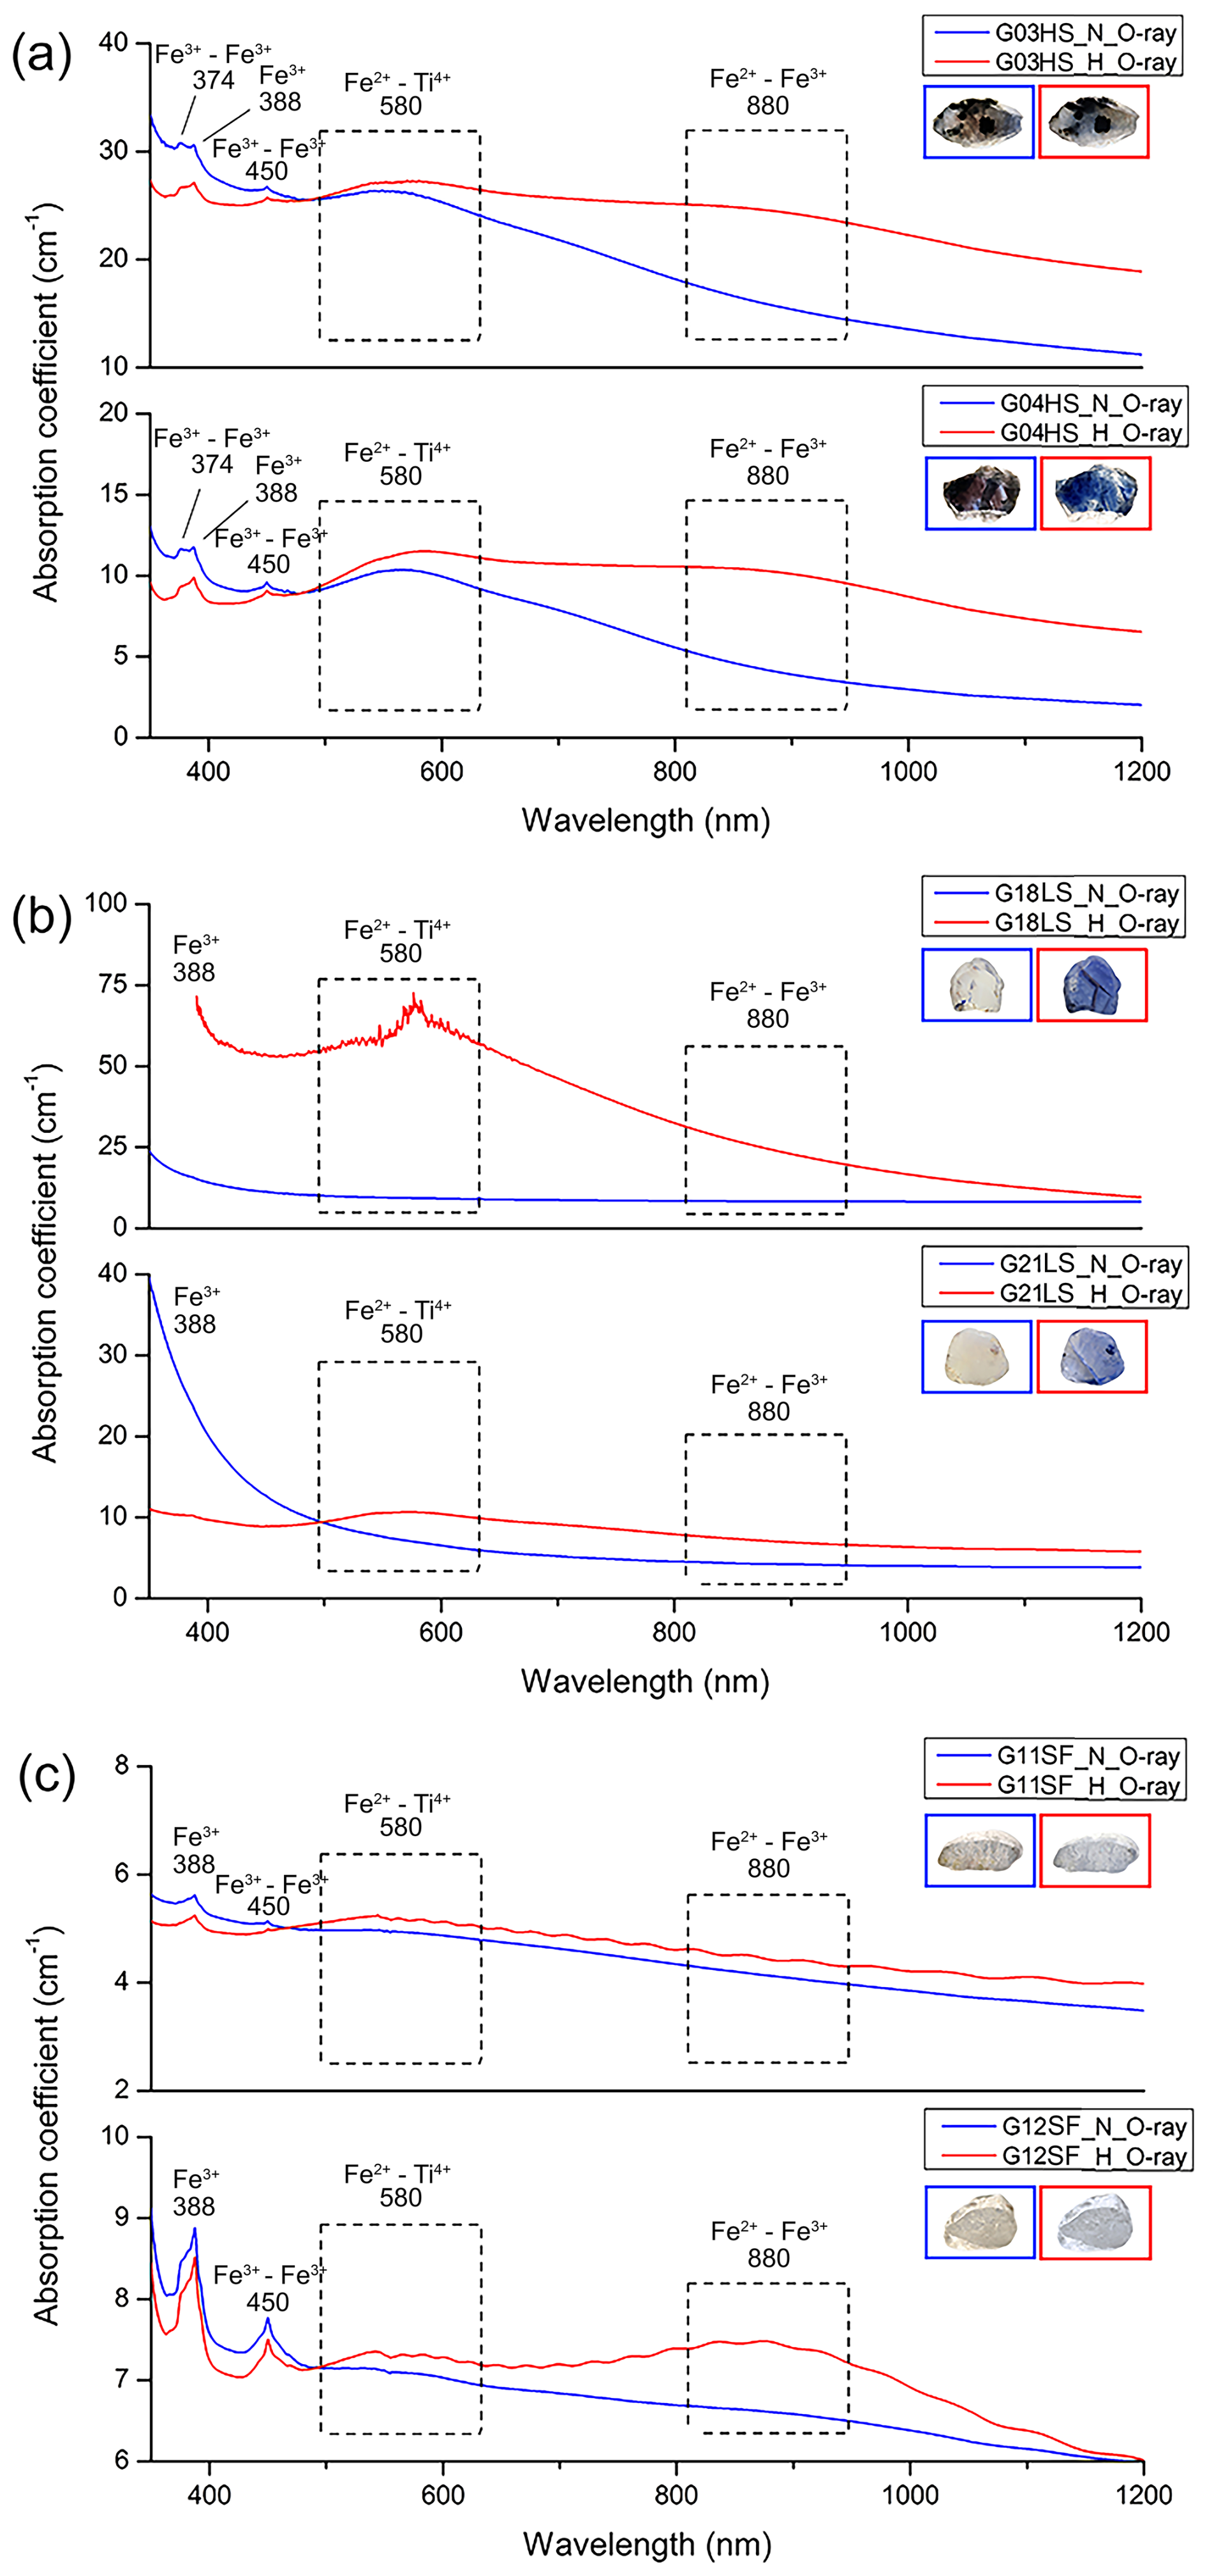
Figure 5Optical absorption spectra of untreated (blue lines) and heated (red lines) samples: (a) HS group (G03HS, G04HS), (b) LS group (G18LS, G21LS), and (c) SF group (G11SF, G12SF). Sizes of stones range between 4 and 12 mm.
Spectral characteristics of corundum containing Fe3+ ions exhibit a high degree of complexity. It is noteworthy that Fe3+ has an electron configuration of d5 resulting in a crystal field spectrum with a ground state of 6A1 (Ferguson and Fielding, 1972). Small peaks at 374 nm (4Eb) and 450 nm (4A1, 4Ea) should be attributed to the enhanced absorption of Fe3+–Fe3+ pairs (McClure, 1962; Ferguson and Fielding, 1971, 1972; Krebs and Maisch, 1971) and to a weak broadband absorption at 540 nm (4T2), which could not be seen in this work. The distinct peak observed at a wavelength of 388 nm (4T) (Krebs and Maisch, 1971) is linked to the individual Fe3+ ions. This, however, does not rule out the possibility of a higher-order cluster with extra ions or other point defects (Emmett et al., 2003). Additionally, there is also a broad band at a wavelength of 330 nm (4T), which is interpreted as an Fe3+–Fe3+ pair absorption (Ferguson and Fielding, 1972). As they are in low concentration (traces), this is also present in the spectra of heated samples G03HS and G04HS and in all spectra of sample G12SF in this study. In trace contents, both Fe2+ (d6) and Ti4+ (d0) ions alone do not exhibit any absorption in corundum in the visible range (Townsend, 1968); on the other hand, Fe2+–Ti4+ pairs (t2→2E) (Ferguson and Fielding, 1971) may yield a broadband absorption around 580 nm (E⊥c) or 700 nm () (Dubinsky et al., 2020). The Fe2+–Fe3+ pair gives rise to the broad absorption band at ca. 880 nm (Fig. 5; Ferguson and Fielding, 1972).
3.5 FTIR spectroscopy
FTIR spectra of most samples yielded identical patterns within the range of 1600–4000 cm−1 (Fig. 6). They usually showed CO2 peaks (at 2339 and 2360 cm−1) and peaks related to C–H stretching (at 2856 and 2925 cm−1), likely from artifacts (Fig. 6, blue lines), in accordance with Hughes (2017) and Soonthorntantikul et al. (2021). However, O–H stretching of boehmite/diaspore peaks (at 1975 and 2105 cm−1) (Delattre et al., 2012; Sun et al., 2015; Choi et al., 2018; Filatova et al., 2021; Soonthorntantikul et al., 2021) was only observed in sample G03HS (Fig. 7a, blue line). Weak absorption features of O–H stretching from H2O (broad band at ca. 3400 cm−1) and OH groups (ca. 3600–3700 cm−1) were only found in the untreated samples (blue lines); see Fig. 6a.
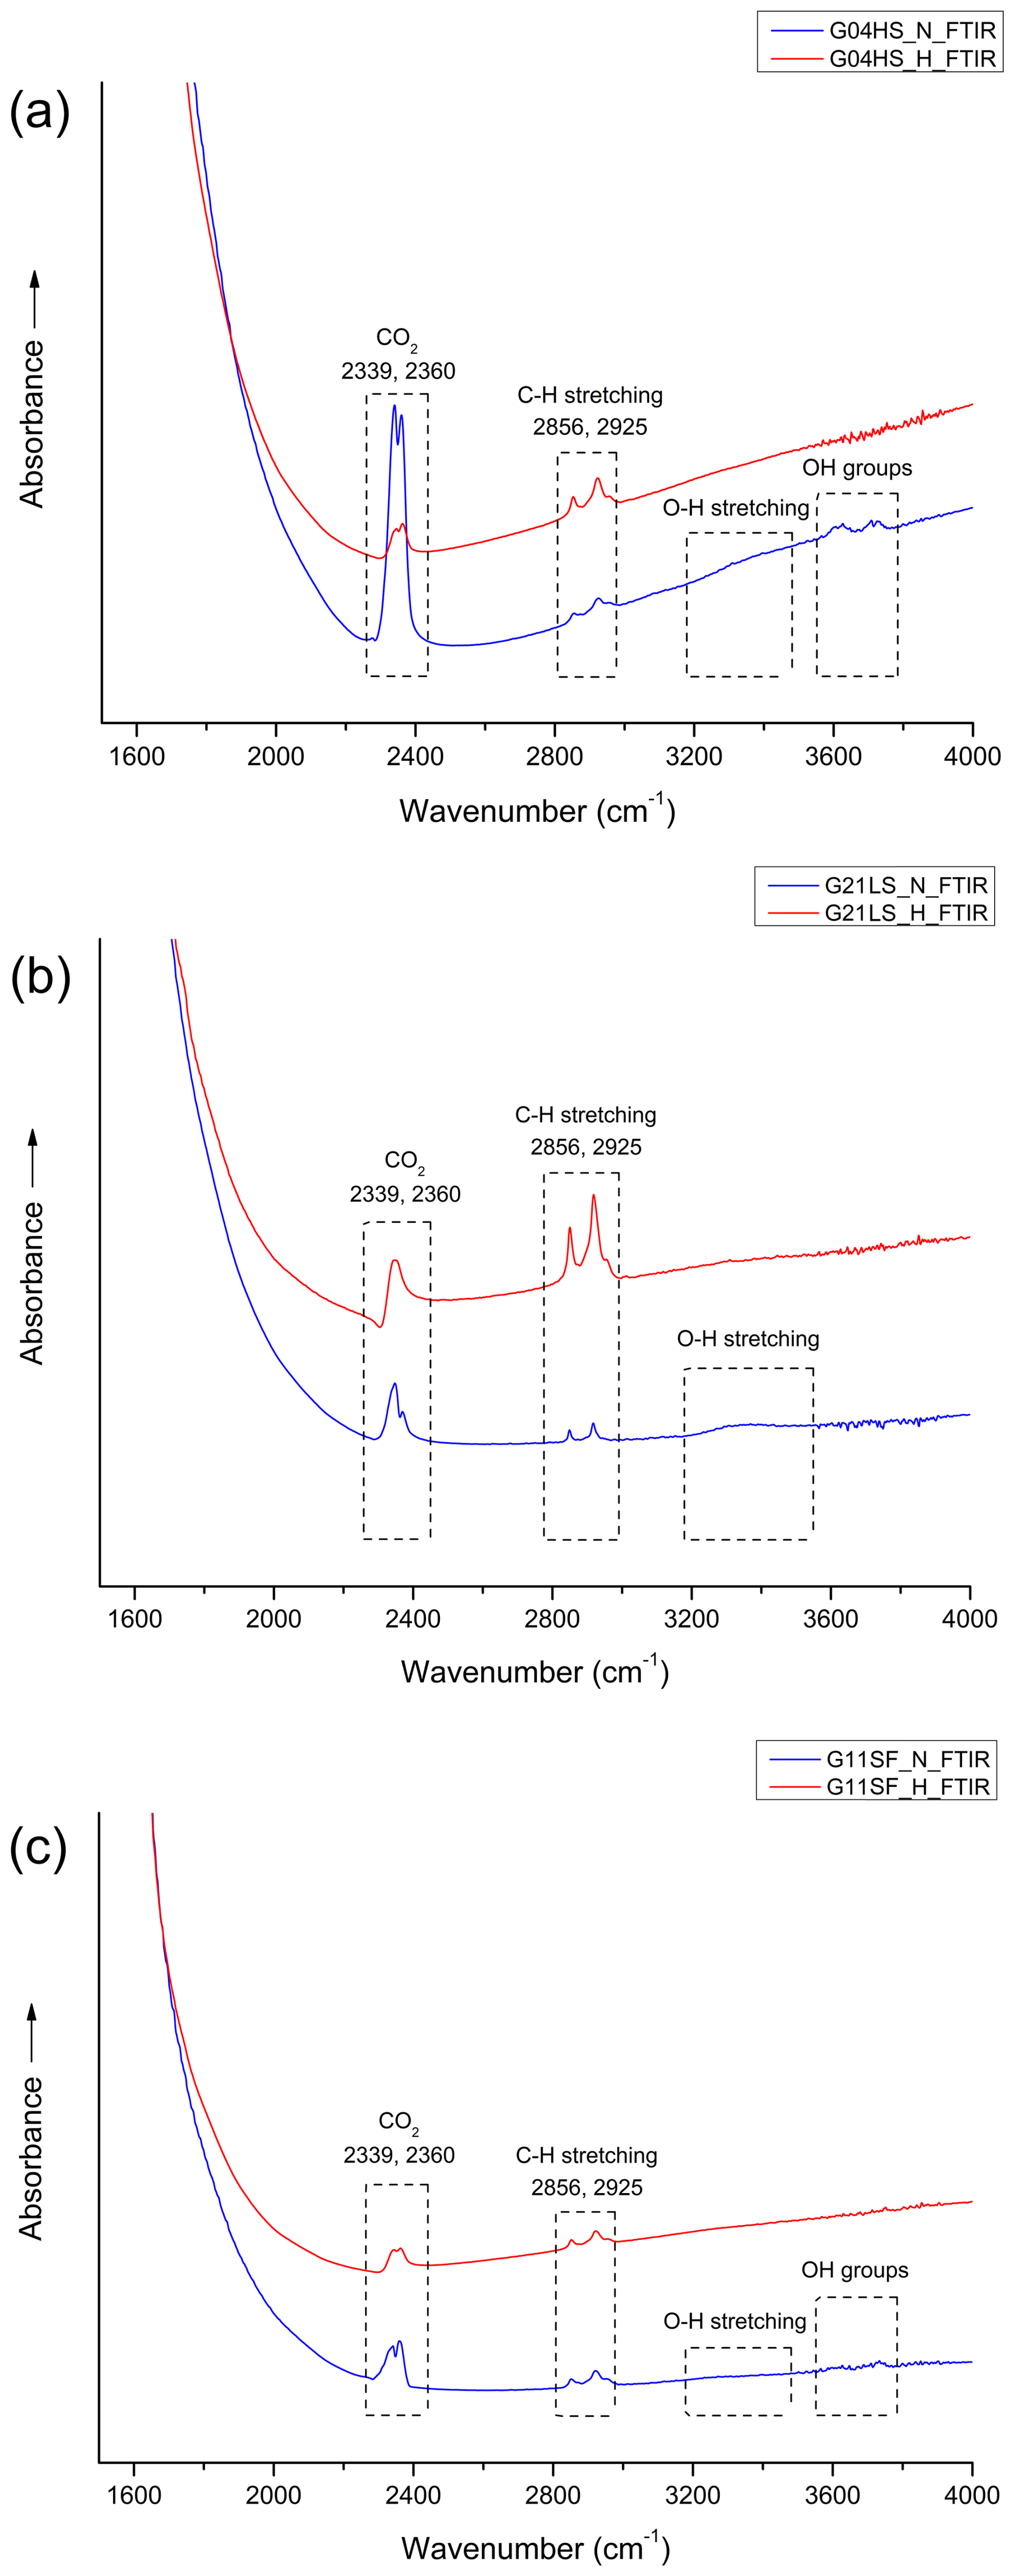
Figure 6FTIR spectra obtained before (blue lines) and after (red lines) heating experiments of representative samples G04HS (a), G21LS (b), and G11SF (c), respectively.
After heating, boehmite-/diaspore-related absorption peaks (only observed in sample G03HS; Fig. 7a) at 1975 and 2105 cm−1 disappeared. In contrast, the 3309 cm−1 hydroxyl (O–H) absorption, which was not present in any natural sample before heating, appeared only in sample G18LS after heating (Fig. 7b, red line).
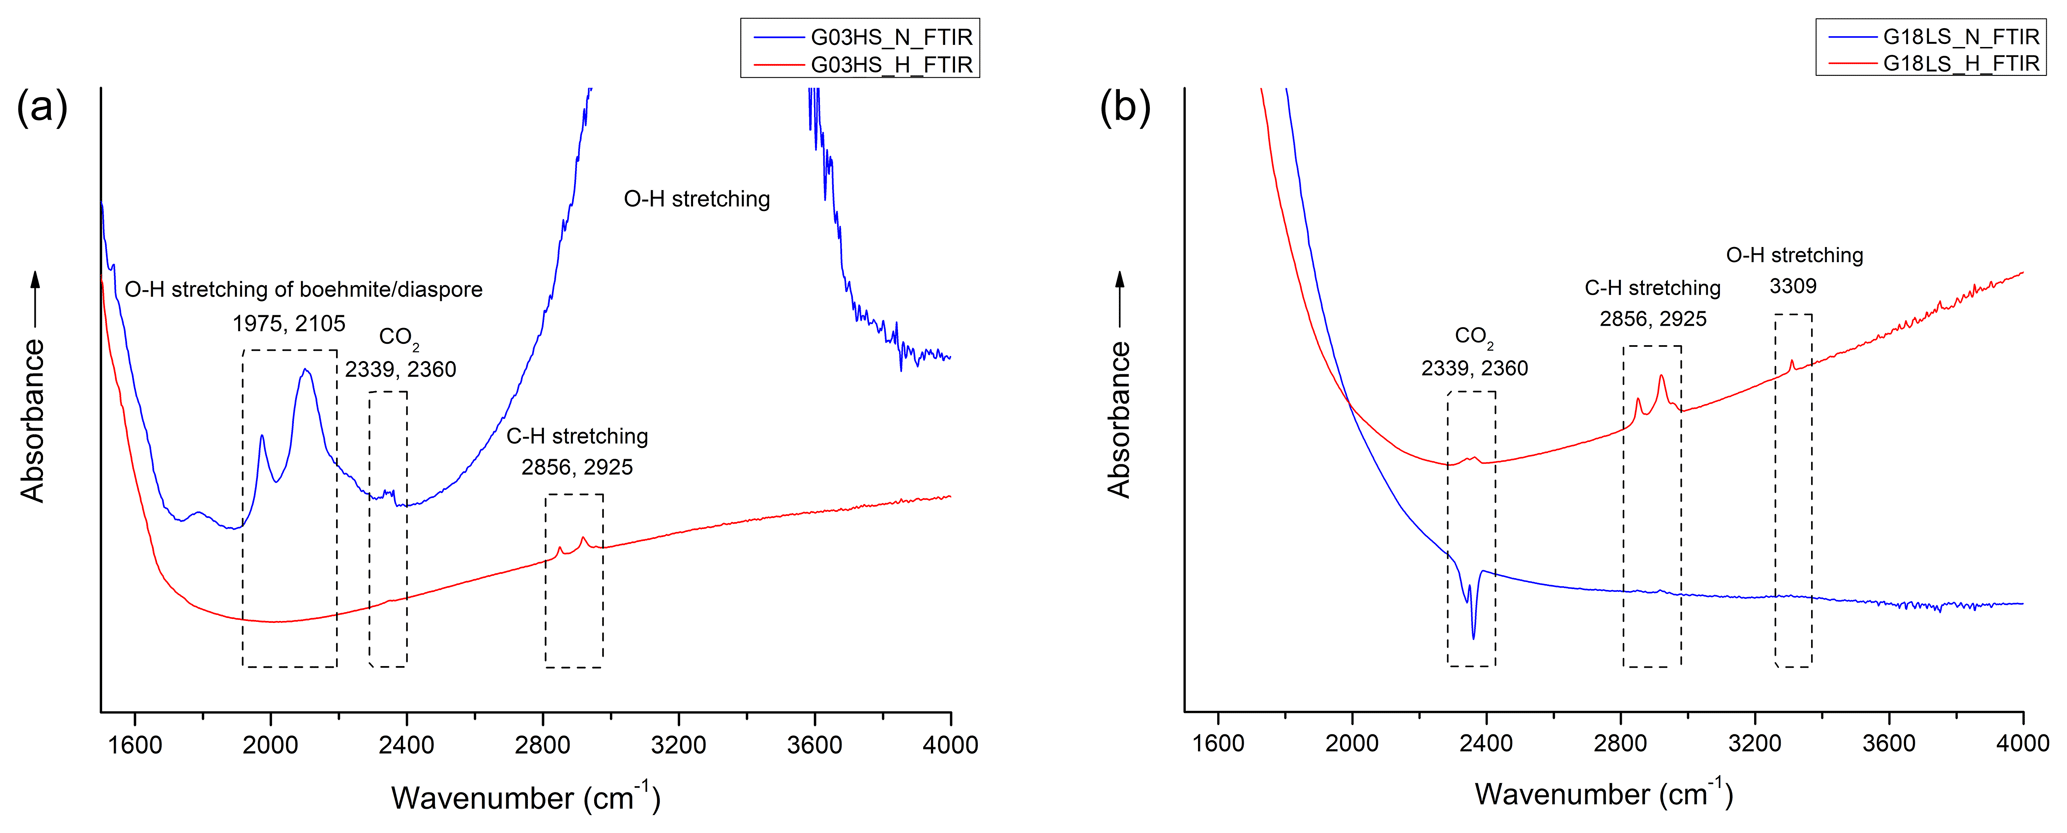
Figure 7FTIR spectra obtained before (blue lines) and after (red lines) heat treatment of samples G03HS (a) and G18LS (b).
In this study, the non-systematic occurrence of O–H absorption in the 3100–3600 cm−1 range in all natural geuda sapphire samples, together with the development of a weak absorption at 3309 cm−1 upon heating in only one of the samples (see Fig. 7b, red line), addresses the limitation of differentiating unheated and heated sapphire by FTIR spectroscopy. Furthermore, heat treatment employed in this study did not involve the use of any additional gases, such as hydrogen, to create a reducing atmosphere within the furnace. Despite this, the 3309 cm−1 absorption band was seen after the heating process. This might be in accordance with an explanation proposed earlier by Notari et al. (2018).
The controversy of the presence of an O–H peak in the FTIR spectrum in unheated and heated sapphire could be attributed to the inherent hydrogen content of the corundum. Hydrogen was found in corundum, primarily in the form of alumina hydrates (Notari et al., 2018). These hydrates could release hydrogen through de-hydroxylation at temperatures as low as approx. 450 °C. Additionally, hydrogen was present in the air as H2O, which can be split at temperatures around 900 °C to produce hydrogen gas (H2) and oxygen gas (O2) through the reaction 2H2O → 2H2+ O2 (Notari et al., 2018).
3.6 Photoluminescence imaging and spectroscopy
Photos presenting luminescence of some samples both before and after heat treatment are shown in Fig. 8. Before heating, all natural sapphire samples were inert to SWUV light; moreover, all LS and SF samples exhibited orange to red luminescence under LWUV light (Fig. 8). After heating, all LS and SF samples exhibited intense blue luminescence under SWUV light, whereas their initial orange to red luminescence under LWUV light turned into a strong purplish-red luminescence (Fig. 8, samples G06LS and G20LS in particular). In summary, the HS samples were all inert to SWUV and LWUV light both before and after heating. Notably, under LWUV light, an initial orange to red luminescence of a few samples from the SF group was drastically reduced after heating (e.g., G23SF in Fig. 8).
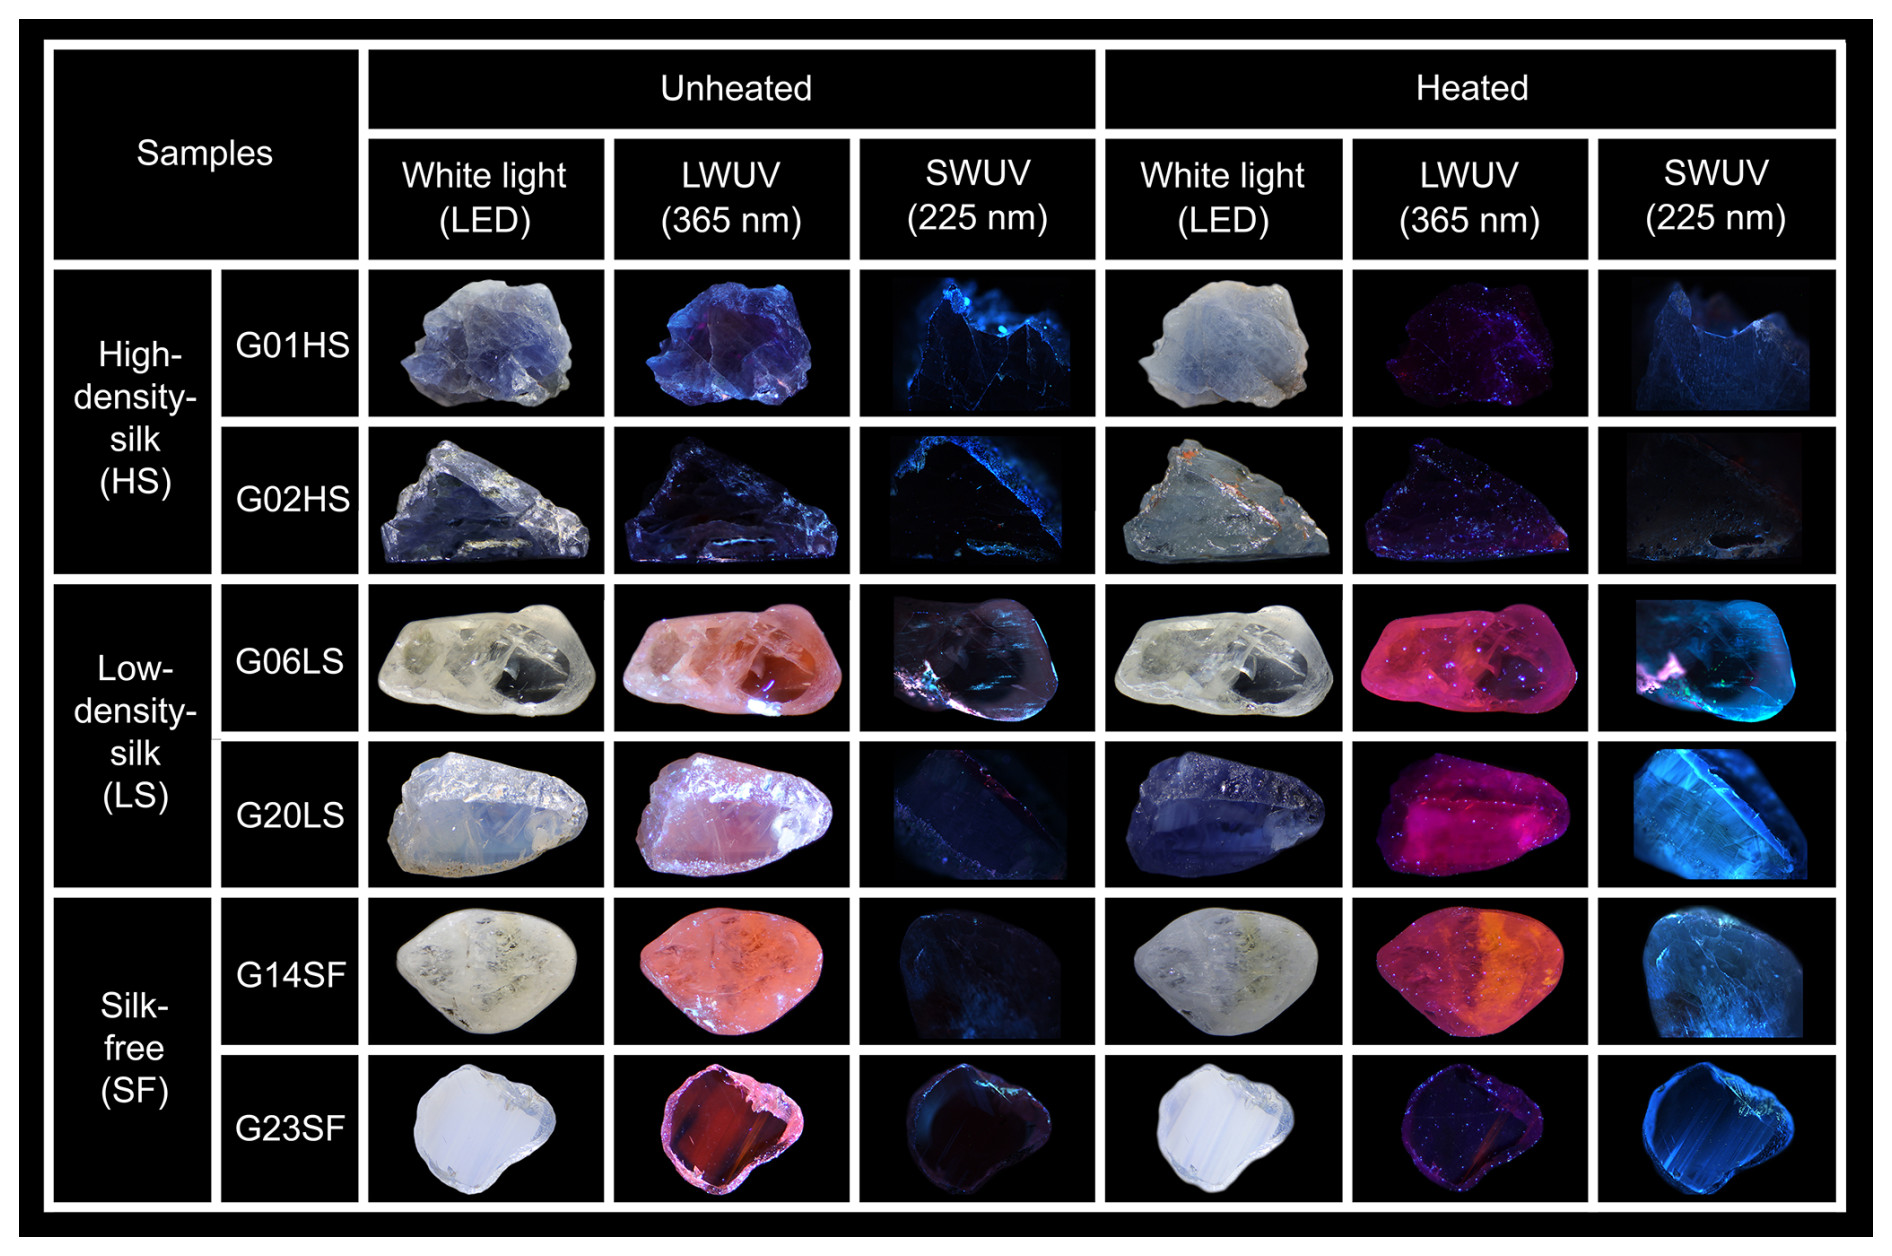
Figure 8Representative images of HS (G01HS, G02HS), LS (G06LS, G20LS), and SF (G14SF, G23SF) groups obtained under LWUV and SWUV illumination before and after heating. Sizes of stones range between 4 and 12 mm.
The UV-excited PL spectra showed that all the unheated and heated sapphire samples have an identical feature of two narrow peaks of trace Cr3+ lines at around 692.8 and 694.2 nm (Fig. 9) that are assigned to the spin-forbidden 2E →4A2 relaxation of trace Cr3+ (Nelson and Sturge, 1965). However, the Cr3+ lines of some samples (Fig. 9c) are too weak to be visible within the noise of a broad and strong emission band. All unheated sapphire samples showed a similar emission band in the orange to red region centered around 630–650 nm (Fig. 9a–c, blue line). Remarkably, this appears to be associated with orange to red luminescence under LWUV light, as noted by Segura (2013), Vigier et al. (2021a, b, c), and Vigier and Fritsch (2022). Despite having the emission band around 630–650 nm, only unheated sapphire from the HS group appeared inert under LWUV illumination, while the others revealed orange to red luminescence.
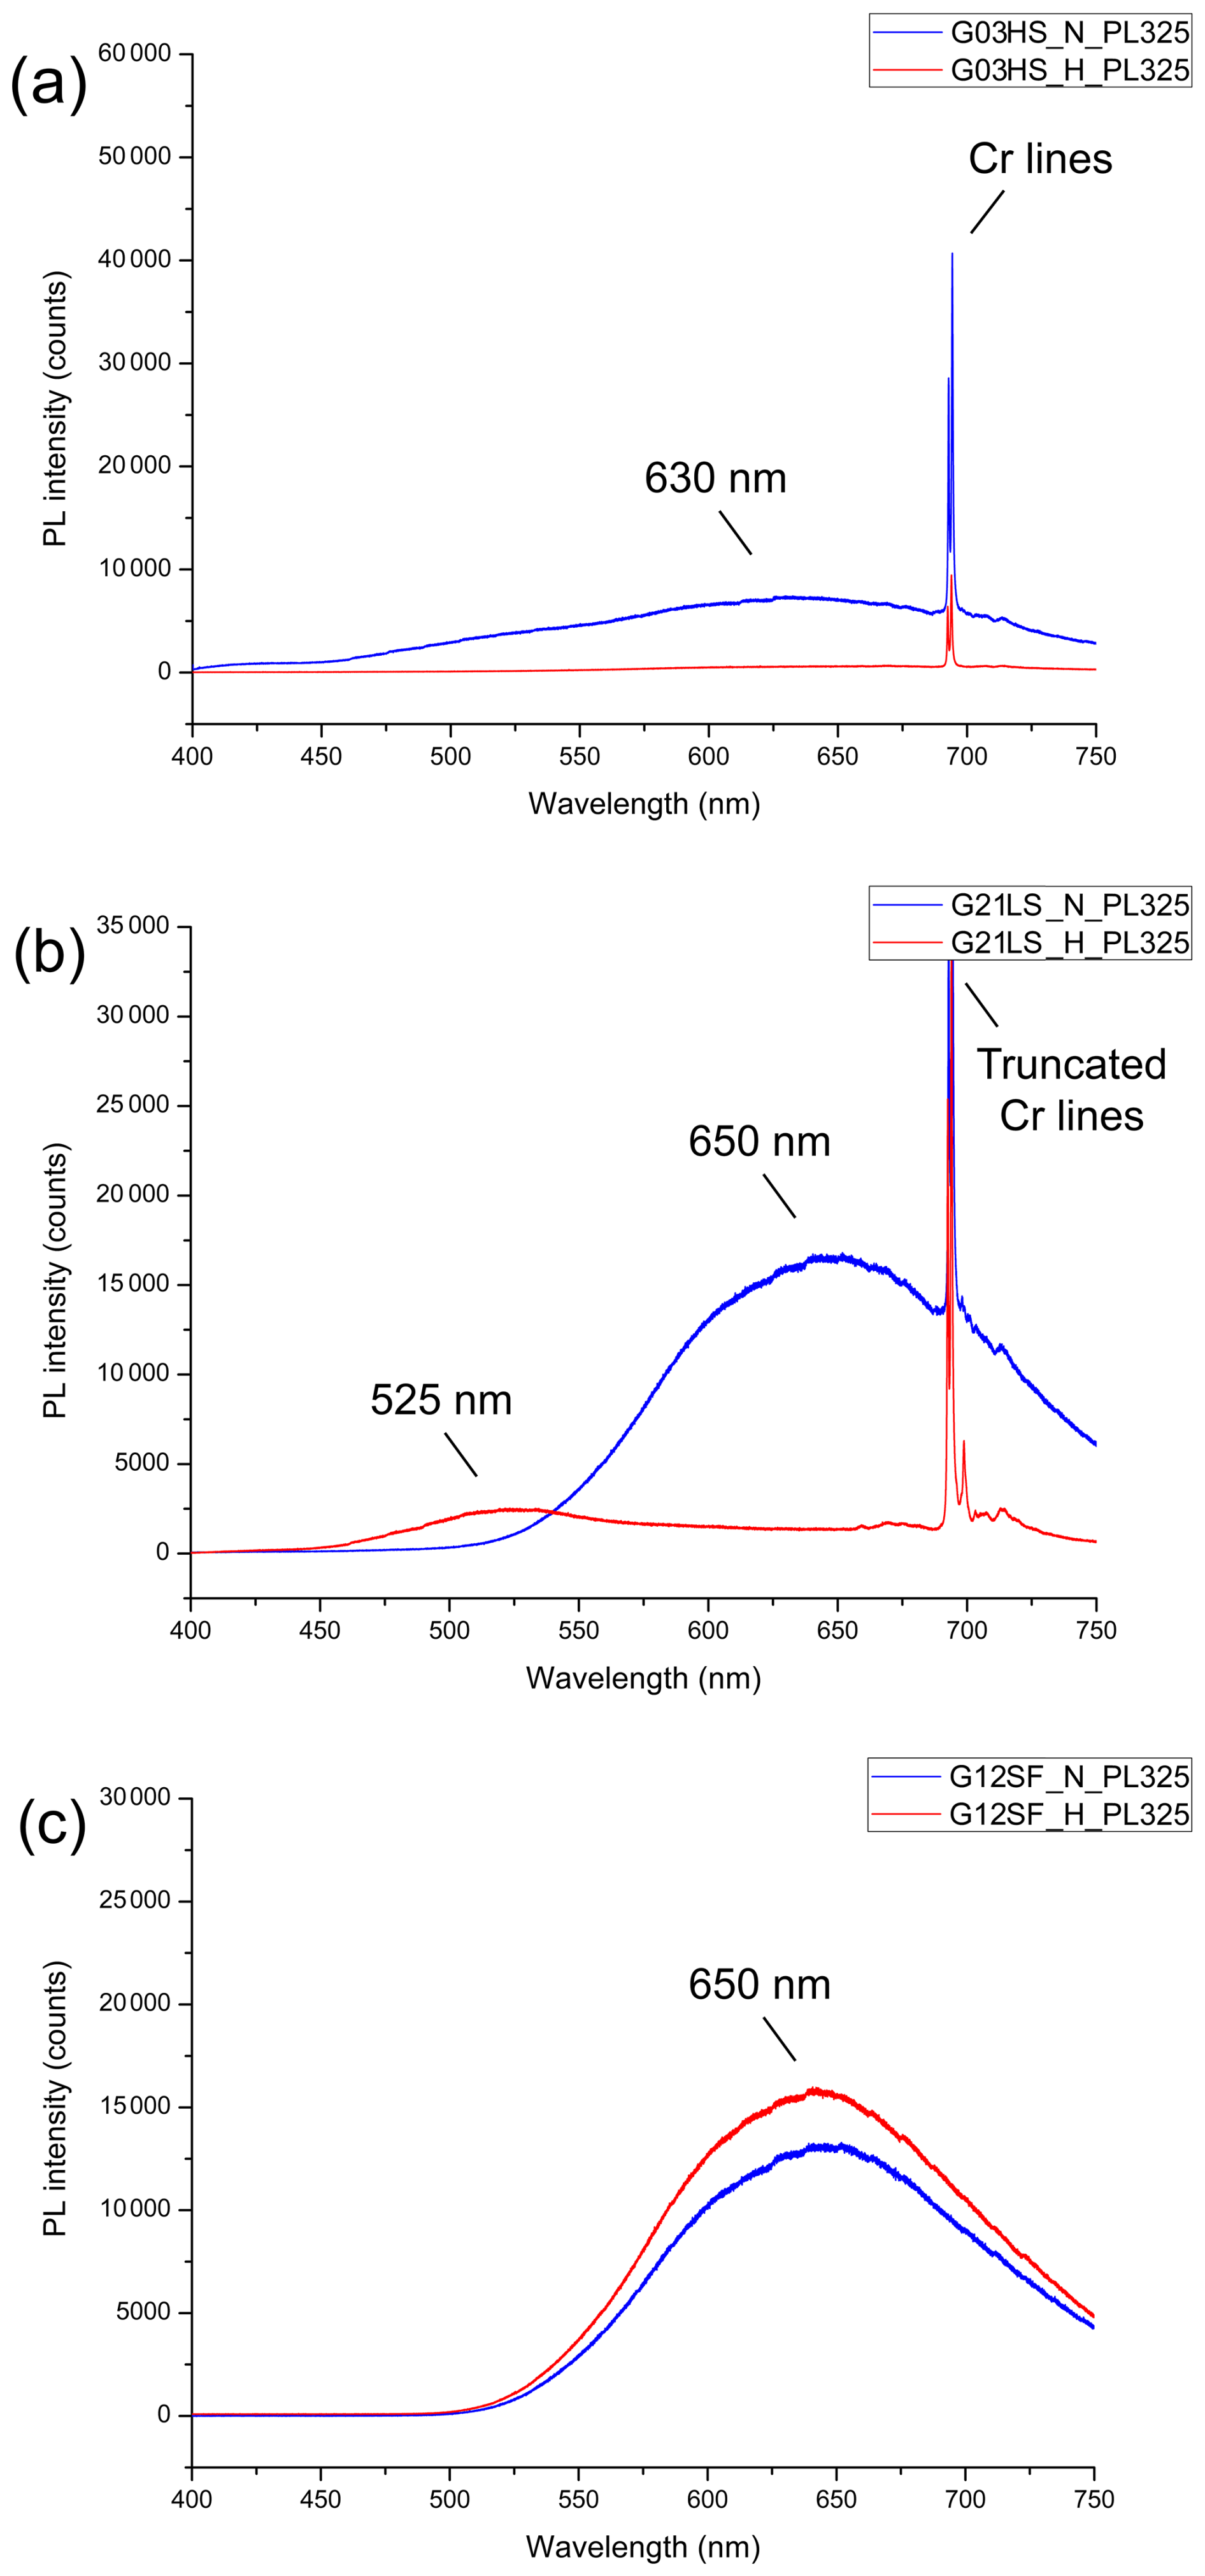
Figure 9Representative (UV-excited) PL spectra obtained before (blue lines) and after (red lines) the heating of sample G03HS (a), sample G21LS (b), and sample G12SF (c).
After heating, significant alteration in the emission band was observed, as depicted by the red lines in Fig. 9a–c. The PL spectra of sample G03HS exhibited a notable reduction in the emission band through the visible region (Fig. 9a, red line). This went along with a lack of luminescence under both SWUV and LWUV excitation, whereas sample G12SF demonstrated a slight increase in the emission band in the orange to red region (Fig. 9c, red line). More details are given in the Discussion part below.
In contrast to the other groups, after heating, sample G21LS (Fig. 9b, red line) exhibited a significant emission band in the green region at around 525 nm. Note that this broad emission is excited with the 325 nm laser (Fig. 9) but does not seem to affect significantly the emission colors observed under SWUV (225 nm) and LWUV (365 nm) excitation (Fig. 8). For a discussion of the possibly strong dependence of emission intensity (and color) on the excitation wavelength, see, for instance, Zeug et al. (2022). Likewise, heated sapphire has been proposed to have an emission band in the blue region, which corresponds to blue luminescence under SWUV light (Nassau, 1981; Hughes, 2017; Vigier et al., 2023).
4.1 Generalities
After Ti4+ ions are exposed to SWUV light, they yield luminescence (Nasdala and Fritsch, 2024). However, blue luminescence was not observed in both unheated and heated basaltic sapphire, possibly due to the abundant presence of Fe2+ of basaltic origin that may strongly quench such blue luminescence (Soonthorntantikul et al., 2019). More details are discussed in this paper. Furthermore, even though microscopic inclusions have been the distinguishing characteristics of heated sapphire, identifying heat-treated sapphire remains challenging (Crowningshield, 1966; Hughes, 2017). FTIR spectroscopy has also been applied to detect heated sapphire. In some cases, the presence or absence of specific FTIR features in the O–H absorption region (3100–3600 cm−1) may serve as an indicator of heat treatment (Smith, 1995; Beran and Rossman, 2006; Saeseaw et al., 2018); however, it is probably not conclusive evidence (Ediriweera and Perera, 1989; Perera, 1993; Sutthirat et al., 2006; Cartier, 2009; Jaliya et al., 2020). For example, the presence of the 3309 cm−1 FTIR absorption peak was used as an indicator of heated corundum (Hughes and Perkins, 2019; Soonthorntantikul et al., 2021). However, recent discoveries show that this peak may also be found in unheated sapphire, suggesting that it is not a reliable indication of heat treatment (Hughes, 1997, 2017; Hughes and Perkins, 2019; Soonthorntantikul et al., 2021).
4.2 Silk inclusions and coloration of sapphire
Studies addressing brown silk inclusions in corundum are scarce. Soonthorntantikul et al. (2021) reported a mix of whitish silk and irregular/flaky/platelet-like brownish silk inclusions in corundum from Mogok. Brown silk was ascribed as presumable ilmenite (FeTiO3), which is noticeable in high-Fe sapphire, whereas white silk was suggested to consist of rutile (TiO2). The brown silks seen in our sapphire samples are likely ilmenite, which is supported by their irregular/flaky/platelet-like brownish appearance and their high Fe and Ti contents (note that the highest quantity of Fe was found in the HS group). Ilmenite decomposition upon heat treatment does result in Fe and Ti migration into the host sapphire and subsequently causes blue coloration. In particular, the decomposition of brown silks during heat treatment induces the formation of blue dots, which is a result of the Fe2+–Ti4+ pairing formation. Upon closer inspection using a high-resolution microscope, these blue dots reveal distinct micro-inclusions as melt inclusions (with a size of ≤ 1 µm; see Fig. 4), which have never been documented before. However, it should be noted that these melt inclusions are possibly derived from the decomposition of silks.
This work focuses only on blue coloration in sapphire, which mainly relates to the Fe2+–Ti4+ pair, as initially noted by Townsend (1968), followed by Mattson and Rossman (1988), Moon and Phillips (1994), and Emmett et al. (2003). Ti exhibits electron-donor properties, whereas Fe may function as an electron acceptor. When occupying neighboring Al3+ positions, absorption due to intervalence charge transfer between such donor-acceptor pairs may occur (details reported by Emmett et al., 2003, and Monarumit et al., 2023).
It should also be mentioned that Ti4+ ions do not exhibit any absorption characteristics in the visible spectrum when considered individually. The Ti4+ ion has a closed-shell electron configuration, whereas the Fe2+ ion mainly absorbs wavelengths within the near-infrared and low-energy visible regions. In contrast, when Fe2+ and Ti4+ ions are situated on neighboring structural sites, notable absorption bands develop across the visible and near-infrared spectral regions. These Fe2+–Ti4+ pairs exhibit a band center at around 580 nm (see Fig. 5) when the electric field vector E is perpendicular to the crystallographic c axis (E ⊥ c), but a peak at 700 nm is seen when the electric field vector E is parallel to the crystallographic c axis () (Dubinsky et al., 2020). Although the theory of the energy levels of an individual transition metal ion inside a crystal has been extensively explored, the corresponding theory for ion pairs or clusters within a crystal remains underdeveloped (Dubinsky et al., 2020).
In the present study, the natural unheated geuda sapphire samples were placed in atmospheric conditions and subjected to a maximum temperature of 1650 °C for a duration of 10 h. According to the examples presented in Fig. 1, samples G03HS and G04HS exhibited a noticeable increase in blue coloration, particularly around the area of brown silks and brown color banding/zoning, after heating. On the other hand, the initial blue patch (e.g., samples G01HS and G02HS) became paler blue after heating, which might be due to the breakage of initial Fe–Ti pairs in those areas. The other groups, which have yellowish and/or milky appearances, revealed an increase in blue color after heating (samples G12SF and G18LS; Fig. 1). This blue coloration is attributed to two distinct factors, notably the decomposition of silk inclusions and a subsequent charge transfer mechanism (Emmett and Douthit, 1993; Hughes, 1997, 2017; Nassau, 1980, 1981; Themelis, 2018). The process of charge transfer (Ferguson and Fielding, 1972; Nassau, 1981) is described as
It is important to note that the blue color observed in sapphire could also be produced with the application of heat in oxidizing conditions at high temperature. Heat treatment can be classified as high- or low-temperature according to the decomposition of rutile silks in corundum (Nassau, 1981; Emmett and Douthit, 1993; Emmett et al., 2003; Hughes, 2017; Hughes and Perkins, 2019). The term low-temperature heat treatment has been used (typically referred to as below 1000 °C) when rutile particles still reveal their original structures. On the other hand, temperatures beyond 1350 °C denote high-temperature heat treatment when rutile silks start to decompose and dissolve within the corundum host (Hughes, 2017; Themelis, 2018). Consequently, internal diffusion (indicated by a colored halo surrounding the crystal inclusion), molten or altered inclusions, and/or broken silk are strong indicators of high-temperature heat treatment. However, low-temperature heat treatment can also produce various altered mineral inclusions (Kammerling et al., 1990; McClure and Smith, 2000; McClure et al., 2010; Pisutha-Arnond, 2017; Soonthorntantikul et al., 2019).
In recent studies, the possibility of employing Fe2+–Fe3+ charge transfer as an alternate method for blue coloration has also been mentioned (Nikolskaya et al., 1978; Schmetzer and Kiefert, 1990; Häger, 1992, 2001; Sripoonjan et al., 2014; Pisutha-Arnond, 2017). However, it is necessary to emphasize that this approach was considered highly improbable (Nassau, 1981). Nevertheless, previous studies have indicated that a minor proportion of geuda sapphire from Sri Lanka and geuda-like sapphire from Mogok in Myanmar revealed an alteration in color to blue when subjected to heating in an oxidizing environment (Hughes, 1997, 2017; Kyi et al., 1999), which is in complete contradiction to the treatment method employed for the geuda sapphire in reducing conditions. The appearance of certain stones displaying a blue coloration under oxidizing conditions might be attributed to the presence of ilmenite silks, which are composed of Fe and Ti, with Fe in its reduced Fe2+ state (Hughes, 1997). Therefore, it is unnecessary to reduce Fe3+ to Fe2+ ions to generate the Fe2+–Ti4+ pairs that are responsible for the manifestation of the blue color. Hence, the blue areas have a substantial concentration of Fe ions in the form of Fe–Ti pairs, derived from the decomposed ilmenite silk inclusions.
According to Nassau (1981), the presence of blue dots in heated sapphire is attributed to remains of dissolved silk inclusions and internal cation diffusion. The diffusion process is positively correlated with the temperature and duration of heat treatment (Nassau, 1981). Despite the slow diffusion rates of Fe and Ti, the distances across are extremely short, i.e., just a few micrometers (Nassau, 1981). Consequently, a potential Fe–Ti combination within the corundum's lattice may generate the blue dots.
The presence of melt inclusions among the blue dots after high-temperature heating might be due to the decomposition of brown silk and its solubility into the host sapphire as demonstrated by Jung et al. (2009). They predicted a phase relationship within the Al2O3–Ti2O3–TiO2 system based on experimental data and thermodynamic calculation. Consequently, they suggested that a liquid phase (the composition of the liquid inclusion phase varies significantly between Al2O3 and Ti3O5) could possibly be present at a temperature of 1600 °C and slightly below, which is close to the heating temperature (1650 °C) of our experiment. Silk inclusions as represented by Ti2O3–TiO2 components may have dissolved into the host sapphire (Al2O3 component) and produced a proper composition of solution which could be partially melted at ≤ 1650 °C. Some of these melts can be preserved as inclusions after cooling down.
4.3 Luminescence of sapphire
Luminescence of corundum may be assigned to two types, namely (a) emissions of impurity-related centers such as Ti4+ (commonly known) and (b) emissions of defect-related centers, which typically involve either vacancies, such as oxygen (O) or aluminum (Al) vacancies known as F center (color center; from the German Farbzentrum); or interstitials (Ali and Oi), possibly trapped at impurities (less known); or both (Viger et al., 2021a, b, c). This means that defect-related emission centers in corundum refer to an inconsistency in the atomic arrangement limited to one or a few atoms (often called color-centers). O vacancies (or electron holes) are sometimes called hole centers because the holes simply designate the absence of an electron. The holes are sometimes filled with one or two electrons in order to maintain electroneutrality (Vigier et al., 2021a).
As presented in Fig. 8, a notable orange to red luminescence is easily noticeable under LWUV excitation in most unheated sapphire samples, except for those of the HS group, which appear inert. After heat treatment, the orange to red luminescence that is initially observed in all samples of the LS group and many samples of the SF group turns into a purplish-red luminescence. In contrast, no orange to red or purplish-red luminescence is observed in any sample of the HS group both before and after heating.
The origin of orange to red luminescence in sapphire remained controversial, with varying ideas among researchers (Vigier et al., 2021a, b, 2023). The occurrence of orange luminescence has been documented in previous studies (e.g., Spencer, 1927; Kane, 1982; Emmett et al., 2003; Fritsch et al., 2003; Nasdala and Fritsch, 2024). In the beginning, it was hypothesized that this luminescence is associated with the geographic origin of yellow sapphire from Sri Lanka (Webster, 1984). Subsequently, Segura (2013) presented an alternative argument to this notion, suggesting that the presence of orange luminescence in various colors of corundum, regardless of treatment or synthetic origin, might be attributed to the existence of some defects. However, the orange to red luminescence observed in our study (characterized by a broad emission band) seems to be associated with complex defect-related centers.
Orange to red luminescence in sapphire is not due to impurities (Vigier et al., 2021a, b). HS sapphire (e.g., with ilmenite, FeTiO3) lacks noticeable luminescence, likely because Fe2+ suppresses luminescence, contrasting with LS and SF sapphire, which display stronger luminescence both before and after heating. While sample G23SF shows decreased purplish-red luminescence after heating, most samples display increased purplish-red luminescence, potentially due to complex, defect-related centers in the sapphire lattice. Observations suggested that Fe2+ acts as a luminescence quencher in the orange to red range (Andrade et al., 2008; Norrbo et al., 2016; Vigier et al., 2021a, b, c; Vigier and Fritsch, 2022); orange luminescence generally appears in colorless, low-Fe areas (Segura, 2013; Notari et al., 2003). However, a definitive explanation remains unresolved. Regarding blue luminescence, it has been observed that, upon exposure to SWUV light, all natural unheated samples appeared inert. After heating, apart from HS sapphire, a distinct blue luminescence was detected throughout most heated sapphire samples (Fig. 8). Previous studies suggest that luminescence in sapphire becomes noticeable only at heating temperatures of 1000 °C (Hughes and Perkins, 2019), at which point blue luminescence is linked to heat treatment detection. This luminescence is believed to arise from silk inclusions composed of TiO2, commonly found in natural blue sapphire. Notably, despite the relatively low Ti concentration (0.02 wt %–0.03 wt % oxide) in comparison to Fe (0.05 wt %–0.08 wt % oxide) in some samples (e.g., G12SF and G21LS), blue luminescence remains detectable. In contrast, HS samples (e.g., G02HS) show an absence of blue luminescence, likely due to the presence of ilmenite, supporting findings by Norrbo et al. (2016), Andrade et al. (2008), and Vigier et al. (2021a, b, c, 2023) that Fe2+ acts as a luminescence quencher. Blue luminescence has been associated with the interaction between O2− and Ti4+ ions (Evans, 1994; Wong et al., 1995b; Nasdala and Fritsch, 2024), followed by a later hypothesis of a charge transfer process involving Ti4+ ions and certain defect-related centers (Lacovara et al., 1985; Mikhailik et al., 2005). However, it was widely accepted that the blue luminescence (characterized by a broad emission band at the blue to green region) observed in sapphire under SWUV illumination is associated with the presence of Ti impurities, which are classified as element-related defects (Vigier et al., 2021a, b). Thus, it is likely that the blue luminescence reported in this work is associated with Ti impurities, whereas orange to red luminescence seems to be associated with complex defect-related emission centers.
The correlation between the orange to red PL emission band (approx. 650 nm; blue lines in Fig. 9) and orange to red luminescence in unheated sapphire (Fig. 8), and between the emission band (approx. 525 nm; red lines in Fig. 9) and blue luminescence in heated sapphire (Fig. 8), is particularly evident in the LS group (Fig. 9b). In contrast, the HS group shows a reduction in emission across the visible spectrum after heating, indicating inertness under LWUV and SWUV excitation (Fig. 9a). The SF group exhibits a notable increase in the red emission band (Fig. 9c) and intense purplish-red luminescence under LWUV excitation after heating. Interestingly, this group also displays strong blue luminescence under SWUV excitation despite the absence of a corresponding blue emission band, likely due to the 325 nm excitation laser used in our PL investigation. Variations in excitation wavelengths significantly affect observed emissions, as noted by Wong et al. (1995a) and Vigier et al. (2023), who showed that their sapphire emission band at 425 nm was only visible with a 254 nm excitation laser. Utilizing distinct SWUV (225 nm) and LWUV (365 nm) lasers, or conducting excitation spectroscopy, may yield more accurate results compared to relying solely on a 325 nm laser. Thus, the presence of orange to red luminescence at approx. 650 nm and blue luminescence at around 525 nm is a vital indicator for differentiating unheated and heated sapphire.
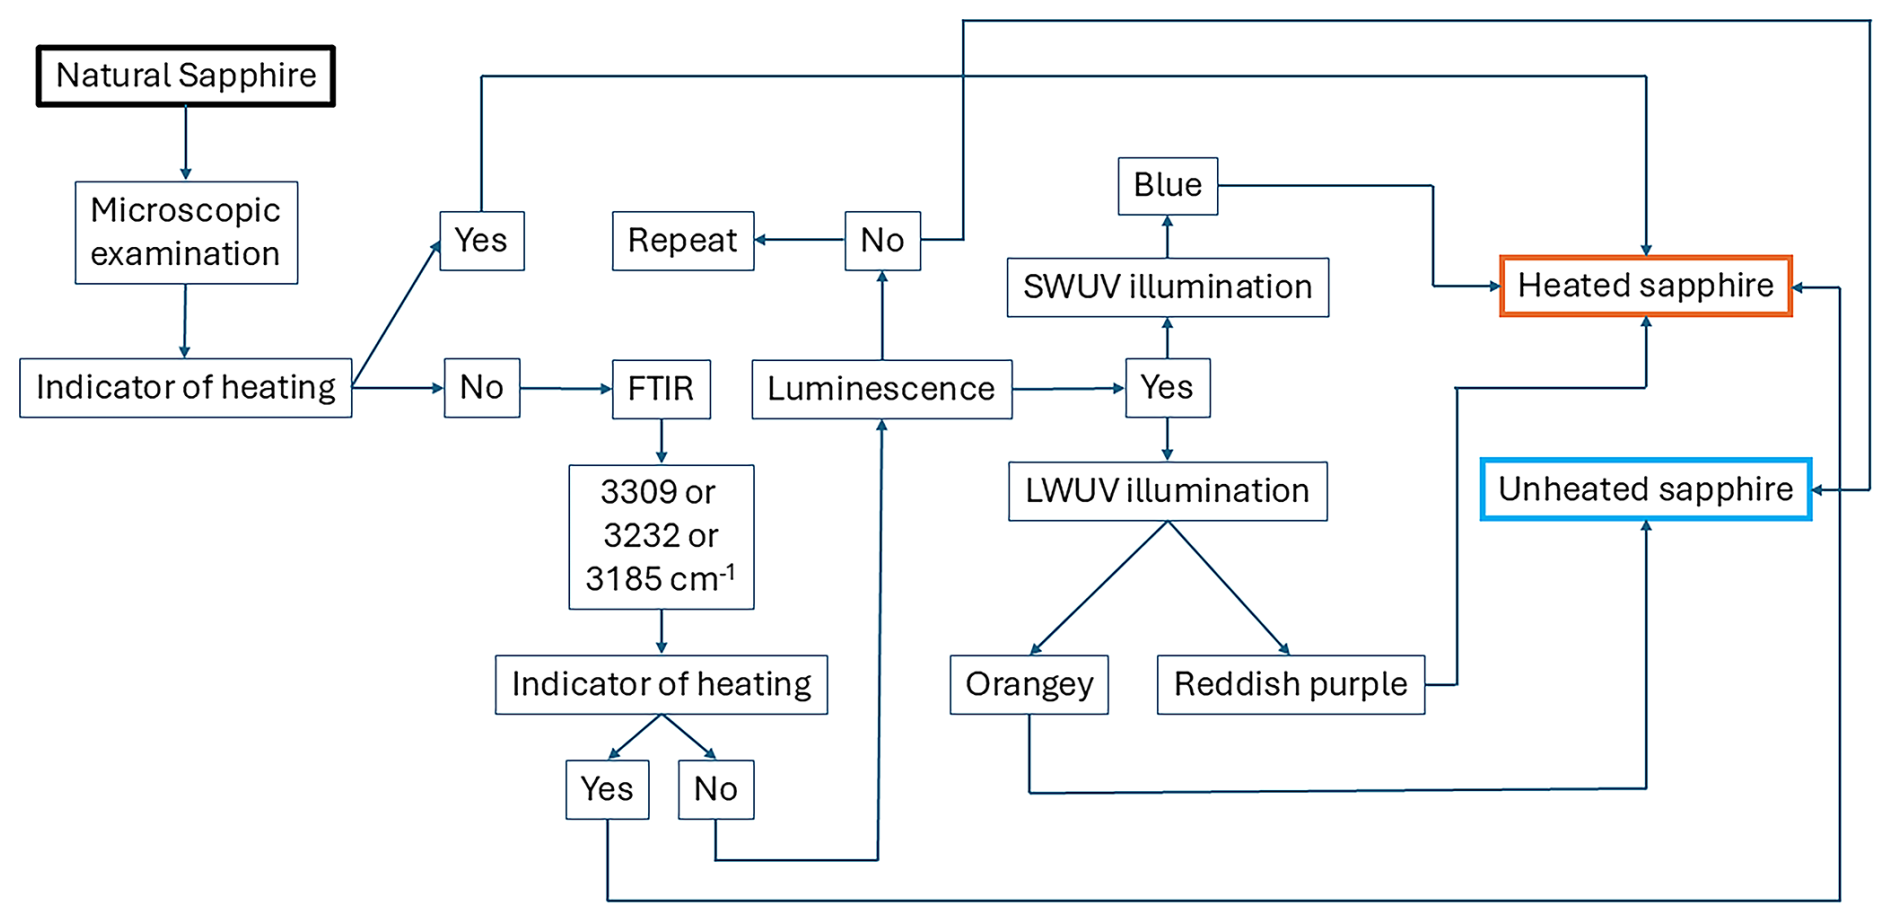
Figure 10Flowchart proposing the combined strategy for heated sapphire identification criteria.
The present study demonstrates that melt inclusions (∼ 1 µm) serve as indicators of heat treatment in sapphires and highlights the critical role of luminescence in distinguishing unheated from heated geuda sapphire. Under LWUV light, orange luminescence may arise from defect-related F centers, while blue luminescence under SWUV light likely correlates with Ti impurities. Geuda sapphires with low Fe concentrations exhibit distinct luminescence, whereas those with HS inclusions show minimal luminescence due to Fe2+-quenching effects. The presence of orange luminescence may be a helpful indicator for unheated geuda sapphires, while blue luminescence is generally absent in unheated samples, confirming its utility for identifying heated geuda sapphire. Although the 3309 cm−1 O–H stretching band from FTIR analysis alone is insufficient for differentiation, increased intensity around 580 nm of an optical spectrum effectively indicates heat treatment, as it corresponds to higher Fe–Ti pair concentrations from silk inclusion decomposition. Combining blue and/or purplish-red luminescence with additional analytical techniques provides a promising strategy for accurately distinguishing between unheated and heated geuda sapphires (Fig. 10). Future research should acquire emission and excitation spectra on the samples before and after heat treatment. Further investigation of luminescence characteristics from various sapphire origins (and colors) and clarifying the specific Fe and Ti concentrations impacting luminescence is also recommended. Finally, using laser excitation as low as 200–254 nm may enhance the detection of emission shifts towards the blue region in heated sapphires, improving gemological identification criteria.
All the data obtained in this paper can be provided by the corresponding author upon request.
TP, CS, BW, and LN conducted conceptualization; EGZ acquired samples; TP, CS, BW, LN, CCN, MW, EL, GG, and TS conducted analyses and evaluation; TP wrote the paper; and all co-authors reviewed and edited the paper.
The contact author has declared that none of the authors has any competing interests.
Publisher’s note: Copernicus Publications remains neutral with regard to jurisdictional claims made in the text, published maps, institutional affiliations, or any other geographical representation in this paper. While Copernicus Publications makes every effort to include appropriate place names, the final responsibility lies with the authors.
We thank Andreas Wagner (Universität Wien) for sample preparation and Sopit Poompeang (Chulalongkorn University, Bangkok) for assistance in EPMA analysis. The constructive comments of the two anonymous reviewers are greatly appreciated. Teerarat Pluthametwisute acknowledges the use of QuillBot's artificial intelligence to facilitate grammatical verification in an earlier draft of this paper. This research project was supported by the Second Century Fund (C2F), Chulalongkorn University, Bangkok (postdoctoral researcher number 80004543). Finally, this research was an initiative of an international network, Hub of Talents in Gem and Jewelry Industries, supported by the National Research Council of Thailand (Ministry of Higher Education, Science, Research and Innovation).
This research project is supported by the Second Century Fund (C2F), Chulalongkorn University, Bangkok (postdoctoral researcher number 80004543).
This paper was edited by Andrea Di Muro and reviewed by two anonymous referees.
Alombert-Goget, G., Li, H., Guyot, Y., Brenier, A., and Lebbou, K.: Luminescence and coloration of undoped and Ti-doped sapphire crystals grown by Czochralski technique, J. Lumin., 169, 516–519, https://doi.org/10.1016/j.jlumin.2015.02.001, 2016a.
Alombert-Goget, G., Li, H., Faria, J., Labor, S., Guignier, D., and Lebbou, K.: Titanium distribution in Ti-sapphire single crystals grown by Czochralski and Verneuil technique, Opt. Mater., 51, 1–4, https://doi.org/10.1016/j.optmat.2015.11.016, 2016b.
Andrade, L. H. C., Lima, S. M., Novatski, A., Neto, A. M., Bento, A. C., Baesso, M. L., Gandra, F. C. G., Guyot, Y., and Boulon, G.: Spectroscopic assignments of Ti3+ and Ti4+ in titanium-doped OH-free low silica calcium aluminosilicate glass and role of structural defects on the observed long lifetime and high fluorescence of Ti3+ ions, Phys. Rev. B, 78, 224202, https://doi.org/10.1103/PhysRevB.78.224202, 2008
Beran, A. and Rossman, G. R.: OH in naturally occurring corundum, Eur. J. Mineral., 18, 441–447, https://doi.org/10.1127/0935-1221/2006/0018-0441, 2006.
Cartier, L. E.: Ruby and sapphire from marosely, Madagascar, J. Gemmol., 31, 171–180, https://doi.org/10.15506/JoG.2009.31.5.171, 2009.
Choi, E., Song, K., An, S., Lee, K., Youn, M., Park, K., Jeong, S., and Kim, H.: Cu/ZnO/AlOOH catalyst for methanol synthesis through CO2 hydrogenation, Korean J. Chem. Eng., 35, 73–81, https://doi.org/10.1007/s11814-017-0230-y, 2018.
Crowningshield, R.: Developments and highlights at the gem trade lab in new york: Unusual items encountered (sapphire with unusual fluorescence), Gems Gemol., 12, 3, 1966.
Crowningshield, R.: Developments and highlights at GIA's lab in New York: Unusual fluorescence, Gems Gemol., 13, 120–122, 1970.
Delattre, S., Balan, E., Lazzeri, M., Blanchard, M., Guillaumet, M., Beyssac, O., Haussühl, E., Winkler, B., Salje, E. K. H., and Calas, G.: Experimental and theoretical study of the vibrational properties of diaspore (α-AlOOH), Phys. Chem. Miner,, 39, 93–102, https://doi.org/10.1007/s00269-011-0464-x, 2012.
Dubinsky, E. V., Stone-Sundberg, J., and Emmett, J. L.: A quantitative description of the causes of color in corundum, Gems Gemol., 56, 2–28, https://doi.org/10.5741/gems.56.1.2, 2020.
Ediriweera, R. and Perera, S.: Heat treatment of geuda stones – spectral investigation, J. Gemmol., 21, 403–410, https://doi.org/10.15506/jog.1989.21.7.403, 1989.
Emmett, J. L. and Douthit, T. R.: Heat treating the sapphires of Rock Creek, Montana, Gems Gemol., 29, 250–272, https://doi.org/10.5741/gems.29.4.250, 1993.
Emmett, J. L., Scarratt, K., McClure, S. F., Moses, T., Douthit, T. R., Hughes, R., Novak, S., Shigley, J. E., Wang, W., Bordelon, O., and Kane, R. E.: Beryllium diffusion of ruby and sapphire, Gems Gemol., 39, 84–135, https://doi.org/10.5741/gems.39.2.84, 2003.
Evans, B. D.: Ubiquitous blue luminescence from undoped synthetic sapphire, J. Lumin., 60–61, 620–626, https://doi.org/10.1016/0022-2313(94)90233-X, 1994.
Ferguson, J. and Fielding, P. E.: The origins of the colors of yellow, green and blue sapphires, Chem. Phys. Lett., 10, 262–265, https://doi.org/10.1016/0009-2614(71)80282-8, 1971.
Ferguson, J. and Fielding, P. E.: The origins of the colors of natural yellow, blue, and green sapphires, Aust. J. Chem., 25, 1371–1385, https://doi.org/10.1071/CH9721371, 1972.
Filatova, N. V., Kosenko, N. F., and Artyushin, A. S.: The physicochemical analysis of bayerite Al(OH)3→γ-Al2O3 transformation, J. Sib. Fed. Univ. Chem., 14, 527–538, https://doi.org/10.17516/1998-2836-0260, 2021.
Fritsch, E., Chalain, J. P., Hanni, H., Devouard, B., Chazot, G., Giuliani, G., Schwartz, D., Rollion-Bard, C., Garnier, V., Barda, S., Ohnenstetter, D., Notari, F., and Maitrallet, P.: Le nouveau traitement produisant des couleurs orange a jaune dans les saphirs, Revue de Gemmologie no. 147-Février 2003, 147, 11–23, https://horizon.documentation.ird.fr/exl-doc/pleins_textes/divers19-12/010034444.pdf (last access: 13 September 2023), 2003.
Häger, T.: Farbgebende und “farbhemmende” Spurenelemente in blauen Saphiren, Berichte der Deutschen Mineralogischen Gesellschaft – Beih. Eur. J. Mineral., 4, 109, 1992.
Häger, T.: High temperature treatment of natural corundum, in: Proceeding of the International Workshop on Material Characterization by Solid State Spectroscopy: The Minerals of Vietnam, Hanoi, 4–10 April 2001, 1–10, 2001.
Hughes, E. B. and Perkins, R.: Madagascar sapphire: Low temperature heat treatment experiments, Gems Gemol., 55, 184–197, https://doi.org/10.5741/GEMS.55.2.184, 2019.
Hughes, R. W.: Ruby & Sapphire, RWH Publishing, 1st edn., 511 pp., ISBN 0964509768, 1997.
Hughes, R. W.: Ruby & sapphire: A gemologist's guide, RWH Publishing/Lotus Publishing, 816 pp., ISBN 9780964509719, 2017.
Jaliya, R. G. C., Dharmaratne, P. G. R., and Wijesekara, K. B.: Characterization of heat treated geuda gemstones for different furnace conditions using FTIR, XRD and UV-Visible spectroscopy methods, Solid Earth Sci., 5, 282–289, https://doi.org/10.1016/j.sesci.2020.11.001, 2020.
Jung, I. H., Eriksson, G., Wu, P., and Pelton, A.: Thermodynamic modeling of the Al2O3-Ti2O3-TiO2 system and its applications to the Fe–Al–Ti–O inclusion diagram, ISIJ Int., 49, 1290–1297, https://doi.org/10.2355/isijinternational.49.1290, 2009.
Kammerling, R. C., Koivular, J. I., and Kane, R. E.: Gemstone enhancement and its detection in the 1980s, Gems Gemol., 26, 32–49, https://doi.org/10.5741/GEMS.26.1.32, 1990.
Kane, R. E.: The gemological properties of Chatham flux-grown synthetic orange sapphire and synthetic blue sapphire, Gems Gemol., 18, 140–153, https://doi.org/10.5741/GEMS.18.3.140, 1982.
Krebs, J. J. and Maisch, W. G.: Exchange effects in the optical-absorption spectrum of Fe3+ in Al2O3, Phys. Rev. B, 4, 757–769, https://doi.org/10.1103/PhysRevB.4.757, 1971.
Kyi, U. H., Buchhol, P., and Wolf, D.: Heat treatment of milky sapphires from the Mogok stone tract, Myanmar, J. Gemmol., 26, 313–315, https://doi.org/10.15506/jog.1999.26.5.313, 1999.
Lacovara, P., Esterowitz, L., and Kokta, M.: Growth, spectroscopy, and lasing of titanium-doped sapphire, IEEE J. Quantum Elect., 21, 1614–1618, https://doi.org/10.1109/JQE.1985.1072563, 1985.
Mattson, S. M. and Rossman, G. R.: Fe2+-Ti4+ charge transfer in stoichiometric Fe2+,Ti4+-minerals, Phys. Chem. Miner., 16, 78–82, https://doi.org/10.1007/BF00201333, 1988.
McClure, D. S.: Optical spectra of transition-metal ions in corundum, J. Chem. Phys., 36, 2757–2779, https://doi.org/10.1063/1.1732364, 1962.
McClure, S. F. and Smith, C. P.: Gemstone enhancement and detection in the 1990s, Gems Gemol., 36, 336–539, https://doi.org/10.5741/GEMS.36.4.336, 2000.
McClure, S. F., Kane, R. E., and Sturman, N.: Gemstone enhancement and detection in the 2000s, Gems Gemol., 46, 218–240, https://doi.org/10.5741/GEMS.46.3.218, 2010.
Mikhailik, V. B., Kraus, H., Wahl, D., and Mykhaylyk, M. S.: Luminescence studies of Ti-doped Al2O3 using vacuum ultraviolet synchrotron radiation, Appl. Phys. Lett., 86, 101909, https://doi.org/10.1063/1.1880451, 2005.
Monarumit, N., Lhuaamporn, T., Wathanakul, P., Saiyasombat, C., and Wongkokua, W.: The acceptor-donor pair recombination of beryllium-treated sapphires, Radiat. Phys. Chem., 206, 110756, https://doi.org/10.1016/j.radphyschem.2023.110756, 2023.
Moon, A. R. and Phillips, M. R.: Defect clustering and color in Fe, Ti: α-Al2O3, J. Am. Ceram. Soc., 77, 356–367, https://doi.org/10.1111/j.1151-2916.1994.tb07003.x, 1994.
Nasdala, L. and Fritsch, E.: Luminescence: The “Cold Glow” of Minerals, Elements, 20, 287–292, https://doi.org/10.2138/gselements.20.5.287, 2024.
Nassau, K.: The causes of color, Sci. Am., 243, 124–154, https://doi.org/10.1038/SCIENTIFICAMERICAN1080-124, 1980.
Nassau, K.: Heat treating ruby and sapphire: Technical aspects, Gems Gemol., 17, 121–131, https://doi.org/10.5741/GEMS.17.3.121, 1981.
Nelson, D. F. and Sturge, M. D.: Relation between absorption and emission in the region of the R lines of ruby, Phys. Rev., 137, A1117–A1130, https://doi.org/10.1103/PhysRev.137.A1117, 1965.
Nikolskaya, L. V., Terekhova, V. M., and Samoilovich, M. I.: On the origin of natural sapphire color, Phys. Chem. Miner., 3, 213–224, https://doi.org/10.1007/BF00633571, 1978.
Norrbo, I., Gluchowski, P., Hyppänen, I., Laihinen, T., Laukkanen, P., Mäkelä, J., Mamedov, F., Santos, H. S., Sinkkonen, J., Tuomisto, M., Viinikanoja, A., and Lastusaari, M.: Mechanisms of tenebrescence and persistent luminescence in synthetic hackmanite Na8Al6Si6O24(Cl,S)2, ACS Appl. Mater. Inter., 8, 11592–11602, https://doi.org/10.1021/acsami.6b01959, 2016.
Notari, F., Fritsch, E., and Grobon, C.: Comment l'observation de la luminescence (fuorescence) peut aider a l'identification des corindons jaunes, rose orange et orange, traites par diffusion du beryllium (How the observation of luminescence might aid in the identification of yellow, orangy pink and orange corundum treated by Be-diffusion), Rev. de Gem., 148, 40–43, 2003.
Notari, F., Hainschwang, T., Caplan, C., and Ho, K.: The heat treatment of corundum at moderate temperature, InColor, 42, 15–23, 2018.
Page, P. S., Dhabekar, B. S., Bhatt, B. C., Dhoble, A. R., and Godbole, S. V.: Role of Ti4+ in the luminescence process of Al2O3:Si,Ti, J. Lumin., 130, 882–887, https://doi.org/10.1016/j.jlumin.2009.12.029, 2010.
Palke, A. C., Saeseaw, S., Renfro, N. D., Sun, Z., and McClure, S. F.: Geographic origin determination of blue sapphire, Gems Gemol., 55, 536–579, https://doi.org/10.5741/gems.55.4.536, 2019.
Peiris, B. P. S.: Color enhancement of diesal geuda, in: Proceedings of the National symposium on geuda heat treatment, Sri Lanka, 10–11 June 1993, 113–122, ISBN 955-9251-00-7, 1993.
Perera, I.: Identification of treatable geuda by spectral investigations, in: Proceedings of the National symposium on geuda heat treatment, Sri Lanka, 10–11 June 1993, 89–98, ISBN 955-9251-00-7, 1993
Perera, S. Z., Pannila, A. S., Gunasekera, H. P. N. J., and Ediriweera, R. N.: Anomalous behaviour of certain geuda corundums during heat treatment, J. Gemmol., 22, 405–407, https://doi.org/10.15506/jog.1991.22.7.405, 1991.
Pisutha-Arnond, V.: Ruby & sapphire treatments and identification: Decades of advancement, Amarin Printing and Publishing, Bangkok, 96 pp., ISBN 978–6169145097, 2017.
Saeseaw, S., Kongsomart, B., Atikarnsakul, U., Khowpong, C., Vertriest, W., and Soonthorntantikul, W.: Update on “low temperature” heat treatment of Mozambican ruby: A focus on inclusions and FTIR spectroscopy, News from research, Gemological Institute of America, 37 pp., https://www.gia.edu/doc/low_HT_Moz_report.pdf (last access: 11 October 2022), 2018.
Schmetzer, K. and Kiefert, L.: Spectroscopic evidence for heat treatment of blue sapphires from Sri Lanka – additional data, J. Gemmol., 22, 80–82, 1990.
Segura, O.: La luminescence orange des corindons, Diplome Universitaire de Gemmologie de Nantes, 60 pp., https://gemmologie-francophonie.com/wp-content/uploads/2021/10/Segura_2013_DUG-La-luminescence-orange-des-corindons.pdf (last access: 8 October 2022), 2013.
Smith, C. P.: A contribution to understanding the infrared spectra of rubies from Mong Hsu, Myanmar, J. Gemmol., 24, 321–335, https://doi.org/10.15506/JoG.1995.24.5.321, 1995.
Soonthorntantikul, W., Khowpong, C., Atikarnsakul, U., Saeseaw, S., Sangsawong, S., Vertriest, W., and Palke, A.: Observations on the heat treatment of basalt-related blue sapphires, News from research, Gemological Institute of America, 60 pp., https://www.gia.edu/gia-news-research/observations-heat-treatment-of-basalt-related-blue-sapphires (last access: 13 April 2023), 2019.
Soonthorntantikul, W., Atikarnsakul, U., and Vertriest, W.: Blue sapphires from Mogok, Myanmar: A gemological review, Gems Gemol., 57, 292–317, https://doi.org/10.5741/GEMS.57.4.292, 2021.
Soysa, E. S. K. and Fernando, W. S.: A field classification of low value corundum in Sri Lanka, J. Natn. Sci. Coun. Sri Lanka, 20, 51–57, https://doi.org/10.4038/jnsfsr.v20i1.8058, 1992.
Spencer, L. J.: South African occurrences of willemite. Fluorescence of willemite and some other zinc minerals in ultra-violet rays, Mineral. Mag., 21, 388–396, https://doi.org/10.1180/minmag.1927.021.119.04, 1927.
Sripoonjan, T., Lhuaamporn, T., Nilhud, N., Sukkee, N., and Sutthirat, C.: Characteristics of Cyangugu sapphire from rwanda, in: Proceedings of the 4th International Gem and Jewelry Vonference (GIT2014) Chiang Mai, Thailand, 8–9 December 2014, 165–168, https://www.cigem.ca/research/PROCEEDINGS_GIT2014.pdf (last access: 26 May 2023), 2014.
Sun, T., Zhuo, Q., Chen, Y., and Wu, Z.: Synthesis of boehmite and its effect on flame retardancy of epoxy resin, High Perform. Polym., 27, 100–104, https://doi.org/10.1177/0954008314540312, 2015.
Sutthirat, C., Pattamalai, K., Sakkaravej, S., Pumpeng, S., Pisutha-Arnond, V., Wathanakul, P., Atichat, W., and Sriprasert, B.: Indications of heating in corundum from experimental results, Gems Gemol., 42, 3, 2006.
Themelis, T.: The heat treatment of ruby & sapphire: Experiments & observations, Ted Themelis, 3rd edn., 294 pp., ISBN 0940965577, 2018.
Townsend, M. G.: Visible charge transfer band in blue sapphire, Solid State Commun., 6, 81–83, https://doi.org/10.1016/0038-1098(68)90005-7, 1968.
Vertriest, W., Palke, A. C., and Renfro, N. D.: Field Gemology: Building a Research Collection and Understanding the Development of Gem Deposits, Gems Gemol., 55, 491–494, https://doi.org/10.5741/GEMS.55.4.490, 2019.
Vigier, M. and Fritsch, E.: More on orange luminescence in corundum, Gems Gemol., 58, 376–377, 2022.
Vigier, M., Fritsch, E., and Segura, O.: Orange luminescence of corundum as a source of geologic information?, Goldschmidt 2021 Abstract, Virtual conference, 4–9 July 2021, https://doi.org/10.7185/gold2021.3467, 2021a.
Vigier, M., Fritsch, E., and Segura, O.: Orange luminescence of corundum an atypical origin for gemmologists (part one), Revue de L'Association Française de Gemmologie No. 211-Mars 2021, 12–19, https://www.researchgate.net/publication/352706164 (last access: 15 September 2023), 2021b.
Vigier, M., Fritsch, E., and Segura, O.: Orange luminescence of corundum an atypical origin for gemmologists (part two), Revue de L'Association Française de Gemmologie Nø. 212-Juin 2021, 13–19, https://www.researchgate.net/publication/361183902 (last access: 16 September 2023), 2021c.
Vigier, M., Fritsch, E., Cavignac, T., Latouche, C., and Jobic, S.: Shortwave UV blue luminescence of some minerals and gems due to titanate groups, Minerals, 13, 104, https://doi.org/10.3390/min13010104, 2023.
Webster, R.: Practical Gemmology – A Study of the Identification of Gem-Stones, Pearls, And Ornamental Minerals, Mcintosh Press, 294 pp., ISBN 1446522873, 2014.
Wong, W. C., McClure, D. S., Basun, S. A., and Kokta, M. R.: Charge-exchange processes in titanium-doped sapphire crystals. I. Charge-exchange energies and titanium-bound excitons, Phys. Rev. B Condens. Matter, 51, 5682–5692, https://doi.org/10.1103/physrevb.51.5682, 1995a.
Wong, W. C., McClure, D. S., Basun, S. A., and Kokta, M. R.: Charge-exchange processes in titanium-doped sapphire crystals. II. Charge-transfer transition states, carrier trapping, and detrapping, Phys. Rev. B Condens. Matter, 51, 5693–5698, https://doi.org/10.1103/physrevb.51.5693, 1995b.
Zeug, M., Nasdala, L., Wanthanachaisaeng, B., Balmer, W. A., Corfu, F., and Wildner, M.: Blue zircon from Ratanakiri, Cambodia, J. Gemmol., 36, 112–132, https://doi.org/10.15506/JoG.2018.36.2.112, 2018.
Zeug, M., Nasdala, L., Chanmuang N., C., and Hauzenberger, C.: Gem topaz from the Schneckenstein crag, Saxony, Germany: Mineralogical characterization and luminescence, Gems Gemol., 58, 2–17, https://doi.org/10.5741/GEMS.58.1.2, 2022.