the Creative Commons Attribution 4.0 License.
the Creative Commons Attribution 4.0 License.
 | 02 Aug 2019
Overprinting translational domains in passive margin salt basins: insights from analogue modelling
Matthias Rosenau
Michael Warsitzka
Rob L. Gawthorpe
Current models of gravitational tectonics on the structural styles of salt-influenced passive margins typically depict domains of upslope extension and corresponding downslope contraction separated by a mid-slope domain of translation that is rather undeformed. However, an undeformed translational domain is rarely observed in natural systems as extensional and contractional structures tend to interfere in the mid-slope area. In this study, we use sandbox analogue modelling analysed by digital image correlation (DIC) to investigate some of the factors that control the structural evolution of translational domains. As in nature, experimental deformation is driven by slowly increasing gravitational forces associated with continuous basal tilting. The results show that a translational domain persists throughout the basin evolution when the pre-kinematic layer is evenly distributed. However, a thin (1 mm in the experiment, 100 m in nature) pre-kinematic layer can render the translational domain relatively narrow compared to settings with a thicker (5 mm) pre-kinematic layer. In contrast, early differential sedimentary loading in the mid-slope area creates minibasins separated by salt diapirs overprinting the translational domain. Similarly, very low sedimentation rate (1 mm per day in the experiment, < 17 m Ma−1 in nature) in the early stage of the experiment results in a translational domain quickly overprinted by downslope migration of the extensional domain and upslope migration of the contractional domain. Our study suggests that the architecture of passive margin salt basins is closely linked to the pre- and syn-kinematic cover thickness. The translational domain, as an undeformed region in the supra-salt cover, is a transient feature and overprinted in passive margins with either low sedimentation rate or a heterogeneous sedimentation pattern.
- Article
(12298 KB) - Full-text XML
- BibTeX
- EndNote


In passive margin basins containing syn- and post-rift salt deposits, salt tectonics generally have significant influences on structural style and stratigraphic architecture (e.g. Jackson and Vendeville, 1994; Rowan, 2014; Tari et al., 2003). Tilting due to thermal subsidence or seaward progradation of sedimentary wedges causes passive margin salt basins to experience deformations related to gravitational failure, typically forming a linked system of upslope extension and downslope contraction separated by a more or less undeformed, translational domain in the mid-slope (e.g. Brun and Fort, 2011; Cramez and Jackson, 2000; Dooley et al., 2017; Fort et al., 2004a; Rowan et al., 2004) (Fig. 1a).
The translational domain has received relatively limited attention, whereas the extensional and contractional domains have been studied extensively. The translation domain is generally considered to be a rather passive region of the cover strata, which remains largely undeformed during basin-wide gravitational gliding and spreading (Fig. 1a) (e.g. Adam et al., 2012a; Dooley et al., 2017; Fort et al., 2004a). However, sub-surface data generally show evidence of deformation within the mid-slope areas of translational domains in most passive margin salt basins, such as those in the West Africa and Brazilian margins (e.g. Marton et al., 2000; Modica and Brush, 2004) (Fig. 1b and c). To the best of our knowledge, only one subsurface study so far has interpreted an overall undeformed translational domain based on 2-D regional seismic analysis (Gradmann et al., 2005). However, this interpretation has been challenged more recently based on high-quality 2-D and 3-D seismic analysis, which suggests widespread faulting in the translational domain (Gvirtzman et al., 2015). Most passive margin salt basins have typical structures of minibasins and salt diapirs in the mid-slope, translational domain area (Fig. 1b and c). Recent studies have shown that base-salt relief can initiate extensional and contractional structures as well as ramp syncline basins in the mid-slope, therefore modifying the translational domain (e.g. Dooley et al., 2017, 2018; Ferrer et al., 2017; Pichel et al., 2018). However, in basins where pre-salt relief is limited or very gentle (e.g. Fig. 1b and c), other mechanisms may be responsible for overprinting the translational domain.
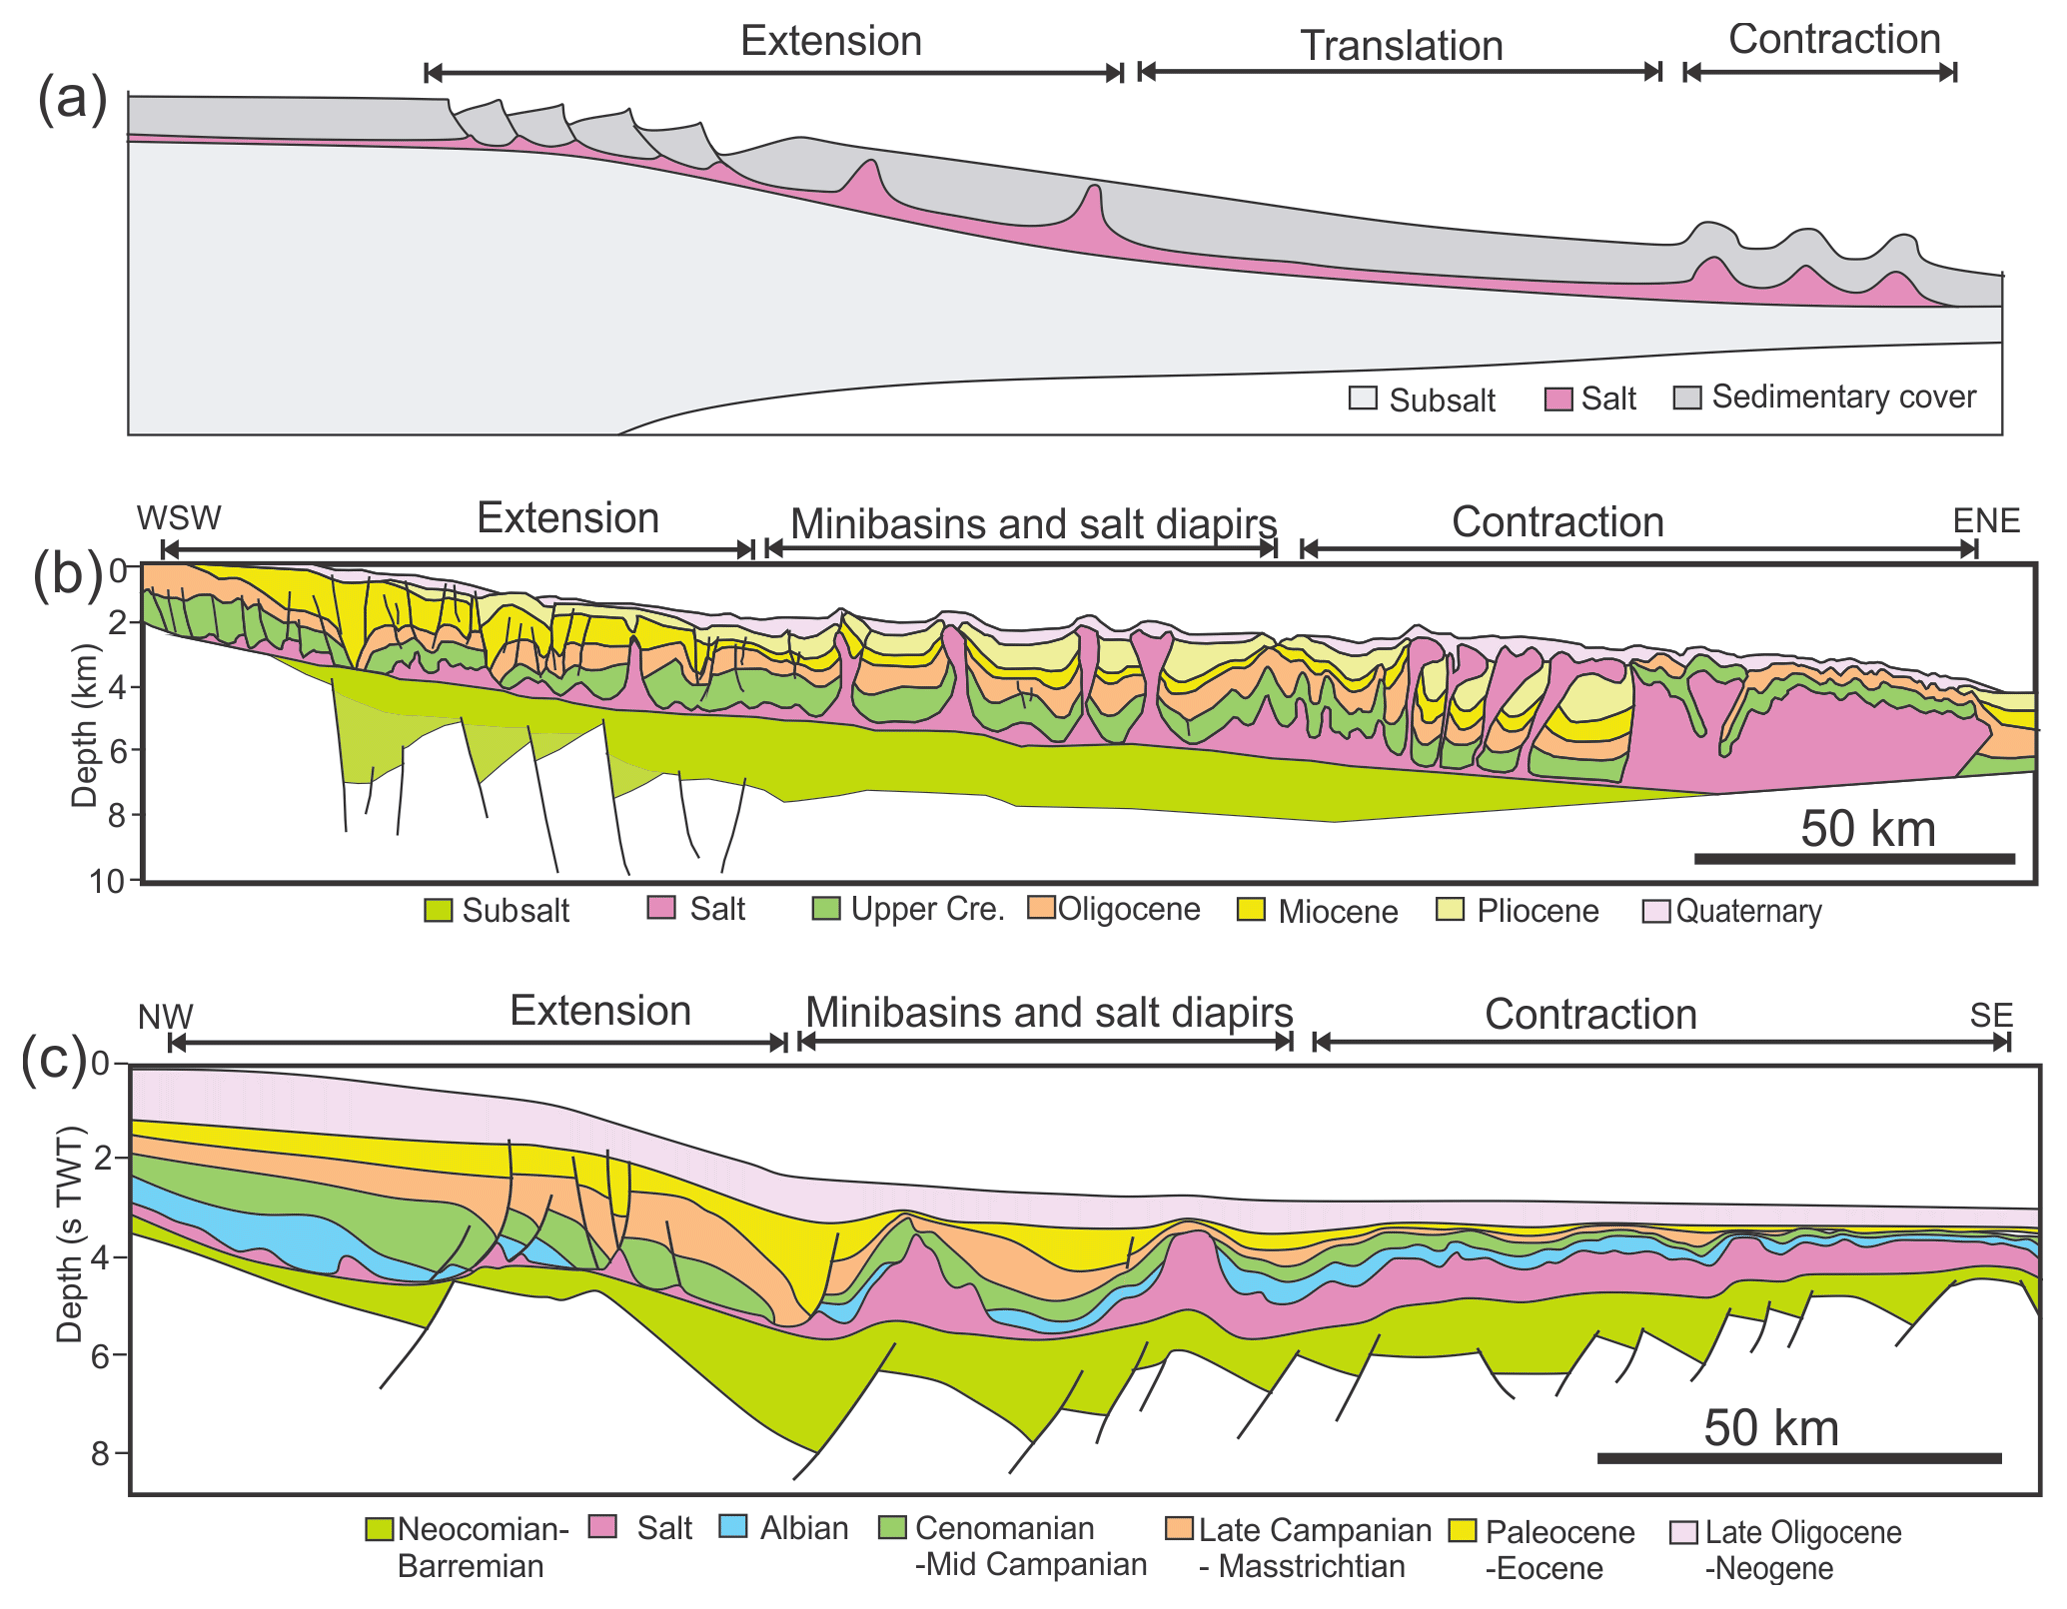
Figure 1(a) Simplified cross section illustrating the kinematic domains and structural styles in a typical passive margin salt basin (modified after Rowan et al., 2004; Brun and Fort, 2011). (b) Regional interpreted seismic profile crossing the Lower Congo Basin (modified after Marton et al., 2000). Note the minibasins and diapirs in the mid-slope. (c) Regional interpreted seismic profile crossing the central Santos Basin (modified after Modica and Brush, 2004). Note the large minibasins and diapirs in the mid-slope area.
The concept of a translational domain is rather loosely defined because it has both spatial and kinematic meanings. When used as a term describing the basin-wide structural partitioning, the term translational domain is usually used to indicate an area located between the upslope extensional and downslope contractional structures (e.g. Fig. 1a). For example, when describing the structural characteristics of the Lower Congo Basin, Rowan (2014) used the term of translational domain to indicate the mid-slope area of salt minibasins and diapirs. Yet many diapirs and minibasins in the mid-slope have an extensional or contractional origin, due to the downslope and upslope migration of extensional and contractional domains (Brun and Fort, 2011; Fort et al., 2004a). When referring to the kinematic behaviour of the salt basin, translational domain is used to define a zone within the salt basin that is transferring the deformation without being internally deformed (e.g. Adam et al., 2012a). In this sense, the translational domain may not be part of the final basin architecture, but it is a transient feature of the basin evolution. In this paper, a translational domain satisfies two criteria: it is a largely undeformed (at least transiently) area and connects upslope extension and downslope contraction.
In this paper, we investigate the structural evolution of a salt-bearing passive margin's mid-slope area and the origin of a translation domain. Using sandbox modelling combined with quantitative surface deformation monitoring by means of 4-D (3-D plus time) DIC (digital image correlation), we demonstrate how the translation domain originates and evolves, and we investigate possible mechanisms that may overprint it during ongoing gravitational deformation. Specifically, we focus on the influences of pre- and syn-kinematic layer thickness and differential sedimentary loading on the structural evolution of the translation domain. Furthermore, we investigated the overall evolution of different kinematic domains (extensional, translational and contractional) to understand their complexity and how they develop in space and time.
Analogue experiments using analogue materials, such as quartz sand and silicone oil, have been traditionally employed to gain insight into gravity-driven, thin-skinned salt tectonics (e.g. Ge et al., 1997; Mauduit and Brun, 1998; Mauduit et al., 1997; Rowan and Vendeville, 2006; Vendeville and Jackson, 1992). Quartz sand is suitable to model the supra-salt cover sediment due to its brittle behaviour. Similarly, silicone oil and salt both behave in a viscous manner in the model and in nature, respectively. In the last decade, the advances of quantitative and high-resolution “4-D” (three spatial dimensions plus time) DIC (digital image correlation)-based deformation monitoring techniques, which record time series of incremental experimental surface deformation, have allowed the analysis and reconstruction of the kinematic evolution of arrays of structures in great detail and accuracy (e.g. Adam et al., 2012a; Adam and Krezsek, 2012; Dooley et al., 2018; Warsitzka et al., 2015).
2.1 Rock analogue materials
In this study, we use a mix of granular materials to simulate the brittle sediment layer cover and PDMS (polydimethylsiloxane) silicone oil to represent the underlying viscous salt (e.g. Weijermars et al., 1993; Withjack and Callaway, 2000). The density contrast between commonly used pure quartz sand and silicone oil in analogue modelling is generally too high compared to natural prototypes (Allen and Beaumont, 2012). In unison with other studies (Adam et al., 2012a; Dooley et al., 2007), we hereby use a mixture of quartz sand (G12, grain size: < 400 µm, Rosenau et al., 2018) and foam glass spheres (company: LIAVER, grain size: 250–500 µm, Warsitzka et al., 2019) to adjust the density ratio between the cover layer and silicone. The weight ratio for a mixture of sand and foam glass sphere is 3:1 and the resulting mixture density is 1.13 g cm−3 after sieving (Table 1). The resulting density ratio between the granular mixture and silicone is 1.16, which is representative of a density ratio between cover sediments and underlying salt (e.g. Adam et al., 2012a; Allen and Beaumont, 2012; Warsitzka et al., 2015).
The frictional properties of the granular mix are similar to pure quartz sands used in analogue modelling (e.g. Klinkmüller et al., 2016). Static and sliding friction coefficients of the granular mixture are about 0.7 and 0.55, respectively, and the cohesion is of the order of a few tens of pascals as determined by using a ring shear tester (Warsitzka et al., 2019) (Table 1). The silicone oil used in the experiments (Bayer Korasilon G30M) has a density of 0.97 g cm−3 at a room temperature of 23 ∘C with a Newtonian viscosity of about 2×10⁴ Pa s at shear rates below 10−1 s−1 (Rudolf et al., 2016) (Table 1).
2.2 Model scaling
Adequate scaling of the analogue model from nature allows a direct comparison between the model and nature in terms of geometry, kinematic evolution, as well as the deformation driving and resisting forces (e.g. Costa and Vendeville, 2002; Hubbert, 1937; Ramberg, 1981). Based on dimensionless numbers representing ratios of forces, scaling factors for the basic dimensions of length, mass, and time are derived. Here we use the ratio Γ of lithostatic pressure vs. cohesion (C).
where ρ, g and l are density, gravitational acceleration and length, respectively, to scale the brittle regime and the ratio between lithostatic pressure and viscous strength (the so-called Ramberg number Ra):
where η and v are dynamic viscosity and velocity, respectively, to scale the viscous regime (e.g. Adam and Krezsek, 2012; Gemmer et al., 2005). Achieving the same Γ and Ra in the model as in nature ensures geometric, kinematic, and dynamic similarity between the analogue model and nature (e.g. Costa and Vendeville, 2002; Hubbert, 1937; Ramberg, 1981) and allows the derivation of scaling factors for all relevant dimensions and parameters. Among the scaling factors, the geometric (l*) and time (t*) scaling factors, where * marks the ratios of model vs. natural values, are particularly important to design the model and interpret modelling results. From Eqs. (1) and (2), it follows that, for brittle–viscous models, the timescale depends directly on the initial choice of length scale, density, and viscosity:
In this study, the geometric scaling bounded by the cohesion and densities of the rock analogue versus rocks is chosen as (1 cm in the model is 1 km in nature) (Table 1). The time scaling, dictated by the density of sediments and the viscosity of natural salt versus silicone oil and strain rate, is consequently after adjustment for submarine systems (4 h in the model is approximately 1 Ma in nature) (Table 1).
Table 1Material properties and scaling relationship of the experiments in this study. Note the geometric scaling of 1 cm in the model is 1 km in nature, and time scaling of 1 h in the model is 0.268 Ma in nature.
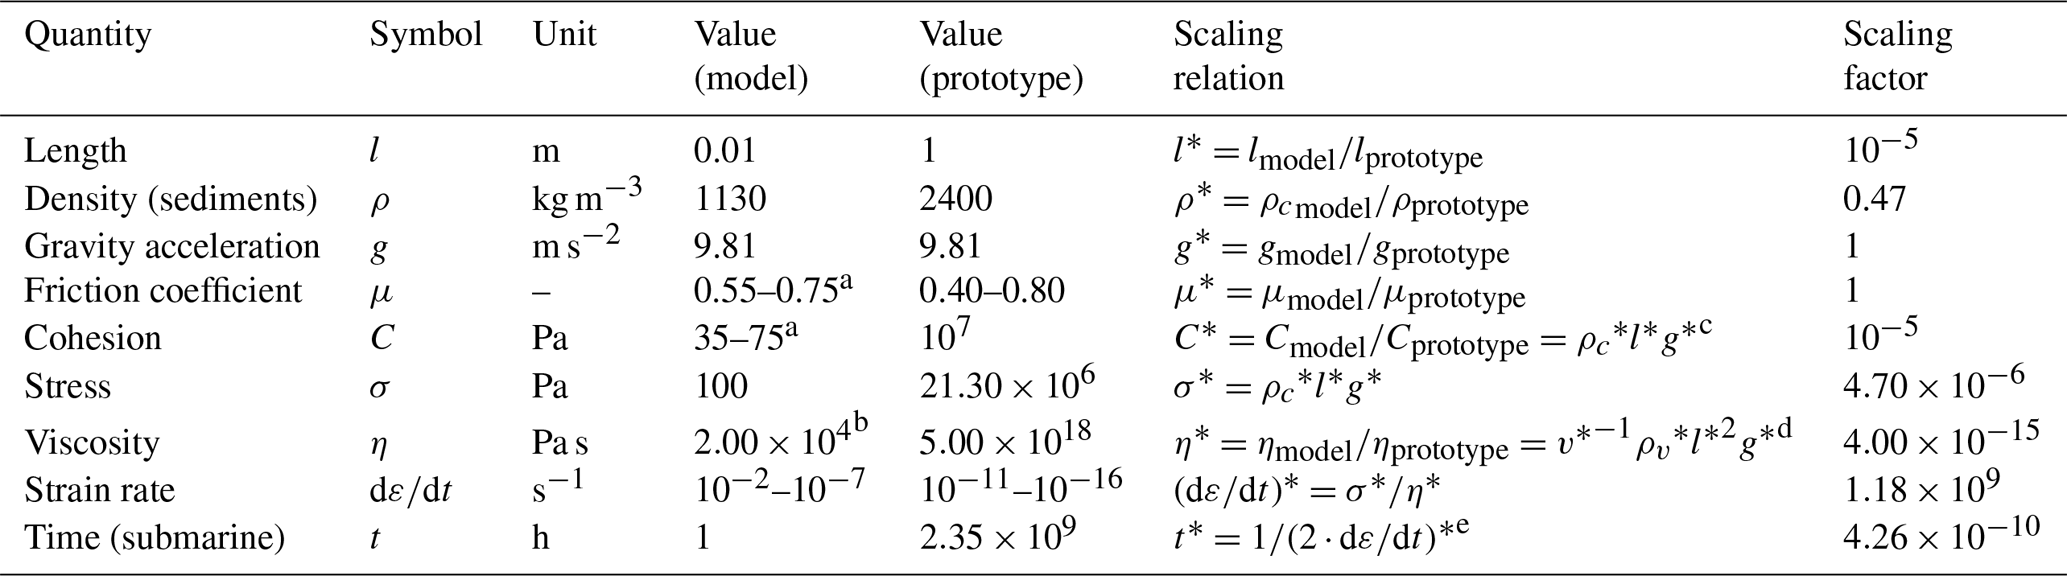
a For static > reactivation > dynamic friction coefficients (Warsitzka et al., 2019). b Rudolf et al. (2016). c brittle regime scaling based on the ratio between lithostatic pressure and cohesion. d viscous regime scaling based on the ratio between lithostatic pressure and viscous strength (Ramberg number), v is a characteristic velocity. e submarine systems at hydrostatic conditions deform at about half the rate of subaerial systems (Gemmer et al., 2005) because of the stabilizing effect of the water column and buoyancy. Since the experiment is conducted in sub-aerial environment, we here apply a generic correction factor of 1∕2 following Adam et al. (2012a).
2.3 Experimental setup and model design
The overall model setup shares the characteristics of earlier studies aiming to understand kinematic domain partition and evolution in passive margin salt basins (Fig. 2) (e.g. Adam et al., 2012a; Brun and Fort, 2004; Fort et al., 2004a). A flat rigid base of 1 m wide and 1.8 m long is covered by a double-wedge shape basal sand layer that serves as a mould for the basin fill akin to passive margin basins (Brun and Fort, 2011, 2012). The two wedges are 65 cm in the upslope and 25 cm in the downslope respectively (Fig. 2a). In each experiment, we simulate two basins, each 35 cm wide (35 km in nature) and 90 cm long (90 km in nature), built on the basal wedges separated by a 4 cm wide sand wall and bounded by two 3 cm wide sand walls on the outside boundaries (Fig. 2a). The basin depth is 2 cm at the basin's deepest location and pinches out upslope and downslope towards the basin edges (Fig. 2a). The tilting of the entire base and model towards the side of the short wedge is driven by a computer-controlled stepper motor at a continuous rate of 1∘ d−1 (0.17∘ Ma−1) (Fig. 2b). Importantly, no deformation occurs within or at the base of the basal sand wedges during the experiment.
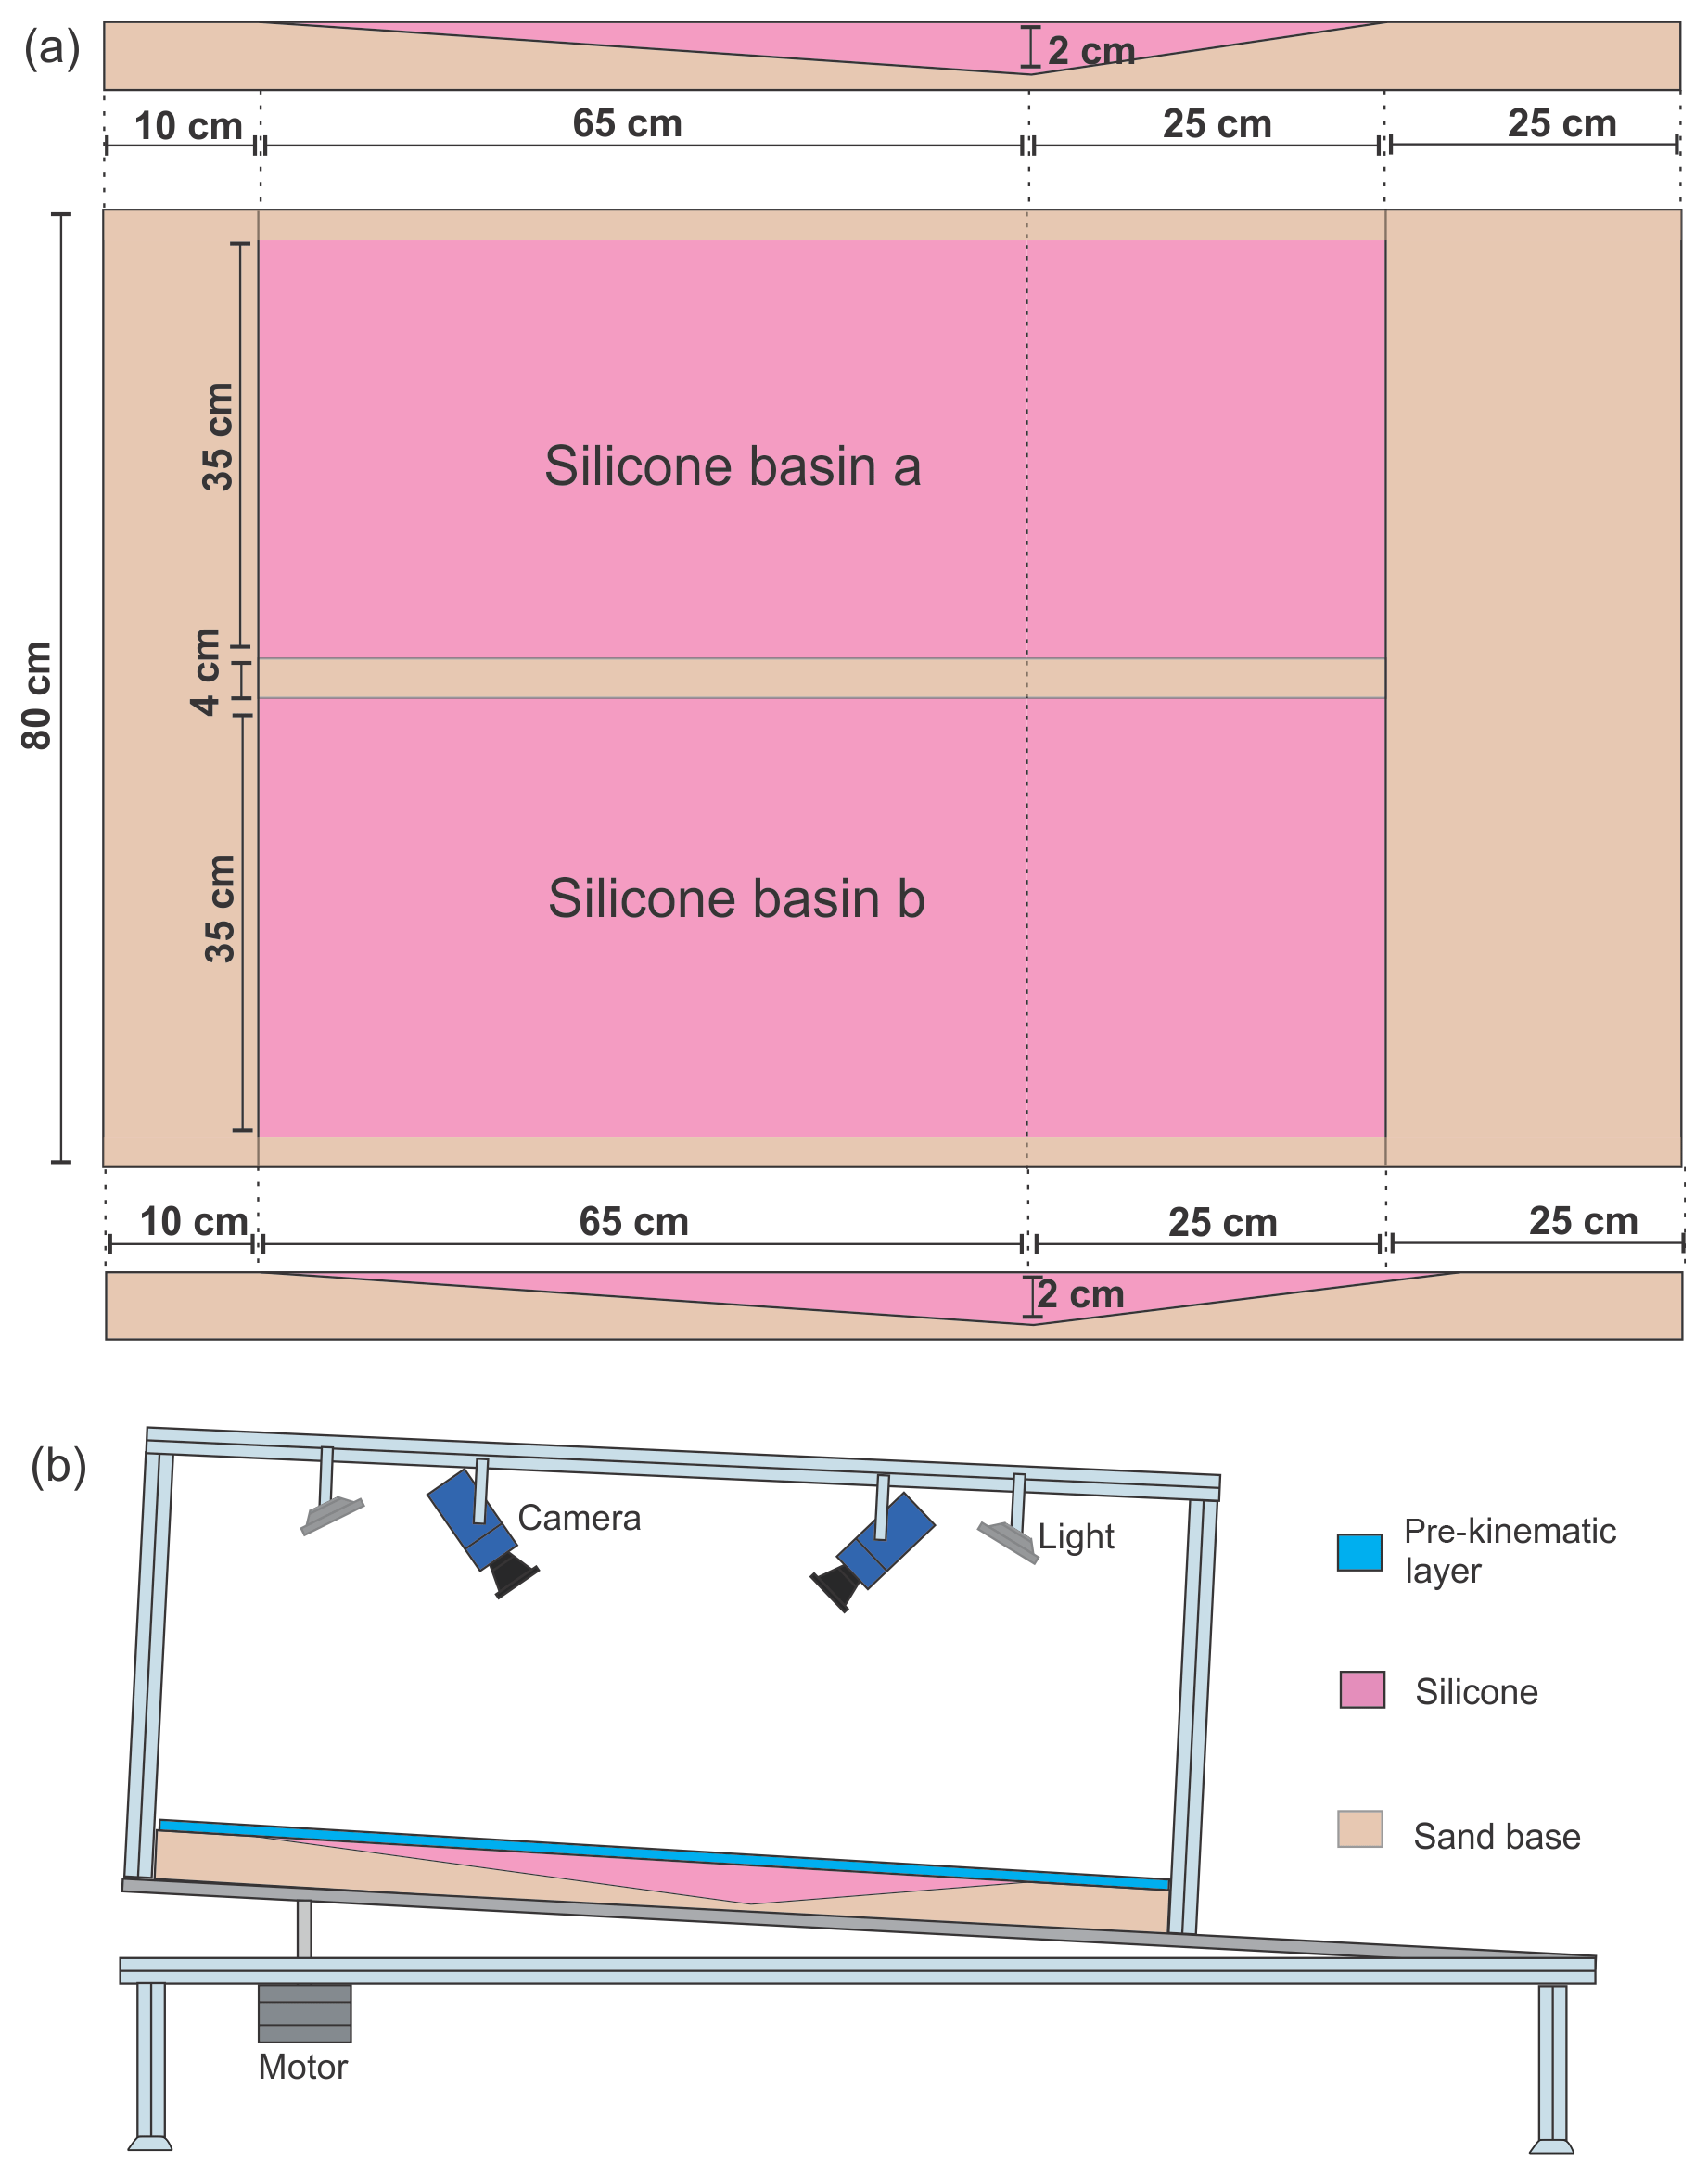
Figure 2Experimental setup and sketch of the apparatus. (a) Experimental setup including two identical silicone basins in each experimental run. The double-wedge shape of the silicone basin is 2 cm at its deepest. (b) 2-D sketch of the experimental setup. The cameras are attached to the tilting basal plate lifted by a stepper motor.
The basin is filled with silicone; once the silicone is free from air bubbles and has a flat upper surface, a pre-kinematic layer consisting of a mixture of quartz sand and foam glass beads is sieved onto the basin surface. Then, tilting is started at the rate of 1∘ per day until reaching a final tilting of 3.5∘ after 84 h (three and half days; 21 Ma in nature). Subsequently, the experiment continues for another 36 h to observe basin evolution under static, tilted conditions. The total running time is 5 d or 120 h, which is equal to approximate 30 Ma in nature (Appendix Table A1). During the experiment, the granular cover material is added by sieving every 12 h to simulate syn-kinematic sedimentation (Appendix Table A1). After the experiment, the model is sliced and photographed for cross-sectional analysis.
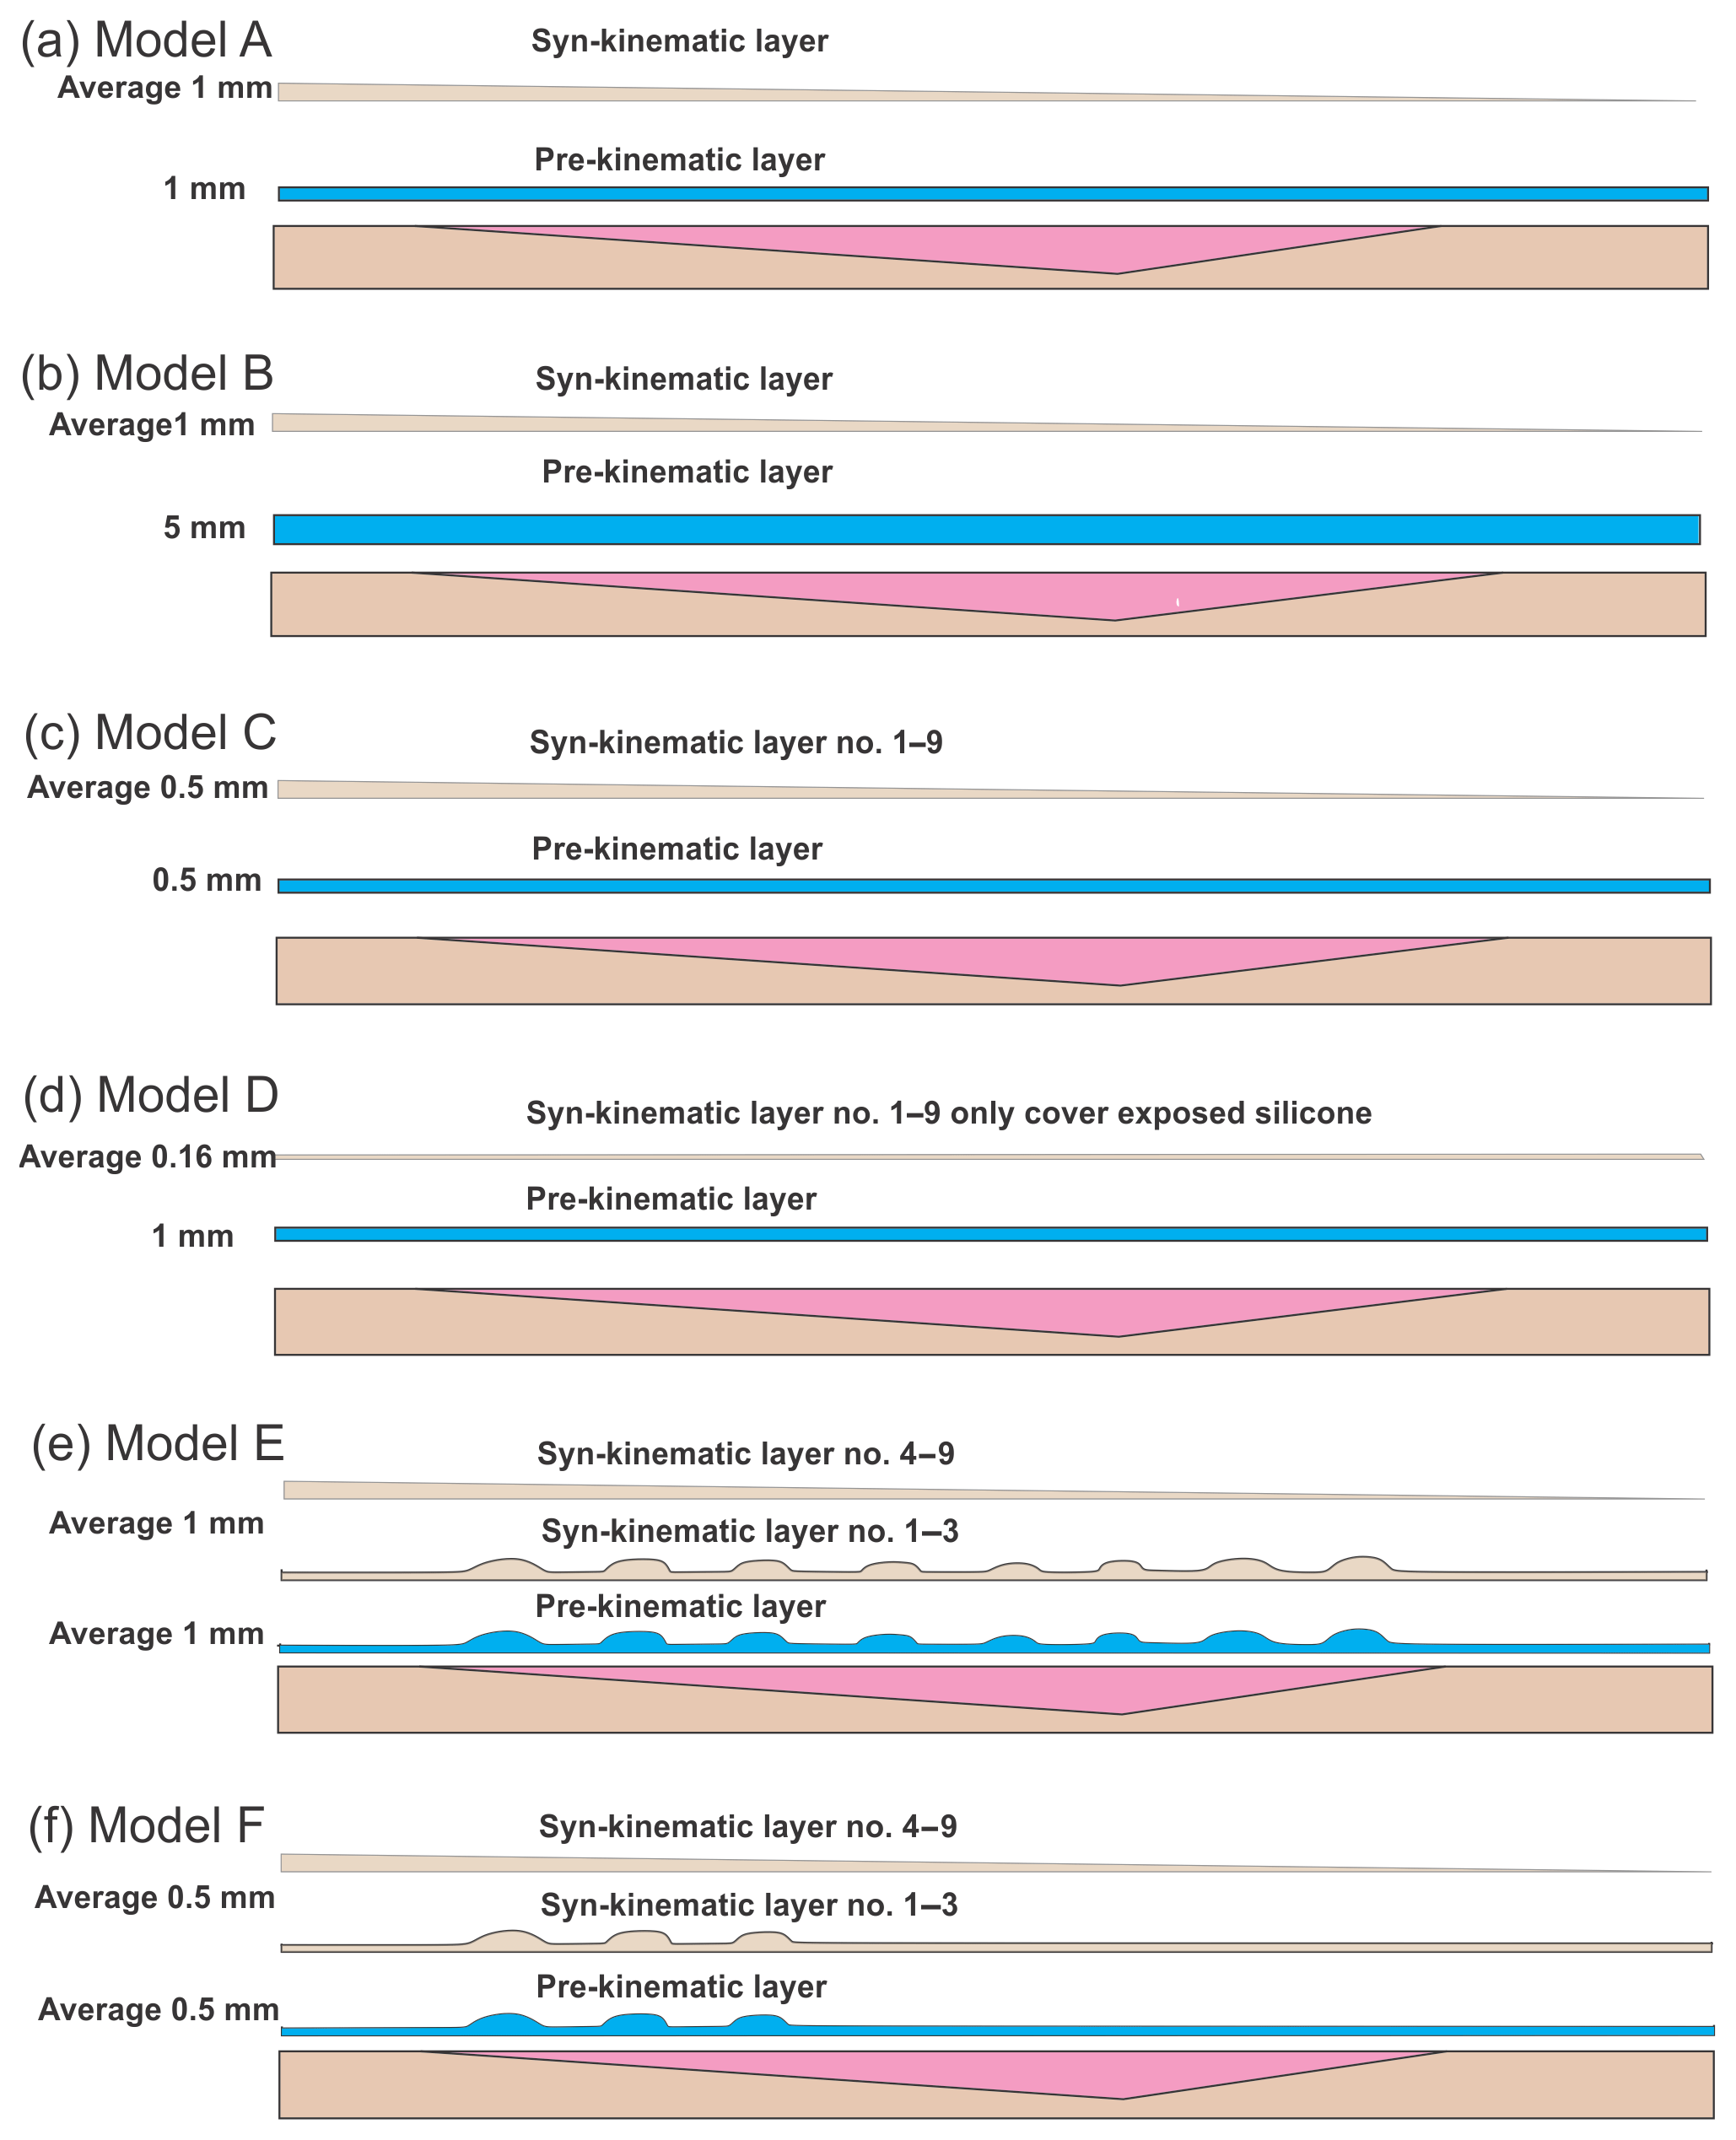
Figure 3Depositional scenarios for six models of the three experiments. The blue layers are pre-kinematic and brown layers are syn-kinematic. Note the minibasin shapes associated with differential loading in Model E and F. The syn-sedimentation thickness is an average as they are in wedge shape.
Three experiments, each with two basins, were performed for this study (Fig. 2a). Sedimentation patterns were different for the modelled silicone basins (Fig. 3). We group the modelling results into two categories with Models A–D focusing on the influences of cover thickness and sedimentation rate and Models E and F emphasizing the role of minibasin loading on translational domain evolution:
-
Model A aims to establish a baseline for investing the impact of sedimentation pattern and rate on the evolution of the translational domain. In Model A, the pre-kinematic layer is 1 mm thick and further sedimentation is added every 12 h with an overall wedge shape and 1 mm average thickness (Fig. 3a). The wedge-shape sedimentation, which thins downslope, mimics proximal sediment source areas and overall reduction in downslope sedimentation. Moreover, when deformation occurs creating extensional grabens or contractional folds, more materials are added over structures with topographic lows to mimic natural sedimentation. Such a sieving method is also applied for other models.
-
Model B has the same syn-kinematic sedimentation rate as the Model A, but with a pre-kinematic layer of 5 mm, in order to study the influences of pre-kinematic layer thickness on the translational domain evolution (Fig. 3b).
-
Model C investigates the translational domain development under reduced pre-kinematic layer thickness (0.5 mm) and sedimentation rate (0.5 mm per 12 h) (Fig. 3c) compared to Model A.
-
Model D has an even thickness of 1 mm for the pre-kinematic layer (Fig. 3d). Further sedimentation is only added when necessary to cover the newly exposed silicone. Therefore, Model D has negligible syn-kinematic sedimentation and provides an extreme example of translational domain evolution under sediment-starved condition with no significant influence from sedimentary differential loading.
-
Model E studies how differential loading influences the translational domain (Fig. 3e). Specifically, the pre-kinematic layer in Model E has an average thickness of 1 mm, but with a differential sedimentation pattern of eight minibasins created by sieving. We sieve a layer of sand up to 1 mm thicker than the surrounding areas to create the minibasins. The minibasins are 3–4 cm wide with 6–7 cm gaps in between. The differential sieving continues for another three rounds before the sieving shift to sedimentary wedge shape (Fig. 3e), because previous studies have suggested that differential loading is more likely to dominate the thin-skinned deformation system during the early stages of basin evolution (e.g. Adam et al., 2012a). Minibasin spacing and dimensions are constrained by generalization of natural observations where they can be a few kilometres to tens of kilometres in diameter and intervened by salt diapirs of similar size (e.g. Cramez and Jackson, 2000; Hudec and Jackson, 2004; Marton et al., 2000; Oluboyo et al., 2014).
-
Model F has both pre-kinematic layer (0.5 mm) and sedimentation rates (0.5 mm per sieving) reduced by a factor of 2 compared to Model E (Fig. 3f). We only add three minibasins as differential loading in the upslope area, with similar geometries to those of Model E (Fig. 3f). The objective is testing minibasin behaviours with thinner thickness. Model F also serves as a comparison to Model 3, in which no minibasin loading is introduced. The syn-kinematic differential sedimentation also continues for three sieving periods before wedge-shaped syn-kinematic sedimentation is applied (Appendix Table A1).
2.4 Experimental monitoring
We apply state-of-the-art strain monitoring methods using digital image correlation (DIC) to derive quantitative observational data from the experiments. The model surface is monitored by a stereoscopic pair of two digital 12 bit monochrome CCD cameras with 29 megapixels (LaVision Imager X-Lite 29M) at a time interval of 100 s (0.01 Hz frequency). We attach the cameras and a light (LED) system to a frame moving with the base. Thereby only deformation with respect to the base is recorded, i.e. gravity gliding without interfering with the tilting motion. The recorded stereoscopic images are processed with DIC techniques, which allows deriving the surface topography and full three-dimensional incremental surface velocity field with high accuracy (≤0.1 mm) (Adam et al., 2005).
We base our kinematic model analysis on incremental horizontal downslope displacements (or velocity, Vx) reflecting gravitational sliding, and vertical displacements (or velocity, Vz) reflecting subsidence and uplift associated with cover deformation and silicone flow. From the surface displacements, longitudinal strain (εxx) is derived. Moreover, εxx is extracted along the centre axis of the basins (downslope direction) at 1 h intervals and displayed in the form of space–time plots, here referred to as strain evolution (or strain rate) diagrams. DIC analysis allows us to quantitatively constrain and analyse the structural and kinematic evolution of the model at high spatial (resulting vector spacing about 1–2 mm, at a vector accuracy of few tens of micrometres) and temporal resolution (100 s). DIC data generated in this study are published open access in Ge et al. (2019).
We use DIC-derived surface deformation data displayed as maps of surface incremental displacement (Vx and Vz) and longitudinal strain (εxx). Incremental surface displacements and longitudinal strains from three intervals represent snapshots of the surface deformation of the experiments (e.g. Fig. 4): early, 25–36 h (7–9 Ma in nature); mid, 61–72 h (16–18 Ma in nature); and late, 109–120 h (28–30 Ma in nature). As the tilting of the experiments lasts from 1 to 84 h (1–21 Ma in nature), the early and mid stages show basin evolution during tilting; the late stage represents basin status after tilting. The strain evolution diagrams visualize the surface strain rate evolution in the centre of each silicone basin through time and are tied to the cross sections showing the final structural geometry at the end of the experiment (e.g. Fig. 5a).
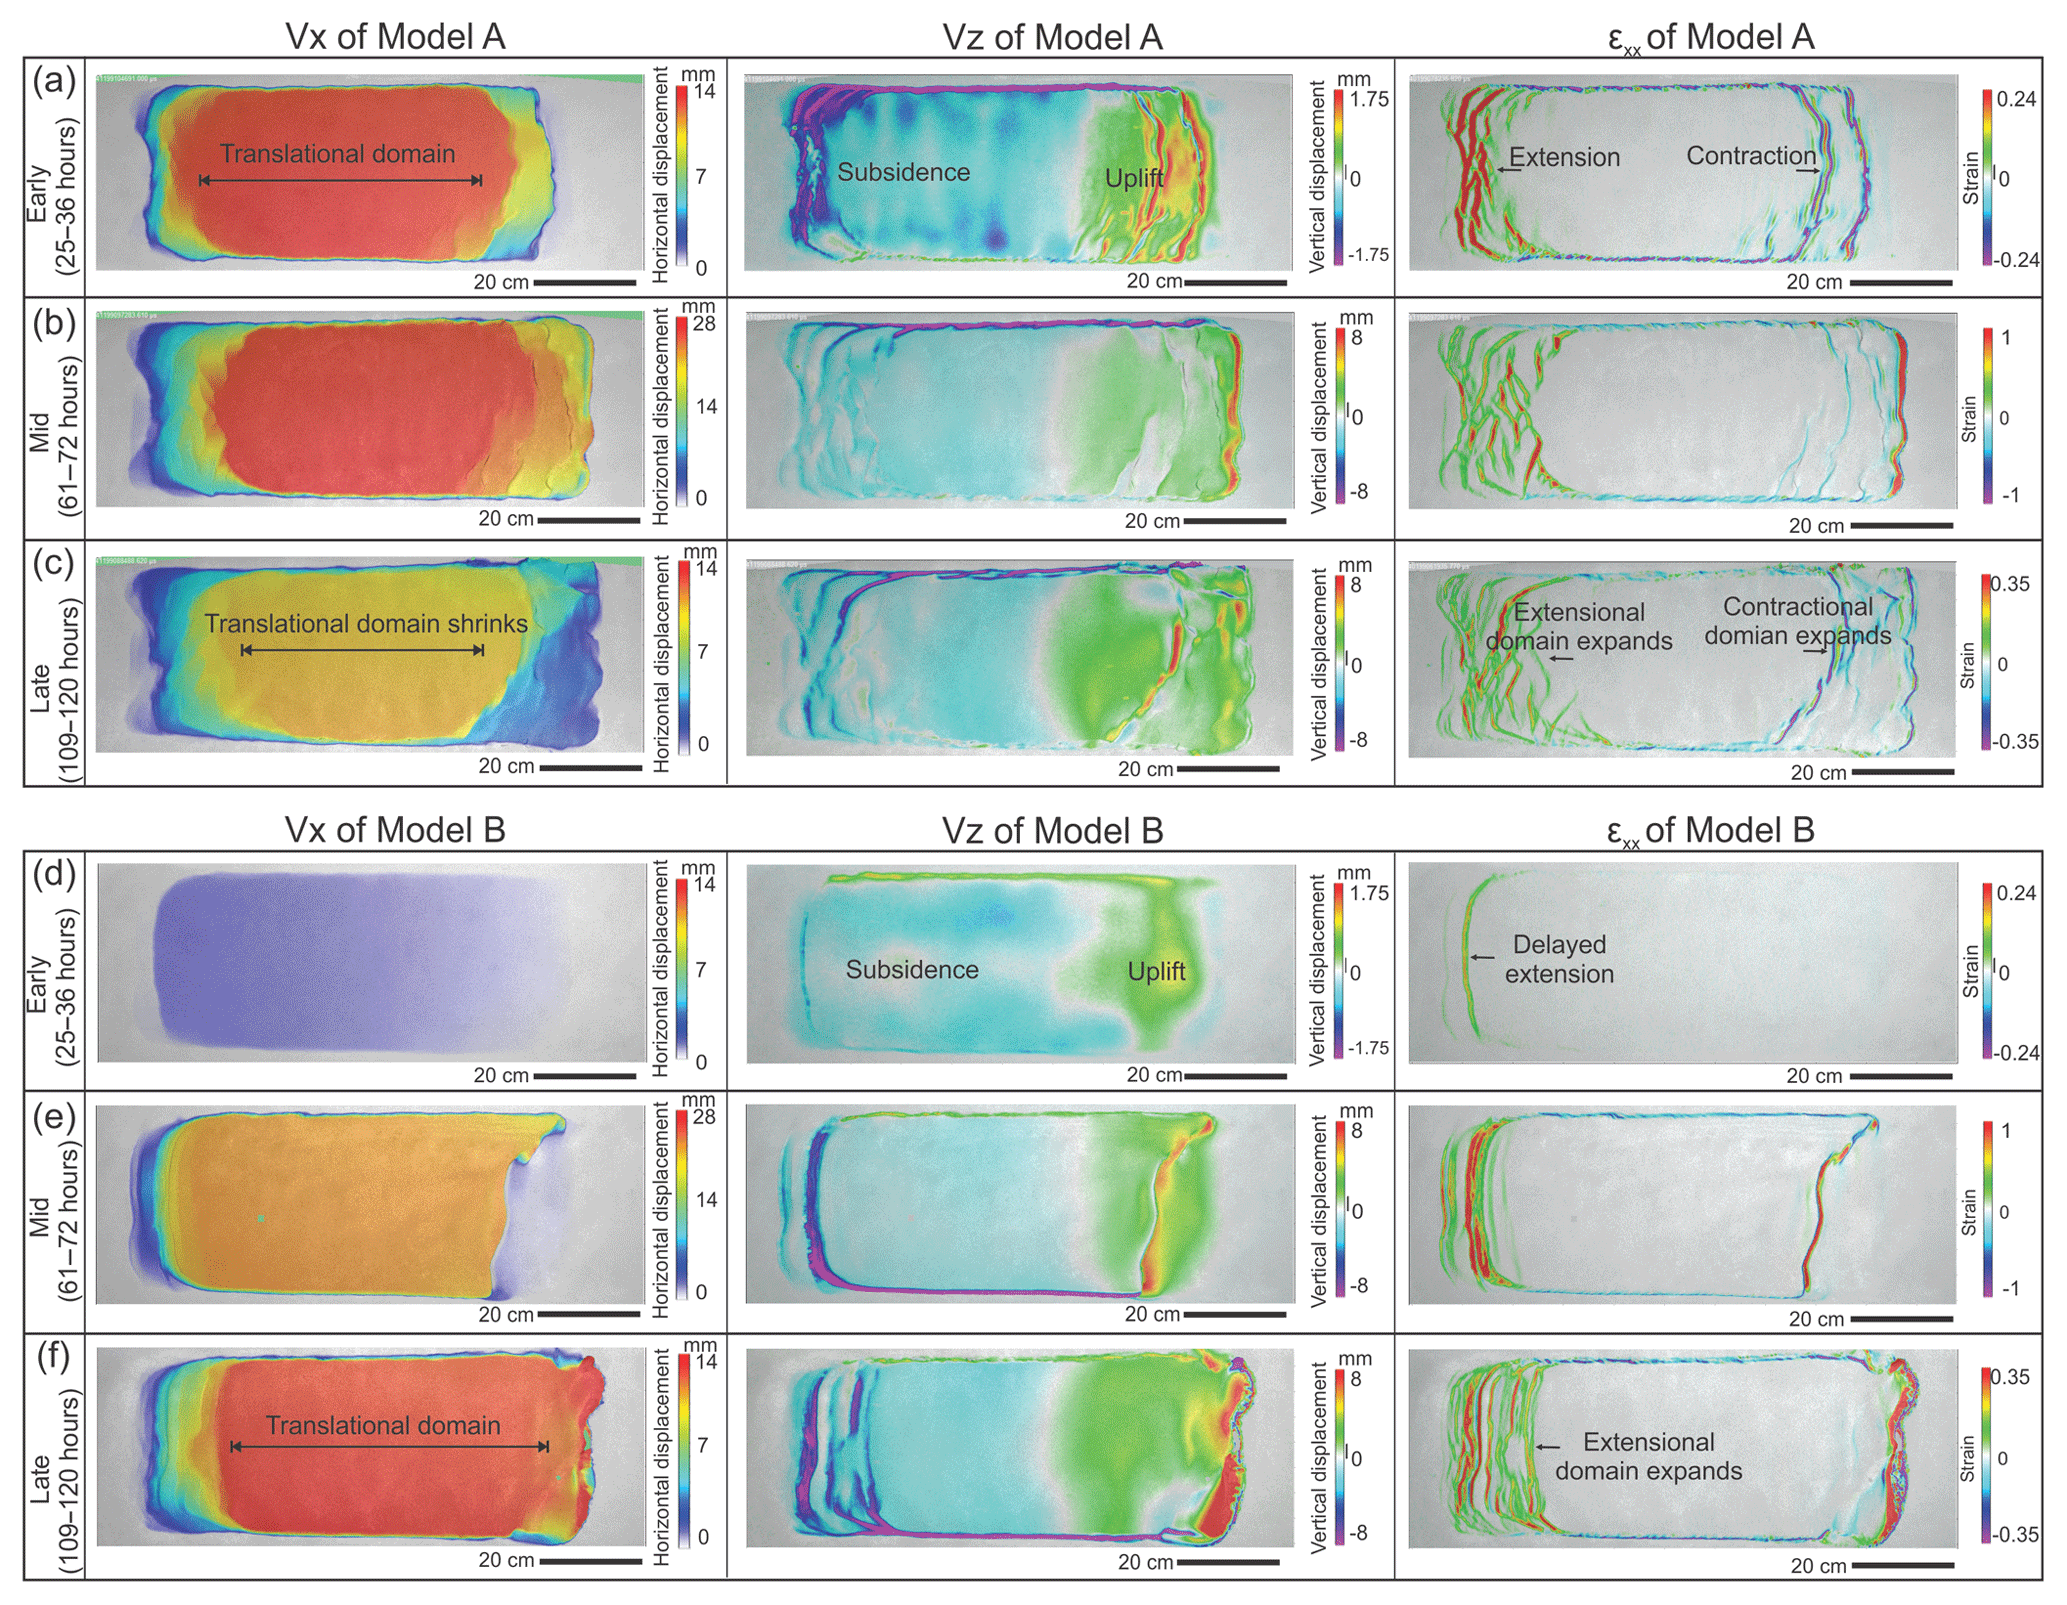
Figure 4(a–c) Map view of incremental horizontal and vertical displacement (Vx, Vz) and strain pattern (εxx) derived from 3-D DIC strain data of Model A from the (a) early (25–36 h), (b) mid (61–72 h) and (c) late stages (109–120 h). Note the persistent translational domain throughout the experiment. (d–f) Map view of incremental horizontal and vertical displacement (Vx, Vz) and strain pattern (εxx) of Model B from the (d) early (25–36 h), (e) mid (61–72 h) and (f) late stages (109–120 h). Note the delayed deformation and large translational domain in the model. The horizontal displacement (Vx) displays downslope displacement of the sedimentary cover (left to right in map view). The vertical displacement (Vz) displays total subsidence and uplift. The horizontal strain (εxx) shows location of the extensional (red) and contractional (purple) structures.

Figure 5(a) Structural styles and kinematic domain partition in central section of Model A. The strain evolution diagram (showing incremental strain at 1 h intervals, or strain rate in 1/h) along the central section beneath shows the initiation of extensional and contractional structures and how they evolve in space and time. Note the persistent translational domain. (b) Structural styles and kinematic domain partition in central section of Model B. The strain evolution diagram (showing incremental strain at 1 h intervals, or strain rate in 1/h) along the central section shows the evolution of extensional and contractional structures in space and time. Note the first contractional structure Tb1 occurs in the mid stage of the experiment.
3.1 Model A
In Model A, after the first period of syn-kinematic sieving, the silicon basin is dominated by gravity gliding with upslope extension, mid-slope translation, and downslope contraction (Fig. 4a–c). In the early stage of the experiment (25–36 h; 7–9 Ma in nature), a ca. 10 cm (10 km in nature) wide belt with extensional grabens and diapirs occurs at the uppermost area of the slope (Fig. 4a). This extensional domain continues to expand downslope to the end of the experiment, reaching over 20 cm wide (20 km in nature) (Figs. 4b, c and 5a). Downdip, two significant thrusts and folds develop with an interval of ca. 10 cm near the lowermost edge of the silicone basin (εxx in Fig. 4a). In the mid-stage of the experiment (61–72 h; 16–18 Ma in nature), the thrust belt expands both upslope and downslope with all thrusts being active in the late stage of the experiment (109–120 h; 28–30 Ma in nature) (εxx in Fig. 5a). In the mid-slope, the translational domain occurs from the beginning of the experiment with ca. 70 cm wide (70 km in nature) and gradually shrinks as the extensional and contractional domains expand (Fig. 5a). By the end of the experiment, the translational domain is ca. 45 cm long (45 km in nature) (Fig. 5a). Overall, the model shows a clear domain partitioning from extension through translation to contraction, similar to the classic conceptual model of kinematic domains within passive margin salt basins (Fig. 1a).
3.2 Model B
In Model B, with a thicker, 5 mm thick pre-kinematic cover, the model surface remains largely undeformed in the early stage of the experiment (25–36 h; 7–9 Ma in nature), with only a single extensional graben developed at the upslope edge of the basin and no visually resolvable contractional structures in the downslope (εxx in Fig. 4d). However, the thick cove strata still drive the silicone flowing from the upslope to the downslope, leading to the uplift of the downslope area (Vz in Fig. 4b). Major deformation starts in the mid-stage (ca. 60 h; 15 Ma in nature) when normal faults occur in the upslope creating a ca. 10 cm (10 km in nature) wide extensional domain (Fig. 4e). At the same time, a thrust belt Tb1 occurs ca. 15 cm (15 km in nature) away from the downslope basin edge (Fig. 5b). In the mid-slope, the translational domain occurs with ca. 65 cm wide (65 km in nature) between the extensional and contractional domains (Fig. 5b). In the late stage of the experiment (109–120 h; 28–30 Ma in nature), as the extensional domain slowly expands to ca. 15 cm wide (15 km in nature), a frontal thrust Tb2 occurs at the downslope edge of the silicone basin (Fig. 5b). However, as the front thrust Tb2 is initiated, the early thrust Tb1 gradually becomes inactive (Fig. 5b). The resultant translational domain of Model B is ca. 55 cm wide (55 km in nature), larger than that of Model A (Fig. 5a and b).
3.3 Model C
Model C has a reduced pre-kinematic layer thickness (0.5 mm) as well as reduced syn-kinematic sedimentation (0.5 mm per 12 h) compared to Model A; therefore, the cover thickness of Model C is half that of Model A (Fig. 3c). The domain evolution of Model C is similar to Model A, but with some important variations. The upslope extensional domain of Model C starts wider than Model A with ca. 20 cm in width (20 km in nature) and expands gradually to be over 30 cm wide (30 km in nature) in the mid-stage (61–72 h; 16–18 Ma in nature) (Fig. 6a and b). The contractional domain initially starts with ca. 10 cm wide (10 km in nature) near the downslope edge but migrates upslope to ca. 40 cm after 72 h (18 Ma in nature). In the mid-slope, the translational domain occurs with ca. 70 cm in width (70 km in nature) at the early stage (25–36 h; 7–9 Ma in nature), but it diminishes continuously as both the extensional and contractional domains expand towards the mid-slope (Fig. 7a). By the end of the experiment, the translational domain is completely overprinted as the contraction reaches the extensional domain in the upslope, squeezing the early extensional structures (Fig. 7a).

Figure 6(a–c) Map view of incremental horizontal and vertical displacement (Vx, Vz) and strain pattern (εxx) derived from 3-D DIC strain data of Model C from the (a) early (25–36 h), (b) middle (61–72 h) and (c) late stages (109–120 h). Note the upslope migration of the translational domain and its overprinting at the end of the experiment. (d–f) Map view of incremental horizontal and vertical displacement (Vx, Vz) and strain pattern (εxx) of Model D from the (d) early (25–36 h), (e) middle (61–72 h) and (f) late stages (109–120 h). Note the widely distributed deformation and overprinted translational domain. The horizontal displacement (Vx) displays downslope displacement of the sedimentary cover (left to right in map view). The vertical displacement (Vz) displays total subsidence and uplift. The horizontal strain (εxx) shows location of the extensional (red) and contractional (purple) structures.
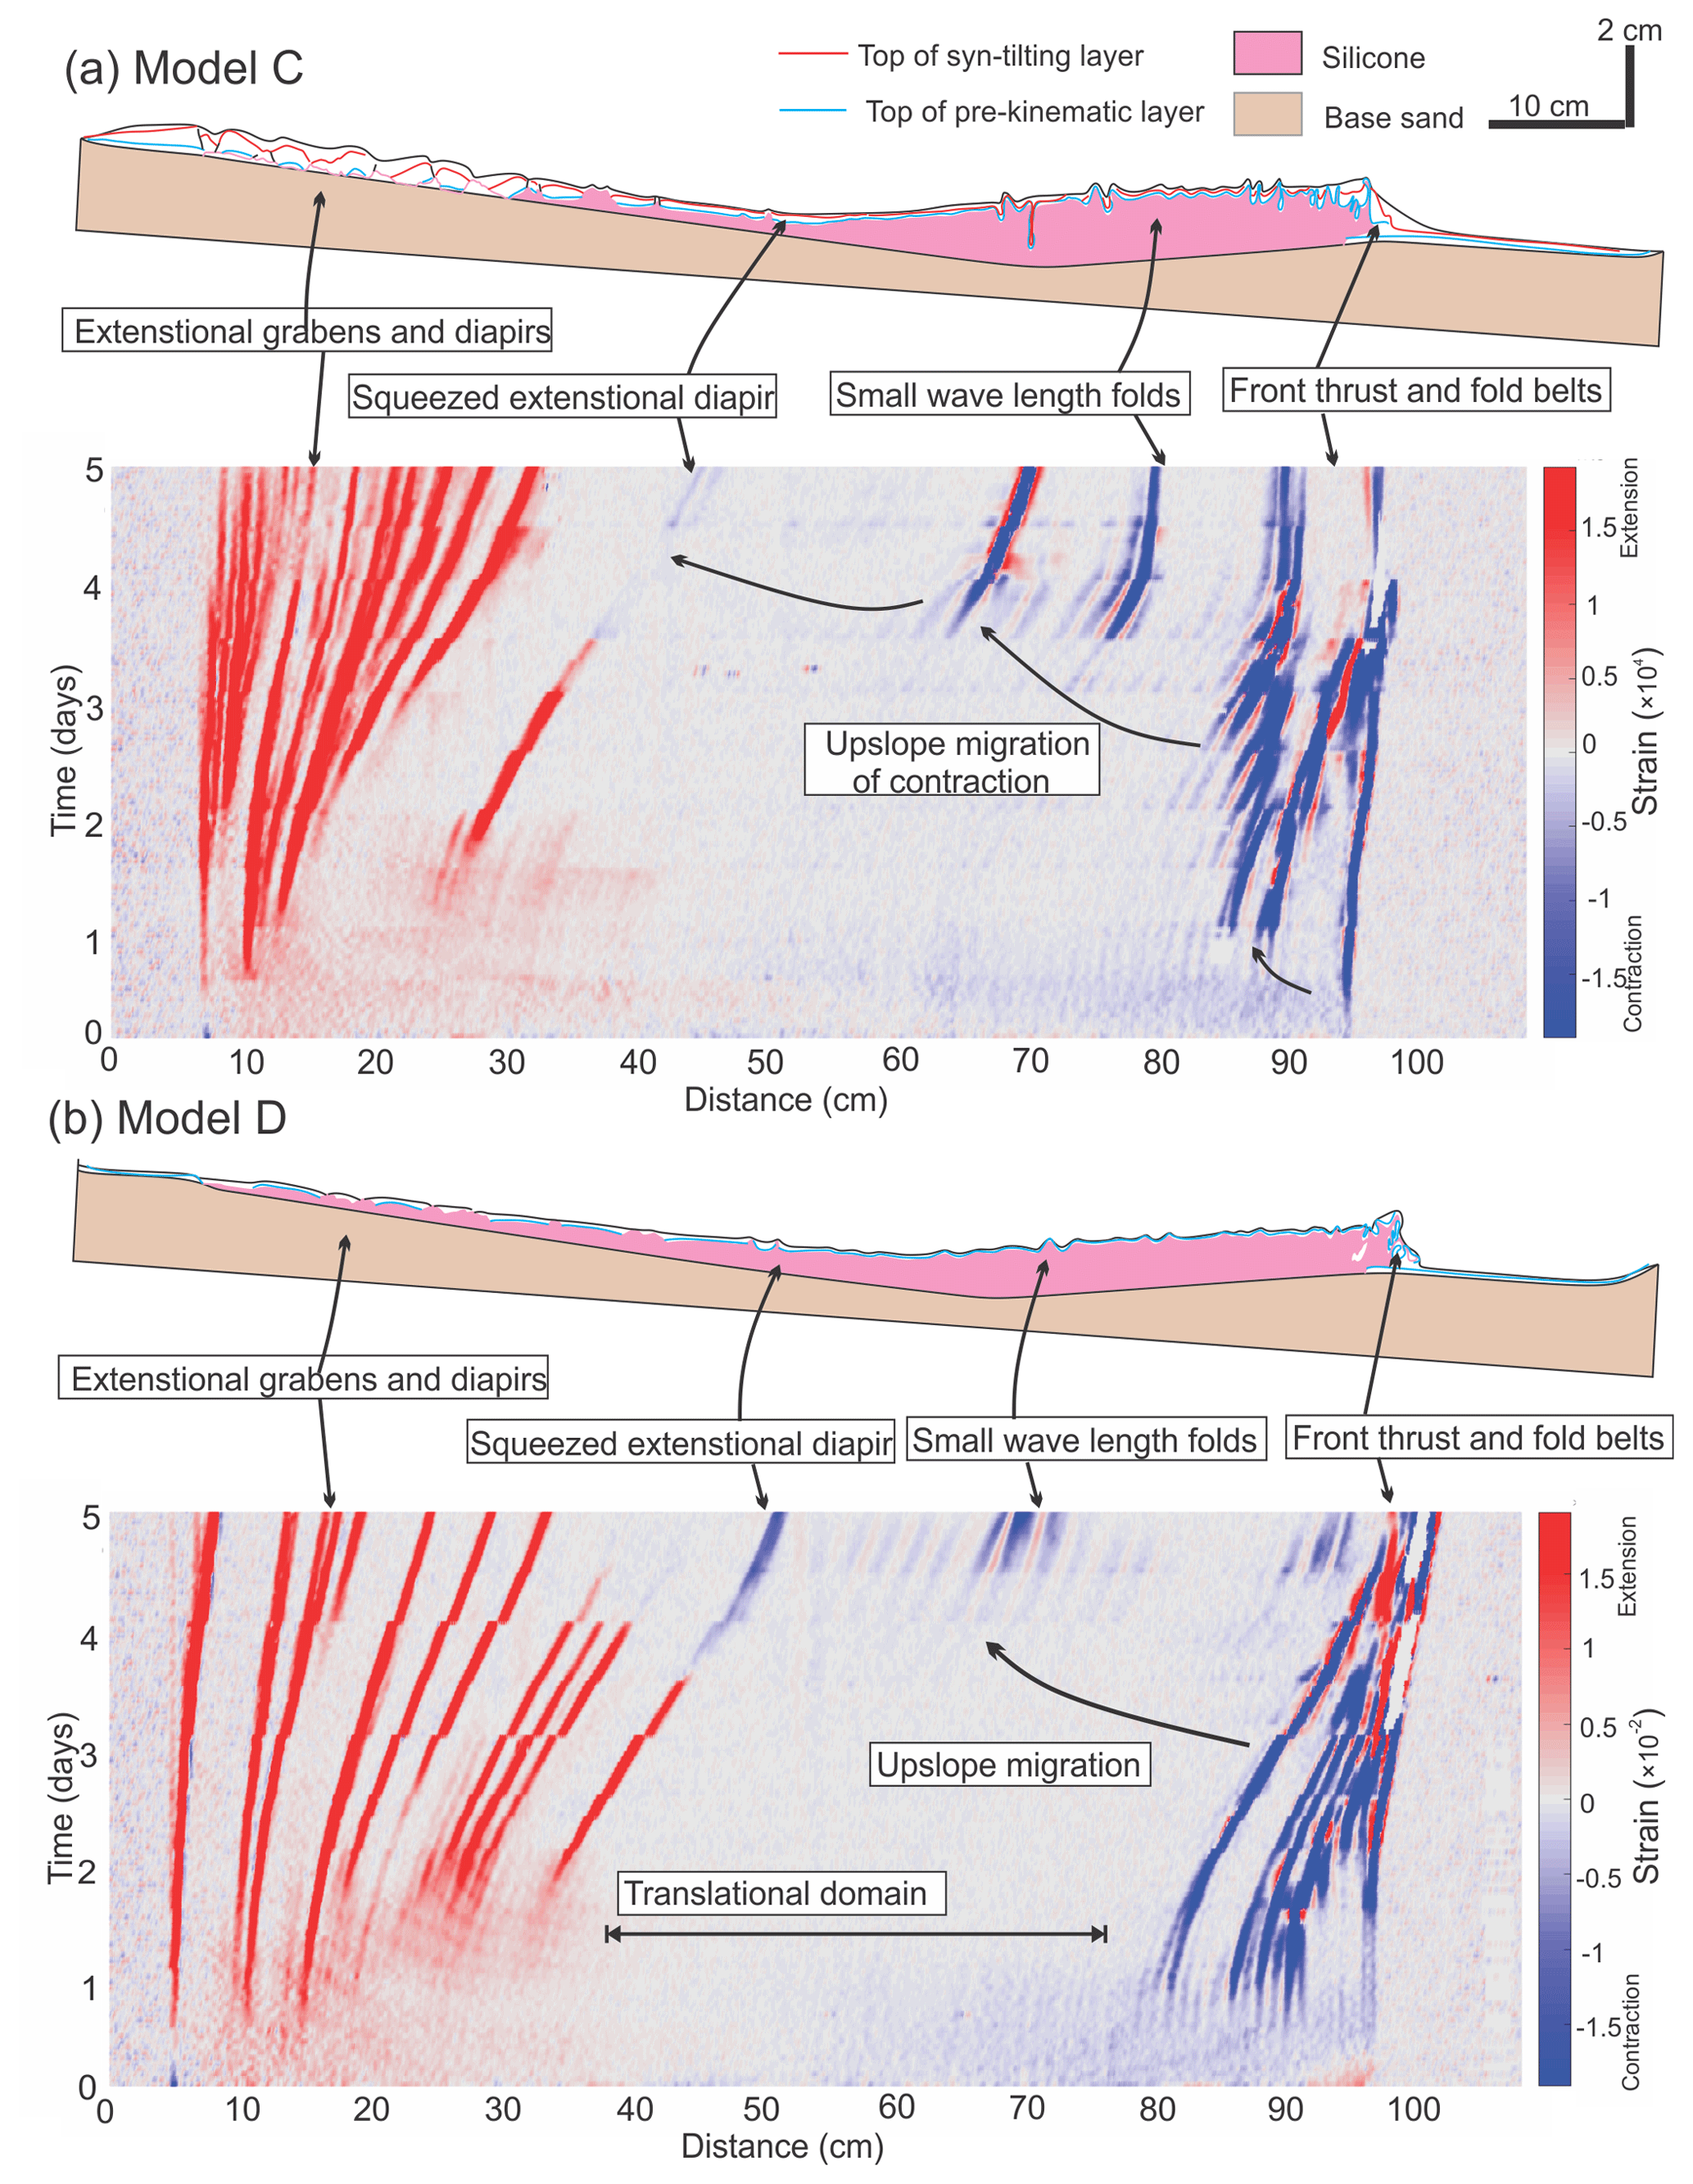
Figure 7(a) Structural styles and kinematic domain partition in central section of Model C. The strain evolution diagram (showing incremental strain at 1 h intervals, or strain rate in 1/h) along the central section beneath shows the initiation of extensional and contractional structures and how they evolve in space and time. Note the squeezed diapir due to the upslope migration of contractional domain. (b) Structural styles and kinematic domain partition in central section of Model D. The strain evolution diagram (showing incremental strain at 1 h intervals, or strain rate in 1/h) along the central section shows the evolution of extensional and contractional structures in space and time. Note the overall kinematic and structural evolution of Model D are similar to Model A–C despite no differential loading from wedge-shaped syn-kinematic sedimentation.
3.4 Model D
Model D has the same pre-kinematic layer thickness (1 mm) as Model A but no syn-kinematic sedimentation in the early stage and only negligible sedimentation afterwards (Appendix Table A1). The extensional structures are initiated across a ca. 20 cm wide area (20 km in nature) in the upslope and expand to more than 40 cm wide (40 km in nature) in the mid-stage (61–72 h; 16–18 Ma in nature) (Figs. 6d and 7b). Contractional structures occur across an area of ca. 20 cm wide (20 km in nature) near the downslope edge of the basin (Fig. 7b). The contractional belt converges into an area of approximately 10 cm wide (10 km in nature) before the contraction migrates upslope after 72 h (18 Ma in nature) (Figs. 6f and 7b). The translational domain in the mid-slope occurs with ca. 60 cm wide (60 km in nature) and shrinks to ca. 40 cm wide in the mid-stage (61–72 h; 16–18 Ma in nature) (Fig. 7b). Due to the thin cover layer in the mid-slope (∼1 mm), the migration of the contractional domain towards upslope causes short-wavelength (ca. 2 cm) folding in the translational domain in the late stage of the experiment (after 96 h; 24 Ma in nature) (Figs. 6f and 7b). At the end of the experiment, the contractional domain overlaps the extensional domain, causing squeezing of extensional diapirs and folding of the cover layer, overprinting the simple, undeformed translational domain (Fig. 7b).
3.5 Model E
Model E shows considerable differences in structural style and evolution compared to the other models (Models A–D), due to different sedimentation patterns (Fig. 3e). In Model E, differential loading of the pre-kinematic and early syn-kinematic sieving within eight minibasins result in a basin-wide imprint of minibasin downbuilding. The differential loading process is most prominent on the subsidence pattern during the early stage where thicker minibasin areas subside more strongly than the intervening areas of diapirs (Vz in Fig. 8a). However, minibasin downbuilding only dominates the deformation for a very short period of 1 to 2 h (0.25–0.5 Ma), during which time the minibasins and diapirs in between are areas of extension and contraction respectively, with no sign of a translational domain (Fig. 9a). Shortly afterwards, gravity gliding takes over as the extension and contraction dominate the upslope and downslope respectively, forming a ca. 10 cm wide (10 km in nature) extensional domain and a ca. 10 cm wide contractional domain (Figs. 8b and 9a). During the transition, the deformation concentrates on diapirs, and little deformation is observed within the minibasins (Fig. 9c). In the middle and late stages of the experiment, Model E develops similar surface pattern to Model A with downslope contraction migrating towards upslope (Fig. 9a).
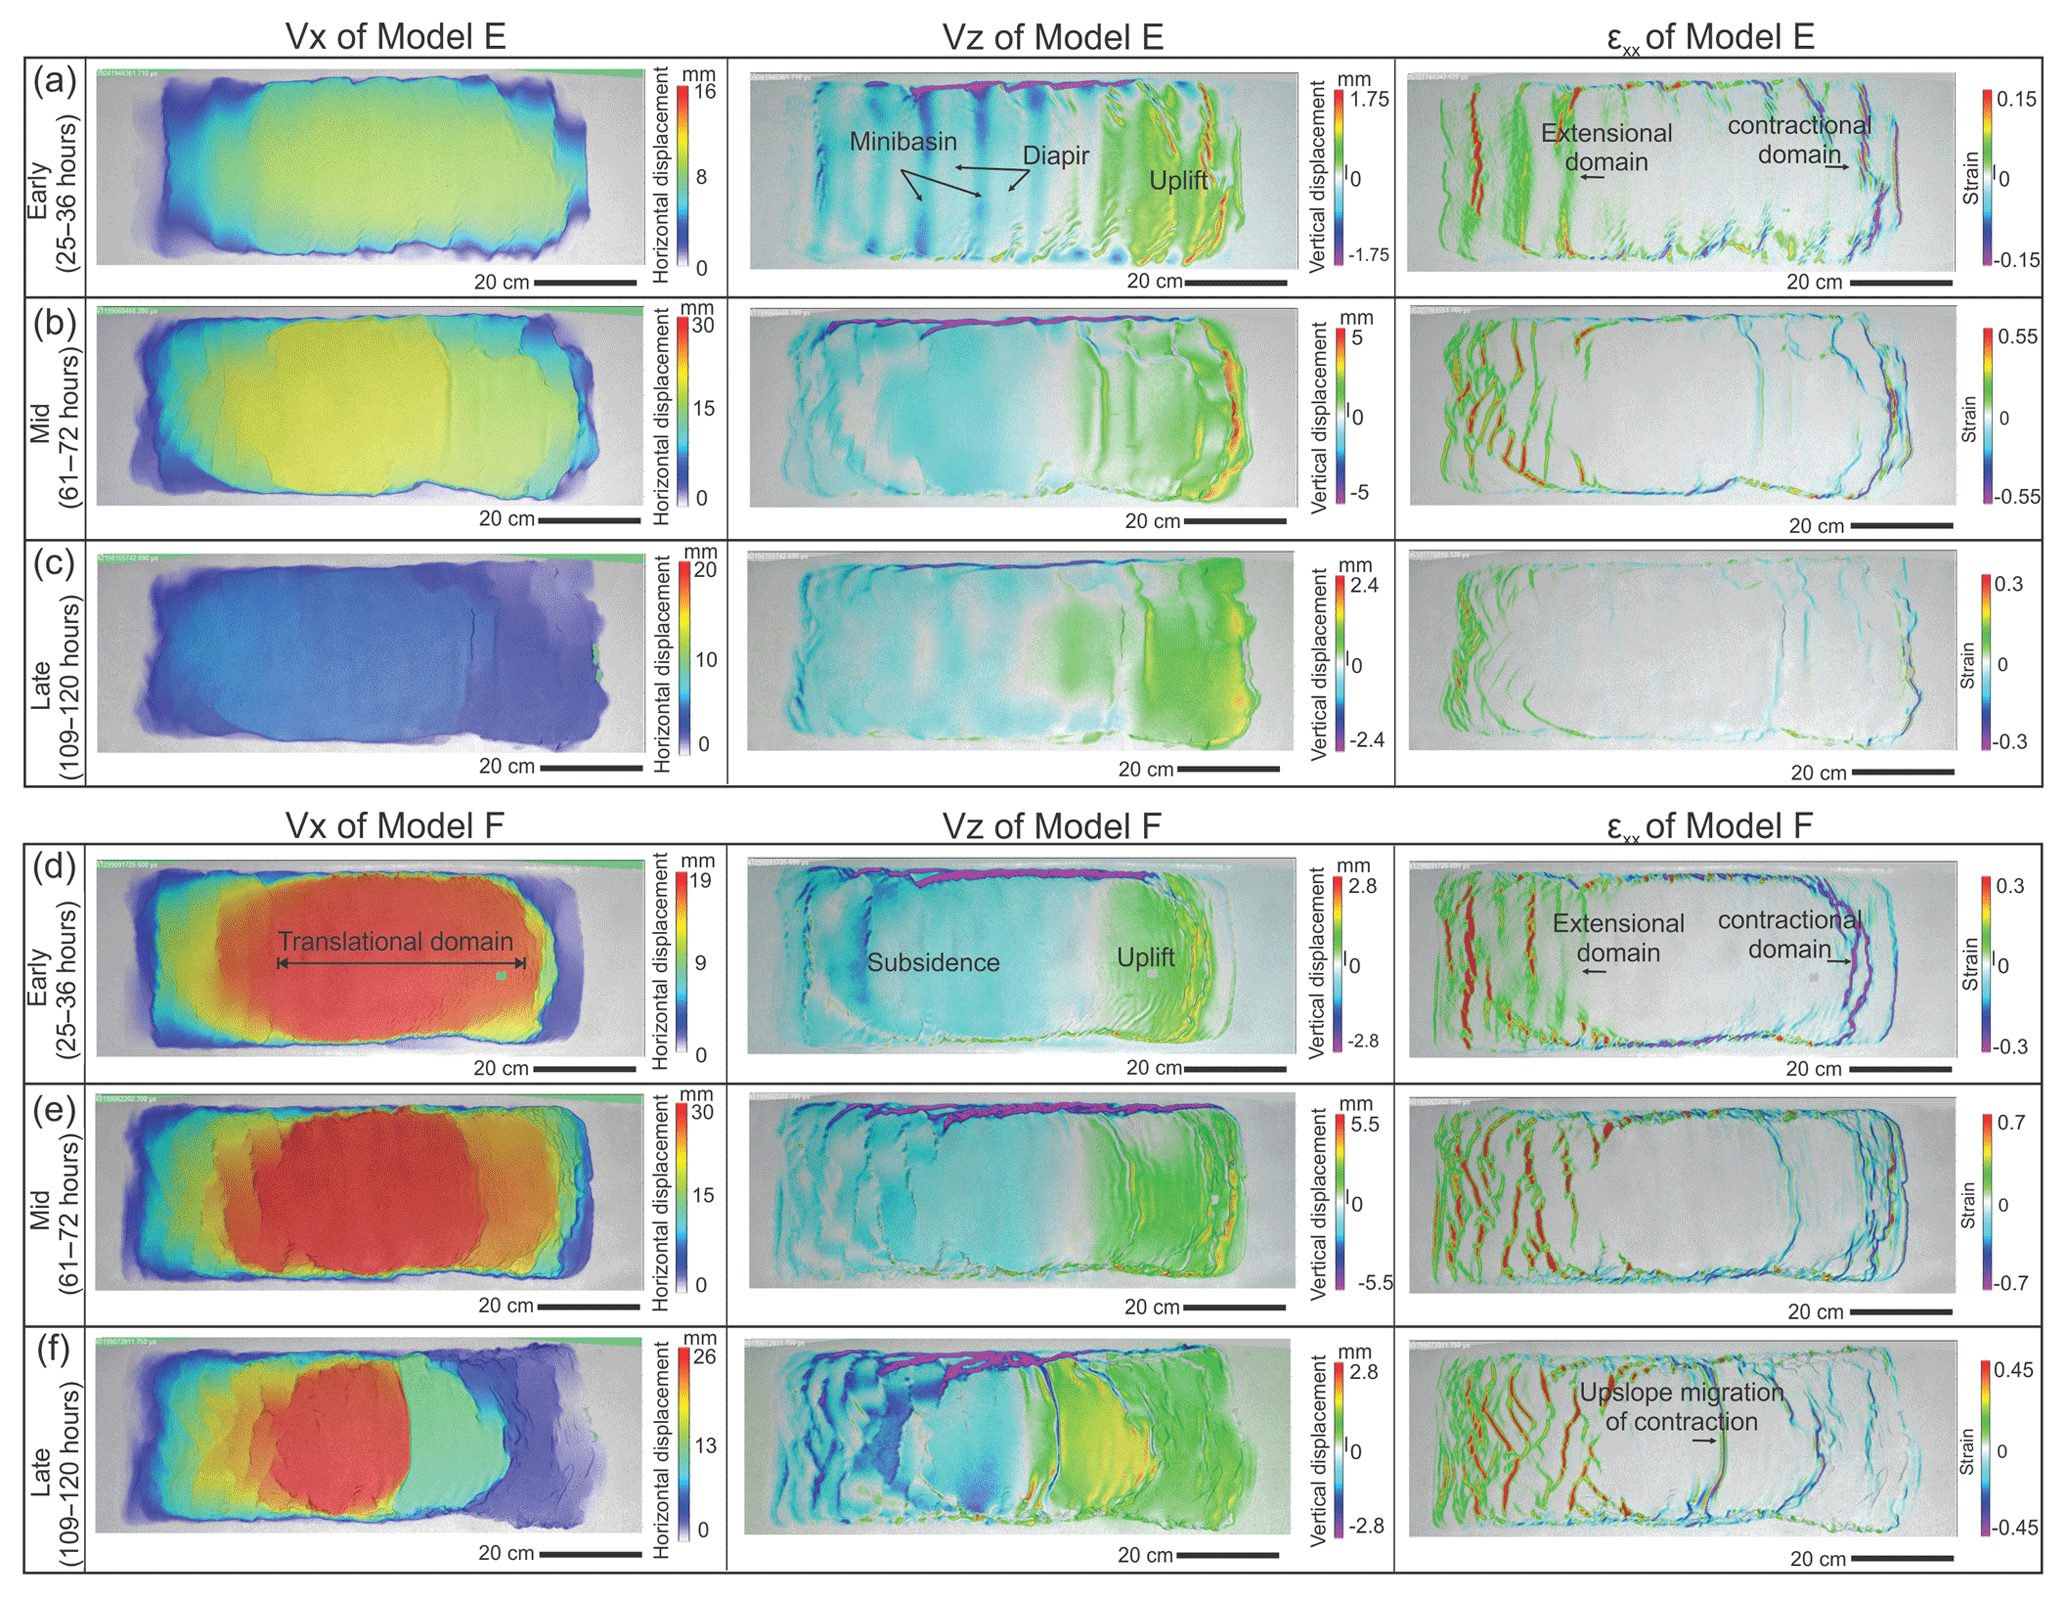
Figure 8(a–c) Map view of incremental horizontal and vertical displacement (Vx, Vz) and strain pattern (εxx) derived from 3-D DIC strain data of Model E from the (a) early (25–36 h), (b) middle (61–72 h) and (c) late stages (109–120 h). Note the minibasins and diapirs formed in the mid-slope during the early stage of the experiment. (d–f) Map view of incremental horizontal and vertical displacement (Vx, Vz) and strain pattern (εxx) of Model F from the (d) early (25–36 h), (e) middle (61–72 h) and (f) late stages (109–120 h). Note the overall similarity between Model F to Model C. The horizontal displacement (Vx) displays downslope displacement of the sedimentary cover (left to right in map view). The vertical displacement (Vz) displays total subsidence and uplift. The horizontal strain (εxx) shows location of the extensional (red) and contractional (purple) structures.

Figure 9(a) Structural styles and kinematic domain partition in central section of Model E. The strain evolution diagram (showing incremental strain at 1 h intervals, or strain rate in 1/h) along the central section beneath shows the initiation of extensional and contractional structures and how they evolve through time. Note the early stage minibasin formation and diapirism and their imprints in the translational domain area. (b) Structural styles and kinematic domain partition in central section of Model F. The strain evolution diagram (showing incremental strain at 1 h intervals, or strain rate in 1/h) along the central section reveals the evolution of extensional and contractional structures. Note the early stage diapirism and upslope migration of contraction overprint the translational domain together. (c) Zoom into the strain evolution diagram for the first 24 h along central cross section of Model E. The minibasins gradually change from areas of extension to zones that are relatively strong and stable in the first 3 h. MB means minibasin and ST means strain transfer. See the dashed box in (a) for the time interval of the zoomed strain evolution.
3.6 Model F
Compared to Model E, Model F has reduced pre-kinematic layer thickness and syn-kinematic sedimentation and only three minibasins in the upslope area (Fig. 3f). The differential loading in the upslope area in the first 1–2 h of Model E is also observed in Model F. However, because the minibasins are located only in the upslope, more proximal area and the sedimentation rate is half that of Model E, the imprint of minibasin downbuilding on the structural evolution is less significant compared to Model E (Fig. 8d). For example, the early-stage minibasins and diapir formation preserved in the cross section are much smaller than similar structures in Model E (Fig. 9a). Moreover, as minibasins only form in the proximal part of the mid-slope, a translational domain occurs in the distal part of the mid-slope with ca. 40 cm in width (40 km in nature) (Fig. 9b). From 48 h (12 Ma in nature) and onwards, the extensional domain dominates the upslope and continues to expand to > 30 cm wide (30 km in nature) by the end of the experiment (Fig. 9b). The downslope contractional domain is ca. 15 cm wide (15 km in nature) initially and expands to ca. 60 cm wide (45 km in nature) due to upslope migration of contraction (Fig. 9b). By the end of the experiment, the contractional structures interfere with early extensional structures, resulting in an overprinted translational domain (Fig. 9b).
We used basin-scale sandbox analogue modelling to study the first-order controls on origination, development, and overprinting of the translational domain in salt-bearing passive margin basins where the thin-skinned salt tectonics dominates the structural and stratigraphic evolution. Based on the analysis of temporal and spatial evolution of individual structures and kinematic domains of extension, translation, and contraction, we identify the translational domain as a transient feature. It is modified by two potential mechanisms: (i) migration of extensional and contractional domains into a previous undeformed translational domain and (ii) differential loading by sedimentation into minibasins that triggers salt-related structures, such as diapirs, from the beginning of basin evolution, therefore preventing the formation of a tectonically stable translational domain.
4.1 Influences of pre- and syn-kinematic layer thickness on the translational domain
Our modelling results are in good agreement with previous works where a translational domain is evident when a relatively thick and continuous pre-kinematic layer exists (e.g. Dooley et al., 2018; Fort et al., 2004a). Translational domains have been observed in other experiments with a pre-kinematic layer of even thickness of the order of 3–10 mm (300 to 1000 m in nature) (Adam et al., 2012a; Adam and Krezsek, 2012; Fort et al., 2004a). Similar observations are made in Model A and B, where about 50 % of the basin length is occupied by the translational domains (Fig. 5). As noted by Brun and Fort (2012), the cover layer needs to be thick and strong enough to transfer the strain without deforming internally. In many analogue models, the total thickness of pre- and syn-kinematic layers is usually of the order of a few centimetres (e.g. Adam et al., 2012a; Fort et al., 2004a), which is equal to a few kilometres in nature using a similar geometric scaling factor from this study (1 cm in the model is 1 km in nature). Results from our study suggest that a 1 mm thick pre-kinematic layer and 2–3 mm thick syn-kinematic sedimentation (few hundreds of metres if scaled to nature) seems strong enough to form a stable translational domain from beginning to end, such as the one (ca. 45 cm wide; 45 km in nature) in Model A (Fig. 5a). With a thicker cover, such as Model B (5 mm pre-kinematic layer), the translational domain becomes even larger (ca. 55 cm wide; 55 km in nature) due to stronger cover (Fig. 5b).
4.2 Overprinting the translational domains by deformation migration
Our study shows that a very thin supra-salt cover, combining a thin pre-kinematic layer with a very low sedimentation rate, allows the downslope migration of extensional domains and upslope migration of contractional domains, which ultimately leads to the overprint of the translational domain (Figs. 7a and10a). Specifically, in Model C, when the pre-kinematic layer is only 0.5 mm in the models (50 m in nature) and syn-kinematic sedimentation is 1 mm d−1 (about 17 m per Ma in nature), the translational domain can be overprinted by the migration of extension and contraction towards the mid-slope (Fig. 7a and b). This contrasts with Model A and B (Fig. 5), as well as other studies with thick pre- and syn-kinematic layers (e.g. Adam et al., 2012a; Brun and Fort, 2004; Fort et al., 2004a), where the undeformed translation domains are either fully or partially preserved, even under the influence of upslope migration of contraction. However, the simulated sedimentation rate of 17 m Ma−1 in nature is extremely low compared to natural salt basins where the typical sedimentation rate is > 100 m Ma−1 (Adam et al., 2012a; Adam and Krezsek, 2012). In general, such low sedimentation rates are more compatible with typical hemiplegic sedimentation rates of 2–20 m Ma−1 (Stow et al., 2001). This implies that our models that include a very thin pre-kinematic layer and a very low sedimentation rate may not be typical of passive margin salt basins with high terrestrial input (e.g. Fig. 1b and c).
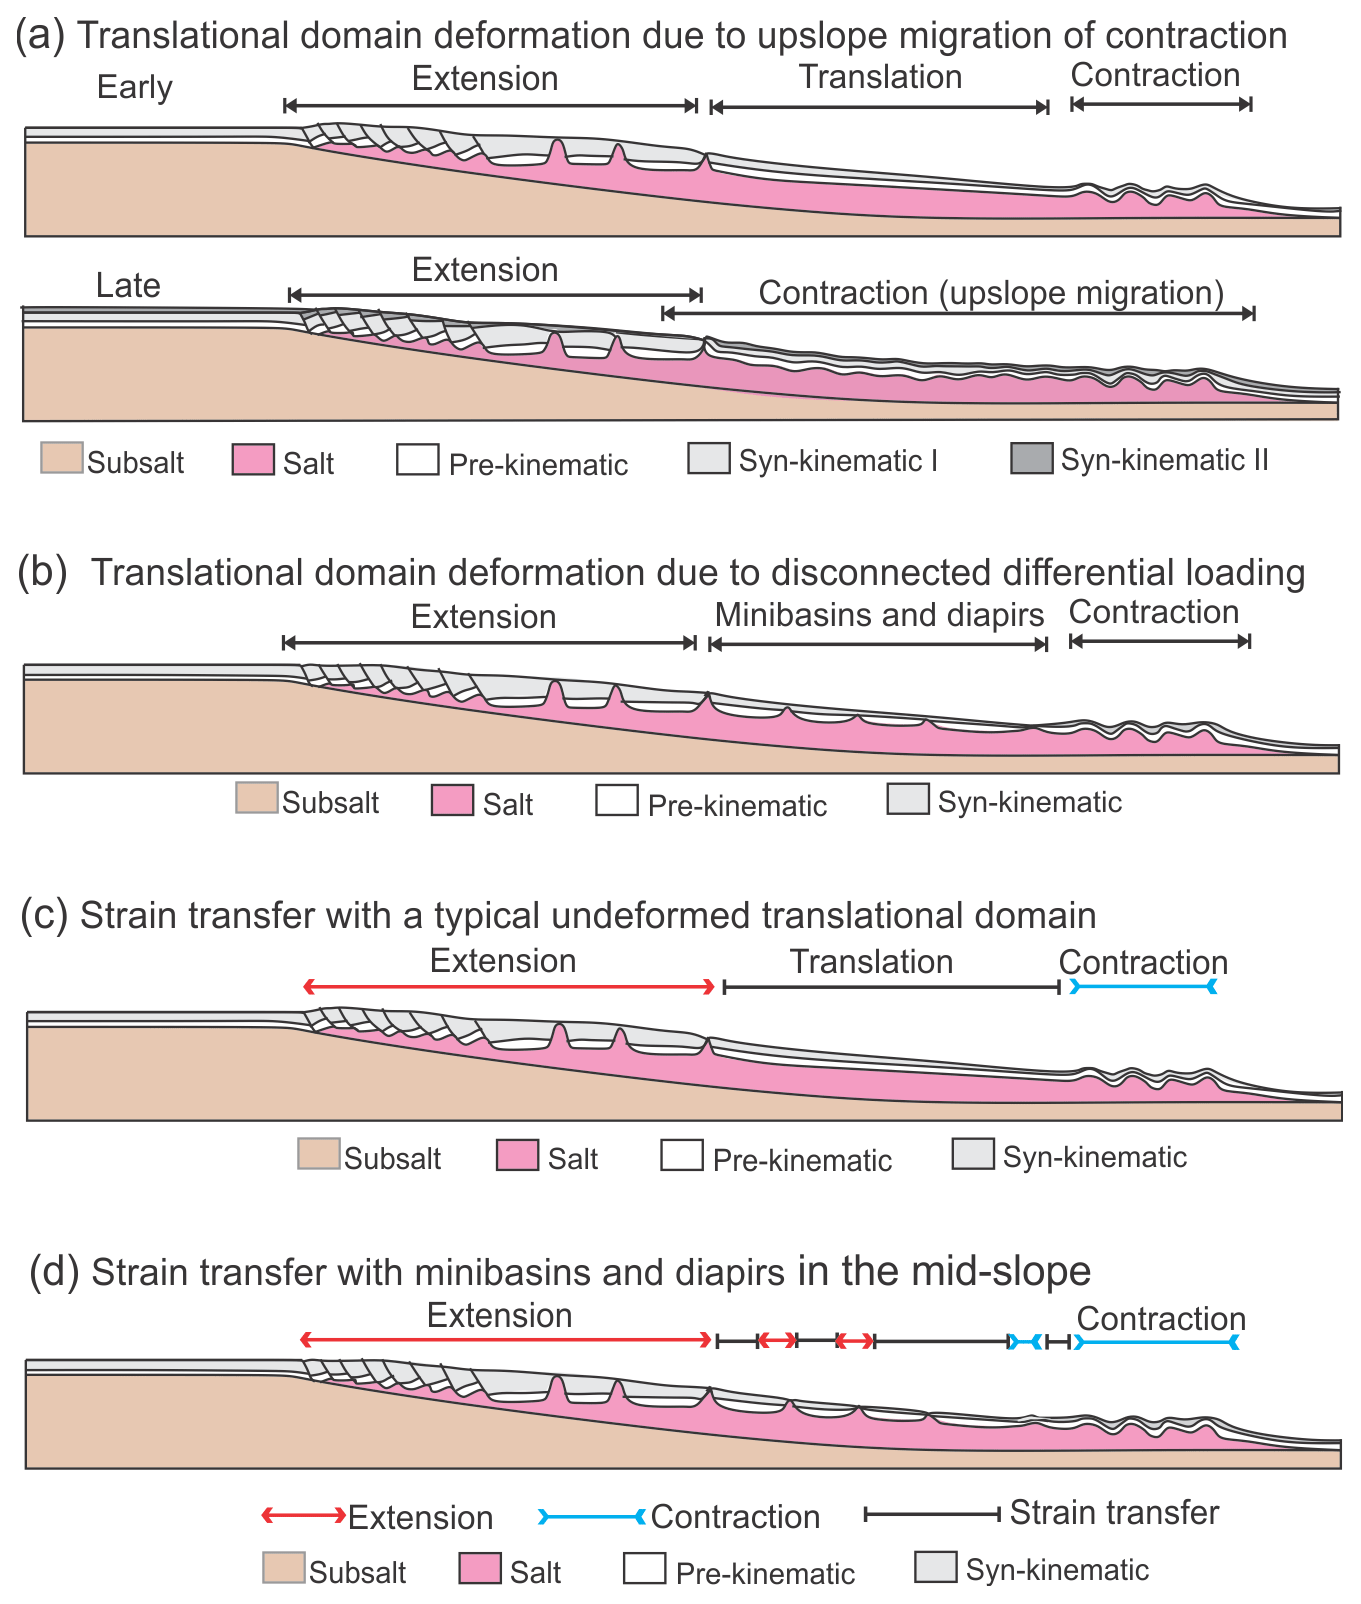
Figure 10Proposed mechanisms of overprinting translational domains and models illustrating strain transfer with underformed translational domain, and areas of minibasins and diapirs. (a) Low sedimentation rate and thin supra-salt cover allows upslope migration of contraction resulting in overprinting the translational domain. (b) Sedimentary differential loading leads to the development of minibasins and diapirs in the mid-slope preventing the establishment of a stable, undeformed translational domain. (c) The undeformed translational domain in the mid-slope allows strain transfer (ST) without significant internal deformation. (d) The minibasins and diapirs in the mid-slope allow strain transfer (ST) through a combination of passive movement of minibasin and minor widening (extension) or shortening (contraction) of diapirs.
In some cases, when margin tilting is modified due to basement tectonics, deformation migration may also occur even with a thick supra-salt cover. A good example is the Kwanza Basin, Angola, where a major Miocene sub-salt uplift of the basin in the upslope area leads to a reactivation of basin-wide thin-skinned deformation (e.g. Hudec and Jackson, 2004). The uplifted area has average cover thickness over 2 km, yet it shows evidence of extension migrating towards both upslope and downslope (Hudec and Jackson, 2004; their Fig. 9).
4.3 Overprinting the translational domain by differential loading
The results of the experiments documented here suggest that differential loading in the mid-slope is a viable mechanism for overprinting the translational domain (Fig. 10b). Basin-wide differential loading is applied in Model E (Fig. 9a), which results in the formation of minibasins and diapirs in the mid-slope. Even though the differential loading only dominates the basin for a short, early period (roughly 1.5 h in the model or 0.4 Ma in nature), the translational domain is overprinted completely during the time. Although the pattern of differential loading is idealized in the experiments as a series of minibasins, variation of sediment deposition occurs in nature as sediment supply through discrete sediment routing systems results in different sediment thicknesses across the basin. For example, restorations of the earliest stratigraphic units in passive margin salt basins have always been patchy with marked thickness variations between different locations (e.g. Adam et al., 2012b; Hudec and Jackson, 2004; Marton et al., 2000). Moreover, numerical simulation has demonstrated that such a patchy pattern of minibasin depocentres, separated by salt diapirs, can be simply formed by differential loading alone (Peel, 2014).
Since the scenario of early differential loading is more realistic than a thick and uniform supra-salt cover, the strain transfer from upslope extension to downslope contraction may not need a simple translational domain as current models suggest (Figs. 1a and 10c). The thick and strong minibasins and intervened weak diapirs form heterogeneities within the supra-salt sediment cover and complicate the pattern of strain transfer. For example, the minibasins in Model E are passively translated and the diapirs in between accommodate the deformation (Figs. 9c and 10d). In this way, the deformation is transferred by a combination of minibasin translation and diapir widening (extension) and shortening (contraction) in the mid-slope (Fig. 10d). However, the strike orientations of minibasins and associated diapirs in this study are all perpendicular to the orientation of thin-skinned deformation. In reality, the diapirs with various orientations may connect to each other forming a network, as has been observed in the northern Gulf of Mexico (e.g. Rowan and Vendeville, 2006). Consequently, during thin-skinned deformation, the associated strain distribution of diapirs may be more complex than our models suggest.
4.4 Alternative mechanisms for overprinting translation domains
Other mechanisms may also be responsible for the absence or overprinting of a well-defined translational domain. One potential mechanism is a step or relief of the base of the salt associated with early tectonic activity (e.g. rift-related topography) (Jackson and Hudec, 2005; Pichel et al., 2018). Analogue models with sub-salt steps/relief have demonstrated that these basement structures can cause strain localization of the supra-salt cover strata around them, therefore complicating the structural style and overprinting the translational domain (e.g. Dooley et al., 2017, 2018; Ferrer et al., 2017; Gaullier et al., 1993).
Progradational sedimentary wedges can also cause overprinting the translational domain. As the sedimentary wedges generate extension and contraction in the upslope and downslope areas within the wedges, progradation of the sedimentary wedges bring the associated extensional and contractional domains to move forward. Consequently, early formed translational domains in the middle of the sedimentary wedge are superimposed by late, forward-moving extensional structures (Brun and Fort, 2011; McClay et al., 1998; Vendeville, 2005). Furthermore, sediment progradation direction and rate may also have variations across the margin and thus further complex the process of translational domain overprinting (e.g. Brun and Fort, 2018; Fort et al., 2004b).
Sandbox analogue modelling analysed by 4-D digital image correlation (DIC) allows a thorough and precise analysis of the evolution and kinematic domain partitioning of passive margin salt basins under different combination of pre- and syn-kinematic sedimentation. Experiments with uniform pre-kinematic cover thickness show a typical domain partition of upslope extension compensated by downslope contraction with an intermediate domain of translation. Under such circumstances, even very thin (1 mm or 100 m in nature) pre-kinematic cover is sufficient to generate a translational domain, and it becomes wider with a thicker supra-salt cover. We identify two scenarios in which the translational domain is only a transient feature during basin evolution and becomes progressively overprinted and destroyed. Firstly, when the initial cover layer is thin and sedimentation rate is low, upslope migration of the contractional domain overprints the translational domain. Secondly, when early differential sediment loading occurs in the mid-slope area, formation of minibasins separated by diapirs also overprints the translational domain.
A comparison between analogue models and natural examples of passive margin salt basins suggests that an undeformed translational domain, as seen in analogue models, occurs rarely in nature. This is because the sediment deposition from natural sedimentary systems tends to have thickness variations and is unlikely to form a thick, mechanically stable (or rigid and undeformable) supra-salt cover layer such as that in analogue models. Low sedimentation rates are required to overprint the translational domain through migration of the extensional and contractional domains. Our study suggests this is rare in natural passive margins due to high clastic sediment input. Instead, a more viable mechanism in nature is differential loading with initial thickness variations of the supra-salt cover that causes overprinting of the translational domain through the formation of minibasins and diapirs. Other factors, such as progradation of sedimentary wedges and subs-salt-related deformation or relief, can also be responsible for modifying the translational domain through domain migration and perturbing the strain distribution in the supra-salt cover strata.
The experimental data, along with analysis code, are available on the GFZ repository under https://doi.org/10.5880/GFZ.4.1.2019.001 (Ge et al., 2019).
Table A1Sedimentation rates, pre- and syn-kinematic depositional scenarios for all six silicone basins of the three experiments. Note the labels of basins, such as Basin 1a and 1b, are for paired models. The labels of models are the names referred to in the main text.

ZG, MR, and RG designed the experiments. ZG and MW ran the experiments. ZG, MR, and MW processed the data and did the strain analysis. All authors contributed to the writing of the manuscript.
The authors declare that they have no conflict of interest.
The project was supported by E.ON Stipendienfonds and the 2018 TNA programme of EPOS' Thematic Core Service Multi-scale Laboratories. Zhiyuan Ge would like to thank Equinor for sponsoring his postdoc at University of Bergen. We thank Frank Neumann and Thomas Ziegenhagen for construction of the experimental device as well as the whole laboratory team for scientific assistance. Danielle Howlett is thanked for remarks on an early version of the paper. Frank Zwaan and Tim Dooley are thanked for their constructive reviews that improved the quality and clarity of the manuscript. We also thank the editor, Mark Allen, for editing suggestions. We thank GFZ Data Services for making the data underlying this study openly accessible (Ge et al., 2019; Warsitzka et al., 2019).
This paper was edited by Mark Allen and reviewed by Tim Dooley and Frank Zwaan.
Adam, J. and Krezsek, C.: Basin-scale salt tectonic processes of the Laurentian Basin, Eastern Canada: insights from integrated regional 2-D seismic interpretation and 4D physical experiments, Geol. Soc. London Spec. Pub., 363, 331–360, 2012.
Adam, J., Urai, J. L., Wieneke, B., Oncken, O., Pfeiffer, K., Kukowski, N., Lohrmann, J., Hoth, S., van der Zee, W., and Schmatz, J.: Shear localisation and strain distribution during tectonic faulting – new insights from granular-flow experiments and high-resolution optical image correlation techniques, J. Struct. Geol., 27, 283–301, 2005.
Adam, J., Ge, Z., and Sanchez, M.: Post-rift salt tectonic evolution and key control factors of the Jequitinhonha deepwater fold belt, central Brazil passive margin: Insights from scaled physical experiments, Mar. Pet. Geol., 37, 70–100, 2012a.
Adam, J., Ge, Z., and Sanchez, M.: Salt-structural styles and kinematic evolution of the Jequitinhonha deepwater fold belt, central Brazil passive margin, Mar. Pet. Geol., 37, 101–120, 2012b.
Allen, J. and Beaumont, C.: Impact of inconsistent density scaling on physical analogue models of continental margin scale salt tectonics, J. Geophys. Res.-Sol. Ea., 117, B08103, https://doi.org/10.1029/2012JB009227, 2012.
Brun, J.-P. and Fort, X.: Compressional salt tectonics (Angolan margin), Tectonophysics, 382, 129–150, 2004.
Brun, J.-P. and Fort, X.: Salt tectonics at passive margins: Geology versus models, Mar. Pet. Geol., 28, 1123–1145, 2011.
Brun, J.-P. and Fort, X.: Salt tectonics at passive margins: geology versus models–Reply, Mar. Pet. Geol., 37, 195–208, 2012.
Brun, J.-P. and Fort, X.: Growth of Continental Shelves at Salt Margins, Front. Earth Sci., 6, https://doi.org/10.3389/feart.2018.00209, 2018.
Costa, E. and Vendeville, B. C.: Experimental insights on the geometry and kinematics of fold-and-thrust belts above weak, viscous evaporitic décollement, J. Struct. Geol., 24, 1729–1739, 2002.
Cramez, C. and Jackson, M. P. A.: Superposed deformation straddling the continental-oceanic transition in deep-water Angola, Mar. Pet. Geol., 17, 1095–1109, 2000.
Dooley, T. P., Jackson, M. P. A., and Hudec, M. R.: Initiation and growth of salt-based thrust belts on passive margins: results from physical models, Basin Res., 19, 165–177, 2007.
Dooley, T. P., Hudec, M. R., Carruthers, D., Jackson, M. P. A., and Luo, G.: The effects of base-salt relief on salt flow and suprasalt deformation patterns – Part 1: Flow across simple steps in the base of salt, Interpretation, 5, SD1vSD23, https://doi.org/10.1190/INT-2016-0087.1, 2017.
Dooley, T. P., Hudec, M. R., Pichel, L. M., and Jackson, M. P. A.: The impact of base-salt relief on salt flow and suprasalt deformation patterns at the autochthonous, paraautochthonous and allochthonous level: insights from physical models, Geol. Soc. London Spec. Pub., 476, SP476.13, https://doi.org/10.1144/sp476.13, 2018.
Ferrer, O., Gratacós, O., Roca, E., and Muñoz, J. A.: Modeling the interaction between presalt seamounts and gravitational failure in salt-bearing passive margins: The Messinian case in the northwestern Mediterranean Basin, Interpretation, 5, 99–117, 2017.
Fort, X., Brun, J.-P., and Chauvel, F.: Salt tectonics on the Angolan margin, synsedimentary deformation processes, AAPG Bull., 88, 1523–1544, 2004a.
Fort, X., Brun, J. P., and Chauvel, F.: Contraction induced by block rotation above salt (Angolan margin), Mar. Pet. Geol., 21, 1281–1294, 2004b.
Gaullier, V., Brun, J. P., Guerin, G., and Lecanu, H.: Raft tectonics: the effects of residual topography below a salt de'collement, Tectonophysics, 228, 363–381, 1993.
Ge, H., Jackson, M. P. A., and Vendeville, B. C.: Kinematics and dynamics of salt tectonics driven by progradation, AAPG Bull., 81, 398–423, 1997.
Ge, Z., Rosenau, M., Warsitzka, M., Rudolf, M., and Gawthorpe, R. L.: Digital image correlation data from analogue modeling experiments addressing mechanisms of overprinting translational domains in passive margin salt basins, data set, GFZ Data Services, https://doi.org/10.5880/GFZ.4.1.2019.001, 2019.
Gemmer, L., Beaumont, C., and Ings, S. J.: Dynamic modelling of passive margin salt tectonics: effects of water loading, sediment properties and sedimentation patterns, Basin Res., 17, 383–402, 2005.
Gradmann, S., Hübscher, C., Ben-Avraham, Z., Gajewski, D., and Netzeband, G.: Salt tectonics off northern Israel, Mar. Pet. Geol., 22, 597–611, 2005.
Gvirtzman, Z., Reshef, M., Buch-Leviatan, O., Groves-Gidney, G., Karcz, Z., Makovsky, Y., and Ben-Avraham, Z.: Bathymetry of the Levant basin: interaction of salt-tectonics and surficial mass movements, Mar. Geol., 360, 25–39, 2015.
Hubbert, M. K.: Theory of scale models as applied to the study of geologic structures, Bull. Geol. Soc. Am., 48, 1459–1520, 1937.
Hudec, M. R. and Jackson, M. P. A.: Regional restoration across the Kwanza Basin, Angola: Salt tectonics triggered by repeated uplift of a metastable passive margin, AAPG Bull., 88, 971–990, 2004.
Jackson, M. P. A. and Hudec, M. R.: Stratigraphic record of translation down ramps in a passive-margin salt detachment, J. Struct. Geol., 27, 889–911, 2005.
Jackson, M. P. A. and Vendeville, B. C.: Regional extension as a geologic trigger for diapirism, Geol. Soc. Am. Bull., 106, 57–73, 1994.
Klinkmüller, M., Schreurs, G., Rosenau, M., and Kemnitz, H.: Properties of granular analogue model materials: A community wide survey, Tectonophysics, 684, 23–38, 2016.
Marton, G., Tari, G. C., and Lehmann, C. T.: Evolution of the Angolan Passive Margin, West Africa, With Emphasis on Post-Salt Structural Styles, Atlantic rifts and continental margins, 2000, 129–149, 2000.
Mauduit, T. and Brun, J. P.: Growth fault/rollover systems: birth, growth, and decay, J. Geophys. Res.-Sol. Ea., 103, 18119–18136, 1998.
Mauduit, T., Guerin, G., Brun, J. P., and Lecanu, H.: Raft tectonics: the effects of basal slope angle and sedimentation rate on progressive extension, J. Struct. Geol., 19, 1219–1230, 1997.
McClay, K. R., Dooley, T., and Lewis, G.: Analog modeling of progradational delta systems, Geology, 26, 771–774, 1998.
Modica, C. J. and Brush, E. R.: Postrift sequence stratigraphy, paleogeography, and fill history of the deep-water Santos Basin, offshore southeast Brazil, AAPG Bull., 88, 923–945, 2004.
Oluboyo, A. P., Gawthorpe, R. L., Bakke, K., and Hadler-Jacobsen, F.: Salt tectonic controls on deep-water turbidite depositional systems: Miocene, southwestern Lower Congo Basin, offshore Angola, Basin Res., 26, 597–620, 2014.
Peel, F. J.: How do salt withdrawal minibasins form? Insights from forward modelling, and implications for hydrocarbon migration, Tectonophysics, 630, 222–235, 2014.
Pichel, L. M., Peel, F., Jackson, C. A. L., and Huuse, M.: Geometry and kinematics of salt-detached ramp syncline basins, J. Struct. Geol., 115, 208–230, 2018.
Ramberg, H.: Gravity, deformation, and the earth's crust: In theory, experiments, and geological application, Academic press, London, 1981.
Rosenau, M., Pohlenz, A., Kemnitz, H., and Warsitzka, M.: Ring-shear test data of quartz sand G12 used for analogue experiments in the Helmholtz Laboratory for Tectonic Modelling (HelTec) at the GFZ German Research Centre for Geosciences in Potsdam, GFZ Data Services, https://doi.org/10.5880/GFZ.4.1.2019.003, 2018.
Rowan, M. G.: Passive-margin salt basins: hyperextension, evaporite deposition, and salt tectonics, Basin Res., 26, 154–182, 2014.
Rowan, M. G., Peel, F. J., and Vendeville, B. C.: Gravity-driven fold belts on passive margins, AAPG Mem., 2004, 157–182, 2004.
Rowan, M. G. and Vendeville, B. C.: Foldbelts with early salt withdrawal and diapirism: Physical model and examples from the northern Gulf of Mexico and the Flinders Ranges, Australia, Mar. Pet. Geol., 23, 871–891, 2006.
Rudolf, M., Boutelier, D., Rosenau, M., Schreurs, G., and Oncken, O.: Rheological benchmark of silicone oils used for analog modeling of short-and long-term lithospheric deformation, Tectonophysics, 684, 12–22, 2016.
Stow, D. A. V., Huc, A. Y., and Bertrand, P.: Depositional processes of black shales in deep water, Mar. Pet. Geol., 18, 491–498, 2001.
Tari, G., Molnar, J., and Ashton, P.: Examples of salt tectonics from West Africa: a comparative approach, Geol. Soc. London Spec. Pub., 207, 85–104, 2003.
Vendeville, B. C.: Salt tectonics driven by sediment progradation: Part I – Mechanics and kinematics, AAPG Bull., 89, 1071–1079, 2005.
Vendeville, B. C. and Jackson, M. P. A.: The rise of diapirs during thin-skinned extension, Mar. Pet. Geol., 9, 331–354, 1992.
Warsitzka, M., Kley, J., and Kukowski, N.: Analogue experiments of salt flow and pillow growth due to basement faulting and differential loading, Solid Earth, 6, 9–31, https://doi.org/10.5194/se-6-9-2015, 2015.
Warsitzka, M., Ge, Z., Schönebeck, J.-M., Pohlenz, A., and Kukowski, N.: Ring-shear test data of foam glass beads used for analogue experiments in the Helmholtz Laboratory for Tectonic Modelling (HelTec) at the GFZ German Research Centre for Geosciences in Potsdam and the Institute of Geosciences, Friedrich Schiller University Jena, GFZ Data Services, https://doi.org/10.5880/GFZ.4.1.2019.002, 2019.
Weijermars, R., Jackson, M. P. A., and Vendeville, B.: Rheological and tectonic modeling of salt provinces, Tectonophysics, 217, 143–174, 1993.
Withjack, M. O. and Callaway, S.: Active normal faulting beneath a salt layer: an experimental study of deformation patterns in the cover sequence, AAPG Bull., 84, 627–651, 2000.