the Creative Commons Attribution 4.0 License.
the Creative Commons Attribution 4.0 License.
 | 29 Aug 2019
Cyclic activity of the Fuego de Colima volcano (Mexico): insights from satellite thermal data and nonlinear models
Antonio Costa
Roberto Sulpizio
Diego Coppola
Lucia Capra
The Fuego de Colima volcano (Mexico) shows a complex eruptive behavior, with periods of rapid and slow lava dome growth punctuated by explosive activity. We reconstructed the weekly discharge rate average between 1998 and 2018 by means of satellite thermal data integrated with published discharge rate data. By using spectral and wavelet analysis, we found a multiyear long-term, multi-month intermediate-term, and multi-week short-term cyclic behavior during the period of the investigated eruptive activity like that of many other dome-forming volcanoes. We use numerical modeling in order to investigate the nonlinear cyclic eruptive behavior considering a magma feeding system composed of a dual or a single magma chamber connected to the surface through an elastic dyke developing into a cylinder conduit in the shallowest part. We investigated cases in which the periodicity is controlled by (i) the coupled deep–shallow magma reservoirs, (ii) the single shallow chamber, and (iii) the elastic shallow dyke when it is fed by a fixed influx rate or constant pressure. Due to the limitations of the current modeling approach, there is no single configuration that can reproduce all the periodicities on the three different timescales. The model outputs indicate that the observed multiyear periodicity (1.5–2.5 years) can be described by the fluctuations controlled by a shallow magma chamber with a volume of 20–50 km3 coupled with a deep reservoir of ca. 500 km3, connected through a deep elastic dyke. The multi-month periodicity (ca. 5–10 months) appears to be controlled by the shallow magma chamber for the same range of volumes. The short-term multi-week periodicity (ca. 2.5–5 weeks) can be reproduced considering a fixed influx rate or constant pressure at the base of the shallower dyke. This work provides new insights on the nonlinear cyclic behavior of Fuego de Colima and a general framework for comprehension of the eruptive behavior of andesitic volcanoes.
- Article
(9778 KB) - Full-text XML
- BibTeX
- EndNote


Lava-dome-forming eruptions are relatively long-lived events, lasting from several months to several decades (e.g., Merapi, Indonesia, Siswowidjoyo et al., 1995; Kelut, Indonesia, De Bèliaz et al., 2012; Fuego de Colima, Mexico, Lamb et al., 2014; Santiaguito, Guatemala, Harris et al., 2003), and are usually punctuated by dome collapses and explosive (Vulcanian) episodes. Discharge rates can change widely over a range of timescales, reflecting the physical mechanisms involved in the transfer of magma to the Earth's surface (Melnik et al., 2009; Odbert and Wadge, 2009).
Volcanoes, including Santiaguito (Guatemala; Harris et al., 2003), Mt. St. Helens (USA; Swanson and Holcomb, 1990), and Soufrière Hills, Montserrat (Voight et al., 1998; Loughlin et al., 2010; Wadge et al., 2010; Nicholson et al., 2011), have shown periodic dome growth. Periodicity in eruption parameters can be complex, showing systematic or nonsystematic temporal changes as the eruption progresses (Denlinger and Hoblitt, 1999; Costa et al., 2007a; Melnik et al., 2009; Bernstein et al., 2013; Wolpert et al., 2016), and can be characterized by short-, intermediate-, and long-term wavelengths (Costa et al., 2007a, 2012, 2013; Melnik et al., 2009; Melnik and Costa, 2014). Short- and intermediate-term periodicities (hours or weeks) are generally explained by the upper conduit pressurization related to the nonlinear ascent of magma flow (Denlinger and Hoblitt, 1999; Melnik and Sparks, 1999; Voight et al., 1999; Wylie et al., 1999; Ozerov et al., 2003; Lensky et al., 2004; Costa et al., 2007a, b, 2012; Kozono and Koyaguchi, 2009, 2012). This is because the lower part of the dyke conduit can act as a capacitor that allows magma to be stored temporarily and released during the more intense phase of discharge (Costa et al., 2007a, b, 2012, 2013; Melnik et al., 2009). The long-term periodicity, with timescales from several months to decades (Voight et al., 2000; Belousov et al., 2002; Sparks and Young, 2002; Wadge et al., 2006), is usually controlled by pressure variations in magma reservoirs (Barmin et al., 2002; Costa et al., 2007b; Melnik et al., 2009; Melnik and Costa, 2014).
Since historical times, the Fuego de Colima volcano (Mexico; Fig. 1a) has been characterized by decade-lasting cycles of dome growth alternating with Vulcanian explosions and ending with sub-Plinian eruptions. The last two occurred in 1818 and 1913 (Luhr, 2002; Saucedo et al., 2005; Norini et al., 2010; Heap et al., 2014; Massaro et al., 2018b). The most recent cycle started after the 1913 eruption, and it is characterized by lava domes extruded with minor seismicity at high magma temperatures (960–1020 ∘C) (Savov et al., 2008). As for other dome eruptions (Sparks, 1997), dome growth at Fuego de Colima can be explained by complex nonlinear pressure variations during magma ascent from magma reservoirs (e.g., Melnik and Costa, 2014), cooling, crystallization, degassing (e.g., Melnik and Sparks, 1999; Lensky et al., 2004; Nakanishi and Koyaguchi, 2008; Kozono and Koyaguchi, 2012), and upper conduit geometric configurations characterized by multiple pathways (e.g., Lavallee et al., 2012; Reubi et al., 2015).
Two magma chambers located at different depths characterize the feeding system of the Fuego de Colima volcano (Fig. 1b), with roofs located at ca. 6 (shallow magma chamber) and ca. 15 km (deep magma chamber) of depth, as indicated by petrographic studies (Macìas et al., 2017) and geophysical data (Spica et al., 2017). The purpose of this study is to investigate the existence of patterns of fluctuations in discharge rates during the 1998–2018 eruption activity at the Fuego de Colima volcano. The available geological, geophysical, and petrological data for this recent activity provide a remarkable opportunity to improve the characterization and our understanding about the physical processes underlying the cyclic extrusion of lava domes. In particular, we used thermal remote sensing data along with published effusion rates for reconstructing the oscillatory magma discharge rate behavior of effusive activity at Colima.
The availability of satellite thermal images in the last decade has strengthened the use of thermal data for observing volcanic activity (Ramsey and Harris, 2013), especially in studying the relationships with lava discharge rates (Coppola et al., 2009; Harris et al., 2010; Garel et al., 2012). Coppola et al. (2013) propose that the radiant density of effusive–extrusive activity can be used to estimate lava discharge rates and erupted volumes by means of empirical relationships based on the SiO2 content of the erupted lava. Although still under debate, the so-called “thermal approach” (Dragoni and Tallarico, 2009) offers a good way to monitor volcanic activity, especially when direct observations are limited or absent. Here we focus our attention on the dynamics of fluctuations in the magma discharge rate at different timescales at the Fuego de Colima volcano during 1998–2018. By using time series analytical techniques (i.e., Fourier and wavelet analysis) we have identified three fundamental periodicities in subsets of the time series: (i) long term (ca. 1.5–2.5 years), (ii) intermediate term (ca. 5–10 months), and (iii) short term (ca. 2.5–5 weeks), similar to those observed at many lava dome eruptions (Costa et al., 2012; Melnik and Costa, 2014; Christopher et al., 2015). These periodicities were compared with numerical simulations provided by the model of Melnik and Sparks (2005) as generalized by Costa et al. (2007a) to account for the presence of a shallow dyke, as well as with Melnik and Costa (2014) for describing the control of a coupled dual chamber system.
Numerical modeling of the different parts of the plumbing system can successfully reproduce the first-order cyclic behavior of Fuego de Colima during the 1998–2018 eruption activity. Our results highlight the fact that the dual magma chamber dynamics control the long-term periodicity evident during 2002–2006 and 2013–2016, while the single magma chamber dynamics are more effective to explain the intermediate-term periodicity in the same periods. Finally, the shallow dyke dynamics regulate the multi-week cycles observed during 2002–2006 and 2011–2016.
The present work is divided in five main sections. The first describes the historical activity of the Fuego de Colima, with particular attention to the recent period, from 1998 to 2018. The second section describes the methods applied to the dataset composed of satellite thermal data integrated with published data. The third section is dedicated to the input and target data used for numerical simulations. The fourth section presents the results obtained by the spectral and wavelet analyses. This latter allows us to establish significance levels for the wavelet power spectrum. The periodicities observed in this spectrum were compared to the results obtained by numerical simulations. The last section contains a discussion on the eruptive behavior that occurred at Fuego de Colima during 1998–2018, providing new insights from observational data and nonlinear models.
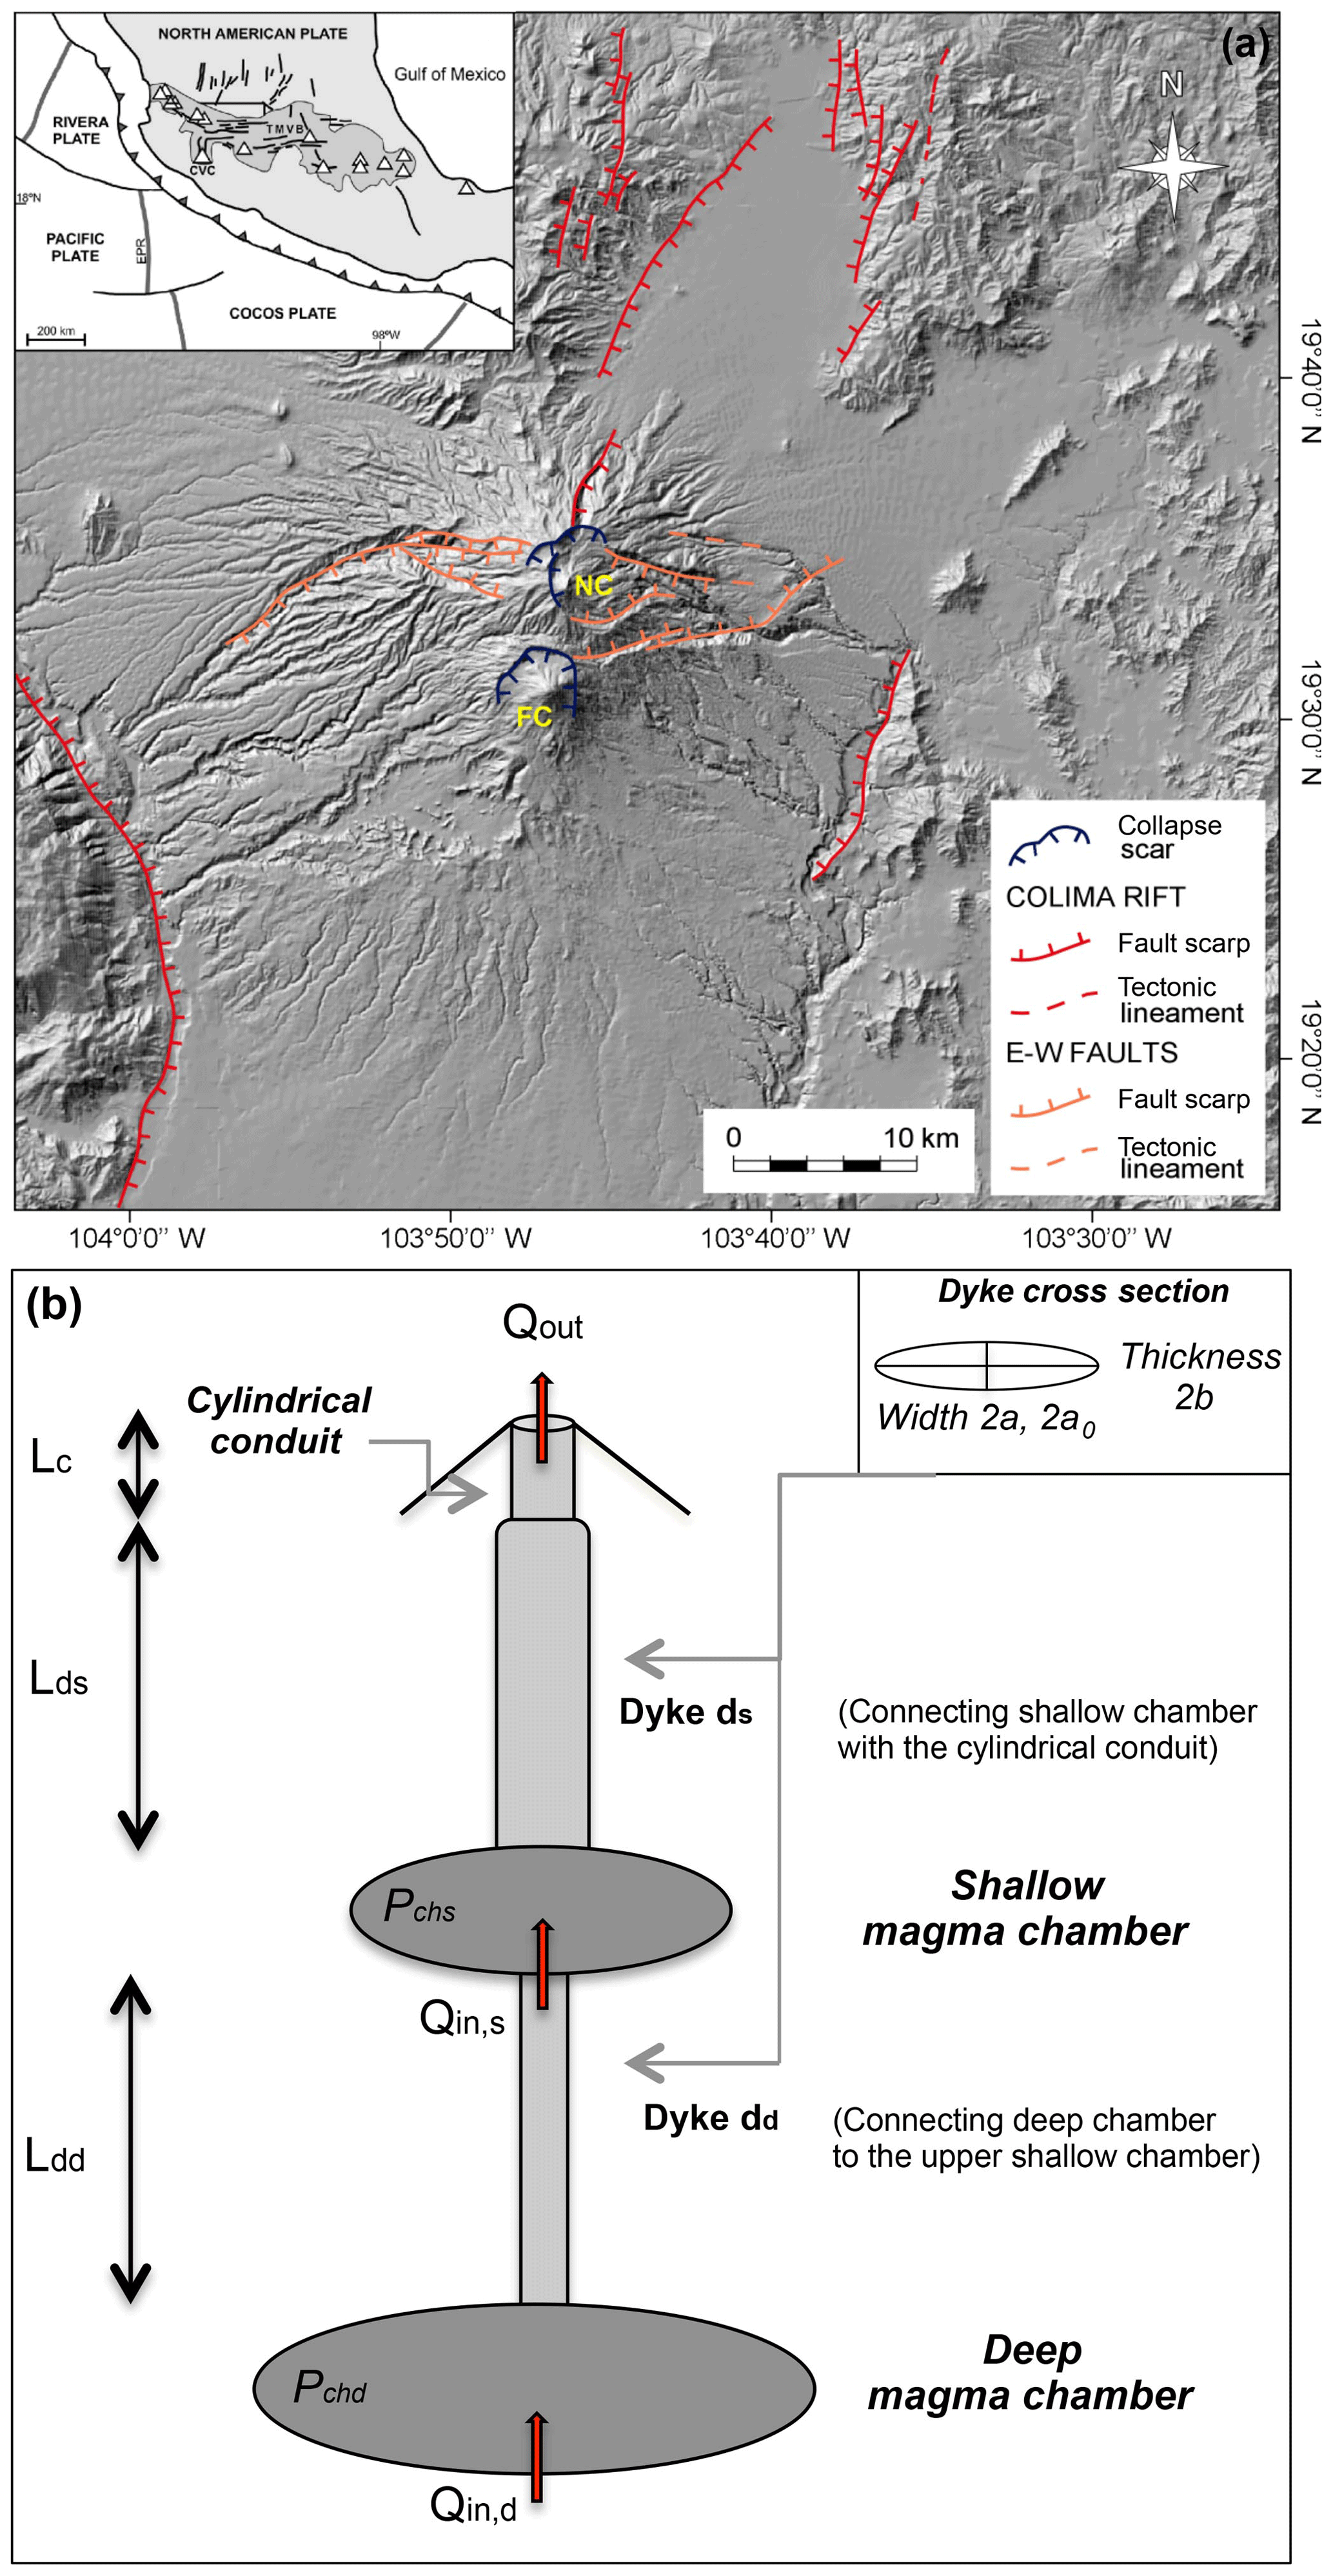
Figure 1(a) Digital elevation model of the Colima Volcanic Complex (NC: Nevado de Colima volcano; FC: Fuego de Colima volcano) and Colima Rift with the main tectonic and volcano–tectonic structures (modified from Norini et al., 2010). In the inset, the location of the Colima Volcanic Complex (CVC) within the Trans-Mexican Volcanic Belt (TMVB) is shown in the frame of the subduction-type geodynamic setting of Central America. (b) Schematic view of the conduit feeding system framework used for numerical simulations (modified after Melnik and Costa, 2014).
Since historical times Fuego de Colima has represented the most active volcano in Mexico, posing a serious threat to all surrounding populations (Cortés et al., 2005; Gavilanes-Ruiz et al., 2009; Bonasia et al., 2011; Roverato et al., 2011). The earliest accounts of the volcano activity can be found in Historia Antigua de Mexico (Clavijero, 1780), wherein the destructive effects of its explosive activity are carefully described (Brèton-Gonzalez et al., 2002).
The historical activity of Fuego de Colima was described and interpreted by several authors (Luhr and Carmichael, 1980; Medina-Martinez, 1983; De la Cruz-Reyna, 1993; Brèton-Gonzalez et al., 2002; Luhr, 2002). The Fuego de Colima has shown a transitional eruptive behavior spanning from effusive to explosive activity, dominated by dome growth and Vulcanian eruptions. Occasionally sub-Plinian events occurred (1576, 1606, 1690, 1818, and 1913), indicating a recurrence time of approximately 100 years (De la Cruz-Reyna, 1993; Luhr, 2002; Saucedo et al., 2005; Gavilanes-Ruiz et al., 2009; Massaro et al., 2018b). The sub-Plinian event that occurred in 1913 (Saucedo et al., 2010) is the largest historical eruption and it has been used as a benchmark for volcanic hazard studies (Martin del Pozzo et al., 1995; Saucedo et al., 2005; Bonasia et al., 2011).
The 1998–2018 eruptive activity
The 1998–2018 period is the only period of post-1913 activity for which there is sufficiently available information to explore the cyclic activity of Fuego de Colima.
Different periods of effusion (domes and lava flows) punctuated by Vulcanian eruptions and dome collapses characterized the volcano activity between 1998 and 2018 (Savov et al., 2008; Varley et al., 2010a; Hutchison et al., 2013; Mueller et al., 2013; Zobin et al., 2015; GVP, 2017). The duration of extrusive activity and the magma discharge rate varied through time, generally divided into five eruptive phases up to 2015: (I) 1998–1999; (II) 2001–2003; (III) 2004–2005; (IV) 2007–2011; (V) 2013–2015 (Zobin et al., 2015; Aràmbula-Mendoza et al., 2018).
The first dome extrusion of the 1998–1999 phase started in November 1998 and quickly filled the 1994 explosion crater, forming lava flows that descended the southern flanks of the Fuego de Colima cone during most of 1999 (<5 m3 s−1 on average for Mueller et al., 2013; 4.11 m3 s−1 on average for Reubi et al., 2013). At the beginning, this dome grew rapidly (ca. 4.4 m3 s−1), reaching a volume of ca. 3.8×10⁵ m3 in 24 h. During this period the effusion rate reached a peak value around 30 m3 s−1 (Navarro-Ochoa et al., 2002; Zobin et al., 2005; Reubi et al., 2015) and showed a cyclic damped behavior soon after.
During 1999–2001 a series of explosions destroyed the dome and excavated a large apical crater (Brèton-Gonzalez et al., 2002). A slow outpouring of lava (<1 m3 s−1 for Mueller et al., 2013, 0.17 m3 s−1 for Reubi et al., 2013, 2015) resumed in May 2001 and continued for 22 months. In February 2002, the lava dome overflowed the crater rims, producing lava flows. During this eruptive phase, the magma extruded from three separate vents with only minor explosive activity at a rate of ca. 0.9 m3 s−1 (GVP, 2002). Vulcanian explosions dismantled the dome during July and August 2003 (GVP, 2003).
In September 2004, low-frequency seismic swarms heralded the onset of the new effusive phase (Varley et al., 2010a; Aràmbula-Mendoza et al., 2011; Lavallee et al., 2012) with a small increase in the average discharge rate of 0.6 m3 s−1 (Reubi et al., 2013, 2015). The lava dome building occurred from the end of September until the beginning of November, with a magma effusion rate up to 7.5 m3 s−1 in October (Zobin et al., 2008, 2015). The effusive activity was accompanied and followed by intermittent Vulcanian explosions. The explosive activity diminished in intensity during December 2004–January 2005.
From February to September 2005, effusion and large explosions occurred. In the following months, small, short-lived domes were observed, with an estimated effusion rate between 1.2 and 4.6 m3 s−1 (Varley et al., 2010b; Reubi et al., 2015). In May and June, the explosive activity produced pyroclastic density currents reaching distances up to 5.4 km from the volcano summit (Varley et al., 2010a).
In February 2007, a new lava dome began to grow and explosions were reported in the period between January 2009 and March 2011. The 2007–2011 period of dome extrusion represents the slowest growth rate in the recent history of Fuego de Colima. Hutchison et al. (2013) calculated a mean effusion rate of ca. 0.02 m3 s−1 from 2007 to 2010 using digital photographic data, in good accordance with Zobin et al. (2015), who reported extrusion rates of 0.03 m3 s−1 during 2007. Mueller et al. (2013) estimated the magma extrusion rate between 0.008±0.003 and 0.02±0.007 m3 s−1 during 2010, which dropped down to 0.008±0.003 m3 s−1 again in March 2011. On 21 June 2011 an explosion heralded the cessation of dome growth and marked the end of the effusive period. After 1.5 years of rest, in January 2013 a sequence of explosions cored out the 2011 dome and generated pyroclastic density currents that reached distances of up to 2.8 km from the summit (GVP, 2013). From March to October, the calculated discharge rate was in the range of 0.1–0.2 m3 s−1 (Reyes-Dávila et al., 2016).
Successively, the middle to low explosive activity took place up to February–March 2014 until a new pulse of magma was observed in July, with an approximate rate of 1–2 m3 s−1 (Aràmbula-Mendoza et al., 2018). On 11 January 2015, a new lava dome was observed inside the crater (Thiele et al., 2017) and its growth continued until July, with an effusion rate of ca. 0.27 m3 s−1 (Zobin et al., 2015). Between 10 and 11 July 2015 the recent dome was destroyed by the most intense activity since the 1913 eruption (Capra et al., 2016; Reyes-Dávila et al., 2016).
In the 2013–2015 period, the average extrusion rate was ca. 0.2 m3 s−1 (Thiele et al., 2017), with peak values >10 m3 s−1 (Varley, 2015). After that, the eruptive activity ceased until January 2016 when daily ash plumes started to occur along with active lava flows and explosions. In early July a new dome began to grow, overtopping the crater rim. A large explosion was recorded on 10 July 2016, followed by daily and multiple daily ash plumes up to the end of year. Multiple flows descended from the lava dome during September–December. In 2017 frequent strong explosions and ash emissions were recorded until March. Through June decreasing seismicity and minor landslides were reported with no evidence of effusive activity or new dome growth (GVP, 2017).
Here we provide a more systematic overview of the 1998–2018 eruption activity obtained by satellite thermal data along with some published data, explained in the following section.
We analyzed the thermal energy spectrum of the Fuego de Colima volcano available from March 2000 to October 2018 from the Middle Infrared Observation of Volcanic Activity (MIROVA) hot-spot detection system (Coppola et al., 2016). The period 1998–1999 was integrated using published discharge rates (Navarro-Ochoa et al., 2002; Zobin et al., 2005). The MIROVA system is based on the near-real-time (NRT) analysis of the MODerate resolution Imaging Spectroradiometer (MODIS) data, distributed by the LANCE-MODIS data system (http://modis.gsfc.nasa.gov/, last access: 22 August 2019).
The thermal emission from an object is attenuated by the atmosphere resulting from absorption by gases and scattering by particles. The MIROVA system focuses on the middle infrared region (MIR), which shows the lowest attenuation levels, to better detect and analyze thermal radiation emitted from volcanic sources. While the standard MODIS forward processing delivers Aqua and Terra images within 7–8 h of real time, LANCE-MODIS allows for the creation of MIROVA radiant flux time series within 1–4 h from the satellite overpass (http://www.mirovaweb.it, last access: 22 August 2019). This thermal data collection was converted into lava discharge rate estimates and integrated with some published data in order to reconstruct the weekly mean discharge rate spectrum from 1998 to 2018 (Fig. 2a).
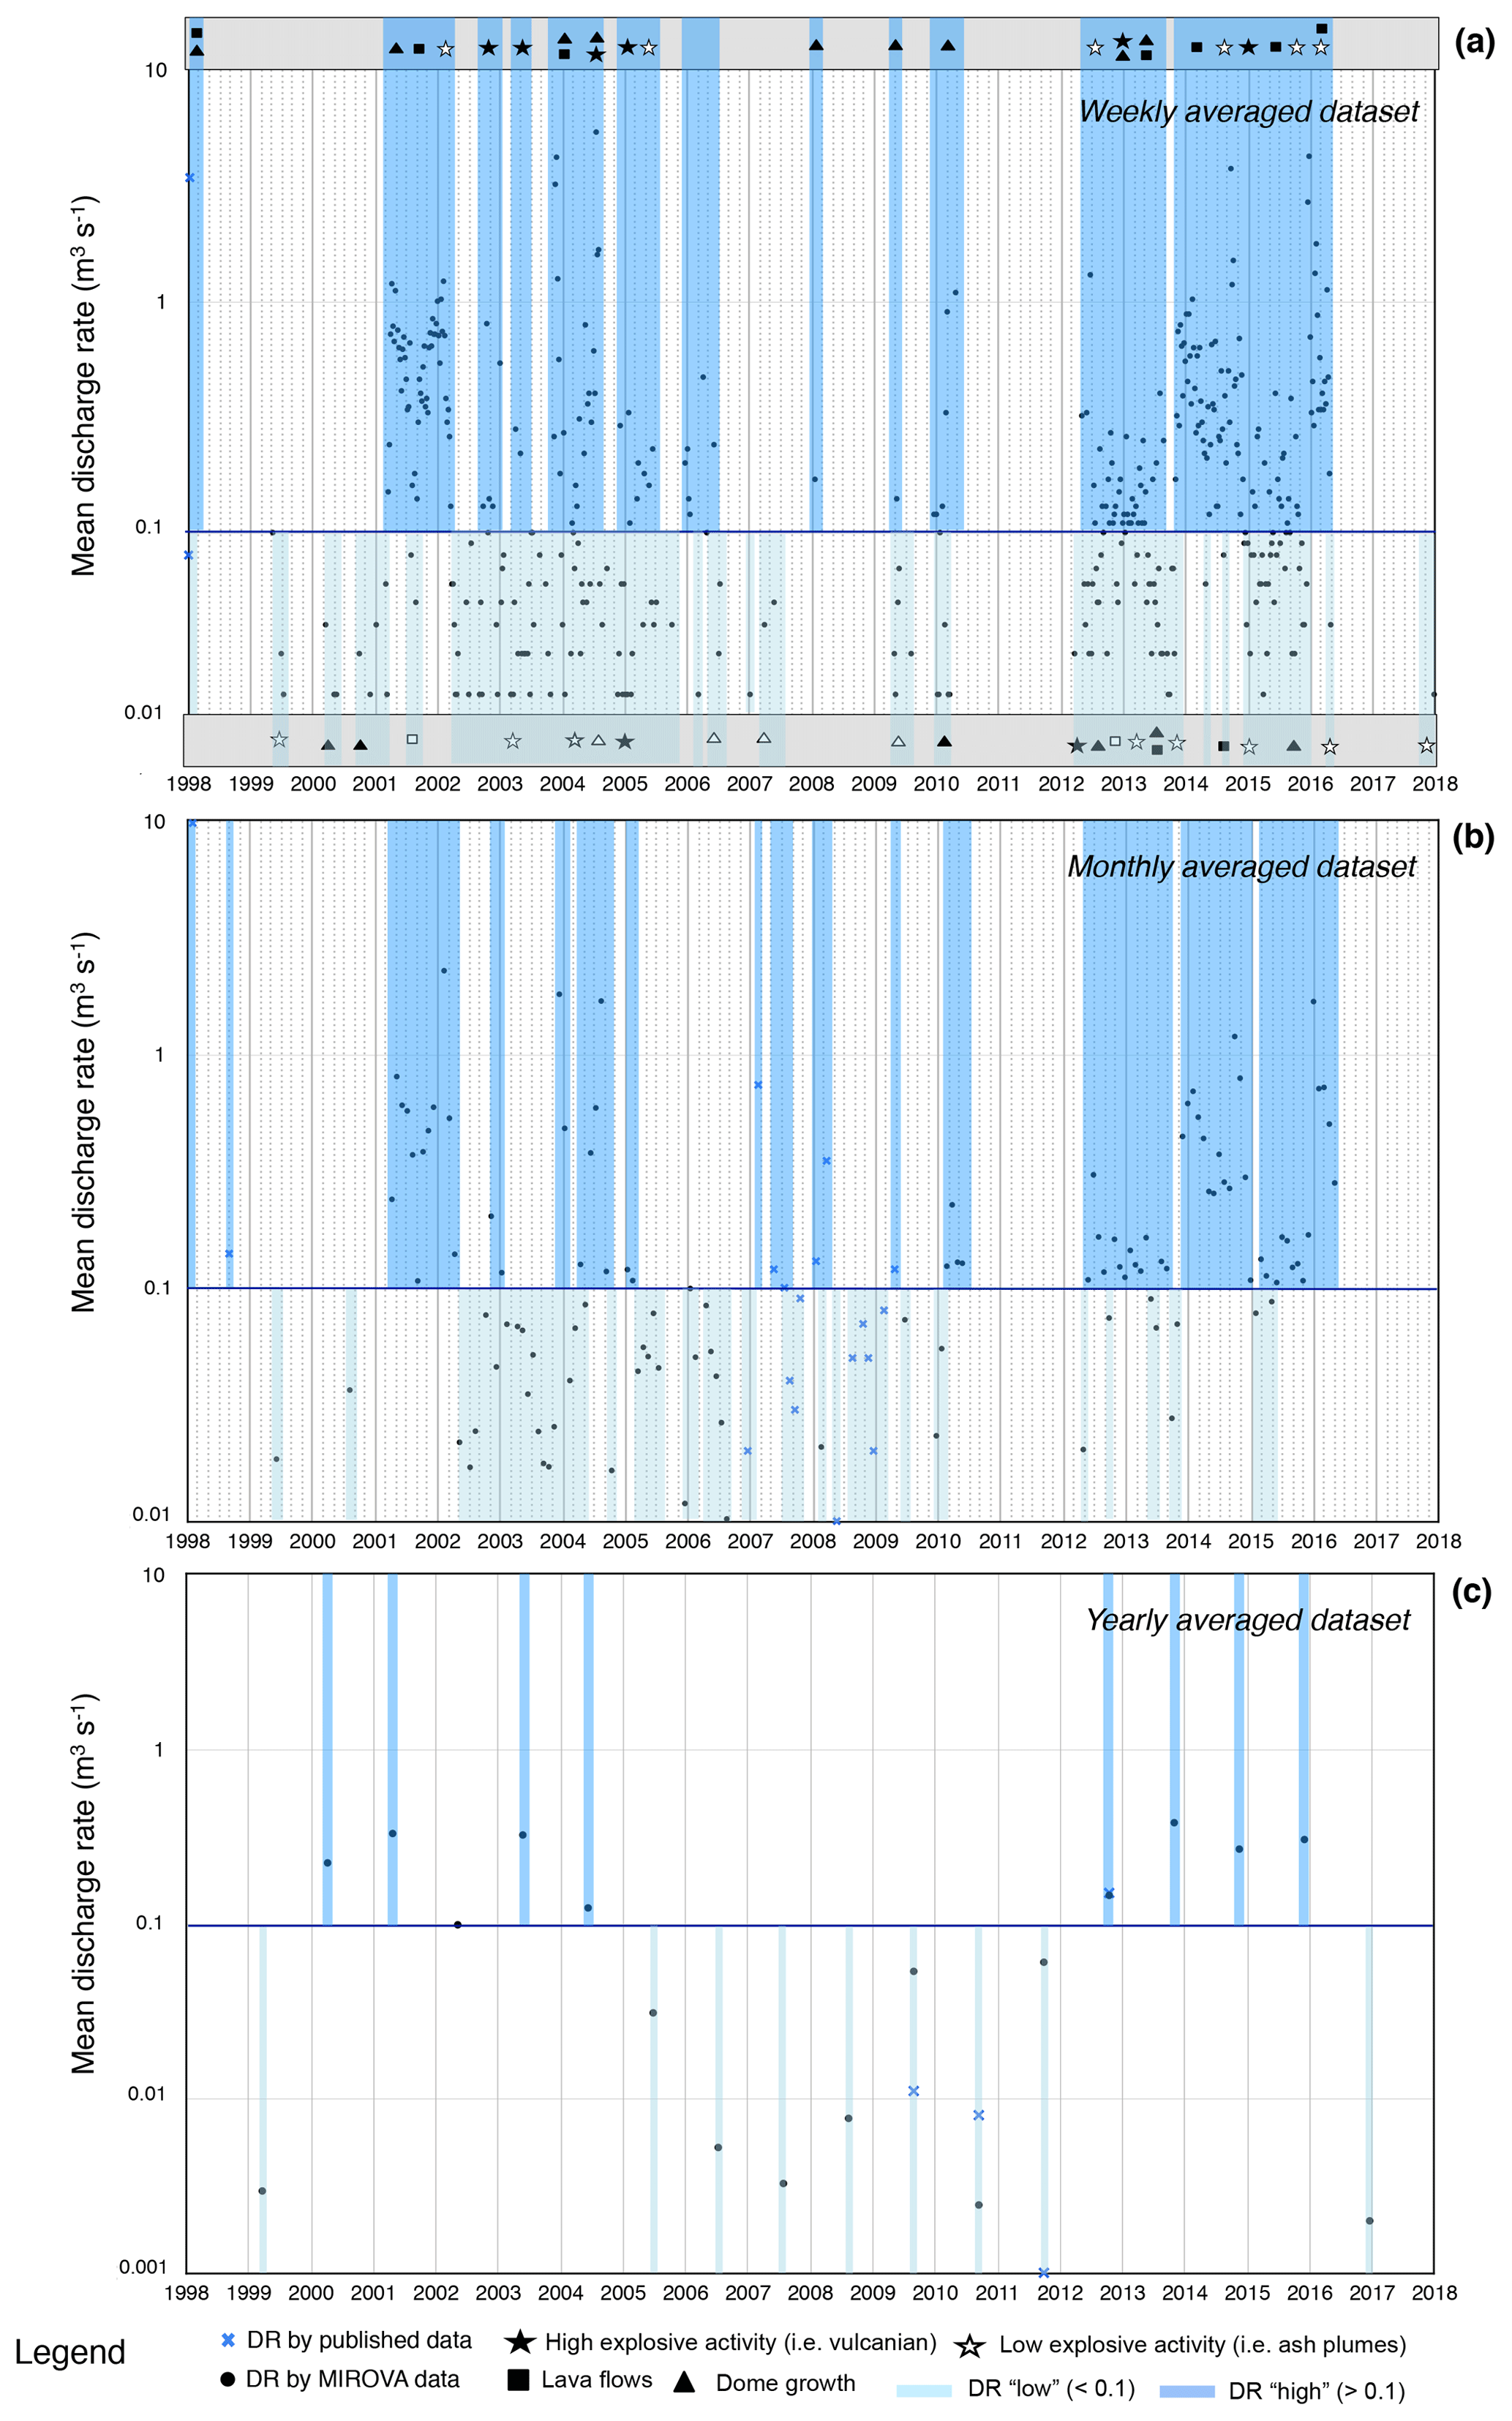
Figure 2Dataset of the averaged discharge rates of Fuego de Colima during 1998–2018, derived from the MIROVA thermal data (black points) and published data (blue crosses) (Navarro-Ochoa et al., 2002; Zobin et al., 2005; Reubi et al., 2013; Mueller et al., 2013; Varley, 2015; Reyes-Dávila et al., 2016; Thiele et al., 2017; GVP, 2002, 2017). Values >0.1 (m3 s−1) are considered to be “high” (dark blue area) and values <0.1 (m3 s−1) are “low” discharge rates (light blue area). The 0.01 (m3 s−1) value is the threshold under which the MIROVA system does not provide reliable data (blue line); (a) weekly average discharge rates. The boxes contain symbols of volcanological observations reported in the literature; (b) monthly average discharge rates; (c) yearly average discharge rates.
In this work, we refer to Coppola et al. (2013), who describe the relationship between the heat lost by lava thermal radiance variations and discharge rates by means of a unique empirical parameter. They compared the energy radiated during several distinct eruptions to the erupted lava volumes (m3). The relationship between the volcanic radiated energy (VRE) and the erupted volume was defined by introducing the concept of radiant density (crad; J m−3).
This parameter is analyzed as a function of the SiO2 content and the bulk rheological properties of the related lava bodies. It is strongly controlled by the characteristic thickness of the active lavas at the time of a satellite overpass, whereas the effects of variable degrees of insulation, morphology, and topographic conditions produce only a limited range of variability (±50 %) (Coppola et al., 2013). For the Fuego de Colima we used a value of (J m−3) for a SiO2 content of 59.6 % (Savov et al., 2008; Coppola et al., 2013). We obtained the cumulative volumes of effusion per year (from 2000 to 2018) considering the ratio between the average VRE estimations and crad.
It is important to stress that the instrumental limit of the MIROVA system is not able to detect thermal anomalies below 0.5–1 MW. Since we used a radiant density crad of 3.90×10⁷ J m−3, the minimum reliable value of the discharge rate is 0.01 m3 s−1 (Coppola et al., 2013). As reported by Coppola et al. (2016), the thermal data obtained from MIROVA are not corrected due to the presence and/or attenuation of clouds. For this reason, the estimates of effusion rates and volumes are to be considered minimum estimates. Because the 2002–2006 and 2013–2016 intervals are the most active in the analyzed period, we firstly applied the Fourier analysis to the monthly average discharge rates (Fig. 2b) of these time intervals in order to explore the modal spectrum of the signal.
Although Fourier analysis is well suited to the quantification of constant periodic components in a time series, it cannot recognize signals with time-variant frequency content. Whereas a Fourier transform analysis may determine all the spectral components embedded in a signal, it does not provide any information about the timing of occurrence. To overcome this problem, several solutions have been developed in the past decades that are able to represent a signal in the time and frequency domain at the same time.
The aim of these approaches is to expand a signal into different waveforms with local time–frequency properties well adapted to the signal structure (Cazelles et al., 2008). In order to get information on the amplitude of the periodic signals within the Fuego de Colima (MIROVA) time series, we performed a wavelet analysis by decomposing the weekly time series (Fig. 2a) into time–frequency space (Fig. 3).
Wavelet analysis is a powerful tool used in many scientific fields (i.e., ecology, biology, climatology, geophysics) and engineering. It is especially relevant to the analysis of nonstationary systems (i.e., systems with short-lived transient components; Cazelles et al., 2008). In particular, the wavelet analysis is well suited for investigations of the temporal evolution of aperiodic and transient signals (Lau and Weng, 1995; Mallat, 1998). For this study, practical the details of applying wavelet analysis were taken from Torrence and Compo (1998) and Odbert and Wadge (2009). It is worth noting that wavelet analysis considers a wave that decays over a finite time and whose integral over infinite time is zero. Many forms of wavelets (called wavelet “functions”, ψ(η), or “mother functions” that depend on a nondimensional time parameter η) have been designed for analytical use (Farge, 1992; Weng and Lau, 1994; Daubechies, 1992), each with its own characteristics that make it suitable for certain applications. The choice of the wavelet can influence the time and scale resolution of the signal decomposition. Wavelet analysis is popular in geosciences (Trauth, 2006) as it does not require any a priori understanding of the system generating the time series. Our time series (weekly average discharge rates acquired by the MIROVA system), called (xn), has equal time spacing (δt=7 d) and an equal number of points . Using the approximately orthogonal Morlet function wavelet ψ(η) (it must have a zero mean and be localized in both time and frequency space; Farge, 1992), we define the wavelet transform Wn(s) as the convolution of xn with a scale (s) and translated version of ψ0(η) (mother function). The formula is as follows:
where (*) indicates the complex conjugate. The scale s should be equal to approximately 2δt, according to the Nyquist theorem. Therefore, the smallest wavelet we could possibly resolve is 2δt, and thus we choose s0=14 d.
Generally, ψ(η) is a complex function, and therefore the wavelet transform is also complex. It is possible to reconstruct the “local” wavelet power spectrum as the absolute value squared of the wavelet coefficients, . The way to compute the wavelet transform for a time series is to find the Fourier transform of both the wavelet function (Morlet in our case) and the time series.
Following Torrence and Compo (1998), we made the normalization by dividing by the square root of the total wavelet variance (σ2).
Usually, a periodic component in a time series may be identified in a power spectrum if it has distinctly greater power than a mean background level (that would correspond to Gaussian background noise) (Odbert and Wadge, 2009). However, the spectra generated from many geophysical systems indicate that the noise in time series data tends not to have a Gaussian distribution (Vila et al., 2006), but it can be better described by colored noise, specifically red noise (Fougere, 1985).
For this reason, we use a simple model for red noise given by the univariate lag-1 autoregressive or Markov process (Torrence and Compo, 1998) in order to determine the significance levels for our wavelet spectrum. These background spectra are used to establish a null hypothesis for the significance of a peak in the wavelet power spectrum. The null hypothesis is defined for the wavelet power spectrum considering that the time series has a mean power spectrum: if a peak in the wavelet power spectrum is significantly above this background spectrum, then it can be assumed to be a true feature with a certain percentage of confidence.
For definitions, significant at the 5 % level is equivalent to the 95 % confidence level (Torrence and Compo, 1998). The confidence interval is defined as the probability that the true wavelet power at a certain time and scale lies within a certain interval about the estimated wavelet power (Torrence and Compo, 1998). Because we deal with finite-length time series, errors occur at the beginning and end of the wavelet power spectrum. A solution is to pad the end of the time series with zeroes to bring the total length N up to the next-higher power of two, thus limiting the edge effects. However, padding with zeroes introduces discontinuities at the end points and, especially towards larger scales, decreases the amplitude near the edges as more zeroes enter the analysis (Torrence and Compo, 1998).
The cone of influence (COI) is the region of the wavelet spectrum beyond which edge effects become important. The criterion for applying wavelet analysis is very similar to those employed with classic spectral methods. In other words, the wavelet transform can be regarded as a generalization of the Fourier transform, and by analogy with spectral approaches, we compute the local wavelet power spectrum as described above. Successively, this can be compared with the “global” wavelet power spectrum, which is defined as the averaged variance contained in all wavelet coefficients of the same frequency (Torrence and Compo, 1998; Cazelles et al., 2008).
Numerical simulations have been carried out using the magma flow model of Melnik and Costa (2014), who generalized the model proposed by Melnik and Sparks (2005) and Costa et al. (2007a) for a magma chamber connected to a dyke that develops into a cylindrical conduit near the surface.
In particular, the model of Melnik and Costa (2014) accounts for the possibility of a dual magma chamber system. The model accounts for rheological changes due to volatile loss and temperature-driven crystallization. These processes are both effective during dome extrusion eruptions because of the typically low magma ascent velocities (from millimeters to a few centimeters per second), which can result in magma transit times from days to weeks. These ascent times are often comparable with those of crystal nucleation and growth (Melnik and Sparks, 1999, 2005; Costa et al., 2007a).
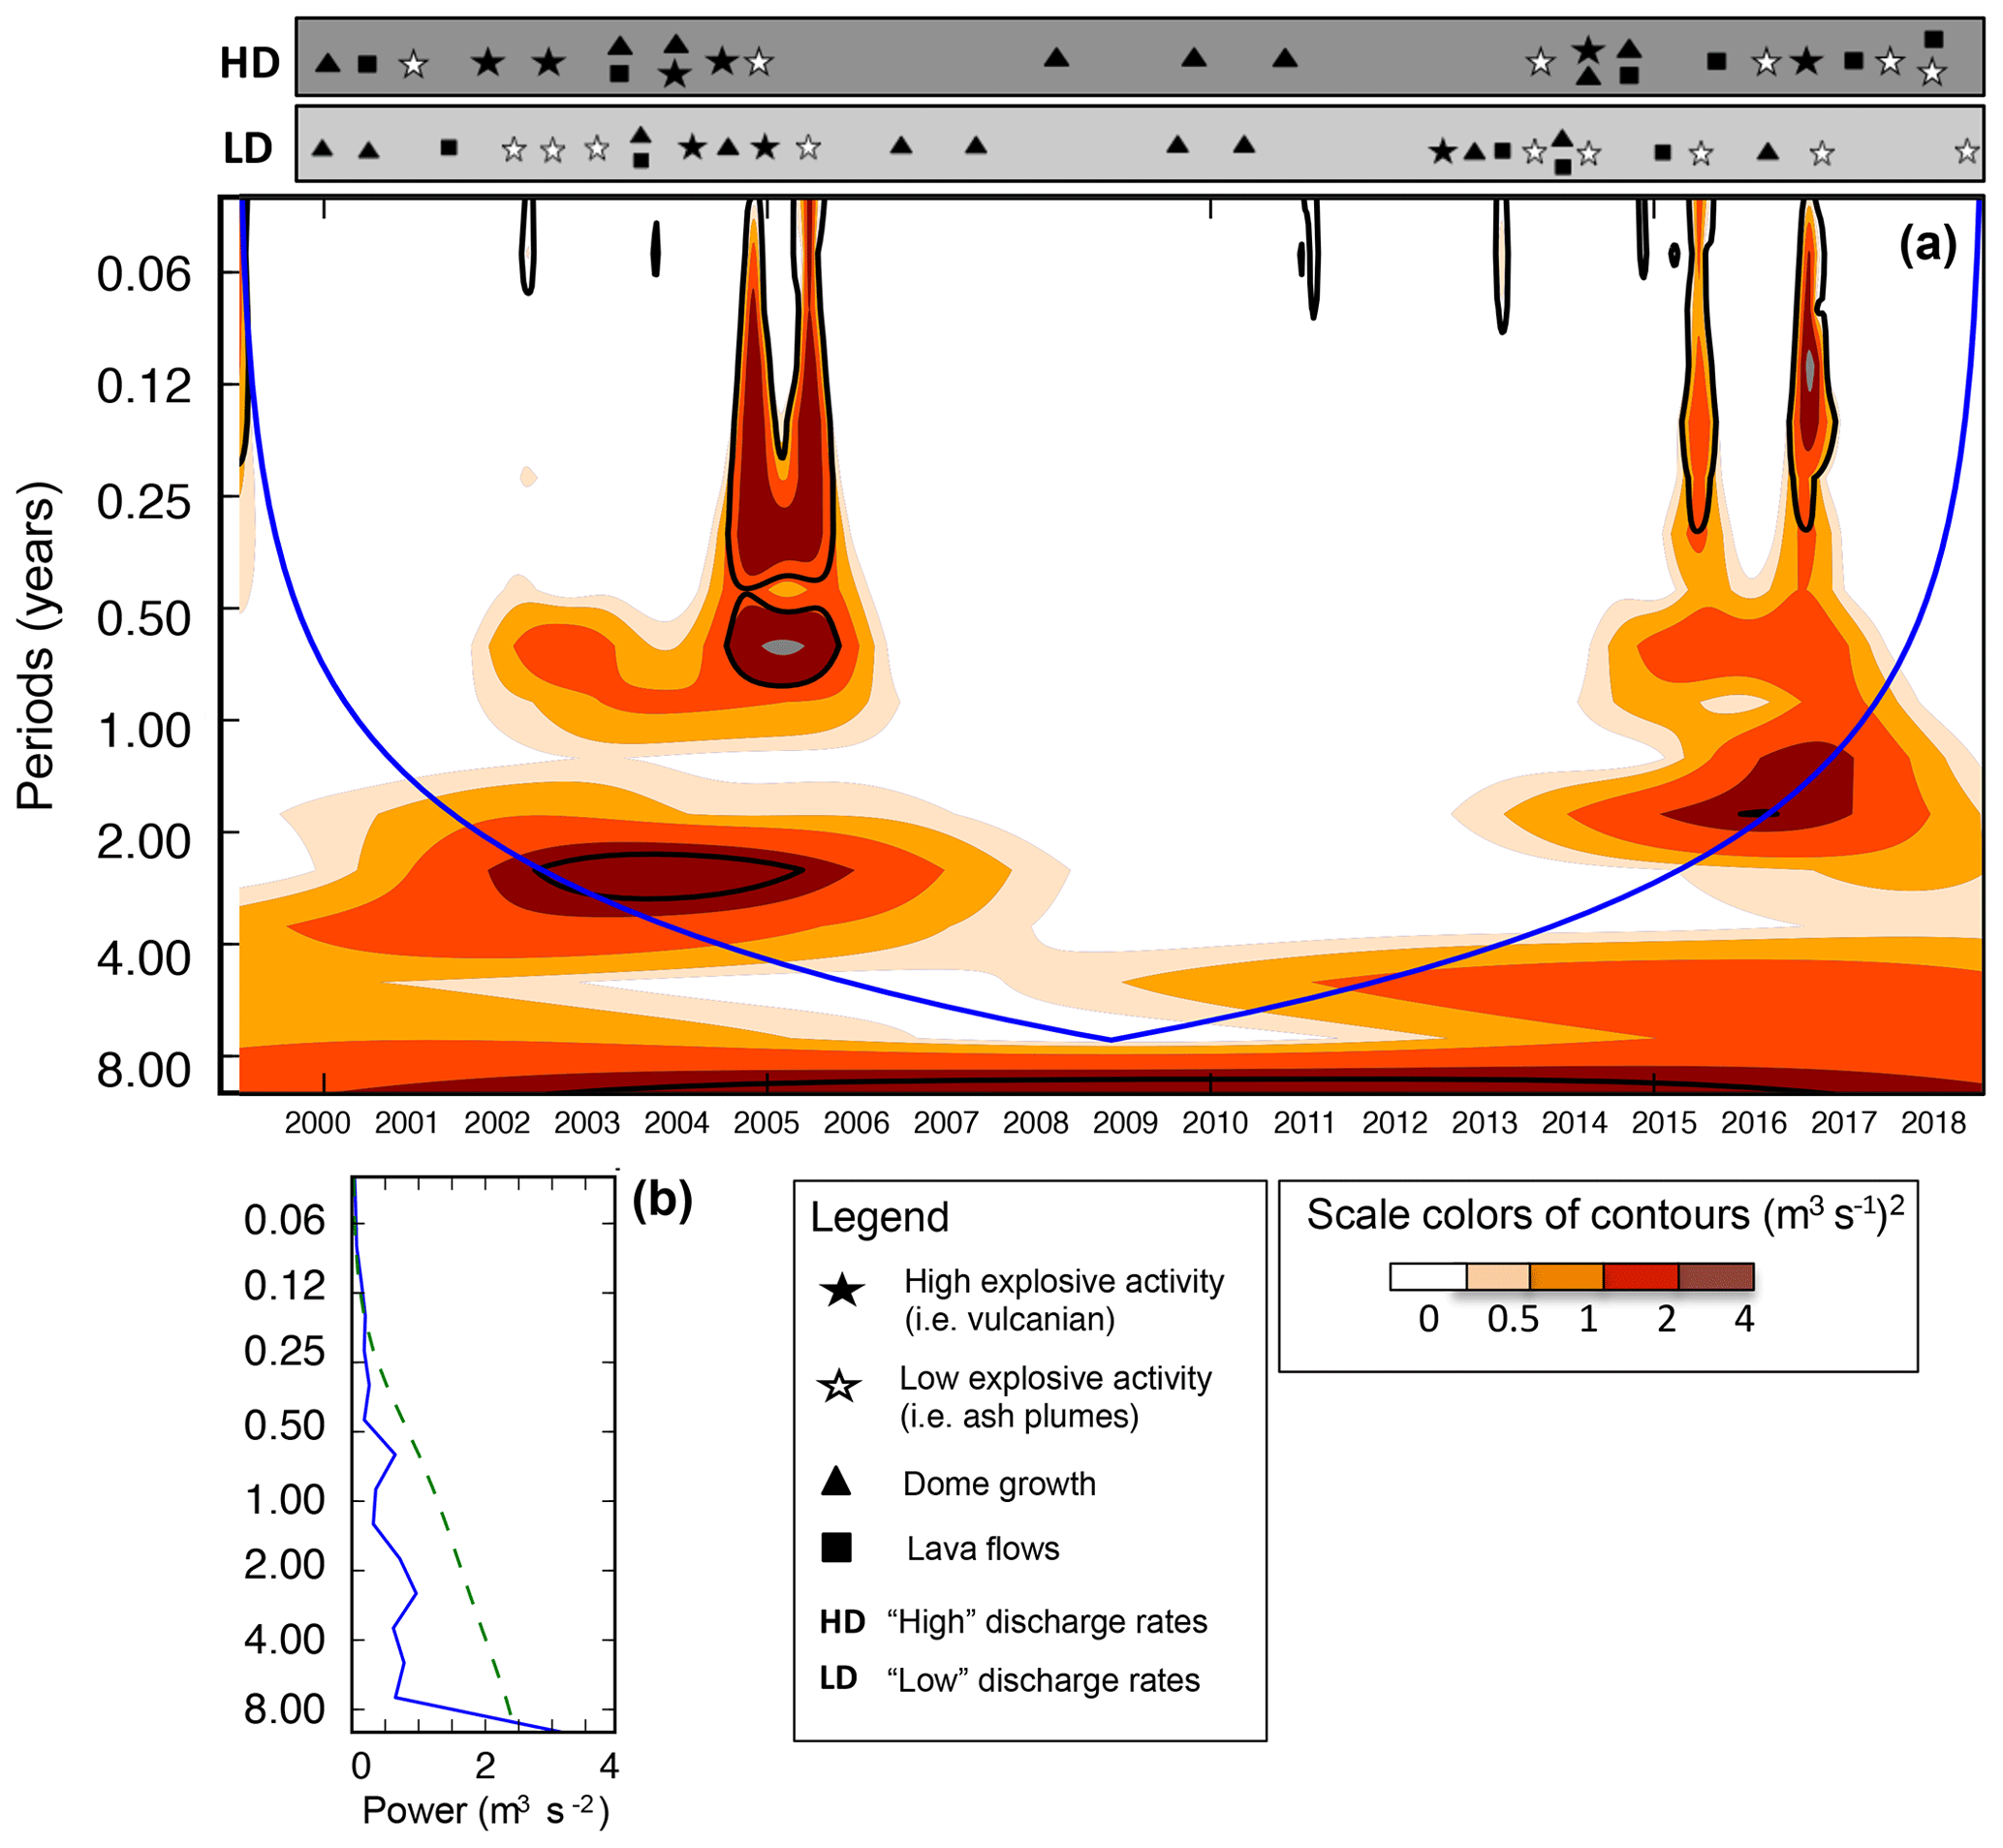
Figure 3(a) Local wavelet spectrum normalized by 1∕(σ)2 ((σ)2; (m3 s−1)2). The left axis is the period (in years). The bottom axis is time (in years). The shaded contours are at normalized variances of 0.5, 1, 2, and 4 (m3 s−1)2. The thick black contour encloses regions of greater than 95 % confidence for a red-noise process with a lag-1 coefficient of 0.72. It shows three orders of periodicities: long-term (ca. 1.5–2.5 years), intermediate-term (ca. 5–10 months) during 2002–2006 and 2013–2016, and short-term (ca. 2.5–5 weeks) during 2001–2006 and 2011–2016. The blue line indicates the “cone of influence”, outside of which edge effects become important; (b) global wavelet power spectrum. The green dotted line represents the best-fitting red-noise spectrum at the 95 % confidence level.
4.1 Geometrical configurations of the magma plumbing system
Within the physical framework used in Melnik and Costa (2014), the model (Fig. 1b) consists of two elastic magma chambers located at different depths, with chamber pressures Pchs and Pchd able to drive the magma ascent in an elliptical cross-sectional volcanic conduit (approximating a dyke). Near the surface the conduit develops into a cylinder at depth LT (called the “transition level”).
Numerical simulations were carried out considering the shallower magma chamber (single magma chamber configuration) or the double magma chamber (see Tables 2–3). The single magma chamber model considers a conduit feeding system composed of a shallow dyke (ds) that connects the magma chamber to a shallower cylinder, in agreement with geological and geophysical evidence from different volcanoes (Melnik and Sparks, 2005; Costa et al., 2007a; Melnik et al., 2009; Melnik and Costa, 2014). The double magma chamber model includes the addition of a deep reservoir connected to the shallow chamber through a deep elastic dyke (dd) (Fig. 1b).
Table 2Conduit geometry parameters using a single magma chamber model.

Table 3Parameters used for simulations carried out with a dual magma chamber model.

In order to reproduce the observed fluctuations in discharge rates recorded in some periods of the 1998–2018 eruption activity, we considered a discharge rate regime in which the period of pulsations is controlled by the elasticity of the shallow dyke and a discharge rate regime in which the periodicity is controlled by the volume of the single or dual magma chamber(s) (Barmin et al., 2002; Melnik and Sparks, 2005; Costa et al., 2007a; Melnik and Costa, 2014). In Appendix Figs. A1 and A2 we report some test simulations in order to show the control of the most sensitive parameters (i.e., water content in magma, dyke dimensions, volume of magma chamber, magma influx rate into the magma chamber) affecting the model outputs in the case of the single magma chamber model. The volumes of the magma chamber (Vch) range from 20 to 50 km3 and the width of the feeder dyke 2a varies from 200 to 400 m (Massaro et al., 2018b).
In Appendix Fig. A3 we show the sensitivity test aimed to explore a broad range of chamber volumes and aspect ratios in the case of the double magma chamber configuration. The deep chamber has its top at 15 km of depth; it is pressurized and fed from below by a constant influx Qin,d.
The volumes of the shallow magma chamber (Vchs) range from 30 to 50 km3, and the volumes of the deep magma chamber (Vchd) from 550 to 750 km3, according to geophysical data (Spica et al., 2017). The aspect ratios for the shallow and deep magma chambers (ARs−ARd) varied from 1 to 2. For each run included in sections 1–3 of Fig. A4, we used a fixed influx m3 s−1 and variable widths of the deeper dyke (2a0d) from 200 to 3000 m (representative of weak to strong coupling of the magma chambers; Melnik and Costa, 2014). The lower dyke thickness 2b0d is not used as input data to the model as it changes as a function of local pressure conditions, and therefore it does not appear in the diagrams. In section 4 of Fig. A3 we show two sets of runs having Qin,d equal to 1 and 3 m3 s−1, respectively, and the following fixed parameters: ARs and ARd=1, Vchd=650 km3, Vchs=40 km3.
4.2 Petrological data
Erupted products at Fuego de Colima are chemically intermediate and primarily andesitic lavas with ca. 61 wt. % SiO2 (Lavallee et al., 2012). The observed dome growth phases are usually fed by prolonged magma ascent times, which allow for efficient degassing and crystallization. This is in agreement with the low mean porosity (14,%–16 %, e.g., Lavallee et al., 2012; Farquharson et al., 2015; Mora et al., 2002; 0.1 wt. %–2.5 wt. % for 1998–2005 products, Reubi and J., 2008).
Dome lava currently erupted exhibits a range of crystallinities (phenocrysts, 20 % vol.–30 % vol.; microlites, 25 % vol.–50 % vol.), and the groundmass constitutes as much as 68 % vol. (Luhr, 2002). The andesites show a porphyritic texture with plagioclase (13 % vol.–25 % vol.), orthopyroxene (2 % vol.–4 % vol.), clinopyroxene (3 % vol.–4 % vol.), and minor hornblende (<0.5 %) and Fe–Ti oxides (ca. 2 % vol.). Olivine occurs rarely as xenocrysts (Lavallee et al., 2012). As reported in Melnik and Costa (2014), the magma viscosity μ is calculated according to Costa et al. (2007a) considering the melt viscosity, μm, times a correction for the effects of crystallinity, θ, and for the bubbles, η. The formula is
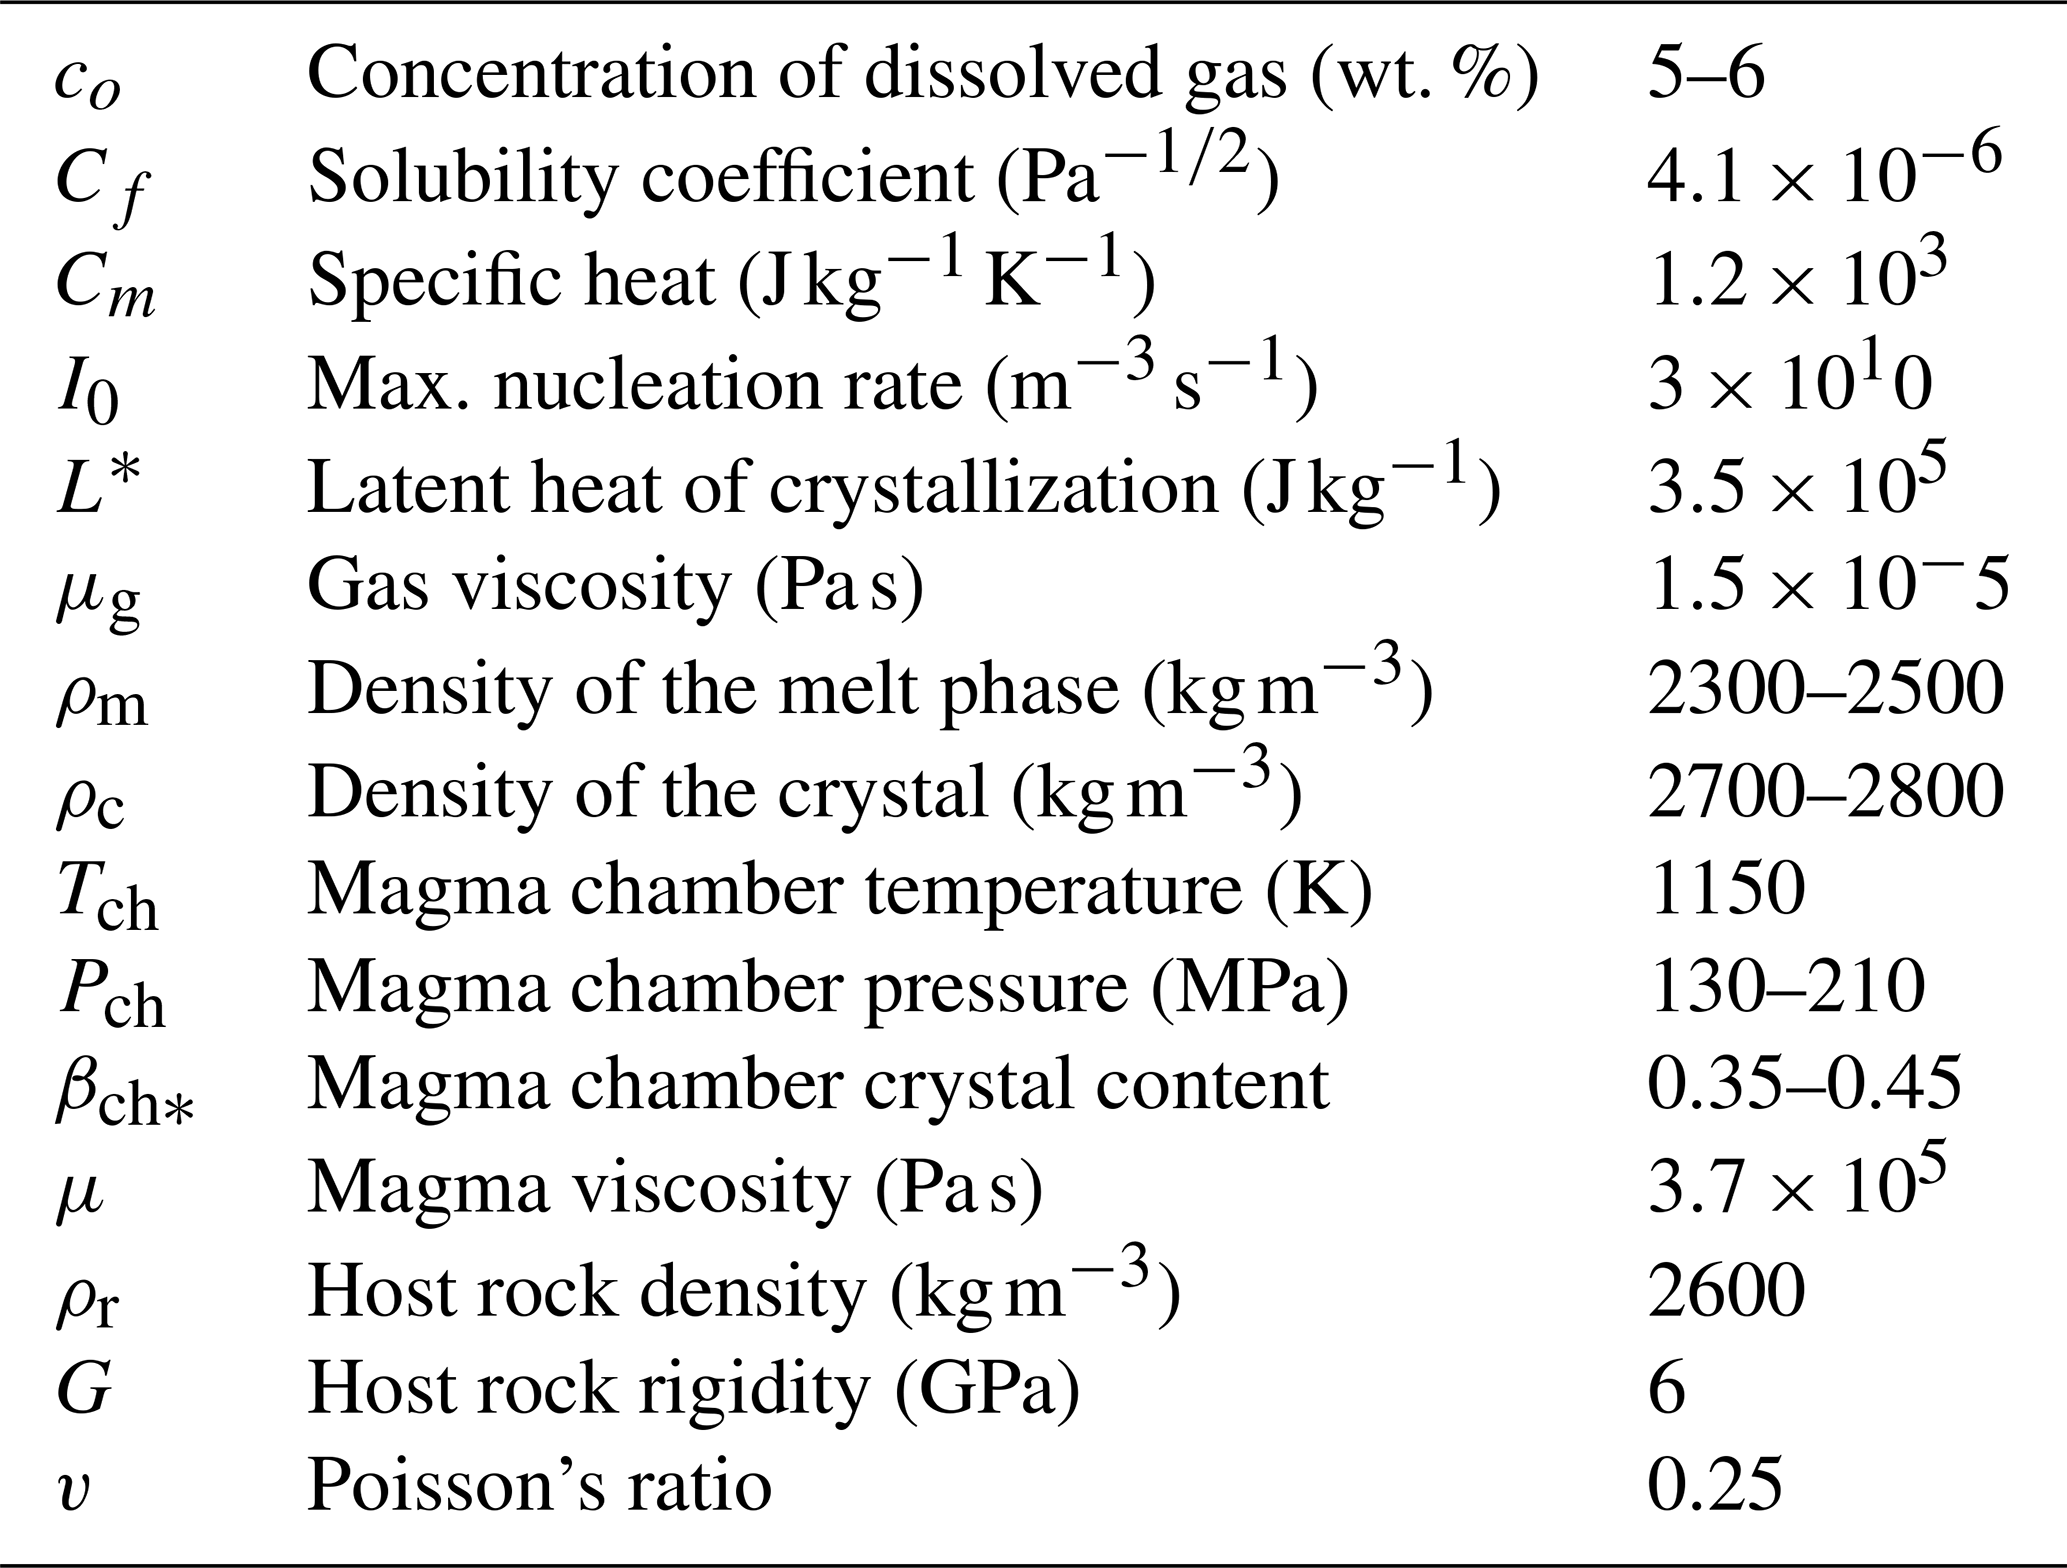
which depends on the melt viscosity μm (that is a function of the water content c and temperature T), on the crystal content β, on bubble fraction α, and on bubble capillarity number (Ca). The rheological model is described in detail in Costa et al. (2007a). Table 1 summarizes the value ranges used for the input parameters of the model.
In Fig. 2 we show the average discharge rates at the Fuego de Colima volcano from November 1999 to October 2018. Here we define “high” discharge rate values as >0.1 m3 s−1 (highlighted as dark blue areas). All values below 0.1 m3 s−1 are considered “low” discharge rates (light blue areas).
Volcanological observations are reported at the top and the bottom of the diagram. It is worth noting that the high and low explosive activity correspond to the high and low discharge rate, respectively. In addition, we distinguish between lava flows and lava domes according to the dominant emplacement style typical of each eruption, as well as between low-magnitude (i.e., ash plumes, gas emissions) and high-magnitude (i.e., strong explosions, Vulcanian eruptions) explosive activity.
The weekly average discharge rates represent the complete dataset used in this study and are reported in Fig. 2a. These data have been calculated by using the MIROVA data (black dots) for the 2000–2018 period and complemented with published data (blue crosses) for the 1998–1999 period (Navarro-Ochoa et al., 2002; Zobin et al., 2005). Even if the data detection of satellite thermal energy represents a continuous spectrum of information, it is worth noting that it suffers from some limitations connected to cloud covering, magma composition, rheology, and the emplacement of the investigated lava body due to topographic conditions (Harris and Rowland, 2009; Harris et al., 2010; Coppola et al., 2009).
Figure 2b shows the monthly discharge rate spectrum from 1998 to 2018 using the MIROVA dataset (black dots), integrated with available published data (blue crosses) (Navarro-Ochoa et al., 2002; Zobin et al., 2005; Capra et al., 2010; Varley et al., 2010a; Sulpizio et al., 2010; James and Varley, 2012; Hutchison et al., 2013; Reubi et al., 2013; Varley, 2015; Reyes-Dávila et al., 2016; Thiele et al., 2017; GVP, 2000, 2017). Figure 2c summarizes the yearly average discharge rates from the MIROVA dataset, highlighting the good agreement with the available average estimation of yearly discharge rates from the literature (Mueller et al., 2013; Reyes-Dávila et al., 2016; Aràmbula-Mendoza et al., 2018; GVP, 1998, 2017).
5.1 Fourier analysis
We applied Fourier analysis to the 1998–2018 dataset (Fig. 2a). In particular, we chose two time windows: (i) the 2002–2006 period, which showed two periodic components, T0=24.70 and T1=6.17, corresponding to ca. 24 and ca. 6 months, respectively (Appendix Fig. A4a), and (ii) the 2013–2016 period that provided similar results of T0=24.94 and T1=6.23, corresponding to ca. 25 and ca. 6 months, respectively (Appendix Fig. A4b).
5.2 Morlet wavelet analysis
The whole analyzed dataset is composed of 825 data points, representing the time evolution of the oscillating components of the 1998–2018 eruptive activity (Fig. 2a). Figure 3a shows the normalized local wavelet power spectrum of the signal. The color scales for power values vary from light orange (low values) to dark red (high values). The thick black contours represent the 95 % confidence level. The blue line indicates the cone of influence (COI) that delimits the region not influenced by edge effects.
From this analysis, it is easy to observe three main periodicities during the 2002–2006 and 2013–2016 periods: (i) long-term periodicity of ca. 1.5–2.5 years; (ii) intermediate-term periodicity of ca. 5–10 months; and (iii) short-term periodicity of ca. 2.5–5 weeks.
The volcanological observations (for high and low discharge rates) are also reported in order to provide a closer link between the observational datasets and the identification of a frequency change in the extrusion rate time series. The short-term periodicity is also present in 2011 (Fig. 3a). Figure 3b shows the global wavelet spectrum corresponding to the local wavelet power spectrum plotted in Fig. 3a. The green dashed line shows the position of the best-fitting red-noise model at the 95% confidence level.
5.3 Numerical simulations
Appendix Figs. A1–A3 provide some sensitivity tests in order to explore the effects of different parameters on discharge rate fluctuations for the single (Figs. A1–A2) and dual magma chamber models (Fig. A3). In particular, in Appendix Fig. A1 the general steady-state solution of the numerical model is reported, with both stable and unstable branches (e.g., Melnik et al., 2009; Nakanishi and Koyaguchi, 2008; the cyclic behavior can occur only between 2 and 4 m3 s−1 for the fixed input data – panel a). Varying the width of the shallow dyke 2a (from 200 to 400 m) and water content in the melt phase, we observed how the unstable branch changes its shape. This implies different periods of possible oscillations in the discharge rate (panels b–c).
Appendix Fig. A2 provides a set of simulations carried out varying the width of the shallow dyke 2a (panel a). The resulting periodicities vary from ca. 1000 d (2a=200 m) ca. 500 d (2a=300 m) to ca. 250 d (2a=400 m). These results highlight the negative correlation between dyke widths and periods of oscillation (Costa et al., 2007a). In this case, the variable widths influence the intensity and periodicity of discharge rates: the wider the dyke, the lower the intensity and periodicity of discharge rates.
Differences in the amplitude of oscillations are observed in panel (b), highlighting a positive correlation between the volume of the magma chamber Vch and periodicities. Periodicities of ca. 500 d correspond to 20–30 km3, while larger values of ca. 970 and ca. 1176 d are provided for 40 and 50 km3, respectively. In panel (c), we also report a set of simulations considering the modeled discharge rate controlled by the elasticity of the shallower dyke with fixed influx rates Qin (in the range of 0.01–0.1 m3 s−1).
Appendix Fig. A3 contains four sections dedicated to the sensitivity tests for the dual magma chamber model (Table 3). As reported in Melnik and Costa (2014), the dual chamber model shows cyclic behavior with a period that depends on the intensity of the influx rate and the chamber connectivity (described as the horizontal extent of the dyke connecting the two chambers).
For a weak connectivity, the overpressure in the deeper chamber remains nearly constant during the cycle and the influx of fresh magma into the shallow chamber is also nearly constant. For a strong connectivity between the two chambers, their overpressures increase or decrease during the cycle in a synchronous way. Influx into the shallow chamber stays close to the extrusion rate at the surface (Melnik and Costa, 2014). We explored different cases considering various fixed parameters as follows: (i) volumes of the shallow and deep magma chambers (Vchs=40 km3, Vchd=650 km3); (ii) aspect ratios (ARs=1, ARd=1) and the deep magma chamber volume (Vchd=650 km3); and (iii) aspect ratios (ARs=1, ARd=1) and the shallow magma chamber volume (Vchs=40 km3). For cases (i), (ii), and (iii), the deep influx rate Qin,d has fixed values from 3 to 1 m3 s−1.
In conclusion, these sensitivity tests showed the passage from weakly connected magma chambers (lack of simultaneous oscillation of Qin,s and Qout) when 2a0d=200 m to strongly connected magma chambers (synchronous oscillations of Qin,s and Qout) when 2a0d=3000 m.
Figure 4 reports the results of numerical simulations aimed to reproduce the Fuego de Colima fluctuations during 1998–2018. Figure 4a shows a representative example of a time-dependent solution for a discharge rate controlled by the elasticity of the shallower dyke.
Simulations were carried out using fixed values of pressure (blue line) and influx rate (green line) at the source region of the shallower dyke, which is ca. 6000 m long. The dyke has width 2a=400 m, thickness 2b=2 m, and a dyke–cylinder transition TL at 1300 m of depth. The magma chamber volume is fixed to 30 km3. Solutions present periodicities from 16 to 40 d, in agreement with the weekly periodicities of ca. 38–18 d (ca. 2.5–5 weeks) derived from the wavelet analysis (Fig. 3a).
Figure 4b describes a representative example of the single magma chamber model simulations. We set up the magma feeding system to be composed of a 6500 m long dyke with a width 2a=600 m, thickness 2b=4 m, and a dyke–cylinder transition TL fixed at 1000 m of depth. The chamber has a volume fixed to 30 km3 and receives a constant m3 s−1. The transient solution accounts for the discharge rate controlled by the magma chamber volume, showing an intermediate-term periodicity of ca. 220 d, in agreement with the intermediate-term periodicity of ca. 146–292 d (ca. 5–10 months) obtained from the wavelet analysis (Fig. 3a).
Figure 4c reports a representative example of the solution obtained with the dual magma chamber model in order to assess the effect of the deep chamber on the discharge rate. We fixed the volumes of the deep and shallow magma chamber at 40 and 650 km3, respectively. The shallow dyke is 6500 m long with a width 2a=260 m and thickness 2b=4 m. The deep dyke has a width 2a0d=500 m and a deep influx rate m3 s−1. A cyclic behavior of ca. 825 d is observed, reaching a peak discharge rate of ca. 6 m3 s−1. This result is in agreement with the long-term periodicity of ca. 547–913 d (ca. 1.5–2.5 years) derived from the wavelet analysis (Fig. 3a).
Considering uncertainties in both modeling results and parameters and the fact that the thickness and width of the dykes are functions of the local overpressure, the results are quite consistent, although with a single model configuration the current approach cannot reproduce the periodicity observed at different timescales.
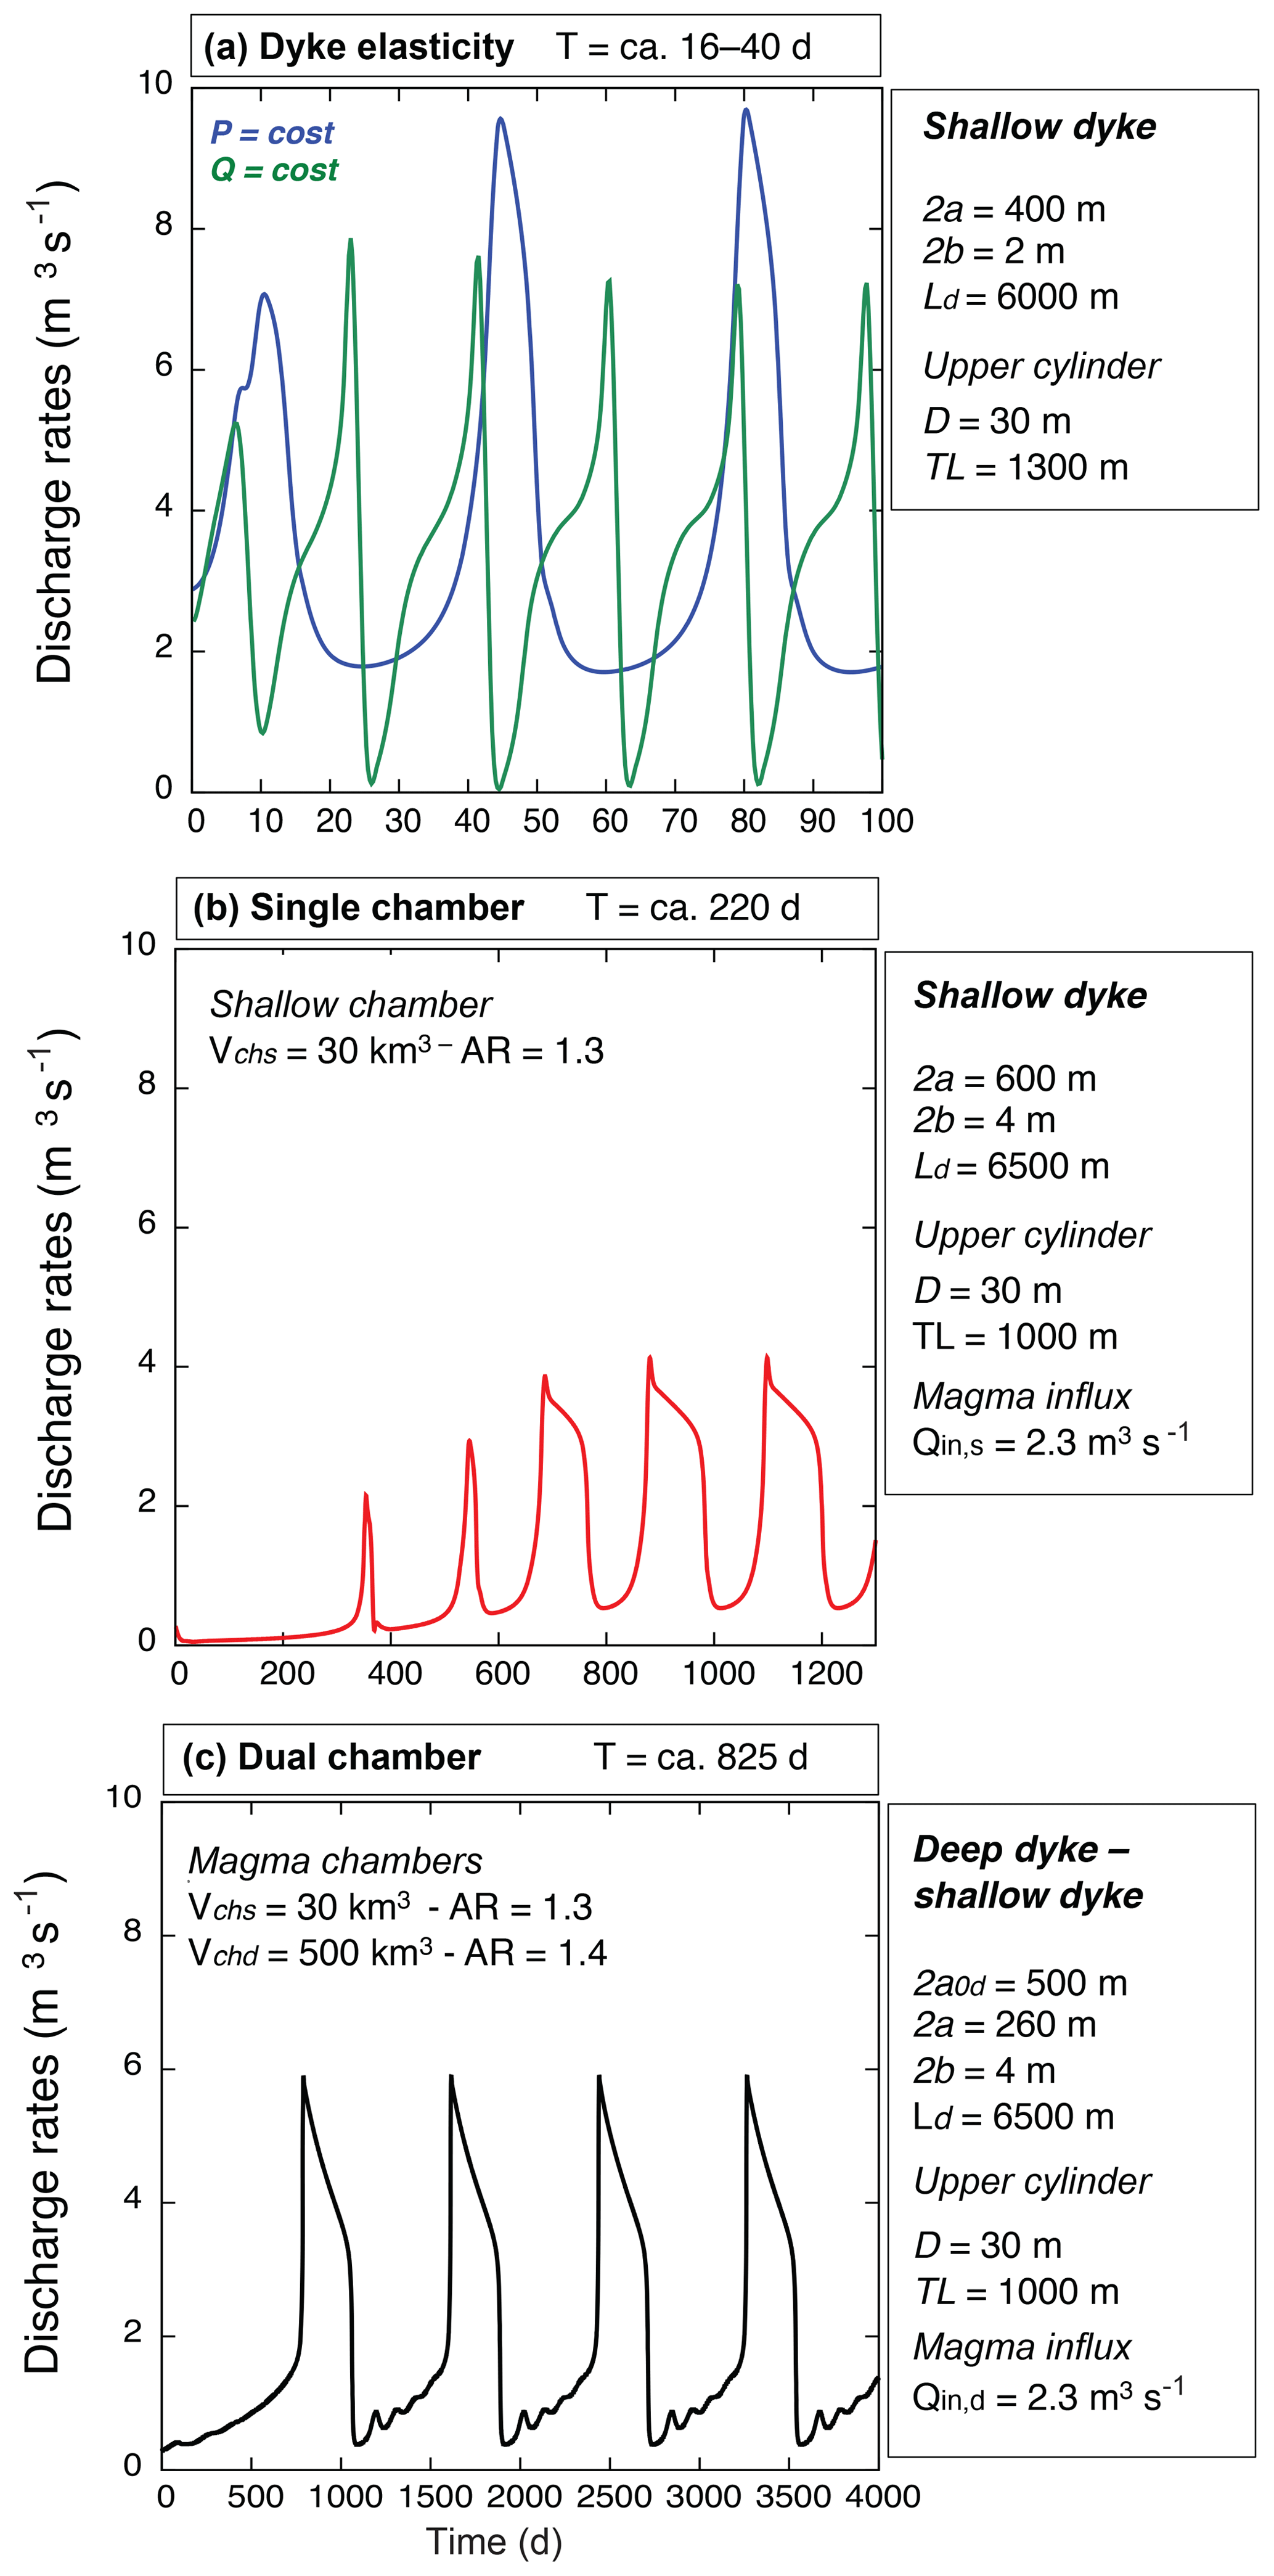
Figure 4Results of numerical simulations. The physical framework of the conduit feeding system has deep and shallow chambers connected to the surface via vertical elastic dykes evolving into a nonelastic cylinder. The length of the shallow dyke Lds is in the range of 6000–6500 m. The passage to the cylinder conduit LT occurs at ca. 1300–500 m below the cone. (a) Discharge rates vs. time considering the elasticity of the shallower dyke, with a width 2a=400 m and thickness 2b=2 m. The cylinder diameter is D=30 m. Two cases are shown: (i) constant pressure (blue line) and (ii) constant influx rate at the source region of the dyke, providing different periodicities of 16 and 40 d, in good agreement with the short-term (weekly) periodicities observed in Fig. 3a; (b) discharge rate vs. time using the single magma chamber model. The dyke width 2a=600 m and thickness 2b=4 m. The chamber has a volume Vch=30 km3, receiving a constant influx m3 s−1; periodicity is ca. 220 d, in good agreement with the intermediate-term (monthly) periodicities observed in Fig. 3a; (c) discharge rate vs. time using the dual magma chamber model. The aspect ratios of the shallow and deep chambers (ARs−ARd) are equal to 1.3 and 1.4, respectively. The upper feeding system has a chamber (Vchs=30 km3) connected to a dyke (width 2a=260 m; 2b=4 m) evolving into a cylinder (D=30 m) at LT=1000 m. The shallow chamber is connected to the deep one (Vchd=500 km3) through a feeder dyke (2a0d=500 m). A constant m3 s−1 is injected from below. Periodicity is in the range of ca. 825 d, in good agreement with the long-term (yearly) periodicities observed in Fig. 3a.
In recent years, many studies have focused on magma flow dynamics in volcanic conduits during lava-dome-building eruptions (Melnik and Sparks, 1999; Wylie et al., 1999; Barmin et al., 2002; Melnik and Sparks, 2005; Costa et al., 2007a, b; Nakanishi and Koyaguchi, 2008; Kozono and Koyaguchi, 2009, 2012), highlighting periodic variations in the discharge rate due to the transition from a low regime (allowing for efficient crystal growth and leading to an increase in magma viscosity) to a high regime (with negligible crystallization). This difference in discharge rates can be of orders of magnitude, with strongly nonlinear responses to the variation of governing parameters from the volcanic system.
This behavior allows for periodic oscillations of the discharge rate (Nakada et al., 1999; Watts et al., 2002), as observed in different dome extrusion eruptions (e.g., Mt. St. Helens, Santiaguito, Soufrière Hills; Melnik et al., 2009). Although each volcano usually shows its complex pattern of discharge fluctuations, the cause can be explained as the superimposition of long-, intermediate-, and short-term effects of the coupled magma chamber(s) and conduit dynamics.
The long-term oscillations in discharge rate are a function of magma chamber size, magma compressibility, the amount and frequency of magma recharge, and withdrawal (Barmin et al., 2002; Costa et al., 2007b, 2013; Melnik et al., 2009). The short-term and intermediate oscillation dynamics can also superimpose on the main long-term periodicity through small changes in magma temperature, water content, and the kinetics of crystallization during magma transit in the conduit (e.g., Melnik et al., 2009).
The aforementioned eruptive behavior also characterized the Fuego de Colima activity in the 1998–2018 period, as demonstrated by the wavelet analysis of satellite thermal data. It is important to stress that the oscillating behavior is not regular, having a period between 2007 and 2012 that does not show any significant periodicity (Fig. 3a), possibly indicating a damped oscillation (Appendix Fig. A2). During this period the volcano enters an almost quiescent state with very low discharge rates. This period of low discharge rates is punctuated by low explosive activity, triggered by dome collapse or pressurization of the upper conduit.
It is well known for Fuego de Colima that Vulcanian explosions can evacuate significant portions of the upper conduit and destroy the lava dome. The influence of these processes on the periodicity of at least short-term periodic regimes could be significant. However, it is expected that such processes should mainly affect sub-daily periodicities, as explained by Costa et al. (2012), who analyzed the periodicity variations due to the collapse of a 200 m high plug at Montserrat. These changes should also have significant effects on the multi-week periodicity analyzed here.
Certainly, we cannot exclude the possibility that an exceptionally large evacuation of the upper conduit would be able to influence longer periodicities such as those investigated here, causing a transition to a more explosive eruptive style (i.e., Plinian) (Massaro et al., 2018b).
In order to investigate the relationship between the periodic components observed in wavelet analysis and the dynamics of the Fuego de Colima feeding system, we run simulations using the numerical model of Melnik and Costa (2014) (Fig. 4). The model can reproduce the results of the wavelet analysis in terms of observed periodicities, allowing us to relate short-, intermediate-, and long-term oscillations in discharge rates to the dynamics of the upper conduit, shallow magma chamber, and coupled shallow and deep magma chambers, respectively. This implies that the pressurization of the deep magma chamber has cascade effects on the whole feeding system of the Fuego the Colima, similar to what has been observed in other recent lava dome eruptions (i.e., Montserrat, Melnik and Costa, 2014).
It is of particular interest that the best output with the dual magma chamber model indicates that chambers do not oscillate simultaneously (“decoupled oscillation”; Fig. 4c). Although the presented data provide, for the first time, a framework able to describe the periodic behavior of effusive activity at the Fuego de Colima volcano, both the numerical model and wavelet analysis suffer from some limitations that need to be taken into account in interpreting the results.
- i.
The available data for discharge rates and dome volumes collected for the 1998–2018 period do not have the same quality. This led us to extract only averages of discharge rates for the entire period, with biasing effects to lower amplitudes.
- ii.
A common weakness of the spectral and wavelet analysis techniques is their inability to distinguish the source of any given periodic component (i.e., whether it is a signal from a volcanic process, an external process, or noise in the dataset). Elucidating the exact mechanism requires competing robust models and multiple independent field observations (Odbert and Wadge, 2009).
- iii.
Assumptions behind the numerical model imply several limitations, such as those due to the constant value of the dyke width and simplified Newtonian rheology.
The first assumption greatly oversimplifies the physics. In the case of large overpressures, stress at the dyke tips will exceed the fracture toughness of the rocks and the dyke will expand horizontally (Massaro et al., 2018a), reaching some equilibrium configuration. When the deep chamber deflates, overpressure in the deeper dyke will decrease and, as the flow rate decreases, magma at the dyke tips can solidify, leading to a decrease in 2a0d (Kavanagh and Sparks, 2011; Melnik and Costa, 2014).
Thermal exchange with wall rock can also affect the nonlinear dynamics of the system (Costa and Macedonio, 2002; Melnik et al., 2009). In addition, a more realistic estimate of the magma viscosity during lava dome eruptions should account for the coupling with energy loss, viscous dissipation, and stick–slip effects (e.g., Costa and Macedonio, 2005; Costa et al., 2007c, 2013.
Although this study revealed that different periodic signals are controlled by different mechanisms occurring in the plumbing system, the current model approach is not able to describe the three periodicities (long, intermediate, and short term) using a unique model configuration. Nevertheless, we hope this work will motivate further numerical modeling approaches in order to develop more sophisticated models able to describe the three timescales together, by incorporating further physical aspects (e.g., full thermal effects) and considering 3-D geometries.
The coupling of wavelet analysis and numerical modeling allowed us to decipher the eruptive behavior of Fuego de Colima in the period 1998–2018, as revealed by satellite thermal data. Three periodicities emerged from the study: (i) long term, (ii) intermediate term, and (iii) short term. The long-term periodicity extracted from wavelet analysis is ca. 913–547 d (ca. 1.5–2.5 years). It was replicated by the dual magma chamber model, which provided a periodicity of ca. 1000–500 d. The intermediate-term periodicity obtained from wavelet analysis is ca. 146–292 d (ca. 5–10 months), fairly replicated by the single magma chamber model with a periodicity of ca. 220 d. The short-term periodicity of ca. 18–38 d (ca. 2.5–5 weeks) is matched by model outputs considering the dynamics of the upper conduit (ca. 16–40 d).
The depicted behavior of effusive activity at Fuego de Colima is presented here for the first time, showing how the volcano presents similarities to the eruptive dynamics of other recent lava dome eruptions (i.e., SHV, Montserrat; Costa et al., 2013).
The wavelet analysis code is a Python script available by contacting the authors. The Melnik and Costa (2014) code is research software and is not free. It can be obtained by contacting the authors and used under their supervision.
The original thermal dataset is available from http://www.mirovaweb.it (last access: 22 August 2019); (Coppola et al., 2009). Excel worksheets can be obtained from the authors.
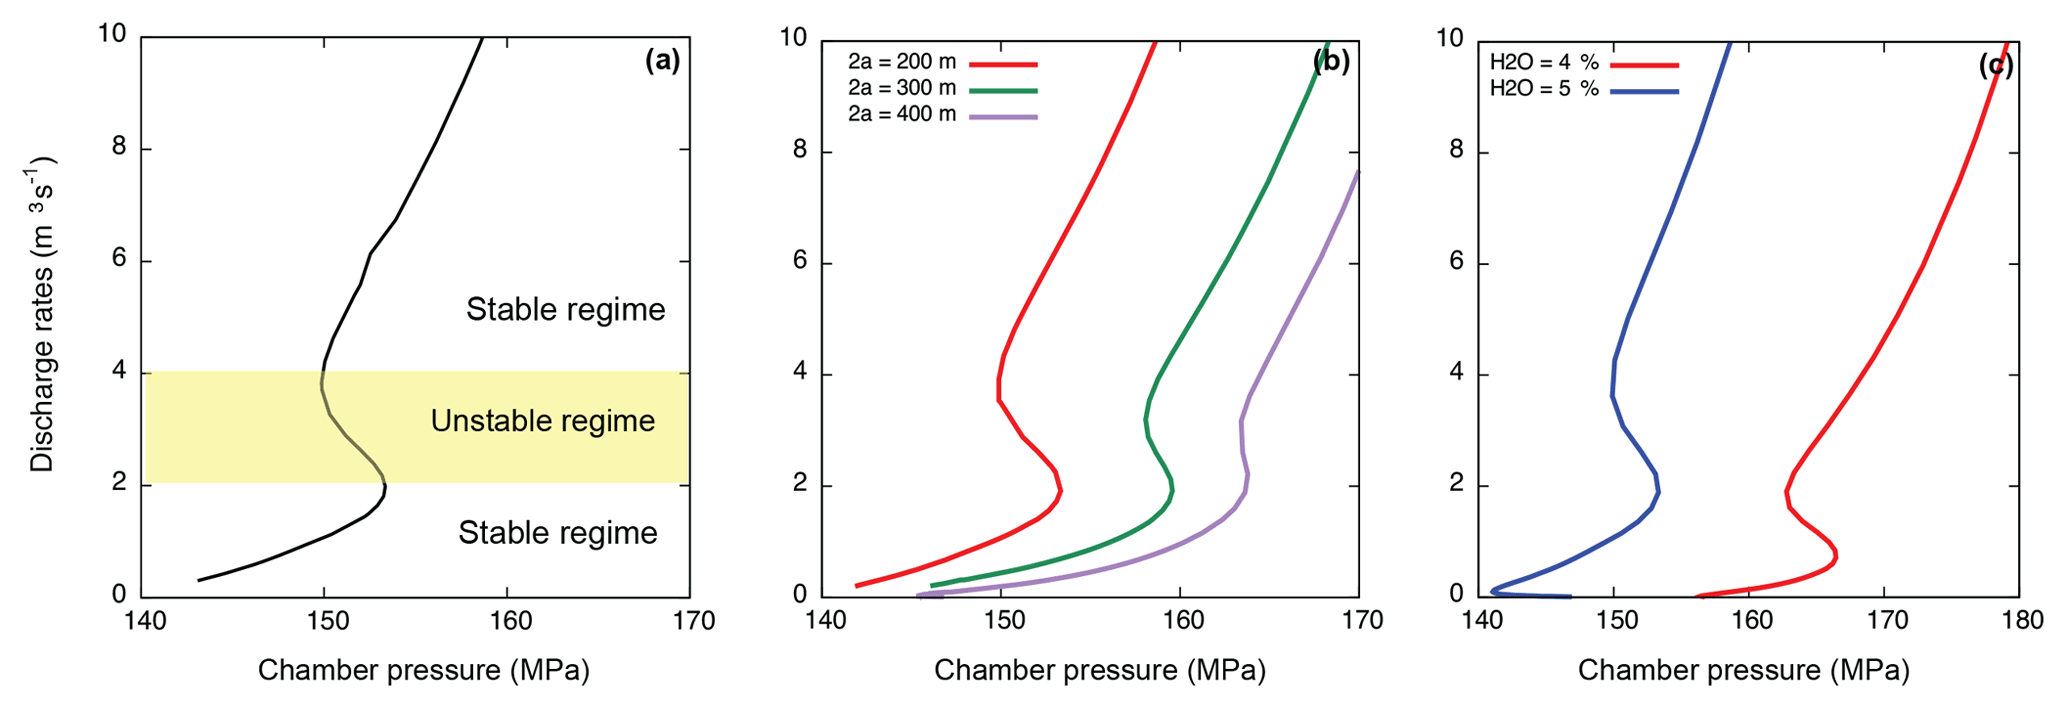
Figure A1Sensitivity tests for steady-state solutions of discharge rate vs. chamber pressure (top) and time evolution of discharge rates (bottom). These solutions refer to the following main input parameters: (i) dyke thickness 2b=40 m as the conduit diameter at the top (D=2b), the transition from the dyke to cylindrical conduit LT=500 m below the surface, the length of the dyke Ld=6 km3, and the volume of the magma chamber Vch=50 km3. (a) General solution showing the transient regime in which the periodicity can occur; (b) solutions influenced by the dyke width 2a (from 200 to 400 m); (c) solutions influenced by the proportion of the water content in the melt (H2O from 4 % to 5 %).
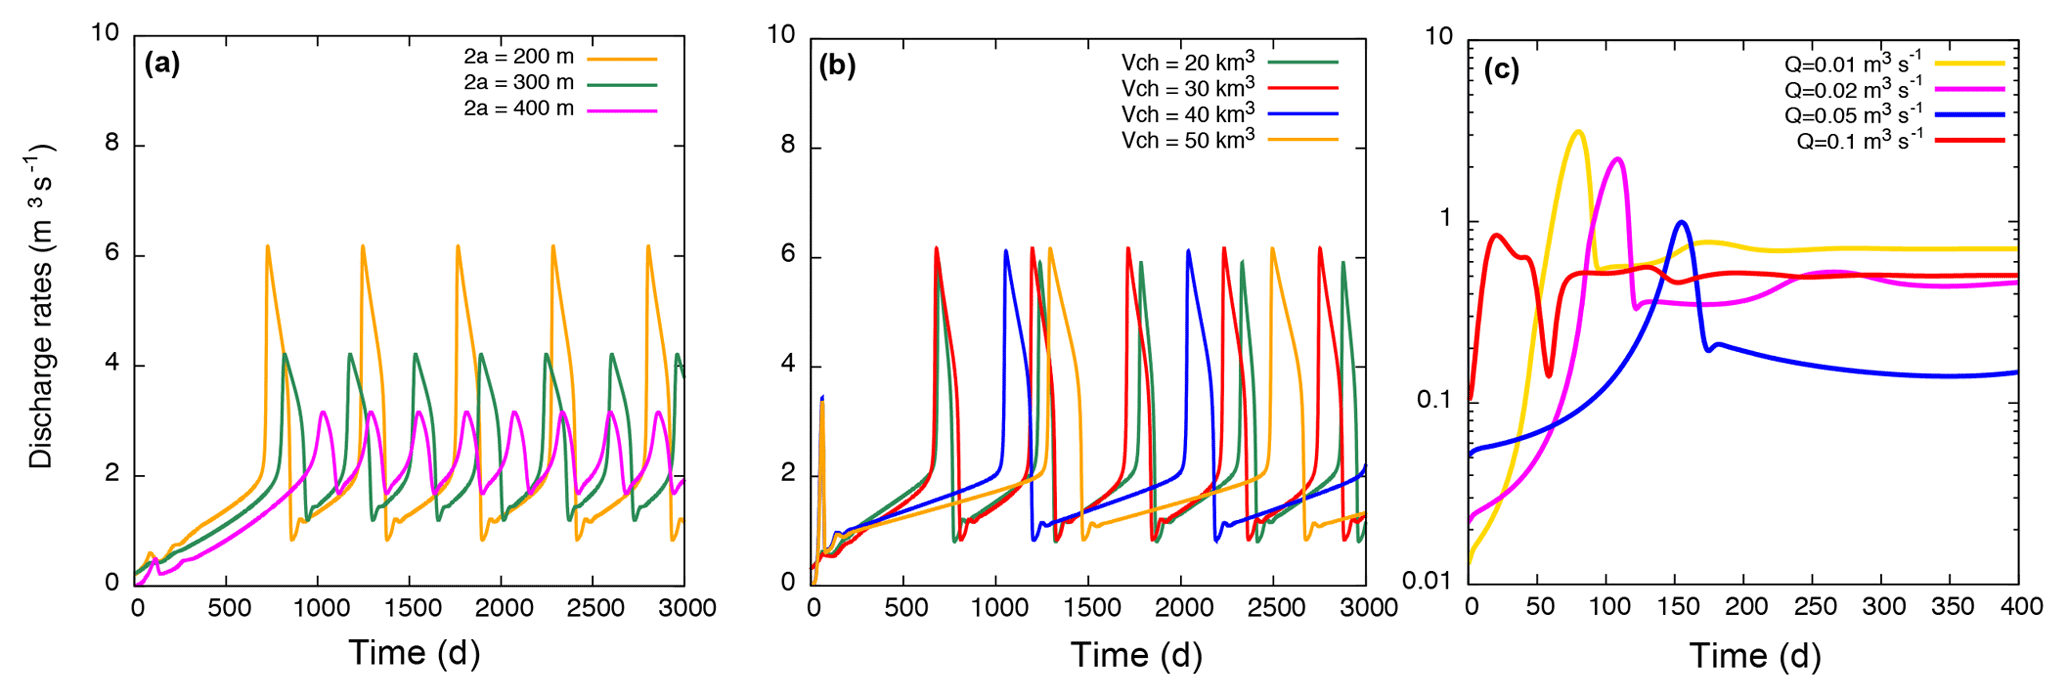
Figure A2Sensitivity tests for transient solutions using the single magma chamber model. As a reference these solutions have the same main input parameters used for Fig. A1. (a) Dependence of discharge rate on time considering the influence of the dyke width 2a from 200 to 400 m; (b) influence of the magma chamber volume Vch (from 20 to 50 km3); (c) dependence of discharge rate on time considering the dyke elasticity. Each curve shows a solution with a constant influx rate Qin (in the range of 0.01–0.1 m3 s−1).
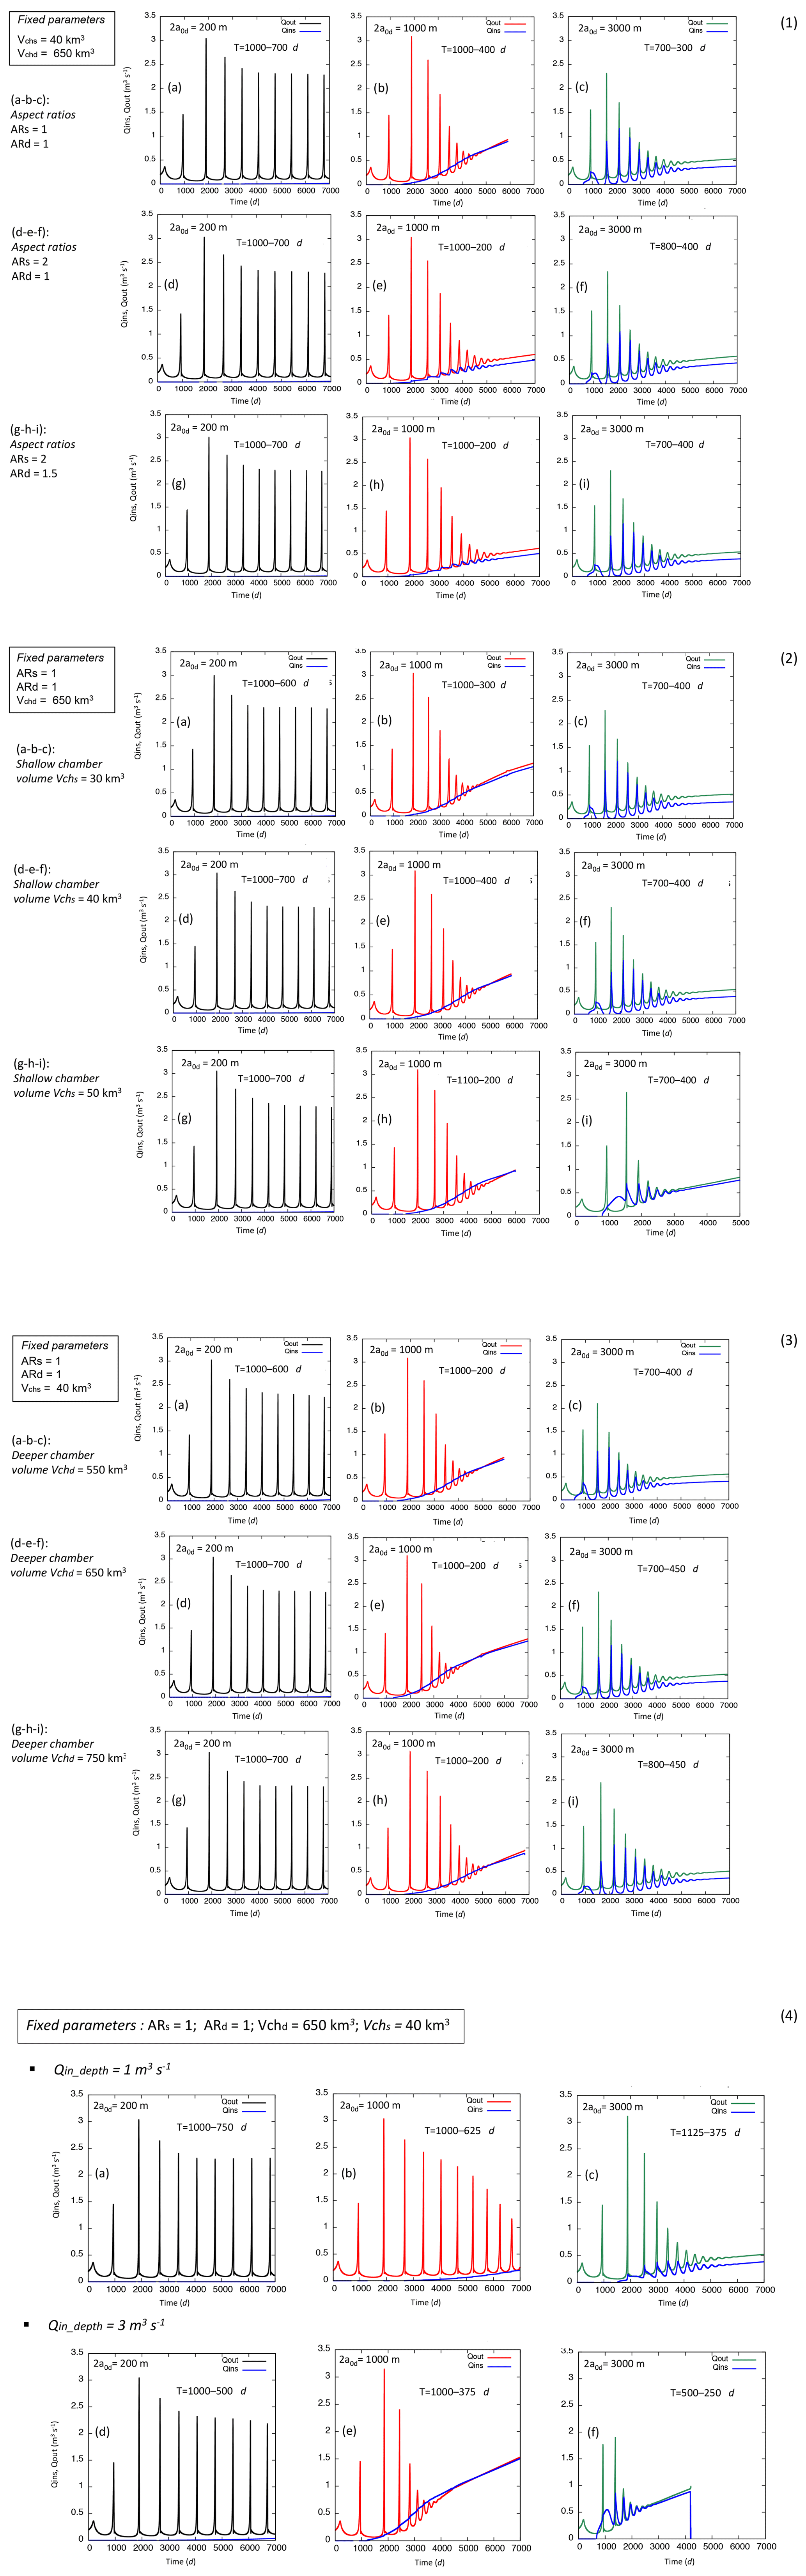
Figure A3Sensitivity tests for transient solutions using the dual magma chamber model. The shallow feeding system has a dyke with a width 2a=200 m, 2b=40 m, and LT=500 m. The cylindrical conduit diameter is D=2b. For each diagram, the outflow (Qout; black red and green lines), the flux entering the shallower magma chamber (Qins; blue line), and periods in days (T) are indicated. Runs of section 1–2–3 have fixed m3 s−1. Section 1: the volumes of the shallow and deep magma chambers are fixed to 40 and 650 km3, respectively. A set of runs is carried out for three different aspect ratios (ARs) of the shallow and deep chambers (ARs=1; ARd=1, ARs=2; ARd=1, ARs=2; ARd=1.5) considering three widths of the deeper dyke (2a0d=200 m – black line, 1000 m – red line, 3000 m – green line). Section 2: the volume of the deeper magma chamber and the aspect ratios of both shallow and deep chambers are fixed to 650 km3 and . A set of runs is provided for three different shallow chamber volumes (Vchs=30, 40, 50 km3) considering three widths of the deeper dyke (2a0d=200 m – black line, 1000 m – red line, 3000 m – green line). Section 3: the shallow chamber volume and the aspect ratios of both shallow and deep chambers are fixed to 40 km3 and , respectively. A set of runs is carried out for three deep chamber volumes (Vchd=550, 650, 750 km3) considering three widths of the deeper dyke (2a0d=200 m – black line, 1000 m – red line, 3000 m – green line). Section 4: the shallow and deep chamber volumes are fixed to 40 and 650 km3, respectively. Two set of runs are carried out for Qin,d equal to 1 and 3 (m3 s−1). The aspect ratios (ARs) of the shallow and deep chambers are both equal to 1, considering three widths of the deeper dyke (2a0d=200 m – black line, 1000 m – red line, 3000 m – green line).
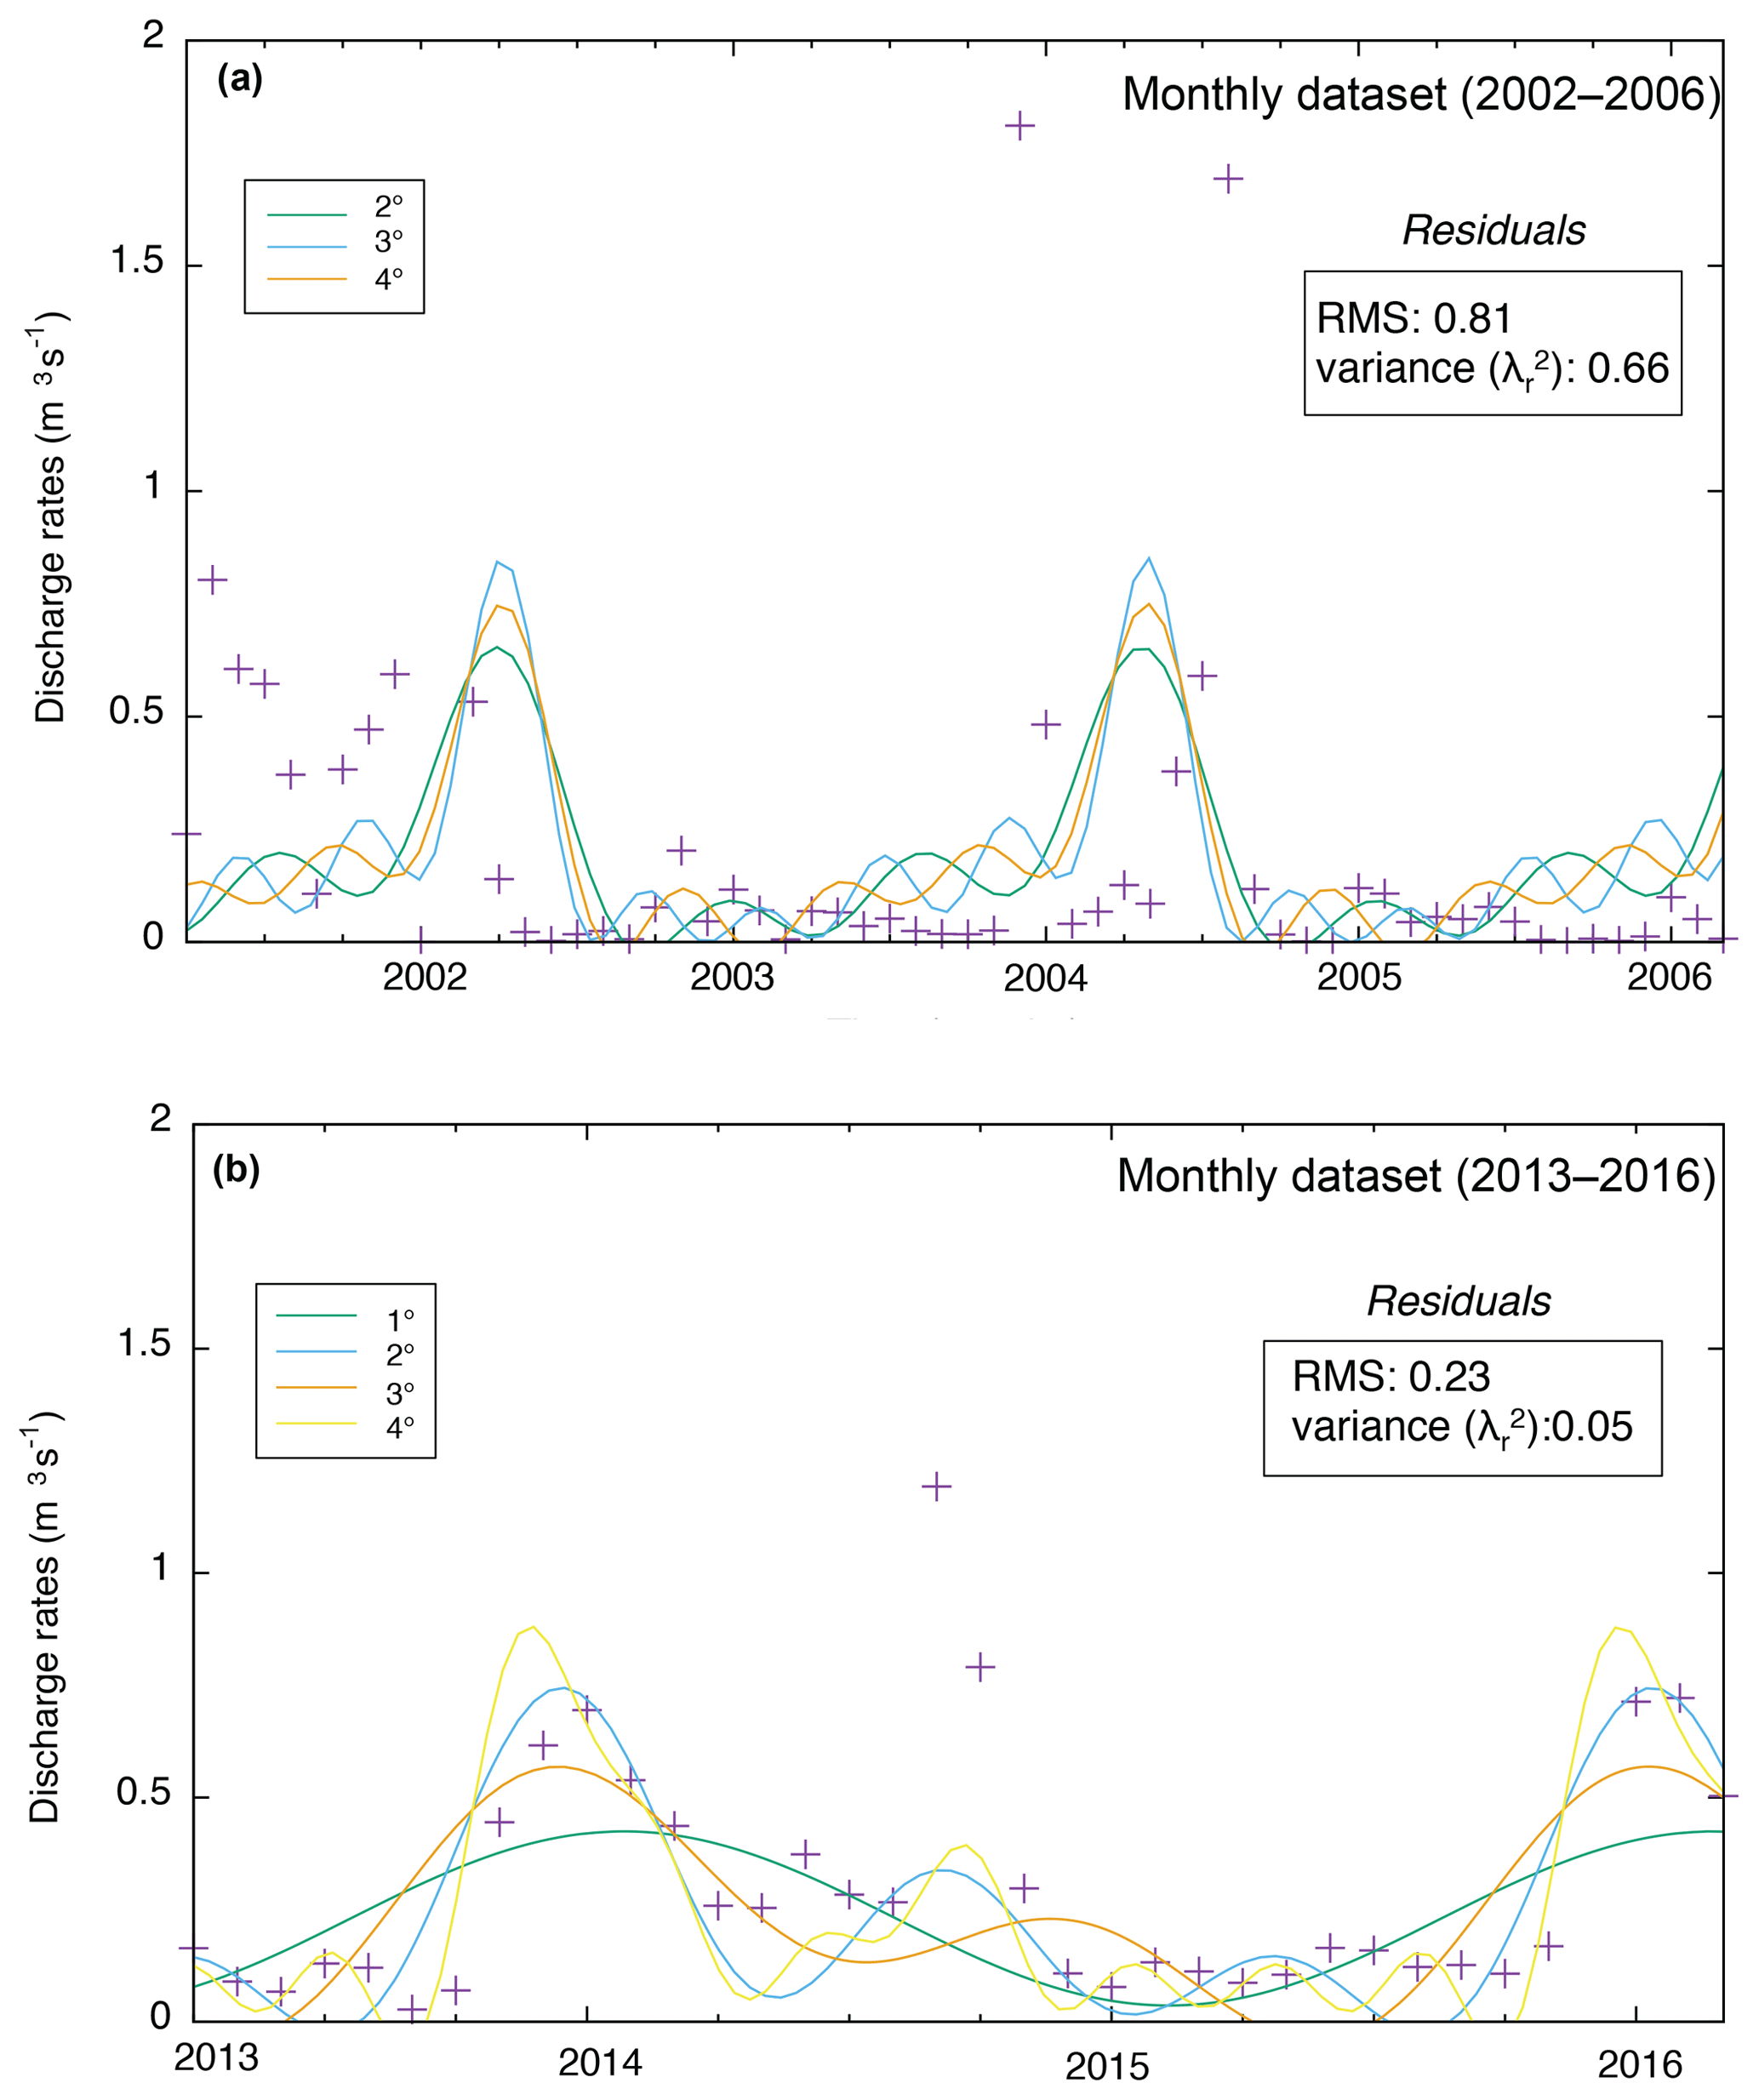
Figure A4Results of the Fourier analysis. (a) The 2002–2006 period shows two main periodic components, T0=24.70 and T1=6.17 months, corresponding to ca. 2 years and ca. 6 months, respectively. (b) The 2013–2016 period shows similar results: T0=24.94 and T1=6.23 months, corresponding to ca. 2.1 years and ca. 6 months, respectively.
SM and AC compiled the numerical simulations and formulated the adopted methodology. DC provided and processed the satellite thermal data. LC provided the volcanological data. SM and RS wrote the paper with the input of all coauthors. All authors worked on the interpretation of the results.
The authors declare that they have no conflict of interest.
Silvia Massaro thanks Centro de Geociencias of Querétaro (UNAM, Mexico) for the hospitality during the period of research at the Fuego de Colima volcano, the doctoral course in Geoscience at the University of Bari (Italy), and Francesco Loparco for help with the Python coding. All authors are grateful to the reviewers for their valuable comments and suggestions that were useful in improving the paper.
Lucia Capra was supported by PAPIIT-UNAM project (grant no. 105116).
This paper was edited by Andrea Di Muro and reviewed by Oleg Melnik and one anonymous referee.
Aràmbula-Mendoza, R., Lesage, P., Valdez-Gonzales, C., Varley, N., Reyes-Davila, G., and Navarro-Ochoa, C.: Seismic activity that accompagnied the effusive and explosive eruptions during the 2004–2005 period at Volcan de Colima, Mexico, J. Volcanol. Geoth. Res., 205, 30–46, 2011. a
Aràmbula-Mendoza, R., Reyes-Davila, G., Dulce, M., Gonzalez-Amezcua, M., Navarro-Ochoa, C., Martinez-Fierros, A., and Ramirez-Vazquez, A.: Seismic monitoring of effusive-explosive activity and large lava dome collapses during 2013–2015 at Volcan de Colima, Mexico., J. Volcanol. Geoth. Res., 77–88, 2018. a, b, c
Barmin, A., Melnik, O., and Sparks, R.: Periodic behavior in lava dome eruptions, Earth Planet. Sc. Lett., 199, 173–184, 2002. a, b, c, d
Belousov, A., Voight, B., Belousova, M., and Petukhin, A.: Pyroclastic surges and flows from the 8-10 May 1997 explosive eruption of Bezymianny volcano, Kamchatka, Russia, B. Volcanol., 64, 455–471, 2002. a
Bernstein, M., Pavez, A., Varley, N., Whelley, P., and Calder, E.: Rhyolite lava dome growth styles at Chaitén Volcano, Chile (2008–2009):Interpretation of thermal imagery, Andean Geology, 40, 295–309, 2013. a
Bonasia, R., Capra, L., Costa, A., Macedonio, G., and Saucedo, R.: Tephra fallout hazard assessment for a Plinian eruption scenario at Volcán de Colima (Mexico), J. Volcanol., 203, 12–22, 2011. a, b
Brèton-Gonzalez, M., Ramirez, J., and Navarro-Ochoa, C.: Summary of the historical eruptive activity of Volcan de Colima, Mexico 1519–2000, J. Volcanol., 117, 21–46, 2002. a, b, c
Capra, L., Borselli, L., Varley, N., Gavilanes-Ruiz, J., Norini, G., Sarocchi, D., and Cortes, A.: Rainfall-triggered lahars at Volcán de Colima, Mexico: surface hydro-repellency as initiation process, J. Volcanol., 189, 105–117, 2010. a
Capra, L., Macías, J., Cortés, A., Dávila, N., Saucedo, R., Osorio-Ocampo, S., Arce, J., Galvilanes-Ruiz, J., Corona-Càvez, P., Gàrcia-Sancez, L., Sosa-Ceballos, G., and Vasquez, R.: Preliminary report on the July 10–11, 2015 eruption at Volcán de Colima: Pyroclastic density currents with exceptional runouts and volume, J. Volcanol., 310, 39–49, 2016. a
Cazelles, B., Chavez, M., Berteaux, D., Ménard, F., Vik, J., Jenouvrier, S., and Stenseth, N.: Wavelet analysis of ecological time series, Oecologia, 156, 287–304, 2008. a, b, c
Christopher, T., Blundy, J., Cashman, K., Cole, P., Edmonds, M., Smith, P., and Stinton, A.: Crustal-scale degassing due to magma system destabilization and magma-gas decoupling at Soufrière Hills Volcano, Montserrat, Geochem. Geophys. Geosyst., 16, 2797–2811, 2015. a
Clavijero, F.: Historia Antigua de Mexico, Sepan Cuantos, 29, Porrua, 1780, 1780. a
Coppola, D., Piscopo, D., Staudacher, T., and Cigolini, C.: Lava discharge rate and effusive pattern at Piton de la Fournaise from MODIS data, J. Volcanol. Geoth. Res., 184, 174–192, 2009. a, b, c
Coppola, D., Laiolo, M., Piscopo, D., and Cigolini, C.: Rheological control on the radiant density of active lava flows and domes, J. Volcanol. Geoth. Res., 249, 39–48, 2013. a, b, c, d, e
Coppola, D., Laiolo, M., Cigolini, C., Delle Donne, D., and Ripepe, M.: Enhanced volcanic hot-spot detection using MODIS IR data: results from the MIROVA system, Geol. Soc. Lond. Spec. Public., 426, 181–205, 2016. a, b
Cortés, A., Garduño-Monroy, V., Navarro-Ochoa, C., Komorowski, J., Saucedo, R., Macías, J., and Gavilanes, J.: Carta geológica del Complejo Volcánico de Colima, con Geología del Complejo Volcánico de Colima, Univer. Nat. Autón. México, Cartas Geológicas y Mineras, 10, 2005. a
Costa, A. and Macedonio, G.: Nonlinear phenomena in fluids with temperature-dependent viscosity: a hysteresis model for magma flow in conduits, Geophys. Res. Lett., 29, 40-1–40-4, 2002. a
Costa, A. and Macedonio, G.: Viscous heating in fluids with temperature-dependent viscosity: Triggering of secondary flows, J. Fluid Mech., 540, 21–38, 2005. a
Costa, A., Melnik, O., and Sparks, R.: Controls of conduit geometry and wallrock elasticity on lava dome eruptions, Earth Planet. Sc. Lett., 260, 137–151, 2007a. a, b, c, d, e, f, g, h, i, j, k, l, m
Costa, A., Melnik, O., Sparks, R., and Voight, B.: Control of magma flow in dykes on cyclic lava dome extrusion, Geophys. Res. Lett., 34, L02303, https://doi.org/10.1029/2006GL027466, 2007b. a, b, c, d, e
Costa, A., Melnik, O., and Vedeneeva, E.: Thermal effects during magma ascent in conduits, J. Geophys. Res., 112, B12205, https://doi.org/10.1029/2007JB004985, 2007c. a
Costa, A., Wadge, G., and Melnik, O.: Cyclic extrusion of a lava dome based on a stick-slip mechanism, Earth Planet. Sc. Lett., 337, 39–46, 2012. a, b, c, d, e
Costa, A., Wadge, G., Stewart, R., and Odbert, H.: Coupled subdaily and multiweek cycles during the lava dome eruption of Soufrière Hills Volcano, Montserrat, J. Geophys. Res.-Sol. Ea., 118, 1895–1903, 2013. a, b, c, d, e
Daubechies: Ten Lectures on Wavelets, Society for Industrial and Applied Mathematics, Philadelphia, Pennsylvania, 357, 1992. a
De Bèliaz, E., Lavigne, J., Gaillard, D., Grancher, I., Pratomo, and Komorowski, J.: The 2007 eruption of Kelut volcano (East Java, Indonesia): phenomenology, crisis management and social response, Geomorphology, 136, 165–175, 2012. a
De la Cruz-Reyna, S.: Random patterns of activity of Colima Volcano, Mexico, J. Volcanol. Geoth. Res., 55, 51–68, 1993. a, b
Denlinger, R. and Hoblitt, R.: Cyclic eruptive behavior of silicic volcanoes, Geology, 27, 459–462, 1999. a, b
Dragoni, M. and Tallarico, A.: Assumption in the evaluation of lava effusion rates from heat radiation, Geophys. Res. Lett., 36, L08302, https://doi.org/10.1029/2009GL037411, 2009. a
Farge, M.: Wavelet transforms and their applications to turbulence, Annu. Rev. Fluid Mech., 24, 395–457, 1992. a, b
Farquharson, J., Heap, M., Varley, N., Baud, P., and Reuschlé, T.: Permeability and porosity relationships of edifice-forming andesites: a combined field and laboratory study, J. Volcanol. Geoth. Res., 297, 52–68, 2015. a
Fougere, P.: On the accuracy of spectrum analysis of red noise processes using maximum entropy and periodogram models: simulation studies and application to geophysical data, J. Geophys. Res., 90, 4355–4366, 1985. a
Garel, F., Kaminski, E., Tait, S., and Limare, A.: An experimental study of the surface thermal signature of hot subaerial isoviscous gravity currents: implications for thermal monitoring of lava flows and domes, J. Volcanol. Geoth. Res., 117, B02205, https://doi.org/10.1029/2011JB008698, 2012. a
Gavilanes-Ruiz, J., Cuevas-Muñiz, A., Varley, N., Gwynne, G., Stevenson, J., Saucedo-Girón, R., and Cortés-Cortés, A.: Exploring the factors that influence the perception of risk: The case of Volcán de Colima, Mexico, J. Volcanol. Geoth. Res., 186, 238–252, 2009. a, b
GVP: Report on Colima (Mexico), edited by: Wunderman, R., B. Global Volcanism Net., Smithsonian Institution, Washington, 23, 1998. a
GVP: Report on Colima (Mexico), edited by: Wunderman, R., B. Global Volcanism Net., Smithsonian Institution, Washington, 25, 2000. a
GVP: Report on Colima (Mexico), edited by: Wundermann, R., B. Global Volcanism Net., Smithsonian Institution, Washington, 27, 2002. a, b
GVP: Report on Colima (Mexico), edited by: Wunderman, R., B. Global Volcanism Net., Smithsonian Institution, Washington, 28, 2003. a
GVP: Report on Colima (Mexico), edited by: Wunderman, R., B. Global Volcanism Net., Smithsonian Institution, Washington, 38, 2013. a
GVP: Report on Colima (Mexico), edited by: Sennert, S. K., Weekly Volcanic Activity Report, 26 July–1 August 2017, Smithsonian Institution and US Geological Survey, Washington, 2017. a, b, c, d, e
Harris, A. and Rowland, S.: Effusion rate controls on lava flow length and the role of heat loss: a review, edited by: Thordarson, T., Self, S., Larsen, G., Rowland, S. K., and Hoskuldsson, A., Studies in Volcanology: The Legacy of George Walker: Special Publication IAVCEI, Geol. Soc. Lond., 2, 33–51, 2009. a
Harris, A., Rose, W., and Flynn, L.: Temporal trends in lava dome extrusion at Santiaguito 1922–2000, B. Volcanol., 65, 77–89, 2003. a, b
Harris, A., Favalli, M., Steffke, A., Fornaciai, A., and Boschi, E.: A relation between lava discharge rate, thermal insulation, and flow area set using lidar data, Geophys. Res. Lett., 37, L20308, https://doi.org/10.1029/2010GL044683, 2010. a, b
Heap, M., Lavallée, Y., Petrakova, L., Baud, P., Reuschle, T., Varley, N., and Dingwell, D. B.: Microstructural controls on the physical and mechanical properties of edifice-forming andesites at Volcán de Colima, Mexico, J. Geophys. Res.-Sol. Ea., 119, 2925–2963, 2014. a
Hutchison, W., Varley, N., Pyle, D., Mather, T., and Stevenson, J.: Airborne thermal remote sensing of the Volcán de Colima (Mexico) lava dome from 2007 to 2010, Geol. Soc. London, Spec. Public., 380, 203–228, 2013. a, b, c
James, M. and Varley, N.: Identification of structural controls in an active lava dome with high resolution DEMs: Volcán de Colima, Mexico, Geophys. Res. Lett., 39, L22303, https://doi.org/10.1029/2012GL054245, 2012. a
Kavanagh, J. and Sparks, R.: Insights of dyke emplacement mechanics from detailed 3D dyke thickness datasets, J. Geol. Soc., 168, 965–978, 2011. a
Kozono, T. and Koyaguchi, T.: Effects of relative motion between gas and liquid on 1-dimensional steady flow in silicic volcanic conduits: Origin of diversity of eruption styles, J. Volcanol. Geoth. Res, 180, 37–49, 2009. a, b
Kozono, T. and Koyaguchi, T.: Effects of gas escape and crystallization on the complexity of conduit flow dynamics during lava dome eruptions, Geophys. Res. Lett.-Sol. Ea., 117, B08204, https://doi.org/10.1029/2012JB009343, 2012. a, b, c
Lamb, O., Varley, N., Mather, T., Pyle, D., Smith, P., and Liu, E.: Multiple timescales of cyclical behaviour observed at two dome-forming eruptions, J. Volcanol. Geoth. Res., 284, 106–121, 2014. a
Lau, K. and Weng, H.: Climatic signal detection using wavelet transform: how to make a time series sing, B. Am. Meteorol. Soc., 76, 2391–2402, 1995. a
Lavallee, Y., Varley, N., Alatorre-Ibarguengoitia, M., Hess, K., Kueppers, U., Mueller, S., Richard, D., Scheu, B., Spieler, O., and Dingwell, D.: Magmatic architecture of dome-building eruptions at Volcan de Colima (Mexico), B. Volcanol., 74, 249–260, 2012. a, b, c, d, e
Lensky, N., Navon, O., and Lyakhovsky, V.: Bubble growth during decompression of magma: experimental and theoretical investigation, J. Volcanol. Geoth. Res., 129, 7–22, 2004. a, b
Loughlin, S., Luckett, R., Ryan, G., Christopher, T.and Hards, V., De Angelis, S., and Strutt, M.: An overview of lava dome evolution, dome collapse and cyclicity at Soufrière Hills Volcano, Montserrat, 2005–2007, Geophys. Res. Lett., 37, L00E16, https://doi.org/10.1029/2010GL042547, 2010. a
Luhr, J.: Petrology and geochemistry of the 1991 and 1998–1999 lava flows from Volcan Colima, Mexico, J. Volcanol. Geoth. Res., 117, 169–194, 2002. a, b, c, d
Luhr, J. and Carmichael, I.: The Colima Volcanic Complex, Mexico, Con. to Mineral. Petrol., 71, 343–372, 1980. a
Macìas, J., Arce, J., Sosa, G., Gardner, J., and Saucedo, R.: Storage conditions and magma processes triggering the 1818CE Plinian eruption of Volcán de Colima, J. Volcanol. Geoth. Res., 340, 117–129, https://doi.org/10.1016/j.jvolgeores.2017.02.025, 2017. a
Mallat, S.: A wavelet tour of signal processing, Academic Press, San Diego, 1998. a
Martin del Pozzo, A., Sheridan, M., Barrera, D., Lugo Hubp, J., and Vázquez Selem, L.: Potential hazards from Colima volcano, Mexico, Geofisica Int., 34, 363–376, 1995. a
Massaro, S., Costa, A., and Sulpizio, R.: Time evolution of a magma feeding system during a Plinian eruption: the example of the Pomici di Avellino eruption of Somma-Vesuvius (Italy), Earth Planet. Sc. Lett. 482, 545–555, 2018a. a
Massaro, S., Sulpizio, R., Costa, A., Capra, L., and Lucchi, F.: Understanding eruptive style variations at calc-alkaline volcanoes: the 1913 eruption of Fuego de Colima volcano (Mexico), B. Volcanol., 80, 80–62, https://doi.org/10.1007/s00445-018-1235-z, 2018b. a, b, c, d
Medina-Martinez, F.: Analysis of the eruptive history of the Volcán de Colima, Mexico (1560–1980), Geofisica Int., 22, 157–178, 1983. a
Melnik, O. and Costa, A.: Dual-chamber-conduit models of non-linear dynamics behaviour at Soufrière Hills Volcano, Montserrat, Geol. Soc. Lond., Mem., 39, 61–69, 2014. a, b, c, d, e, f, g, h, i, j, k, l, m, n, o, p, q, r, s
Melnik, O. and Sparks, R.: Non linear dynamics of lava dome extrusion, Nature, 402, 37–41, 1999. a, b, c, d
Melnik, O. and Sparks, R.: Controls on conduit magma flow dynamics during lava-dome building eruptions, J. Geophys. Res., 110, B02209, https://doi.org/10.1029/2004JB003183, 2005. a, b, c, d, e, f
Melnik, O., Sparks, R., Costa, A., and Barmin, A.: Volcanic Eruptions: Cyclicity during Lava Dome Growth, Meyers: Encyclopedia of Complexity and Systems Science, Springer, 9763–9784, 2009. a, b, c, d, e, f, g, h, i, j, k
Mora, J., Macìas, J., Saucedo, R., Orlando, A., Manetti, P., and Vaselli, O.: Petrology of the 1998–2000 products of Volcán de Colima, México, J. Volcanol. Geoth. Res., 117, 195–212, 2002. a
Mueller, S. B., Varley, N. R., Kueppers, U., Lesage, P., Reyes Davila, G. Á., and Dingwell, D. B.: Quantification of magma ascent rate through rockfall monitoring at the growing/collapsing lava dome of Volcán de Colima, Mexico, Solid Earth, 4, 201–213, https://doi.org/10.5194/se-4-201-2013, 2013. a, b, c, d, e, f
Nakada, S., Shimizu, H., and Ohta, K.: Overview of the 1990–1995 eruption at Unzen Volcano, J. Volcanol. Geoth. Res., 89, 1–22, 1999. a
Nakanishi, M. and Koyaguchi, T.: A stability analysis of a conduit flow model for lava dome eruptions, J. Volcanol. Geoth. Res., 178, 46–57, 2008. a, b, c
Navarro-Ochoa, C., Gavilanes-Ruiz, A., and Cortès-Cortès, A.: Movement and emplacement of lava flows at Volcán de Colima, México: November 1998–February 1999, J. Volcanol. Geoth. Res., 117, 155–167, 2002. a, b, c, d, e
Nicholson, R., Gardner, J., and Neal, C.: Variations in eruption style during the 1931 A.D. eruption of Aniakchak volcano, Alaska, J. Volcanol. Geoth. Res., 207, 69–82, 2011. a
Norini, G., Capra, L., Groppelli, G., Agliardi, F., Pola, A., and Cortès, A.: Structural architecture of the Colima Volcanic Complex, J. Geophys. Res., 115, B12209, https://doi.org/10.1029/2010JB007649, 2010. a, b
Odbert, H. and Wadge, G.: Time series analysis of lava flux, J. Volcanol. Geoth. Res., 188, 305–314, 2009. a, b, c, d
Ozerov, A., Ispolatov, I., and Lees, J.: Modeling strombolian eruptions of Karymsky volcano, Kamchatka, Russia, J. Volcanol. Geoth. Res., 122, 265–280, 2003. a
Ramsey, M. and Harris, A.: Volcanology 2020: how will thermal remote sensing of volcanic surface activity evolve over the next decade?, J. Volcanol. Geoth. Res., 249, 217–233, https://doi.org/10.1016/j.jvolgeores.2012.05.011, 2013. a
Reubi, O. and Blundy, J.: Assimilation of Plutonic roots, formation of high-K exotic melt inclusions and genesis of andesitic magmas at Volcán De Colima, Mexico, J. Petrol., 49, 2221–2243, 2008. a
Reubi, O., Blundy, J., and Varley, N.: Volatiles contents, degassing and crystallisation of intermediate magmas at Volcán de Colima, Mexico, inferred from melt inclusions, Contr. Mineral. Petrol., 165, 1087–1106, 2013. a, b, c, d, e
Reubi, O., Sims, K., Varley, N., Reagan, M., and Eikenberg, J.: Timescales of degassing and conduit dynamics inferred from 210Pb–226Ra disequilibria in Vòlcan de Colima 1998–2010 andesitic magmas, Geol. Soc., London, Sp. Publ., 422, SP422-5, 2015. a, b, c, d, e
Reyes-Dávila, G., Arámbula-Mendoza, R., Espinasa-Pereña, P., Pankhurst, M., Navarro-Ochoa, C., Savov, I., and Domínguez-Reyes, T.: Volcán de Colima dome collapse of July, 2015 and associated pyroclastic density current, J. Volcanol. Geoth. Res., 320, 100–106, 2016. a, b, c, d, e
Roverato, M., Capra, L., Sulpizio, R., and Norini, G.: Stratigraphic reconstruction of two debris avalanche deposits at Colima Volcano (Mexico): insights into pre-failure conditions and climate influence, J. Volcanol. Geoth. Res., 207, 33–46, 2011. a
Saucedo, R., Macìas, J., Sheridan, M., Bursik, M., and Komorowski, J.: Modeling of pyroclastic flows of Colima Volcano, Mexico: implications for hazard assessment, J. Volcanol. Geoth. Res., 139, 103–115, 2005. a, b, c
Saucedo, R., Macías, J., Gavilanes, J., Arce, J., Komorowski, J., Gardner, J., and Valdez-Moreno, G.: Eyewitness, stratigraphy, chemistry, and eruptive dynamics of the 1913 Plinian eruption of Volcán de Colima, México, J. Volcanol. Geoth. Res., 191, 149–166, 2010. a
Savov, I., Luhr, J., and Navarro-Ochoa, C.: Petrology and geochemistry of lava and ash erupted from Volcan Colima, Mexico, during 1998–2005, J. Volcanol. Geoth. Res., 174, 241–256, 2008. a, b, c
Siswowidjoyo, S., Suryo, I., and Yokoyama, I.: Magma eruption rates of Merapi volcano, Central Java, Indonesia during one century (1890–1992), B. Volcanol., 57, 111–116, 1995. a
Sparks, R.: Causes and consequences of pressurisation in lava dome eruptions, Earth Planet. Sc. Lett., 150, 177–189, 1997. a
Sparks, R. and Young, S.: The eruption of Soufrière Hills volcano, Montserrat (1995–1999): Overview of scientific results, in The Eruption of the Soufrière Hills Volcano, Montserrat from 1995 to 1999, Geol. Soc. London Mem., 21, 45– 69, 2002. a
Spica, Z., Perton, M., and Legrand, D.: Anatomy of the Colima volcano magmatic system, Mexico, Earth Planet. Sc. Lett., 459, 1–13, 2017. a, b
Sulpizio, R., Capra, L., Sarocchi, D., Saucedo, R., Gavilanes-Ruiz, J., and Varley, N.: Predicting the block-and-ash flow inundation areas at Volcán de Colima (Colima, Mexico) based on the present day (February 2010) status., J. Volcanol. Geoth. Res., 193, 49–66, 2010. a
Swanson, D. and Holcomb, R.: Regularities in growth of the Mount St. Helens dacite dome, 1980–1986, in: Lava Flows and Domes: Emplacement Mechanisms and Hazard Implications, Springer, Berlin, Heidelberg, 3–24, 1990. a
Thiele, S., Varley, N., and James, M.: Thermal photogrammetric imaging: A new technique for monitoring dome eruptions, J. Volcanol. Geoth. Res., 337, 140–145, 2017. a, b, c, d
Torrence, C. and Compo, G.: A practical guide to wavelet analysis, B. American Meteorol. Soc., 79, 61–78, 1998. a, b, c, d, e, f, g
Trauth, M.: MATLAB Recipes for Earth Sciences, 1st ed. Springer-Verlag, Berlin Heidelberg, 2006. a
Varley, N.: La evolución de la actividad reciente del Volcán de Colima, Webseminar, Unión Geofísica Mexicana A.C., 2015. a, b, c
Varley, N., Arámbula-Mendoza, R., Reyes-Dávila, G., Stevenson, J., and Harwood, R.: Long-period seismicity during magma movement at Volcán de Colima, B. Volcanol., 72, 1093–1107, 2010a. a, b, c, d
Varley, N., Aràmbula-Mendoza, R., Reyes-Reyes-Dàvila, G., Sanderson, R., and Stevenson, J.: Generation of Vulcanian activity and long-period seismicity at Volcan de Colima, Mexico, J. Volcanol. Geoth. Res., 198, 45–56, 2010b. a
Vila, J., Macià, R., Kumar, D., Ortiz, R., Moreno, H., and Correig, A.: Analysis of the unrest of active volcanoes using variations of the base level noise seismic spectrum, J. Volcanol. Geoth. Res., 153, 11–20, 2006. a
Voight, B., Hoblitt, R., Clarke, A., Lockhart, A., Miller, L., Lynch, and McMahon, J.: Remarkable cyclic ground deformation monitored in real-time on Montserrat, and its use in eruption forecasting, Geophys. Res. Lett., 25, 3405–3408, 1998. a
Voight, B., Sparks, R., Miller, A., Stewart, R., Hoblitt, R., Clarke, A., and Cole, P.: Magma flow instability and cyclic activity at Soufriere Hills volcano, Montserrat, British west indies, Science, 283, 1138–1142, 1999. a
Voight, B., Constantine, E., Siswowidjoyo, S., and Torley, R.: Historical eruptions of Merapi volcano, central Java, Indonesia, 1768–1998, J. Volcanol. Geoth. Res., 100, 69–138, 2000. a
Wadge, G., Dorta, D., and Cole, P.: The magma budget of Volcán Arenal, Costa Rica from 1980 to 2004, J. Volcanol. Geoth. Res., 157, 60–74, 2006. a
Wadge, G., Herd, R., Ryan, G., Calder, E., and Komorowski, J.: Lava production at Soufrière Hills Volcano, Montserrat: 1995–2009, Geophys. Res. Lett., 37, L00E03, https://doi.org/10.1029/2009GL041466, 2010. a
Watts, R. B., Herd, R. A., Sparks, R. S. J., and Young, S. R.: Growth patterns and emplacement of the andesitic lava dome at Soufriere Hills Volcano, Montserrat, Geol. Soc. Lond. Mem. 21, 115–152, 2002. a
Weng, H. and Lau, K. M.: Wavelets, period doubling, and time-frequency localization with application to organization of convection over the tropical western Pacific, J. Atmos. Sci., 1035, 2523–2541, 1994. a
Wolpert, R., Ogburn, L., and Calder, E.: The longevity of lava dome eruptions, Geophys. Res. Lett.-Sol. Ea., 121, 676–686, 2016. a
Wylie, J., Voight, B., and Whitehead, J.: Instability of magma flow from volatile dependent viscosity, Science, 285, 1883–1885, 1999. a, b
Zobin, V., Orozco-Rojas, J., Reyes-Dávila, G., and Navarro-Ochoa, C.: Seismicity of an andesitic volcano during block-lava effusion: Volcán de Colima, México, November 1998–January 1999, B. Volcanol., 67, 679–688, 2005. a, b, c, d, e
Zobin, V., Varley, N., González, M., Orozco, J., Reyes, G., Navarro-Ochoa, C., and Bretón, M.: Monitoring the 2004 andesitic block-lava extrusion at Volcán de Colima, México from seismic activity and SO2 emission, J. Volcanol. Geoth. Res., 177, 367–377, 2008. a
Zobin, V., Arámbula, R., Bretón, M., Reyes, G., Plascencia, I., Navarro-Ochoa, C., and Martínez, A.: Dynamics of the January 2013–June 2014 explosive-effusive episode in the eruption of Volcán de Colima, México: insights from seismic and video monitoring, B. Volcanol., 77, 31, https://doi.org/10.1007/s00445-015-0917-z, 2015. a, b, c, d, e
- Abstract
- Introduction
- The historical activity of the Fuego de Colima volcano
- Methods
- Input and target data for numerical simulations
- Results
- Discussion
- Conclusions
- Code availability
- Data availability
- Appendix A
- Author contributions
- Competing interests
- Acknowledgements
- Financial support
- Review statement
- References