the Creative Commons Attribution 4.0 License.
the Creative Commons Attribution 4.0 License.
 | 30 Aug 2019
Sinkholes and uvalas in evaporite karst: spatio-temporal development with links to base-level fall on the eastern shore of the Dead Sea
Robert A. Watson
Djamil Al-Halbouni
Leila Saberi
Ali Sawarieh
Damien Closson
Hussam Alrshdan
Najib Abou Karaki
Christian Siebert
Thomas R. Walter
Torsten Dahm
Enclosed topographic depressions are characteristic of karst landscapes on Earth. The developmental relationship between depression types, such as sinkholes (dolines) and uvalas, has been the subject of debate, mainly because the long developmental timescales in classical limestone karst settings impede direct observation. Here we characterize the morphometric properties and spatio-temporal development of ∼1150 sinkholes and five uvalas formed from ∼1980 to 2017 in an evaporite karst setting along the eastern coast of the hypersaline Dead Sea (at Ghor Al-Haditha, Jordan). The development of sinkhole populations and individual uvalas is intertwined in terms of onset, evolution and cessation. The sinkholes commonly develop in clusters, within which they may coalesce to form compound or nested sinkholes. In general, however, the uvalas are not defined by coalescence of sinkholes. Although each uvala usually encloses several clusters of sinkholes, it develops as a larger-scale, gentler and structurally distinct depression. The location of new sinkholes and uvalas shows a marked shoreline-parallel migration with time, followed by a marked shoreline-perpendicular (i.e. seaward) growth with time. These observations are consistent with theoretical predictions of karstification controlled by a laterally migrating interface between saturated and undersaturated groundwater, as induced by the 35 m fall in the Dead Sea water level since 1967. More generally, our observations indicate that uvalas and the sinkhole populations within them, although morphometrically distinct, can develop near-synchronously by subsidence in response to subsurface erosion.
- Article
(14406 KB) - Full-text XML
-
Supplement
(419 KB) - BibTeX
- EndNote


Sinkholes and uvalas are types of enclosed topographic depressions and they are characteristic of karst regions on Earth. In such regions, which make up ∼15 % of the Earth's dry land surface (BGR et al., 2017; Chen et al., 2017), the bedrock or surficial material is composed of carbonate, sulfate or halide minerals that are prone to dissolution by water. In limestone karst areas, sinkholes (also termed dolines) and uvalas are distinct with regard to scale, morphometry and their inter-relationship (Ćalić, 2011). Uvalas typically occur on a larger scale than sinkholes; uvala diameters in limestone karst are typically 1000–5000 m (Ćalić, 2011), whereas sinkhole diameters in limestone karst are sub-kilometre in size and typically in the range of 10–200 m (Bondesan et al., 1992). Morphometrically, uvalas commonly have gentler slopes than dolines and they have more complex shapes, both in plan view and in three-dimensions (Ćalić, 2011). A single uvala typically includes numerous sinkholes within it.
Historically, there has been considerable debate over the process(es) of uvala formation and over the genetic relationship between uvalas and sinkholes. In limestone karst areas, where uvalas have been first and most extensively described, various mechanisms have been proposed for uvala formation, such as areally distributed surface dissolution, subsurface corrosion and mass-wasting, and coalescence of sinkholes (see Ćalić, 2011, for discussion). Cvijić (1901, 1960) proposed a direct genetic relationship, whereby sinkholes evolve by coalescence into uvalas and ultimately into a third type of enclosed karstic depression, a polje, which occurs on still-larger scales of several square kilometres to several hundred km2 in area (Kranjc, 2013). Poljes typically have steeper sides than uvalas, are elongated in plan view and have characteristically wide and flat bottoms. Many authors since have considered Cvijić's concept of a cyclical karst evolution between the three depression forms to be problematic (Lowe and Waltham, 1995; Ćalić, 2011; Sauro, 2012). Nonetheless, the concept of uvalas developing by coalescence of sinkholes is widespread: the term “uvala” has traditionally been regarded as synonymous with “compound sinkhole”, “nested sinkhole” and “valley sink” (cf. Lowe and Waltham, 1995; Monroe, 1970; Sweeting, 1973).
A significant problem for unravelling relationships between uvalas and sinkholes (dolines) in limestone karst areas is that the landform evolution is controlled by the relatively slow dissolution kinetics of carbonate minerals. Consequently, the development of these landform types is not directly observable in such areas. Furthermore, the slow rate of karstic processes means that limestone areas are susceptible also to long-term geomorphic influences from changing climate and active tectonics. Indeed, the areas in which such uvalas and dolines have been best documented occur in tectonically complex settings in which climate has varied considerably over time, such that many landforms have been modified not only by karst processes but also by fluvial and/or glacial processes (Ćalić, 2011, and references therein). Uvala-like depressions have also been noted in areas of evaporite karst, such as at the margins of the hypersaline Dead Sea (Al-Halbouni et al., 2017; Avni et al., 2016; Baer et al., 2002; Closson, 2005; Frumkin, 2013), the Ebro Valley of northeastern Spain (Gutiérrez et al., 2005), in the central uplands of Turkey (Dogan, 2005; Doğan and Özel, 2005; Waltham, 2015) and within the Arabian Platform of central and eastern Saudi Arabia (Gutiérrez and Cooper, 2013; Youssef et al., 2015). The evaporitic minerals of such karst settings have much faster dissolution kinetics but uvala-like depressions there have not been studied as extensively as their equivalents in limestone karst.
The rapid development of sinkholes and uvala-like depressions in evaporite karst over the last 35 years at the Dead Sea provides a unique opportunity to shed new light on the geometric and genetic relationships between them. The sinkholes have been the focus of most previous works, with over 6500 mapped on the western shore as of 2017 (Abelson et al., 2017; Arkin and Gilat, 2000; Avni et al., 2016; Taqieddin et al., 2000; Yechieli et al., 2006). Together with the uvala-like depressions, they represent a substantial geohazard in the Dead Sea region and they have already destroyed or damaged several tourism facilities, factories, evaporation pond dykes, highways, link roads, houses and farmland.
In this paper, we provide a first detailed documentation of the spatio-temporal evolution of both sinkholes and uvala-like depressions on the eastern shore of the Dead Sea, at Ghor Al-Haditha in Jordan. Our aims are to discern the spatio-temporal inter-relationship of these two types of karstic depressions and to examine how their development relates to the regional base-level fall caused by the decline of the Dead Sea. Our approach combines remote sensing data spanning the 50-year duration of base-level fall from 1967 to 2017 with close-range photogrammetric surveys and field observations made during 2014–2017. This approach develops from that presented by Kottmeier et al. (2016) and Al-Halbouni et al. (2017) but involves new datasets that are much more extensive in both space and time. By providing a detailed overview of the evolution of surface subsidence features in the Ghor Al-Haditha area, our study also complements recent geophysical surveys (Polom et al., 2018) and numerical modelling (Al-Halbouni et al., 2018, 2019) of subsurface characteristics and processes there. Our results yield the most detailed insights to date into the spatio-temporal development of sinkholes and uvala-like depressions in an evaporite karst setting and they provide the clearest yet illustration of the consequences of base-level fall on that development.
The Dead Sea is the hypersaline terminal lake of the Jordan River (Fig. 1a) and it lies within the Dead Sea basin. This ∼150 km long and ∼8–15 km wide basin lies at a left step (or bend) along the left-lateral Dead Sea Transform fault system (Garfunkel and Ben-Avraham, 1996). Maximum tectonic subsidence is ∼8.5 km around the Lisan Peninsula, adjacent to our study area (Ten Brink and Flores, 2012). The basin has subsided rapidly from the late Pliocene to the present (Ten Brink and Flores, 2012), and during this time has hosted several palaeo-lakes of varying size and longevity (Bartov et al., 2002; Torfstein et al., 2009). With respect to modern global mean sea level (m.s.l.), a high-stand of −162 m m.s.l. was reached at around 25 ka, during the “Lisan Lake” episode. The modern Dead Sea initiated after a major low-stand at around 10 ka (Bartov et al., 2002). Since the late 1960s, the Dead Sea water level has undergone a largely anthropogenically forced decline at a gradually increasing rate (Lensky et al., 2005) from −395 to −433 m m.s.l. (1967–2018). As its level has declined, the modern lake has divided into northern and southern parts; the latter is now occupied entirely by industrial salt evaporation ponds. The base-level fell at a rate of 0.5 m yr−1 in the 1970s and at a rate of 1.1 m yr−1 in the last decade. In absolute terms, the lake level has declined by 39 m as of 2018 and is forecast to drop a further 25–70 m by 2100 (Asmar and Ergenzinger, 2002; Yechieli and Gavrieli, 1998).
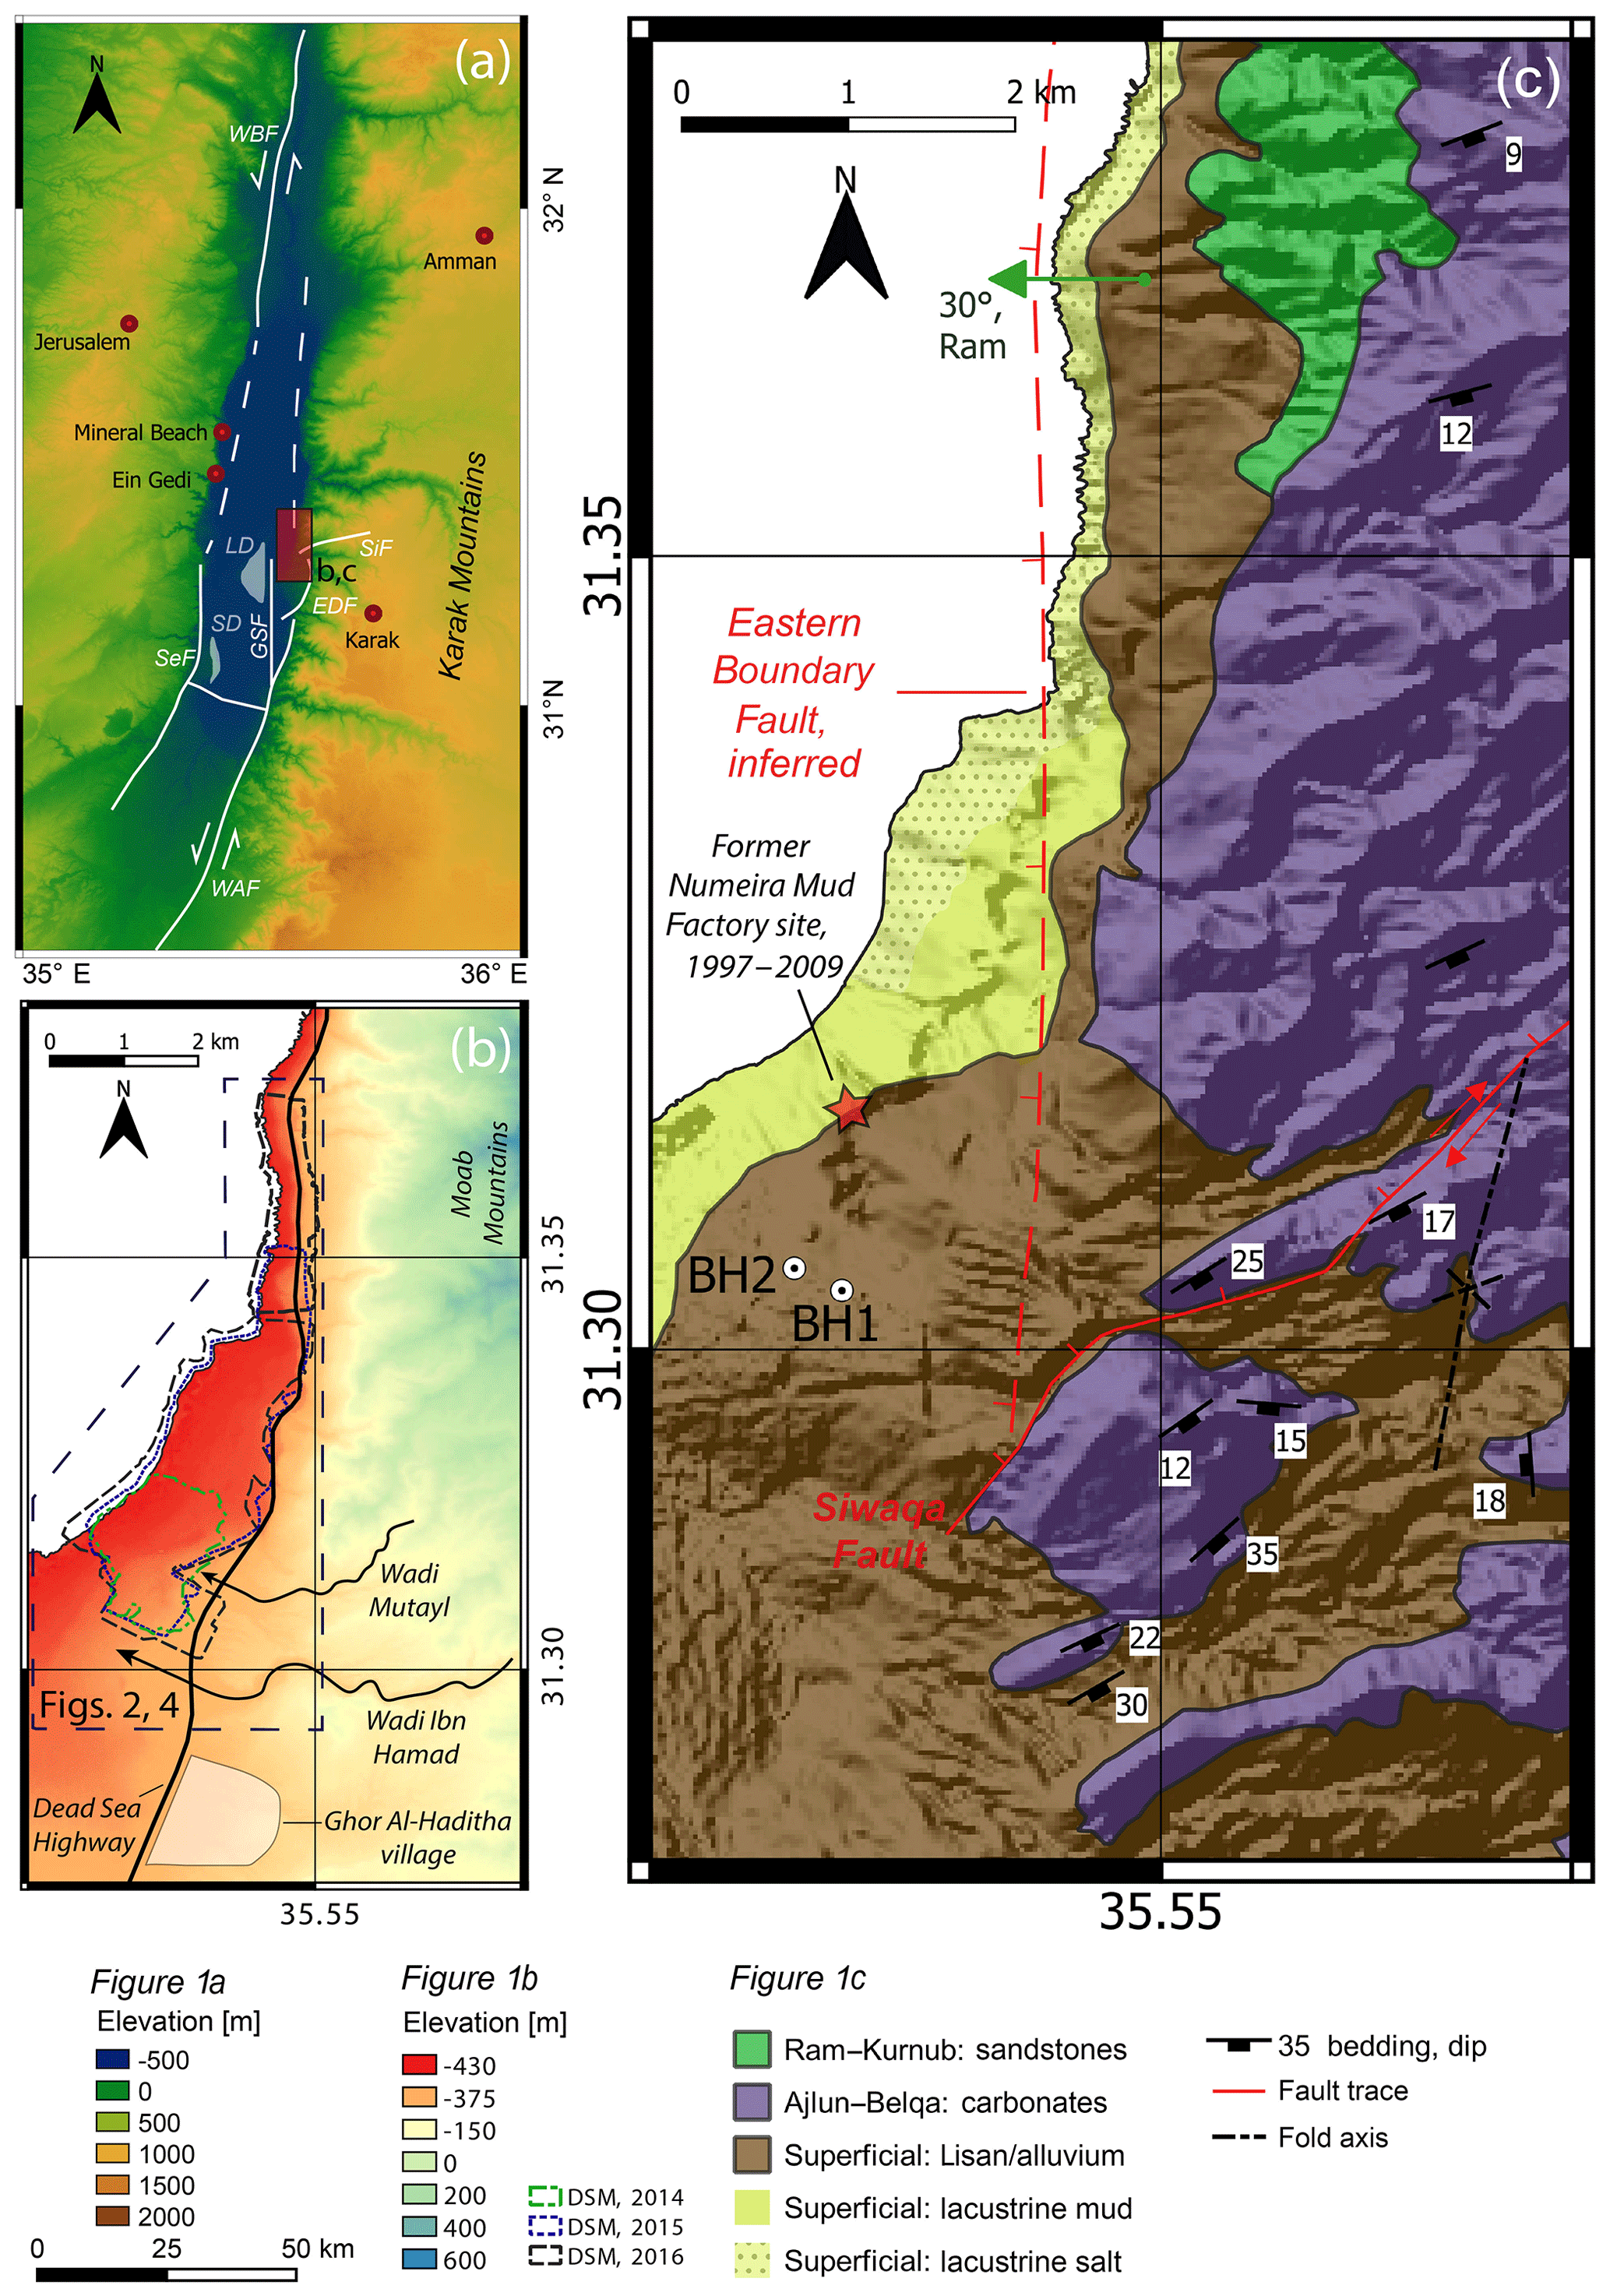
Figure 1Overview of the Ghor Al-Haditha study area. (a) Advanced Land Observing Satellite (ALOS) 30 m digital surface model (DSM) of the Dead Sea study area, showing the regional tectonic regime. WBF: Western Boundary Fault; SiF: Siwaqa Fault; LD: Lisan Diapir; EDF: Ed Dhira Flexure; GSF: Ghor Safi Fault; SD: Sedom Diapir; SeF: Sedom Fault; WAF: Wadi Araba Fault. (b) ALOS 30 m DSM showing relief in the study area, as highlighted in red in (a), along with the footprints of the 2014, 2015 and 2016 drone and field surveys. The flow paths of the Wadi Mutayl and Wadi Ibn Hamad are shown, along with the positions of the regional Dead Sea Highway and the village of Ghor Al-Haditha. (c) Simplified geological map of the study area, partly based on 1:50 000 scale mapping of Jordanian Ministry of Energy and Mineral Resources (Khalil, 1992) and partly on our own work. The stratigraphy generally dips acutely to the southeast, while striking to the northeast. Also shown is the right-lateral oblique Siwaqa fault, the inferred position of the Eastern Boundary Fault (downthrowing to the east), and the axis of the Haditha syncline. A 30∘ bend in the Ram deposits in the north of the study area is also marked on the map; this bend and the 0∘ N-trending scarp visible on the map and in (b) are the main features indicating the presence of the Eastern Boundary Fault. The two boreholes of El-Isa et al. (1995) are labelled “BH1” and “BH2”. The red and black star indicates the position of the Numeira Mud Factory, which is now defunct after being destroyed by sinkhole formation at the site.
The Dead Sea water level represents the regional hydrological base level. Its decline since the late 1960s (Lensky et al., 2005) has been linked with sinkhole formation, which began in the 1980s (Arkin and Gilat, 2000; Frumkin and Raz, 2001; Taqieddin et al., 2000). Theoretically, the fall in base level causes a seaward shift of the “fresh–saline interface” developed between the dense hypersaline Dead Sea brine and overlying less-dense and less-saline (i.e. relatively fresh) groundwater (Salameh and El-Naser, 2000; Yechieli, 2000; Yechieli et al., 2009). This shift enables groundwater undersaturated with respect to halite and other evaporitic minerals to infiltrate evaporite deposits in the subsurface, thus triggering karstification and surface subsidence. The location of karstification and sinkhole formation is controlled by the intersection of the fresh–saline interface with the shoreward edge of evaporite deposits in the subsurface (cf. Ezersky et al., 2013). A prediction of this theory is that new sinkhole development should also migrate seaward with time but evidence for this migration on the well-studied western Dead Sea shore is somewhat patchy (Abelson et al., 2017; Avni et al., 2016) and it has been regarded by some authors as unconvincing (Charrach, 2018). Preferential flow of relatively fresh groundwater into evaporite-rich deposits along conductive regional tectonic faults has been proposed as an alternative control on the location of sinkhole (and uvala) development (Abelson et al., 2003; Charrach, 2018; Closson, 2005; Shalev et al., 2006).
The Ghor Al-Haditha study area, which is about 25 km2 in size, is situated on the southeast shore of the northern part of the Dead Sea (Fig. 1a). The area lies in a zone of tectonic complexity at the eastern basin margin, where subsidence is relayed between several major tectonic structures. From south to north, these are the 24∘ N-trending Wadi Araba fault, the 0∘ N-trending Ghor Safi fault, the Ed-Dhira monoclinal flexure and the 80∘ N-trending Siwaqa fault. Further north again, and marking the northeast boundary of the study area, is a prominent 0∘ N-trending escarpment (Fig. 1b). This probably reflects the orientation of another major basin-bounding fault (Khalil, 1992), here termed the Eastern Boundary Fault (Fig. 1c; cf. Meqbel et al., 2013), although the exact location of the fault trace is unclear.
Three major wadi (dry river valley) systems, Wadi Ibn Hamad, Wadi Mutayl and Wadi al Mazra'a, drain the uplands to the east and southeast of Ghor Al-Haditha. These wadi systems have formed an alluvial fan plain (“Ghor”) at elevations between −360 and −380 m in the south of the study area (Fig. 1b). Smaller alluvial fans and wadis occur sporadically along the coastline in the central and northern parts of the study area. West and north of the alluvial plain, exposure of the former lakebed by the ongoing recession of the Dead Sea has formed extensive lacustrine deposits. These lacustrine flats have differing compositions at the surface: some comprise mainly of muds and silts (mud-flat) and others have an elevated evaporite composition (salt-flat). The mapped extents of these end-members on the surface at Ghor Al-Haditha are shown in Fig. 1c, with field impressions of each deposit shown in Fig. S1 of the Supplement. Several springs rise locally at the transition between the alluvial and lacustrine deposits, or within the area of the former lakebed. These feed surface streams that drain into the Dead Sea via channels cut into the former lakebed. Other surface channels on the former lakebed derive sporadic flow from the various wadi systems during flood events.
The geology of the Ghor Al-Haditha study area (Fig. 1c) comprises folded and faulted sequences of siliciclastic or carbonate rocks, which are locally overlain by semi-consolidated to unconsolidated lacustrine or alluvial deposits (Khalil, 1992). Hydrogeologically, there are three principal aquifer units: (1) a lower sandstone aquifer comprising the Ram group and Kurnub formation of Cambrian to Early Cretaceous ages, respectively; (2) an upper carbonate aquifer spanning the Ajlun and Belqa groups of Late Cretaceous to early Tertiary age; and (3) a superficial aquifer in the Lisan formation of Plio-Pleistocene age (Khalil, 1992) and the eastern shore equivalent of the Holocene deposits found on the western shore, termed the Ze'elim formation.
In detail, the superficial materials assigned to the Lisan and Ze'elim formations comprise both alluvial and lacustrine deposits. Comparable deposits have been widely reported in studies of numerous boreholes along the western shore of the Dead Sea (Yechieli et al., 1993, 2002). At Ghor Al-Haditha, the stratigraphic succession and ages are weakly constrained because of a limited depth of exposure, a paucity of boreholes and a lack of radiometric dating. On the basis of 1–12 m deep exposures in sinkhole walls and 45–48 m deep boreholes (BH1 and BH2 in Fig. 1c), the alluvium consists of poorly sorted semi-consolidated to unconsolidated sands and gravels, which are interbedded with minor silts and clays (El-Isa et al., 1995; Polom et al., 2018; Sawarieh et al., 2000; Taqieddin et al., 2000). Similar stratigraphically younger, but unconsolidated, alluvial deposits are probably equivalent to the Ze'elim formation (Abou-Karaki et al., 2016). Lacustrine deposits now exposed in channels up to 6 m deep into the former Dead Sea bed at Ghor Al-Haditha (Al-Halbouni et al., 2017) probably also belong to the Ze'elim formation. These lacustrine deposits comprise alternating light–dark laminated-to-thinly-bedded layers dominated by aragonite and calcite with localized beds of gypsum and clay. The mineral contents of these layers are variable, being primarily carbonates (e.g. aragonite and calcite, 30 %–40 %) and clay minerals; predominantly kaolinite, smectite and illite (20 %–30 %); and quartz (20 %–40 %), with smaller percentage contents of evaporites (predominantly halite), hydrated organic material and silt (Khlaifat et al., 2010; Khoury, 2002; Salameh et al., 2019; Sneh, 1979; Yechieli et al., 1993). Interbedded in a spatially variable proportion with these marly layers are distributed lenses or layers of evaporites, such as halite and gypsum, up to 1 m in thickness in channel exposures (Al-Halbouni et al., 2017). Borehole data from the western shore of the Dead Sea show that such evaporite layers can be up to 26 m thick (Yechieli et al., 2006). For further descriptions of the deposits of the Lisan and Ze'elim formations, please refer to the Supplement. Similar lacustrine deposits, though not with very thick salt layers, likely extend in under the alluvial plain (Polom et al., 2018).
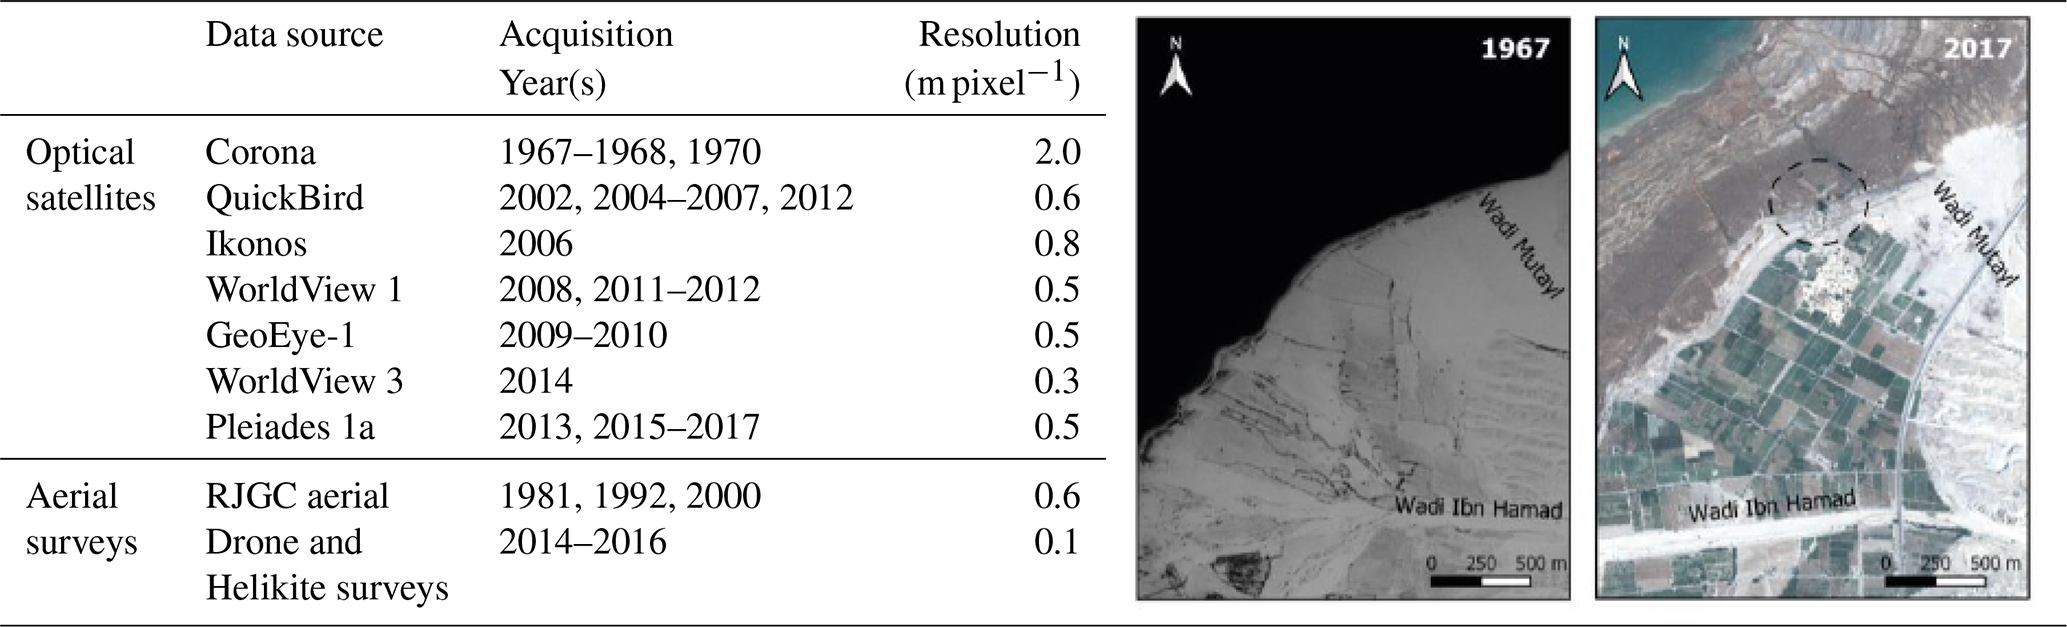
Our dataset includes high-resolution optical satellite imagery and aerial survey photographs covering the 50-year period from 1967 to 2017 (Table 1). We orthorectified and pan-sharpened the satellite imagery by using standard algorithms and workflows in the PCI Geomatica software package. For orthorectification of the 2002–2010, 2011–2013 and 2014–2015 satellite imagery, we used the Shuttle Radar Topography Mission (SRTM) digital elevation model (DEM), the Advanced Spaceborne Thermal Emission and Reflection Radiometer (ASTER) DEM, and the Advanced Land Observing Satellite (ALOS) World 3-D digital surface model (DSM), respectively. For the Pleiades images from 2016 and 2017, atmospheric correction, orthorectification and georeferencing were conducted by Airbus against the Astrium Elevation 30 global DEM. All pre-2016 images were georeferenced by using nine ground control points (GCPs) with accuracies of ±0.71 m, which were collected in 2015 using a Trimble XRTpro dual-frequency GPS receiver. Real-time differential corrections were performed using real-time kinematic (RTK) positioning. Additional co-registration of pre-2016 imagery was performed with respect to the 2017 Pleiades imagery by using tools from the GDAL/OGR library (GDAL/OGR Contributors, 2018) with numerous manually selected tie points. In the case of the 1967 image, the use of ESRI online World Imagery was also necessary for further co-registration due to the geographical limits of the 2017 Pleiades imagery. For all satellite imagery metadata and a full error analysis, please refer to the Supplement.
Table 1Sources and resolution of remote- and near-sensing data used in this study. RJGC is the Royal Jordanian Geographic Centre. The spatial resolution of the dataset varies from 1.8 to 0.1 m per pixel. The temporal resolution of the dataset is decadal from 1970 to 2010, and annual from 2004 to 2017. On the right are images of the southern part of the study area from 1967 and 2017 demonstrating the evolution of geomorphology and land use change in the study area. Dashed black ellipse marks the site of the former Numeira Mud Factory.
Close-range photogrammetric surveys undertaken in October 2014, October 2015 and December 2016 provide even higher resolution orthophoto mosaics and DSMs (for survey limits, see Fig. 1b). The surveyed areas were imaged from a Helikite or drone at a height of ∼100 m with a 16 megapixel (MP) Ricoh GR camera (2014), a 12 MP GoPro Hero4 camera with modified lens (2015) or with a 12 MP DJI Phantom 3 inbuilt camera (2016). During each survey, 50–60 temporary GCPs were measured with a Trimble ProXRT differential GPS receiver with RTK. Al-Halbouni et al. (2017) detail the procedure for generating these orthophoto mosaics and DSMs. The internal horizontal and vertical uncertainties in the DSMs are estimated as follows: 2014 (10, 11 cm), 2015 (12, 17 cm) and 2016 (37, 31 cm).
All data were integrated and analysed within a geographic information system (GIS) software package (Q-GIS). The number and extent of remotely sensed sinkholes represent minima, as local farmers have filled in sinkholes to mitigate disruption to their work. Therefore, we also include information from sources that undertook earlier field surveys in communication with local farmers (El-Isa et al., 1995; Sawarieh et al., 2000; Closson and Abou-Karaki, 2009). Depending on the dominant material surrounding each sinkhole at the surface, as visible from orthophotos and field observations (cf. Fig. 2, Al-Halbouni et al., 2018), we assigned sinkholes a material from three groups: alluvium, lacustrine “mud” and lacustrine “salt”. The classification of a sinkhole is in line with the extents of these deposits as presented in Fig. 1c. Whilst this assignment of materials may seem somewhat arbitrary since it is based only on observations of the surface and what can be seen in the interior of the sinkholes, it is helpful to contextualize the results in light of previous studies (Al-Halbouni et al., 2017, 2018; Filin et al., 2011). The classification is also based around the observed differences in morphology between examples of each end-member (Al-Halbouni et al., 2017; cf. Fig. 3, Al-Halbouni et al., 2018). In reality the material between a given subsurface cavity and the surface sinkhole is likely to be a mixed lithology of all those described here.
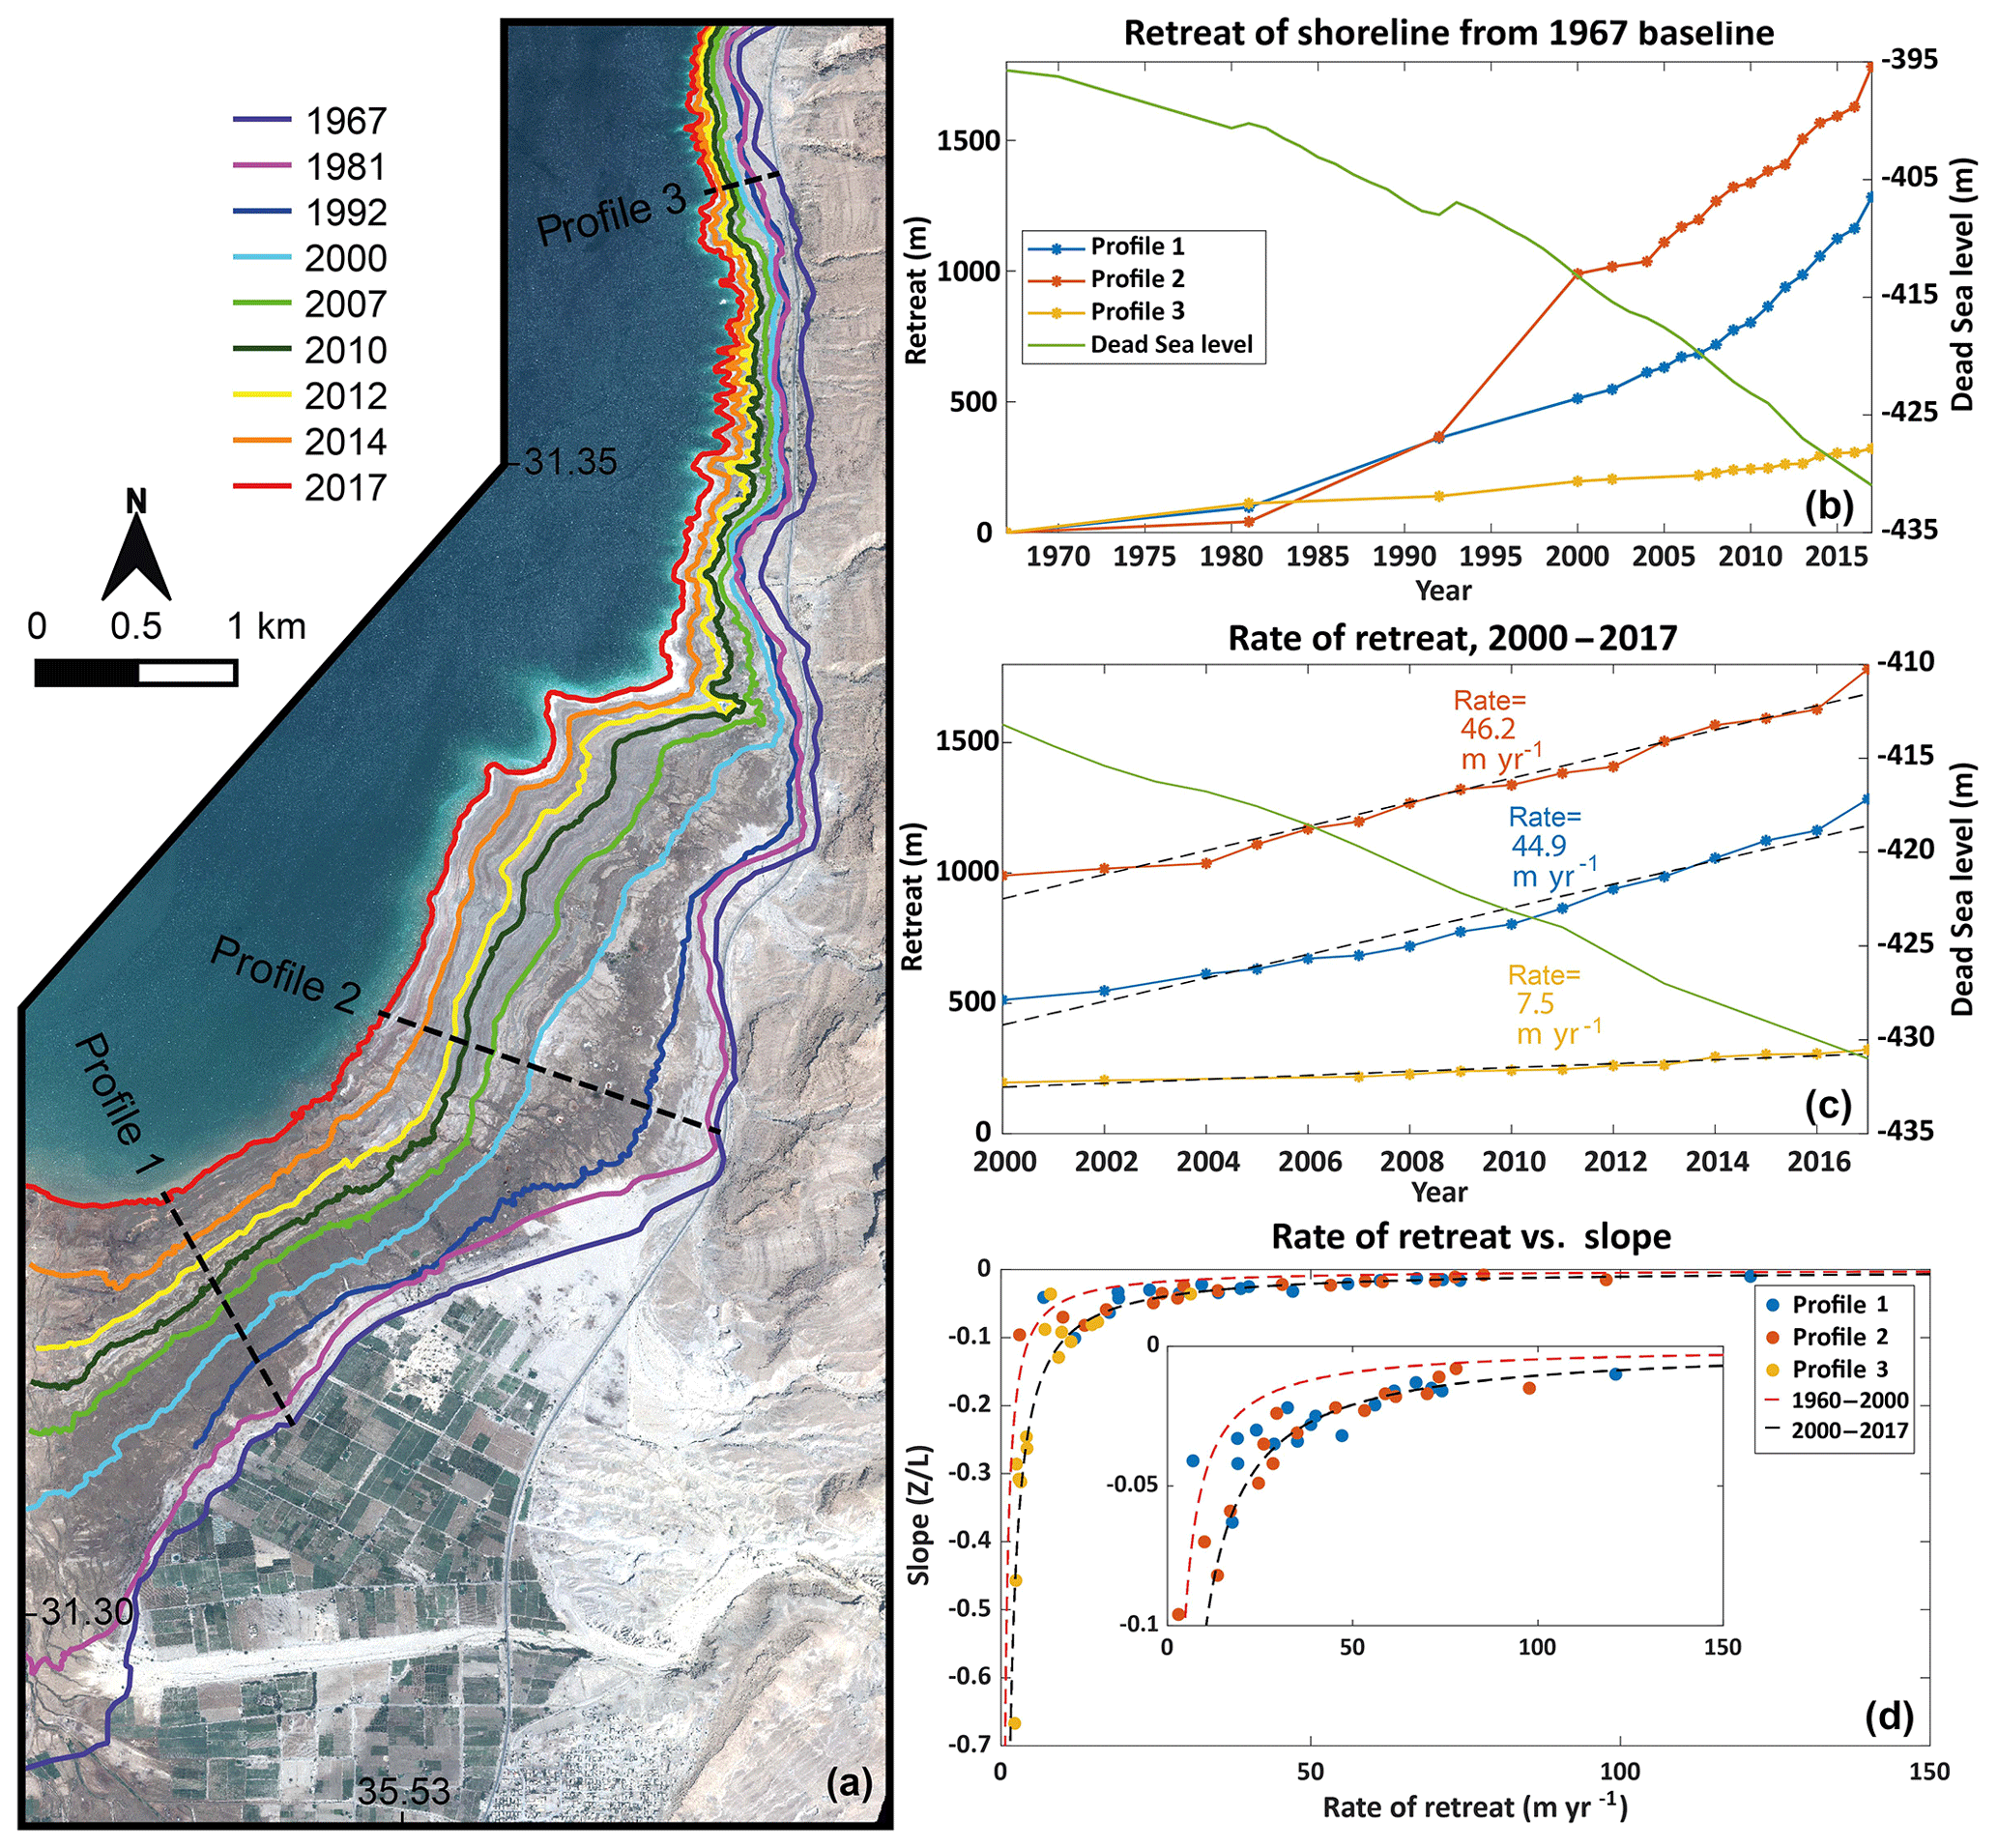
Figure 2Dead Sea level fall and shoreline retreat in the Ghor Al-Haditha area of Jordan from 1967 to 2017. (a) Map of shoreline retreat with time, produced from satellite and aerial imagery. Also shown here are plots of the Dead Sea level and of the shoreline position along profiles in the Ghor Al-Haditha area over the periods: (b) 1967–2017 and (c) 2000–2017. (d) Plot of rate of shoreline retreat against bathymetric slope for profiles 1–3. The inset shows a close-up of the data from profiles 1 and 2 for clarity.
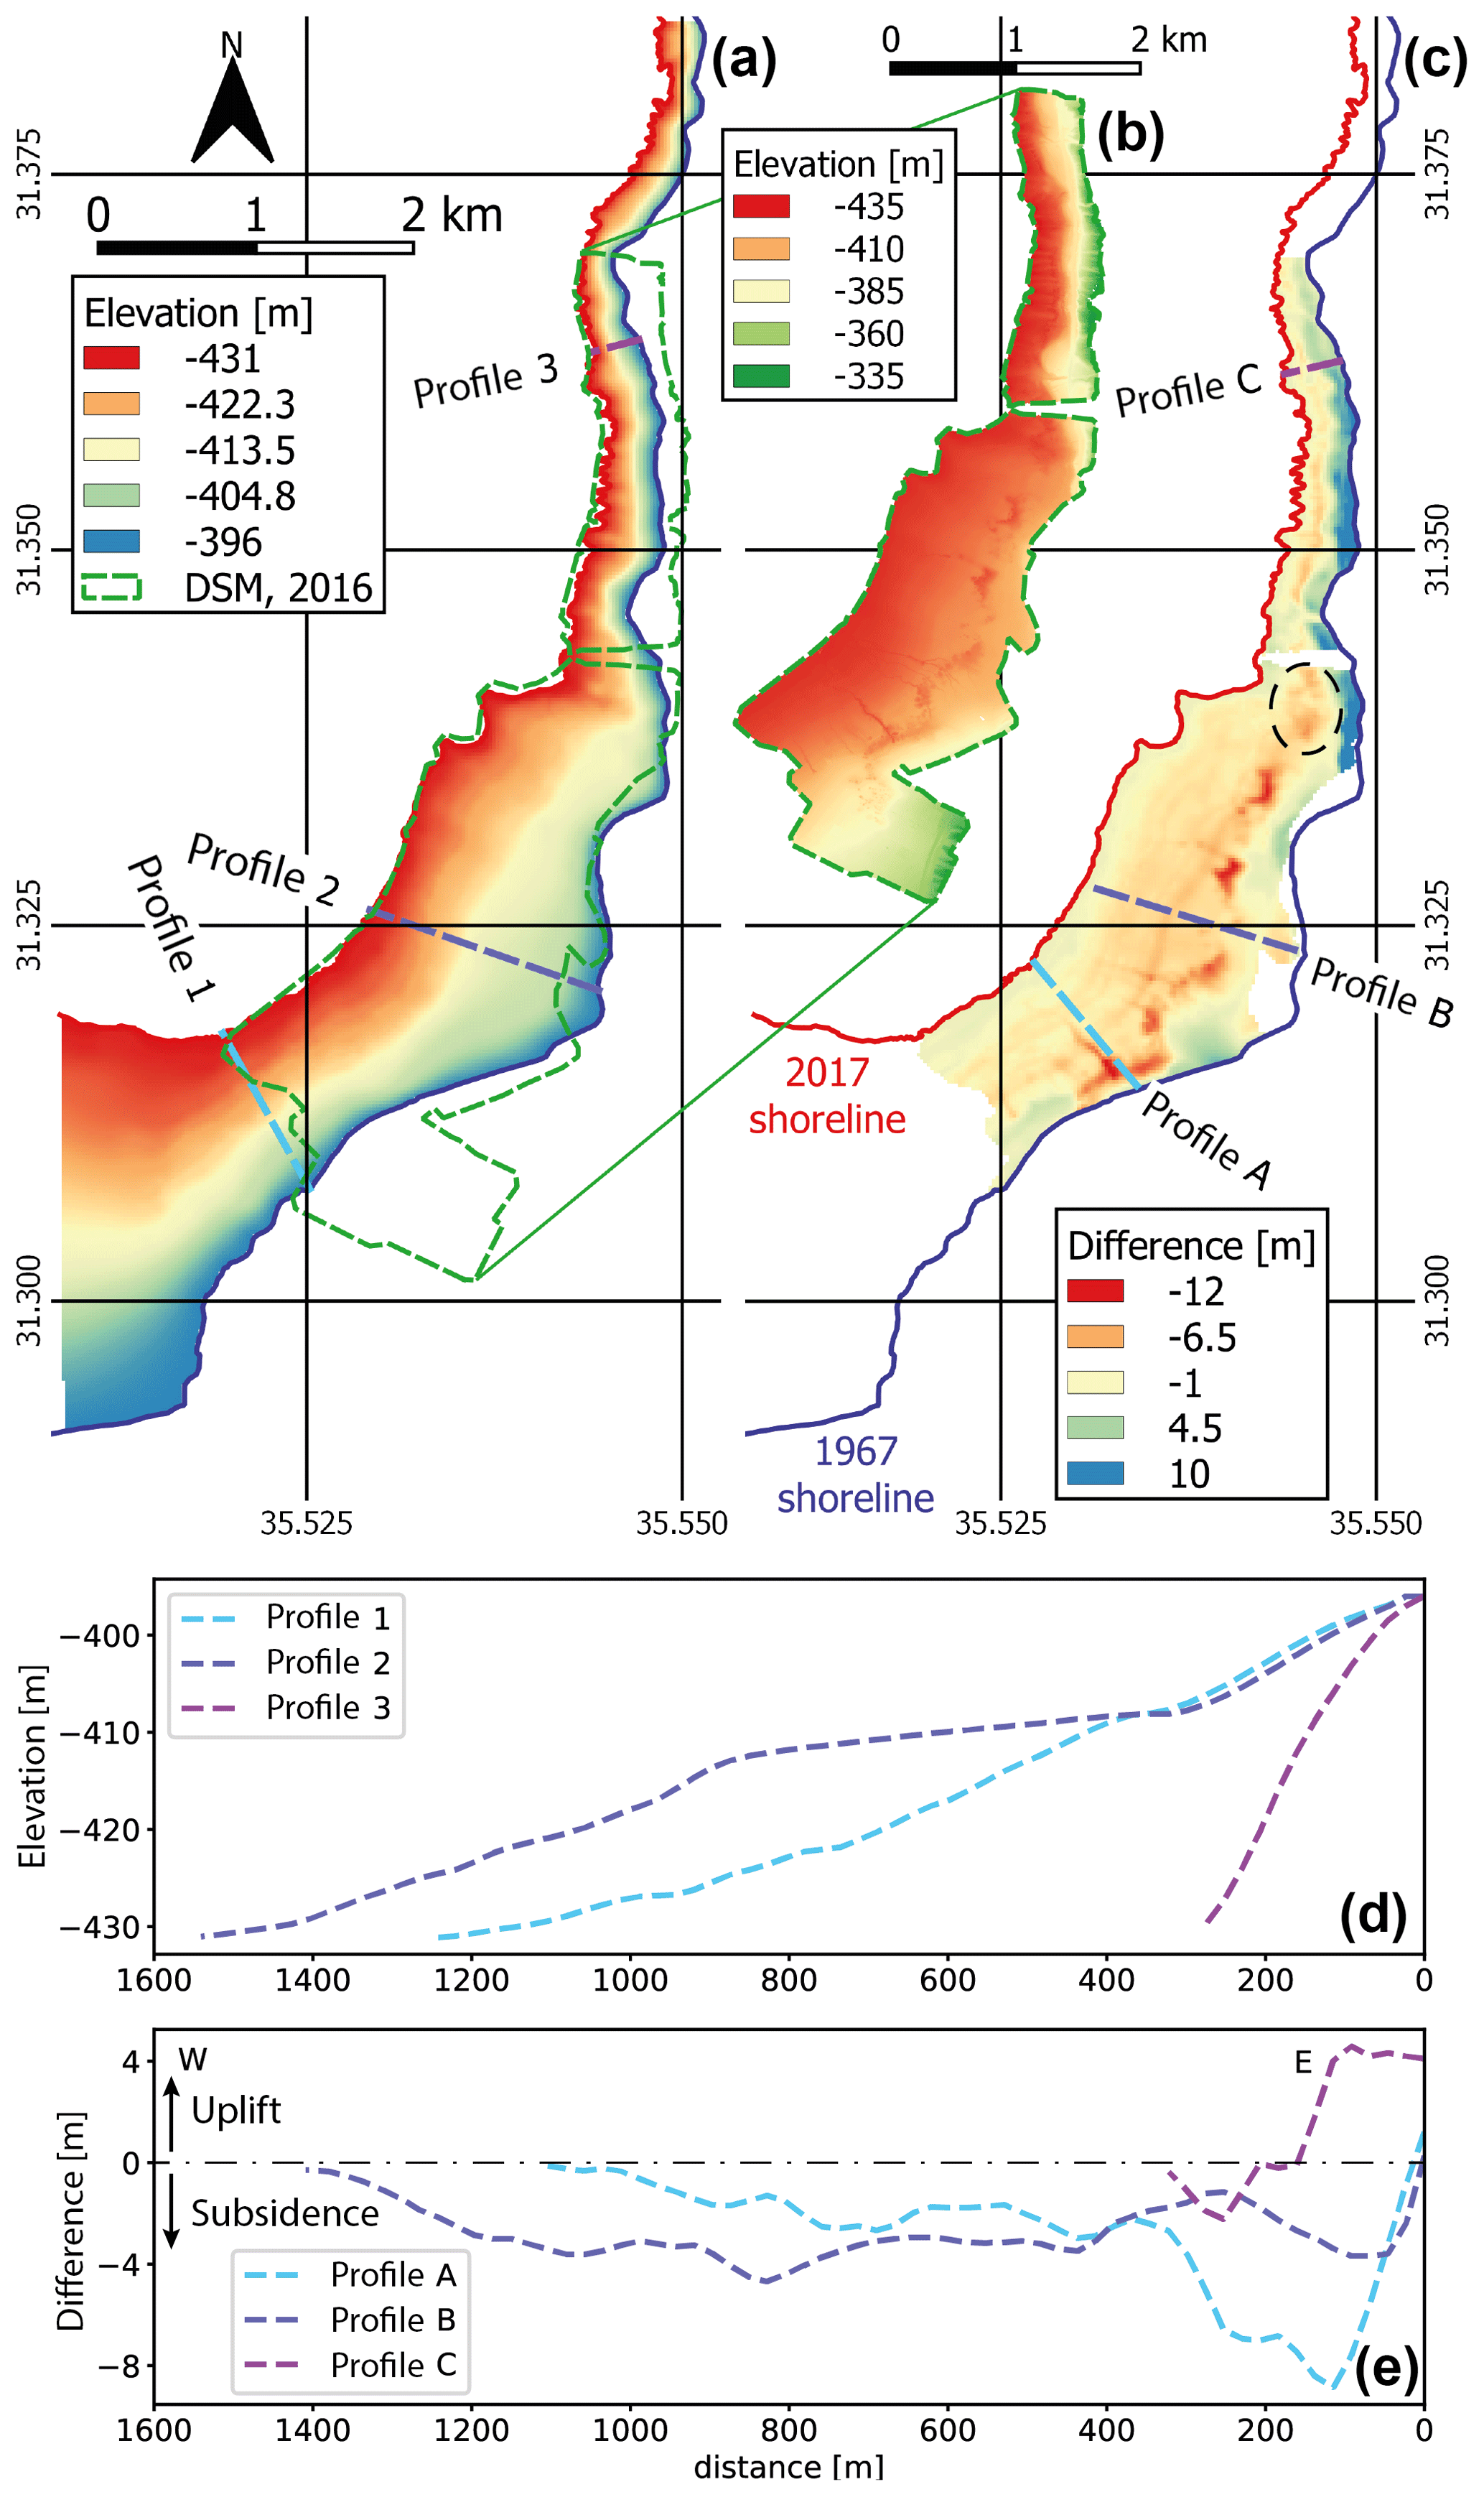
Figure 3(a) Bathymetric contour map of the relief of the former lakebed (top left), with a zoomed-in view (b) of the 2016 DSM relief and elevation profiles 1–3 (as in Fig. 3) plotted second from bottom. (c) Map of elevation difference between the former lakebed bathymetry and the 2016 topography. (d) Plot of elevation vs. distance along profiles 1–3 as labelled in (a). (e) Plot of elevation difference vs. distance along profiles A–C as labelled in (c). Areas of significant subsidence are identifiable by the large negative difference (see 0–300 m along profile A). There is subsidence of between 0 and 6 m on the kilometre scale in the southern part of the study area (profiles A and B), with subsidence of 0–3 m on a smaller scale in the northern part of the study area (profile C). The dashed black ellipse indicates a zone of developing uvala-like subsidence referred to in Sect. 4.4.
Using historical measurements of the Dead Sea level from the Israel Marine Data Center (ISRAMAR; Israel Oceanographic and Limnological Research – Israel Marine Data Center, 2017) and the Jordanian Ministry of Water and Irrigation (MWI; El-Isa et al., 1995), we reconstructed the former Dead Sea bathymetry in the study. The shoreline was digitized from each satellite or aerial image (Fig. 2) and the level of the Dead Sea for the year of image acquisition was assigned to it such that each shoreline represented a bathymetric contour. A linearly interpolated raster of bathymetric contours with a resolution of 23 m was then generated by using inverse distance weighting (Fig. 3). The 2016 DSM was then downsampled to the same resolution and the difference of the two relief models was calculated (bathymetric contours – 2016 DSM). For a table of the Dead Sea level data used please refer to the Supplement.
4.1 Base-level fall, shoreline retreat and bathymetry
The Dead Sea level drop has resulted in a dramatic retreat of the shoreline in the Ghor Al-Haditha area (Fig. 2a). As of 2017, the shoreline had retreated from its 1967 position by a minimum of 0.3 km in the north of the study area and by a maximum of 2.5 km in the south. The rate of retreat in the southern part of the study area accelerated from < 10 m yr−1 between 1967–1980 to an average rate of ∼45 m yr−1 between 2000 and 2017 (Fig. 2b, c). In the north of the area, the rate of retreat has been steadier at about 7–8 m yr−1. The pre-recession bathymetry was steepest in the northern part of the study area (Fig. 3a), reflecting its proximity to the escarpment of the Eastern Boundary Fault of the Dead Sea basin (Fig. 1a, c). The southern part of the area had a gentler bathymetry (Fig. 2), possibly reflecting the extensive Plio-Pleistocene and Holocene fan deposition at the terminations of several major wadis (Fig. 1b, c).
The rate of shoreline retreat is correlated non-linearly with the former bathymetric slope (Fig. 2d). Following the Bruun rule of coastal erosion, a theoretical relationship between slope and the rate of shoreline retreat assuming a constant rate of base-level drop (Bruun, 1988) is as follows:
where RDS is the rate of retreat of the Dead Sea shoreline, ZDS is the average rate of Dead Sea level drop for the time period being analysed and α is the slope of the former Dead Sea bed. The data are well explained by the theoretical retreat rate vs. slope curves calculated for cases of base-level fall rates of 0.5 m yr−1 (1960–2000) and 1.1 m yr−1 (2000–2017). Therefore, the shoreline retreat rates are partly influenced by the gradually accelerating rate of base-level fall but they are mainly related to the relief of the former bathymetry.
4.2 Widespread subsidence of the former lakebed
Comparison of the reconstructed lake bathymetry (Fig. 3a) with the 2016 DSM (Fig. 3b) reveals several substantial elevation changes since lake recession (Fig. 3c). The negative differences in elevation reveal a pattern of subsidence of 0–6 m across the former lakebed in the southern part of the study area over distances on the kilometre scale (Fig. 3e). This wide-scale subsidence consistently diminishes seaward to the position of the 2017 shoreline, where elevation difference tends to zero across the study area. More localized subsidence due to development of uvala-like depressions can be seen across the central part of the study area (for details, see Sect. 4.4). Subsidence of 0–3 m occurs also in the areas of exposed lakebed in the north of the study area, although these are on a smaller spatial scale in accordance with the smaller shoreline retreat there.
Positive elevation changes occur near the 1967 shoreline in the southern and northern parts of the study area. Those in the south coincide with the active alluvial fan at the mouth of the Wadi Mutayl, as well as with areas of vegetation growth (trees and bushes) and/or anthropogenic activity (e.g. earthworks at the former Numeira Mud Factory site). Large positive elevation differences in the north coincide with the main north–south highway, which was constructed in the early 1990s.
4.3 Sinkhole development and morphology
Overall, we estimate that at least ∼1150 sinkholes have formed at Ghor Al-Haditha between 1985 and 2017. Sinkhole formation began in the southern part of the study area (Fig. 4). Initiation of new sinkhole development subsequently shifted north-northeastward, roughly parallel to the coastline. In detail, the sinkholes have initiated in clusters with gaps between earlier clusters filled or reduced as new sinkholes and new sinkhole clusters form. The most active area is currently adjacent to the Dead Sea highway in the northern part of the study area.

Figure 4Sinkholes mapped from satellite and aerial imagery, colour-coded by year of first sighting in time intervals as labelled. Base image is Pleiades 2017. Smaller black dots are sinkholes mapped prior to 2009 by other sources but not visible in our imagery. Insets (a) and (b) show the larger-scale depressions, as denoted by mapped ground cracks and fractures. For clarity, all fractures for each depression are colour-coded by year of first sighting of any fractures related to that depression. In detail, the fracture formation ages in each large-scale depression span a greater range than shown here (see Figs. 6 and 7).
After initiation in a given subarea, further new sinkhole development within that subarea has generally migrated seaward, i.e. westward or northwestward. The extent to which new sinkhole development has migrated seaward varies between 100 and 700 m but such migration is observed consistently all along the line of the currently mapped sinkhole population (Fig. 4).
The size and morphology of individual sinkholes are linked to the nature of the near-surface deposits in which they form (Fig. 5). In general, sinkhole diameters range from 1 to 70 m (Fig. 5a). The distribution of diameters is skewed toward lower values, however, such that the mode of sinkhole diameter is 4–8 m in “salt”, 4–12 m in alluvial sediments and 8–16 m in lacustrine “mud”. The skew is most pronounced for sinkholes in the lacustrine “mud”, the diameter of which is over 70 m for some.
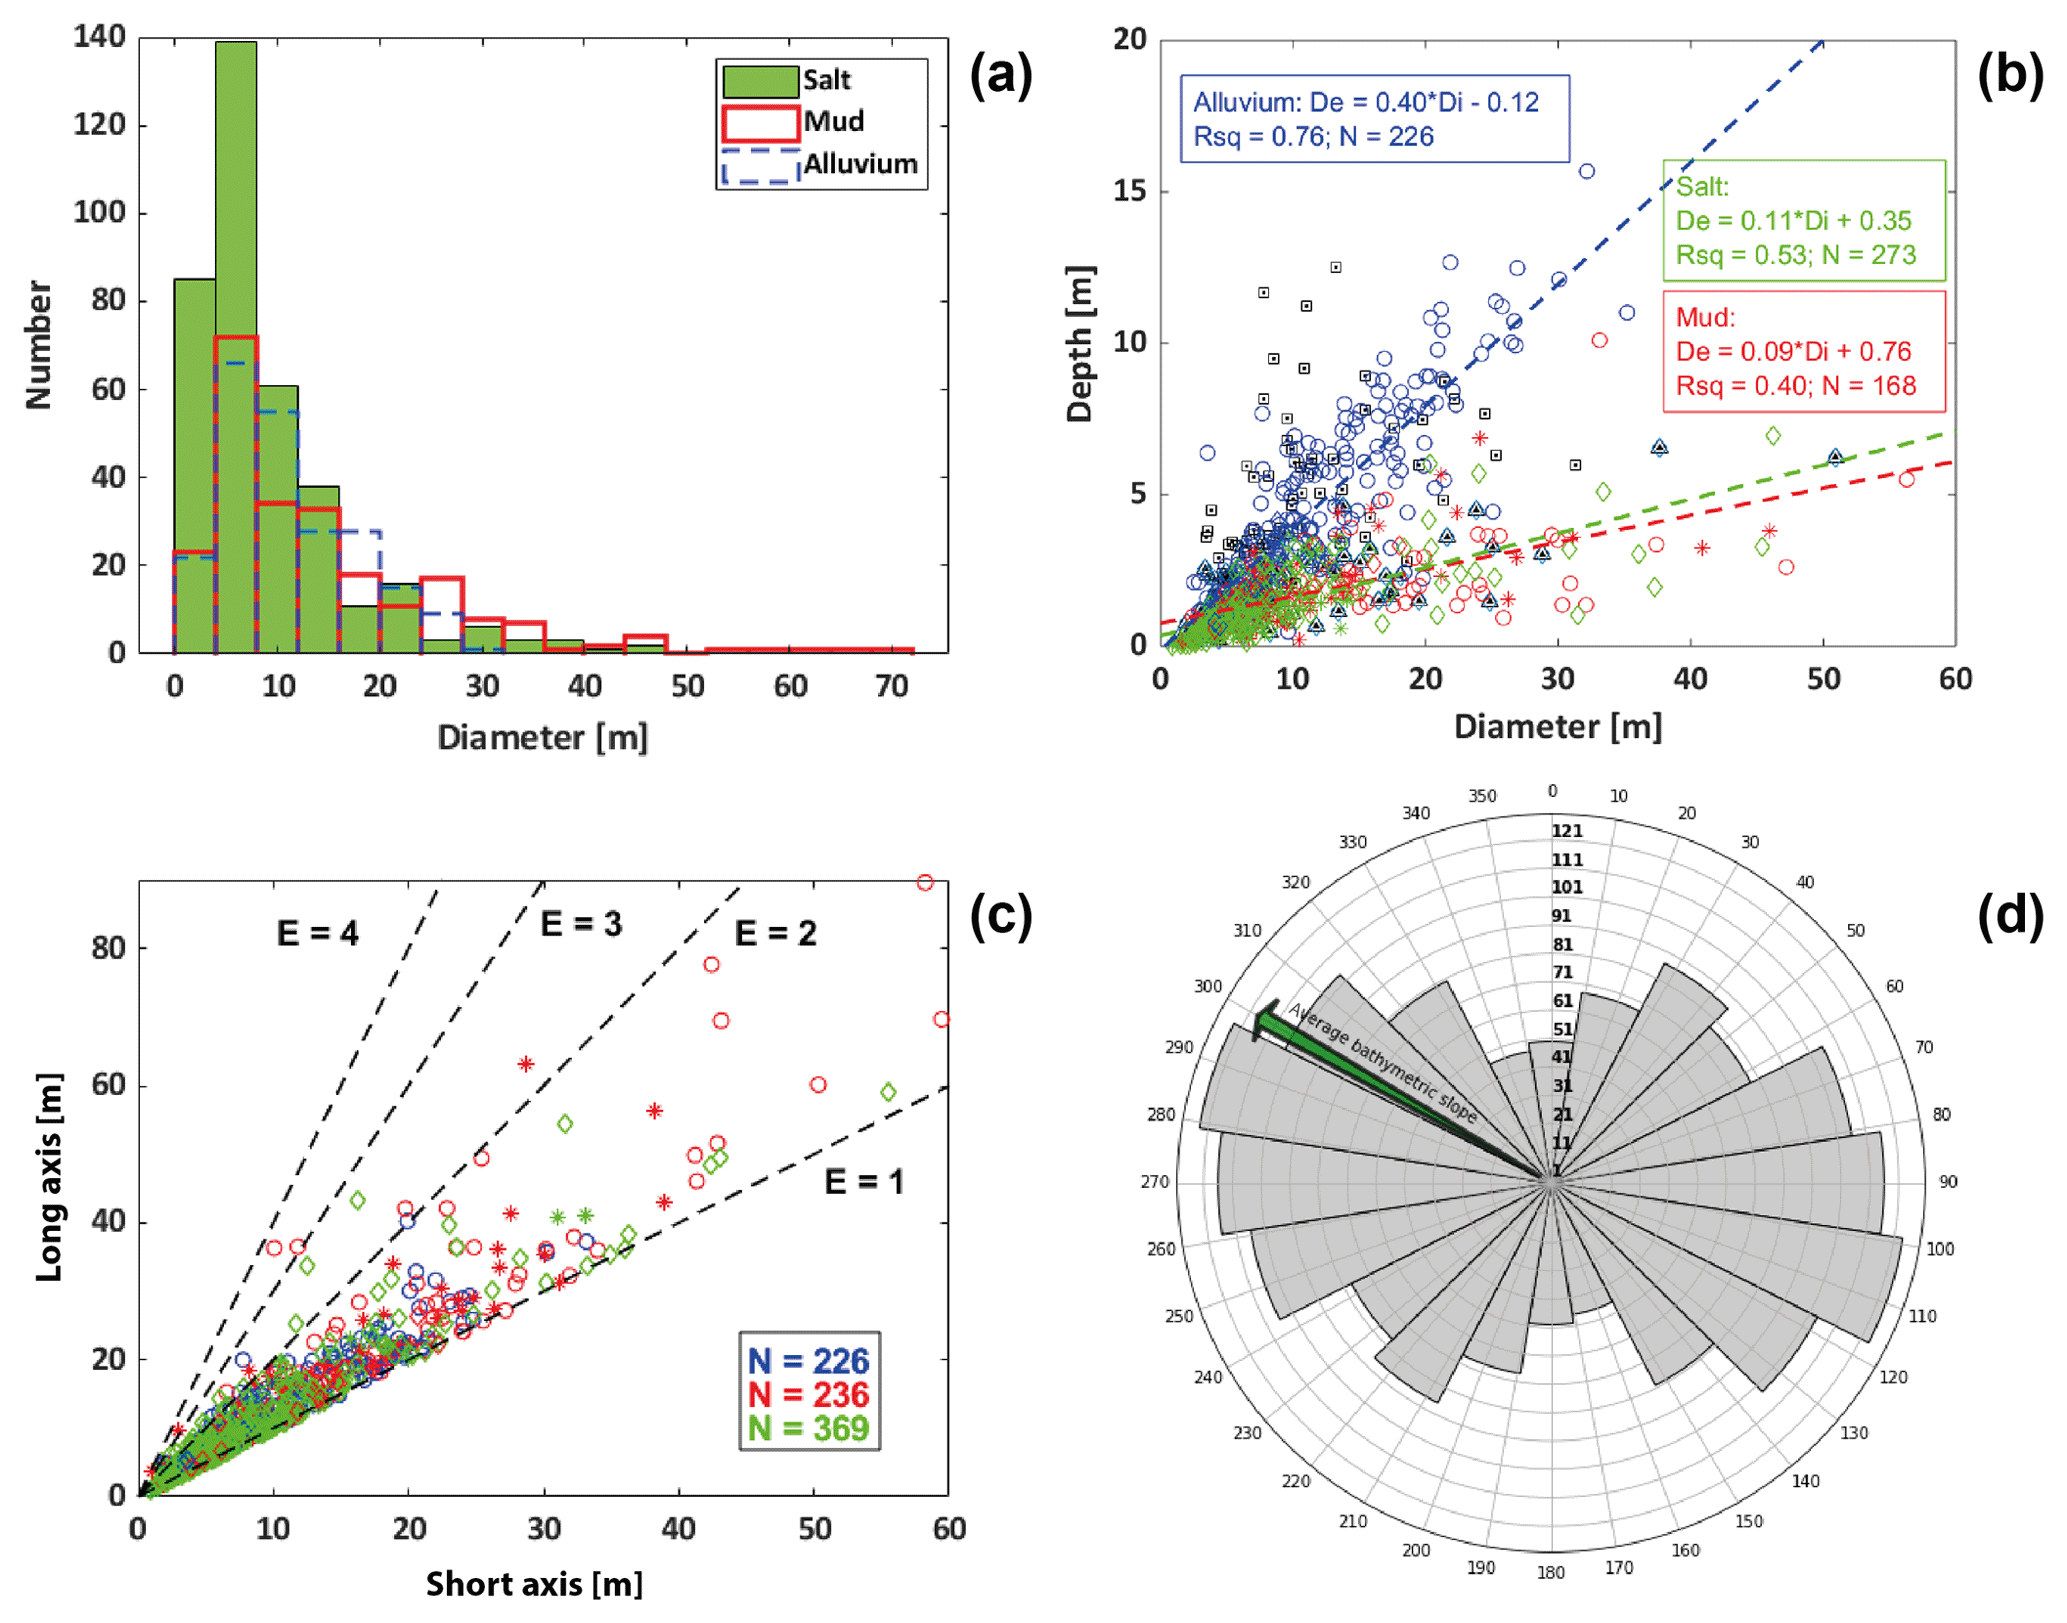
Figure 5Morphological characteristics of the sinkhole population developed at Ghor al-Haditha in various sedimentary materials. (a) Number of holes binned according to average diameter, (b) the relationship between depth and diameter and (c) plan-view eccentricity (longest to shortest diameter). (d) Rose diagram of azimuth of the long axes of all sinkholes in the study area with the average aspect of bathymetric slope plotted for comparison (green arrow). Each concentric circle represents a count of 10 sinkholes. The total number of holes analysed is 226 in the alluvium, 236 in the mud-dominated lacustrine deposits (“mud”) and 369 in the salt-dominated deposits (“salt”). Water-filled holes were excluded from the depth-to-diameter analysis. The De ∕ Di plot presents the maximum elevation difference between the rim and the bottom of each sinkhole. Black squares in (b) are De ∕ Di for sinkholes formed in alluvium at numerous sites along the Dead Sea's western shore derived from Filin et al. (2011); the black triangles are De ∕ Di for sinkholes formed in mudflats along the western shore also derived from Filin et al. (2011).
The depth-to-diameter ratios of sinkholes in lacustrine “mud” and “salt” are lower (average De ∕ Di = 0.18±0.09 and 0.16±0.08, respectively) than the sinkholes in “alluvium” (average De ∕ Di = 0.38±0.17) (Fig. 5b). For linear regression models calculated for depth against diameter, sinkholes in alluvium show the least variance; sinkholes in mud show the most variance. Regardless of the surface materials in which they occur, eccentricity of sinkhole circumferences is usually 1–2; values greater than 2 are rare (Fig. 5c). The azimuths of the long axes of all sinkholes show a general E–W alignment (Fig. 5d), which is broadly parallel to the average aspect of the slope for the study area.
4.4 Uvala development and morphology
The uvalas in the study area are gentle depressions of several hundred metres in lateral extent and of irregular shape (Figs. 4, 6 and 7). Each uvala encloses several tens to a few hundred sinkholes. These uvalas have De ∕ Di ratios of 0.016–0.042, calculated by using the method suggested by Ćalić (2011) of considering the diameter of a circle of equivalent area and taking the maximum depth. The uvalas are bounded partly by systems of ground cracks and/or faults. The ground cracks are dominantly opening-mode fractures with apertures of up to 30 cm, while the faults are shear fractures with vertical displacements of the ground surface up to 1.5 m. Mixed opening- and shear-mode fractures are also observed. The expression of such fractures is material dependent. In alluvium, subsidence-related displacements are accommodated on fewer but larger fractures, whereas in mud-rich lacustrine deposits such displacements are accommodated on more numerous but smaller fractures. As shown below, these fracture systems are spatially and temporally associated with subsidence of each uvala. They are not to be confused with regional tectonic structures.
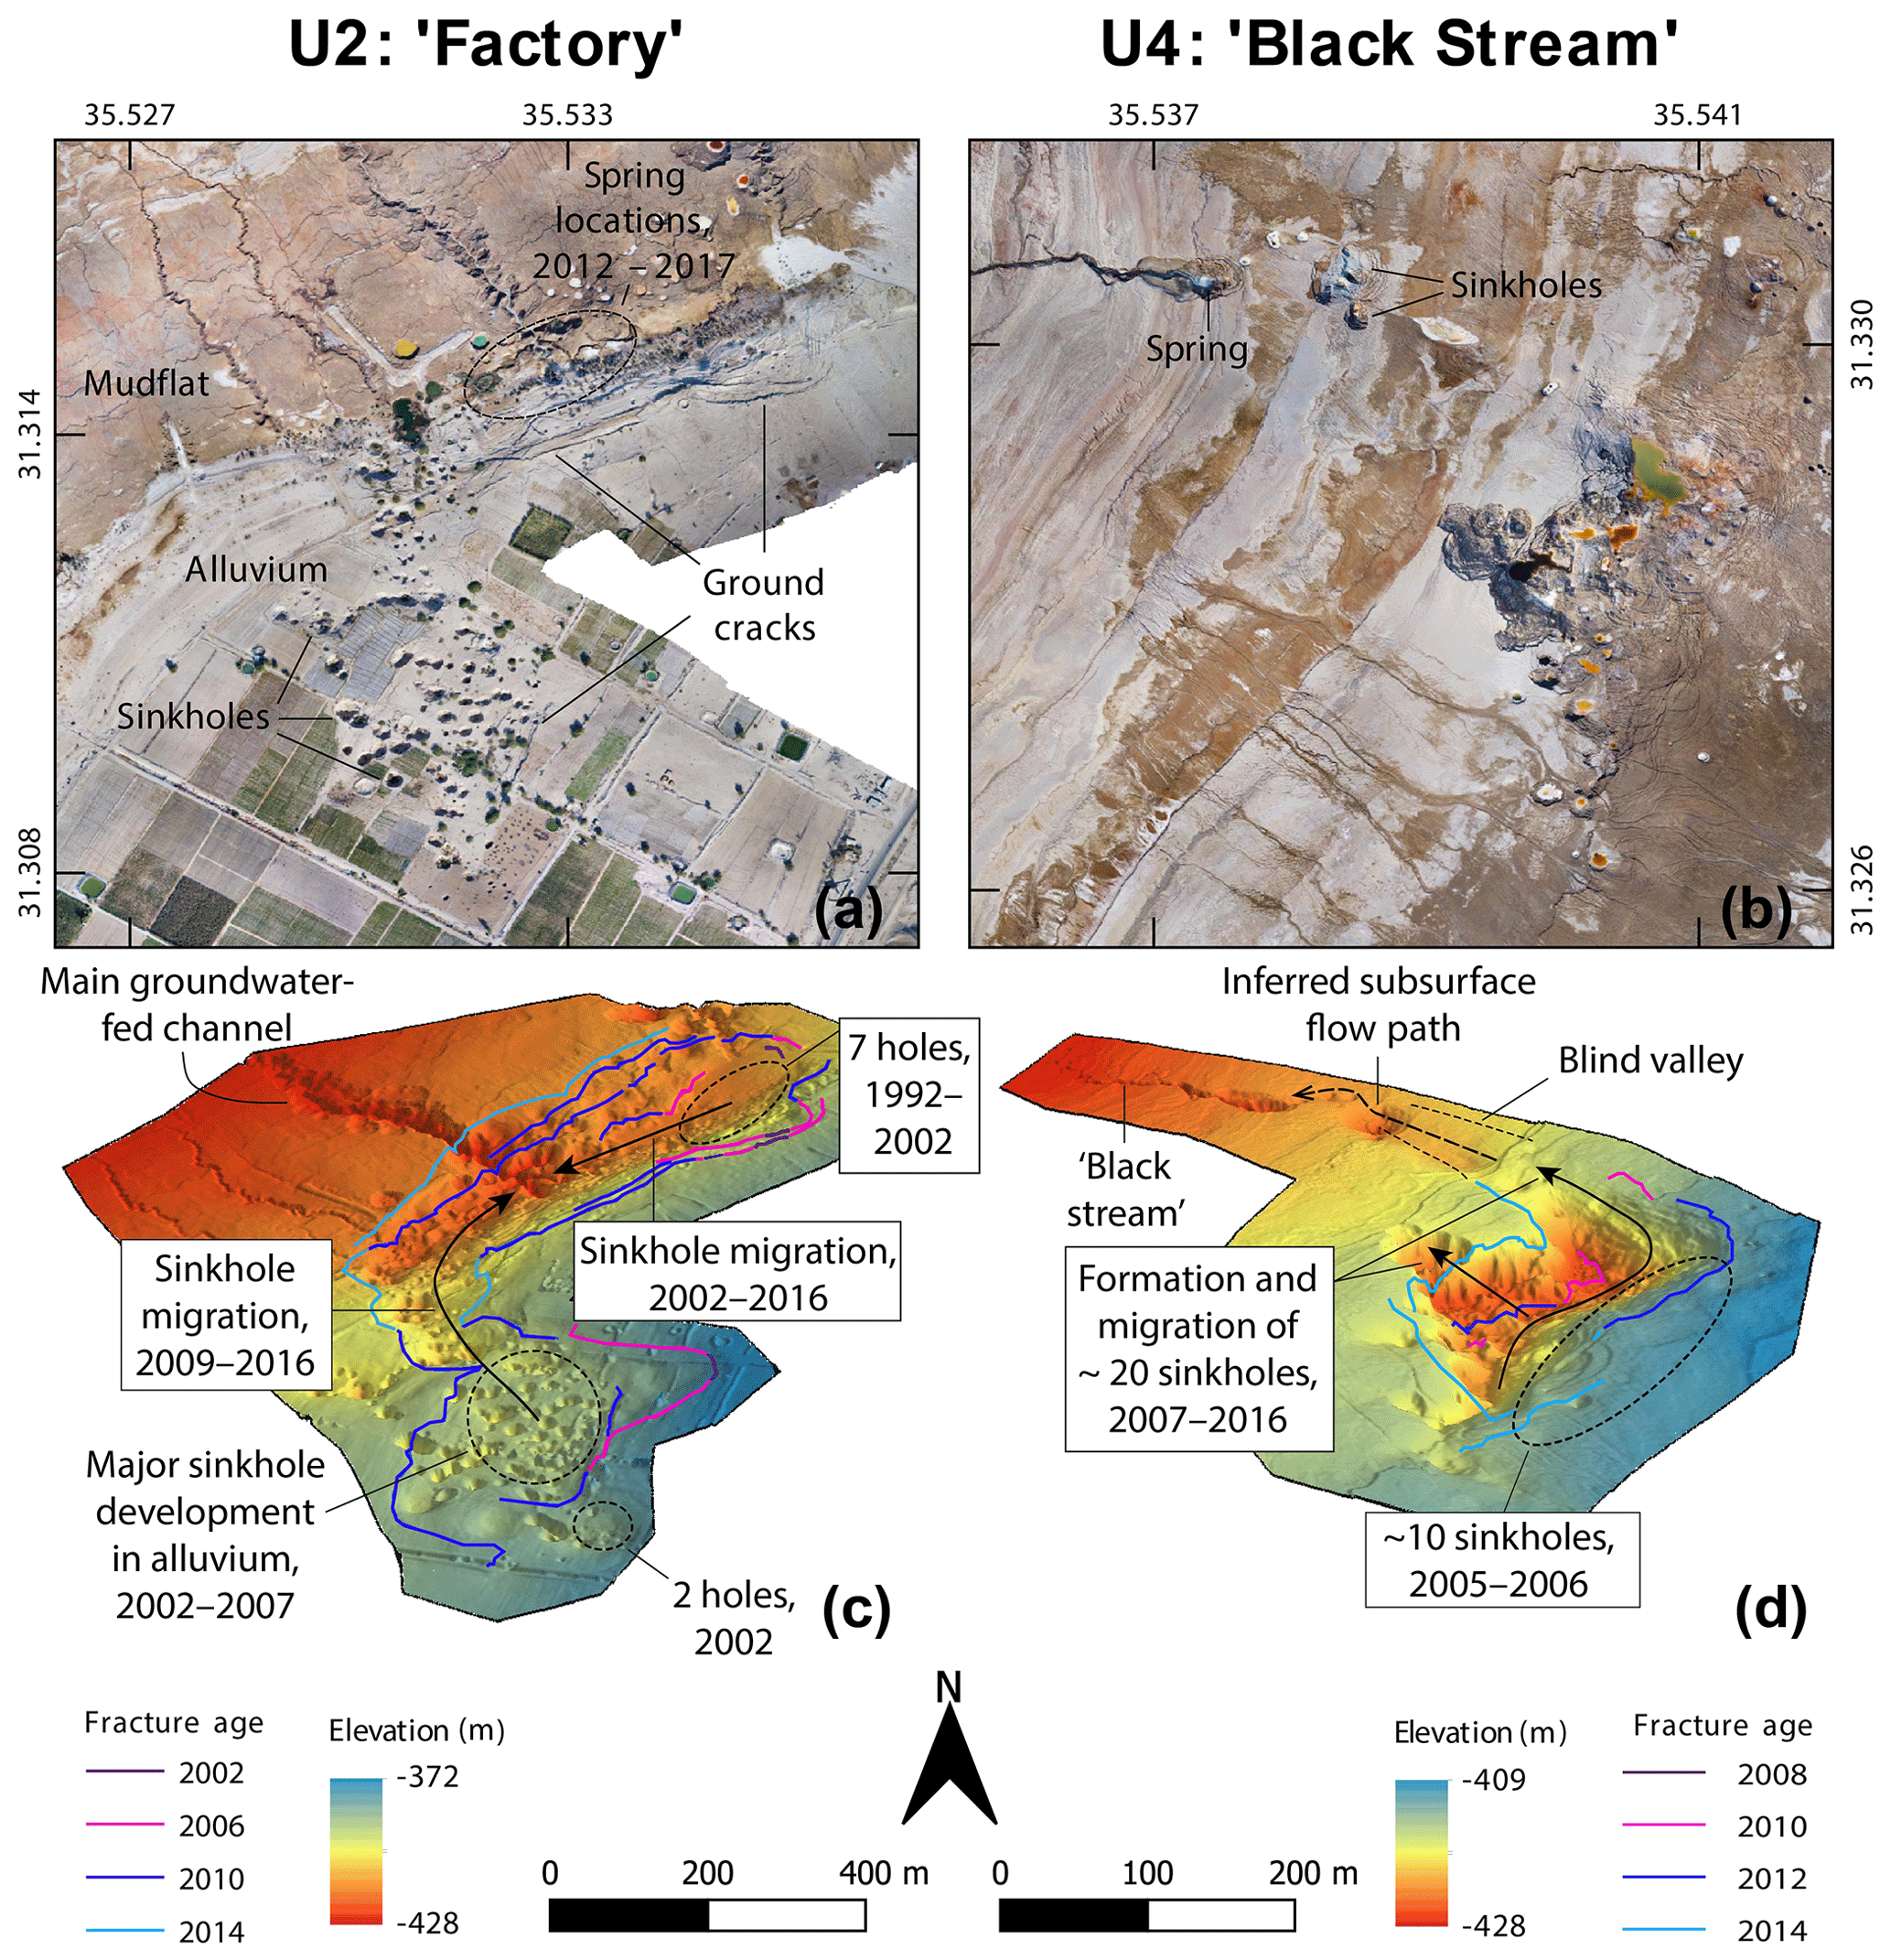
Figure 6Structural development of uvalas with demonstrable connection to channelized subsurface water flow. See Fig. 4 for locations. Panels (a) and (b) show orthophoto images from 2016; Panels (c) and (d) show oblique 3-D views of the depressions derived from the 2016 DSM. The main depression-bounding fractures are shown, whose years of formation (i.e. when first visible in imagery) are grouped and coloured in 4-year intervals for U2 and in 2-year intervals for U4. Each uvala is linked morphologically to a highly active stream that emerges on the seaward side at several metres below the surrounding ground surface.
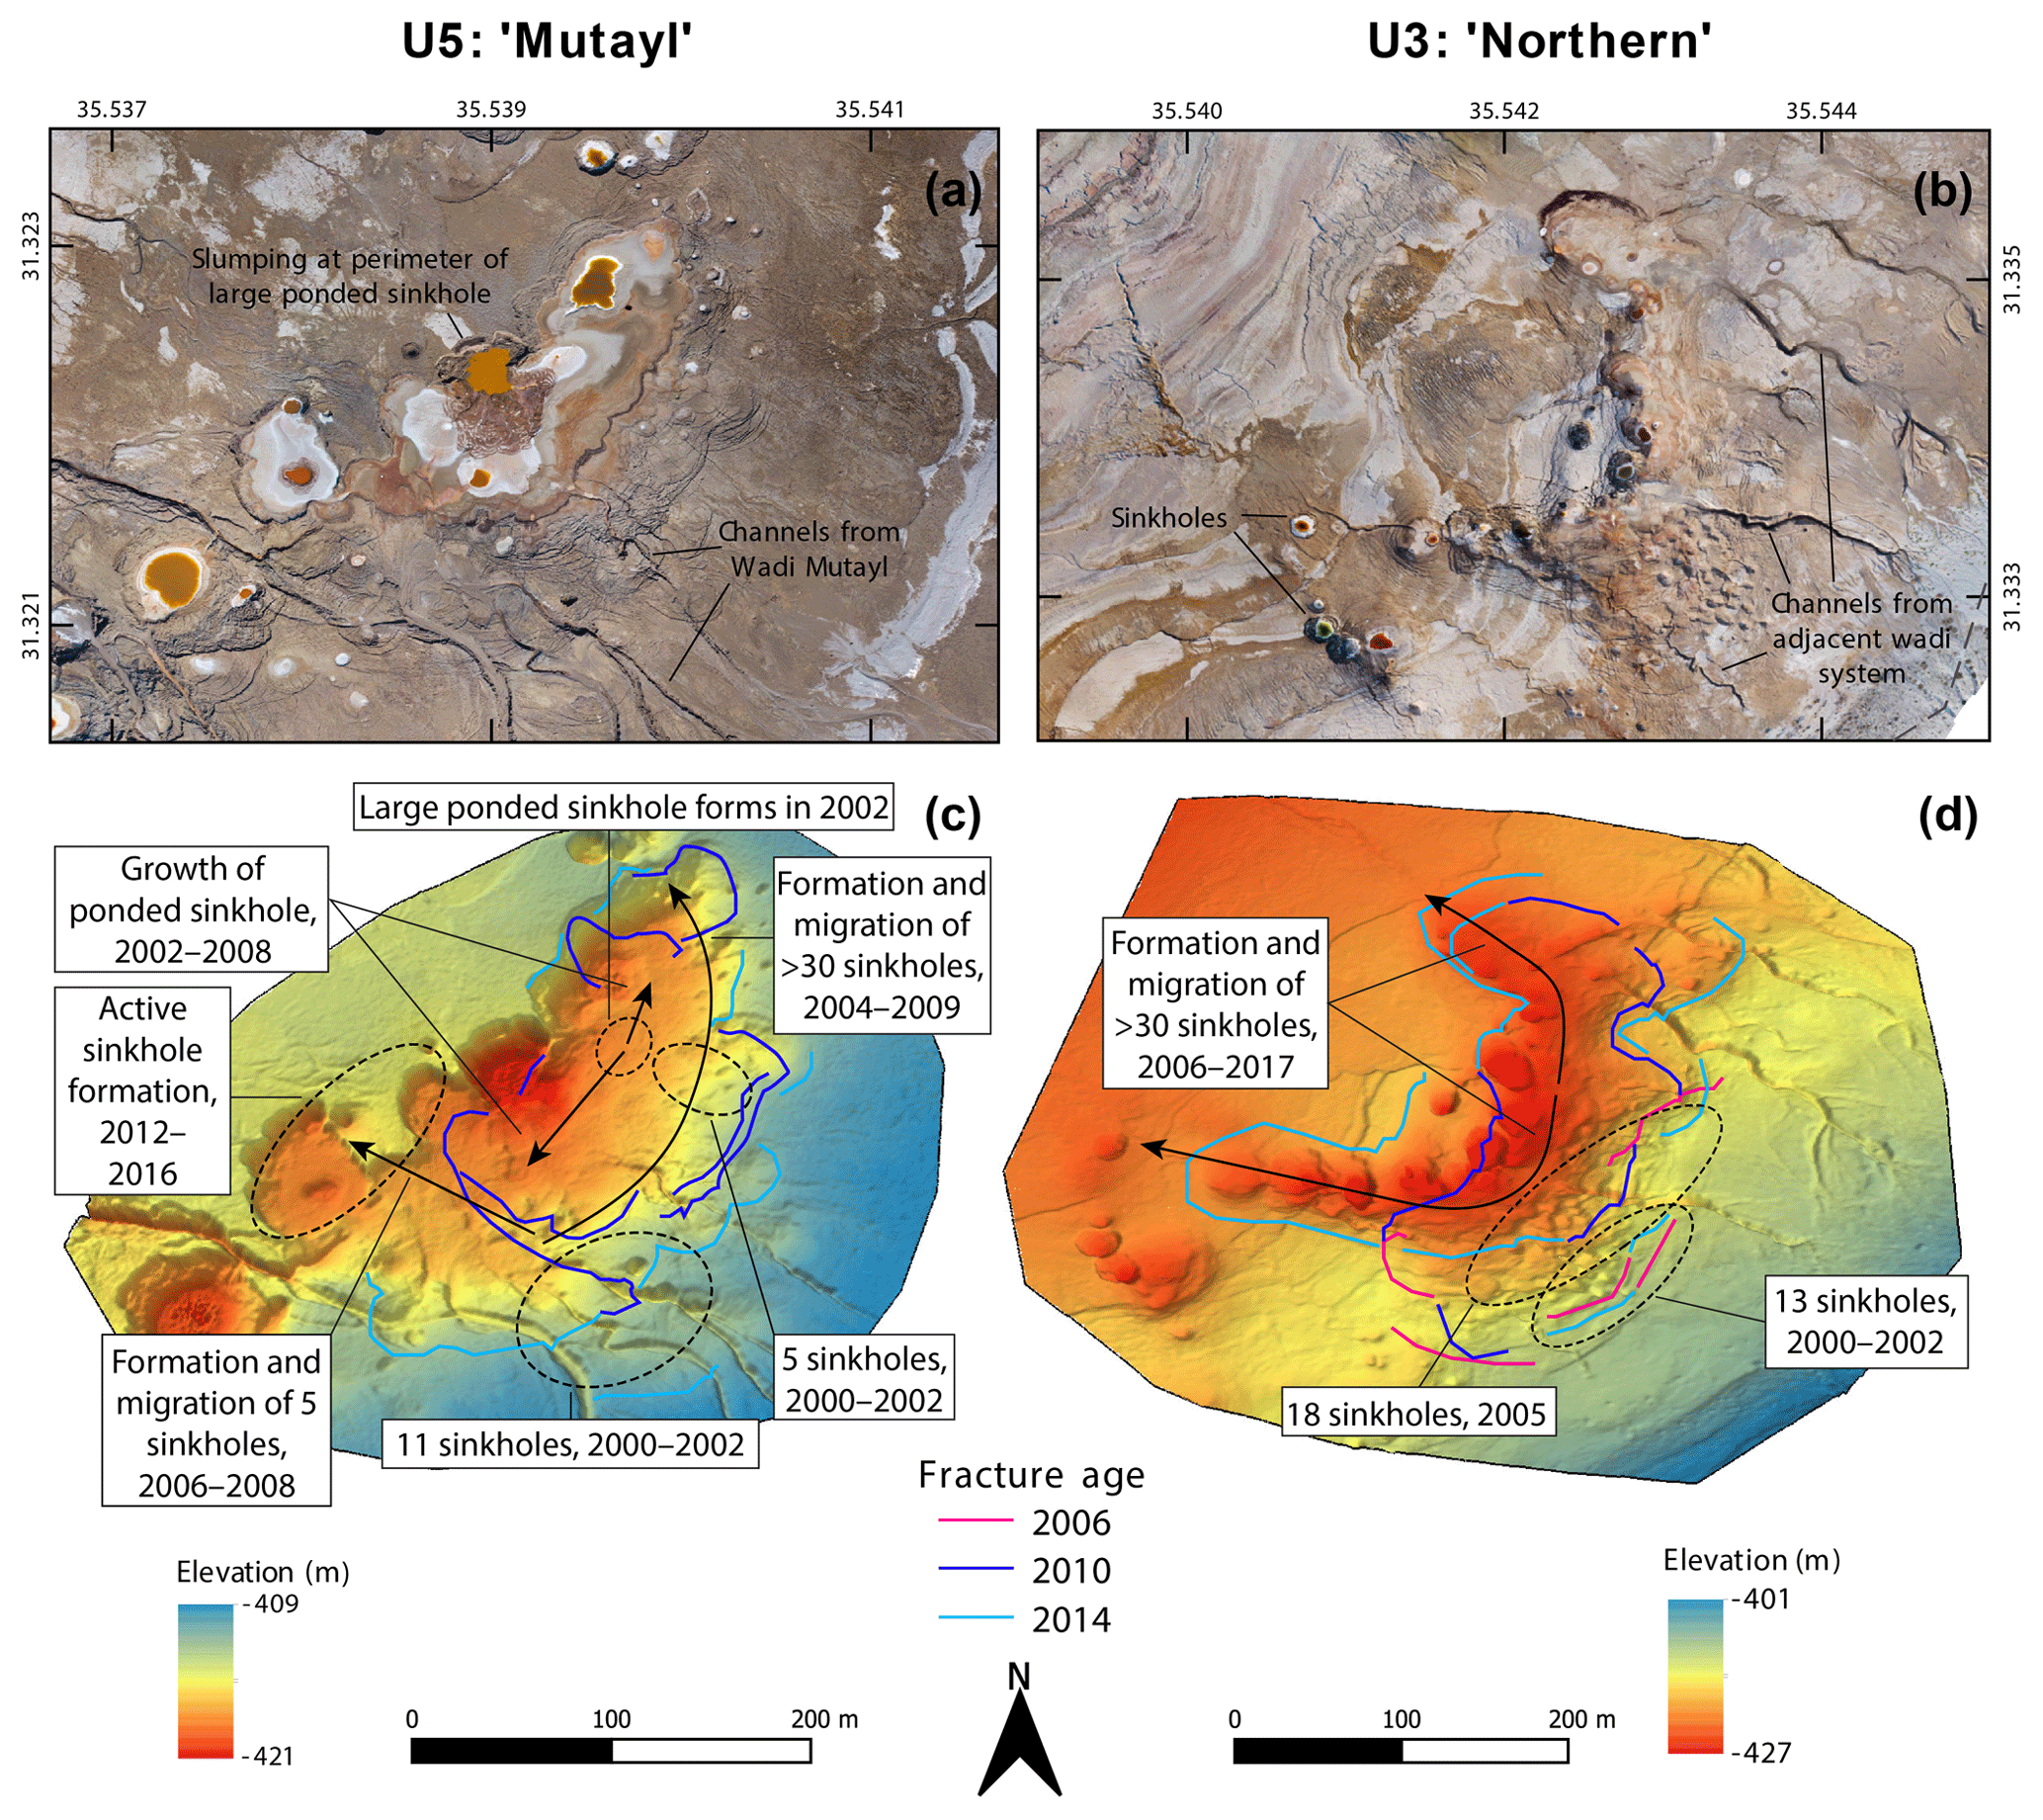
Figure 7Structural development of uvalas U5 and U3 with unclear connection to subsurface water flow. See Fig. 4 for locations. Panels (a) and (b) show orthophoto images from 2016; Panels (c) and (d) show oblique 3-D views of the depressions derived from the 2016 DSM. The main depression-bounding fractures are shown, whose years of formation (i.e. when first visible in imagery) are coloured in 4-year intervals.
Development of each uvala appears to have followed precursory sinkhole formation (occurring prior to the first remotely sensed ground cracks associated with the uvala) at that site. About 2–8 years after the first sinkhole sighting (in which time many new sinkholes have generally clustered about the initial holes), ground cracks developed that no longer trended concentrically to any single sinkhole, but instead delineated a wider zone of subsidence that enveloped several sinkholes or even several clusters of sinkholes. The first uvala, U1, began developing between 1992 and 1995 in the south of the area, near the Wadi Ibn Hamad (Fig. 4). Ground cracking at U1 was first reported by Taqieddin et al. (2000), in an aerial photograph from 1995. U2 and U3 initiated in 2002 and 2005–2006, respectively, to the northeast of U1. Both U4 and U5 began forming around 2008 but lie between U2 and U3. Additionally, a wide area of metre-scale subsidence was detected in the bathymetry–topography DEM differencing (dashed black ellipse, Fig. 3), along with some initial ground cracking patterns observed in the 2015 and 2016 orthophotos in that area, suggest that a new uvala, U6, is developing further northeast of U3. In general, therefore, younger uvalas have formed to the northeast, as seen for the sinkholes, although not (yet) in as clear a sequence.
After initiation, uvala growth is closely linked with further sinkhole formation within it. For instance, ground cracks related to U2 initiated around two spatially discrete sinkhole clusters; these ground-crack sets propagated and joined as sinkhole development migrated seaward (Fig. 6). For both U3 and U4, two “prongs” of coevally migrating ground cracks and sinkhole development are visible (Figs. 6 and 7). Again, the direction of uvala growth has generally been seaward. The end of uvala growth is also linked with the end of sinkhole development; this is exemplified by uvala U1, which ceased development by 2006, in tandem with cessation of sinkhole activity nearby.
4.5 Links between subsurface stream flow and the formation of sinkholes and uvalas
Several features of the uvalas and the formation of sinkholes within them strongly suggest a link between their development and the channelized flow of relatively fresh groundwater in the subsurface. The best example of such links is seen at uvala U2 (Fig. 6a, c), close to the former Numeira Mud Factory site. The history of this uvala occurs in close association with the development of the system of groundwater-fed stream channels located mainly at the alluvium–mudflat boundary. This stream channel system has transformed from several small channels into one main channel over time. This main channel formed late in the system evolution and, unusually, it developed by rapid retrogressive (upslope, headward) erosion from a spring located initially far out on to the mudflat (Al-Halbouni et al., 2017). This new channel also developed in association with drainage of a lake hosted in U2 (Fig. 6; cf. Fig. 16, Al-Halbouni et al., 2017). The migration patterns of sinkholes within U2 over time converge to the current spring location (Fig. 6c). Upstream incision at the head of the channel is spatially and temporally linked with sinkhole collapses, which we observed during photogrammetric surveys on a timescale of a few days. These collapses suggest that the water flowing into the channel reaches its head via subsurface conduits, which are the cause of subsurface instability related to the surface collapse and sinkhole formation.
Further evidence of such links is seen at uvala U4, which is linked spatially and temporally with another artesian spring feeding a similar meandering stream channel (Fig. 6b). We have termed this the “black stream” due to the very dark-coloured sulfurous water that flows within it. Initial ground cracking at U4 occurred proximal to a subtle linear depression (or “blind valley”) between the uvala and the spring feeding the black stream, which we first observe in satellite images from 2009. The migration of sinkholes within U4 seems to follow a flow path from the initial pre-uvala sinkhole cluster to the black stream head, suggesting the presence of a flow conduit system beneath the depression. The additional prongs of sinkhole migration and ground cracking at uvalas U4 and U3 (Figs. 6 and 7) may also represent a surface expression of subsurface conduit development, although no associated springs have yet been observed.
Our reconstruction of the former Dead Sea bathymetry in the Ghor Al-Haditha study area combined with the DSMs from our photogrammetric surveys has revealed subsidence on three area scales: (1) a m2 sized swath of distributed subsidence affecting the lacustrine deposits of the former Dead Sea bed; (2) several 3×10⁴ to 5×10⁵ m2 sized zones of subsidence (uvalas); and (3) numerous 1×100 to 7×101 m2 sized features of highly localized subsidence (sinkholes). In this section, we discuss the former of these area scales first. We then discuss the role of base-level fall in the overall spatio-temporal development of the sinkhole and uvalas. Lastly, we consider the morphometry, processes of formation and inter-relationship between the mapped uvalas and sinkholes.
5.1 Distributed subsidence of the former Dead Sea bed following base-level fall
The distributed subsidence of the former lakebed increases systematically in magnitude from 0 m at the 2017 shoreline to a maximum of about 4 or 5 m near the shoreward edge of the lacustrine deposits. The magnitude of subsidence in the lakebed area lying between the 2000–2017 shorelines correlates with the age of emergence of the lakebed as the Dead Sea has receded (Fig. 8). Data from the predominantly alluvial area lying between the 1967–2000 shorelines and from the northern-most part of the study area are excluded from this figure because these are demonstrably subject to confounding influences from alluvial erosion and deposition, karstification and, most significantly, anthropogenic landscape disturbance (infrastructural development). The data in Fig. 8 are fit well by a function in which subsidence magnitude varies linearly with time, and they are fit slightly better by a function in which subsidence magnitude varies as a function of the square root of time.
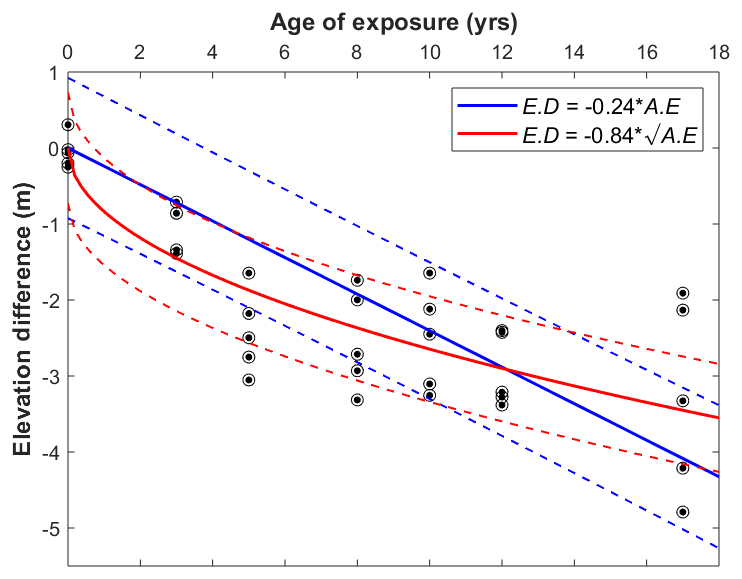
Figure 8Plot of lakebed subsidence against time since exposure. The elevation difference is modelled as varying linearly (thick blue line, R2=0.51) and non-linearly (thick red line, R2=0.71) with the age of exposure of the lakebed. Dashed blue and red lines represent the 95 % confidence limits. Black bullseyes represent the measured elevation difference between the reconstructed bathymetric DSM and the 2016 topographic DSM at the intersection points of the several profiles taken parallel with the direction of shoreline retreat as they transect the 2017, 2014, 2012, 2009, 2007, 2005 and 2000 shorelines. Age of exposure is with respect to 2017.
A non-linear subsidence rate model, as shown in Fig. 8, is more compatible than a linear model with the distribution and magnitude of subsidence rates of the lakebed as reported previously from interferometric synthetic aperture radar (InSAR) analysis (Baer et al., 2002; Fiaschi et al., 2017; Nof et al., 2019; Yechieli et al., 2015) and from differencing of lidar-derived DSMs (Avni et al., 2016). In general, those studies also reported that the rate of subsidence of the former lakebed decreases landward from the contemporary shoreline. The magnitude of subsidence rates previously reported are up to 0.18–0.30 m yr−1 immediately adjacent to the contemporary shoreline, with magnitudes of 0.01–0.15 m yr−1 further landward. The non-linear rate of subsidence modelled in Fig. 8 would give a rather high initial subsidence rate of 0.53–0.65 m yr−1 in the first 2 years after emergence, but this rate would decline to 0.10–0.13 m yr−1 in the 10–17 years after emergence. The latter rate agrees well with InSAR-derived subsidence rates of 0.05–0.15 m yr−1 adjacent to the 2000 shoreline around Ghor Al-Haditha and the Lisan Peninsula (Fiaschi et al., 2017). Our results thus represent the first ground validation of InSAR-based detection of distributed subsidence of the former lakebed at the Ghor Al-Haditha study site. In agreement with Baer et al. (2002), we regard the most likely driving mechanism for the observed distributed subsidence of the former lakebed to be compaction of the formerly water-logged marl deposits upon lowering of the Dead Sea level.
5.2 Effects of base-level fall on the spatio-temporal pattern of sinkhole and uvala development
At the kilometre scale, the spatial distribution of sinkholes and uvalas at Ghor Al-Haditha follows two linear trends: a 24∘ N trend in the south and a 0∘ N trend in the north (Fig. 4). These trends match those of main regional faults in the Dead Sea Transform (Fig. 1a, c) and so indicate some tectonic control (cf. Abelson et al., 2003; Closson, 2005; Yechieli et al., 2015), the nature of which has been debated. Some authors have envisaged that tectonic faults conduct groundwater directly into evaporite deposits (Charrach, 2018; Closson and Abou Karaki, 2013), while others suggest that tectonic faults control the initial depositional geometry of evaporite deposits (Ezersky et al., 2013; Frumkin et al., 2011; Frumkin and Raz, 2001). In closer detail, on a hundred-metre scale, the sinkhole distribution at Ghor Al-Haditha is rather non-linear (Fig. 4). This non-linearity may reflect control from the distribution of salt-rich evaporite deposits at depth (Ezersky et al., 2013), and thus reflect the palaeo-shoreline, as determined by the regional fault systems on the larger scale.
The spatio-temporal development of sinkholes and uvalas at Ghor Al-Haditha shows two striking features. Firstly, new sinkholes and uvalas have successively formed along a SSW → NNE trend with time, i.e. roughly shoreline parallel (Fig. 4). Secondly, after they have been established in a given part of the study area, the formation of new sinkholes and the growth of the uvalas occur in a consistently seaward direction, i.e. roughly shoreline perpendicular (Figs. 4, 6 and 7). Both observations are qualitatively consistent with the predicted migration of this dissolution front in the response of sinkhole population evolution to base-level fall, especially if the migration of the fresh–saline interface is considered to intersect obliquely with the distribution of salt-rich evaporite deposits in the subsurface (Fig. 9). Although constraints on the fresh–saline interface from boreholes or geophysical techniques are lacking in the Ghor Al-Haditha study area, the systematic spatio-temporal migration of new depression development provides strong evidence that a seaward shift of the fresh–saline interface induced by base-level fall is a key control on sinkhole development here. A future definitive analysis of the sinkhole and uvala migration should include a borehole drilling campaign in the study area, similar to that conducted on the western shore (Abelson et al., 2017; Yechieli, 2000; Yechieli et al., 2006).

Figure 9Hypothetical interaction of a migrating fresh–saline interface with subsurface salt-rich deposits. The shaded coloured areas depict the expected zones of sinkhole development for different time periods as a result of convergence between the salt-rich deposits at depth and the fresh–saline interface: blue represents 1985–2000; green represents 2000–2010; red represents 2010–2017. “Salt-rich deposits” here refers to deposits rich in numerous different evaporites. The inset shows the conceptual model of seaward migration of sinkhole populations at the Dead Sea as the fresh–saline interface migrates with the base-level drop, as outlined in Sect. 1, after Abelson et al. (2003, 2017), Yechieli (2000) and Salameh and El-Naser (2000). “GW” here refers to the inferred level of the groundwater in the subsurface.
5.3 Morphological attributes of sinkholes and uvalas in evaporite karst
The sinkholes and uvalas in the evaporite karst setting of the Dead Sea's eastern shore are distinct in terms of their scale and morphology. The uvala perimeters are irregular in plan view, with maximum diameters 1 to 2 orders of magnitude greater than the numerous sinkholes (including coalesced sinkholes and clusters of sinkholes) that they enclose. The uvalas also have depth-to-diameter ratios (De ∕ Di = 0.016–0.042) of up to 2 orders of magnitude lower than the sinkholes (De ∕ Di = 0.02–1.80). As indicated by their spatio-temporal association with groundwater-fed springs, the uvalas overlie karst drainage systems which are surprisingly well developed given the geology of the surface deposits.
The close similarity of these descriptive characteristics to those of uvalas in classical limestone karst (see Ćalić, 2011) justifies our application of the term uvala in this evaporite karst setting. As in our evaporite karst setting, uvalas in limestone karst settings typically have an irregular form, have internal karstic drainage systems, are far greater in size than the enclosed sinkholes (dolines), and have far lower depth-to-diameter ratios than these dolines. In the Dinaric and Carpatho–Balkanides limestone karst, for example, the range of depth-to-diameter ratios of uvalas is De ∕ Di = 0.016–0.10 (Ćalić, 2011), whereas in the Classical Karst of Trieste the range of depth-to-diameter ratios is De ∕ Di = 0.04–0.40 (Bondesan et al., 1992). These ranges overlap those of our evaporite karst uvalas and sinkholes, respectively. A difference between the respective depression types of each karst setting is the absolute size. Sinkholes and uvalas in the evaporite karst of the Dead Sea are considerably smaller than their equivalents in the limestone karst. This difference is possibly as a result of the greater material strength and greater depth of karstification in the limestone regions (Al-Halbouni et al., 2018, 2019; Ćalić, 2011).
For sinkholes in the Dead Sea evaporite karst setting, we add new data to the well-known relationship between surface materials and sinkhole morphology (Filin et al., 2011; Al-Halbouni et al., 2017). The low vs. high De ∕ Di ratios of the sinkholes in mud and alluvium end-member materials, respectively, have been attributed previously to a contrast in the strength (Al-Halbouni et al., 2018, 2019) and/or rheology (Shalev and Lyakhovsky, 2012) of these materials. Expanding upon data presented in these previous works, we show that De ∕ Di ratios of sinkholes formed in salt generally fall between those of sinkholes formed in alluvium or mud (Fig. 5b). This probably reflects the observation that near-surface deposits dominated by salt layers usually contain a considerable proportion of mud layers and so the mechanical behaviour of salt is weakened. Compared to those in mud-rich sediments or alluvium, sinkholes formed in the salt-rich sediments also have generally smaller diameters (Fig. 5a). This could reflect a scaling limit imposed by the level of karstification, which field evidence locally shows is at or within a few metres of, the surface in the salt-rich material in the northern part of the area. The effect of material property on the uvalas is seen mainly in the expression of the marginal fracturing, which, as for sinkholes, is more sharply defined in the higher strength alluvium (cf. Al-Halbouni et al., 2017). However, the data are too few to determine any material-linked differences in depth-to-diameter ratio of the uvalas.
5.4 The formation of uvalas and their inter-relationship with sinkholes
The processes governing the genesis of uvalas are debated in karst geomorphology (Ćalić, 2011; Kranjc, 2013; Lowe and Waltham, 1995). As summarized by Ćalić (2011), three main end-member mechanisms for the formation of uvalas in limestone karst have been proposed: (1) large-scale lowering of the landscape by dissolution of material at the surface and in the vadose zone; (2) areally distributed subsurface mass wasting (corrosion) of soluble material, possibly enhanced along tectonic fractures; and (3) coalescence of sinkholes. Here we discuss the relevance of these three end-member mechanisms for the genesis of the uvalas related to evaporite karstification in our study area.
Surface dissolution and sinkhole coalescence can be precluded as major mechanisms for uvala formation in the evaporite karst setting of Ghor Al-Haditha. Much of the surface material affected by uvala formation is non-karstic (non-soluble alluvium) and the hyper-arid climate conditions of the study area probably limit any dissolution in the vadose zone. Sinkhole coalescence produces compound sinkholes at Ghor al-Haditha. These compound sinkholes are found either within or outside of the uvalas. Fracture systems that delimit compound sinkholes trend concentrically to one or more of the constituent sinkholes. In contrast, fractures that delimit the uvalas generally do not trend concentrically to any individual sinkhole but instead delineate the margins of a larger-scale zone of subsidence (e.g. Fig. 6a). Sinkhole coalescence therefore contributes locally to the definition or the expansion of the spatial extent of an uvala (e.g. Fig. 7d) but in general it is subordinate to the wider-scale subsidence in defining the limits of the uvalas at Ghor al-Haditha. The uvalas are observed to develop as larger-scale depressions than compound sinkholes and they have distinct morphometric attributes and limits – both in space and time (Figs. 4, 6, 7 and 10).
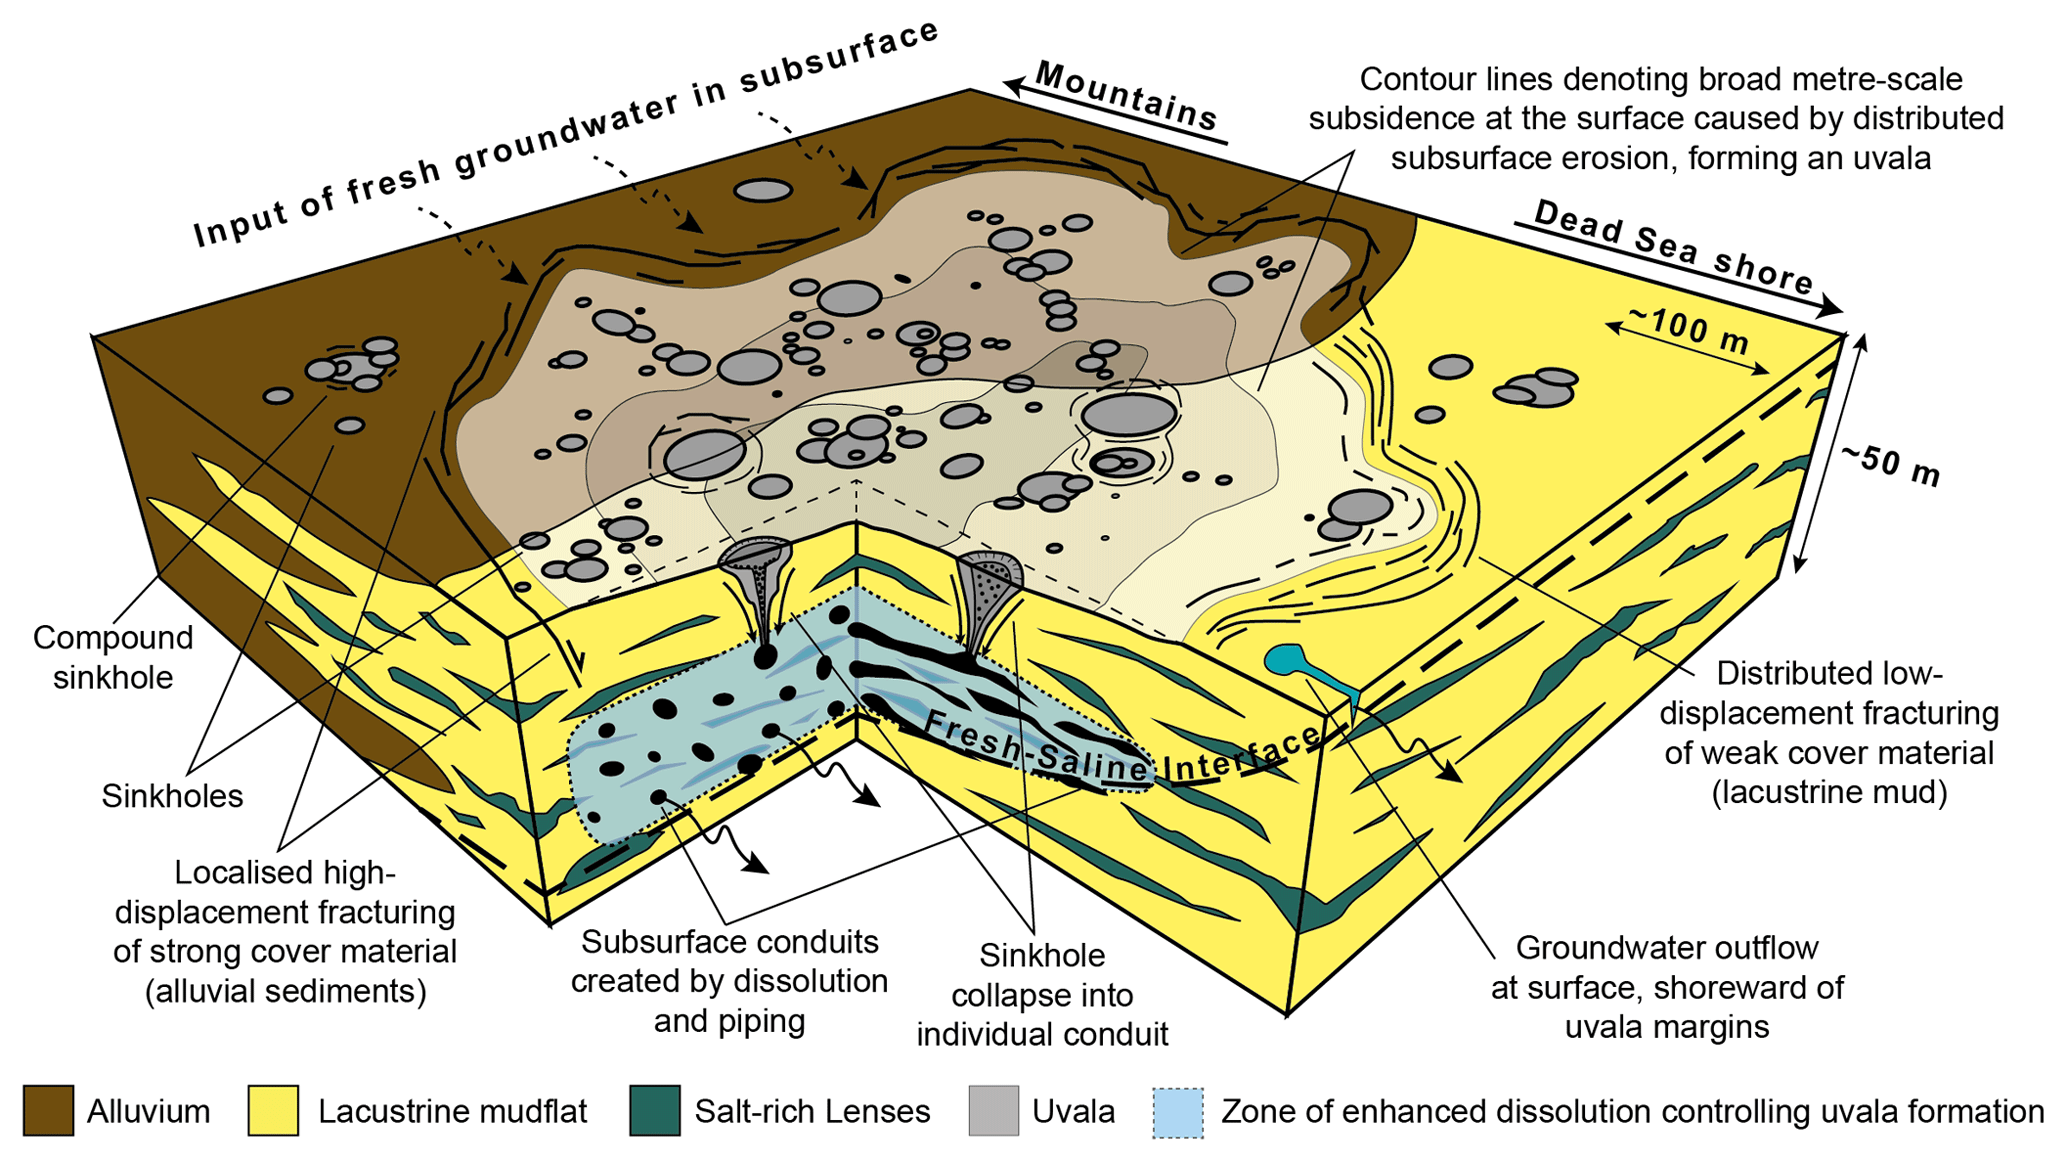
Figure 10Schematic depiction of an uvala, its relationship to sinkholes and the inferred subsurface processes governing their formation in the evaporite karst setting of the Dead Sea. The influence of dissolution and piping on sinkhole and uvala formation is demonstrated, along with the relationship of uvala formation to sinkhole coalescence, which occurs both within and outside the spatial extent of the uvala. The spatial extent of the uvala (grey shading with contour lines) is defined by surface fracturing delineating broad surface subsidence. The expression of these fractures depends upon the host material.
Our observations are consistent with a mechanism of uvala formation by volumetrically distributed subsurface corrosion and erosion, which results in a broad lowering of the surface by subsidence (sagging). Our observations further show that an uvala initiates, evolves and ceases in tandem with sinkhole development within it. These observations are broadly consistent with numerical modelling of subsidence produced by the development of multiple void spaces at progressively deepening levels with varying individual growth rates (Al-Halbouni et al., 2019). We propose that this indicates the same overall formation process for both types of enclosed depression but that the morphological expression of the process differs depending on the scale at which the process operates. Uvalas can be considered to be the integrated subsidence response of both dissolution and mechanical erosion (piping) distributed over a mechanically unstable subsurface volume (e.g. a groundwater conduit network). Sinkholes, on the other hand, represent discrete subsidence responses within that volume to smaller-scale zones of highly localized material removal and related instability (e.g. in an individual groundwater conduit). Figure 10 summarizes our vision of the subsurface processes governing sinkhole and uvala formation at Ghor Al-Haditha.
It is beyond the scope of the current study to resolve the general relevance of this subsidence mechanism of uvala formation in evaporite karst for areas of limestone or gypsum karst. One must of course be conscious that similarity of form does not necessarily mean similarity of genesis. Future work might involve resurveying uvalas in limestone karst areas for structural evidence of uvala-scale subsidence, such as synclinal bed rotations and marginal fractures (fissures and/or faults) that are geometrically and kinematically linked to the uvala. Although sparse, structural data presented for the Grda Draga uvala in the limestone Dinaric karst, Slovenia (Fig. 4 of Ćalić, 2011), seem broadly consistent with a genesis through subsidence. In limestone karst areas, regional tectonics may facilitate (and complicate) uvala formation by, for instance, providing zones of enhanced permeability for groundwater flow (Ćalić, 2011). Additionally, in limestone karst, most uvalas do not have water at their bottoms (Ćalić, 2011), whereas water has occupied (ephemerally or otherwise) the bottom of some of our evaporite karst uvalas. Hence the relationship of uvalas to the water table may vary from one karst environment to the other, in line with the dissolution dynamics of each.
Differences in material properties between different karst settings are also an important factor dictating differences in uvala morphology and formation processes. For instance, the relatively weak semi-consolidated material in the Dead Sea karst setting seems to facilitate piping as a mechanism for subsurface erosion (Arkin and Gilat, 2000; Al-Halbouni et al., 2017) and sagging as a subsidence mechanism. Similarly, in the mantled evaporite karst of the Ebro Valley of northeastern Spain, uvala formation has been attributed primarily to passive sagging of cover deposits accompanied by widespread formation and coalescence of sinkholes formed by corrosional collapse (piping) and suffosion (Gutiérrez et al., 2005, 2008). In contrast, the strength and consolidated nature of many limestones is likely to inhibit these mechanisms as is the case with sinkhole formation (Waltham et al., 2005; Williams, 2003). Future studies with more detailed datasets are required to test whether the mechanisms of uvala development in evaporite karst in our study area are applicable to limestone or gypsum karst areas.
Our results provide, for the first time, a detailed picture of the interlinked geomorphological development of sinkholes and uvalas in an evaporite karst setting. They also provide new insights into impact of base-level fall on sinkhole and uvala development in the Dead Sea area. Based on the combination of remote sensing data, photogrammetric surveying and field observations, our main findings with respect to the Ghor Al-Haditha study area on the eastern shore of the Dead Sea are as follows:
-
At least 1150 collapse sinkholes and five uvalas have formed by subsidence in this evaporite karst setting since the mid-1980s. The developments of individual uvalas and of sinkhole populations within them are intertwined in terms of onset, evolution and cessation.
-
The locations of new sinkholes and uvalas migrate markedly with time, roughly parallel to the shoreline. After initiated, sinkhole clusters and uvalas also show a marked seaward growth with time. These migration patterns of new depression development are broadly consistent with theoretical predictions of a spatio-temporal control on karstification from a laterally migrating interface between saturated and undersaturated groundwater, as induced by the base-level fall.
-
The exposed former Dead Sea lakebed has also undergone a wider-scale subsidence of up to several metres that decreases toward the present-day shoreline. Subsidence rates estimated here by DSM differencing are in line with those estimated previously by remote sensing. This wider-scale subsidence is possibly related to post-recession compaction or consolidation of the near-surface lakebed sediments upon withdrawal of pore-fluids as the lake level has fallen.
-
While many sinkholes develop initially in clusters, the uvalas develop around such clusters as larger-scale and gentler depressions that are structurally distinct both in space and time. In agreement with inferences for examples in limestone karst settings, the uvalas in the studied evaporite karst setting do not form by coalescence of sinkholes.
-
The studied evaporite–karst uvalas likely form through subsidence (sagging) in response to distributed subsurface dissolution and physical erosion within a mechanically unstable subsurface volume (e.g. a groundwater conduit network). Sinkholes, on the other hand, represent discrete subsidence responses within that volume to smaller-scale zones of highly localized material removal (e.g. in individual groundwater conduits) and related instability.
A full set of metadata is available upon request. Satellite images: some are open access (Corona) but most are commercial. Aerial images: available at the discretion of the RJGC. Photogrammetric surveys: raw images, DSMs and orthophotos available upon consultation with the authors. Geological map 1:50 000 Ar Rabba: available at the discretion of the Ministry of Energy and Mineral Resources (MEMR).
The supplement related to this article is available online at: https://doi.org/10.5194/se-10-1451-2019-supplement.
RAW and EPH led the production of figures and writing of the article. RAW undertook the majority of the data analysis associated with the satellite imagery time series and with the 2015 and 2016 DSMs. Additional satellite imagery processing and data analysis were performed by LS, DAH and EPH. DAH and LS generated the orthophotos and DSMs of the study area using SfM photogrammetry. EPH, DAH, LS, HA and AS undertook the field studies and close-range photogrammetric surveys during 2014–2016. All authors reviewed and commented on the article and they contributed to discussions on the data.
The authors declare that they have no conflict of interest.
This article is part of the special issue “Environmental changes and hazards in the Dead Sea region (NHESS/ACP/HESS/SE inter-journal SI)”. It is not associated with a conference.
We acknowledge MEMR colleagues for support in fieldwork and other logistical support. The comments of Jo De Waele and three anonymous reviewers have greatly improved the quality of the article. We thank Amotz Agnon for his handling of editorial duties. Part of the work of NAK was done during a sabbatical year supported by the Deanship of Scientific Research – The University of Jordan. The authors acknowledge financial support from GFZ-Potsdam and the Helmholtz Association's recent Dead Sea Research Venue (DESERVE) initiative, especially for the associated data and fieldwork costs. Funding for RAW's masters research project, supervised by EPH, was provided by the Geological Survey Ireland.
This research has been supported by the GFZ-Potsdam together, the Helmholtz Association's recent Dead Sea Research Venue (DESERVE, grant no. VH-VI-527) and the Geological Survey Ireland under a GSI short call grant to EPH (grant no. 2017-sc-002).
This paper was edited by Amotz Agnon and reviewed by Jo De Waele and three anonymous referees.
Abelson, M., Baer, G., Shtivelman, V., Wachs, D., Raz, E., Crouvi, O., Kurzon, I., and Yechieli, Y.: Collapse-sinkholes and radar interferometry reveal neotectonics concealed within the Dead Sea basin, Geophys. Res. Lett., 30, 2–5, https://doi.org/10.1029/2003GL017103, 2003.
Abelson, M., Yechieli, Y., Baer, G., Lapid, G., Behar, N., Calvo, R., and Rosensaft, M.: Natural versus human control on subsurface salt dissolution and development of thousands of sinkholes along the Dead Sea coast, J. Geophys. Res.-Earth, 122, 1262–1277, https://doi.org/10.1002/2017JF004219, 2017.
Abou-Karaki, N., Fiaschi, S., and Closson, D.: Sustainable development and anthropogenic induced geomorphic hazards in subsiding areas, Earth Surf. Proc. Land., 2295, 2282–2295, https://doi.org/10.1002/esp.4047, 2016.
Al-Halbouni, D., Holohan, E. P., Saberi, L., Alrshdan, H., Sawarieh, A., Closson, D., Walter, T. R., and Dahm, T.: Sinkholes, subsidence and subrosion on the eastern shore of the Dead Sea as revealed by a close-range photogrammetric survey, Geomorphology, 285, 305–324, https://doi.org/10.1016/J.GEOMORPH.2017.02.006, 2017.
Al-Halbouni, D., Holohan, E. P., Taheri, A., Schöpfer, M. P. J., Emam, S., and Dahm, T.: Geomechanical modelling of sinkhole development using distinct elements: model verification for a single void space and application to the Dead Sea area, Solid Earth, 9, 1341–1373, https://doi.org/10.5194/se-9-1341-2018, 2018.
Al-Halbouni, D., Holohan, E. P., Taheri, A., Watson, R. A., Polom, U., Schöpfer, M. P. J., Emam, S., and Dahm, T.: Distinct element geomechanical modelling of the formation of sinkhole clusters within large-scale karstic depressions, Solid Earth, 10, 1219–1241, https://doi.org/10.5194/se-10-1219-2019, 2019.
Arkin, Y. and Gilat, A.: Dead Sea sinkholes – An ever-developing hazard, Environ. Geol., 39, 711–722, https://doi.org/10.1007/s002540050485, 2000.
Asmar, B. N. and Ergenzinger, P.: Long-term prediction of the water level and salinity in the Dead Sea, Hydrol. Process., 16, 2819–2831, https://doi.org/10.1002/hyp.1073, 2002.
Avni, Y., Lensky, N., Dente, E., Shviro, M., Arav, R., Gavrieli, I., Yechieli, Y., Abelson, M., Lutzky, H., Filin, S., Haviv, I., and Baer, G.: Self-accelerated development of salt karst during flash floods along the Dead Sea Coast, Israel, J. Geophys. Res.-Earth, 121, 17–38, https://doi.org/10.1002/2015JF003738, 2016.
Baer, G., Schattner, U., Wachs, D., Sandwell, D., Wdowinski, S., and Frydman, S.: The lowest place on Earth is subsiding – An InSAR (interferometric synthetic aperture radar) perspective, Geol. Soc. Am. Bull., 114, 12–23, 2002.
Bartov, Y., Stein, M., Enzel, Y., Agnon, A., and Reches, Z.: Lake Levels and Sequence Stratigraphy of Lake Lisan, the Late Pleistocene Precursor of the Dead Sea, Quaternary Res., 57, 9–21, https://doi.org/10.1006/qres.2001.2284, 2002.
BGR, IAH, KIT and UNESCO: World Karst Aquifer Map, 1:40 000 000, Berlin, Reading, Karlsruhe, Paris, 2017.
Bondesan, A., Meneghel, M., and Sauro, U.: Morphometric analysis of dolines, Int. J. Speleol., 21, 1–55, https://doi.org/10.5038/1827-806x.21.1.1, 1992.
Ćalić, J.: Karstic uvala revisited: Toward a redefinition of the term, Geomorphology, 134, 32–42, https://doi.org/10.1016/j.geomorph.2011.06.029, 2011.
Charrach, J.: Investigations into the Holocene geology of the Dead Sea basin, Carbonates Evaporites, https://doi.org/10.1007/s13146-018-0454-x, 2018.
Chen, Z., Auler, A. S., Bakalowicz, M., Drew, D., Griger, F., Hartmann, J., Jiang, G., Moosdorf, N., Richts, A., Stevanovic, Z., Veni, G., and Goldscheider, N.: The World Karst Aquifer Mapping project: concept, mapping procedure and map of Europe, Hydrogeol. J., 25, 771–785, https://doi.org/10.1007/s10040-016-1519-3, 2017.
Closson, D.: Structural control of sinkholes and subsidence hazards along the Jordanian Dead Sea coast, Environ. Geol., 47, 290–301, https://doi.org/10.1007/s00254-004-1155-4, 2005.
Closson, D. and Karaki, N. A.: Salt karst and tectonics?: sinkholes development along tension cracks between parallel strike-slip faults, Dead Sea, Jordan, Earth Surf. Proc. Land., 34, 1408–1421, 2009.
Closson, D. and Abou Karaki, N.: Sinkhole hazards prediction at Ghor Al Haditha, Dead Sea, Jordan: “Salt Edge” and “Tectonic” models contribution – a rebuttal to “Geophysical prediction and following development sinkholes in two Dead Sea areas, Israel and Jordan, edited by: Ezersky, M. G., Eppelbaum, L. V., Al-Zoubi, A., Keydar, S., Abueladas, A.-R., Akkawi, E., and Medvedev, B., Environ. Earth Sci., 70, 2919–2922, https://doi.org/10.1007/s12665-013-2418-8, 2013.
Cvijić, J.: Morphologische und glaciale Studien aus Bosien, Herzegovina und Montenegro, in: Abhandlungen d. K. K. Geographischen Gesell. Bd III (Heft 2), Wien, 1–85, 1901.
Cvijić, J.: La géographie des terrains calcaires, in: Monographies tome 341, Classe des sciences mathématiques et naturelles, No. 26, Belgrade, 1960.
Dogan, U.: Land subsidence and caprock dolines caused by subsurface gypsum dissolution and the effect of subsidence on the fluvial system in the Upper Tigris Basin (between Bismil-Batman, Turkey), Geomorphology, 71, 389–401, https://doi.org/10.1016/j.geomorph.2005.04.010, 2005.
Doğan, U. and Özel, S.: Gypsum karst and its evolution east of Hafik (Sivas, Turkey), Geomorphology, 71, 373–388, https://doi.org/10.1016/j.geomorph.2005.04.009, 2005.
El-Isa, Z., Rimawi, O., Jarrar, G., Abou Karaki, N., Taqieddin, S., Atallah, M., Seif El-Din, N., and Al Saed, E.: Assessment of the Hazard of Sinkholes and Subsidence in the Ghor al-Haditha Area, Amman, Jordan, 1–141, 1995.
Ezersky, M. G., Eppelbaum, L. V., Al-Zoubi, A., Keydar, S., Abueladas, A., Akkawi, E., and Medvedev, B.: Geophysical prediction and following development sinkholes in two Dead Sea areas, Israel and Jordan, Environ. Earth Sci., 70, 1463–1478, https://doi.org/10.1007/s12665-013-2233-2, 2013.
Fiaschi, S., Closson, D., Abou Karaki, N., Pasquali, P., Riccardi, P., and Floris, M.: The complex karst dynamics of the Lisan Peninsula revealed by 25 years of DInSAR observations. Dead Sea, Jordan, ISPRS J. Photogramm. Remote S., 130, 358–369, https://doi.org/10.1016/j.isprsjprs.2017.06.008, 2017.
Filin, S., Baruch, A., Avni, Y., and Marco, S.: Sinkhole characterization in the Dead Sea area using airborne laser scanning, 58, 1135–1154, https://doi.org/10.1007/s11069-011-9718-7, 2011.
Frumkin, A.: Salt Karst, in: Treatise on Geomorphology, Vol. 6, edited by: Shroder, J. and Frumkin, A., Academic Press, San Diego, CA, 407–424, 2013.
Frumkin, A. and Raz, E.: Collapse and subsidence associated with salt karstification along the Dead Sea, Carbonates Evaporite., 16, 117–130, https://doi.org/10.1007/BF03175830, 2001.
Frumkin, A., Ezersky, M., Al-Zoubi, A., Akkawi, E., and Abueladas, A.-R.: The Dead Sea sinkhole hazard: Geophysical assessment of salt dissolution and collapse, Geomorphology, 134, 102–117, https://doi.org/10.1016/j.geomorph.2011.04.023, 2011.
Garfunkel, Z. and Ben-Avraham, Z.: The structure of the Dead Sea basin, Tectonophysics, 266, 155–176, https://doi.org/10.1016/S0040-1951(96)00188-6, 1996.
GDAL/OGR Contributors: GDAL/OGR Geospatial Data Abstraction Software Library, Open Source Geospatial Foundation, 2018, available at: http://gdal.org (last access: 15 May 2018).
Gutiérrez, F. and Cooper, A. H.: Surface Morphology of Gypsum Karst, in: Treatise on Geomorphology, Vol. 6, edited by: Shroder, J. and Frumkin, A., Academic Press, San Diego, CA, 425–437, 2013.
Gutiérrez, F., Gutiérrez, M., Marín, C., Desir, G., and Maldonado, C.: Spatial distribution, morphometry and activity of La Puebla de Alfindén sinkhole field in the Ebro river valley (NE Spain): applied aspects for hazard zonation, Environ. Geol., 48, 360–369, https://doi.org/10.1007/s00254-005-1280-8, 2005.
Gutiérrez, F., Guerrero, J., and Lucha, P.: A genetic classification of sinkholes illustrated from evaporite paleokarst exposures in Spain, Environ. Geol., 53, 993–1006, https://doi.org/10.1007/s00254-007-0727-5, 2008.
Israel Oceanographic and Limnological Research – Israel Marine Data Center: Interannual changes in the Dead Sea Total Vertical Stability and Sea Level, Long-Term Chang, Dead Sea, available at: https://isramar.ocean.org.il/isramar2009/DeadSea/LongTerm.aspx (last access: 10 February 2018), 2017.
Khalil, B.: The Geology of the Ar Rabba area, Map Sheet No. 3125 IV, Bull 22, Amman, Jordan, 1–105, 1992.
Khlaifat, A., Al-Khashman, O., and Qutob, H.: Physical and chemical characterization of Dead Sea mud, Mater. Charact., 61, 564–568, https://doi.org/10.1016/j.matchar.2010.02.015, 2010.
Khoury, H. N.: Clays and Clay Minerals in Jordan, Amman, 1–116, 2002.
Kottmeier, C., Agnon, A., Al-Halbouni, D., Alpert, P., Corsmeier, U., Dahm, T., Eshel, A., Geyer, S., Haas, M., Holohan, E., Kalthoff, N., Kishcha, P., Krawczyk, C., Lati, J., Laronne, J. B., Lott, F., Mallast, U., Merz, R., Metzger, J., Mohsen, A., Morin, E., Nied, M., Rödiger, T., Salameh, E., Sawarieh, A., Shannak, B., Siebert, C., and Weber, M.: New perspectives on interdisciplinary earth science at the Dead Sea: The DESERVE project, Sci. Total Environ., 544, 1045–1058, https://doi.org/10.1016/j.scitotenv.2015.12.003, 2016.
Kranjc, A.: Classification of Closed Depressions in Carbonate Karst, in: Treatise on Geomorphology, Vol. 6, edited by: Frumkin, A., Academic Press, San Diego, CA, San Diego, 104–111, 2013.
Lensky, N. G., Dvorkin, Y., Lyakhovsky, V., Gertman, I., and Gavrieli, I.: Water, salt, and energy balances of the Dead Sea, Water Resour. Res., 41, W12418, https://doi.org/10.1029/2005WR004084, 2005.
Lowe, D. and Waltham, T.: A dictionary of karst and caves, Cave Studies Series, Vol. 6, British Cave Research Association, London, 1–40, 1995.
Meqbel, N. M. M., Ritter, O., and Group, D.: A magnetotelluric transect across the dead sea basin: Electrical properties of geological and hydrological units of the upper crust, Geophys. J. Int., 193, 1415–1431, https://doi.org/10.1093/gji/ggt051, 2013.
Monroe, W. H.: A glossary of karst terminology, in USGS Water Supply Paper 1899-K, Vol. 14, p. 26, 1970.
Nof, R., Abelson, M., Raz, E., Magen, Y., Atzori, S., Salvi, S., Baer, G., Nof, R. N., Abelson, M., Raz, E., Magen, Y., Atzori, S., Salvi, S., and Baer, G.: SAR Interferometry for Sinkhole Early Warning and Susceptibility Assessment along the Dead Sea, Israel, Remote Sens., 11, 89, https://doi.org/10.3390/rs11010089, 2019.
Polom, U., Alrshdan, H., Al-Halbouni, D., Holohan, E. P., Dahm, T., Sawarieh, A., Atallah, M. Y., and Krawczyk, C. M.: Shear wave reflection seismic yields subsurface dissolution and subrosion patterns: application to the Ghor Al-Haditha sinkhole site, Dead Sea, Jordan, Solid Earth, 9, 1079–1098, https://doi.org/10.5194/se-9-1079-2018, 2018.
Salameh, E. and El-Naser, H.: Changes in the Dead Sea Level and their Impacts on the Surrounding Groundwater Bodies, Acta Hydroch. Hydrob., 28, 24–33, 2000.
Salameh, E., Alraggad, M., and Amaireh, M.: Degradation processes along the new northeastern shores of the Dead Sea, Environ. Earth Sci., 78, 164, https://doi.org/10.1007/s12665-019-8155-x, 2019.
Sauro, U.: Closed depressions in karst areas, in: Encyclopedia of Caves, edited by: White, W. and Culver, D., Academic Press, 140–155, 2012.
Sawarieh, A., Al Addas, A., Al Bashish, M., and Al Seba'i, E.: Sinkholes Phenomena at Ghor Al Haditha Study Area, Internal Report No. 12, Amman, Jordan, 1–86, 2000.
Shalev, E. and Lyakhovsky, V.: Viscoelastic damage modeling of sinkhole formation, J. Struct. Geol., 42, 163–170, https://doi.org/10.1016/j.jsg.2012.05.010, 2012.
Shalev, E., Lyakhovsky, V., and Yechieli, Y.: Salt dissolution and sinkhole formation along the Dead Sea shore, J. Geophys. Res.-Sol. Ea., 111, B03102, https://doi.org/10.1029/2005JB004038, 2006.
Sneh, A.: Late Pleistocene Fan-Deltas Along the Dead Sea Rift, SEPM J. Sediment. Res., 49, 541–551, https://doi.org/10.1306/212F7784-2B24-11D7-8648000102C1865D, 1979.
Sweeting, M.: Karst Landforms, Columbia University Press, 1–362, 1973.
Taqieddin, S. A., Abderahman, N.S., and Atallah, M.: Sinkhole hazards along the eastern Dead Sea shoreline area, Jordan: a geological and geotechnical consideration, Environ. Geol., 39, 1237–1253, 2000.
Ten Brink, U. S. and Flores, C. H.: Geometry and subsidence history of the Dead Sea basin: A case for fluid-induced mid-crustal shear zone?, J. Geophys. Res., 117, B1, https://doi.org/10.1029/2011JB008711, 2012.
Torfstein, A., Haase-Schramm, A., Waldmann, N., Kolodny, Y., and Stein, M.: U-series and oxygen isotope chronology of the mid-Pleistocene Lake Amora (Dead Sea basin), Geochim. Cosmochim. Ac., 73, 2603–2630, https://doi.org/10.1016/J.GCA.2009.02.010, 2009.
Waltham, T.: Large collapse sinkholes, old and new, in the Obruk Plateau, Turkey, Cave Karst Sci., 42, 125–130, 2015.
Waltham, T., Bell, F., and Culshaw, M.: Sinkholes and Subsidence – Karst and Cavernous Rocks in Engineering and Construction, Springer, Chichester, 1–350, 2005.
Williams, P.: Dolines, in: Encyclopedia of Caves and Karst Science, edited by: Gunn, J., Taylor and Francis Group, New York, US, 304–310, 2003.
Yechieli, Y.: Fresh-Saline Ground Water Interface in the Western Dead Sea Area, Ground Water, 38, 615–623, https://doi.org/10.1111/j.1745-6584.2000.tb00253.x, 2000.
Yechieli, Y. and Gavrieli, I.: Will the Dead Sea die?, Geology, 26, 755–758, 1998.
Yechieli, Y., Magaritz, M., Levy, Y., Weber, U., Kafri, U., Woelfli, W., and Bonani, G.: Late Quaternary Geological History of the Dead Sea Area, Israel, Quaternary Res., 39, 59–67, https://doi.org/10.1006/qres.1993.1007, 1993.
Yechieli, Y., Wachs, D., Abelson, M., Crouvi, O., Shtivelman, V., Raz, E., and Baer, G.: Formation of sinkholes along the shore of the Dead Sea – Summary of the fi rst stage of investigation, Geol. Surv. Isr. Curr. Res., 13, 1–6, 2002.
Yechieli, Y., Abelson, M., Bein, A., Crouvi, O., and Shtivelman, V.: Sinkhole “swarms” along the Dead Sea coast: Reflection of disturbance of lake and adjacent groundwater systems, Bull. Geol. Soc. Am., 118, 1075–1087, https://doi.org/10.1130/B25880.1, 2006.
Yechieli, Y., Kafri, U., Wollman, S., Shalev, E., and Lyakhovsky, V.: The effect of base level changes and geological structures on the location of the groundwater divide, as exhibited in the hydrological system between the Dead Sea and the Mediterranean Sea, J. Hydrol., 378, 218–229, https://doi.org/10.1016/J.JHYDROL.2009.09.023, 2009.
Yechieli, Y., Abelson, M., and Baer, G.: Sinkhole formation and subsidence along the Dead Sea coast, Israel, Hydrogeol. J., 24, 601–612, https://doi.org/10.1007/s10040-015-1338-y, 2015.
Youssef, A. M., Al-Harbi, H. M., Gutiérrez, F., Zabramwi, Y. A., Bulkhi, A. B., Zahrani, S. A., Bahamil, A. M., Zahrani, A. J., Otaibi, Z. A., and El-Haddad, B. A.: Natural and human-induced sinkhole hazards in Saudi Arabia: distribution, investigation, causes and impacts, Hydrogeol. J., 24, 625–644, https://doi.org/10.1007/s10040-015-1336-0, 2015.