the Creative Commons Attribution 4.0 License.
the Creative Commons Attribution 4.0 License.
 | 09 Oct 2019
Fault interpretation in seismic reflection data: an experiment analysing the impact of conceptual model anchoring and vertical exaggeration
Clare E. Bond
Gareth Johnson
Armelle Kloppenburg
Oriol Ferrer
Rebecca Bell
Puy Ayarza
The use of conceptual models is essential in the interpretation of reflection seismic data. It allows interpreters to make geological sense of seismic data, which carries inherent uncertainty. However, conceptual models can create powerful anchors that prevent interpreters from reassessing and adapting their interpretations as part of the interpretation process, which can subsequently lead to flawed or erroneous outcomes. It is therefore critical to understand how conceptual models are generated and applied to reduce unwanted effects in interpretation results. Here we have tested how interpretation of vertically exaggerated seismic data influenced the creation and adoption of the conceptual models of 161 participants in a paper-based interpretation experiment. Participants were asked to interpret a series of faults and a horizon, offset by those faults, in a seismic section. The seismic section was randomly presented to the participants with different horizontal–vertical exaggeration (1:4 or 1:2). Statistical analysis of the results indicates that early anchoring to specific conceptual models had the most impact on interpretation outcome, with the degree of vertical exaggeration having a subdued influence. Three different conceptual models were adopted by participants, constrained by initial observations of the seismic data. Interpreted fault dip angles show no evidence of other constraints (e.g. from the application of accepted fault dip models). Our results provide evidence of biases in interpretation of uncertain geological and geophysical data, including the use of heuristics to form initial conceptual models and anchoring to these models, confirming the need for increased understanding and mitigation of these biases to improve interpretation outcomes.
- Article
(13857 KB) - Full-text XML
-
Supplement
(1470 KB) - BibTeX
- EndNote


Reflection seismic data are used to image and understand the subsurface structure of the earth, across scales and tectonic settings (e.g. Park et al., 2002; Simancas et al., 2003; Martí et al., 2008). As with other geophysical methods, seismic images are indirect representations of complex changes in the physical properties of rocks in the subsurface. Seismic images therefore carry inherent uncertainty related to the geological architecture, but also to the acquisition, processing and visualisation methods applied to the seismic data. These uncertainties combined make seismic images subject to multiple geological interpretations or, in other words, non-unique solutions (Frodeman, 1995; Rankey and Mitchell, 2003; Bond et al., 2007; Saltus and Blakely, 2011).
Geoscientists employ mental models (or “conceptual models”) that integrate their observations and that conform to their understanding of the world (Shipley and Tikoff, 2016). When confronted with geological data, interpreters need to apply different conceptual models, acquired during their training and past experience (through learning), together with robust interpretation methodologies, in order to produce interpretations that honour the data, particularly in areas of great uncertainty (Bond et al., 2007, 2015). Interpreters need to be able to identify the key elements (e.g. growth geometries, regional level) and employ different validation techniques (e.g. balancing or restoration) that allow differentiating between (a priori similar) conceptual models (Bond, 2015). The conceptual models therefore incorporate all the elements that shape the knowledge of the geologist of a certain aspect of the geology; for example, the conceptual model of a turbidite system will include characteristics about their origin and evolution, common stratigraphic sequences, lithological composition, and associated stratigraphic structures. These conceptual models are dynamically modified or renewed with the arrival of new observations (input information) and are used to produce predictions (inferences) that can help to answer questions about the world (Shipley and Tikoff, 2017). Conceptual models are therefore the basis of the interpretation, as they provide the necessary criteria to make sense of the data (Frodeman, 1995).
To deal with uncertainty, interpreters employ heuristics (or “rules of thumb”) in the process of generating the conceptual models, and that makes them subject to a broad range of cognitive biases (Kahneman et al., 1982). One of these biases is related to the capability of interpreters to adjust their interpretations from their initial ideas or conceptual models. This type of bias, called anchoring, has been identified in many decision-making processes since it was first described by Tversky and Kahneman (1974), and it takes place in the seismic interpretation process. Rankey and Mitchell (2003) investigated the effect of anchoring in an interpretation experiment by asking interpreters to reassess their seismic interpretations after being provided with additional well data. Their work shows that most interpreters did not feel that their interpretations needed to change substantially, in spite of data showing changes in porosity and net-to-gross predictions that did not fit with their initial interpretations. Their results suggest that interpreters were anchored to their initial conceptual models and that they were reluctant to change their mind in light of new data. In a different experiment, Bond et al. (2007) observed that participants asked for the geographical location of the section and suggested that interpreters could use this information to build their conceptual models, by using geographically specific knowledge of, for example, the relevant tectonic setting to anchor their interpretation. Hence, an interpreter knowing a seismic section was from the North Sea may assume a conceptual model based on an extensional tectonic regime and will consciously and unconsciously look for normal faults in the seismic data. However, if the conceptual model is wrong (e.g. there is significant inversion in the seismic section), the interpretation could be compromised. So although conceptual models can be dynamically modified or renewed with the arrival of new observations, as described by Shipley and Tikoff (2017) and others, anchoring bias often results in limited adjustment from initial models. Thus, although conceptual models are needed to develop geologically sound interpretations, they can also create anchors to potentially erroneous outcomes.
The use of tectono-sedimentary conceptual models in seismic interpretation has been extensively documented in the literature (e.g. Strecker et al., 1999; Nielsen et al., 2008; Alcalde et al., 2014). Understanding what elements influence conceptual model development and application in seismic interpretations is useful to better grasp how interpretations are made. Applying the appropriate conceptual models requires assessment, by the interpreter, of objective uncertainty, such as considering errors in data processing or acquisition, and of subjective elements, such as the potential biases they bring to the interpretation from their background and experience (Bond, 2015). Alcalde et al. (2017c) argue that image presentation also has a subdued effect in the way seismic image data are perceived and interpreted. Here, we develop this theme investigating how presentation of vertically exaggerated seismic image data influences conceptual model choice and application, and the subsequent interpretation outcome.
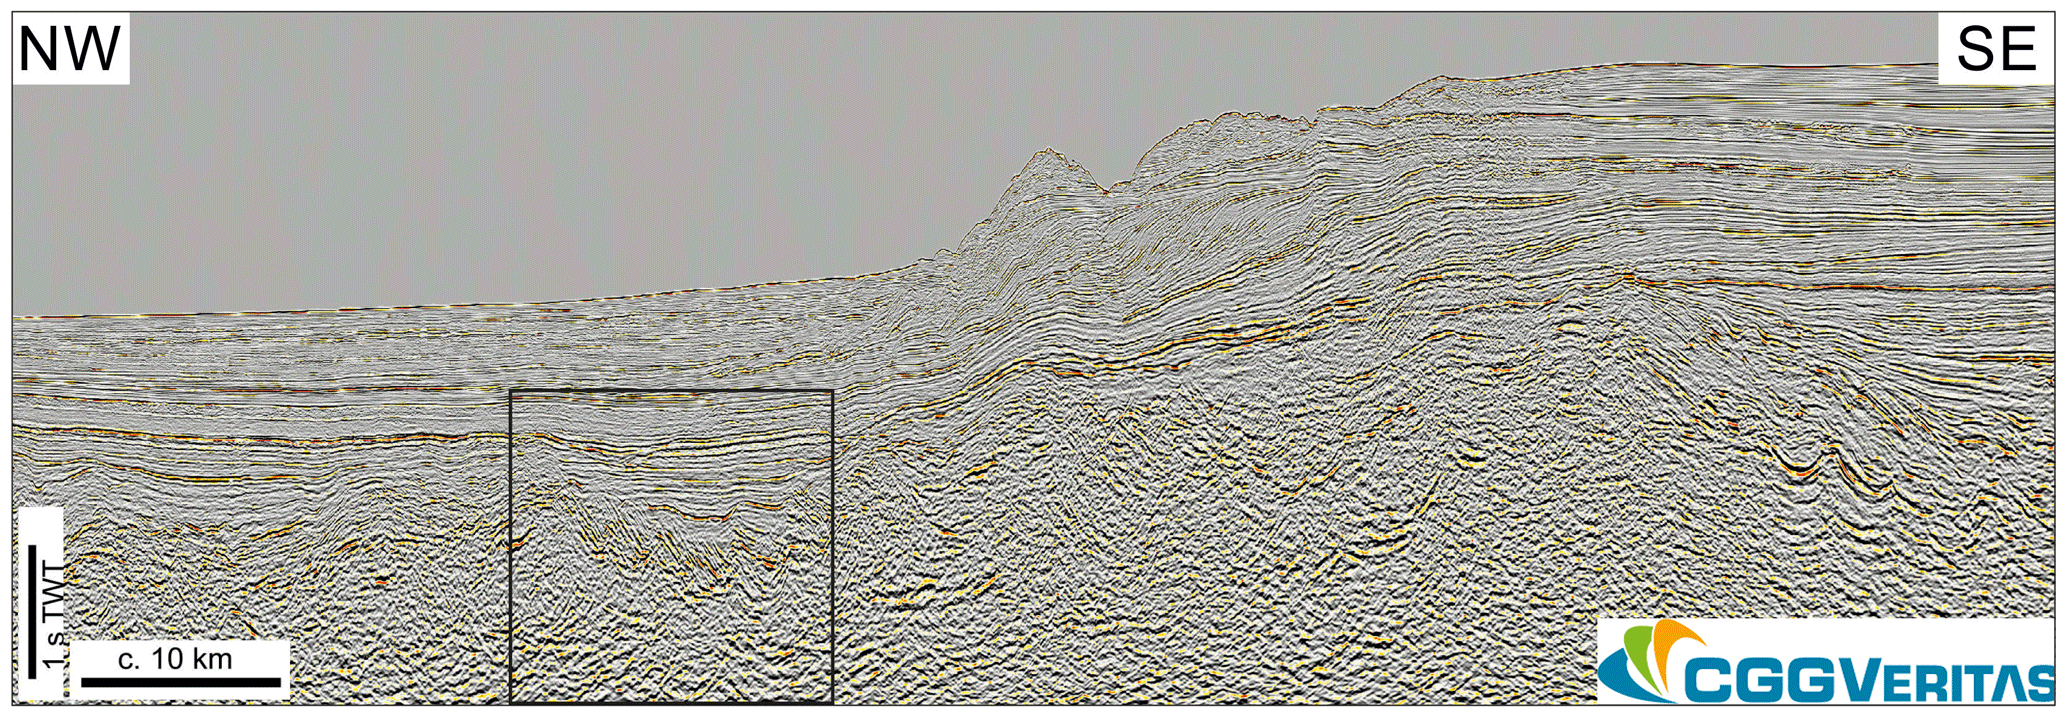
Figure 1Regional seismic image from the Browse Basin (NW Australia). The black box marks the area of the section used in the interpretation experiment. Note that the vertical exaggeration of the image is high (1:8). The full section, with approximately no vertical exaggeration (i.e. 1:1 display), can be downloaded from the VSA website (https://www.seismicatlas.org/entity?id=b39b298b-20fa-4944-a9b8-66b72d3a9ca8, last access: 30 September 2019).
Modern computer-based methods provide important advantages to the interpretation of seismic data, such as the generation of 3-D models, attribute analysis or the easy access to multiple display options (e.g. change in scales, colour palettes). However, the use of computers generally results in the on-screen interpretation of a vertically exaggerated seismic image, due to the conflicting ratios of a 1:1 seismic image with screen dimensions (Bond, 2015). Furthermore, most 2-D seismic cross sections published in the literature are displayed vertically exaggerated (Stewart, 2011), although it is likely that multiple displays were employed during the interpretation stage. Vertical exaggeration of seismic image data creates images with apparent reflection continuity and exaggerates dips of structures and horizons. Conscious application of seismic image stretching is used in the seismic interpretation process because it helps to enhance certain aspects of the display that ease the interpretation (Stewart, 2011). It helps for instance to amplify low-relief structures, which appear otherwise compressed and difficult to differentiate (Feagin, 1981; Bertram and Milton, 1996). For example, Brothers et al. (2009) report that vertical exaggeration helped them to delineate small changes in stratal geometry, otherwise imperceptible, in their seismic interpretation study of the Salton Sea. Vertical exaggeration can also be used to mitigate the difference between vertical and horizontal sampling, which can be considerable depending on the acquisition parameters, the impact of which is to make images appear stretched (Stewart, 2011). These examples highlight the usefulness of scale variation during interpretation.
However, changes in appearance of seismic image data through, subconscious or conscious, vertical exaggeration change an interpreter's perception of an image. The change in image character is often unintentional and can result in unwanted perceptual bias during interpretation. This can subsequently lead to misinterpretations, particularly if the interpreted geological structures are complex (Stone, 1991). Vertical exaggeration can also make features, like gas escape chimneys, appear narrower than they are (Horozal et al., 2009). Black et al. (1994) noticed that vertically exaggerated seismic sections can result in gently dipping reflections being perceived as more steeply dipping, which may lead to the erroneous conclusion that migration of the seismic data is required. Similarly, Stewart (2012) investigated the impact of vertical exaggeration on fault dip and observed that structural restoration of interpretations conducted in exaggerated sections lead to unrealistic subsurface models. Thus, vertical exaggeration in seismic interpretation can have positive and negative influences on interpreter perception of the image and interpretation outcome.
Here we test the theory that the presentation of seismic image data in a vertically exaggerated format impacts the perceptions of interpreters, influencing the conceptual models they apply in their interpretation and their outcome. We focus on analysis of fault and horizon interpretations in a clipped seismic image. Interpreters were randomly presented with different vertical exaggerations (1:2 and 1:4) of the same seismic image. Statistical analysis of fault and horizon placement – fault dip angle, fault dip direction and fault type – allows us to draw conclusions on the effect of vertical exaggeration on interpretation.
The interpretation experiment consisted of a ca. 15 km long clipped portion from a 2-D seismic image from the Browse Basin, NW Australia (Fig. 1) available on the Virtual Seismic Atlas (https://www.seismicatlas.org, last access: 30 September 2019). This seismic image has been interpreted as a series of normal faults dipping to the NW (left-hand side of the section) overlain by post-tectonic sediments, These faults could potentially have been formed in the Late Carboniferous to Early Permian rifting event (Struckmeyer et al., 1998; Keep and Moss, 2000). The area has undergone different stages of reactivation since the Early Triassic, so inversion structures can also be found (Keep and Moss, 2000).
The section used in this experiment was originally downloaded with no vertical exaggeration (i.e. with an approximate horizontal to vertical ratio of 1:1), according to the Virtual Seismic Atlas information. In a series of interpretation experiments, the seismic image was presented to participants with horizontal to vertical exaggeration of 1:4 (Fig. 2a) or 1:2 (Fig. 2b), hereafter called “1:4” and “1:2” sections. The sections were presented in two-way travel time (TWT), and no information about the actual depth of the sections was provided. The participants were asked to “interpret the main faults crossing the section as deep as possible”, as well as to add a “sedimentary horizon to mark the displacement”, and they were given 15–30 min to complete their interpretations. The experiment as presented to the participants can be found in the Supplement.
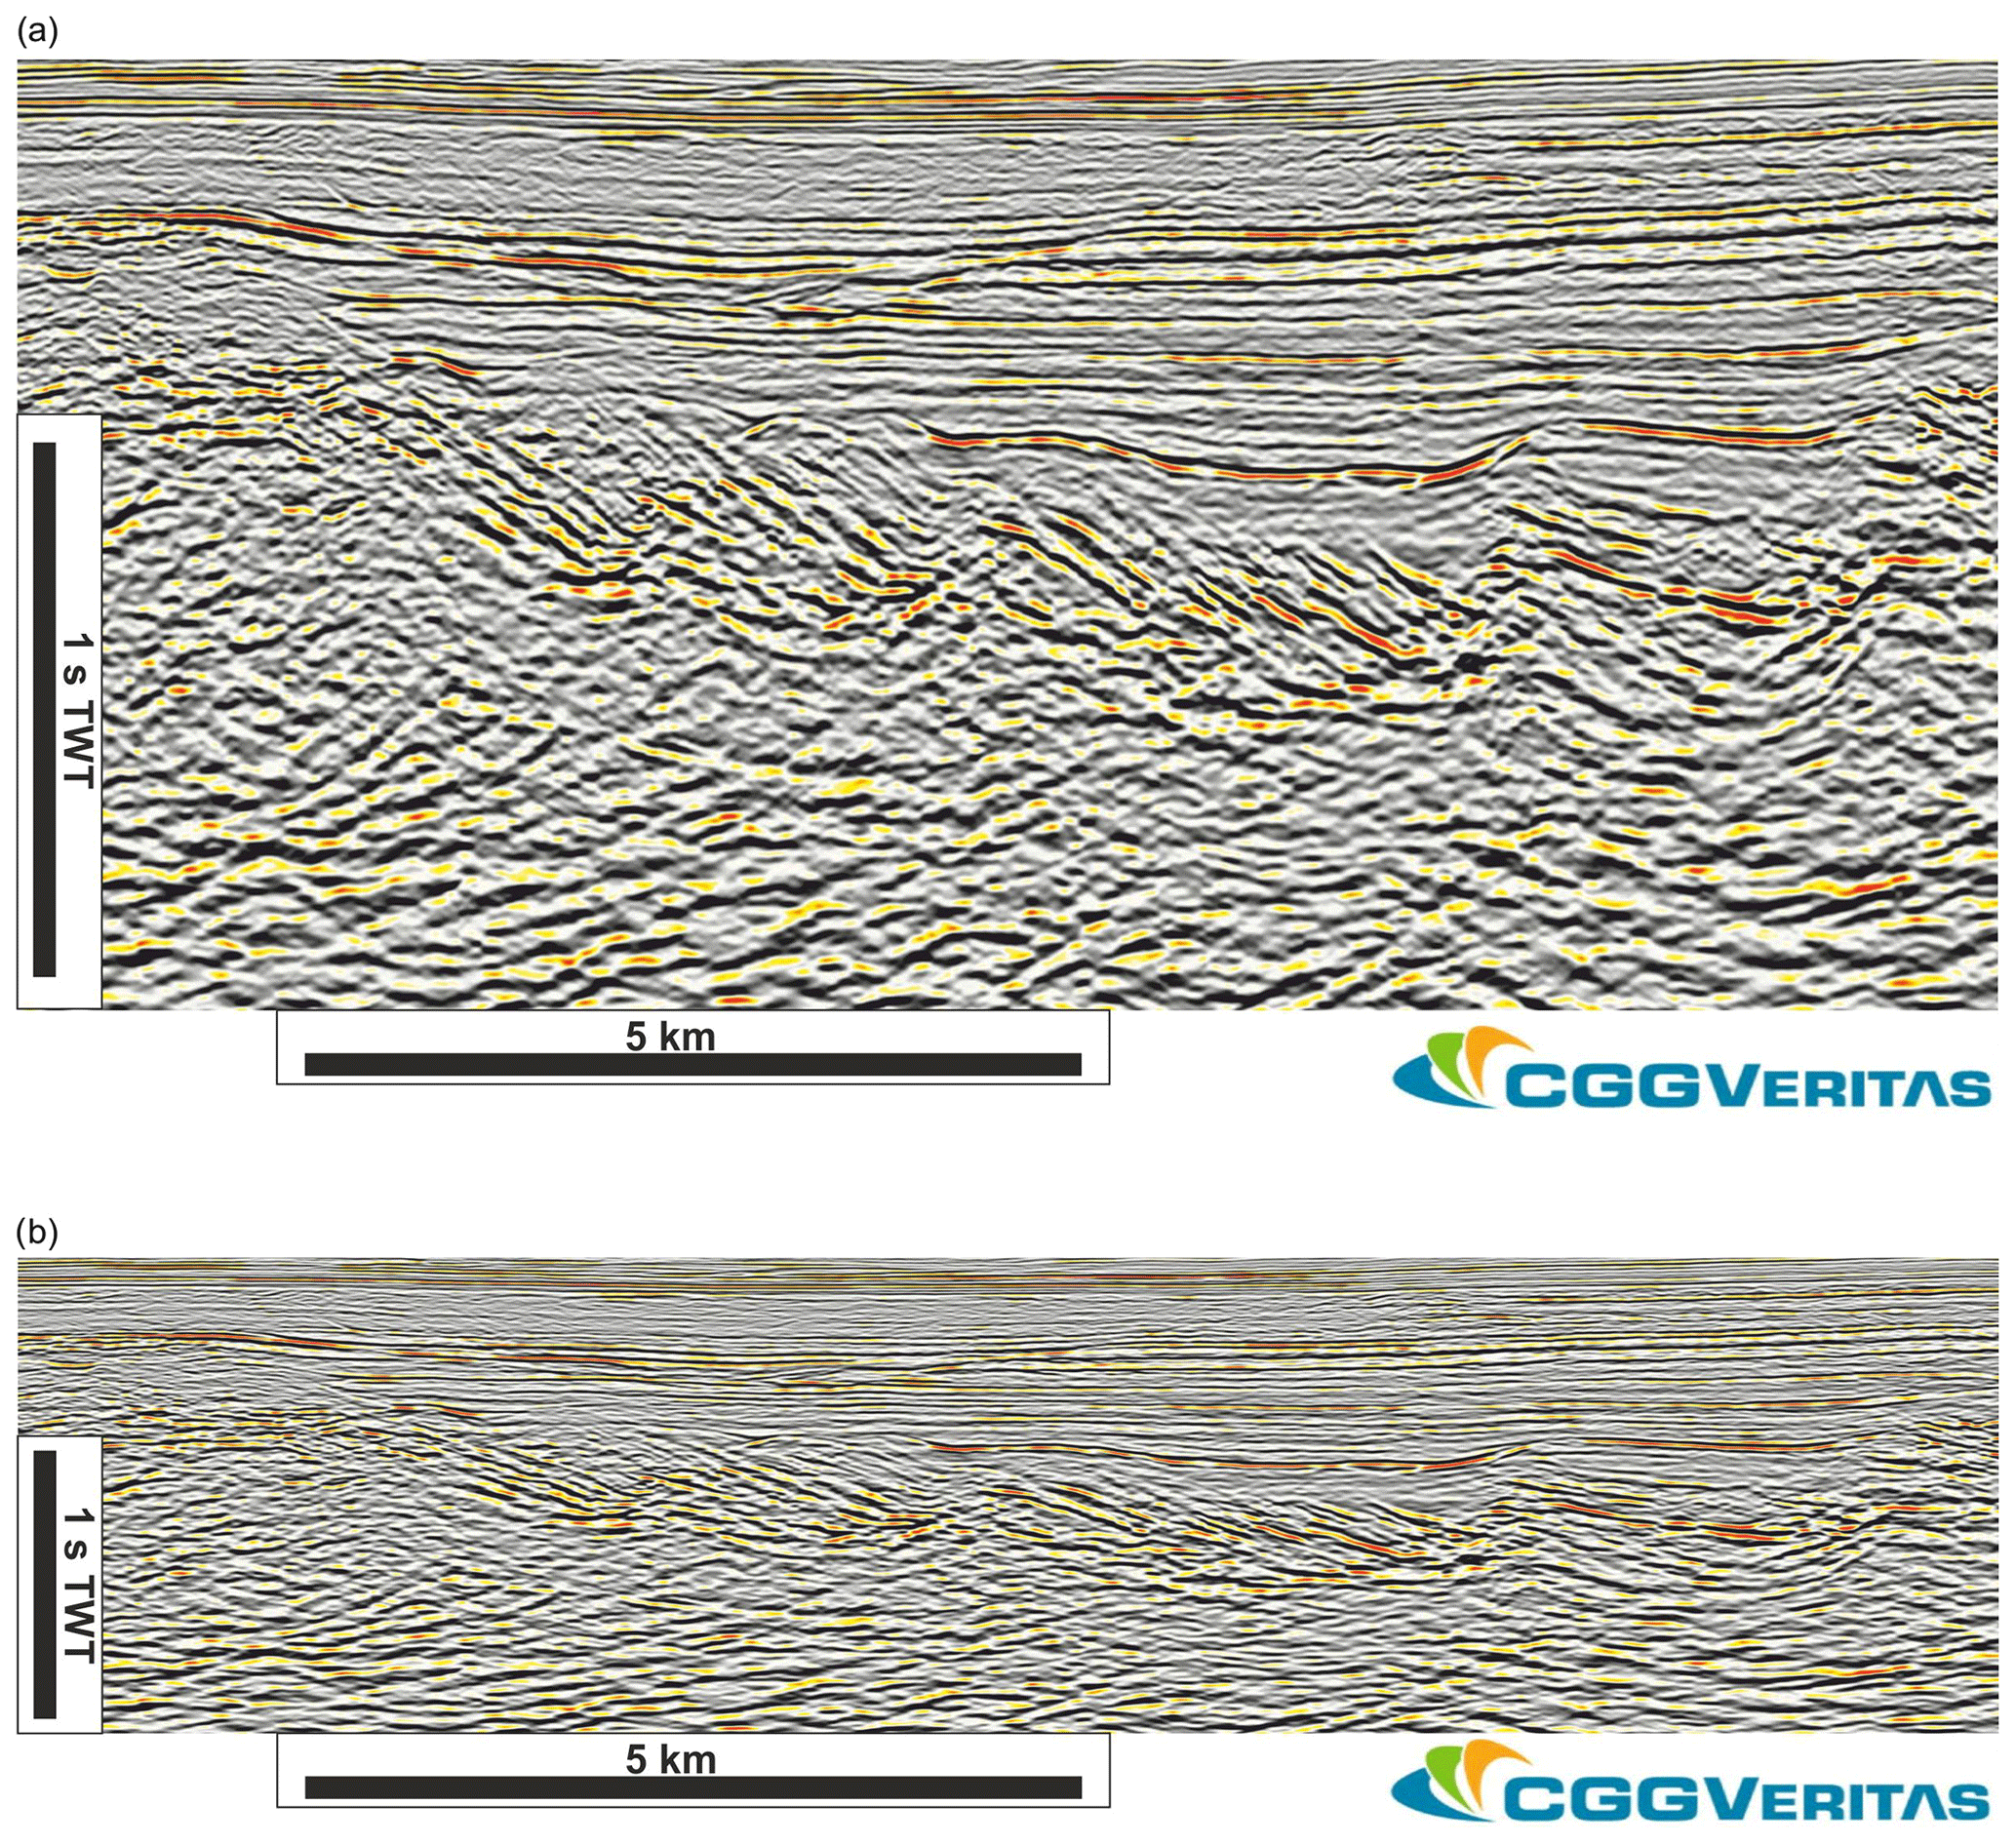
Figure 2Seismic sections used in the interpretation experiment with (a) 1:4 vertical exaggeration and (b) 1:2 vertical exaggeration. These figures are portions of the full section in Fig. 1, and that can be downloaded from the VSA website (https://www.seismicatlas.org/entity?id=b39b298b-20fa-4944-a9b8-66b72d3a9ca8, last access: 30 September 2019).
The participants also completed an anonymous questionnaire designed to collect information about their background, training, knowledge, and experience in structural geology and seismic interpretation. The interpretation experiment was completed by 161 students of which 126 participants (78 % of the total) were undergraduate students and 35 participants (22 % of the total) were postgraduate students, from different universities in the UK, France and Spain. The participants have mostly geology (72.5 %) and geophysics (12.5 %) backgrounds and considered themselves as having basic to good proficiency in structural geology and seismic interpretation (>93 % of the participants). We focused this experiment only on students to observe the potential variability in interpretation of the same section in a group of people with similar experience and background.
The two vertically exaggerated seismic images were assigned randomly to the participants: the 1:2 section was interpreted 88 times (55 %) and the 1:4 section 72 times (45 %). The interpretation results were digitised manually and then converted to a 1:1 vertical exaggeration () for comparison; therefore, the fault dip angles presented in this work are in time. As the sections were interpreted in TWT, the analysed dips of the faults are not true dips (i.e. these observed in sections in depth), but their relative differences are still comparable. Individual examples of the interpretation results after digitisation from both the 1:2 and 1:4 sections are shown in Fig. 3.
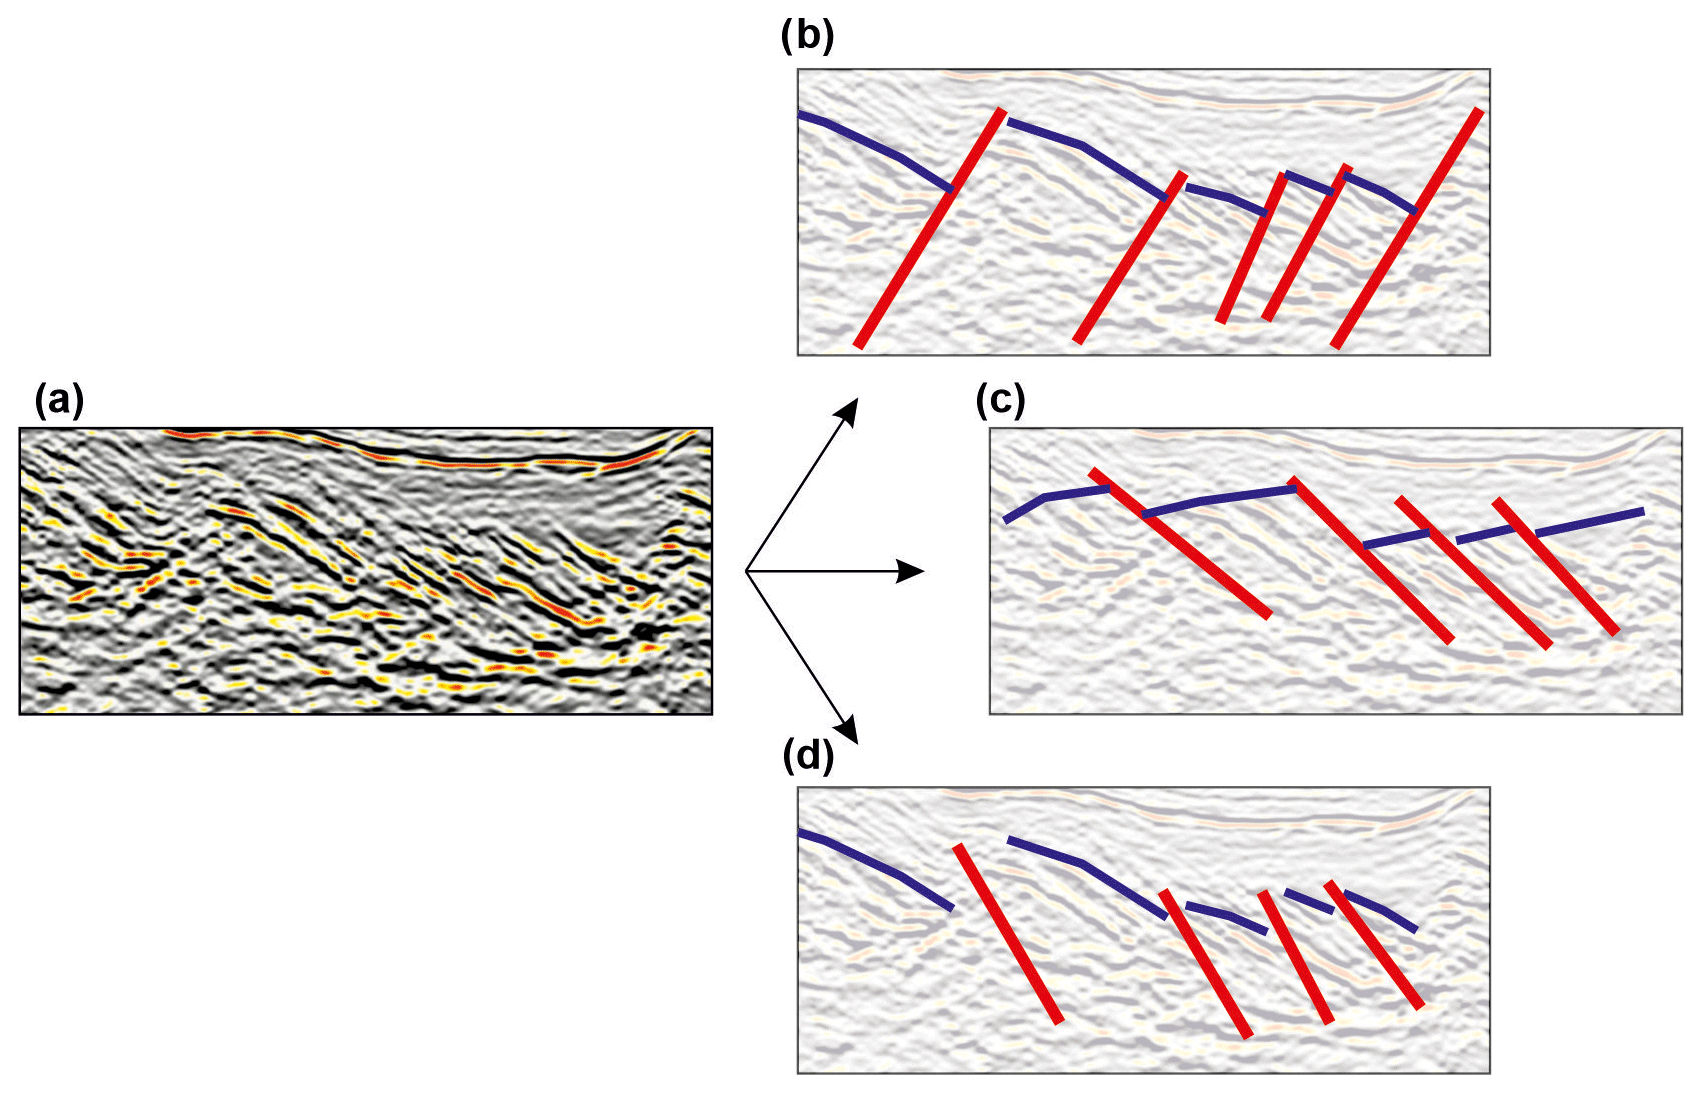
Figure 3The seismic section and sketch interpretations of the three interpretation models applied in interpretations of the seismic section (a) by participants: (b) left-dipping normal faults (in red) with right-dipping horizons (in blue), (c) right-dipping normal faults with left-dipping horizons, and (d) right-dipping reverse faults with right-dipping horizons.
Initially, interpretations were grouped based on fault dip direction, to the left or to the right. Fifteen interpretations (9.4 % of the total) corresponding to equivocal, blank, or interpretations with faults dipping in both directions (e.g. systems of faults and their conjugates) were not included in further analysis. Of the remaining 119 interpretations, most participants interpreted faults dipping to the right (67 interpretations, 56 % of the total interpretations), rather than to the left (52 interpretations, 44 % of the total) (Fig. 4). The relative proportion is greater in the 1:4 sections (39 interpretations to the right, 59 %) compared to the 1:2 sections (28 interpretations to the right, 53 %). These two groupings were identified as it was apparent that participants interpreting faults dipping to the right and those interpreting faults dipping to the left had employed two different conceptual models to the data. This resulted in four datasets with two pairs of properties (i.e. 1:2-left, notified as “1:2L”, 1:2-right or “1:2R”, 1:4-left or “1:4L”, and 1:4-right “1:4R”) that were further analysed in detail. This subdivision allows us to study whether the potential differences can be attributed to the section interpreted (i.e. 1:2 or 1:4) or to the conceptual model used in the interpretation.
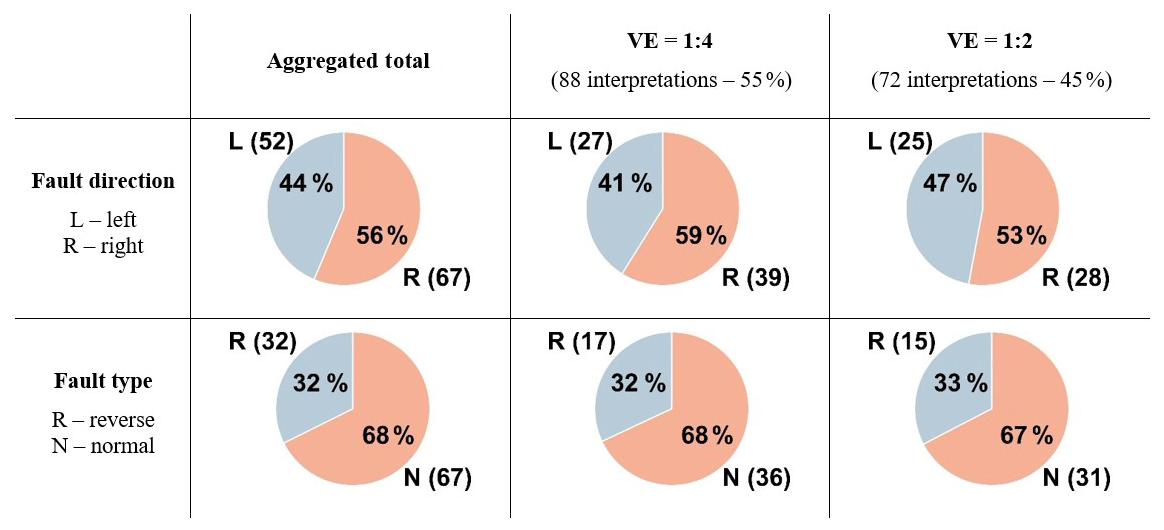
Figure 4Statistics for the interpreted fault directions (left “L” or right “R”), and motions (normal “N” or reverse “R”) in the sections with 1:4 and 1:2 vertical exaggeration (“VE”). The number of participants is given in brackets. Note that ambiguous interpretations (e.g. left + right-dipping fault interpretations, or no faults interpreted), corresponding to 41 interpreters (25.6 % of the total), were excluded from the count.
We analysed the fault type (i.e. normal or reverse) and measured the fault dip angle interpreted by the participants. The fault type results do not show significant differences between the 1:2 and 1:4 section interpretations, with 32 %–33 % of the participants interpreting reverse faults and 67 %–68 % interpreting normal faults (Fig. 4). However, difference in fault type can be correlated to the dip direction of the fault (Fig. 5). Only one participant (3 %) amongst the leftward-dipping datasets (i.e. 1:2L and 1:4L) interpreted the fault motion as reverse, while the vast majority (35 participants, 97 % of the total) interpreted leftward-dipping normal faults. In contrast, most rightward-dipping faults were interpreted as reverse (31 interpretations, 56 %) instead of normal (24 interpretations, 44 %). This result is more pronounced in the 1:4R, with 61 % of faults interpreted as reverse (14 interpretations), compared to the 53 % in the 1:2R (17 interpretations).
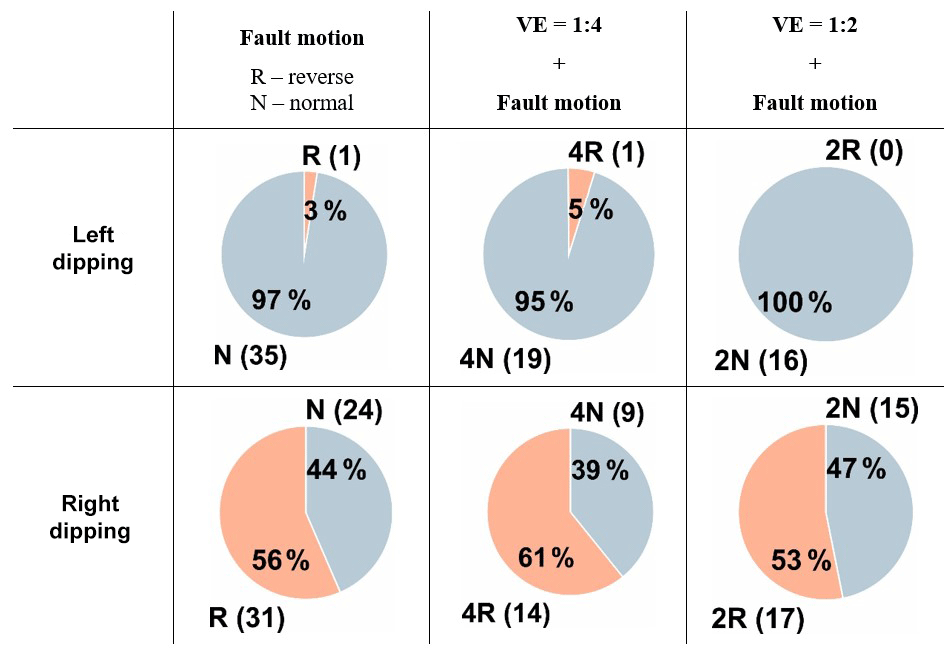
Figure 5Statistics for the interpreted fault directions (left “L” or right “R”), and motions (normal “N” or reverse “R”), separated by vertical exaggeration (“VE”) 1:2 or 1:4.
The dip angles of the faults were calculated by drawing a horizontal line at the approximate mid-depth point (1.1 ms TWT) of the seismic section, with the aim of crossing the majority of the faults around their midpoint. Similar numbers of fault interpretations were made on the 1:4 section (a total 300 faults interpreted by 72 participants, over 4 faults interpreted per participant) and the 1:2 section (272 faults by 88 participants, over 3 faults interpreted per participant) (Fig. 6). The fault dip angle analyses were compared across the four datasets (Fig. 7). The largest difference between the 1:4 and 1:2 sections is highlighted here, with the median dip angle of faults of 22∘ in the rightward-dipping, reverse 1:4 section vs. 16∘ in the 1:2 section (Fig. 7c and d). The differences in normal interpretations, either leftward-dipping (Fig. 7a and b) or rightward-dipping faults (Fig. 7e and f), show only differences of 2–3∘, and therefore are less conclusive. The fault dip of the only participant interpreting leftward-dipping, reverse faults was 23∘ on average, slightly higher than the other two groups.

Figure 6Rose diagrams showing the dips of interpreted faults. Fault dips interpreted at a vertical exaggeration of (a) 1:4, (b) 1:2, (c) 1:4 dipping rightward (“R”), (d) 1:2 dipping rightward, (e) 1:4 dipping leftward (“L”) and (e) 1:2 dipping leftward. The “n” marks the number of faults analysed. “SD” stands for standard deviation.
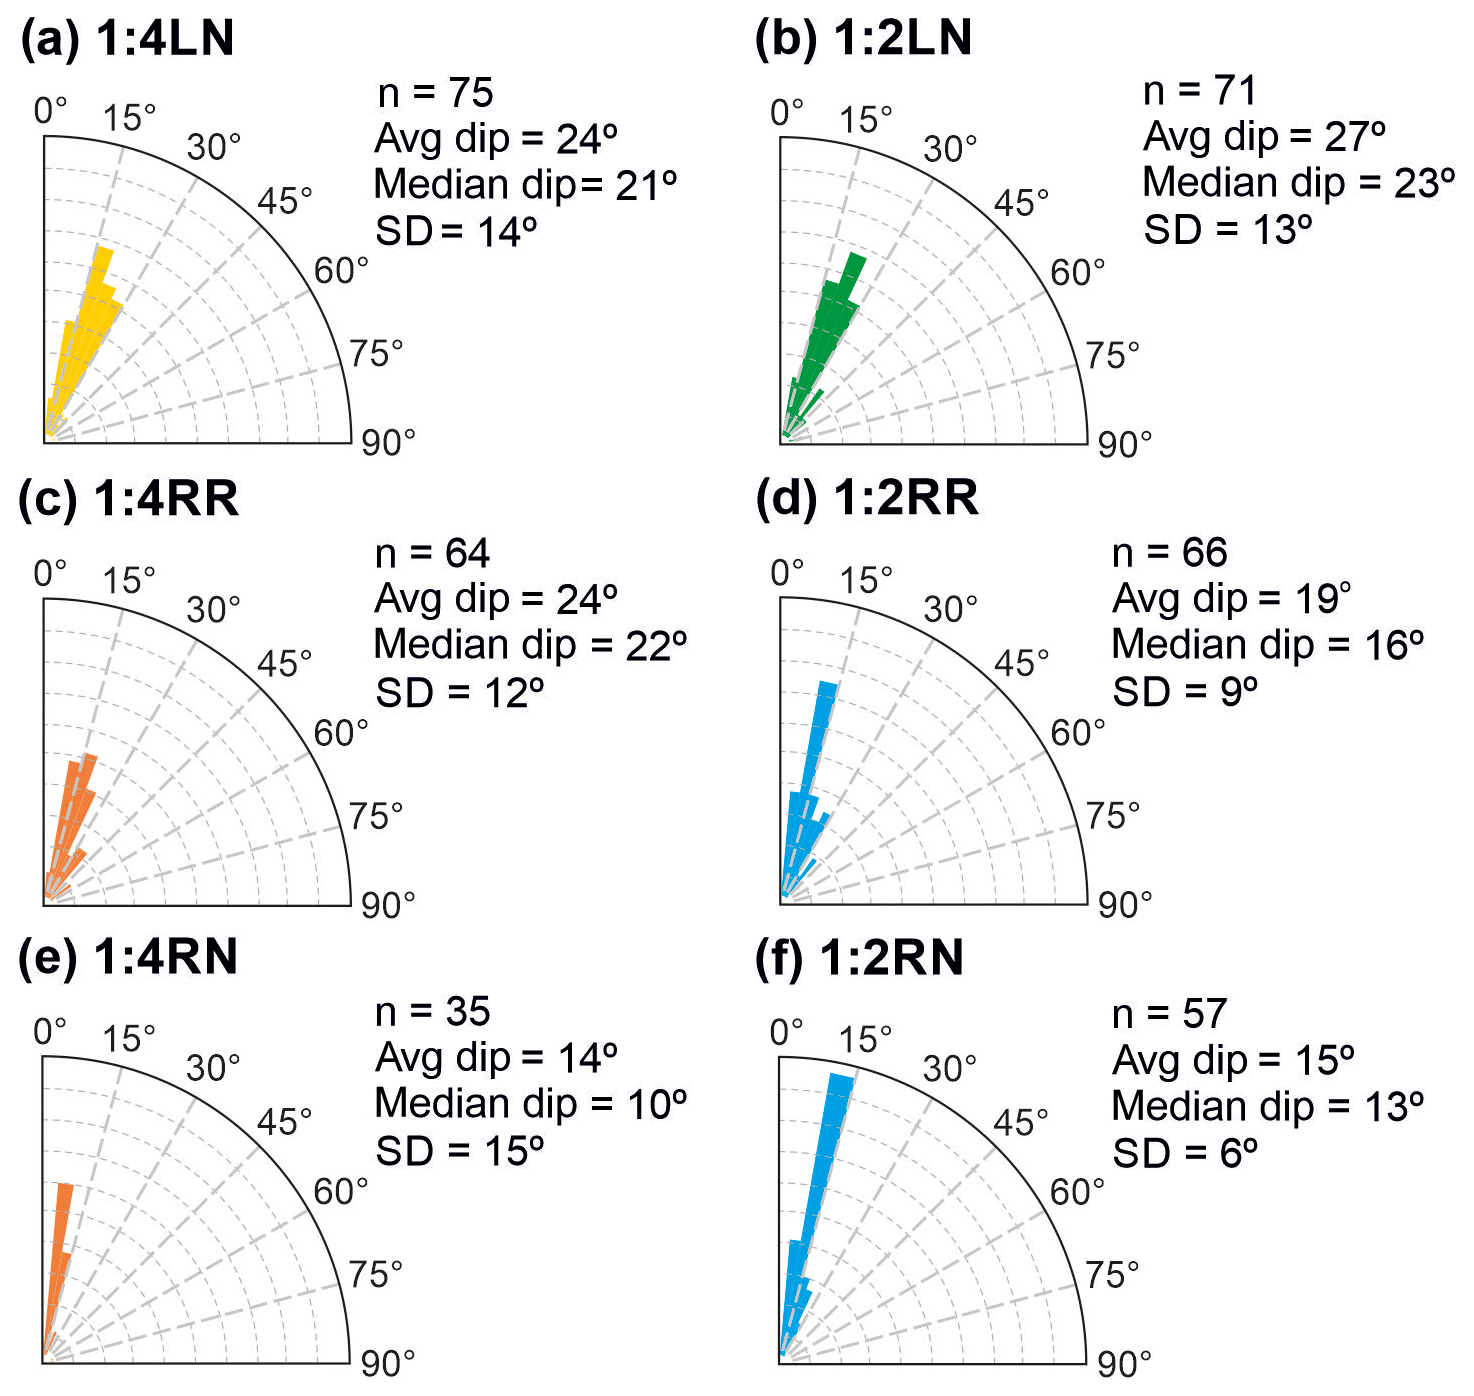
Figure 7Rose diagrams showing the dips of interpreted faults and their motion. Fault dips interpreted at a vertical exaggeration of (a) 1:4, leftward-dipping and normal; (b) 1:2, leftward-dipping and normal; (c) 1:4, rightward-dipping and reverse; (d) 1:2, rightward-dipping and reverse; (e) 1:4, rightward-dipping and normal; (f) 1:2, rightward-dipping and normal. Note that there are fewer faults presented here than in Fig. 6 due to fewer participants interpreting the fault motion. The n marks the number of faults analysed. SD stands for standard deviation.
To check whether other factors – specifically, educational background and experience – influenced interpretation outcome, we also analysed the data for disparities between different university cohorts and between undergraduate and postgraduate students. There are no major differences in the analysed results across student cohorts from different universities or between undergraduate and postgraduate students. For the latter cohort the difference in numbers (undergraduate (126) vs. postgraduate (35) students) is large and does not allow easy comparison; despite this the ratios of leftward- and rightward-dipping faults and the sense of offset are consistent across the cohorts. The effect of level of education and experience in seismic interpretation has been raised in the past (e.g. Bond et al., 2012; Alcalde et al., 2017b), and we suggest that this is still an area of interest for future work.
4.1 Conceptual model anchoring
Analysis of participants' interpretations shows that fault interpretations in the seismic image fall into three main categories (Fig. 3): (1) leftward-dipping normal faults with right-dipping horizons (Fig. 3b), (2) rightward-dipping thrust faults with right-dipping horizons (Fig. 3c), and (3) rightward-dipping normal faults with left-dipping horizons (Fig. 3d). Only one interpretation showed leftward-dipping faults with left-dipping horizons and marked the motion of the faults as reverse (Fig. 5). In addition, this interpretation did not show any evidence of correlating horizons across the fault and simply used arrows to mark the motion instead. The low number of interpretations of this type (one) and the difficulty in correlation suggests that interpreting left-dipping faults with reverse fault motions is largely impossible, given the reflection seismic characteristics of the data.
Faults and horizons (red and blue lines in Fig. 3, respectively) are interpreted in three ways: (1) along left-dipping discontinuous and chaotic reflections, these align with breaks in rightward-dipping reflections that together give the appearance of a leftward-dipping chaotic seismic fabric (Fig. 3b); (2) along “packages” of right-dipping reflections with greater continuity (Fig. 3c); and (3) at an angle to these right-dipping reflections where reflection continuity is less strong (Fig. 3d). Irrespective of the vertical exaggeration of the seismic image interpreted, most participants interpreted faults dipping rightward instead of leftward (Fig. 4). At the same time, the majority of rightward-dipping faults (56 %) were interpreted as reverse, in contrast to leftward-dipping faults, which are mostly interpreted as normal (97 %) (Fig. 7). We suggest that this is a consequence of the seismic reflection characteristics of the different features that are being interpreted as faults and horizons. The continuity of the rightward-dipping reflections makes them a more “certain” interpretation than the leftward-dipping fabric. When the rightward-dipping reflections are interpreted as horizons, leaving the left-dipping fabric to be interpreted as faults, this invariably leads to interpretation of faults with normal offsets due to the angular relationship between the fault and horizon interpretations and potentially due to the participants interpretation, consciously or subconsciously, of the nature and geometries of the basin sediments above (Fig. 3b). When the rightward-dipping reflections are interpreted as faults, the sedimentary packages are harder to interpret and horizon interpretations are often forced to cut reflections (Fig. 3d). When participants have interpreted faults at an angle to the rightward-dipping reflections, where reflection continuity is less strong, this results in steeper fault dip angles, and interpreters often interpret the rightward-dipping reflections as sedimentary packages in horsts between reverse faults (Figs. 3c and 7).
In summary, from the analysis of the fault and horizon interpretations of participants, three conceptual models are identified (Fig. 3) that have been applied in interpretations of the data. What we do not know is how the individual participants honed onto their “chosen” conceptual model. The participants were prompted to interpret the faults as their main task in the experiment instructions and as a secondary element to interpret a horizon to show fault motion; an interpretation sequence is shown in Fig. 9. We should state that we cannot be sure that all participants followed this workflow, but we have no evidence to suggest that they did not. Irrespective of the exact interpretation sequence, we suggest that once participants started interpreting certain “features” in the reflection seismic image data as faults or horizons, they became anchored to an initial conceptual model and fitted the rest of their interpretation to this model. Consequently, we suggest that interpreters were likely anchored to their initial thoughts on the direction of dip of the faults; the rest of their interpretation is determined by this initial fault model, irrespective of whether later interpretative elements conform to the data (e.g. horizons cutting reflections), as seen in Fig. 3; this has previously been reported by Rankey and Mitchell (2003) and Torvela and Bond (2011). However, there appears to be a threshold of tolerance for data dis-confirmation. Note that no leftward-dipping faults with a reverse sense of motion have been interpreted, in which horizons would very distinctively have cut seismic reflectors (see Fig. 9d).
Experience and knowledge are expected to have played a key role in informing the initial observations that led to selection of a conceptual model at the beginning of the interpretation. We purposely chose a student-only cohort to mitigate against the competing effects of experience and knowledge with other factors we wanted to test. To ensure this was the case we have analysed the data for differences in interpretation outcome between students from different universities and between undergraduate and postgraduate students. This analysis shows no strong evidence that experience had an effect on interpretation outcome.
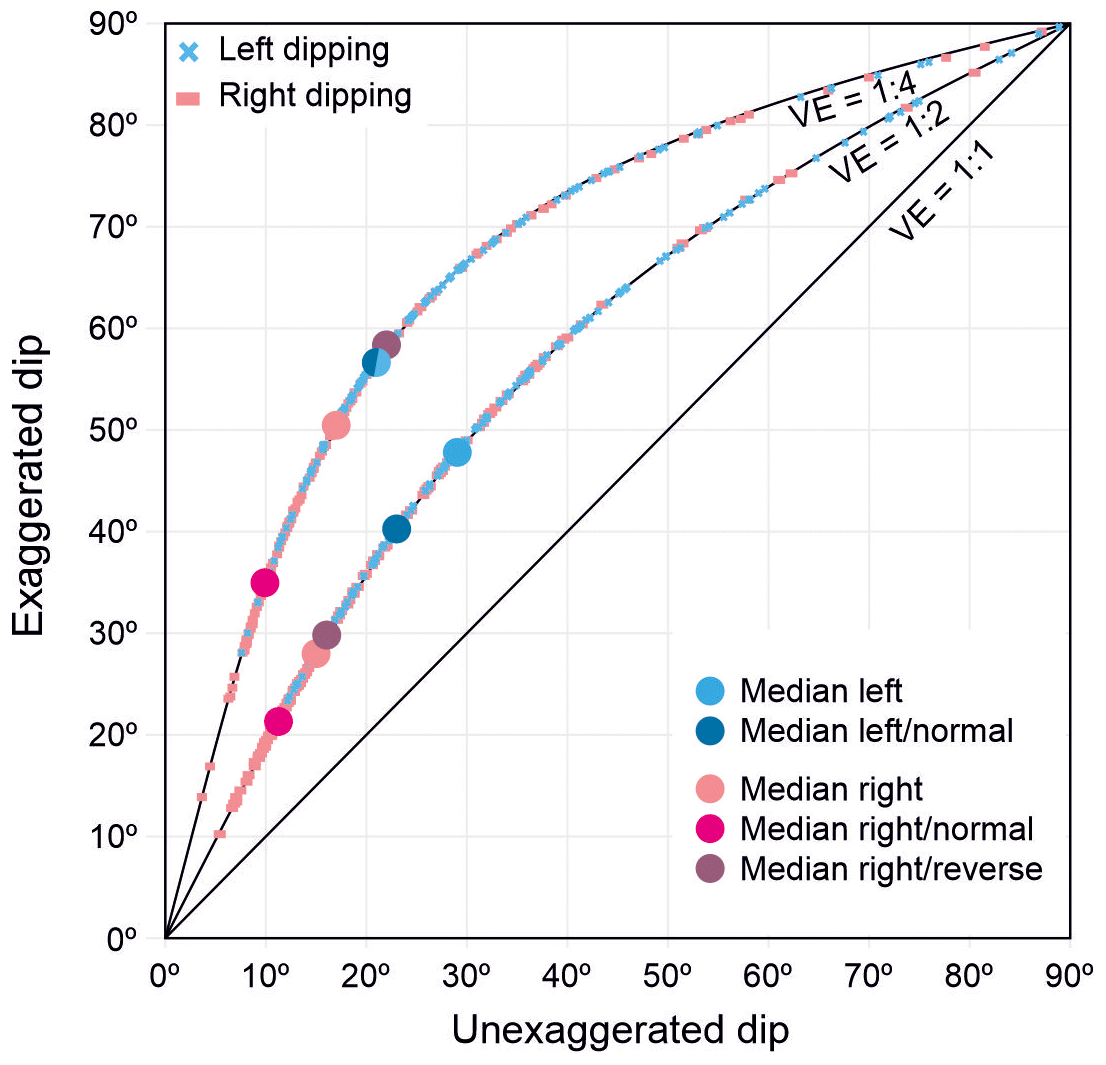
Figure 8Graph adapted from Stewart (2011) showing exaggerated and unexaggerated dip values for all fault interpretations, showing the average fault dips for leftward- and rightward-dipping faults interpreted at 1:2 and 1:4 vertical exaggeration. The medians of the dip direction and fault motion subcohorts are also presented in the 1:2 and 1:4 curves.
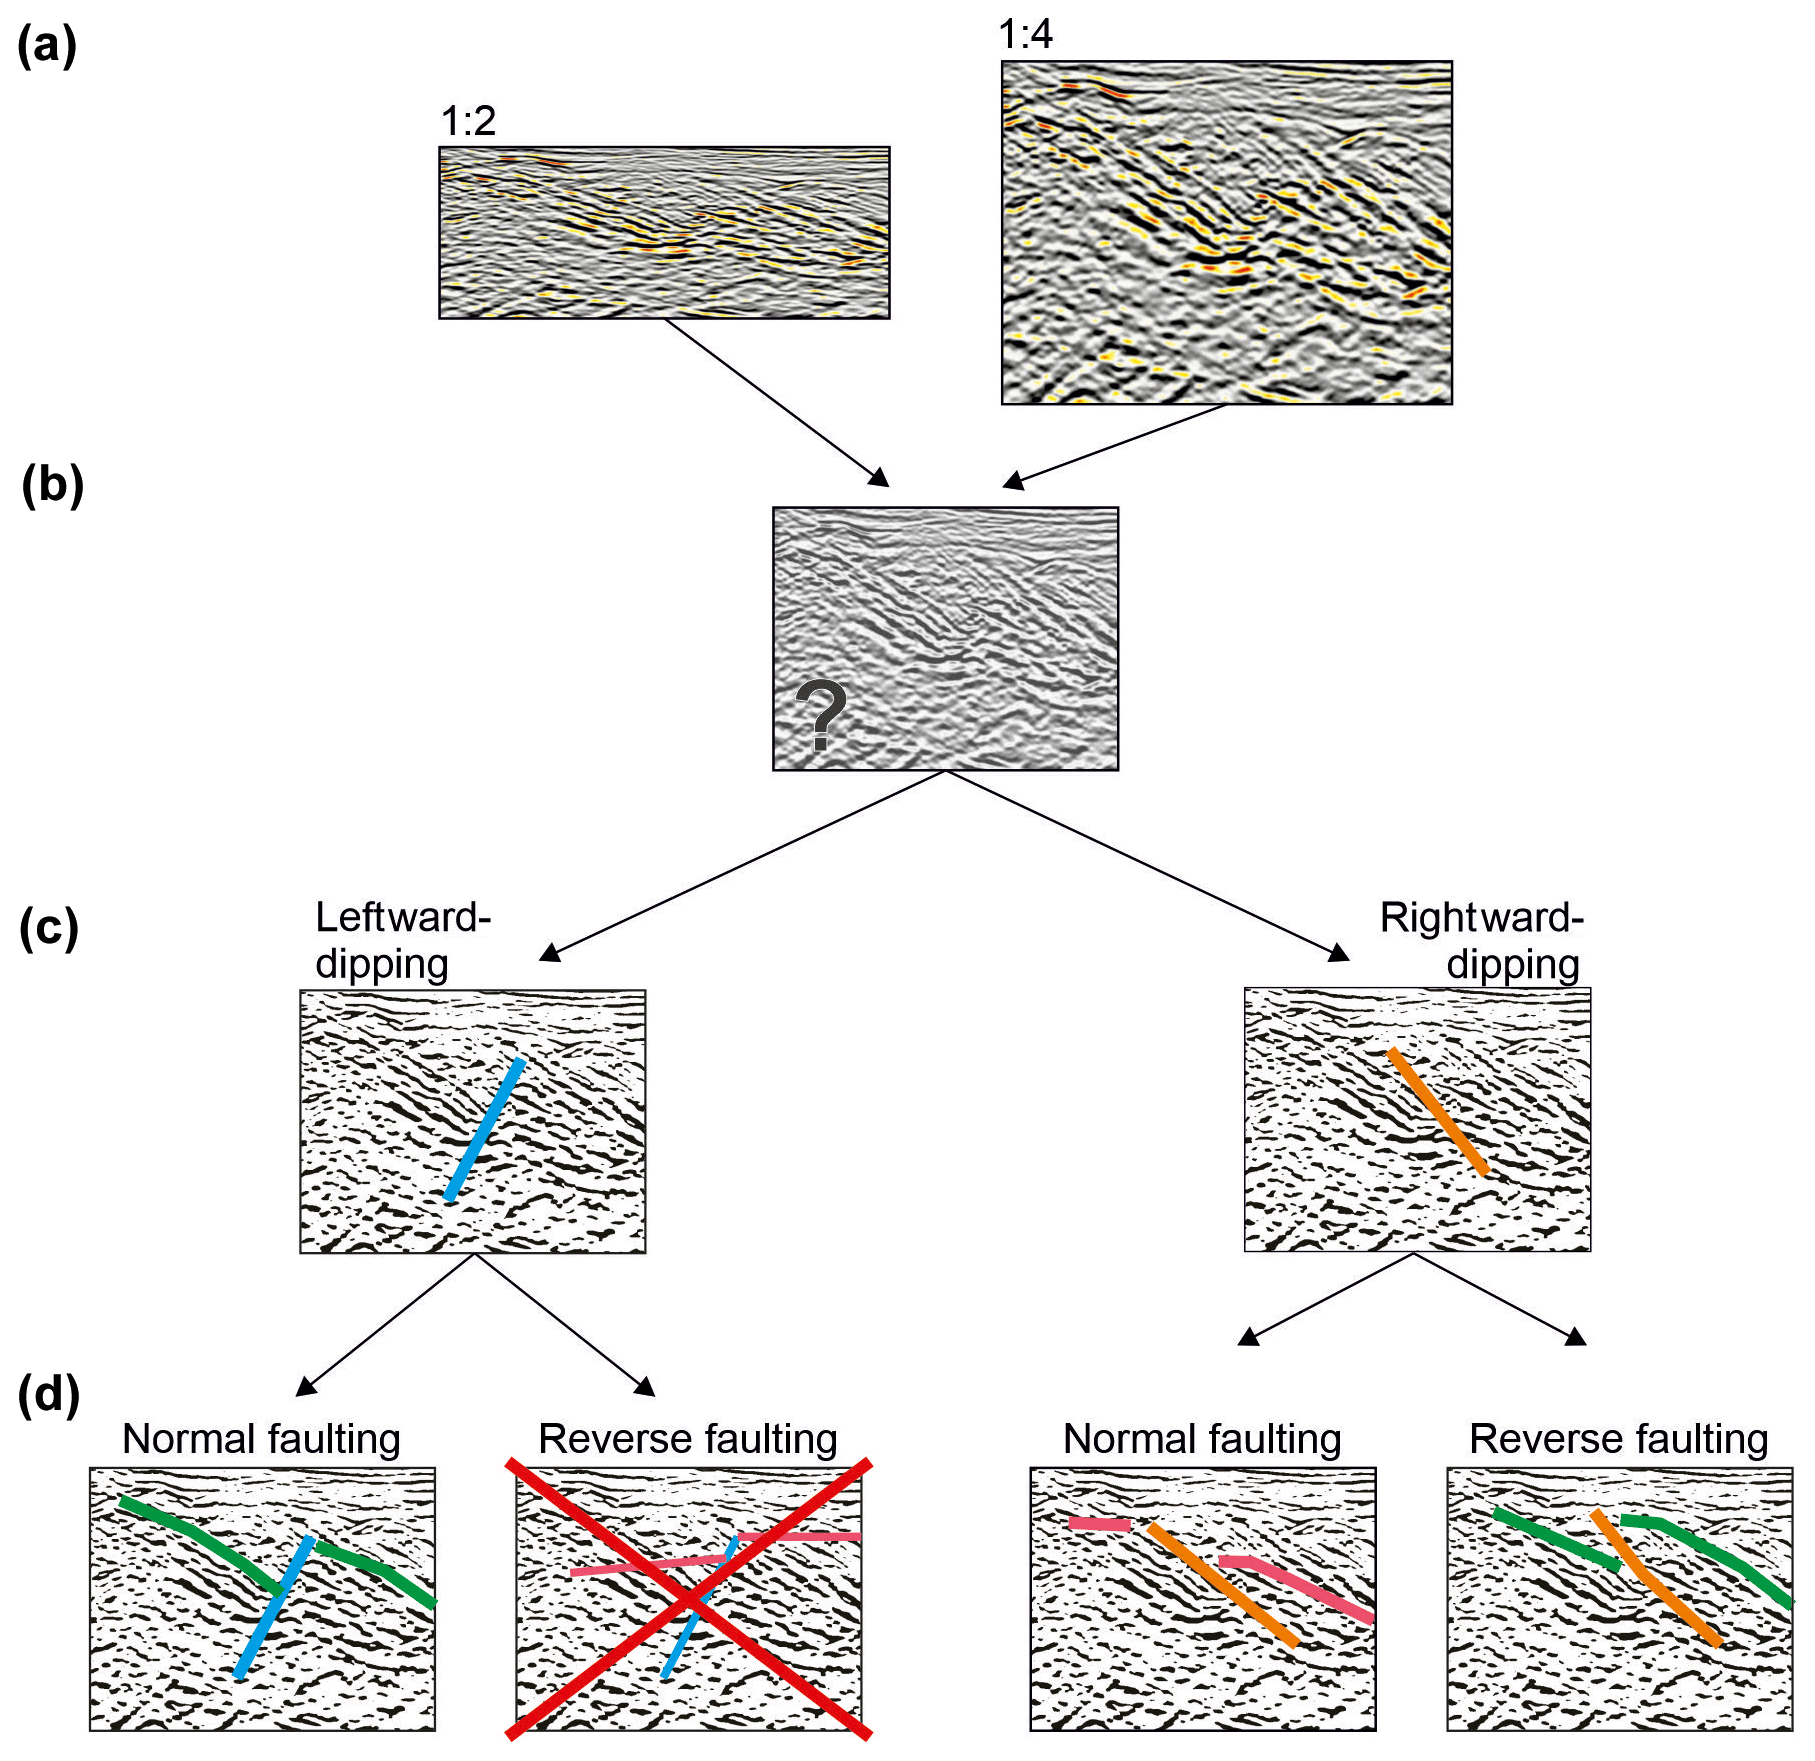
Figure 9Proposed interpretation sequence. (a) The seismic images were presented in both 1:2 and 1:4 vertical exaggerations. (b) Independently of the image interpreted, the participants of the experiment faced the problem of how to interpret the rightward-dipping structures and the chaotic seismic fabric. (c) Participants interpreted the central fabric either as a leftward-dipping (blue) or rightward-dipping (orange) fault, which consequently triggered (d) the horizon interpretation determining the motion (normal, green horizons; and reverse, pink horizons) of the fault. The leftward-dipping, reverse faulting interpretation (crossed out in red) is too difficult to fit to the seismic data, and so only one participant chose this interpretation.
4.2 Fault dip variability
Although we purport that the impact of conceptual model application and anchoring to models has the greatest influence on the interpretation outcomes of this experiment, the experiment results show certain differences in fault dip direction and dip angle between the 1:2 and 1:4 vertically exaggerated section interpretations (Figs. 4, 6 and 7). Figure 8 shows a projection of the interpreted fault dip angles and their median values for both the 1:2 and 1:4 sections on a graph of exaggerated vs. unexaggerated dip angles. The interpreted dip angles are projected onto the corresponding curves of vertical exaggeration to show the equivalent unexaggerated dip angle. The same faults interpreted in sections with differing vertical exaggeration should have the same unexaggerated dip angle (x axis) but a differing exaggerated dip angle (y axis). This is the case for the median of the rightward- and leftward-dipping normal fault interpretations (magenta and dark blue circles in Fig. 8, respectively). In contrast, the median fault dip angles of the rightward-dipping reverse interpretations in the 1:2 and 1:4 sections (dark pink circles in Fig. 8) are not aligned vertically, indicating that the two cohorts, i.e. participants interpreting the 1:2 and 1:4 sections, did not interpret the same dipping features as reverse faults. Interpretations of rightward-dipping faults (at least these interpreted as reverse motion) show an apparent impact of vertical exaggeration on interpretation outcome, whereas the leftward-dipping normal fault interpretations do not. In the 1:2 section, interpretations of leftward-dipping faults have higher dip angles on average than those interpreted in the 1:4 section and a greater spread in fault dip angle (Fig. 6e and f).
The observations of fault dip angle and motion consistency suggest that those interpreting normal faults (either rightward- or leftward-dipping) were unaffected by vertical exaggeration. Note that the interpreted median rightward-dipping fault dip angles are low, 15–17∘; when these are separated into normal and reverse faults, the rightward-dipping normal faults have a very low angle of 10–13∘ (Fig. 7e–f), with the reverse faults having higher average dip angles of 16–22∘ (Fig. 7c–d).
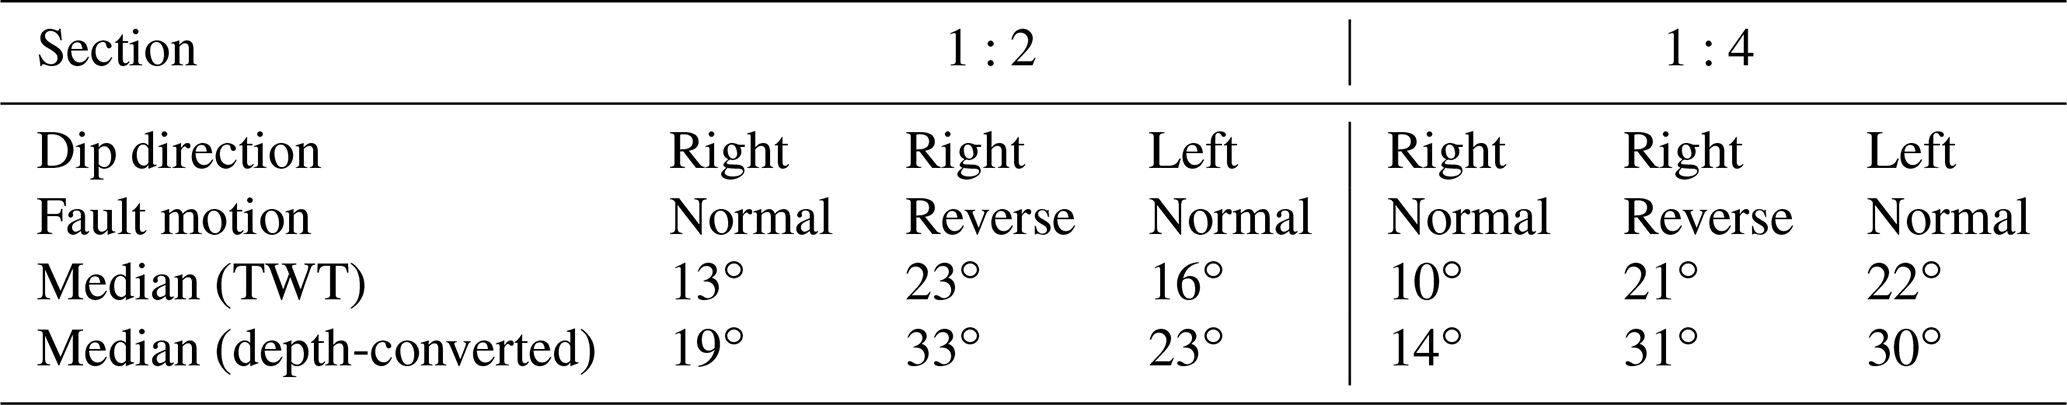
We did not provide the velocity model for the section used, but just for comparison, we converted the faults from TWT to depth assuming a seismic velocity of 3000 m s−1 for the area (following the assumptions and caveats outlined in Stewart, 2011) (Table 1). For the reverse motion faults, the resulting dip angles in depth (31–33∘) are closer to an Andersonian-predicted reverse fault dip of 30∘ and falling within the range of common reverse fault dips of 10–30∘ (Anderson, 1905, 1951). The normal fault angles (14–30∘), however, do not conform to predicted Andersonian fault dips of 45–60∘, which are predominant in teaching materials (Alcalde et al., 2017a). The participants did not have access to the regional seismic line, which would have provided context for such low-angle normal faults, or to the actual depth of the sections, so participants may have been expected to attempt to interpret faults with higher dip angles to conform to accepted dip models of normal faults. We see no evidence of this and interpret this observation as data and conceptual model co-confirmation acting dominantly over other reasoning (if any took place).
Table 1Median values in two-way travel time and their depth-converted equivalent of the 1:2 and 1:4 sections, divided by dip direction and fault motion. The dips were depth-converted using a uniform velocity model of 3000 m s−1 (as per Stewart, 2011).
For the interpretations of leftward-dipping faults, the extent of the vertical exaggeration of the interpreted seismic image appears to have an impact on interpretation outcome. Analysis of fault dip angle from the leftward-dipping fault interpretations of the 1:2 seismic section shows a greater range in fault dip angle (standard deviation SD=16∘) and a higher median fault dip angle of 29∘, compared to the 1:4 section interpretations with an median dip angle of 21∘, SD=13∘ (Fig. 6e–f), that is, an 8∘ higher median fault dip in the 1:2 section. If we now consider only the participants' interpretations that had also interpreted a horizon showing fault motion (Fig. 7a and b), the difference in fault dip angle between the 1:2 and 1:4 sections decreases to only 2∘, with similar standard deviations of 14 and 13∘. We suggest that the differences observed between the 1:2 and 1:4 sections are dominated more by erroneous seismic interpretations than by vertical exaggeration, with those making “dubious” leftward-dipping fault interpretations not completing horizon interpretations. Similarly, for the rightward-dipping fault interpretations normal fault dip have low angles of 24–27∘ but not as low as those interpreted to the right, suggesting that the faults are defined more by their seismic character than by any effects of vertical exaggeration. Testing with more display options (e.g. 1:6 or 1:8 vertical exaggeration) could be helpful to confirm this finding and would be interesting lines for further enquiry.
If we consider the observations described in the light of our knowledge of the perceptual impact of vertically exaggerated seismic images (e.g. Stone, 1991; Black et al., 1994; Horozal et al., 2009; Stewart, 2012), the 1:4 section should perceptually have better reflection continuity due to data compression (Stewart, 2011). The higher apparent reflection continuity in the 1:4 section could make the rightward-dipping reflections appear more dominant and the discontinuities between the sediment packages less dominant and narrower. The smaller range in dip angles for the 1:4 section compared to the 1:2 section (SD=14 vs. 16∘, respectively, Fig. 6a, b) may be the result of this perceptual change. But the lack of consistency in this observation when the data are split between rightward- and leftward-dipping faults (Fig. 6) and also into normal and reverse faults (Fig. 7) leads us to conclude that vertical exaggeration has a subdued impact. Our interpretation of these observations is that the seismic data and conceptual model have a more dominant influence on interpretation than any perceptual bias resulting from vertical exaggeration.
Our work does not provide evidence, in this case, to support the conclusions of Stone (1991), Black et al. (1994) and Stewart (2011, 2012) that vertically exaggerated seismic sections cause perceptual bias, compared with the dominant effect of anchoring to conceptual models. We still suggest, however, that multiple visualisations of the data should be made, including at a scale of 1:1, and that care should be taken when interpretations of seismic image data have been made in a vertically exaggerated form. Other experimental work (Alcalde et al., 2017b) showed that interpreters and interpretation outcomes were influenced by seismic reflection contrast and continuity, factors that can be enhanced in vertically exaggerated seismic images. We suggest that future work should further investigate the effect of vertical exaggeration on seismic image properties and interpretation outcomes.
The interpretation exercise with 161 participants showed the following:
-
Conceptual models have greater dominance on the interpretation outcome than perceptual bias from interpreting vertically exaggerated seismic sections.
-
Initial conceptual models are anchored, and there is no evidence for reassessment by participants when data do not conform to their initial model.
-
When conceptual models are confirmed, at least initially, by the data, there is no evidence that accepted models, for example in fault dip, have an impact on interpretation outcome and that variability in interpretation (e.g. fault dips in our experiment) is minimal even if it does not conform to accepted models (e.g. Andersonian dips). Instead, the data drive the interpreted fault dip, and the conceptual model and data co-confirm each other.
Our results support the conclusions of other researchers (Rankey and Mitchell, 2003; Bond et al., 2007, 2008) that seismic interpreters need to be aware of potential biases when interpreting seismic image data particularly in the application of conceptual models; they also need to be aware of the high likelihood of anchoring to initial conceptual models even when data do not confirm or conform to the model. Research has shown that awareness of biases (e.g. George et al., 2000) can help mitigate the potential impacts of bias. Thus, seismic interpreters and their employers should employ bias awareness in their interpretation workflows and obtain multiple opinions to test a broader range of conceptual models (see Bond et al., 2008, for workflow ideas; for reasoning tests to avoid anchoring see Bond, 2015, and Macrae et al., 2016; and for the potential impact of single conceptual models on decision making see Richards et al., 2015). Research into the effectiveness of different bias awareness techniques and their impact in geological interpretation is an obvious focus for future research.
The work presented here and that of many of the authors referenced provides evidence for biases in interpretation of geological and geophysical data. The resultant interpretation outcomes are not only based on uncertain data, but these uncertainties are compounded by interpretation biases including using heuristics to form initial conceptual models and anchoring to these. Understanding how to better mitigate bias in interpretation and the competing impacts on outcomes of different biases remains a significant challenge in the geosciences.
The seismic image used in the experiment is available on the Virtual Seismic Atlas (https://www.seismicatlas.org, last access: 30 September 2019). The questionnaire presented to the participants is available in the Supplement. Interpretations and statistical analyses are available upon request.
The supplement related to this article is available online at: https://doi.org/10.5194/se-10-1651-2019-supplement.
Both JA and CEB conceptualised and designed the interpretation experiment. CEB, AK, OF, RB and PA conducted the experiments at the University of Aberdeen, the University of Grenoble, University of Barcelona, Imperial College of London and University of Salamanca. JA was responsible for the project administration and data analyses. CEB and JA were responsible for the writing, reviewing and editing of the manuscript with help from GJ, AK, OF, RB and PA.
The authors declare that they have no conflict of interest.
This article is part of the special issue “Understanding the unknowns: the impact of uncertainty in the geosciences”. It is a result of the EGU General Assembly 2018, Vienna, Austria, 8–13 April 2018.
We would like to thank both Charlotte Botter and Javier Tamara for their detailed review and suggestions on improving this paper. Ignacio Marzán is also thanked for his help with the figure designs.
Juan Alcalde has been supported by the Natural Environment Research Council (grant no. NE/M007251/1) and the H2020 European Institute of Innovation and Technology (SIT4ME (grant no. 17024)). Clare E. Bond is currently funded through a Royal Society of Edinburgh research sabbatical on uncertainty in seismic image interpretation. Gareth Johnson is funded by the University of Strathclyde Faculty of Engineering. Oriol Ferrer has been supported by the SALCONBELT Project (grant no. CGL2017-85532-P), the Geomodels Research Institute and the Grup de Geodinàmica i Anàlisi de Conques (grant no. 2017SGR-596). Puy Ayarza is funded by the Regional Government of Castile and León (project SA065P17).
This paper was edited by Lucia Perez-Diaz and reviewed by Charlotte Botter and Javier Tamara.
Alcalde, J., Marzán, I., Saura, E., Martí, D., Ayarza, P., Juhlin, C., Perez-Estaun, A., and Carbonell, R.: 3D geological characterization of the Hontomín CO2 storage site, Spain: Multidisciplinary approach from seismic, well-log and regional data, Tectonophysics, 627, 6–25, 2014.
Alcalde, J., Bond, C. E., Johnson, G., Butler, R. W., Cooper, M. A., and Ellis, J. F.: The importance of structural model availability on seismic interpretation, J. Struct. Geol., 97, 161–171, 2017a.
Alcalde, J., Bond, C. E., Johnson, G., Ellis, J. F., and Butler, R. W.: Impact of seismic image quality on fault interpretation uncertainty, GSA Today, 27, 4–10, https://doi.org/10.1130/GSATG282A.1, 2017b.
Alcalde, J., Bond, C. E., and Randle, C. H.: Framing bias: The effect of figure presentation on seismic interpretation, Interpretation, 5, T591–T605, 2017c.
Anderson, E. M.: The dynamics of faulting: Transactions of the Edinburgh Geological Society, 8, 387–402, https://doi.org/10.1144/transed.8.3.387, 1905.
Anderson, E. M.: The Dynamics of Faulting and Dyke Formation with Application to Britain, Second Edition, Oliver and Boyd, Edinburgh, 206 p., 1951.
Bertram, G. T. and Milton, N. J.: Seismic stratigraphy, in: Sequence Stratigraphy, edited by: Emery, D., Myers, K., and Bertram, G. T., Blackwell Science Ltd, Oxford, pp. 45–60, 1996.
Black, R. A., Steeples, D. W., and Miller, R. D.: Migration of shallow seismic reflection data, Geophysics, 59, 402–410, 1994.
Bond, C. E.: Uncertainty in structural interpretation: Lessons to be learnt, J. Struct. Geol., 74, 185–200, 2015.
Bond, C. E., Gibbs, A. D., Shipton, Z. K., and Jones, S.: What do you think this is? “Conceptual uncertainty” in geoscience interpretation, GSA today, 17, 4–10, https://doi.org/10.1130/GSAT01711A.1, 2007.
Bond, C. E., Shipton, Z. K., Gibbs, A. D., and Jones, S.: Structural models: optimizing risk analysis by understanding conceptual uncertainty, First Break, 26, 65–71, 2008.
Bond, C. E., Lunn, R. J., Shipton, Z. K., and Lunn, A. D.: What makes an expert effective at interpreting seismic images?, Geology, 40, 75–78, 2012.
Bond, C. E., Johnson, G., and Ellis, J. F.: Structural model creation: the impact of data type and creative space on geological reasoning and interpretation, Geological Society, London, Special Publications, 421, 83–97, 2015.
Brothers, D. S., Driscoll, N. W., Kent, G. M., Harding, A. J., Babcock, J. M., and Baskin, R. L.: Tectonic evolution of the Salton Sea inferred from seismic reflection data, Nat. Geosci., 2, 581–584, 2009.
Feagin, F. J.: Seismic data display and reflection perceptibility, Geophysics, 46, 106–120, 1981.
Frodeman, R.: Geological reasoning: geology as an interpretive and historical science, Geol. Soc. Am. Bull., 107, 960e968, https://doi.org/10.1130/0016-7606(1995)107<0960:GRGAAI>2.3.CO;2, 1995.
George, J. F., Duffy, K., and Ahuja, M.: Countering the anchoring and adjustment bias with decision support systems, Decision Support Systems, 29, 195–206, 2000.
Horozal, S., Lee, G. H., Bo, Y. Y., Yoo, D. G., Park, K. P., Lee, H. Y., Kim, W., Kim, H. J., and Lee, K.: Seismic indicators of gas hydrate and associated gas in the Ulleung Basin, East Sea (Japan Sea) and implications of heat flows derived from depths of the bottom-simulating reflector, Mar. Geol., 258, 126–138, 2009.
Kahneman, D., Slovic, P., and Tversky, A. (Eds.): Judgement under Uncertainty: Heuristics and Biases, Cambridge University Press, Cambridge, 1982.
Keep, M. and Moss, S. J.: Basement reactivation and control of Neogene structures in the outer Browse Basin, North West Shelf, Exploration Geophysics, 31, 424–432, 2000.
Macrae, E. J., Bond, C. E., Shipton, Z. K., and Lunn, R. J.: Increasing the quality of seismic interpretation, Interpretation, 4, T395–T402, 2016.
Martí, D., Carbonell, R., Flecha, I., Palomeras, I., Font-Capó, J., Vázquez-Suñé, E., and Pérez-Estaún, A.: High-resolution seismic characterization in an urban area: Subway tunnel construction in Barcelona, Spain, Geophysics, 73, B41–B50, 2008.
Nielsen, T., Knutz, P. C., and Kuijpers, A.: Seismic expression of contourite depositional systems, Developments in Sedimentology, 60, 301–321, 2008.
Park, J. O., Tsuru, T., Kodaira, S., Cummins, P. R., and Kaneda, Y.: Splay fault branching along the Nankai subduction zone, Science, 297, 1157–1160, 2002.
Rankey, E. C. and Mitchell, J. C.: That's why it's called interpretation: Impact of horizon uncertainty on seismic attribute analysis, The Leading Edge, 22, 820–828, 2003.
Richards, F. L., Richardson, N. J., Bond, C. E., and Cowgill, M.: Interpretational variability of structural traps: implications for exploration risk and volume uncertainty, Geological Society, London, Special Publications, 421, 7–27, 2015.
Saltus, R. W. and Blakely, R. J.: Unique geologic insights from “non-unique” gravity and magnetic interpretation, GSA Today, 21, 4–11, 2011.
Shipley, T. F. and Tikoff, B.: Linking Cognitive Science and Disciplinary Geoscience Practice, in: 3-D Structural Interpretation, Am. Assoc. Petr. Geol., 219–237, https://doi.org/10.1306/13561994M1113677, 2016.
Shipley, T. F. and Tikoff, B.: The Role of Geoscience Education Research in the Consilience between Science of the Mind and Science of the Natural World, J. Geosci. Educ., 65, 393–398, https://doi.org/10.5408/16-252.1, 2017.
Simancas, J. F., Carbonell, R., González Lodeiro, F., Pérez Estaún, A., Juhlin, C., Ayarza, P., Kashubin, A., Azor, A., Martínez Poyatos, D., Almodovar, G. R., and Pascual, E.: Crustal structure of the transpressional Variscan orogen of SW Iberia: SW Iberia deep seismic reflection profile (IBERSEIS), Tectonics, 22, 1062, https://doi.org/10.1029/2002TC001479, 2003.
Stewart, S. A.: Vertical exaggeration of reflection seismic data in geoscience publications 2006–2010, Mar. Petrol. Geol., 28, 959–965, 2011.
Stewart, S. A.: Interpretation validation on vertically exaggerated reflection seismic sections, J. Struct. Geol., 41, 38–46, 2012.
Stone, D. S.: Analysis of Scale Exaggeration on Seismic Profiles (1), AAPG Bull., 75, 1161–1177, 1991.
Strecker, U., Steidtmann, J. R., and Smithson, S. B.: A conceptual tectonostratigraphic model for seismic facies migrations in a fluvio-lacustrine extensional basin, AAPG Bull., 83, 43–61, 1999.
Struckmeyer, H. I. M., Blevin, J. E., Sayers, J., Totterdell, J. M., Baxter, K., and Cathro, D. L.: Structural evolution of the Browse basin, northwest shelf: New concepts from deep-seismic data, in: The SedimentaryBasins of Western Australia 2: Proceedings of Petroleum Exploration Society of Australia Symposium, edited by: Purcell, P. G. R. R., pp. 345–367, Petrol. Explor. Soc. of Aust., Perth, Western Australia, Australia, 1998.
Torvela, T. and Bond, C. E.: Do experts use idealised structural models? Insights from a deepwater fold–thrust belt, J. Struct. Geol., 33, 51–58, 2011.
Tversky, A. and Kahneman, D.: Judgment under uncertainty: Heuristics and biases, Science, 185, 1124–1131, 1974.