the Creative Commons Attribution 4.0 License.
the Creative Commons Attribution 4.0 License.
 | 12 Nov 2019
Lithospheric image of the Central Iberian Zone (Iberian Massif) using global-phase seismic interferometry
Deyan Draganov
Martin Schimmel
Puy Ayarza
Imma Palomeras
Mario Ruiz
Ramon Carbonell
The Spanish Central System is an intraplate mountain range that divides the Iberian Inner Plateau in two sectors – the northern Duero Basin and the Tajo Basin to the south. The topography of the area is highly variable with the Tajo Basin having an average altitude of 450–500 m and the Duero Basin having a higher average altitude of 750–800 m. The Spanish Central System is characterized by a thick-skin pop-up and pop-down configuration formed by the reactivation of Variscan structures during the Alpine orogeny. The high topography is, most probably, the response of a tectonically thickened crust that should be the response to (1) the geometry of the Moho discontinuity, (2) an imbricated crustal architecture, and/or (3) the rheological properties of the lithosphere. Shedding some light on these features is the main target of the current investigation. In this work, we present the lithospheric-scale model across this part of the Iberian Massif. We have used data from the Central Iberian Massif Deformation (CIMDEF) project, which consists of recordings of an almost-linear array of 69 short-period seismic stations, which define a 320 km long transect. We have applied the so-called global-phase seismic interferometry. The technique uses continuous recordings of global earthquakes (>120∘ epicentral distance) to extract global phases and their reverberations within the lithosphere. The processing provides an approximation of the zero-offset reflection response of a single station to a vertical source, sending (near)-vertical seismic energy. Results indeed reveal a clear thickening of the crust below the Central System, resulting, most probably, from an imbrication of the lower crust. Accordingly, the crust–mantle boundary is mapped as a relatively flat interface at approximately 10 s two-way travel time except in the Central System, where this feature deepens towards the NW reaching more than 12 s. The boundary between the upper and lower crust is well defined and is found at 5 s two-way travel time. The upper crust has a very distinctive signature depending on the region. Reflectivity at upper-mantle depths is scattered throughout the profile, located between 13 and 18 s, and probably related to the Hales discontinuity.
- Article
(5773 KB) - Full-text XML
-
Supplement
(999 KB) - BibTeX
- EndNote


The Spanish Central System represents the most prominent topographic feature in central Iberia. It is bounded by two major Tertiary basins, namely the Duero Basin to the N and the Tajo Basin to the S, forming the Meseta Central. This mountain range extends in a NE–SW direction for over 300 km, with peaks more than 2500 m in height, and is actively increasing its elevation at the rate of 1 mm yr−1 (Cloetingh et al., 2002), while the Meseta Central features an average altitude of 600–700 m.
The average elevation of the central Iberian Peninsula is the highest among those in the European continent. A current interest of solid-earth science is focusing towards constraining and understanding topography as a whole, and its changes causes. Changes in topography are the expression of the characteristics of the lithosphere and processes that affect it: (1) on the surface (such as erosion and therefore climate), (2) within the lithosphere itself (such as intrusion of volcanics and magmas, faulting, rifting, compression, extension, etc.), and (3) corresponding isostatic rebounds. How the crust responds to these processes is mostly controlled by its internal architecture and the distribution of its physical properties. Since the early 1990s, a number of multidisciplinary geophysical studies have been undertaken to characterize the crust and lithosphere in the Iberian Massif: first to the NW, then to the SW, and up to and across the Toledo mountains. Detailed crustal and, sometimes, lithospheric structures have been delineated primarily from high-resolution controlled-source (normal-incidence and wide-angle) seismic reflection/refraction data (Pulgar et al., 1995; Ayarza et al., 1998; Simancas et al., 2003; Carbonell et al., 2004; Flecha et al., 2009; Palomeras et al., 2009, 2011; Martínez-Poyatos et al., 2012; Ehsan et al., 2014, 2015). However, there is a gap in seismic information at the Central System and surrounding basins.
Due to its usefulness, seismic interferometry (SI) has lately consolidated itself as a tool for lithospheric imaging. Recent studies have exploited earthquake and moonquake recordings (Ruigrok and Wapennar, 2012; Nishitsuji et al., 2016a, b) to image lithospheric discontinuities such as the Moho (in the Earth and the Moon) or subducting slabs. These studies are based on a technique called global-phase seismic interferometry (GloPSI) (Ruigrok and Wapennar, 2012). GloPSI is a technique that retrieves P-wave reflectivity, coming from distant energy sources, below a single station by autocorrelating earthquake phases coming nearly as a plane wave with (near)-vertical incidence angles. We have employed this technique in an almost linear array of 320 km length crossing the Central System and the Duero and Tajo basins within the Central Iberian Zone. The resulting image provides new insights into the lithospheric structure of this intraplate mountain range, which complement previous results.
Our interpretations are supported by models deduced from other nearby seismic datasets available. The results from normal incidence seismic profiles ESCIN-2, IBERSEIS-NI, and ALCUDIA-NI (Pulgar et al., 1995; Simancas et al., 2003; Martínez-Poyatos et al., 2012) as well as the velocity information provided by the wide-angle datasets acquired as part of those experiments (e.g. IBERSEIS-WA and ALCUDIA-WA; Palomeras et al., 2009; Ehsan et al., 2015) are evaluated in our interpretation.
This work aims to contribute to the knowledge on the lithospheric structure and crustal thickness across the Central System and to its relationship with the contrasting topography of the Duero Basin and Tajo Basin, constraints that are an asset to study the origin and evolution of the elevation and the deformation dynamics of the Iberian Peninsula.
In the Iberian Massif (Fig. 1) outcrops are part of the late Palaeozoic Variscan–Alleghanian orogen of Europe. The latter was formed by the collision between pre-Mesozoic Laurentia/Baltica and Gondwana continents. The orogeny took place in two steps: (1) from Ordovician to Devonian times with the closure of the Rheic Ocean, which separated the continents, and (2) from Devonian to Carboniferous times when the continents were amalgamated along with other minor pieces like Armorica (Franke, 2000; Matte, 2001). The Iberian Massif exposes a complete section of the Variscan Belt formed by six units. External parts of the orogen are represented by the South Portuguese Zone (SPZ) to the S and the Cantabrian Zone (CZ) in the N, whereas the internal zones are the Ossa-Morena Zone (OMZ), Galicia–Trás-os-Montes Zone (GTMZ), Central Iberian Zone (CIZ), and West Asturian Leonese Zone (WALZ) (Julivert et al., 1972). From these domains, the CIZ, WALZ, and CZ represent continental portions of a passive margin along Gondwana before the Variscan orogeny. Overlying the CIZ, the GTMZ is a relic of the Rheic Ocean formed partly by ophiolites. The OMZ is interpreted as a ribbon continental domain that drifted to some extent from Gondwana. Finally, the SPZ is interpreted as a fragment of Avalonia (Fonseca and Ribeiro, 1993; Tait el al., 2000).
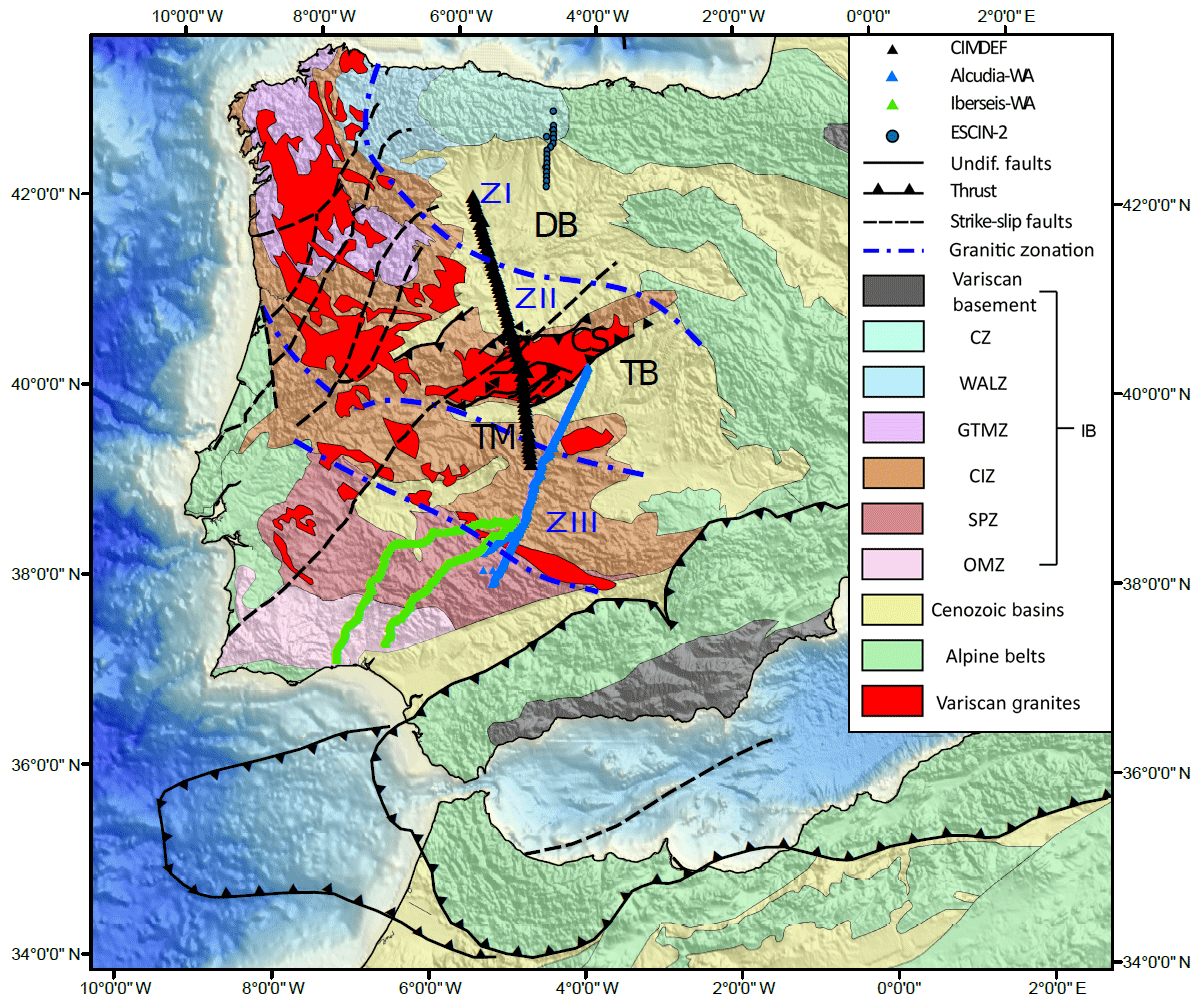
Figure 1Simplified geological map of the study area with major tectonic provinces of the Iberian Massif and structures. TM: Toledo mountains, CS: Central System, DB: Duero Basin, TB: Tajo Basin, CZ: Cantabrian Zone, WALZ: West Asturian Leonese Zone, GTMZ: Galicia–Trás-os-Montes, CIZ: Central Iberian Zone, OMZ: Ossa-Morena Zone, SPZ: South Portuguese Zone. Locations of Variscan granites and granitic zonation are taken from Simancas et al. (2013).
The Central Iberian Massif Deformation (CIMDEF) seismic profile is located within the CIZ, although the latter is overlain by Cenozoic basins to the N and S of the profile. The CIZ is the largest subdivision of the Iberian Massif and has two distinct zones (Díez Balda et al., 1990). To the N it is characterized by high-grade metamorphism and high deformation (Barbero and Villaseca, 2000) and a vast volume of Carboniferous granites (Bea, 2004). The southern part is characterized by less deformed rocks, featuring NW–SE-trending upright folds and faults, and a much more moderate volume of granites.
The profile crosses three main geological domains within central Iberia, namely the Central System, the Duero Basin, and the Tajo Basin. The Central System is an intraplate mountain range characterized by a thick-skin pop-up and pop-down configuration with E–W and NE–SW orientations from E to W, respectively. It was formed during the Cenozoic Alpine compression of the Iberian Peninsula and is composed by uplifted Variscan basement (Vegas et al., 1990; de Vicente et al., 1996, 2007, 2018). It is divided into two major areas by a set of almost N–S-orientated faults. The western sector is called Gredos and the eastern side is Guadarrama-Somosierra. The outcropping materials are mainly Variscan granitoids in the western sector with minor outcrops of metamorphic rocks, while the eastern zone is mainly composed by metamorphic rocks with minor outcropping granites. The granites of the western sector correspond to the Avila Batholith, which is a vast association of igneous rocks. The current knowledge of the crustal and lithospheric structure of the Central System comes mainly from geophysical studies such as seismic data (Suriñach and Vegas, 1988; Diaz et al., 2016) and inversion and forward modelling of potential-field data (Tejero et al., 1996; de Vicente et al., 2007; Torne et al., 2015). These studies have found a crustal thickness in the range of 31 to 35 km, showing a thickening underneath the Central System with respect to the surrounding basins. Our study area is located in the western part of the Central System, i.e. the Gredos sector. Its structure corresponds to a main pop-up of about 100 km across the strike, which can be subdivided into four short-wavelength pop-ups, of about 10–20 km, and three pop-downs framed into the pop-ups. The Duero Basin corresponds to the foreland basin of the Cantabrian Mountains to the N as well as the foreland basin of the Central System to the S. The Tajo Basin is located to the S of the Central System and the contact between them is marked by a thick-skinned thrust fault that fades out to the W. Approximately at the longitude of the CIMDEF profile, this thrust fault is substituted by a set of faults located slightly to the N and hosting the Tiétar river (Fig. 2 in de Vicente et al., 2007).
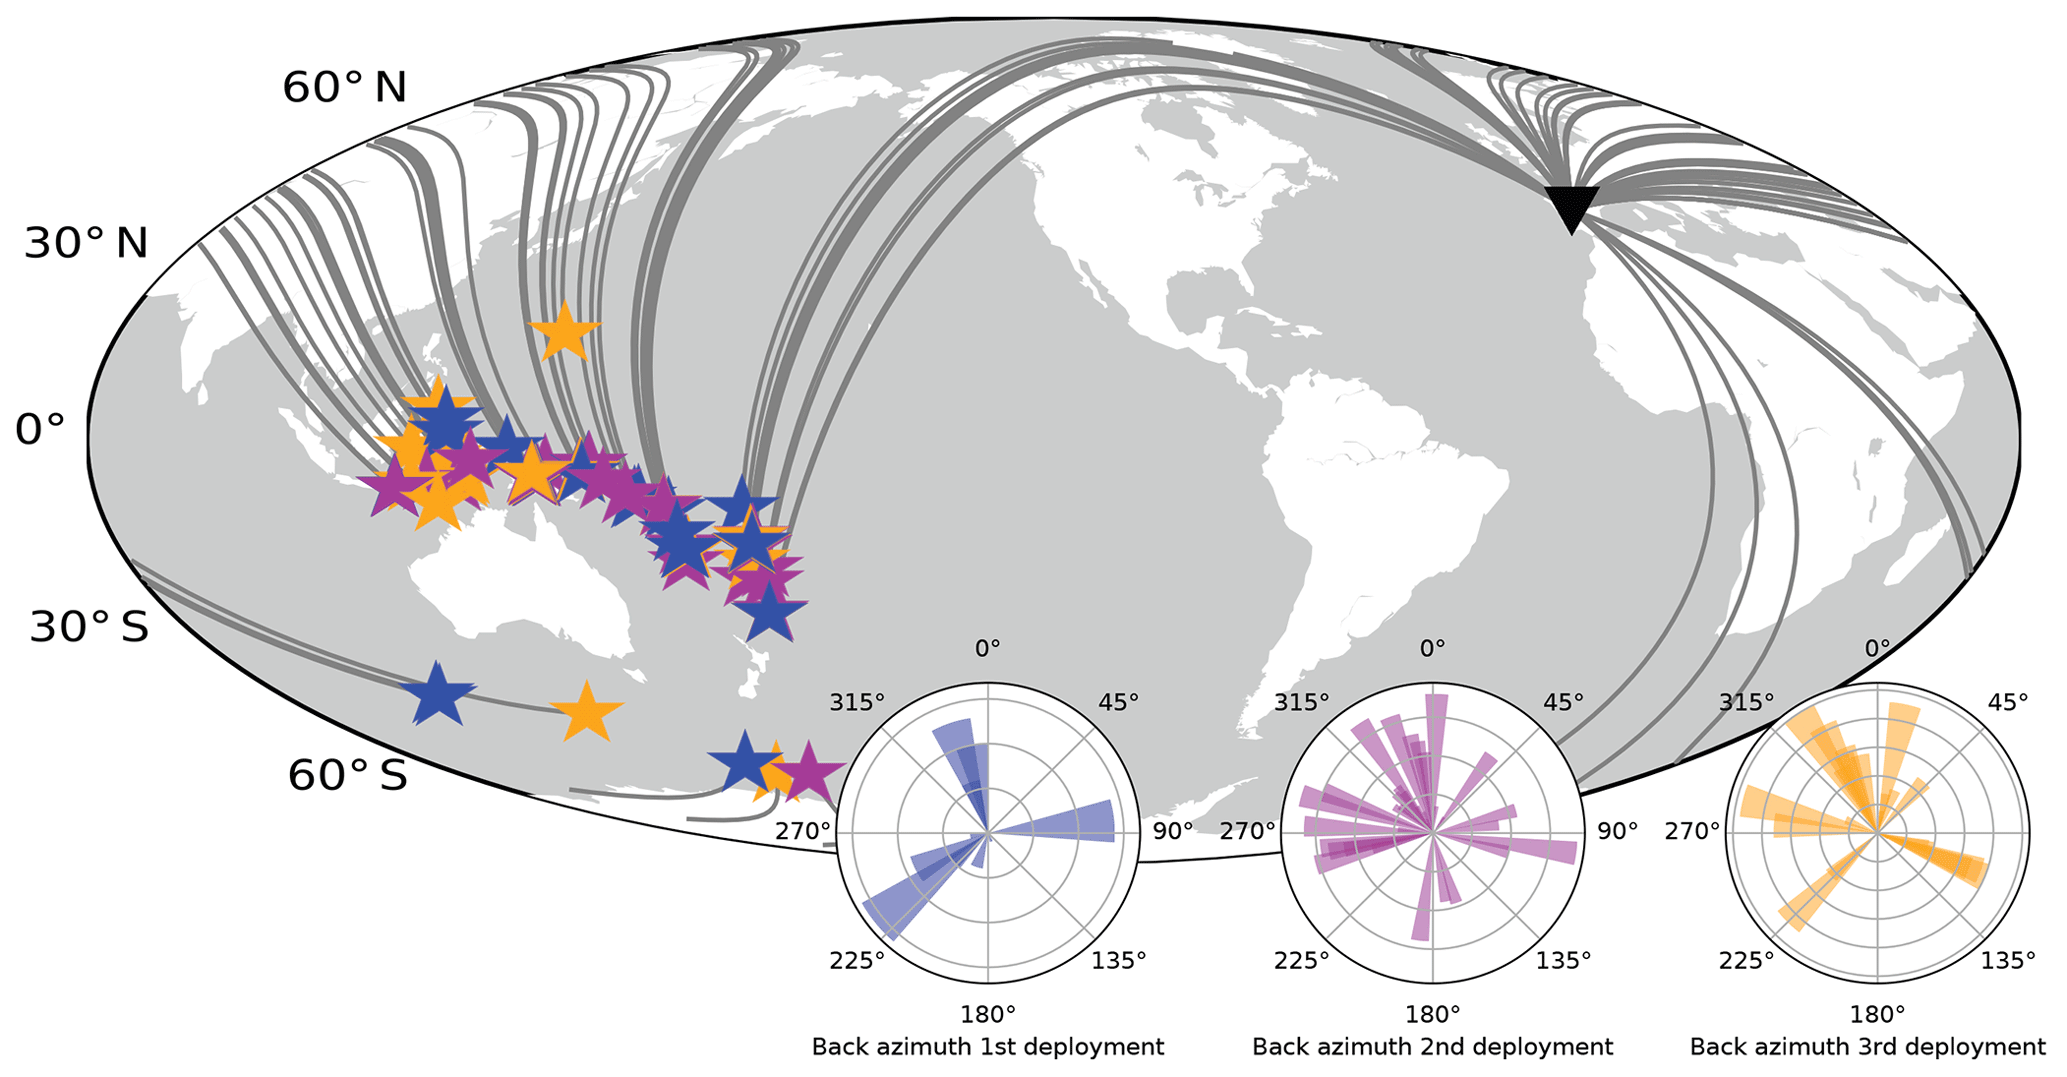
Figure 2Colour-coded earthquakes (Mw ≥ 5) used for the three deployments. There were 17 earthquakes (blue stars) used for the central deployment, 38 (purple stars) for the southern segment, and 26 (orange stars) for the northern part of the profile. Polar plots represent the back azimuth of selected earthquakes for each deployment.
The data used in this study were acquired within the CIMDEF project. The set-up consisted of a three-stage deployment. The first part of the profile was recorded between May and June 2017 by 24 short-period stations equipped with 2 Hz three-component geophones. The second stage was acquired between February and April 2018 and consisted of a deployment of 15 stations, while the third deployment was undertaken between July and September 2018 and 30 new stations were installed using the same configuration of geophones and data loggers for all deployment stages. The data were acquired in continuous recording mode at 250 samples per second (sps) during periods ranging from 28 to 60 d. The stations were installed along an almost linear NW–SE array with an average inter-station spacing of 4.8 km, covering a total length of 320 km (Fig. 1). For every station, at least 28 d of continuous recording is available, although in the northern and southern part of the profile almost 2 months of data are available. For the processing, we select the vertical component of global earthquakes (Fig. 2) with Mw ≥ 5 from the United States Geological Survey catalogue. The limited deployment time of the experiment determined the choice of Mw ≥ 5 in order to allow for the use of more sources. For each deployment, all earthquakes with Mw > 5 and epicentral distance >120∘ were selected. The selection of the minimum magnitude to be considered was taken as a balance between the signal quality of the earthquakes and the number of available sources for each deployment. The 163 gathered events were checked by computing the power-spectral density to confirm the existence of useful energy within the selected frequency band. This process gave the 81 finally selected sources (Table S1 in the Supplement). For the first deployment, a total of 44 earthquakes were analysed and 17 proved to have useful energy. In the second deployment, 59 earthquakes were evaluated, from which 38 were selected for further processing. For the final deployment, 60 earthquakes were analysed and 26 were selected to produce the final image.
For each of the three deployments a different number of earthquakes is available, 17 for the first, 38 for the second, and 26 for the third. Among those, there are 3 in the first deployment, 16 in the second deployment, and 14 for the last deployment that are with Mw ≥ 6. These numbers of events per deployment are insufficient for application of GloPSI. To suppress retrieval of artefacts, for example due to the PKP triplication, it is important to sum phases from a wide range of ray parameters (Ruigraok and Wapennar, 2012; Nishitsuji et al., 2016a).
The use of low-magnitude events, between Mw 5.1 and 5.4, is restricted to the first acquisition where the deployment time was the shorter, and therefore we were forced to include lower-magnitude events in the processing scheme. These events represent 7.4 % of the total events used to produce the central part of the image.
The selection of the beginning of the time window to be used was based on the theoretical travel time of the phases calculated by the ak135 model (Kennett et al., 1995). We visually inspected the recordings and selected phases with a high signal-to-noise ratio. The time window is set to start 30 s before the onset of specific phases of interest (e.g. PKiKP or PKIKP) and to end 300 s after the onset and before the onset of the first S-wave phase.
The GloPSI technique uses body-wave global phases that have travelled through the core and whose energy arrives at the surface nearly vertical. These seismic phases are PKP, PKiKP, and PKIKP, produced by earthquakes at >120∘ of epicentral distance (Fig. 2). When arriving at the station, the phases and their reverberations in the lithosphere are used as the input data. In general, these arrivals are nearly plane waves in the mantle and have a slowness lower than 0.04 s km−1.
The reflections produced by the phases and their reverberations can be retrieved using SI. The methodology is based on the 1-D derivation for an acoustic medium of Claerbout (1968), where reflectivity is retrieved by autocorrelation. This theory was latter extended to 3-D inhomogeneous media by Wapenaar (2003) and adapted to retrieve body waves from global earthquakes by Ruigrok and Wapenaar (2012). The GloPSI technique relies on the application of autocorrelation of every earthquake and stack over sources to retrieve the pseudo zero-offset reflection response below a station from a virtual source that radiates energy nearly vertically down. Stacking over the correct illumination range ensures cancellation of spurious events and enhancement of stationary events. Thus, we calculated the back azimuths of the selected events (inset in Fig. 2). Despite the constraint that the distance >120∘ implies in terms of availability of sources, the illumination is well covered, thus ensuring a good stacking of the resulting autocorrelations. Limitations of the methodology are related to earthquake distribution and quantity and with the internal structure of the crust. As GloPSI uses nearly vertical incident energy, reverberations from steep-dipping structures below the station would not be retrieved. However, the lack of imaged reflectivity of such structures can be used to interpret their presence (Nishitsuji et al., 2016a). The methodology is extensively covered in Ruigrok and Wapenaar (2012), therefore the reader is referred to that paper for further details.
The methodology we employ for the processing of the earthquake recording includes pre-processing and construction of stacked autocorrelograms of the vertical component. We base our processing steps on linear autocorrelations and phase-weighted stacks (tf-PWS) (Schimmel and Gallart, 2007). The tf-PWS method is based on the non-linear theory where the linear stack is weighted by the time–frequency phase. This procedure enhances coherent signals independently of their amplitudes. The time–frequency phase stack is written as
where cps(τ, f) is the time–frequency phase coherence and Sj(τ, f) is the S transform. Then, the tf-PWS is calculated by multiplying the phase stack with the S transform of the linear stack as
Finally, the inverse S transform is applied to convert the stack from the frequency domain to the time domain.
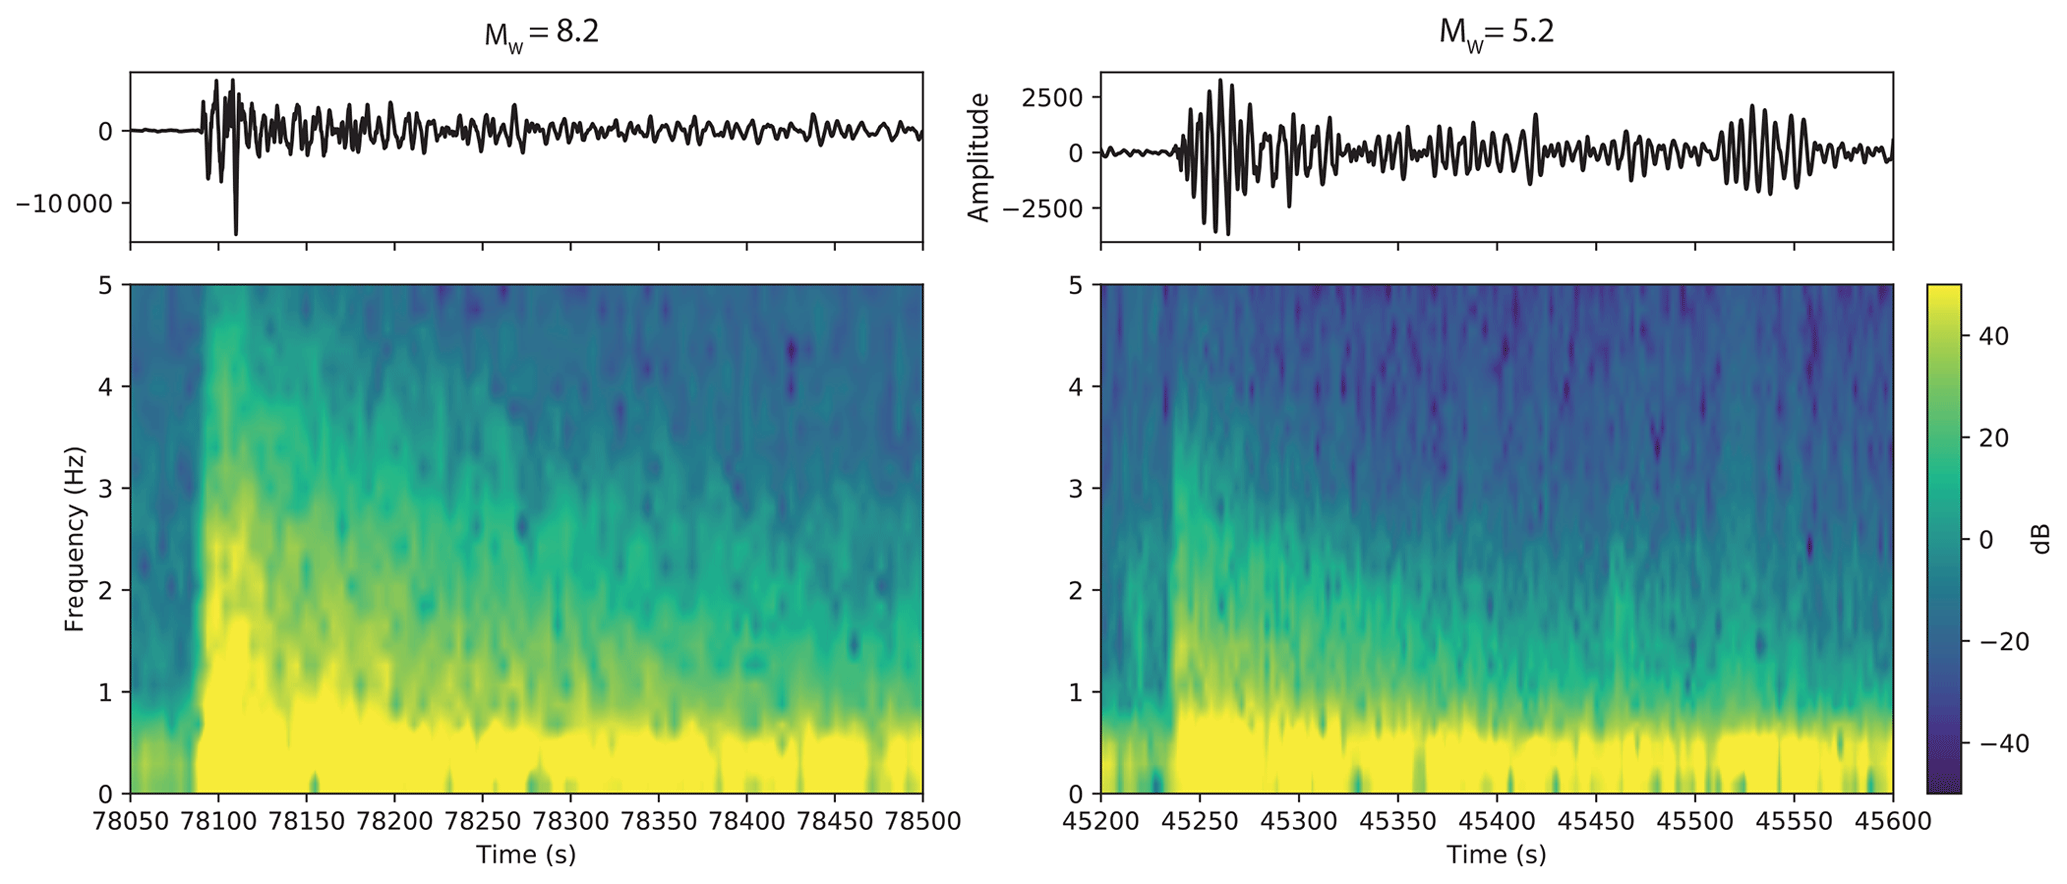
Figure 3Power-spectral density plots of two earthquakes recorded by the CIMDEF array. They cover both ends of the used magnitudes, thus proving the existence of energy at the selected frequency band.
The pre-processing applied to all selected time windows consists of first deconvolving the instrument response from the signal. Then, the data are decimated from 250 to 50 sps in order to reduce computing time. The next step consists of bandpass filtering the data to restrict the frequency bands to those where we expect the target information to be found. We applied a broad bandpass filter of 0.1–2 Hz after computing the power-spectral density for different magnitude earthquakes (Fig. 3). Subsequently, we apply SI by autocorrelation to each selected phase (transient source). To help the correct stacking, the autocorrelations are normalized by their energy. This step aids the summation process as each phase could have a different spectral balance, thus hindering an optimal stacking. The resulting stack is filtered between 0.7 and 2 Hz as low frequencies offer low resolution and they (<0.7 Hz) are influenced strongly by the microseismic noise (Fig. 4).
As a consequence of the autocorrelation process, a strong arrival at t=0 is created, representing a smeared Dirac delta function at a time of 0 s (Claerbout, 1968; Wapenaar, 2003), dominating the earlier part of the trace. Two methodologies have been tested to reduce this effect: (a) deconvolution of the wavelet around 0t (the virtual-source time function) extracted from the average of all autocorrelations per event and phase and (b) subtracting the average time function of all the traces from every individual autocorrelation. Both processes partly helped to eliminate the influence of the virtual-source time function but did not deliver optimal results. For the sake of the interpretation, we have preferred to mute the virtual-source time function, as the previously mentioned techniques have not been entirely successful. The different approaches used in order to eliminate the influence of the delta pulse are illustrated in the Supplement (Fig. S3 and text).
The entire processing workflow of the earthquake recordings yields a pseudo zero-offset section with the reflection response of the lithospheric structure below all stations (Fig. 4). Further post-processing steps, such as elevation correction, have been considered but discarded. The maximum elevation difference in the area is approximately 1 km, which assuming an average crustal P-wave velocity of 5.5 km s−1 would represent a time shift of 0.36 s, which would not modify the possible interpretation of reflectors at the lithospheric scale.
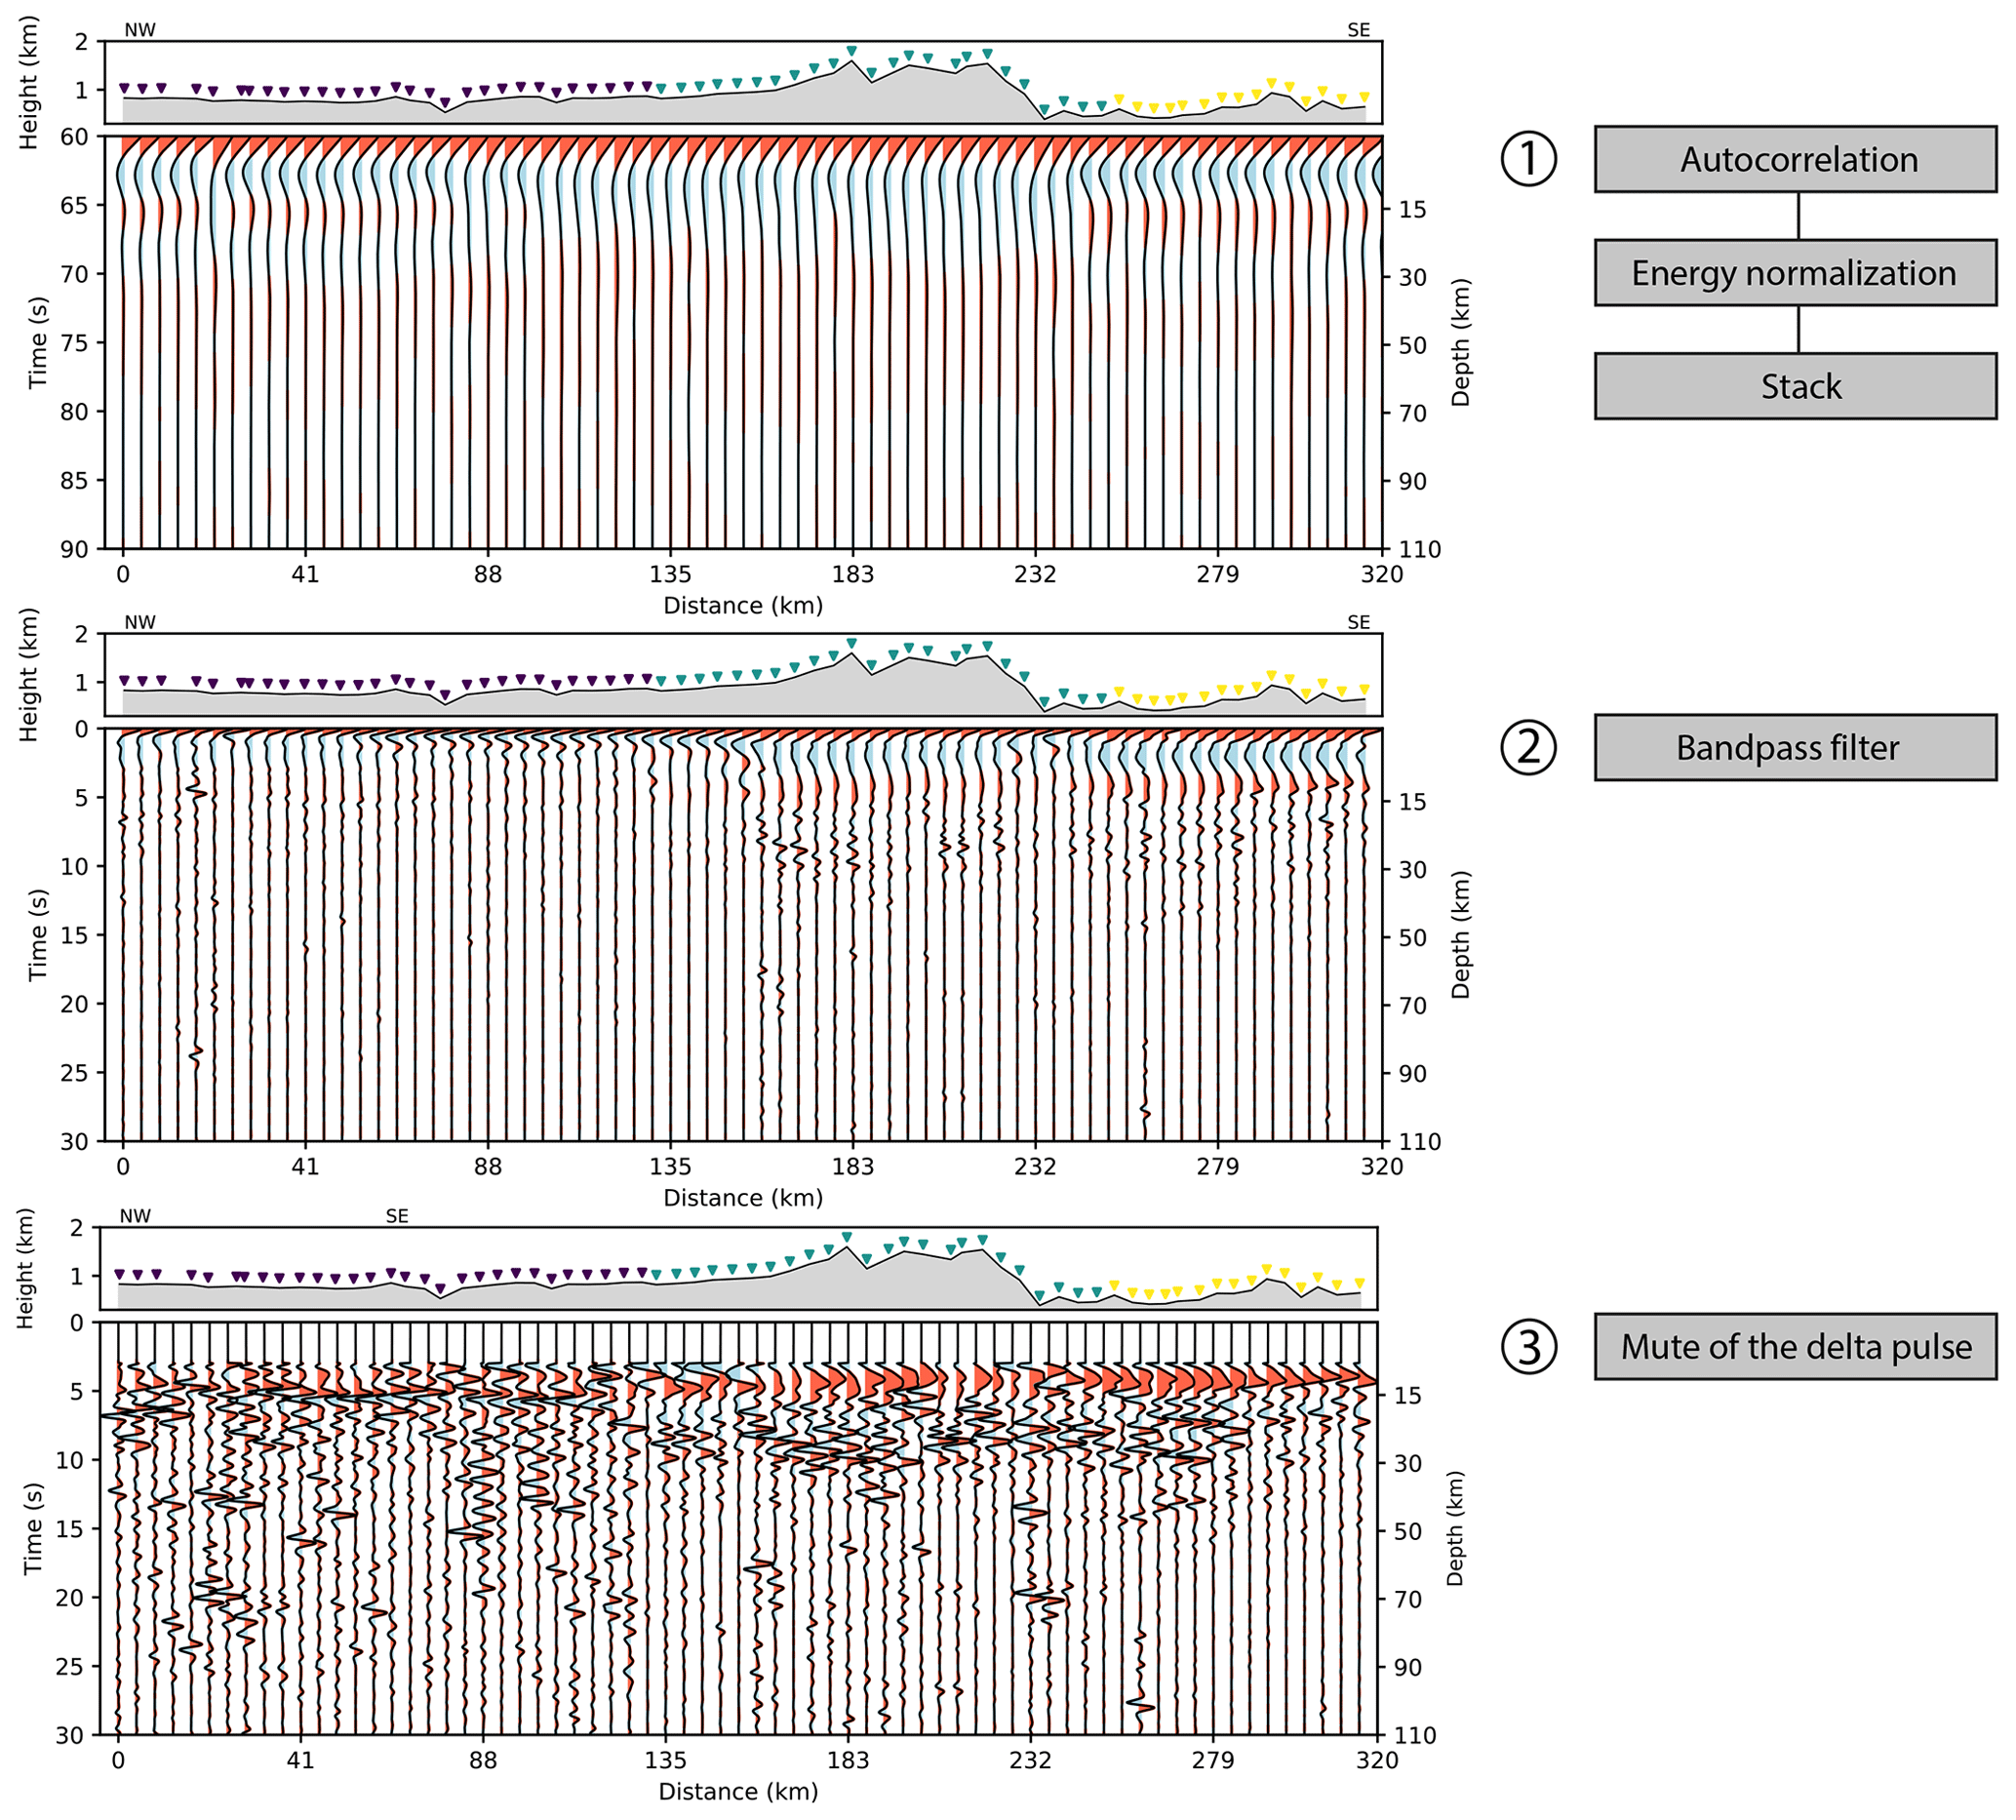
Figure 4Stages of the processing of zero-offset reflection data to construct the lithospheric image across the Spanish Central System.
We present a P-wave reflectivity profile obtained by stacking autocorrelograms from phases of global earthquakes (Fig. 4). The section crosses, from NW to SE, the Duero Basin (DB), Central System (CS), Tajo Basin (TB), and also the Toledo mountains in the Central Iberian Zone (CIZ) (Fig. 1), and it can be regarded as an image of the reflectivity of the upper lithosphere down to 30 s two-way travel time (TWT).
We have applied a time-to-depth conversion to display the estimated depth at which we obtain reflectors. The conversion is applied to the time axis to the left and is displayed on the right axis of Fig. 4, but the velocity model is not too certain, thus the depth serves only as a reference. This conversion uses the velocity profile of shot 3 from the ALCUDIA-WA experiment, down to Moho depths (Ehsan et al., 2015), which is fairly close to the southern end of our profile but at an offset of around 20 km (see Fig. 1). Below the Moho, a constant velocity of 8 km s−1 has been used in the conversion. In areas with a sedimentary cover as the Duero Basin in the northern part of the profile, the depth conversion might not be accurate because of the lower velocity in sediments, thus overestimating the real reflector depths. In addition, in areas where the crust is thicker, the resulting depth would also be overestimated as we might have used mantle velocities in crustal areas.
The relatively long distance covered by the profile and the relatively close station spacing (≈4.8 km) ensure a high lateral resolution of the lithospheric structure of the study area. The section shown in Fig. 4 shows alternating bands of high and low reflectivities and also distinct areas of high and low frequencies. The most conspicuous observations are (1) a high-reflectivity band from the surface down to 9.5–12 s TWT, with much lower reflectivity below and (2) another band of high-amplitude low-frequency arrivals in the southern half of the profile above 5.5 s TWT. This band continues to the N with slightly higher frequency and lesser amplitude arrivals that are slightly shallower. Also, apparently random reflectivity appears below 12 s TWT.
The first of the abovementioned reflective layers represents the highly reflective continental crust which can be easily separated from a more transparent mantle in this part of the CIZ and is one of the keys to calculate the crustal thickness. Among the reflectors found within the crust, a marked package of arrivals is found between 3 and 5.5 s TWT throughout the profile. This displays an almost flat structure underneath the Central System, while thinning towards the N and S of the profile. As seen in the wiggle image in Fig. 4, this shallower band of reflectivity presents a different signature in the three domains, the Central System, the Tajo Basin, and the Duero Basin, displaying much lower frequencies in the Central System. Accordingly, to the N and S, the reflectivity band is defined by higher-frequency wiggles, which become very coherent to the S. Moreover, in the first 70 km of the profile this band of reflectivity features lower amplitudes and exhibits less continuity while showing a similar waveform to the wiggles further S. The bottom of this thick band of reflectivity defines a discontinuity at an average depth of 5.5 s TWT. Based on the characteristics of this feature, we can state that this discontinuity is shallower, sharper, and better defined in the northern and southern parts of the profile, although it covers the entire section. We interpret this discontinuity as the upper-crust–lower-crust boundary. Thus, the upper crust features a homogeneous (low-frequency) signature in the Central System and is probably thinner and more heterogeneous to the N and S.
The lower crust features a high and heterogeneous reflectivity that is interpreted as the seismic expression of a laminated layer, as seen in the ALCUDIA-NI experiment (Martínez-Poyatos et al., 2012; Ehsan et al., 2014). Within this lower band of reflectivity, differences also exist between the central-southern part and the northern sector. Below the Duero Basin, a less reflective lower crust exists up to 135 km of distance, while below the Tajo Basin and the Central System the reflections have higher amplitudes overall, indicating higher impedance contrasts in that area and a coherent response regardless of the differences at upper crustal levels.
The crust–mantle discontinuity is marked by a transition from high-amplitude reflections to a much lower-amplitude seismic signature; it is difficult to define a sharp Moho discontinuity with this dataset. This transition features an increase in seismic impedance and is located between 9.5 and 12 s TWT (peak wiggles in Fig. 4). The Moho is shallower and more difficult to define in the northern sector where it appears slightly above 10 s. Following the abrupt end of the crustal reflectivity from the north, we observe a slight fluctuation around 10 s TWT until 180 km distance along profile. Below the Central System a clear step is found, and we might speculate on a possible Moho doubling. At this point, below the highest elevation of the mountain range, the highest reflectivity is extending down to 12 s TWT, possibly marking the presence of a deep Moho. Then it shallows southwards until 230 km distance, where it becomes almost flat again, featuring depths of 10 s TWT until the end of the profile.
As expected, the mantle is more transparent than the crust and reflections are scattered and less abundant. In general, the northern sector is characterized by slightly higher reflectivity than the central and southern areas. A reflector can be followed up below the Tajo Basin and Toledo mountains at 14 to 13 s TWT. Another possible reflector at 19–20 s TWT is doubtfully visible under the Duero Basin and at a distance of 230 km. At latter times, there are no clear arrivals with high enough continuity as to define a reflector (Fig. 4).
In this work, we present the first reflectivity profile of the lithosphere under the Central Iberian Zone, in the Iberian Massif, by means of SI applied to global-earthquake data. The resulting image (Fig. 5) provides key insights into understanding the internal structure and tectonic evolution of the Central System and the surrounding sedimentary basins. In the following sections, we analyse and address the nature and geometry of the crust and mantle reflectors and their possible origin. Our interpretation approach relies on the identification of arrivals which have lateral coherence, along with similar waveforms. In general terms, good lateral reflectivity is retrieved along the profile where clear crustal reflectors can be identified. Although in this work we use low-frequency global phases, the crust can be divided into upper and lower crust, both coinciding with the main reflectivity zones seen in the ALCUDIA-NI profile, which uses a higher-frequency dataset (8–80 Hz). The upper crust extends from 0 to 5.5 s TWT on average (0–15 km), while the lower crust goes down to 9.5–12 s TWT (29–38 km). Therefore, two crustal-scale discontinuities are identifiable: the base of the upper crust at 5–5.5 s TWT and the crust–mantle discontinuity between 9.5 and 12.5 s TWT. Finally, the lithospheric mantle covers the rest of the profile from depths of 29 to 39 km and also features two discontinuities at 13–14 s TWT and around 19–20 s TWT.
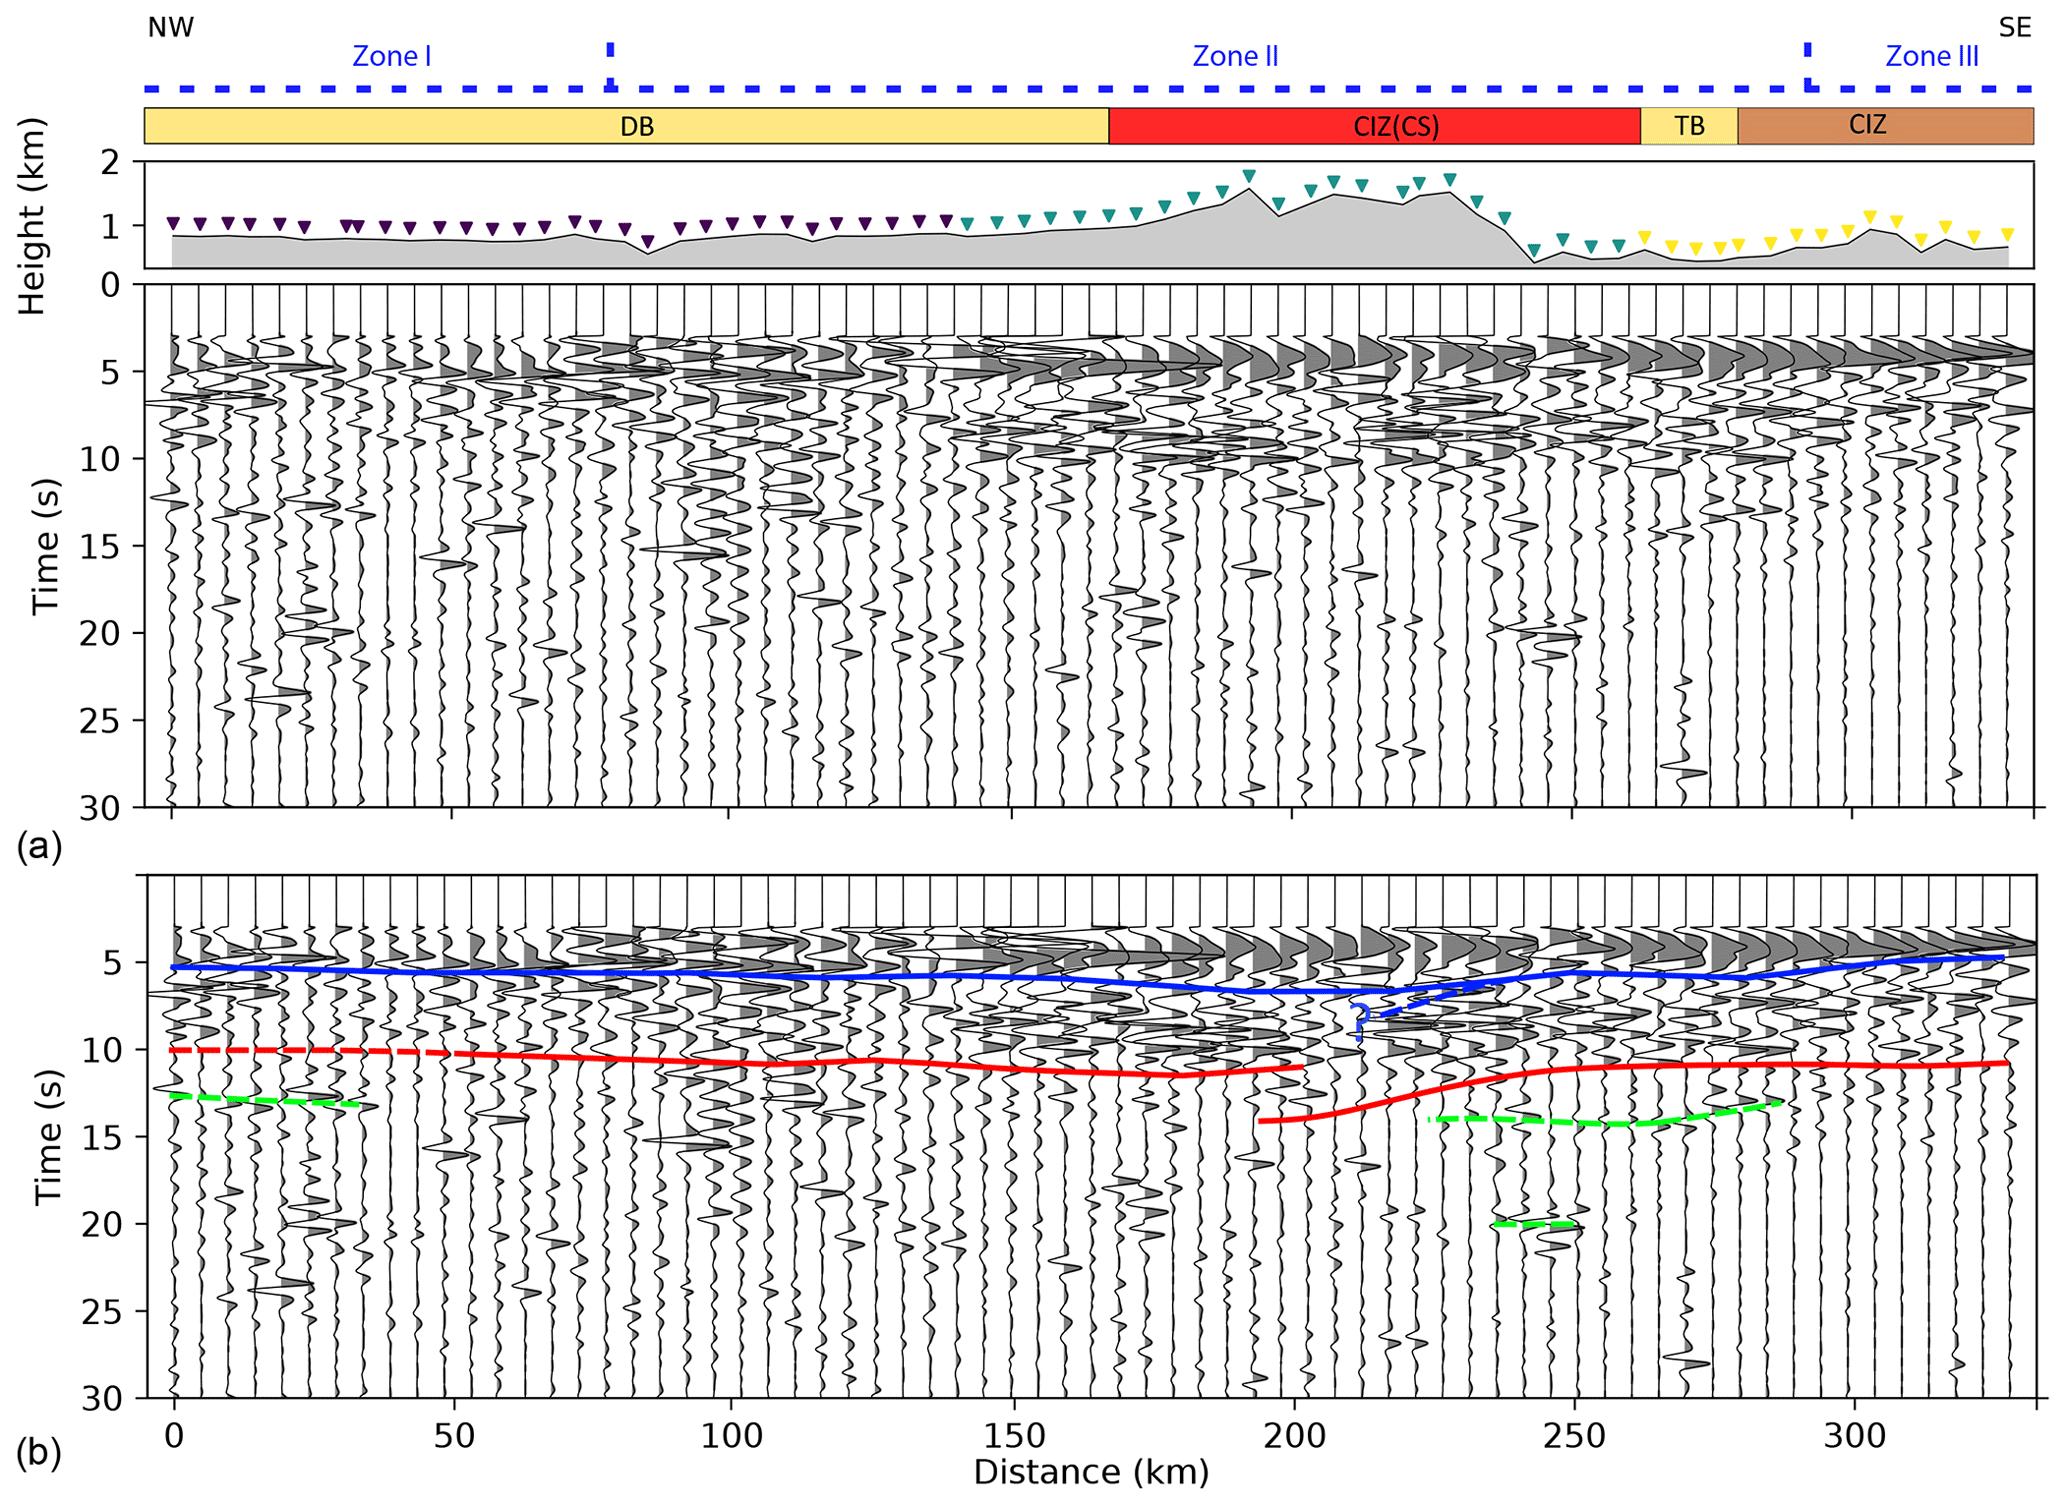
Figure 5(a) Reflectivity profile retrieved by global-phase seismic interferometry. In the wiggle plot, the grey lobes indicate positive polarity. On top is the extent of the geological areas crossed by the profile and the boundaries of the granitic magmatism. Coloured triangles represent the different acquisition stages (from north to south: third, first, and second deployments). (b) Interpretation of the lithospheric reflectivity profile. Solid lines mark stable features, and dashed lines indicate possible features. The blue line marks the boundary between the upper crust and the mid-lower crust. The red line is the crust–mantle boundary. Scattered reflectivity within the upper mantle is marked by the dashed green lines.
7.1 Upper crust
The upper crust observed as part of the CIMDEF experiment (Fig. 5) is identified between 3 and 5.5 s TWT (7–15 km) and is characterized by a package of reflectivity with high-amplitude events and, in places, rather low frequencies. However, this package shows some differences along the profile. Below the Duero Basin two different types of reflectivity are found. From 0 to 70 km distance, relatively low-amplitude reflectivity with higher frequencies is observed. Then, higher amplitudes appear up to the Central System location. There, the reflectivity has much lower frequencies and even higher amplitudes. The signature changes again below the Tajo Basin and the Toledo mountains where higher frequencies are present again and high amplitudes are exhibited. These changes in reflectivity do not coincide with the areas surveyed in each one of the three deployments and therefore, could be attributed to lithological changes associated with the outcropping geology.
The upper crustal image observed in this section allows us to establish a correlation between the reflectivity signatures and the Carboniferous–Permian magmatic zonation of the Iberian Massif (Simancas et al., 2013). According to these authors, the magmatism in the Iberian Varsicides can be divided into four areas depending on its characteristics. From N to S, the CIMDEF profile crosses zones I, II, and III. Zone I includes the Cantabrian and Asturian Leonese zones, is characterized by a negligible volume of post-orogenic granitoids, and corresponds to the first 70 km of the profile. Zone II has large volumes of Carboniferous granitoids (Bea, 2004) related to recycled metasediments from the continental crust (Villaseca et al., 1998; Bea et al., 2003). In this context, crustal thickening and extension has been proposed to support the high production of granites (Pérez Estaún et al., 1991; Martínez Catalán et al., 2014). This area represents 170 km of the profile. The final zone intersected by the experiment has much less abundant granitoids than the previous zone and represents the last 80 km of the southern end of the profile. The boundary between zones I and II coincides with a reflectivity change at the upper crustal level in our profile, as the first 70 km features a lower-amplitude signature, more heterogeneous reflectivity, and higher-frequency events than the rest of the profile. Within zone II, another change in signature is found around 140 km distance, where a high-frequency high-amplitude reflectivity is followed by a high-amplitude low-frequency reflectivity. This transition lies slightly to the N of the contact between the Tertiary sediments of the Duero Basin and the outcropping granitoids of the Central System. Despite the fact that our profile cannot constrain the uppermost part of the upper crust, the relationship between surface geology and our results is evident, and we assume that the main contacts observed at the surface are at the same locations as observed here at 3 s TWT (8–9 km). Accordingly, we suggest that the extension of granites in zone II can be prolonged to the N of the Central System, even though they do not outcrop as they are covered by the Duero Basin sediments. In this context, it can be stated that below the Central System the upper crust is mainly formed by granites down to 5.5 s TWT, as they are massive lithologies that do not feature sharp impedance contrasts at the scale of the sampling waves. Zone III is imaged by the upper crustal reflectivity in the Tajo Basin and further S, which depicts the seismic response of metasediments featuring vertical folds accompanied by few granites, thus providing scarce impedance contrasts visible to high-frequency waves and giving a high-amplitude but relatively low-frequency response. As a summary, it can be inferred that the seismic signature of the upper crust sampled by the CIMDEF experiment is strongly influenced by the amount of granites and overall differences between its seismic response of igneous (granitoids) rocks and that of (meta)sedimentary rocks, the former being the source of a low-frequency homogeneous seismic signature.
7.2 Lower crust
Below the upper crust, the CIMDEF experiment shows a highly reflective lower crust along most of the central segment. However, lower-amplitude reflectivity is found in the first 130 km to the N. Also, from the southern border of the Central System to the end of the profile, amplitudes at a lower-crustal level are somehow lower than underneath the Central System.
Although GloPSI has low resolution when compared to active-source vertical-incidence reflection data, a similar reflective pattern is again identified between both types of datasets. The lower limit of the upper crust correlates well with a mid-crustal discontinuity identified in the IBERSEIS-NI and ALCUDIA-NI datasets to the S (Simancas et al., 2003; Martínez-Poyatos et al., 2012; Ehsan et al., 2014) and also found in the ESCIN-2 and ESCIN-3.3 profiles to the N (Pulgar et al., 1996; Ayarza et al., 1998). This interface is present from the SPZ, the OMZ, and the southern part of the CIZ as well as in the WALZ and in the northern border between the Duero Basin and the Cantabrian Mountains. It has been regarded as the Variscan brittle–ductile transition (Simancas et al., 2003; Palomeras et al., 2009; Martínez-Poyatos et al., 2012; Ehsan et al., 2015), although ductile Variscan deformation is widespread at outcrop level in these areas, i.e. in what is supposed to be the fragile part of the Variscan crust. From a seismic point of view, this interface characterizes the division between the top of a highly laminated lower crust and a more transparent upper crust. Furthermore, this boundary separates areas with different patterns of deformation suggesting that the former might act as a detachment. Estimations of shortening at upper- and lower-crust levels suggest that this detachment might have accommodated most of the deformation (Martínez-Poyatos et al., 2012; Simancas et al., 2013), although these estimations fail to control the amount of ductile deformation and the part of the latter may be previous to the Variscan orogeny at lower crustal level.
As in the previous datasets, in the CIMDEF profile this boundary is not identifiable by a marked reflection but rather by a change in the reflectivity signature between the upper crust and the lower crust. In our profile (Fig. 5), we have also imaged how this interface continues to the north at approximately the same depth (5 s TWT). The existence of this discontinuity, which represents a boundary between layers with different deformation patterns, indicates that the upper and lower crusts should have had some degree of decoupling during their tectonic evolution. If this boundary was Variscan in age, its original position could have been modified by the late Variscan igneous activity affecting the CIZ, mostly the Central System area. This may be the reason why it appears slightly deeper in the central part of the profile. In the southern border of the CS, this interface could be continuous but also could be imbricated as an effect of the shortening, as imaged in Figs. 5 and 6. Below the southern border of the CS, there is a small area where the high-reflectivity pattern of the lower crust seems to be above that of the upper crust thus suggesting the existence of this imbrication. Nevertheless, to confirm this feature higher-resolution studies are needed.

Figure 6Sketch of the proposed crustal geometry, overlapped with Moho results from gravity inversion and receiver function (RF). (a) Model where the S thrust and the Tiétar fault lie within the upper crust and only the lower crust imbricates; (b) model where the entire crust imbricates below the CS.
Variscan orogenic evolution led to a thickening of the crust in the central and northern part of the CIZ during Carboniferous times. This triggered extension and widespread magmatism (Pérez Estaún et al., 1991; Díez Balda et al., 1995; Martínez-Poyatos et al., 2012) during late Carboniferous and early Permian times. The presence of high-frequency reflections at lower crustal levels below the Central System evidence that here not all the crust melted during the Variscan orogeny. Massive granitoids do not produce reflections but rather a transparent low-frequency response. We infer then that the lower crust below the Central System was not entirely affected by crustal melting as intense reflectivity remains. Northwards, below the Duero Basin, the lower crust is less reflective. To explain this difference, three scenarios could be invoked. First, the presence of a partly melted lower crust that would imply the onset of extension and melting of the area. However, the outcropping rocks present a low metamorphic degree, which is incompatible with this scenario. Second, the pre-Variscan lower crust of this area had a slightly different composition and deformation compared to its continuation to the S and N. These contrasting features might have translated into a different response to deformation during the Variscan compressional and extensional stages. Last but not least, the northern part of the CIMDEF profile lies in the Duero sedimentary basin, where Tertiary and Quaternary sedimentary layers might have absorbed part of the seismic energy, thus attenuating the corresponding amplitudes. This hypothesis is supported by the fact that, in general, amplitudes are lower in the northern part of the profile.
The Moho topography of the Central System has been suggested, by gravity modelling (de Vicente et al., 2007) and seismic receiver functions (RF) (Mancilla and Diaz, 2015), to have a gentle bulk in a synform-like structure of long wavelength, increasing its thickness up to 2–3 km with respect to its surroundings. The crust–mantle discontinuity here (Fig. 5) is not presented as a unique and sharp reflection but by a change in the reflectivity pattern instead. We have interpreted the discontinuity (Fig. 5) at 9.5–12 s (29–38 km), based on the position of a boundary between a highly reflective crust that passes to an upper mantle characterized by low-reflectivity and small-amplitude events. In normal-incidence seismic data, the contrast between high and low reflectivities (or transparent) has been used as the criteria to define the position of the Moho (Carbonell et al., 2013). This reflectivity boundary is irregularly distributed, being shallower to the N, around 9.5–10 s (29 km) and deepening in the central part of the profile, although shallowing again to the S. Accordingly, below the highest peak of the Central System, an overlap of two Moho branches is interpreted (Fig. 5), being the deepest set of reflectors at 12 s TWT (38 km). This package of reflectivity is limited to the recordings of two stations and covers a distance of ≈15 km, while the whole thickening covers an area of ≈100 km, going from the southern border of the Central System and to the southern part of the Duero Basin. The fact that the presence of these deeper reflections is limited to two stations might not be a structural feature but be related to the methodology itself. Because GloPSI uses near-vertical incident energy, it is insensible to steeply tilted structures, as the reflection of these cannot be recorded below the same station. Thus, if a steep angle is found in a structure below the Central System, our results would not recover it. Furthermore, the frequency content of such distant earthquakes is quite low, limiting the vertical resolution that can be resolved. As a consequence, other reflections that are shallower than those two already retrieved but deeper than the Moho, between these two and the S limit of the CS, might not be resolved with the frequency used in our study, or the signal could be mixed with that of the lower crust.
In Fig. 5, we have interpreted this crustal thickening as the result of the lithospheric compression that occurred during the Alpine orogeny, which has further modified the structure of the Variscan crust, triggering an imbrication and developing a crustal root that can be only partly observed with this dataset. This structure would be similar to the imbrication of lower crust identified in the Cantabrian Mountains and Pyrenees as a result of Alpine compression (Pulgar et al., 1995; Teixell et al., 2018, among others). Although in our case the observation of this underthrusting is limited by the number of recording stations, a clear thickening of the crust below the Central System can be observed. The northern boundary of this crustal thickening reveals no apparent correlation with major outcropping structures. However, the southern boundary of the thickened crust lies close to the south Central System (SCS) thrust and to the fault system that defines the Tiétar river basin (Fig. 6a and b). A prolongation of this lower crustal imbrication into the upper crust could project in any of these thrusts and would imply that the whole crust is in fact somehow imbricated, giving us additional insights into the origin of the low topography of the meseta to the S of the Central System (Fig. 6b). However, this would require that the identified Variscan mid-crustal detachment did not work as such during the Alpine compression (as shown in Fig. 6a), allowing compressive structures to affect both the upper and the lower crust simultaneously. In addition, seismic profiles crosscutting the Madrid Basin and the SCS thrust to the NE of our profile (de Vicente et al., 2013) do not show underthrusting of sediments of this basin, indicating that if this tectonic feature exists, it is probably related to the Tiétar river fault system.
The crustal pattern suggested above correlates well with the results of a magnetotelluric profile carried out in the same area (Pous et al., 2012). In their image, a zone of lower resistivity is found around the Tiétar fault, which affects not only the upper crust but also extends into the lower crust, and connects even with the Moho. This low resistivity is associated with a set of faults cutting the upper crust and could be extended to cut the whole crust, although they do not need to be necessarily connected. Furthermore, preliminary results from ambient seismic noise data (Andrés et al., 2019) illustrate the same scenario for the crust–mantle boundary, as do new wide-angle seismic data acquired within the CIMDEF experiment, where the mid-crust discontinuity and cortical structures are clearly visible. In any case, the resolution of this dataset does not allow us to identify steeply dipping crustal features. Higher-resolution solutions and estimations of the shortening at upper and lower crustal levels should be used to support any of these hypotheses. In any case, the structure of the CS suggested by the present dataset is that of an asymmetric orogen.
Figure 6 shows a sketch of the interpretation of the CIMDEF GloPSI profile overlapped with the Moho geometry deduced from gravity inversion (Torne et al., 2015) and a compilation of active-source and RF Moho depths (Diaz et al., 2016). Also, the geometry of the inferred imbrication, involving just the lower crust (Fig. 6a) or the upper and lower crust (Fig. 6b), is included. In general, there is a good agreement between the three models, with only small mismatches in the root area. To the S, a similar thickness of around 32–34 km is depicted from the different models. To the N, the model presented in this paper shows a thinner crust of around 30 km, while the two other models present thicknesses of 32–33 km. This mismatch, which is reduced along the profile towards the northern border of the CS, could be due to the existence of low-velocity sediments in the Duero Basin that lead to errors in the time-to-depth conversions. The differences below the CS affect the depth as well as the geometry of the crust–mantle interface. The Moho discontinuity in Diaz et al. (2016) presents a rather flat geometry, depicting a little 1 km thick root. The results from gravity inversion, while being closer to our results regarding crustal thickness, are highly influenced by the inclusion of the topography in the inversion procedure. Accordingly, the crustal thickening starts further to the S, showing a progressive thinning in the area where our crustal thickness is maximum. This implies that the model based on gravity inversion relates the root with local isostasy, whereas our model infers a tectonic influence in the geometry and position of the crust–mantle boundary. In any case, the resolution of the datasets and the limitations of the GloPSI technique in imaging steeply dipping interfaces allows for the observed small differences in the results of different techniques.
The mechanism that gives rise to the uplift and crustal thickening of the Central System is an ongoing discussion where two main hypotheses are proposed. First, several studies (Cloetingh et al., 2002; de Bruijne and Andriessen, 2002; de Vicente et al., 2007, 2018) have suggested lithospheric folding of Iberia to be the driving force. They base their hypothesis on gravity and analogue modelling, basin infill, and structural analysis of outcropping geology. They propose a model where the crust has buckled entirely, and deformation is represented in the upper crust by the formation of pop-ups that uplift the basement, while ductile deformation is present in the lower crust. The folding wavelength in continental Iberia is calculated to be between 150 and 250 km (Muñoz-Martín et al., 2010). The second hypothesis proposes that a detachment level runs from the Betics to the S or the Pyrenees to the N (Quintana et al., 2015). This solution would mean that a simple shear with a detachment at some crustal level would accommodate the shortening and provide the uplift of the Central System. Our reflectivity image provides insights that might shed some light onto its structure. Despite the presence of a clear thickening under the Central System, which affects the upper crust, the lower crust is not much bulked, but it seems tectonically imbricated below the Central System, thus defining and asymmetry. Furthermore, the wavelengths proposed for the lithospheric folding should be visible in our array length, but contrarily the thickening of the crust under the Central System seems to be the only remarkable curvature within the crust. The second hypothesis discussed above is mainly based on the idea that the Central System has a small crustal root. This statement is based on the current geophysical knowledge of the area which includes gravity modelling (de Vicente et al., 2007), gravity inversion (Torne et al., 2015), and receiver-function studies (Mancilla and Diaz, 2015). Considering our results, the crustal root is not as small as previously seen in other geophysical datasets, and at the deepest point it might define an offset of 6–7 km. We suggest that the crustal root should have formed during the Alpine orogeny by the compression of Africa in the NW direction. Consequently, we infer underthrusting or stacking and imbrication of two layers of (lower) crust as the formation mechanism. This might have accommodated much the shortening produced during the compression. If the entire crust (and not just the lower crust) were imbricated, this hypothesis could further explain the elevation difference between the Tajo and Duero basins, as the latter is isostatically supported by a thicker crust and the former is underthrusting.
7.3 Upper mantle
The upper-mantle reflections are scattered within the profile at two main levels (Fig. 5) – between 13 and 14 s TWT and between 19 and 20 s TWT. Both reflections have low lateral continuity, and, although they are visible almost throughout the entire array, the lack of continuity among patches of reflectivity hinders their interpretation and definition of their geometry. Both sets of reflectivity are nearly parallel except below the Central System, where the first reflection deepens while the second does not. At these depths, 45–55 km for the top reflection and 70–75 km for the bottom one, other similar reflectors have been found in southern Iberia. In the IBERSEIS profile, a zone between 61 and 72 km depth was modelled, corresponding to what the authors interpreted to be the Hales discontinuity (Ayarza et al., 2010). The same discontinuity has been imaged by the ALCUDIA-WA datasets. The discontinuity, modelled by wide-angle seismic data, is proposed to be related to the mineral phase transition from spinel-lherzolite to garnet-lherzolites (Hales, 1969). To compensate for the low reflection coefficient of this phase change and to explain the thickness and high reflectivity of this feature, an area of layering or lenses with different ratios of spinel/garnet and thicknesses that allow constructive interferences of the seismic waves have been proposed. Moreover, to the N, below the ALCUDIA-NI profile (Martínez-Poyatos et al., 2012), conspicuous scattered reflectors are found at the same time/depth, between 13–14 and 19 s TWT. These have been interpreted to also be images of the Hales discontinuity in the area. In the same form, the reflectivity seen below the CIMDEF experiment between 45 and 75 km might be related to a mineral phase transition. To confirm the existence and extent of this area, velocity information would be needed. In this regard, a similar scenario is found below the Urals, where a heterogeneous upper mantle, as the one of this study, was sampled by a dense wide-angle seismic experiment (Carbonell, 2004).
However, the lack of control on possible artefacts within the upper mantle should be noted and these results should be taken carefully.
In this work, we present a lithospheric-scale reflectivity profile of the central part of the Iberian Peninsula by means of global-phase seismic interferometry (GloPSI) acquired as part of the CIMDEF project. The array covers the Cenozoic Duero and Tajo basins to the N and S, respectively, of the Central System. The most relevant finding of the resulting image is the thickening of the Central System crust through a northward-directed imbrication of its lowermost part. In general, the crust–mantle boundary presents depths between 29 and 31 km to the N and S of the profile, while below the Central System it reaches depths of 38 km. The crustal thickening has a wavelength of around 100 km, and encloses the entire Central System from the southern thrust, the boundary to the S with the Tajo Basin, until the southern border of the Duero Basin. As yet, it is not clear if the imaged lower crust imbrication affects also the upper crust. In fact, the surface projection of this feature could be projected on top of the southern Central System thrust or the Tiétar river fault system, thus indicating that the whole crust might be affected by this feature and further explaining the low topographies of the meseta to the S of the Central System. However, the fact that a Variscan mid-crustal detachment has been inferred and the lack of estimations of lower-crustal shortening hinder this interpretation. Higher-resolution datasets are necessary to image these features.
Furthermore, the profile reveals a clearly different reflectivity signature within the crust. The crust is subdivided into two main layers, the upper and lower crust. The upper crust is inferred to be formed mainly by massive granitoids under the Central System down to 5.5 s TWT, as its seismic response is dominated by low frequencies and high amplitudes. Below this layer, the lower crust is characterized by high-frequency high-amplitude arrivals, supporting the existence of high-impedance-contrast layers that have been already imaged with vertical incidence data in the lower crust to the S and N of the CIMDEF profile.
The interface that separates the upper and lower crusts (≈ 12.5–15 km depth) is proposed to be a detachment level between both crusts. However, the characteristics of the outcropping rocks, showing ductile deformation in many areas, hinders its interpretation as a fragile–ductile transition. Further studies about this interface are in progress and will be presented elsewhere.
Within the upper mantle, patches of reflectivity are found in two bands, 45–55 km depth and 70–75 km depth. Both reflections are scattered through the profile and appear almost flat. We relate them both with the possible N extension of the Hales discontinuity, the transition zone from spinel-lherzolite to garnet-lherzolite already observed to the S of this profile.
Data are available in the Labsis repository by selecting the corresponding year for each deployment. For access to the data, contact Juvenal Andrés or Ramon Carbonell.
The supplement related to this article is available online at: https://doi.org/10.5194/se-10-1937-2019-supplement.
JA, MR, IM, and PA acquired the data. JA and DD processed the data. JA prepared the article. All authors have contributed to the discussion and article review.
The authors declare that they have no conflict of interest.
The data used for the research carried out in this contribution are stored at the DIGITAL.CSIC data repository. We would like to acknowledge the ICTJA-CSIC Seismic Laboratory (http://labsis.ictja.csic.es/, last access: 11 November 2019) for making their seismic station available for this experiment. We thank the editor Irene Bianchi for her comments and for handling the article. We also acknowledge two anonymous reviewers for their constructive comments.
This research has been supported by the Spanish National Research Program (grant nos. CGL2014-56548-P and CGL2016-81964-REDE), the regional government of Castilla and León (project SA065P17), and the Generalitat de Catalunya (grant no. 2017-SGR-1022); Juvenal Andrés is supported by FPI (Formación de Personal Investigador) from the Spanish Ministry of Science, Innovation and Universities (grant no. BES-2015-071683).
This paper was edited by Irene Bianchi and reviewed by two anonymous referees.
Andrés, J., Draganov, D., Ayarza, P., Schimmel, M., Palomeras, I., Ruiz, M., and Carbonell, R.: Imaging the lithospheric structure of the Central Iberian Zone, Geophys. Res. Abstr., EGU2019-7690, EGU General Assembly 2019, Vienna, Austria, 2019.
Ayarza, P., Martínez Catalán, J. R., Gallart, J., Dañobeitia, J. J., and Pulgar, J. A.: Estudio Sísmico de la Corteza Ibérica Norte 3.3: A seismic image of the Variscan crust in the hinterland of the NW Iberian Massif, Tectonics, 17, 171–186, 1998.
Ayarza, P., Palomeras, I., Carbonell, R., Afonso, J. C., and Simancas, J. F.: A wide-angle upper mantle reflector in SW Iberia: Some constraints on its nature, Phys. Earth Planet. In., 181, 88–102, https://doi.org/10.1016/j.pepi.2010.05.004, 2010.
Barbero, L. and Villaseca, C.: Eclogite facies relicts in metabasites from the Sierra de Guadarrama (Spanish Central System): P-T estimations for the Hercynian evolution, Mineral. Mag., 64, 815–836, 2000.
Bea, F.: La naturaleza del magmatismo de la Zona Centroibérica: Consideraciones generales y ensayo de correlación, in: Geología de España, edited by: Vera, J. A., 128–133, SGE-IGME, Madrid, 2004.
Bea, F., Montero, P., and Zinger, T.: The nature, origin and thermal influence of the granite source layer of Central Iberia, J. Geol., 111, 579–595, 2003.
Carbonell, R.: On the nature of the mantle heterogeneities and discontinuities: evidence from a very dense wide-angle shot record, Tectonophysics, 388, 103–117, 2004.
Carbonell, R., Simancas, F., Juhlin, C., Pous, J., Pérez-Estaún, A., González-Lodeiro, F., Muñoz, G., Heise, W., and Ayarza, P.: Geophysical evidence of a mantle derived intrusion in SW Iberia, Geophys. Res. Lett., 31, L11601, https://doi.org/10.1029/2004GL019684, 2004.
Carbonell, R., Levander, A., and Kind, R.: The Mohorovičić discontinuity beneath the continental crust: An overview of seismic constraints, Tectonophysics, 609, 353–376, https://doi.org/10.1016/j.tecto.2013.08.037, 2013.
Claerbout, J.: Synthesis of a layered medium from its acoustic transmission response, Geophysics, 33, 264–269, https://doi.org/10.1190/1.1439927, 1968.
Cloetingh, S., Burov, E., Beekman, F., Andeweg, B., Andriessen, P. A. M., Garcia-Castellanos, D., de Vicente, G., and Vegas, R.: Lithospheric folding in Iberia, Tectonics, 21, 1041, https://doi.org/10.1029/2001TC901031, 2002.
De Bruijne, C. H. and Andriessen, P. A. M. F.: Fault related denudation in the Spanish Central System (central Spain), recording the far field effects of Alpine plate tectonic history of the Iberian microplate, Tectonophysics, 349, 161–184, 2002.
de Vicente, G., Giner, J. L., Muñoz-Martín, A., González-Casado, J. M., and Lindo, R.: Determination of present-day stress tensor and neotectonic interval in the Spanish Central System and Madrid Basin, central Spain: Dynamics of Extensional Basins and Inversion Tectonics, Tectonophysics, 266, 405–424, https://doi.org/10.1016/S0040-1951(96)00200-4, 1996.
de Vicente, G., Vegas, R., Muñoz Martín, A., Silva, P. G., Andriessen, P., Cloetingh, S., González Casado, J. M., Van Wees, J. D., Álvarez, J., Carbó, A., and Olaiz, A.: Cenozoic thick-skinned deformation and topography evolution of the Spanish Central System, Global Planet. Change, 58, 335–381, https://doi.org/10.1016/j.gloplacha.2006.11.042, 2007.
de Vicente, G., Cunha, P. P., Muñoz-Martín, A., Cloetingh, S. A. P. L., Olaiz, A., and Vegas, R.: The Spanish-Portuguese Central System: An example of intense intraplate deformation and strain partitioning, Tectonics, 37, 4444–4469, https://doi.org/10.1029/2018TC005204, 2018.
Diaz, J., Gallart, J., and Carbonell, R.: Moho topography beneath the Iberian-Western Mediterranean region mapped from controlled-source and natural seismicity surveys, Tectonophysics, 692, 74–85, https://doi.org/10.1016/j.tecto.2016.08.023, 2016.
Díez Balda, M. A., Vegas, R., and González Lodeiro, F.: Central- Iberian Zone. Autochthonous Sequences. Structure, in: Pre-Mesozoic Geology of Iberia, edited by: Dallmeyer, R. D. and Martínez García, E., 172–188, Springer, Berlin, 1990.
Díez Balda, M. A., Martínez Catalán, J. R., and Ayarza, P.: Syn-collisional extensional collapse parallel to the orogenic trend in a domain of steep tectonics: The Salamanca detachment zone (Central Iberian Zone, Spain), J. Struct. Geol., 17, 163–182, 1995.
Ehsan, S. A., Carbonell, R., Ayarza, P., Martí, D., Pérez-Estaún, A., Martínez-Poyatos, D., Simancas, F., Azor, A., and Mansilla, L.: Crustal deformation styles along the reprocessed deep seismic reflection transect of the Central Iberian Zone (Iberian Peninsula), Tectonophysics, 621, 159–174, https://doi.org/10.1016/j.tecto.2014.02.014, 2014.
Ehsan, S. A., Carbonell, R., Ayarza, P., Martí, D., Martínez-Poyatos, D., Simancas, J. F., Azor, A., Ayala, C., Torné, M., and Pérez-Estaún, A.: Lithospheric velocity model across the Southern Central Iberian Zone (Variscan Iberian Massif): The ALCUDIA wide-angle seismic reflection transect, Tectonics, 34, 535–554, https://doi.org/10.1002/2014TC003661, 2015.
Flecha, I., Palomeras, I., Carbonell, R., Simancas, F., Ayarza, P., Matas, J., González-Lodeiro, F., and Peréz-Estaún, A.: Seismic imaging and modelling of the lithosphere of SW-Iberia, Tectonophysics, 472, 148–115, https://doi.org/10.1016/j.tecto.2008.05.033, 2009.
Fonseca, P. and Ribeiro, A.: Tectonics of the Beja-Acebuches Ophiolite: a major suture in the Iberian Variscan Foldbelt, Geol. Rundsch., 82, 440–447, https://doi.org/10.1007/BF00212408, 1993.
Franke, W.: The mid-European segment of the Variscides: tectonostratigraphic units, terrane boundaries and plate tectonic evolution, Geol. Soc. Spec. Publ., 179, 35–61, https://doi.org/10.1144/GSL.SP.2000.179.01.05, 2000.
Hales, A.: A seismic discontinuity in the lithosphere, Earth Planet. Sc. Lett., 7, 44–46, 1969.
Julivert, M., Fontboté, M., Ribeiro, A., and Conde, L. E.: Mapa y Memoria Explicativa del Mapa Tectónico de la Península Ibérica y Baleares, scale 1 : 1 000 000, 113 pp., Inst. Geol. y Min. de Esp., Madrid, 1972.
Kennett, B. L. N., Engdahl, E. R., and Buland R.: Constraints on seismic velocities in the earth from travel times, Geophys. J. Int., 122, 108–124, 1995.
Mancilla, F. L. and Diaz, J.: High resolution Moho topography map beneath Iberia and Northern Morocco from receiver function analysis, Tectonophysics, 663, 203–211, https://doi.org/10.1016/j.tecto.2015.06.017, 2015.
Martínez Catalán, J. R., Rubio Pascual, F. J., Díez Montes, A., Díez Fernández, R., Gómez Barreiro, J., Dias da Silva, I., González Clavijo, I., Ayarza, P., and Alcock, J. E.: The late Variscan HT/LP metamorphic event in NW and Central Iberia: relationships to crustal thickening, extension, orocline development and crustal evolution, Geol. Soc. Spec. Publ., 405, 225–247, https://doi.org/10.1144/SP405.1, 2014.
Martínez-Poyatos, D., Carbonell, R., Palomeras, I., Simancas, F., Ayarza, P., Martí, D., Azor, A., Jabaloy, A., González Cuadra, P., Tejero, R., Martín Parra, L. M., Matas, J., González Lodeiro, F., Pérez-Estaún, A., García Lobón, J. L., and Mansilla, L.: Imaging the crustal structure of the Central Iberian Zone (Variscan Belt): the ALCUDIA deep seismic reflection transect, Tectonics, 31, TC3017, https://doi.org/10.1029/2011TC002995, 2012.
Matte, P.: The Variscan collage and orogeny (480–290 Ma) and the tectonic definition of the Amorica microplate: A review, Terra Nova, 13, 122–128, https://doi.org/10.1046/j.1365-3121.2001.00327.x, 2001.
Muñoz-Martín, A., de Vicente, G., Fernández-Lozano, J., Cloetingh, S. A. P. L., Willingshofer, E., Sokoutis, D., and Beekman, F.: Spectral analysis of the gravity and elevation along the western Africa–Eurasia plate tectonic limit: Continental versus oceanic lithospheric folding signals, Tectonophysics, 495, 298–314, https://doi.org/10.1016/j.tecto.2010.09.036, 2010.
Nishitsuji, Y., Ruigrok, E., Gomez, M., Wapenaar, K., and Draganov, D.: Reflection imaging of aseismic zone of the Nazca slab by global-phase seismic interferometry, Interpretation, 4, 1A-Y1, https://doi.org/10.1190/int-2015-0225.1, 2016a.
Nishitsuji, Y., Rowe, C. A., Wapenaar, K., and Draganov, D.: Reflection imaging of the Moon's interior using deep-moonquake seismic interferometry, J. Geophys. Res.-Planet., 121, 695–713, https://doi.org/10.1002/2015JE004975, 2016b.
Palomeras, I., Carbonell, R., Flecha, I., Simancas, F., Ayarza, P., Matas, J., Martínez-Poyatos, D., Azor, A., González Lodeiro, F., and Pérez-Estaún, A.: The nature of the lithosphere across the Variscan Orogen of SW-Iberia: Dense wide-angle seismic reflection data, J. Geophys. Res.-Sol. Ea., 114, B02302, https://doi.org/10.1029/2007JB005050, 2009.
Palomeras, I., Carbonell, R., Ayarza, P., Fernandez, M., Simancas, F., Martínez-Poyatos, D., González Lodeiro, F., and Pérez-Estaún, A.: Geophysical model of the lithospher across the Variscan Belt of SW-Iberia: multidisciplinary assessment, Tectonophysics, 508, 42–51, https://doi.org/10.1016/j.tecto.2010.07.010, 2011.
Pérez Estaún, A., Martínez Catalán, J. R., and Bastida, F.: Crustal thickening and deformation sequence in the footwall to the suture of the Variscan belt of northwest Spain, Tectonophysics, 191, 243–253, 1991.
Pous, J., Muñoz-Martín, A., Olaiz, A. J., Seillé, H., and de Vicente, G.: Análisis de la estructura alpina de la corteza del centro de la Península Ibérica: Una sección Magneto-Telúrica a través del Sistema Central (Sierra de Gredos), Geo-Temas, 13, 4–8, 2012.
Pulgar, J. A., Pérez-Estaún, A., Gallart, J., Álvarez-Marrón, J., Gallastegui, J., Alonso, J. L., and ESCIN Group: The ESCIN-2 deep seismic reflection profile: a traverse across the Cantabrian Mountains and adjacent Duero basin, Revista Sociedad Geológica España, 8, 383–394, 1995.
Pulgar, J. A., Gallart, J., Fernández-Viejo, G., Pérez-Estaún, A., and Álvarez-Marrón, J.: Seismic image of the Cantabrian Mountains in the western extension of the Pyrenees from integrated ESCIN reflection and refraction data, Tectonophysics, 264, 1–19, https://doi.org/10.1016/S0040-1951(96)00114-X, 1996.
Quintana, I., Pulgar, J. A., and Alonso, J. L.: Displacement transfer from borders to interior of a plate: A crustal transect of Iberia, Tectonophysics, 663, 378–398, https://doi.org/10.1016/j.tecto.2015.08.046, 2015.
Ruigrok, E. and Wapenaar, K.: Global-phase seismic interferometry unveils P-wave reflectivity below the Himalayas and Tibet, Geophys. Res. Lett., 39, L11303, https://doi.org/10.1029/2012GL051672, 2012.
Schimmel, M. and Gallart, J.: Frequency-dependent phase coherence for noise suppression in seismic array data, J. Geophys. Res.-Sol. Ea., 112, B04303, https://doi.org/10.1029/2006JB004680, 2007.
Simancas, J. F., Carbonell, R., González Lodeiro, F., Pérez-Estaún, A., Juhlin, C., Ayarza, P., Kashubin, A., Azor, A., Martínez-Poyatos, D., Almodóvar, G. R., Pascual, E., Sáez, R., and Expósito, I.: Crustal structure of the transpressional Variscan orogen of SW Iberia: SW Iberia deep seismic reflection profile (IBERSEIS), Tectonics, 22, 1062, https://doi.org/10.1029/2002TC001479, 2003.
Simancas, J. F., Ayarza, P., Azor, A., Carbonell, R., Martínez-Poyatos, D., Pérez-Estaún, A., and González Lodeiro, F.: A seismic geotraverse across the Iberian Variscides: Orogenic shortening, collisional magmatism, and orocline development, Tectonics, 32, 417–432, https://doi.org/10.1002/tect.20035, 2013.
Suriñach, E. and Vegas, R.: Lateral inhomogeneities of the Hercynian crust in central Spain, Phys. Earth Planet. In., 51, 226–234, 1988.
Tait, J., Schätz, M., Bachtadse, V., and Soffel, H.: Palaeomagnetism and Palaeozoic palaeogeography of Gondwana and European terranes, Geol. Soc. Spec. Publ., 179, 21–34, https://doi.org/10.1144/GSL.SP.2000.179.01.04, 2000.
Teixell, A., Labaume, P., Ayarza, P., Espurt, N., de Saint Blanquat, M., and Lagabrielle, Y.: Crustal structure and evolution of the Pyrenean-Cantabrian belt: A review and new interpretations from recent concepts and data, Tectonophysics, 724–725, 146–170, https://doi.org/10.1016/j.tecto.2018.01.009, 2018.
Tejero, R., Perucha, M. A., Rivas, A., and Bergamín, J. F.: Gravity and structural models of Spanish Central System, Geogaceta, 20, 947–950, 1996.
Torne, M., Fernàndez, M., Vergés, J., Ayala, C., Salas, M. C., Jimenez-Munt, I., and Diaz, J.: Crust and mantle lithospheric structure of the Iberian Peninsula deduced from potential field modeling and thermal analysis, Tectonophysics, 663, 419–433, https://doi.org/10.1016/j.tecto.2015.06.003, 2015.
Vegas, R., Vázquez, J. T., Suriñach, E., and Marcos, A.: Model of distributed deformation, block rotations and crustal thickening for the formation of the Spanish Central System, Tectonophysics, 184, 367–378, https://doi.org/10.1016/0040-1951(90)90449-I, 1990.
Villaseca, C., Barbero, L., and Rogers, G.: Crustal origin of Hercynian peraluminious granitic batholiths of Central Spain: Petrological, geochemical and isotopic (Sr, Nd) arguments, Lithos, 43, 55–79, 1998.
Wapenaar, K.: Synthesis of an inhomogeneous medium from its acoustic transmission response, Geophysics, 68, 1756–1759, https://doi.org/10.1190/1.1620649, 2003.