the Creative Commons Attribution 4.0 License.
the Creative Commons Attribution 4.0 License.
 | 08 Feb 2019
Event couple spectral ratio Q method for earthquake clusters: application to northwest Bohemia
Marius Kriegerowski
Simone Cesca
Matthias Ohrnberger
Torsten Dahm
Frank Krüger
We develop an amplitude spectral ratio method for event couples from clustered earthquakes to estimate seismic wave attenuation (Q−1) in the source volume. The method allows to study attenuation within the source region of earthquake swarms or aftershocks at depth, independent of wave path and attenuation between source region and surface station. We exploit the high-frequency slope of phase spectra using multitaper spectral estimates. The method is tested using simulated full wave-field seismograms affected by recorded noise and finite source rupture. The synthetic tests verify the approach and show that solutions are independent of focal mechanisms but also show that seismic noise may broaden the scatter of results. We apply the event couple spectral ratio method to northwest Bohemia, Czech Republic, a region characterized by the persistent occurrence of earthquake swarms in a confined source region at mid-crustal depth. Our method indicates a strong anomaly of high attenuation in the source region of the swarm with an averaged attenuation factor of Qp<100. The application to S phases fails due to scattered P-phase energy interfering with S phases. The Qp anomaly supports the common hypothesis of highly fractured and fluid saturated rocks in the source region of the swarms in northwest Bohemia. However, high temperatures in a small volume around the swarms cannot be excluded to explain our observations.
- Article
(5239 KB) - Full-text XML
- BibTeX
- EndNote


The intrinsic and scattering attenuation of the amplitudes of seismic waves is described by the dimensionless factor Q. The mapping of spatiotemporal changes of Q is an important step in seismology, since Q is controlled by temperature, rock porosity, fluid saturation and rock composition (Toksöz and Johnston, 1981). Hence, this factor may help to unravel the possible causes of fluid-induced earthquakes, or thermal anomalies in crustal regions affected by magmatic intrusions. For instance, northwest (NW) Bohemia is regularly affected by earthquake swarms lasting several days or weeks with thousands of recorded events with largest magnitudes up to Ml=4.4 (Fischer et al., 2014). The causes of the repeated earthquake swarms which occur in narrow focal zones remain under debate. Relative earthquake localizations are very precise because of the high waveform quality recorded with a dense local permanent network (Bouchaala et al., 2013). Different tomography studies revealed consistent figures of the 3-D velocity structures (Alexandrakis et al., 2014). The attenuation structure in the source region of the earthquake swarms is scarcely discussed. Some previous studies on whole ray-path Q exist and can be used for verification and benchmarking. However, the main aim of this study is to test whether the method developed here can enhance the resolution of near-source Q and therefore enable more robust conclusions on source dynamics and the role of fluids in the swarm cycle.
Several studies investigated the regional attenuation of northwest Bohemia by integrating along the full path from sources to receivers. Gaebler et al. (2015) estimated intrinsic and scattering attenuation of S waves (Qs) by means of 14 selected events. Their frequency-dependent results indicate mean of approximately 1000. A study by Michálek and Fischer (2013) investigated source parameters and inferred a station-dependent, regional Qp from P-phase spectra. They estimated mean Qp ranging between 100 and 450. They also discuss effects of directivity on Q, concluding that the directivity has little influence due to the position of stations with respect to radiation patterns.
A tomographic study of northwest Bohemia done by Mousavi et al. (2017) indicated a regional average attenuation of approximately Qp≈100 to Qp≈300 and a pronounced highly attenuative source region where Qp<100.
Bachura and Fischer (2016) employed two different methods to resolve the regional coda Qc from the source volume to receivers. They used 13 selected events of the 2011 swarm and found a variation of Qc between 100 and 2500 within the exploited frequency range of 1–18 Hz.
Recent work by Wcisło et al. (2018) used a newly developed differential attenuation estimation technique focused on the source region. The authors employed the peak frequency method which relates the half period of P pulses to attenuation. They also used a differential approach to map the inter-event attenuation using a single station (Nový Kostel; NKC) and found Qp≈120 and Qs≈80 in the source region.
Most previous Q studies focusing on NW Bohemia were inherently of low spatial resolution. This was, firstly, either because Q was estimated for the integral ray path between sources and stations (except for the work by Wcisło et al., 2018) or secondly, because they focused on low frequencies, or both. For example, Mousavi et al. (2017) used frequencies between 1 and 30 Hz and Gaebler et al. (2015) up to 32 Hz.
In this study, we aim to increase the spatial resolution and to resolve Q for waves traveling only within the small source region of the earthquake swarms. The developed event couple spectral ratio method is based on the assumption of an exponentially decreasing spectral slope at high frequencies ω above the corner frequency of the earthquake, often referred to as the ω2 model (Aki, 1980). From the ratio of the spectral slopes of two events, one can estimate the attenuation of P and S phases for the ray path between the two events, given the differential travel time of both events. Matsumoto et al. (2009) exploit amplitude spectral ratios of direct P phases and normalize the spectra with the coda energy to compensate for source effects. Opposed to their approach, we focus on the higher-frequency content to achieve a higher resolution needed to map the compact source volume.
The spatially compact seismic clusters in NW Bohemia provide us with a favorable case study scenario due to the high similarity of source characteristics (Michálek and Fischer, 2013). We test our method on data recorded from 6 to 13 October 2008 and a double-difference relocated event catalog of 3841 events with local magnitudes between −0.9 and 3.5 (Fischer and Michálek, 2008). The high density of events during earthquake swarms clustering within a small and confined region allows to infer the local attenuation from event couples by applying the spectral ratio method (Aki, 1980) to their high-frequency amplitude spectra as we will explain in the following section. One major issue when calculating spectral content of very few data samples is spectral leakage, as a result of the finiteness of the time window under study. In order to overcome this problem, Thomson (1982) proposed the multitaper method, which we employ using mtspec (Prieto et al., 2009; Krischer, 2016).
A velocity spectrum A(ω) of a direct body wave phase originating from a source j recorded at a station i can be described as (Sanders, 1993)
where ω is the angular frequency. Sj(ω) describes the source spectrum and Ii(ω) the instrument response. Ri(ω) is the receiver site effect. Gi,j is the frequency-independent geometric loss. The exponential term depends on the angular frequency ω and t*, the path-integrated attenuation from the source to the receiver:
with Q as the dimensionless quality factor, velocity v of the medium and ds a segment along the ray path from the source to the receiver. Attenuation is considered here as a combination of intrinsic and scattering losses. Instead of estimating a total t* describing the full ray path's attenuation, we estimate a local t* from velocity spectra of two earthquakes sharing the greater part of their ray paths from the seismogenic zone to a receiver. Site effects as well as the receivers' response functions cancel out when two spectra recorded at the same site are analyzed by means of amplitude ratios. Let Aj,0 and Aj,1 be two velocity amplitude spectra of events E0 and E1 (in the following referred to as the first and second events of a couple) recorded at a station j (Fig. 1). We assume that their source spectra S0(ω) and S1(ω) resemble each other to a degree where the effect of random perturbations at high frequencies averages out when the proposed method is applied to many couples. Taking the natural logarithm of the spectral ratio of Ai,0 and Ai,1 yields
with
This equation describes a linear relation with frequency-independent geometrical losses to the left of the negative sign in Eq. (3). The slope k of a line fitted to Eq. (3) can be used to derive the attenuation time t* in between the two sources from which Q−1 can easily be inferred using Eq. (2).
The far-field amplitude spectrum A(ω) of P and S phases can be parameterized as follows: a seismic-moment-dependent low-frequency plateau, the corner frequency fc and the high-frequency spectral decay approximately proportional to ω2 resulting from finiteness of particle rise time and the rupture duration (Aki and Richards, 2002). To remove the dependence on seismic moment, we investigate the high-frequency spectral decay only. Furthermore, exploiting spectral content above the corner frequency also reduces source directivity effects on attenuation estimates (Cormier, 1982).
We infer the corner frequency based on previous studies on NW Bohemian seismic swarms. We use a relation proposed by Michálek and Fischer (2013) to calculate source radii r based on the moment M0 of an event:
where .
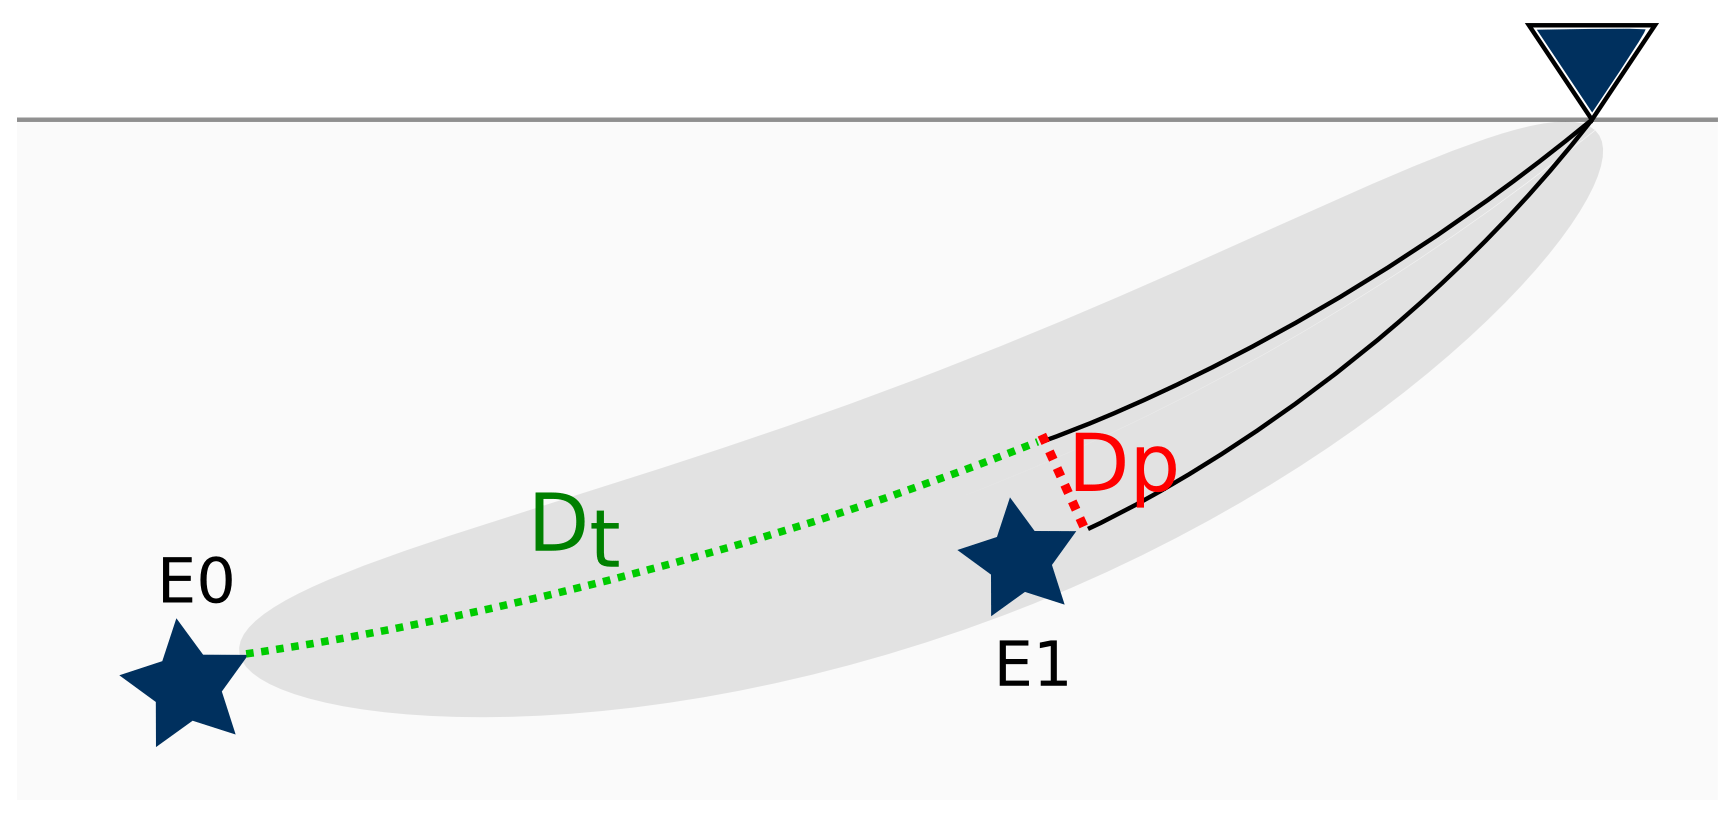
Figure 1Schematic illustration of the geometrical constraints and the employed parameters. The triangle represents a recording station at the surface. Attenuation is estimated for the traversing distance ray-path segment (Dt, green dashed line). Geometrical constraints respect the passing distance (Dp). The grey shaded area illustrates the Fresnel volume of the first event.
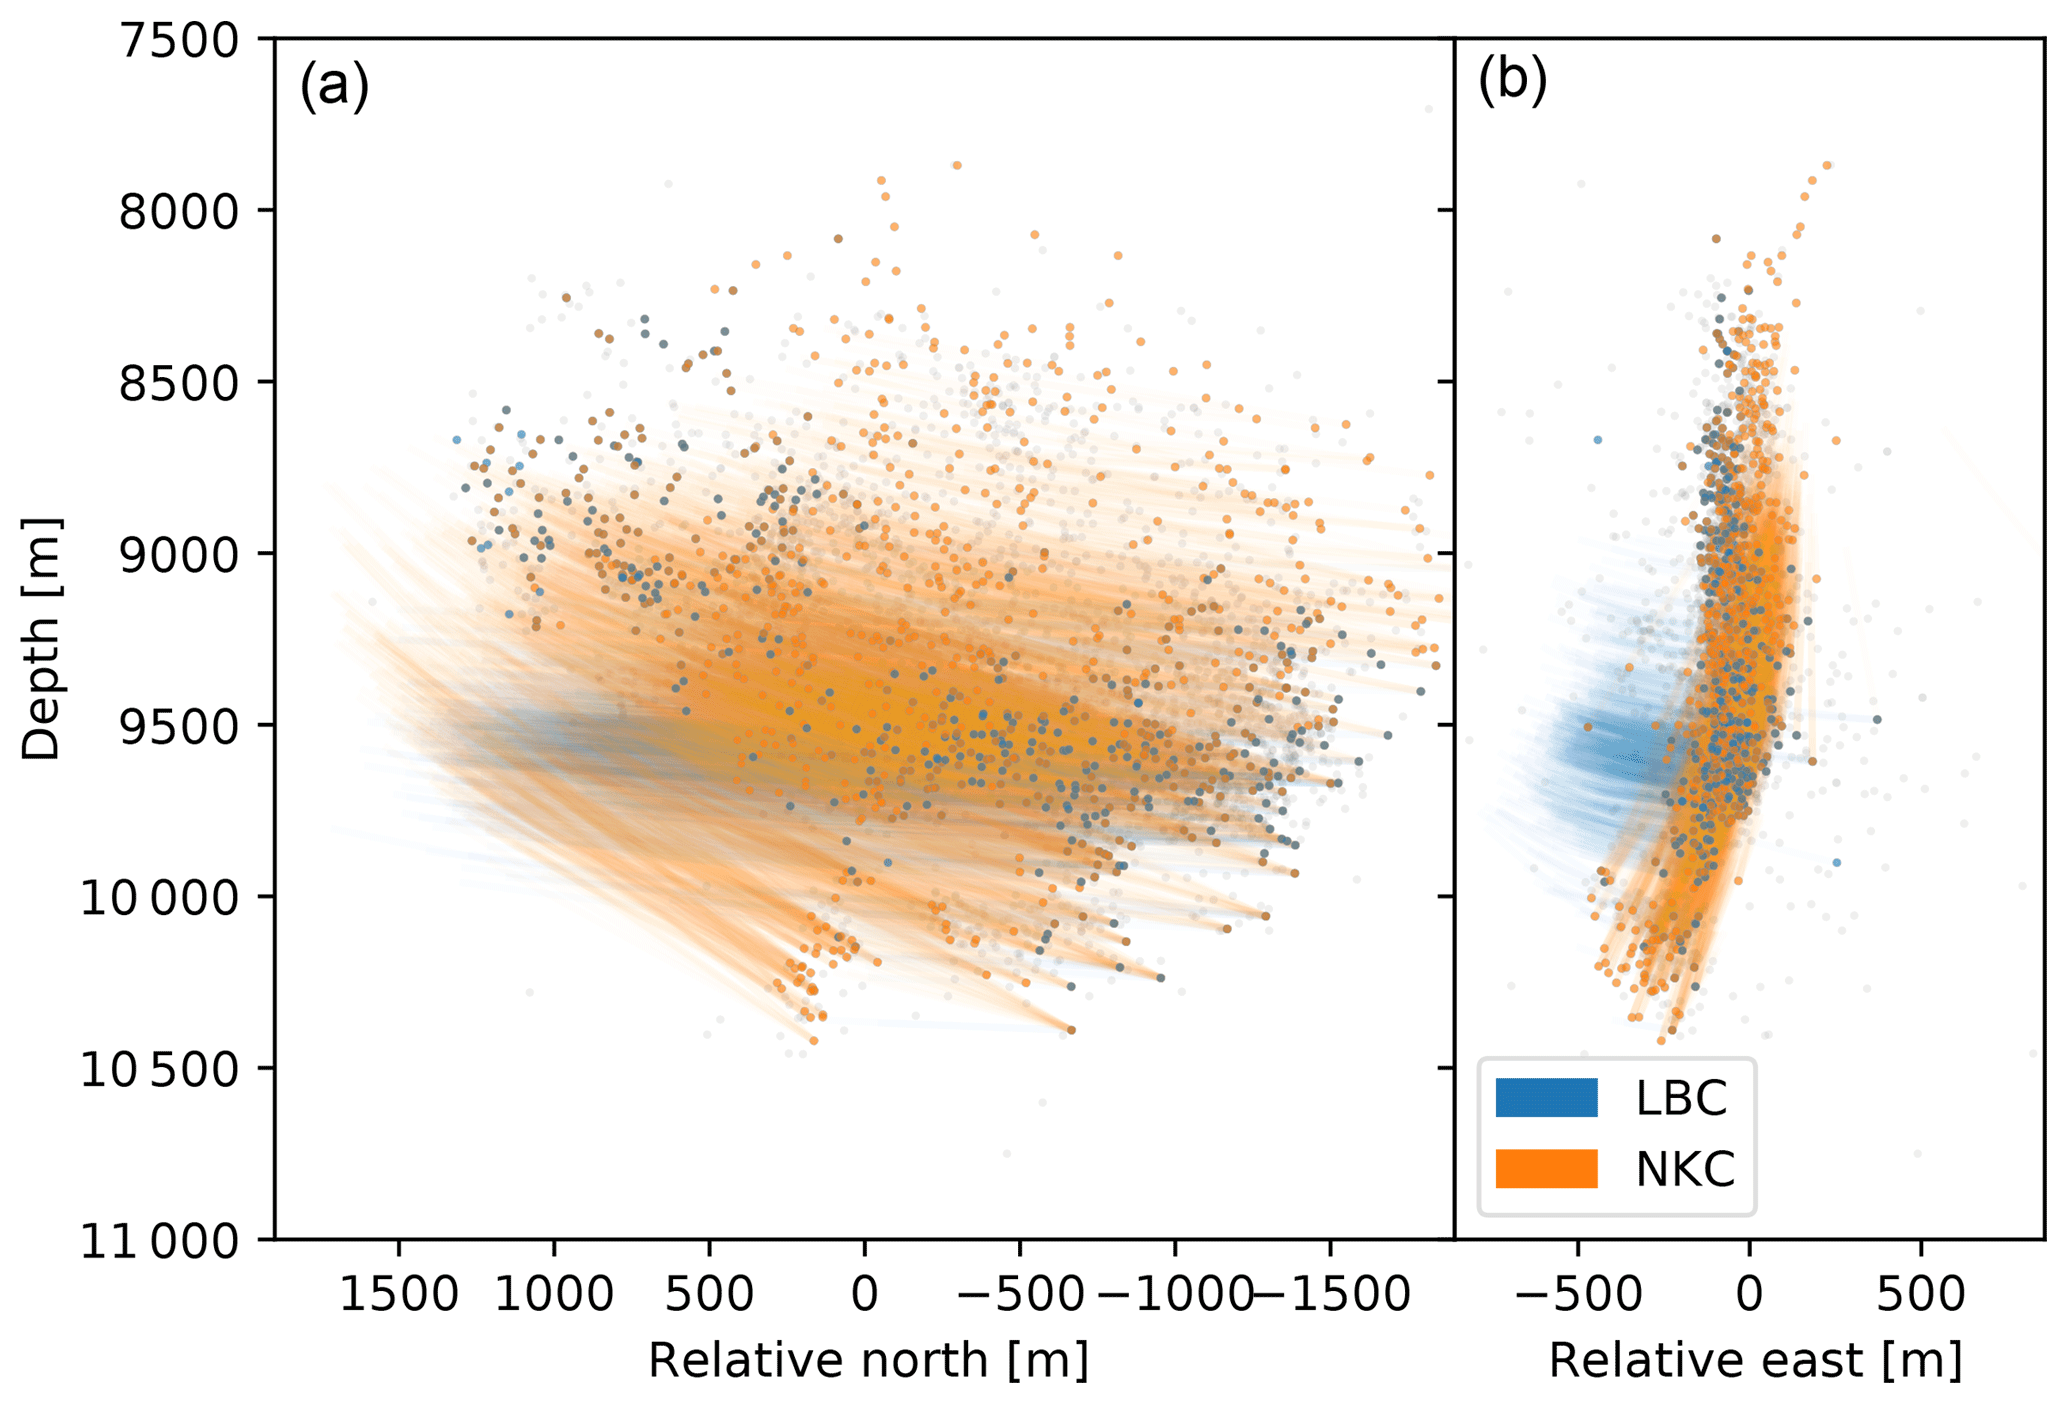
Figure 2Ray segments with respect to stations Luby (LBC) and NKC. Source region seen from the west (a) and from the south (b). The colors indicate the station at which the displayed ray segment arrived as well as the underlying source of the segments. Grey points show hypocenters which occurred during the investigated time interval but were not attributed to an event couple.
The resulting source radii r are then converted to fc using
with k=0.32 (Madariaga, 1976), and β=3.5 km s−1, which is a reasonable assumption for the source region (Michálek and Fischer, 2013). We increase the lower frequency limit (fmin) used for our spectral analysis by an additional 5 Hz with respect to fc to account for uncertainties in M0 and to ensure linearity of the high-frequency decay. This approach allows frequency bands being wide enough for employing a stable linear regression. The upper frequency limit fmax was chosen dependent on the Fresnel volume (see below) of a couple's first event (Fig. 1) and the upper corner frequency of the anti-alias filter of the recording equipment which is approximately 85 Hz. We calculate the power spectral density using the multitaper spectral analysis method (MTM) (Thomson, 1982; Park et al., 1987). With this method, the time series is multiplied with several orthogonal Slepian tapers which are resistant to spectral leakage. The power spectral density is then reconstructed after Fourier transformation of the tapered samples and a weighted summation of the resulting spectra. A more exhaustive explanation can be found in Park et al. (1987). The applied code is a Python wrapper to the Fortran routine mtspec (Prieto et al., 2009; Krischer, 2016). MTM achieves stable spectral estimates also for very short time windows. A critical parameter of the MTM is the number of Slepian tapers as it balances the smoothness and precision of spectral estimates. We use the implemented default, which is
where bw is the bandwidth_factor which we set to bw=4. Lower values prove to increase the number of outliers due to increased spectral leakage. Higher values did not change the results significantly but are more expensive to compute.
We impose strong geometrical constraints to select event couples with respect to a station as sketched in Fig. 1. Ray tracing is done based on a 1-D velocity model suggested by Alexandrakis et al. (2014) for the seismogenic region combined with a regional crustal model proposed by Málek et al. (2000) (Fig. 4, left panel). The first geometrical constraint is the traversing distance (Dt, green dashed line, Fig. 1) between an event E0 with respect to perpendicular projections of other hypocenters onto that path. The second constraint is the passing distance (Dp, red dashed line in Fig. 1) of that projection of E1 onto the ray between E0 and the station. We defined a minimum traversing distance of Dt≥1500 m to ensure that the signal of the second event is attenuated sufficiently to be detectable in the couple's spectral ratio.

Figure 3Mapping potential locations of future seismic stations favorable to resolve Q at the swarm using the described method. The size of the blue points for each tested location represents the relative number of arriving shared ray paths from event couples. Red dots show the seismicity of the investigated swarm. Green triangles indicate locations of the local seismic network (WEBNET) stations.
Subsequent to geometrical preselection upper frequency limits of the analyzed bandwidth are potentially corrected to lower values dependent on the second Fresnel volume in between event E0 and a station. The wavelength from which this frequency limit can be deduced is given as (Matsumoto et al., 2009)
Dp and Dt are passing distance and the traversing distance as defined above. x is the distance from the passing point with respect to the second event E1 to the receiver (Fig. 1). n is the number of the Fresnel volume. The frequency limit can then be deduced from the wavelength and the wave velocity of the underlying medium. This approach provides a physically meaningful limitation to impose on the frequency bandwidth. It ensures that E1 is located within the Fresnel volume (grey shaded area in Fig. 1) for the entire analyzed frequency band.
With this approach, we get an estimate for the attenuation along the traversing distance (green dashed line in Fig. 1) and when repeated for a large number of event couples it can retrieve a median attenuation for the entire source region. The described method is advantageous over other methods which require handcrafted features like onset duration picking as it can be automatized given that an onset catalog is at hand.
In order to evaluate the expected number of exploitable couples given the geometrical constraints, we calculate the relative number of pairs at discrete surface points covering the region of northwest Bohemia. The size of the blue points in Fig. 3 represents the relative number of arriving shared ray paths from event pairs at possible station sites based on ray tracing through a 1-D layered model (Fig. 4). Largest numbers of pairs are expected along a north–south-striking patch which follows the striking direction of the main fault plane. However, in this case study, we use only those stations which provide continuous recordings for the investigated time span. These are stations Kraslice (KRC), Luby (LBC), NKC, Skalná (SKC) and Vackov (VAC). After geometrical filtering, we expect stations NKC and LBC to produce the highest number of couples since they provide continuous recordings for the entire time period and are in a favorable lateral location. Most other stations are located where no or a negligible number of event pairs are expected. Figure 2 shows the rays which penetrate the source volume and fulfill the geometrical requirements described above. It shows that for events recorded at the most significant stations (NKC and LBC) the highest ray density, and therefore sensitivity, is in the lower half of the seismogenic zone. This bias is more pronounced for recordings at station LBC. Also, these ray segments sample the volume up to approximately 500 m to the west of the seismic swarm.
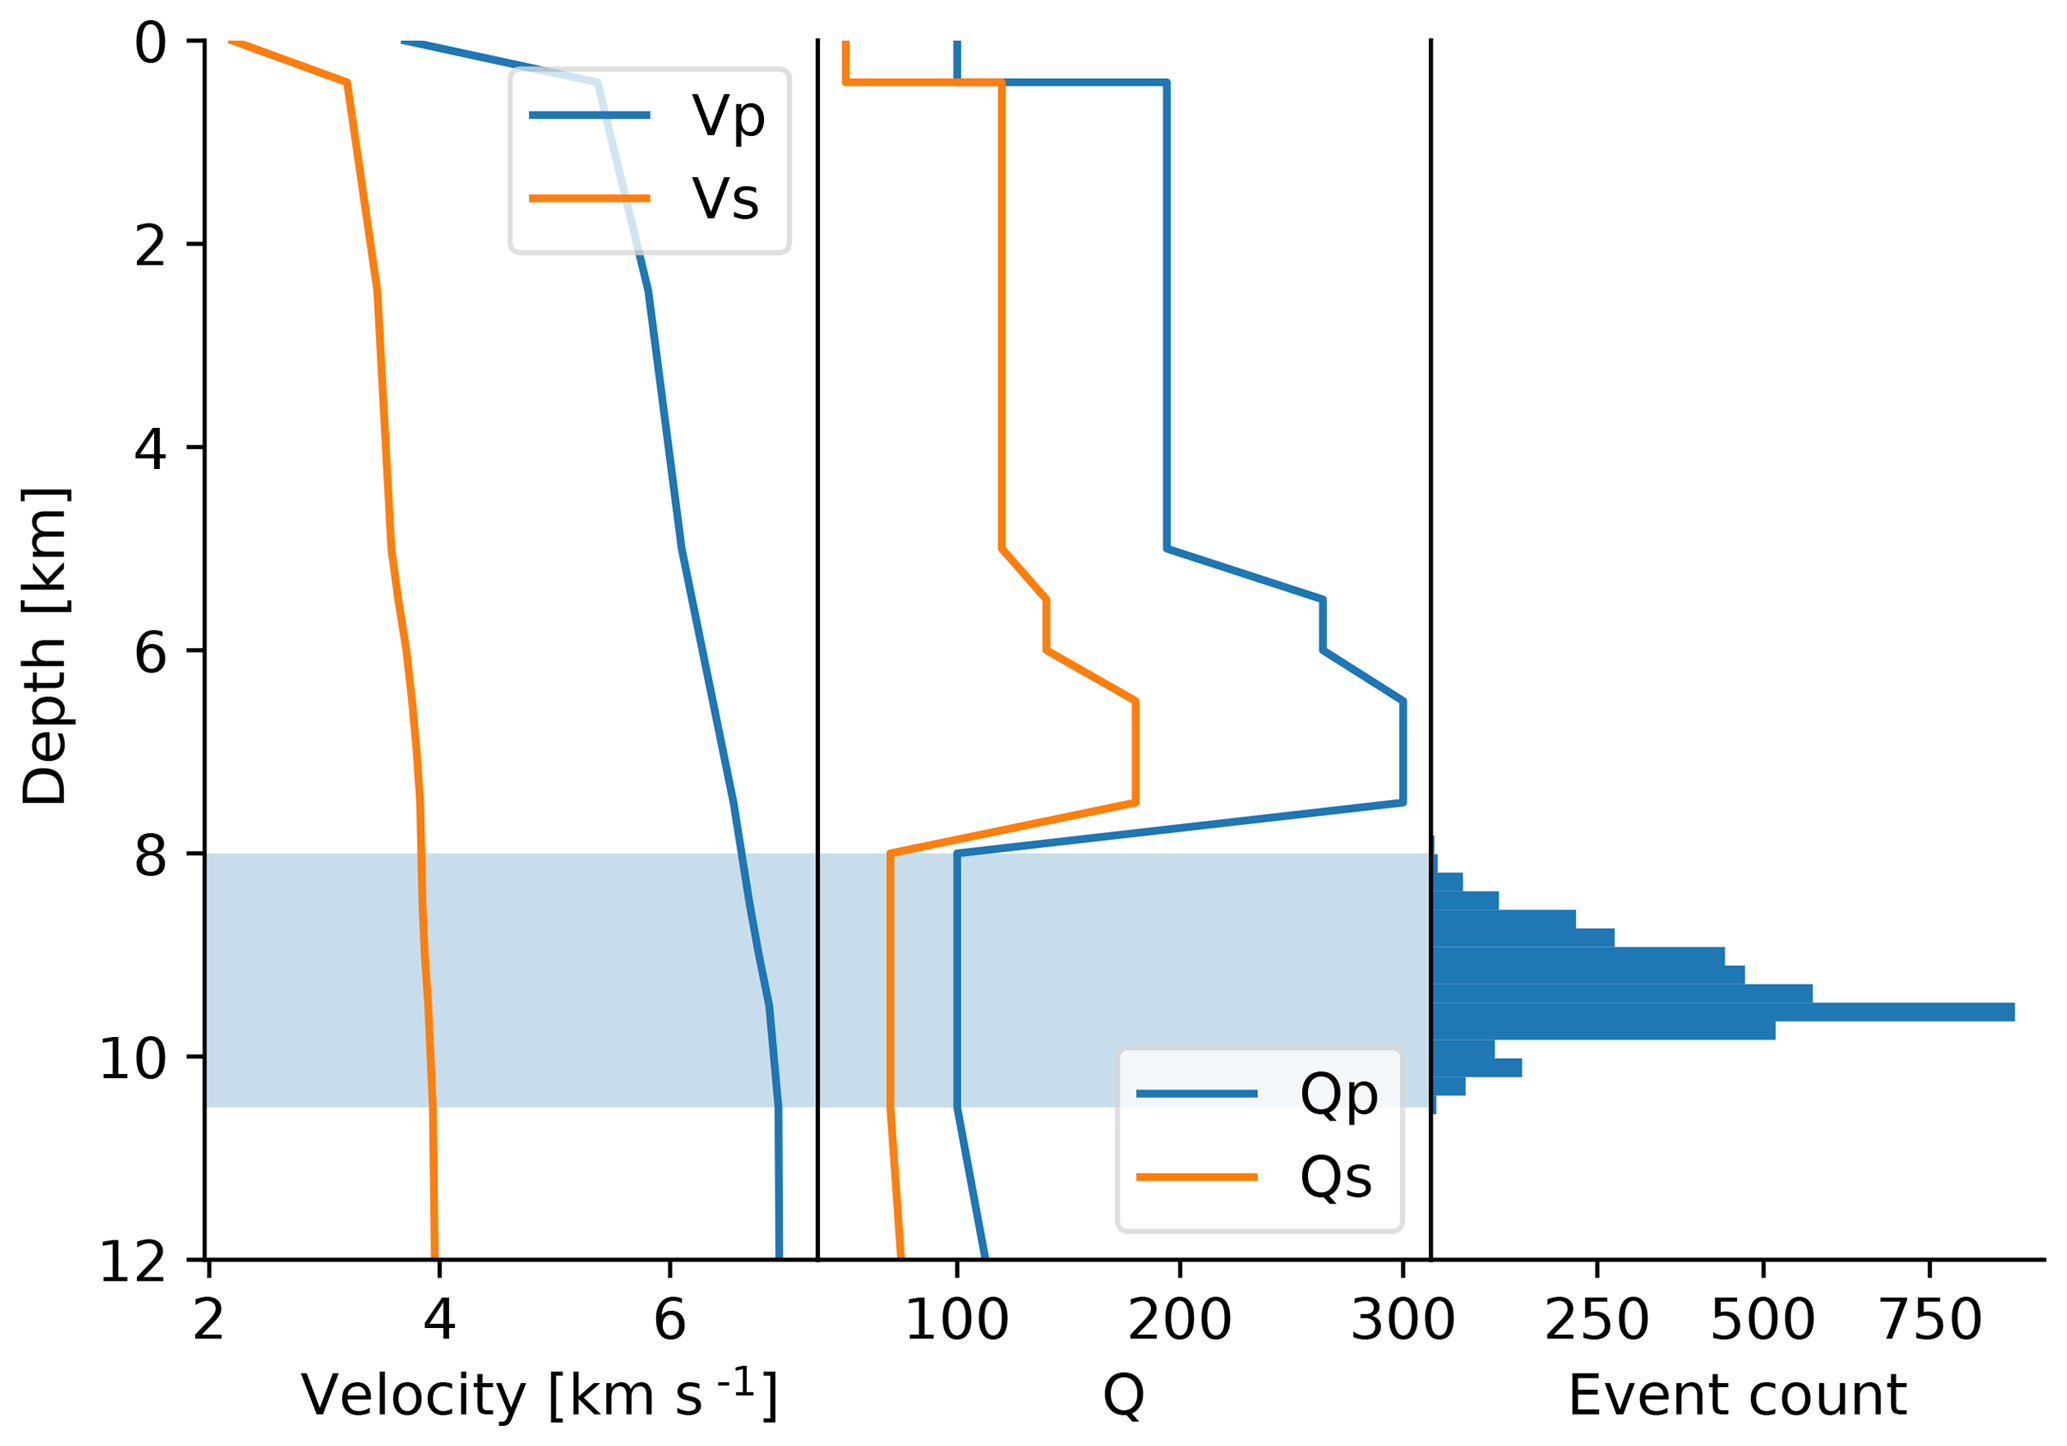
Figure 4Synthetic velocity and attenuation model used for validation of the method. The seismogenic zone is marked by light blue. The attenuation in that zone is expected to be decreased with respect to the regional attenuation model.
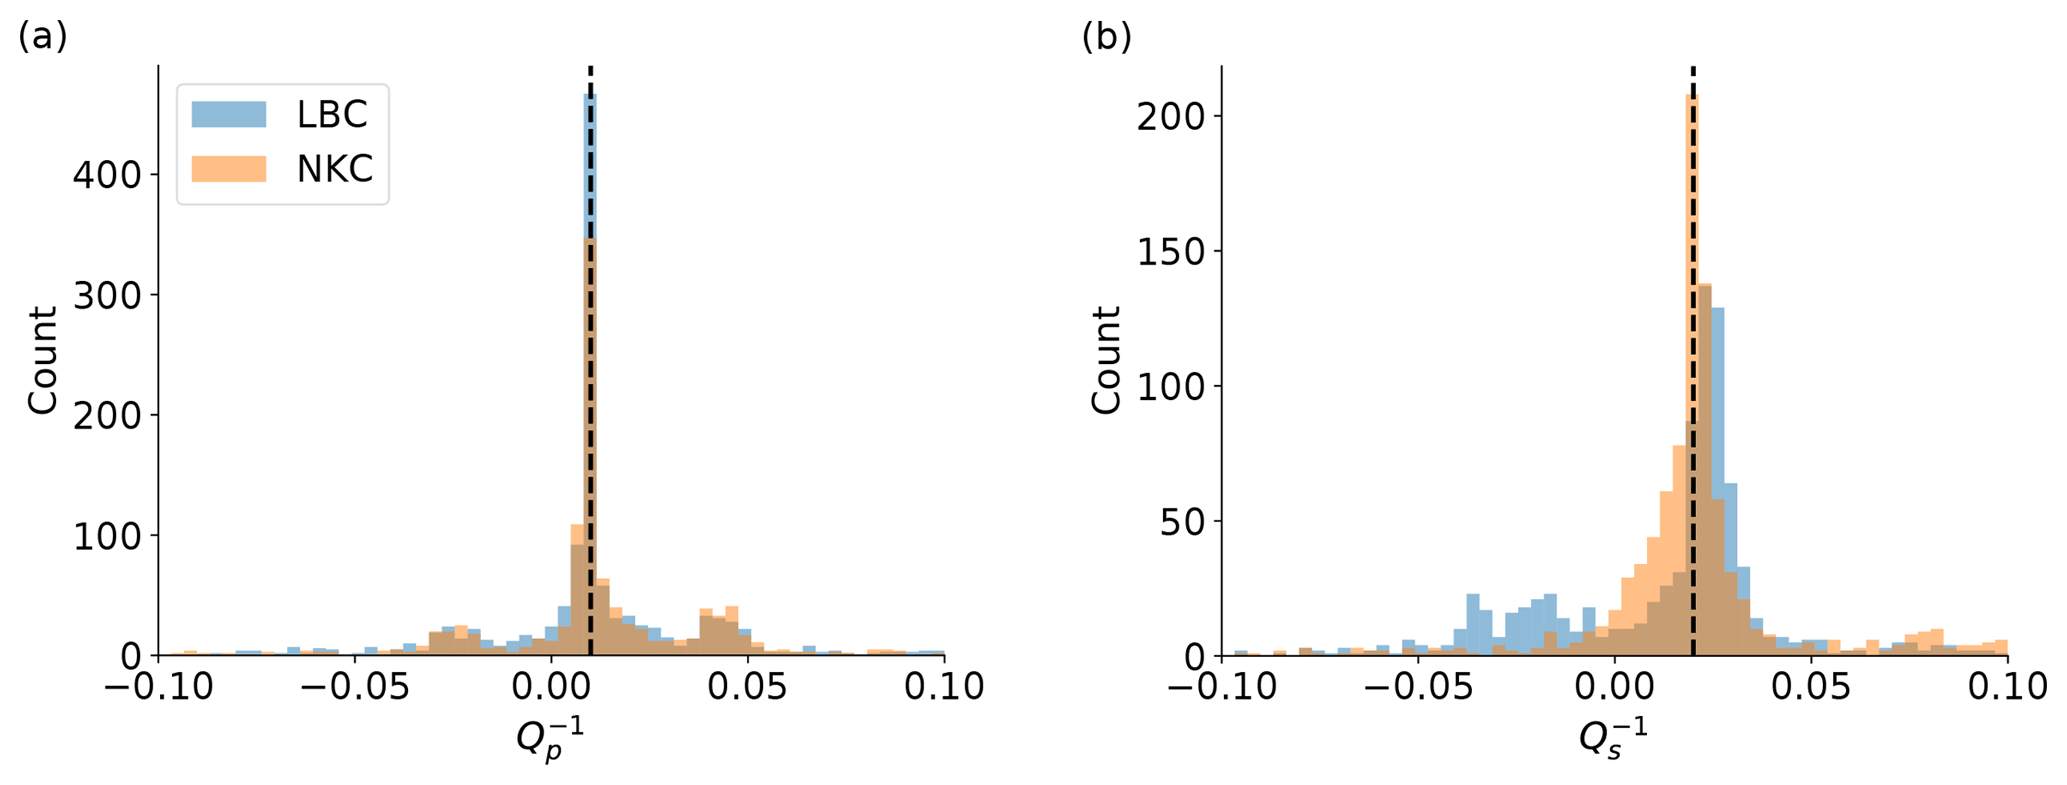
Figure 5Synthetic tests targeting Qp=100 (a) and Qs=50 (b) with noise-free data. No source time functions have been convolved. The correct values for Qp and Qs are indicated by the vertical dashed lines. The station color coding as given in the legend is used consistently throughout all following images.
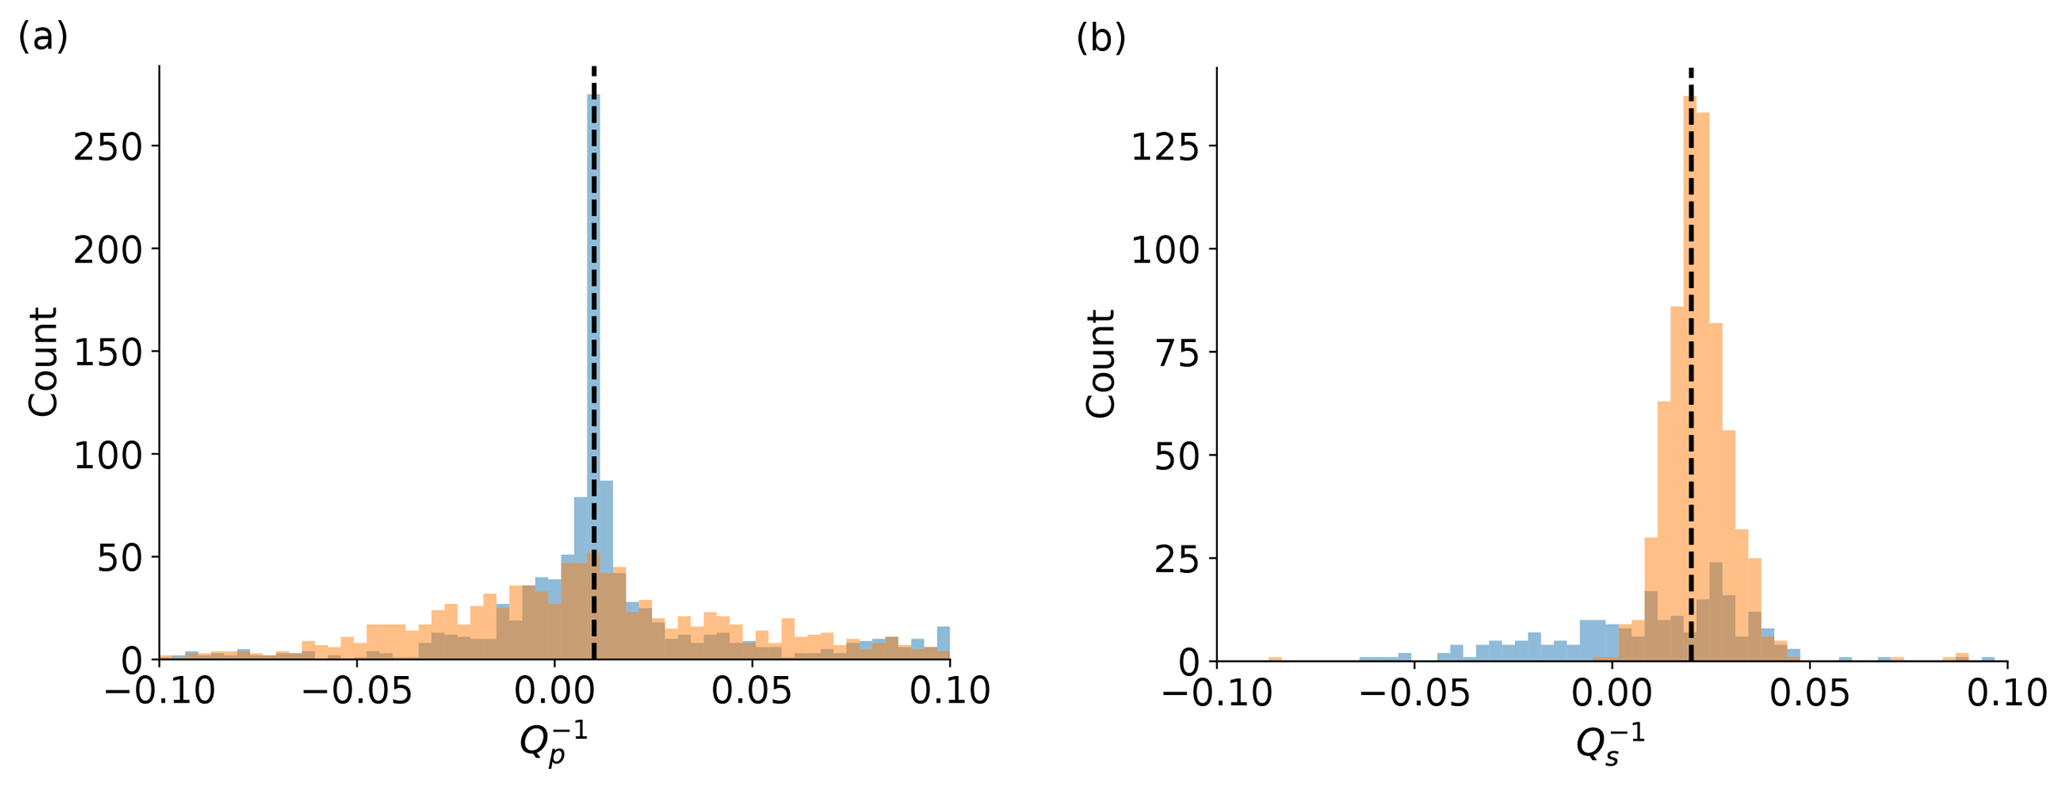
Figure 6Synthetic tests with the same setup as in Fig. 5 but with additive real recorded noise from analyzed stations. Again, traces have not been convolved with a source time function.
We use synthetic waveforms calculated using the reflectivity method (Wang, 1999) employing the same 1-D velocity model as for ray tracing (Fig. 4). The model simplifies the true conditions and therefore produces comparably clear phase onsets. However, the recorded data are also dominated by relatively little scattering and sharp onsets (Fischer et al., 2010). The effects of scattering on the final results will be discussed in greater detail in Sect. 5.
Hypocentral locations and origin times are taken from the double-difference relocated catalog of Fischer and Michálek (2008). All synthetic sources are double couple sources with mean strike, dip and rake set to 170±10, 80±10 and ∘, respectively, uniformly distributed in all three domains. The mean strike, dip and rake values are the predominant source types stated by Fischer et al. (2014) which were retrieved based on polarity analysis of P phases. The seismogenic zone (depth 8500–10 500 m in Fig. 4) has a Qp of 100 and Qs of 50. It is overlain by a more complex attenuation structure, characterized by higher Q values.
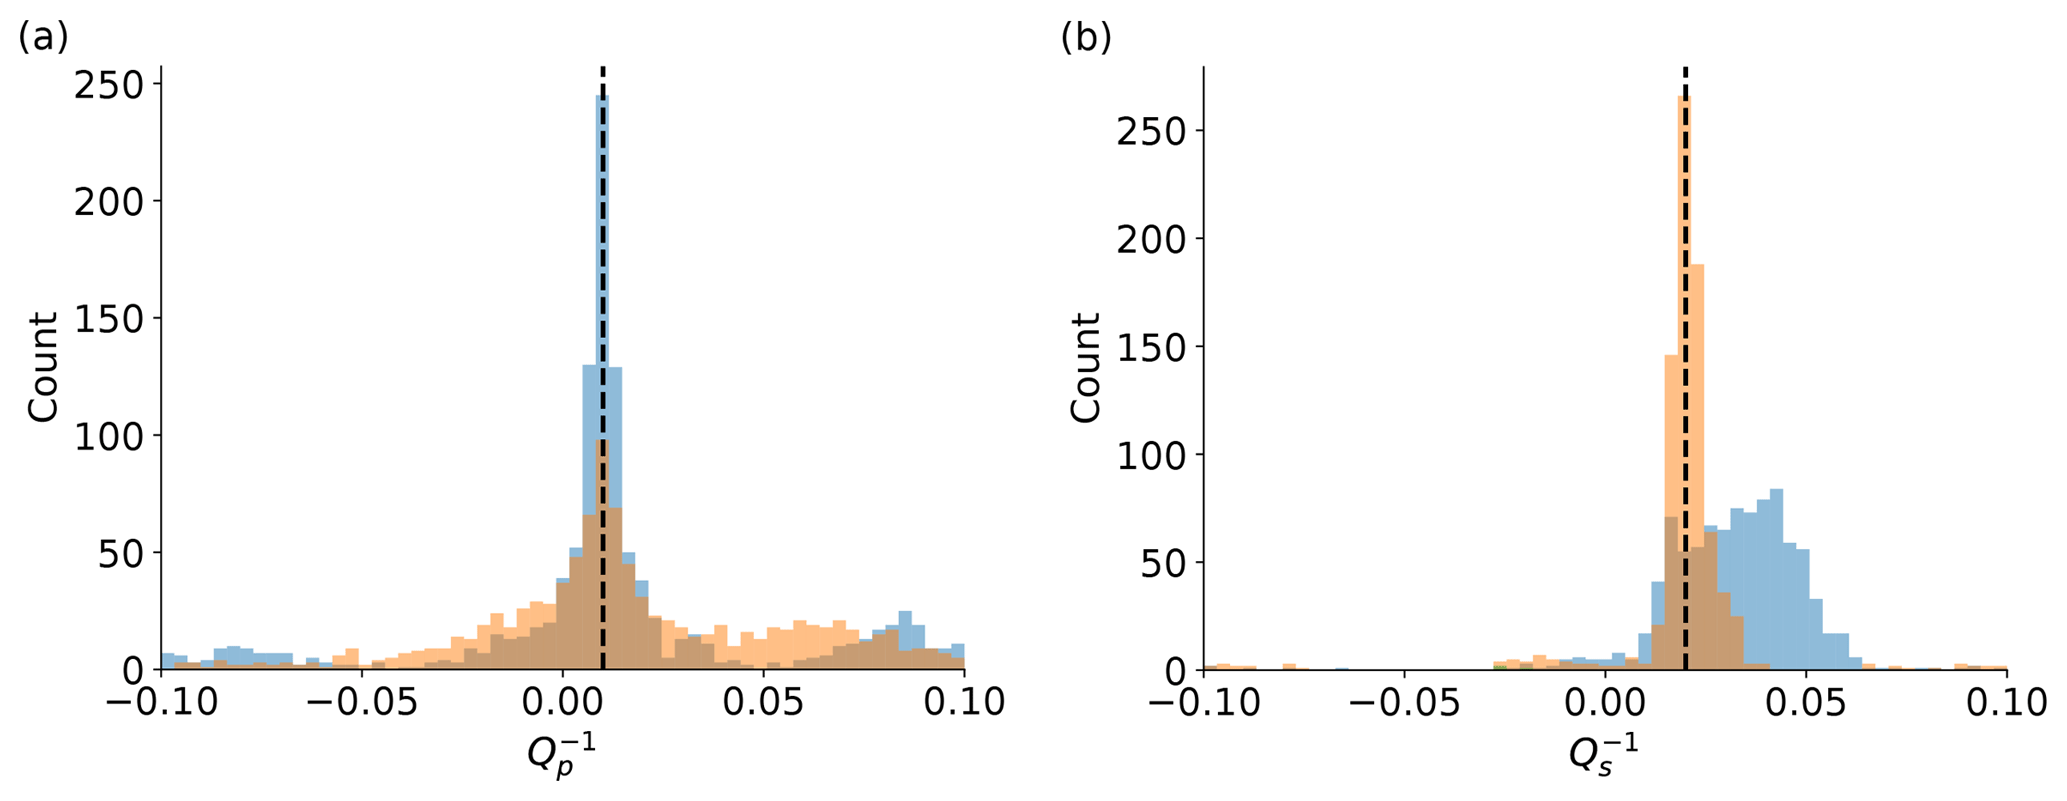
Figure 7Synthetic tests with the same setup as in Fig. 6. Synthetic traces were convolved with magnitude-dependent synthetic source time functions.
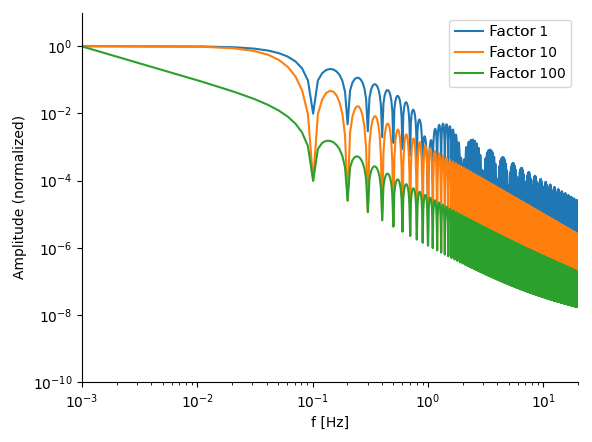
Figure 8Normalized synthetic amplitude spectra of applied source time functions with different durations as a factor relative to the blue one (factor of 1). The slope of the high-frequency spectral roll-off is identical.
In order to mimic uncertainties in origin times, locations and velocity model travel times are perturbed by 10 ms, uniformly distributed. The uncertainties of the velocity model have an effect only in the source region since both rays of a couple traverse through the same overlaying velocity model.
The window length was 0.15 s for P and 0.3 s for S phases. The minimum allowed cross-correlation of event couples in synthetic tests and later application to real data was set to 0.75. Signal-to-noise ratio (SNR) of a phase under consideration compared against a noise sample preceding the P phase has to be larger than 5 across the entire selected frequency band (after slight spectral smoothing to reduce effects of spectral notches). These two requirements efficiently reject outliers. The minimum allowed bandwidth is 10 Hz, which excludes all events with magnitudes of less than 0.5, given the magnitude-dependent lower frequency limit ( Hz, where fc is calculated using Eq. 6). The bandwidth threshold stabilizes the linear fit to the spectral ratio as it limits the minimum number of data points. We evaluate Qp from vertical channels and Qs on north–south and east–west components and average results for each couple.
Data availability of the recorded dataset has been accounted for. Synthetic traces were only produced for an event if the recorded dataset contained data as well. All synthetic traces where convolved with the transfer functions of the local seismic network (WEBNET) stations to generate realistic velocity traces.
Figure 5 shows distributions of retrieved Q−1 estimates from all event couples of the synthetic test using noise-free traces. In this test, as well as in the following test depicted in Fig. 6, traces have not been convolved with a source time function (i.e., they have impulsive source durations). The resulting distributions show some scattering solutions. Peaks in both cases (Qp and Qs) resemble the targeted attenuation model (dashed vertical line).
The next test depicted in Fig. 6 includes additive recorded noise. Data windows without seismic events in the field-recorded data have been manually extracted and randomly added to synthetic traces to mimic realistic noise conditions. P-phase results show a broadening of the distributions at all stations. While the distribution of station LBC still centers around the model value, the results of station NKC show only weak correlation with the correct model. This is a result of the location of station NKC close to the nodal plane of the dominant rupturing plane where smallest signal amplitudes are expected. S-phase results match the model at NKC but show strong scattering at LBC as a result of the interference with the added noise as well as the P-phase coda.
In a next step (Fig. 7), we convolve synthetic Green's functions with realistic magnitude-dependent source time functions. The applied source time function is half sine-shaped, where the slope of the high-frequency spectral roll-off is not dependent on the width of the applied pulse, as can be seen in Fig. 8, where normalized synthetic source spectra are depicted for different relative pulse widths. The vertical position of the spectral envelope changes with changing duration but the slope remains the same for all depicted factorized pulse widths. Other than expected, this stabilizes results. This is a result of the pulse broadening which leads to a stabilization of MTM estimates as onsets become less transient.
The performed synthetic tests cannot reproduce waveforms in their full natural complexity. Nevertheless, they prove that the concept is able to estimate attenuation of the anticipated region.
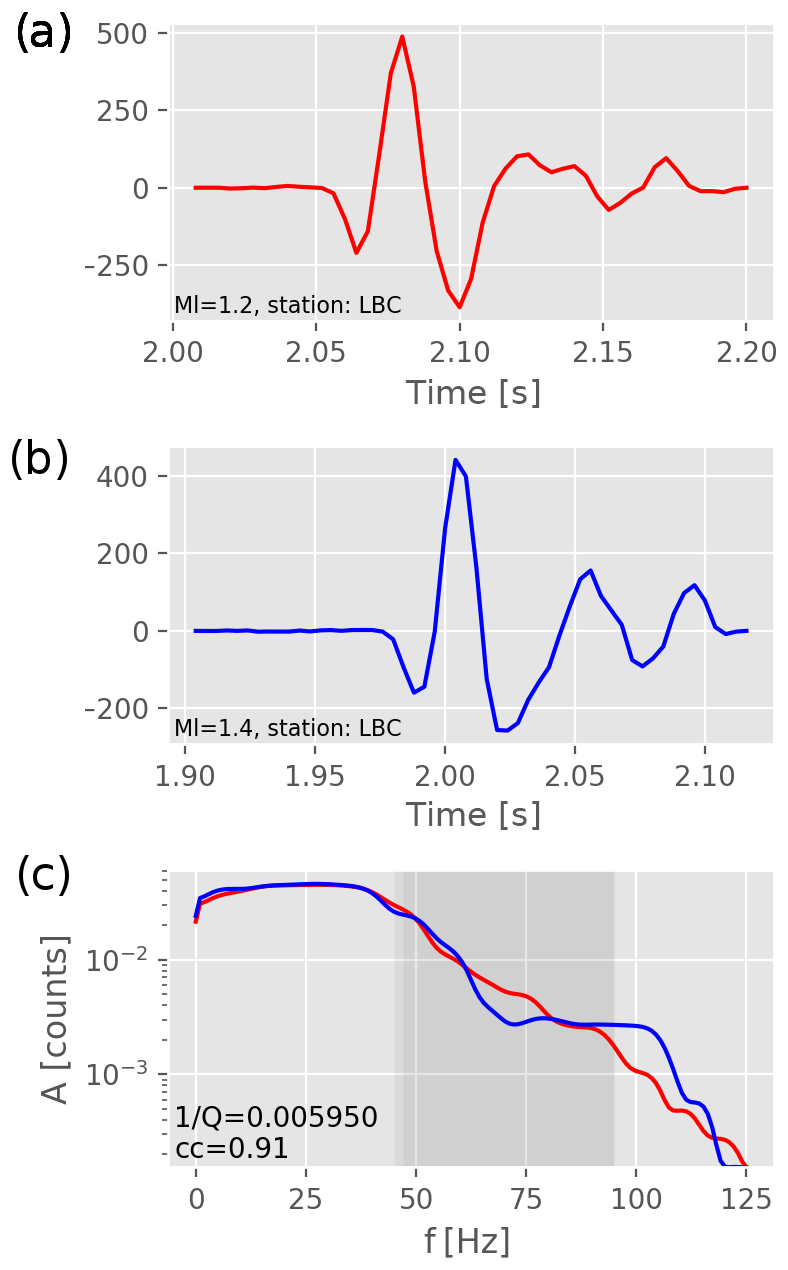
Figure 9Two P-phase wavelets recorded at station LBC and their spectra from events with local magnitudes Ml=1.2 and Ml=1.4. The first two panels show the (a) first and (b) second events of the analyzed event couple. The grey shaded area in panel (c) indicates the used frequency band. The cross-correlation coefficient is 0.91 and the attenuation was in this case estimated as .
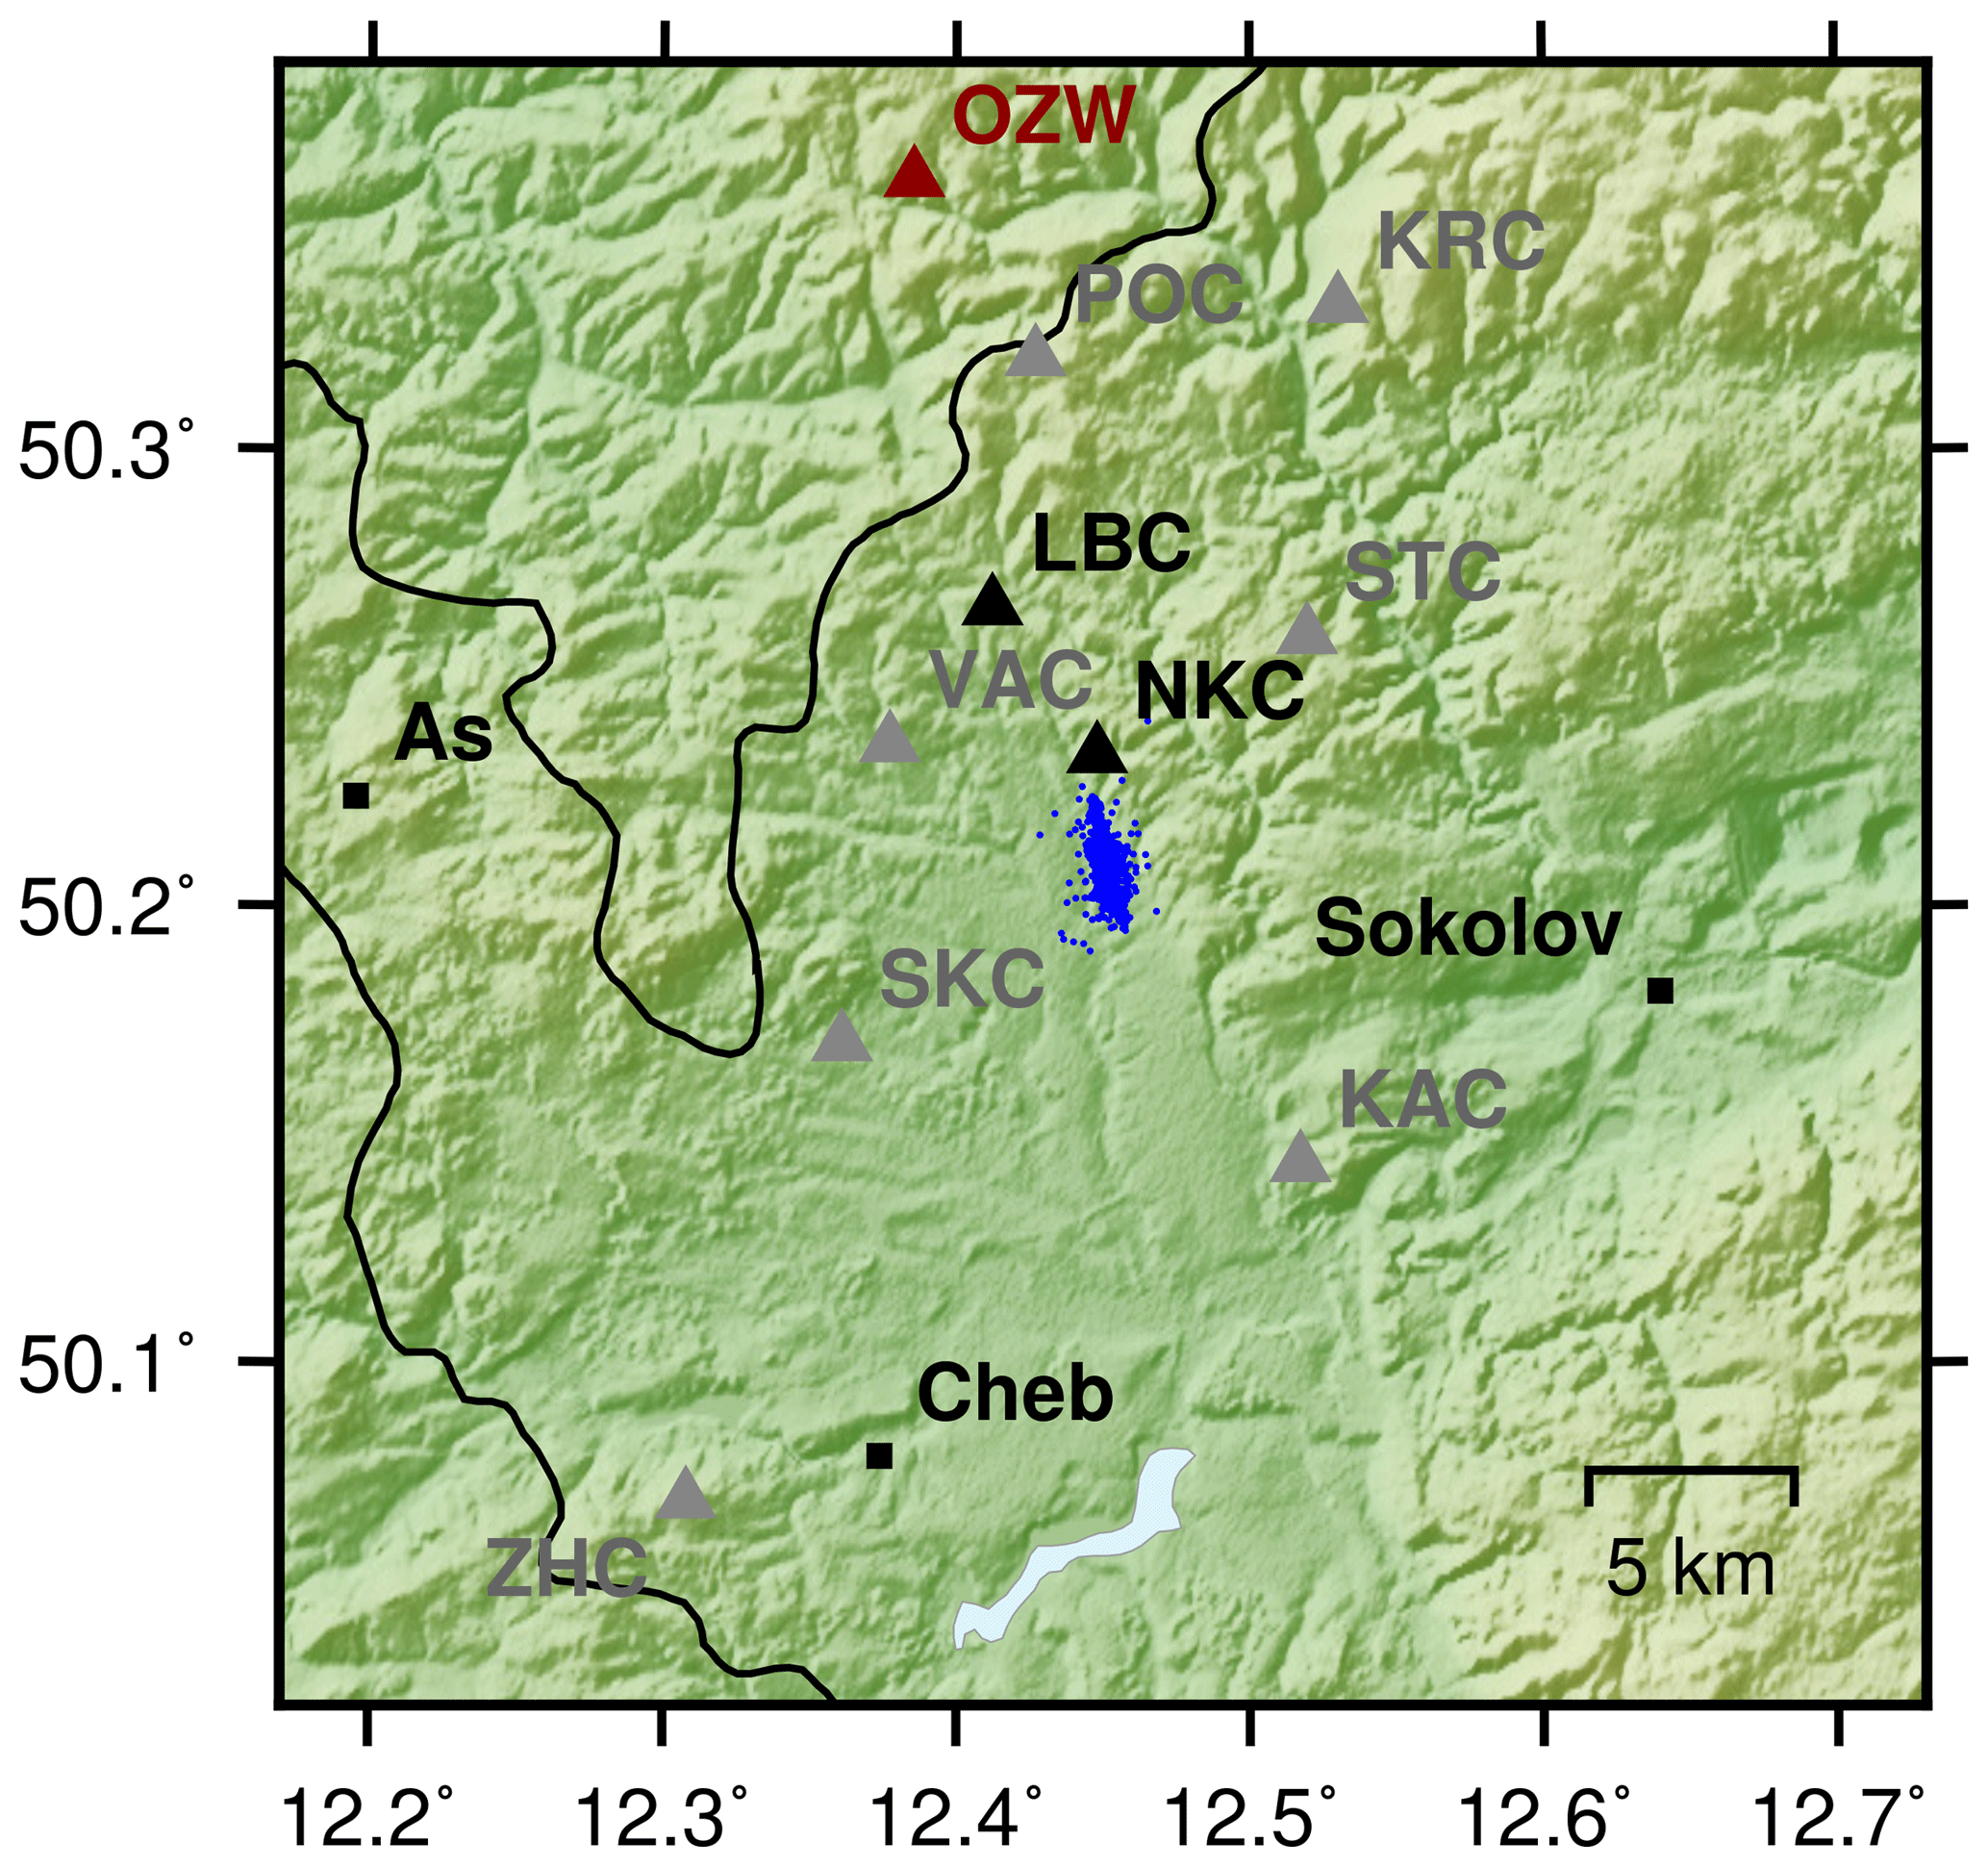
Figure 10WEBNET stations (triangles) and seismicity (blue circles) which occurred in northwest Bohemia during the investigated time period. Red triangle: temporary station installed by the University of Potsdam in October 2017. Stations in NKC and LBC are highlighted. All other stations produce no or an insignificant number of data points.
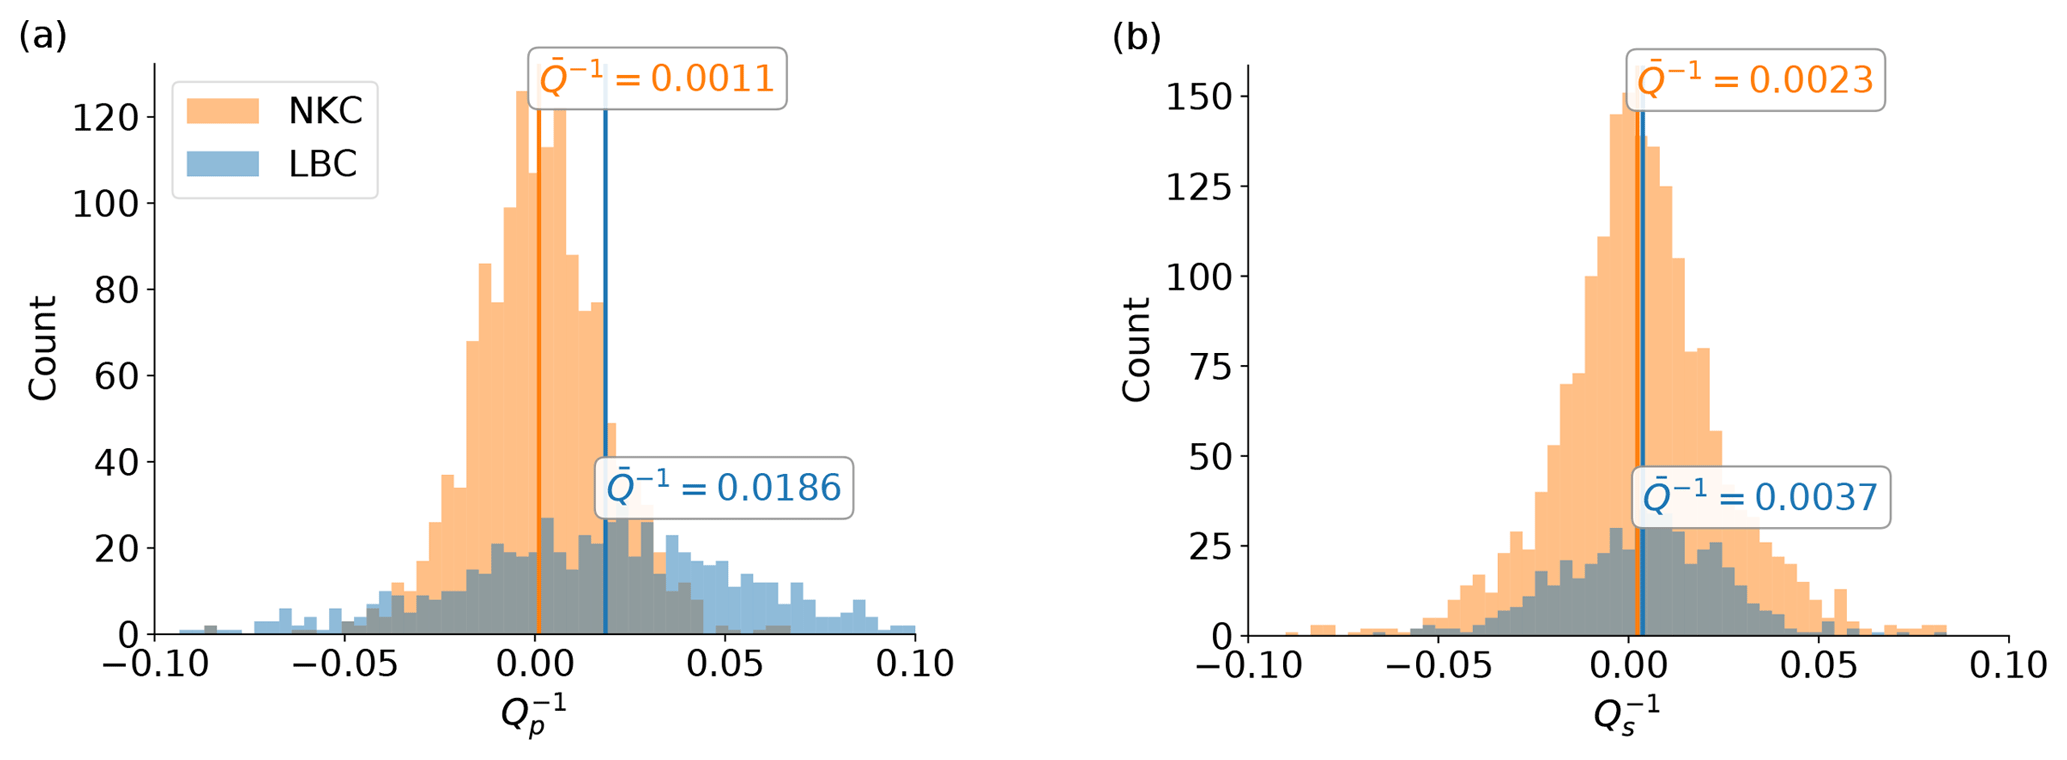
Figure 11Attenuation results at stations LBC and NKC for Qp (a) and Qs (b). Median values are indicated by the overline Q.
Northwest Bohemia is a favorable case for testing our approach. Several focal mechanism studies on earthquake swarms in this region indicate dominant principle faults striking at 169 and 304∘ (Vavryčuk, 2011), which have been active in different seismic sequences. Events occurring during a swarm tend to rupture on the same fault. This observation in combination with compactness of seismic clusters (Fig. 10) explains the high similarity of waveforms observed for each swarm. We therefore also assume that source characteristics including rupture directivity effects are similar throughout each swarm cycle.
By the time of the 2008 swarm, the WEBNET stations were equipped with three-component short-period seismometers, except for station NKC, located in the epicentral area, which is a broadband station. All waveforms are sampled at 250 Hz. An example of a P-phase onset recorded at station LBC is shown in Fig. 9 together with the estimated amplitude spectra. A manual revision of all event waveforms has been done to remove those which show indications of event doublets happening shortly after each other but not being indicated as such in the catalog. Spurious signal leftovers of a preceding event not necessarily cause high distortion of the fundamental P-phase waveform and may thus not be removed by setting a cross-correlation threshold. However, their effect led to distortion at high frequencies of phase spectra and significantly increased the number of outliers during the analysis. The catalog of HypoDD (Waldhauser and Ellsworth, 2000) relocated events is comprised of 3841 events and their associated P- and S-phase picks.
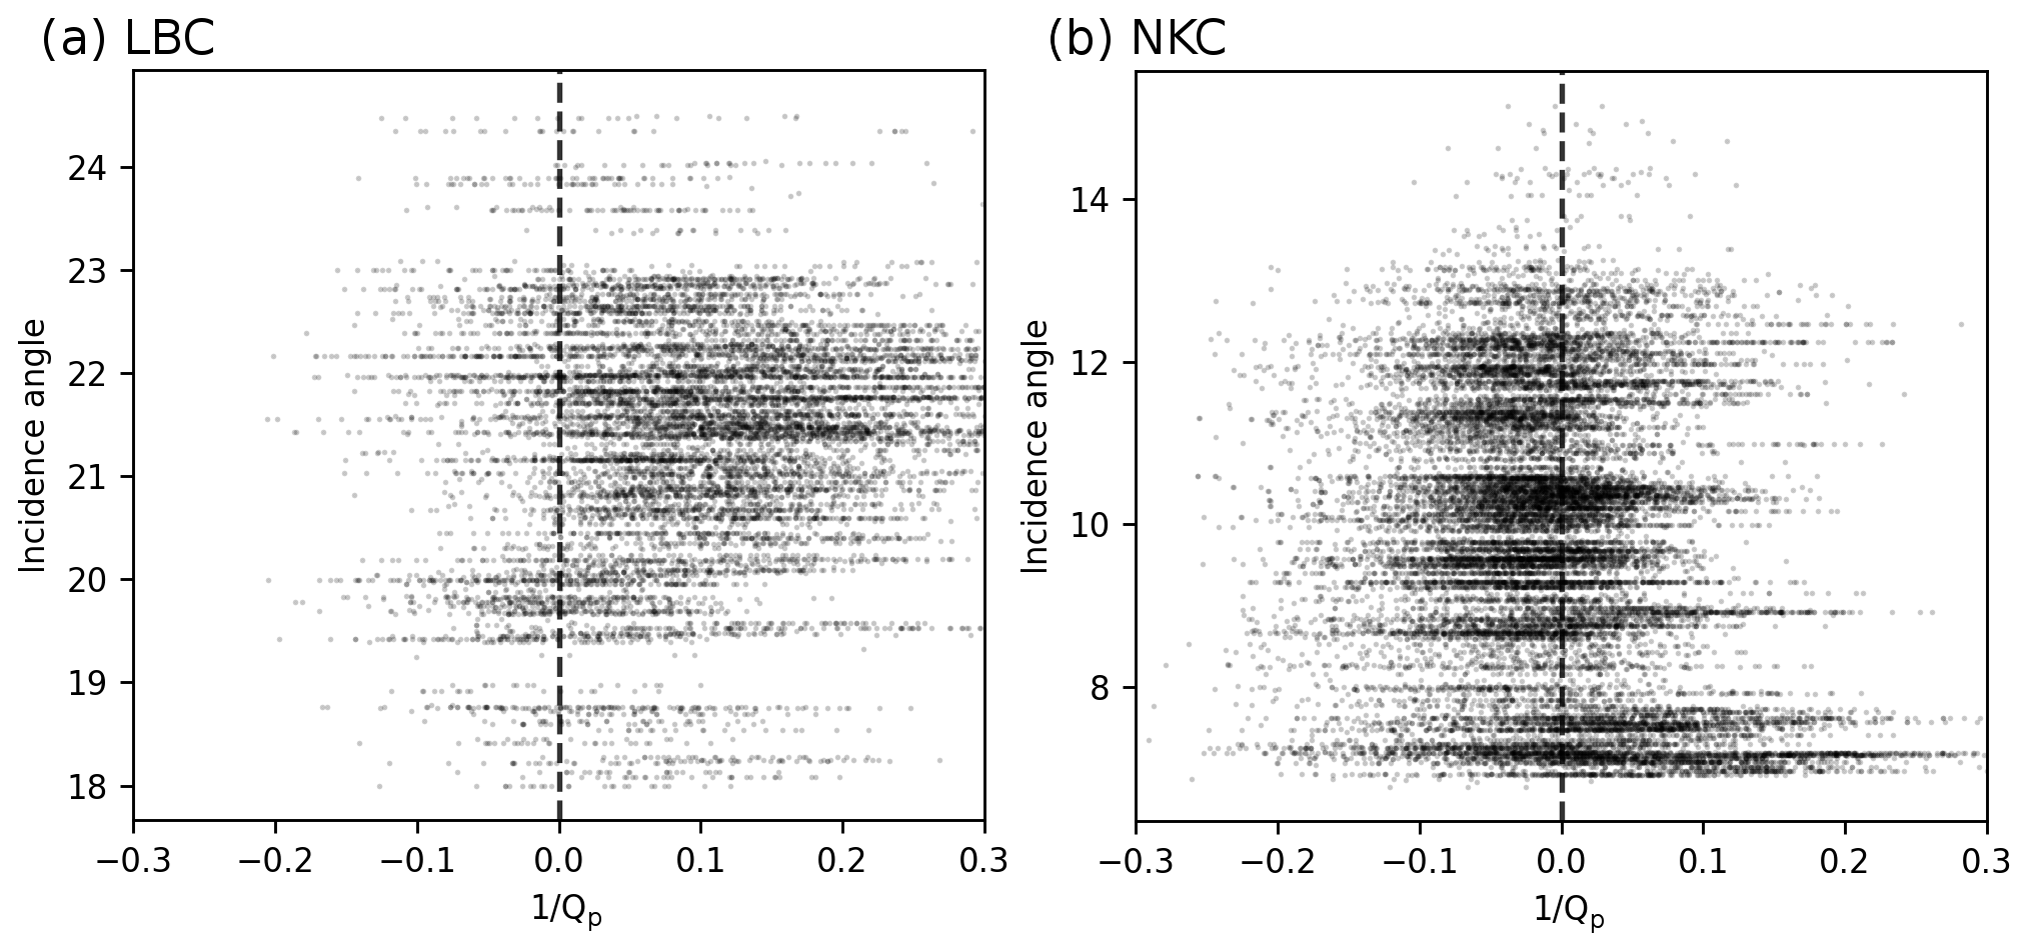
Figure 12Incidence angles plotted against of rays originating from event couples recorded at station LBC (a) and NKC (b). is highlighted with a dashed line.
When applied to station LBC, a total of 641 couples were used, which fulfills the requirements in terms of SNR, cross-correlation and geometrical constraints. Results of P phases evaluated at station LBC (Fig. 11, left) have a median , equivalent to . The distribution shows some negative results which do not have a physical meaning and are related to noise in spectral estimates. Results retrieved based on data from station NKC are significantly more unstable, as Fig. 11a indicates. The distribution shows a large number of negative results. The median attenuation is , equivalent to . Overall, 1404 couples where used in this case.
Attenuation evaluated for S phases shows almost zero centered distributions at both stations (NKC and LBC), which in turn indicates a significant number of negative and therefore unphysical measures. Median attenuation values are () at station NKC and () at stations LBC, respectively. Both values are comparably large compared to Qp estimates from station LBC. A bias of these S-phase attenuation measures is introduced by the P-phase coda energy interfering with S phases and therefore distorting the anticipated high-frequency content.
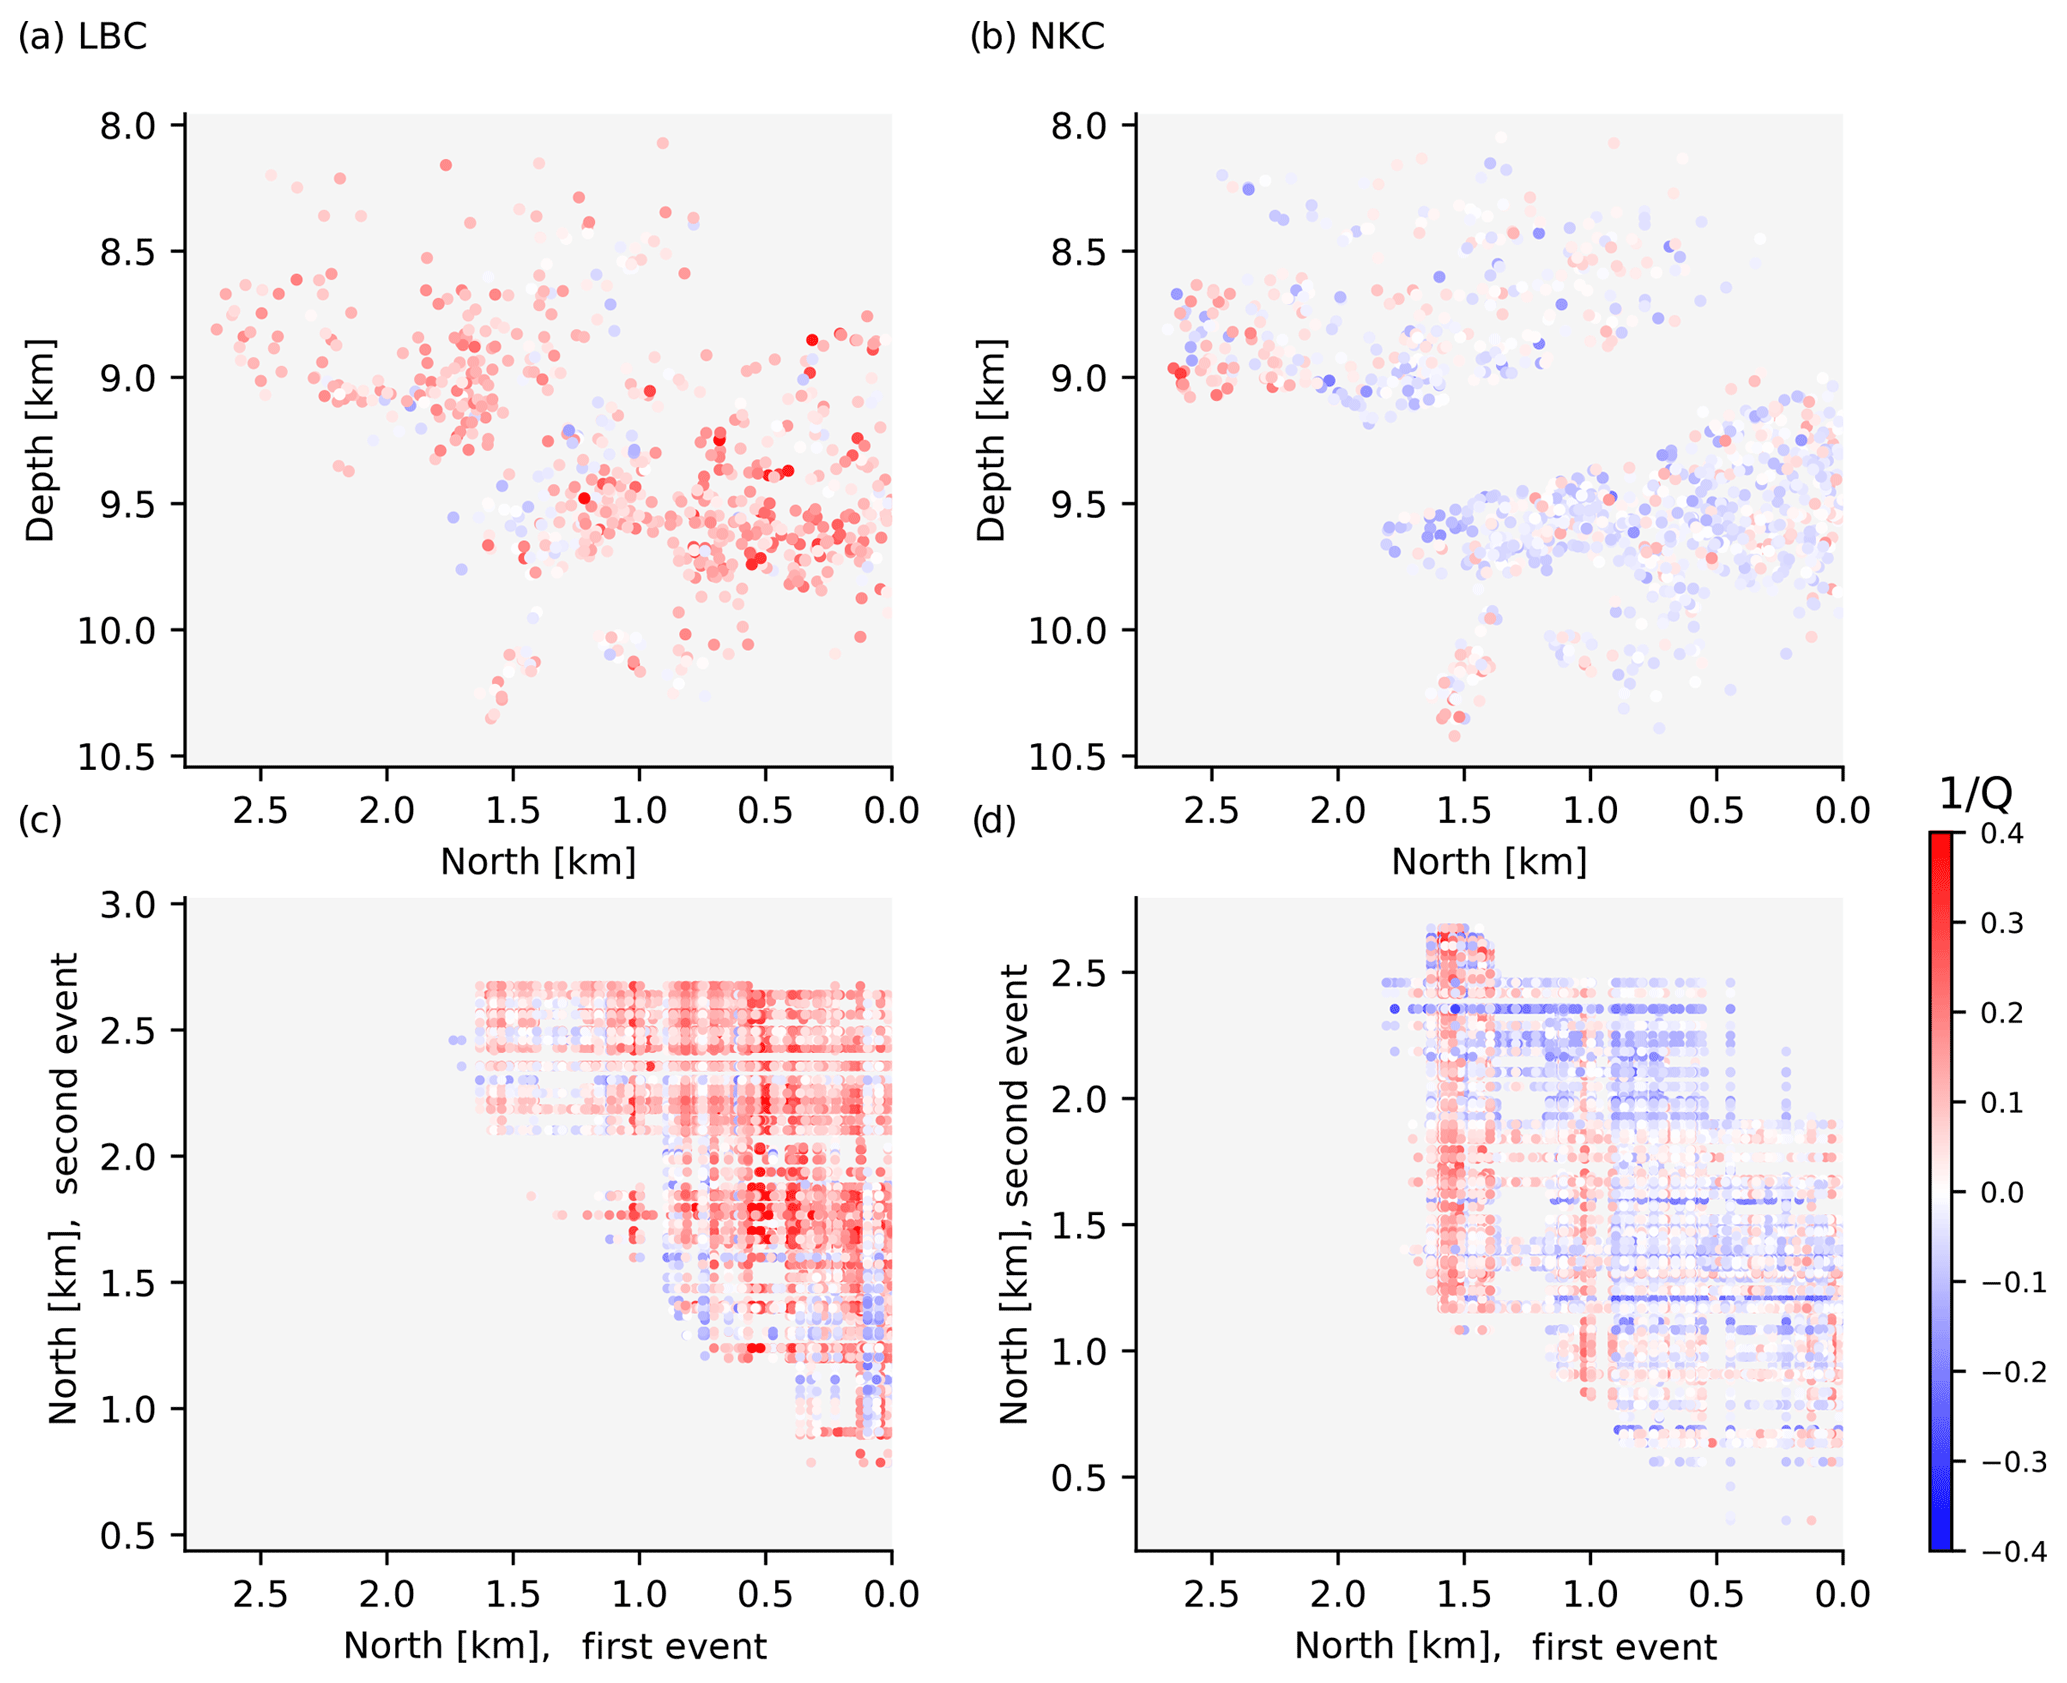
Figure 13Spatial distributions of attenuation at station LBC (a, c) and NKC (b, d). The source region is depicted as seen from the west. The origin of the coordinate system corresponds to the southernmost event. Panels (a) and (b) show average color-coded attenuation results of each used event. Panels (c) and (d) show the attenuation for each single event pair. First (deeper) events of each couple are represented by the x axes, whereas second events of each couple are represented by the y axes. Attenuation at station LBC is mostly positive. Subhorizontal seismicity gaps in panels (a) and (b) are caused by the set minimum distance (Dt) between two events.
In order to achieve a better understanding of the method's breakdown for P-phase recordings of station NKC, we disable the cross-correlation threshold and scrutinize Q−1 against a multitude of parameters for stations NKC and LBC. Figure 12 shows incidence angles of rays of event couples on the y axis and Q−1 on the x axis. Incidence angles are estimated using a 1-D ray-tracing algorithm (Heimann et al., 2017). By definition, the incidence angle is almost identical for both events of a couple. It becomes evident from Fig. 12b that larger incidence angles (>8∘) show a tendency at station NKC to produce negative Q−1, while results from events with steep incidence angles produce positive Q−1 values. When compared to the same kind of plots for station LBC, no such trend is evident.
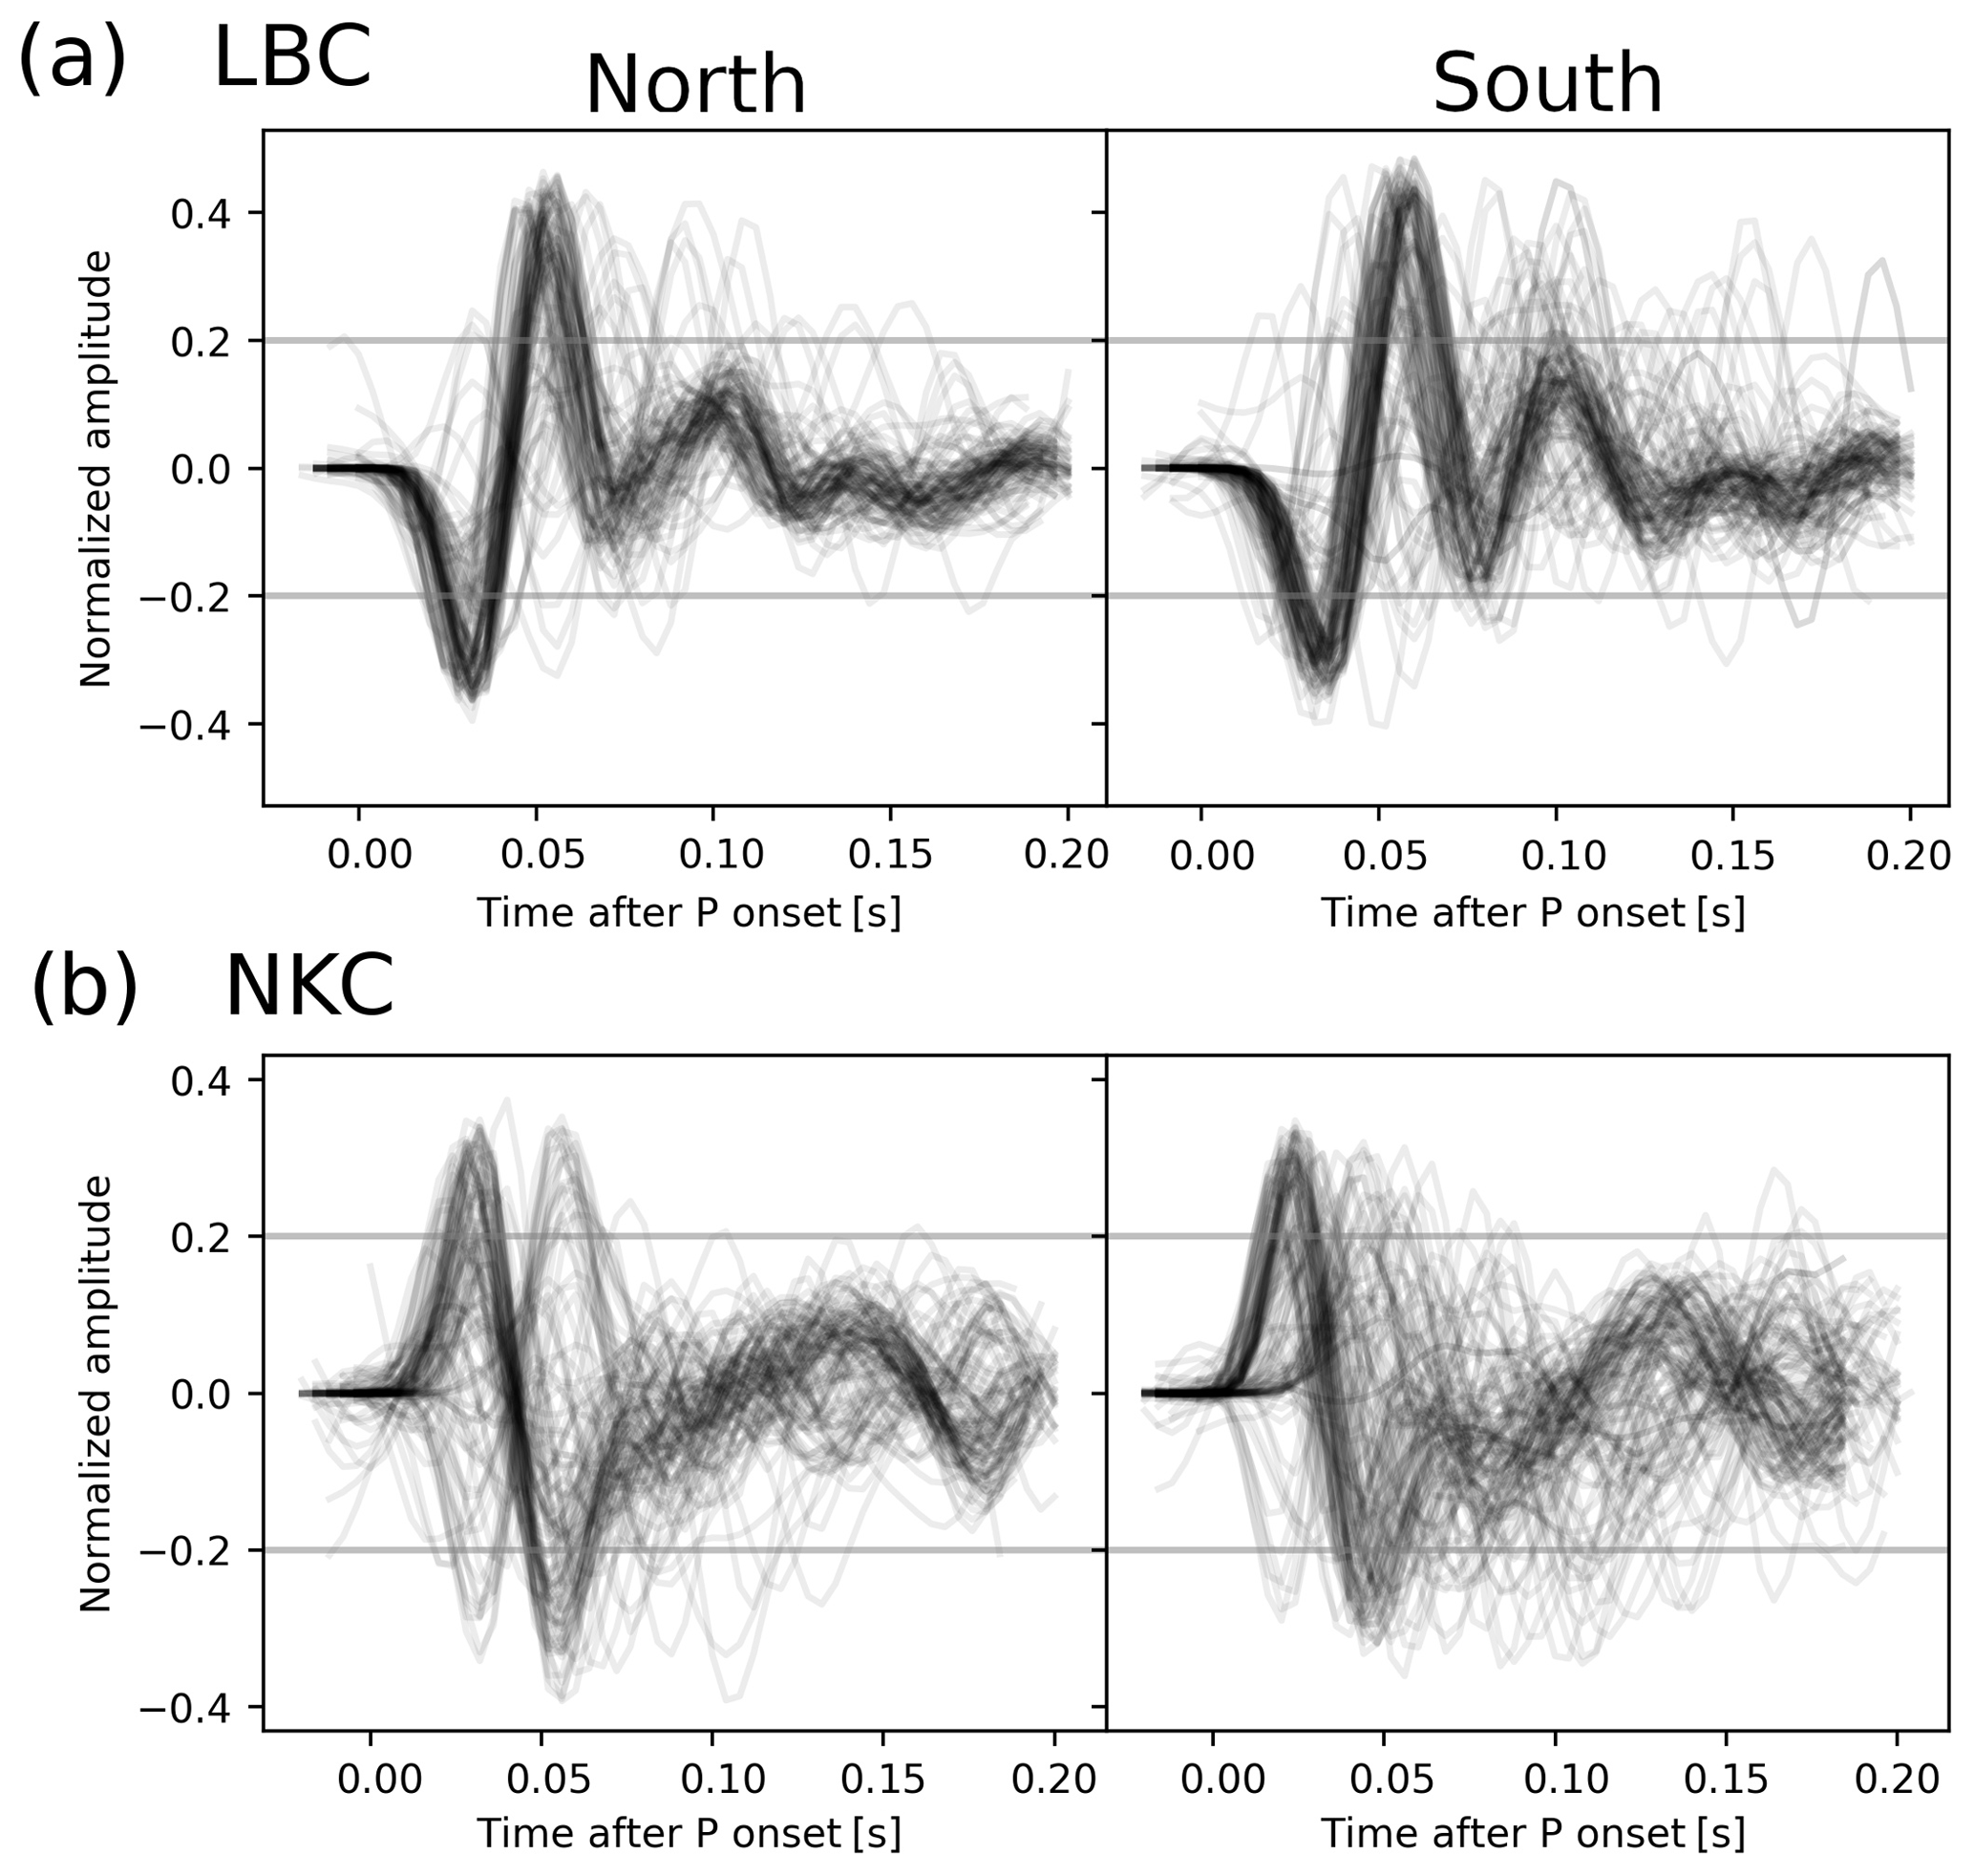
Figure 14P-phase onsets of couples' first events in the northern and the southern part of the swarm area. Panel (a) shows recordings at station LBC and (b) recordings at station NKC.
Station NKC is located at the northern edge of the swarm's epicentral region. Hence, incidence angle approximately correlates with latitude, indicating a location-dependent problem. The depth sections of results from stations LBC and NKC (Fig. 13) show again that the attenuation is mostly positive (red) at station LBC (Fig. 13a and c) in accordance with Fig. 11. The distribution of attenuation at station NKC (Fig. 13b and d) indicates a trend of decreasing Q−1 values from north to south. This supports the hypothesis of a location-dependent issue. Figure 13d shows accumulated positive results related to first events at 1.4 to 2.0 km north (x axis), which coincide with the position of a small subcluster seen in Fig. 13b below a depth of 9.8 km. From 1.2 to 1.4 km north, the event couple distribution becomes more sparse. The separation of positive attenuation in the north and mostly negative attenuation in the south of that gap implies a systematic change in frequency content from two separated segments of the swarm occurring along ray paths from the source region to station NKC.
Figure 14 shows P-phase waveforms of first events of couples recorded at stations NKC and LBC, filtered between 1 and 30 Hz for events northern (Fig. 14a, c) and southern (Fig. 14b, d) of the aforementioned gap. While the used filter frequencies are actually below the exploited frequency band used in the analysis, these waveforms demonstrate that the waveform complexity is significantly higher for events recorded at station NKC than for those recorded at station LBC, indicating that scattering plays a major role along the ray paths to station NKC. The average shapes of the waveforms following the first onset pulse differ in the northern and the southern sections. Furthermore, there are P phases with flipped polarities which indicate that station NKC was situated closer to the nodal plane than station LBC. This aspect is in accordance with synthetic tests in Sect. 3 which show worse performance of station NKC and then station LBC for P-phase measures.
We present a newly developed method to estimate attenuation from spectral ratios of event couples. The short analyzed time windows are prone to spectral leakage which we mitigate by applying the multitaper approach. However, this method can only suppress leakage caused by windowing effects. Leakage from source effects such as finiteness of the slip and the rupture are not smoothed as they are expected source characteristics and not filter artifacts.
The given geometry and available data limit the perceptive field of the applied method mostly to the lower half of the seismic swarm (Fig. 2). Rays arriving at station LBC show a worse penetration of the focal zone compared to those arriving at station NKC (Fig. 2), where the takeoff angle is almost perpendicular to the normal orientation of the main rupturing fault. Therefore, the setting of sources with respect to station NKC is favorable from a geometrical point of view as it can be considered to have a higher sensitivity for attenuation in the source volume.
Synthetic tests show that the method is able to reproduce average source volume attenuation of Qp=100 and Qs=50 given the 2008 earthquake swarm hypocentral locations. In noise-free conditions, a precise result can be achieved for both P and S phases at both significant stations (NKC and LBC). With additive recorded noise, the distribution of Qp results broadens but still resembles the true attenuation with high precision at station LBC. Synthetic waveforms at station NKC suffer from weaker SNR at high frequencies, indicating that the applied SNR threshold of 5 is too optimistic. However, reducing this value would also reduce the number of data points and therefore have a negative impact on the statistical significance of results. Qs results at station NKC are more robust than those at station LBC. Both measures, Qs and Qp, improve when convolving synthetic waveforms with synthetic source time functions, as this stabilizes the multitaper spectral estimates.
The application to recorded P-phase onsets shows fewer negative Qp results at station LBC and than at station NKC which results in a distribution with a clearer offset with respect to Qp=0. Waveforms recorded at station LBC are significantly higher correlated than those at station NKC, where changing waveform polarities and high waveform complexity can be observed. We hypothesize that rays arriving at NKC experienced relatively stronger scattering or that a nearby reflector creates multiples which interfere with signals recorded at NKC. In the latter case, the reflector would have to be situated in a location where interactions with signals arriving at LBC are weaker. Mousavi et al. (2017) assume a highly fractured medium in combination with accumulated free gas or fluids which would cause a high attenuation in the source region and could therefore explain our observations on low Qp. A 3-D Vp∕Vs tomography by Alexandrakis et al. (2014) identified a low Vp∕Vs ratio body directly overlaying the focal zone. The increased waveform complexity seen at station NKC can be a result of waveform interaction with that body. The effects do not necessarily have an influence on results at station LBC where rays have different paths and takeoff angles.
Another influence may be rooted in the different families of focal mechanisms. Vavryčuk et al. (2013) reported three different families of focal mechanisms for the 2008 swarm. While the slope of high-frequency spectra should not directly be affected by the radiation pattern, there can be higher-order effects like rupture propagation and rupture complexity. Dependent on the takeoff angle, these rupture dynamics can affect the high-frequency spectral roll-off and therefore map into attenuation estimates (Kaneko and Shearer, 2015). P-phase polarity changes at station NKC indicate that the station is located close to the nodal plane of the main rupturing fault. This circumstance can increase the effect of the aforementioned effects seen at station NKC. If they differ systematically in the lower and upper source regions, this can lead to biases in attenuation analysis due to the heterogeneous sensitivity across the fault plane. Still, we do not see such effects at station LBC and therefore speculate that the dominating effect is the differing ray paths or a combination of both ray-path scattering and rupture dynamics.
Our findings in terms of P-wave attenuation based on data from station LBC show similarly low values compared to results by Wcisło et al. (2018), who obtained Qp≈120 for the source regions. Previous studies by Michálek and Fischer (2013) investigated source characteristics in NW Bohemia and suggested station-dependent whole-path-integrated mean Qp values ranging between 100 and 450. We find lower values which can be a result of hydration of the seismogenic zone. Haberland and Rietbrock (2001) also report highly increased attenuation (Q<100) within earthquake cluster regions and postulated that this could be related to hydration or partial melting. For instance, melt migration has been postulated from the size and migration pattern of earthquakes of the 2000 earthquake swarm (Dahm et al., 2009). On the other hand, Alexandrakis et al. (2014) interpret their results on velocity variations by dehydration processes. Our results deduced from station LBC for average attenuation are in line with previous findings pointing to high attenuation in the source volume.
Frequency bandwidth is a critical parameter which is limited mostly by the corner frequency of the recording setup and signal-to-noise ratio at high frequencies. Future plans of the Intercontinental Drilling Project (ICDP) include the installation of up to four borehole seismometers in NW Bohemia. It can be expected that our method will benefit from these measurements. Improved signal-to-noise ratios allow to sample and exploit information at higher frequencies which will stabilize the spectral estimate. Furthermore, higher sampling rates allow a better temporal (and therefore spectral) resolution of P and S phases. This will, in turn, also allow to use even shorter time windows. For the method discussed here, it would be favorable if at least one of these borehole stations will be situated in a location where a high number of ray-path-sharing couples can be found. The most sensitive region follows the NNE–SSW striking of the fault and is concentrated in the north of the earthquake swarm (Fig. 3).
In late September 2017, the University of Potsdam installed a short-period seismometer close to the Czech–German border in Oberzwota (red triangle, map in Fig. 10), which is a favorable location. The station recorded 1000 samples per second for 62 days during a period of relative quiescence. Nevertheless, approximately 30 events were recorded in the swarm area with local magnitudes down to Ml=0. Despite the installation directly on top of the weathering layer, the recordings showed signal-to-noise ratios larger than 5 at 120 Hz and above for smallest magnitudes. It becomes evident that even a surface-mounted station would allow to harness spectral information above the corner frequency of the WEBNET stations also for smallest magnitudes, which indicates that this will improve the resolution and robustness of our method once the ICDP borehole installations are operating.
Applying the source couple amplitude spectral ratio method to differential phase measures is an alternative to methods which commonly exploit the lower frequency ranges. Theoretically, it is therefore able to achieve better resolution. Our synthetic study validates this. The geometrical constraints of this method require a high density of events, as is the case for natural earthquake swarms or seismic nests but also for hydrofracturing experiments.
The application to data from the 2008 northwest Bohemian earthquake swarm indicates source region Qp<100 based on data recorded at station LBC. The sensitive region measures only approximately m in the north, east and west directions (Fig. 2). Results can therefore be considered of high spatial resolution. Nevertheless, the distribution of solutions significantly scatters, and we see room for improvement, e.g., through high-frequency borehole recordings. We are not able to retrieve stable estimates at station NKC but instead see negative attenuation in the southern and positive attenuation in the northern section of the swarm. P-phase waveforms of the two sections show systematic differences at both significant stations, which indicates a north–south structural difference. Furthermore, this effect does not inflict on measures at station LBC. Given the fact that ray segments at NKC and LBC probe two different but directly neighboring media leads us to the conclusion that the fractured medium is highly concentrated along the source patch and that the surrounding medium can be considered much more dense or intact.
Waveform data of WEBNET stations as well as double-difference relocated events will only be provided upon request.
MK was responsible for implementation, testing, evaluation and application to synthetic and recorded data, as well as paper writing. SC was responsible for scientific supervision, evaluation of tests and applications. MO was responsible for scientific supervision, discussion and manuscript revision. TD was responsible for scientific supervision, discussion and manuscript revision. FK was responsible for scientific supervision, discussion and manuscript revision.
The authors declare that they have no conflict of interest.
This work is part of the HISS project which is funded by the DFG ICDP
(project no. CE 223/2-2). We would like to thank Tomáš Fischer and one
anonymous reviewer as well as the editors for their valuable
comments.
Edited by: Ylona van Dinther
Reviewed by: Tomáš Fischer and one anonymous referee
Aki, K.: Attenuation of shear-waves in the lithosphere for frequencies from 0.05 to 25 Hz, Phys. Earth Planet. Int., 21, 50–60, https://doi.org/10.1016/0031-9201(80)90019-9, 1980. a, b
Aki, K. and Richards, P. G.: Quantitative seismology, University Science Books, Sausalito, California, 2nd Edn., 2002. a
Alexandrakis, C., Calò, M., Bouchaala, F., and Vavrycuk, V.: Velocity structure and the role of fluids in the West Bohemia Seismic Zone, Solid Earth, 5, 863–872, https://doi.org/10.5194/se-5-863-2014, 2014. a, b, c, d
Bachura, M. and Fischer, T.: Coda Attenuation Analysis in the West Bohemia/Vogtland Earthquake Swarm Area, Pure Appl. Geophys., 173, 425–437, https://doi.org/10.1007/s00024-015-1137-3, 2016. a
Bouchaala, F., Vavryčuk, V., and Fischer, T.: Accuracy of the master-event and double-difference locations: Synthetic tests and application to seismicity in West Bohemia, Czech Republic, J. Seismol., 17, 841–859, https://doi.org/10.1007/s10950-013-9357-4, 2013. a
Cormier, V. F.: the Effect of Attenuation on Seismic Body Waves, B. Seismol. Soc. Am., 72, 169–200, 1982. a
Dahm, T., Fischer, T., and Hainzl, S.: Mechanical intrusion models and their implications for the possibility of magma-driven swarms in NW Bohemia Region, Stud. Geophys. Geod., 52, 529, https://doi.org/10.1007/s11200-008-0036-9, 2009. a
Fischer, T. and Michálek, J.: Post 2000-swarm microearthquake activity in the principal focal zone of West Bohemia/Vogtland: Space-time distribution and waveform similarity analysis, Stud. Geophys. Geod., 52, 493–511, https://doi.org/10.1007/s11200-008-0034-y, 2008. a, b
Fischer, T., Horálek, J., Michálek, J., and Boušková, A.: The 2008 West Bohemia earthquake swarm in the light of the WEBNET network, J. Seismol., 14, 665–682, https://doi.org/10.1007/s10950-010-9189-4, 2010. a
Fischer, T., Horálek, J., Hrubcová, P., Vavryčuk, V., Bräuer, K., and Kämpf, H.: Intra-continental earthquake swarms in West-Bohemia and Vogtland: A review, Tectonophysics, 611, 1–27, https://doi.org/10.1016/j.tecto.2013.11.001, 2014. a, b
Gaebler, P. J., Eulenfeld, T., and Wegler, U.: Seismic scattering and absorption parameters in the W-Bohemia/Vogtland region from elastic and acoustic radiative transfer theory, Geophys. J. Int., 203, 1471–1481, https://doi.org/10.1093/gji/ggv393, 2015. a, b
Haberland, C. and Rietbrock, A.: Attenuation tomography in the western central Andes: A detailed insight into the structure of a magmatic arc, J. Geophys. Res., 106, 11151, https://doi.org/10.1029/2000JB900472, 2001. a
Heimann, S., Kriegerowski, M., Isken, M., Cesca, S., Daout, S., Grigoli, F., Juretzek, C., Megies, T., Nooshiri, N., Steinberg, A., Sudhaus, H., Vasyura-Bathke, H., Willey, T., and Dahm, T.: Pyrocko – An open-source seismology toolbox and library, https://doi.org/10.5880/gfz.2.1.2017.001, 2017. a
Kaneko, Y. and Shearer, P. M.: Variability of seismic source spectra, estimated stress drop, and radiated energy, derived from cohesive-zone models of symmetrical and asymmetrical circular and elliptical ruptures, J. Geophys. Res.-Sol. Ea., 120, 1053–1079, https://doi.org/10.1002/2014JB011642, 2015. a
Krischer, L.: mtspec Python wrappers 0.3.2, https://doi.org/10.5281/zenodo.321789, 2016. a, b
Madariaga,R.: Dynamics of an expanding circular fault, B. Seismol. Soc. Am., 66, 639–666, 1976. a
Málek, J., Janský, J., and Horálek, J.: Layered Velocity Models of the Western Bohemia Region, Stud. Geophys. Geod., 44, 475–490, https://doi.org/10.1023/A:1021859516682, 2000. a
Matsumoto, S., Uehira, K., Watanabe, A., Goto, K., Iio, Y., Hirata, N., Okada, T., Takahashi, H., Shimizu, H., Shinohara, M., and Kanazawa, T.: High resolution Q-1 estimation based on extension of coda normalization method and its application to P-wave attenuation structure in the aftershock area of the 2005 West Off Fukuoka Prefecture Earthquake (M7.0), Geophys. J. Int., 179, 1039–1054, https://doi.org/10.1111/j.1365-246X.2009.04313.x, 2009. a, b
Michálek, J. and Fischer, T.: Source parameters of the swarm earthquakes in West Bohemia/Vogtland, Geophys. J. Int., 195, 1196–1210, https://doi.org/10.1093/gji/ggt286, 2013. a, b, c, d, e
Mousavi, S., Haberland, C., Bauer, K., Hejrani, B., and Korn, M.: Attenuation tomography in West Bohemia/Vogtland, Tectonophysics, 695, 64–75, https://doi.org/10.1016/j.tecto.2016.12.010, 2017. a, b, c
Park, J., Craig, R. L., and Vernon III, F. L.: Multitaper spectral analysis of high-frequency seismograms, J. Geophys. Res., 92, 12675–12684, https://doi.org/10.1029/JB092iB12p12675, 1987. a, b
Prieto, G., Parker, R., and Vernon III, F.: A Fortran 90 library for multitaper spectrum analysis, Comput. Geosci., 35, 1701–1710, https://doi.org/10.1016/j.cageo.2008.06.007, 2009. a, b
Sanders, C. O.: Local earthquake tomography: attenuation–theory and results, Seismic Tomography: Theory and Practice, London, New York, Chapman & Hall, 676–694, 1993. a
Thomson, D. J.: Spectrum estimation and harmonic analysis, P. IEEE, 70, 1055–1096, https://doi.org/10.1109/PROC.1982.12433, 1982. a, b
Toksöz, M. N. and Johnston, D. H.: Seismic wave attenuation, Geophysics reprint series, Society of Exploration Geophysicists, 459 pp., available at: https://books.google.de/books?id=rjlNAQAAIAAJ (last access: 6 February 2019), 1981. a
Vavryčuk, V.: Principal earthquakes: Theory and observations from the 2008 West Bohemia swarm, Earth Planet. Sc. Lett., 305, 290–296, https://doi.org/10.1016/j.epsl.2011.03.002, 2011. a
Vavryčuk, V., Bouchaala, F., and Fischer, T.: High-resolution fault image from accurate locations and focal mechanisms of the 2008 swarm earthquakes in West Bohemia, Czech Republic, Tectonophysics, 590, 189–195, https://doi.org/10.1016/j.tecto.2013.01.025, 2013. a
Waldhauser, F. and Ellsworth, W. L.: A Double-difference Earthquake location algorithm: Method and application to the Northern Hayward Fault, California, B. Seismol. Soc. Am., 90, 1353–1368, 2000. a
Wang, R.: A simple orthonormalization method for stable and efficient computation of Green's functions, B. Seismol. Soc. Am., 89, 733–741, 1999. a
Wcisło, M., Eisner, L., Málek, J., Fischer, T., Vlček, J., and Kletetschka, G.: Attenuation in west bohemia: Evidence of high attenuation in the Nový Kostel focal zone and temporal change consistent with Co2degassing, B. Seismol. Soc. Am., 108, 450–458, https://doi.org/10.1785/0120170168, 2018. a, b, c